august 2016 - second quarter 2016 financial results - august 8, 2016
TRANSCRIPT

TSX – NYSE MKT: RIC
Second Quarter 2016 Financial ResultsAugust 8, 2016

www.richmont-mines.com 2
(1) Refer to the Non-IFRS performance measures contained in the Q2 2016 MD&A.
Q2 2016 Operational Highlights
All amounts are in Canadian Dollars unless otherwise indicated
Consolidated Results Q2 2016 6 Months 2016 2016Guidance
Gold produced (oz) 23,320 55,689 87,000 - 97,000
Gold sold (oz) 24,888 57,127 -
Cash cost per ounce ($)(1) 903 848 930 - 1,000
AISC per ounce ($)(1) 1,330 1,200 1,275 - 1,390
Cash cost per ounce (US$)(1) 701 637 680 - 730
AISC per ounce (US$)(1) 1,032 902 935 – 1,015
Solid quarterly performance underpinned by record productivity at Island Gold
Island Gold production growth of 24%; Company-wide decrease of 11%
Island Gold cash costs and AISC well below guidance estimates
On track to meet, or exceed 2016 consolidates guidance estimates
Update on 2016 guidance estimate in September

www.richmont-mines.com 3
Q2 2016 CORPORATE HIGHLIGHTS
Revenues of $40.6 million
EPS of $0.04 per share
Operating cash flow(1) per share of $0.25
Solid cash position of $95.5 million
Completed $31M bought-deal financing; Net proceeds of $29M
Total debt of $11.1 million
Aggressive Phase 2 exploration program launched at Island Gold
WELL POSITIONED FOR ORGANIC GROWTH(1) After changes in non-cash working capital
All amounts are in Canadian Dollars unless otherwise indicated

FINANCIAL HIGHLIGHTS

www.richmont-mines.com 5
FINANCIAL RESULTS HIGHLIGHTS
Q2 2016 Financial Results
Strong cash position of $95.5M as of June 30, 2016 and growing cash flow stream is expected to support a fully funded strategic growth plan and Phase 2 exploration
(in thousands, except per share amounts)
Quarter EndedJune 30, 2016
Quarter EndedJune 30, 2015
6 MonthsJune 30, 2016
6 MonthsJune 30, 2015
Revenue from mining operations 40,618 40,552 93,252 77,762
Net earnings per share, basic 0.04 0.05 0.19 0.14
Operating cash flow, per share 0.25 0.25 0.54 0.43
Adj. Operating cash flow, per share(1)(2) 0.19 0.18 0.55 0.36
Net free cash flow, per share(2)(3) 0.05 0.13 0.07 0.13
(1) Before changes in non-cash working capital(2) Refer to the Non-IFRS performance measure in the Q2 2016 MD&A.(3) Net free cash flow per share is comprised of the Corporation’s operating cash flow, after changes in non-cash working capital, less investments in property, plant and
equipment
All amounts are in Canadian Dollars unless otherwise indicated

OPERATIONS & OVERVIEW

www.richmont-mines.com 7
ISLAND GOLD: STRONG RESULTS Q2 2016
Island Gold MineQ2 2016 6 Months 2016 2016
Guidance
Gold produced (oz) 18,617 45,206 62,000 – 67,000
Gold sold (oz) 20,147 46,178
Cash cost per ounce ($)(1) 766 714 900 - 960
AISC per ounce ($)(1) 1,038 935 1,160 - 1,250
Cash cost per ounce (US$)(1) 595 537 660 - 705
AISC per ounce(US$)(1) 806 703 850 - 920(1) Refer to the Non-IFRS performance measures contained in the Q2 2016 MD&A
All amounts are in Canadian Dollars unless otherwise indicated
Solid production results; 24% increase over Q2 2015
Focused on development in lower grade extensions of second mining horizon
Record underground (911 tpd) and mill productivities (878 tpd)
Positive reconciliation of 19%: (8% tonnes / 10% grade)
Development ore/total ore of 48% (vs. 40%), YTD 49% (vs. 40%)
Cash costs and AISC decrease of 20% and 21%; well below guidance levels

www.richmont-mines.com 8
ISLAND GOLD: OPERATING KPIsIsland Gold Mine Q2 2016 6 Months 2016 2016E
Underground tpd 911 882 800
Mill tonnes 79,924 155,830 292,000
Mill tpd 878 856 800
Head grade (g/t gold) 7.51 9.36 7.0 – 7.5
Recoveries (%) 96.5 96.4 96.5
Sustaining Costs ($000’s) 5,480 10,193 17,300
Project Costs ($000’s) 7,946 14,933 43,400
Non-sustaining exploration Costs ($000’s) 3,624 7,394 14,300
Underground Mine Productivity
-
10,000
20,000
30,000
40,000
50,000
60,000
70,000
80,000
90,000
100,000
2014 2015 2016E(1) PEA BaseCase
(800tpd)(2)
UpsidePotential
(900tpd)(3)
Island Gold Production Upside
All amounts are in Canadian Dollars unless otherwise indicated
(1) Mid-range of 2016 guidance (2) Avg. annual production 2017-2022 (3) Permitted potential (1) Q4 2015 production and mine and mill productivity: Includes a 3-week scheduled underground mine shutdown and a 2-week scheduled mill shutdown
0.00
2.00
4.00
6.00
8.00
10.00
12.00
0
100
200
300
400
500
600
700
800
900
1000
Gra
ms
per t
onne
Tonn
es p
er d
ay
Underground tpd Head grade (g/t)

www.richmont-mines.com 9
UNIT COST COMPARISONQ2 2016 vs 2015 PEA
2015 PEA Cost/Tonne (C$149/t)(Total 2015 cost/tonne = C$232)
$32SG&A
$72MINING
$32MILLING
$13ROYALTIES
2016 Q2 Cash Cost/Tonne (C$194/t)
$20G&A
$135MINING
$32MILLING
$7ROYALTIES
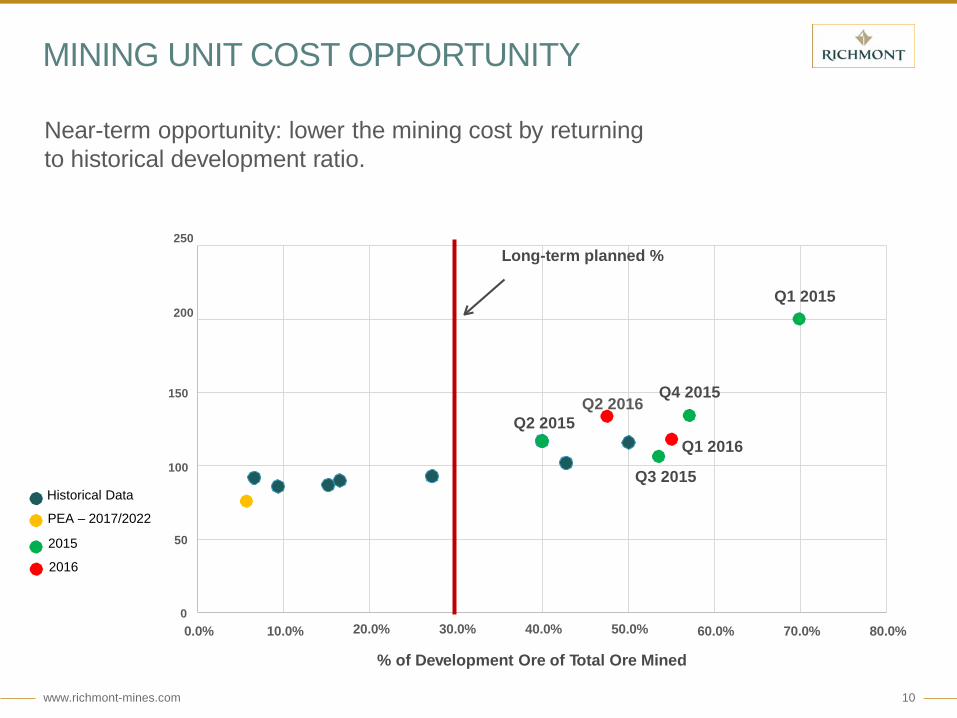
Higher unit mining costs; strategic decision to increase higher cost ore development ratio
Unit mining costs to decline to PEA levels in 2017-2022; return to lower ore development ratio
Q2 2016 milling and royalty unit costs in-line with PEA; SG&A lower than PEA estimates
www.richmont-mines.com 10
MINING UNIT COST OPPORTUNITY
Near-term opportunity: lower the mining cost by returningto historical development ratio.
Uni
t Min
ing
Cos
t
20.0% 30.0% 40.0% 50.0%
% of Development Ore of Total Ore Mined
0
50
150
Q2 2015
100
250Long-term planned %
Q1 2015200
0.0% 10.0% 60.0% 70.0% 80.0%
Historical Data
PEA – 2017/2022
2015
Q4 2015
Q3 2015
2016
Q1 2016
Q2 2016

www.richmont-mines.com 11
ISLAND GOLD:2016 DEVELOPMENTAND MINE PLAN
First Mining Horizon (2015 PEA)Tonnes Grade (g/t) Ounces
P&P 433,681 6.30 87,786
Third Mining Horizon (2015 PEA)Tonnes Grade (g/t) Ounces
P&P 616,039 10.59 209,705Inferred 342,967 11.18 123,267
Second Mining Horizon (2015 PEA)Tonnes Grade (g/t) Ounces
P&P 566,272 8.57 156,048

www.richmont-mines.com 12
Q2 STRONG PRODUCTION at Island Gold:POSITIVE RECONCILIATION TO RESERVES CONTINUES
Reserves (as of Dec 31st, 2015) Mined (reconciled) Variations (Mined vs Reserves)
Diluted Tonnes
Diluted Grade
Diluted Ounces
ReconciledTonnes
ReconciledGrade
ReconciledOunces Tonnes Grade Ounces
Total Development Q1 44,323 8.28 11,795 42,601 12.19 16,701 96% 147% 142%
Total Stope Q1 34,877 7.13 7,991 34,995 9.92 11,166 100% 139% 140%
Total U/G Q1 79,199 7.77 19,785 77,596 11.17 27,867 98% 144% 141%
Q1 Reserve Reconciliation
Reserves (as of Dec 31st, 2015) Mined (reconciled) Variations (Mined vs Reserves)
Diluted Tonnes
Diluted Grade
Diluted Ounces
ReconciledTonnes
ReconciledGrade
ReconciledOunces Tonnes Grade Ounces
Total Development Q2 44,505 5.24 7,493 40,181 5.58 7, 203 90% 106% 96%
Total Stope Q2 32,452 8.46 8,827 42,740 8.88 12,198 132% 105% 138%
Total U/G Q2 76,957 6.60 16,320 82,921 7.28 19,400 108% 110% 119%
Q2 Reserve Reconciliation
Production in Q2; Higher than planned milled grades of 7.51g/t vs 7.19 g/t planned
Positive reconciliation of 19%: (10% grade / 8% tonnes)
Higher cost development ore/total ore of 48%; 2016 mine plan of 40%
Development primarily in lower-grade extensions of the second mining horizon
30% dilution assumption for development reserves; lower dilutionfrom deeper, wider zones
www.richmont-mines.com 13
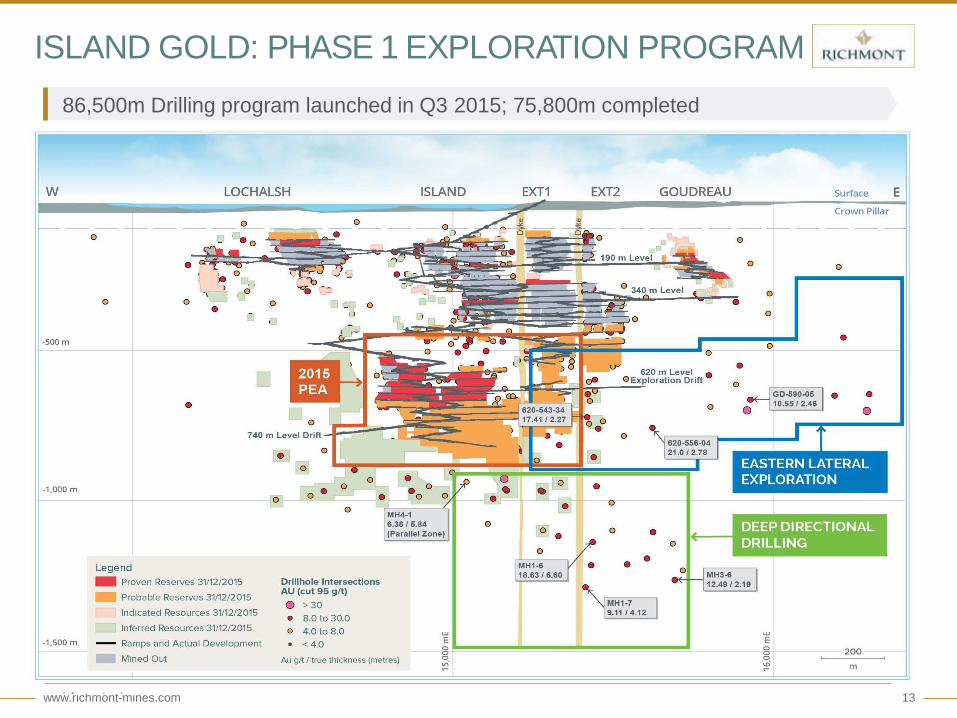
86,500m Drilling program launched in Q3 2015; 75,800m completed
ISLAND GOLD: PHASE 1 EXPLORATION PROGRAM

www.richmont-mines.com 14
ISLAND GOLD:Phase 2 Exploration Program, H2 2016 (36,000m)

www.richmont-mines.com 15
ISLAND GOLD:2016 Regional Surface Exploration Phase 2 (20,000m)

www.richmont-mines.com 16
BEAUFOR MINE: OPERATIONAL HIGHLIGHTS
(1) Refer to the Non-IFRS performance measures contained in the Q2 MD&A.
Beaufor Mine Q2 2016 6 Months 2016 2016 Guidance
Gold produced (oz) 4,703 9,318 25,000-30,000
Gold sold (oz) 4,741 9,778 -
Cash cost per ounce ($)(1) 1,486 1,441 1,000 - 1,060
AISC per ounce ($)(1) 1,899 1,812 1,230 - 1,330
Cash cost per ounce (US$)(1) 1,154 1,083 735 - 780
AISC per ounce (US$)(1) 1,475 1,362 905 - 975
Underground tpd 286 304 -
Mill tonnes 28,281 57,599 -
Head grade (g/t gold) 5.27 5.11 -
Recoveries (%) 98.1 98.4 -
Sustaining Costs ($000’s) 1,958 3,632 6,800
All amounts are in Canadian Dollars unless otherwise indicated
Lower production due to lower grades mined in Zones M-MF and 12
Stope mining in the new higher-grade Q Zone expected in Q3 2016
Cash costs & AISC expected to decrease as stope mining begins in the Q Zone

Q&A
www.richmont-mines.com 18
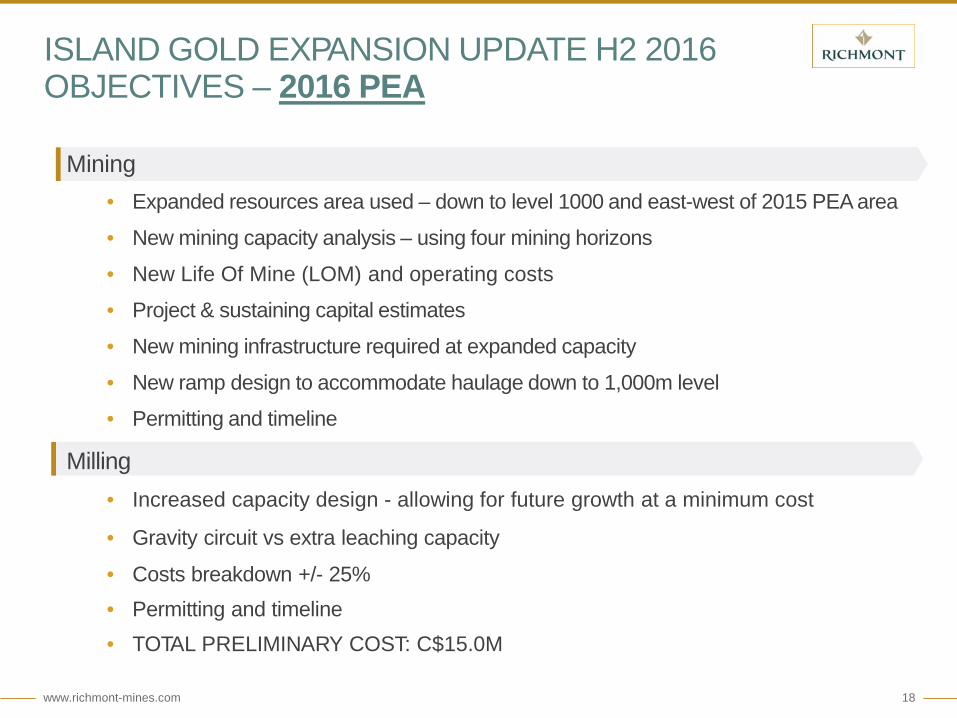
Mining• Expanded resources area used – down to level 1000 and east-west of 2015 PEA area
• New mining capacity analysis – using four mining horizons
• New Life Of Mine (LOM) and operating costs
• Project & sustaining capital estimates
• New mining infrastructure required at expanded capacity
• New ramp design to accommodate haulage down to 1,000m level
• Permitting and timeline
Milling• Increased capacity design - allowing for future growth at a minimum cost
• Gravity circuit vs extra leaching capacity
• Costs breakdown +/- 25%• Permitting and timeline• TOTAL PRELIMINARY COST: C$15.0M
ISLAND GOLD EXPANSION UPDATE H2 2016OBJECTIVES – 2016 PEA
www.richmont-mines.com 19
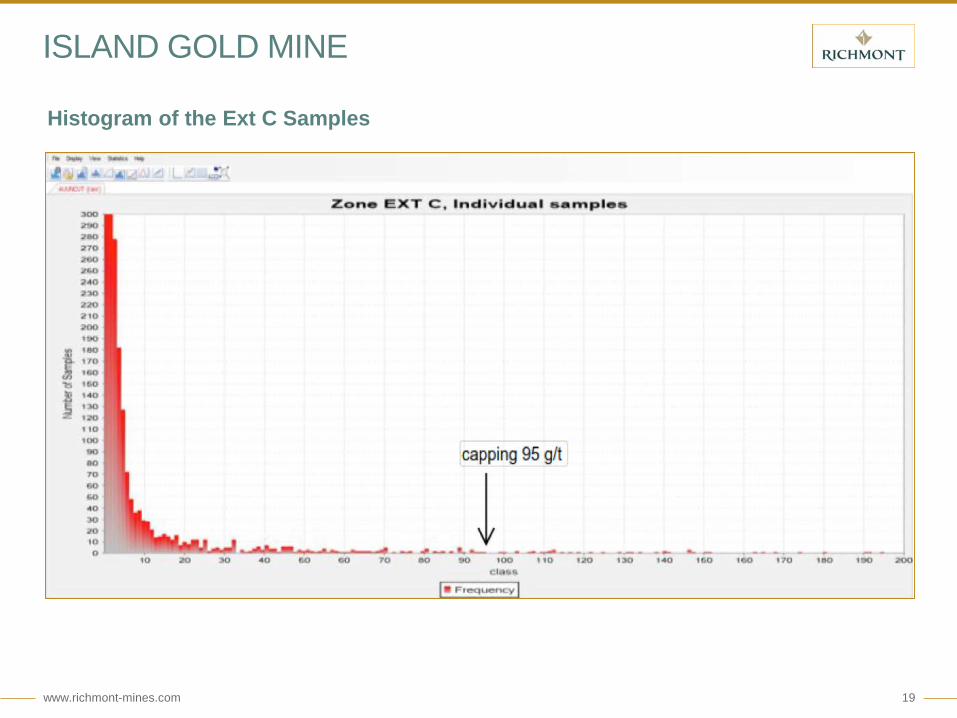
ISLAND GOLD MINE
Histogram of the Ext C Samples

www.richmont-mines.com 20
ISLAND GOLD MINE
Log Normal Probability Plot (Ext C Drill Hole Samples)

www.richmont-mines.com 21
DEEP DRILLING RESULTS COMPARISON
First 508K oz Deep Resource Block(Feb 25 2013) (capping at 75 g/t)
Average of 53 holes: 11.44 g/t over 4.55 m
Metal Factor
• 13 of 53 holes: 25% below 16 g/t; or • 15 of 55 holes: 27% below 16 g/t
Grade • 9 of 53 holes: 17% below 4 g/t; or• 11 of 55 holes: 20% below 4 g/t
Thickness • 26 of 53 holes: 49% less than 4 m; or• 28 of 55 holes: 51% less than 4 m
New Deep Potential Block (May 5 2016) (capping 95 g/t)
Average of 15 holes: 10.78 g/t over 4.60 m
Metal Factor
• 3 of 15 holes: 20% below 16 g/t
Grade • 1 of 15 holes: 7% below 4 g/t
Thickness • 8 of 15 holes: 53% less than 4 m
DEEP C ZONEINFERRED MINERALS RESOURCES1.5 MT at 10.73 g/t Au, 508,000 ounces
AREA OF POTENTIAL RESOURCES

www.richmont-mines.com 22
2016 OPERATIONAL ESTIMATES
2016 Production and Cost Guidance
2016 Capital Investment Guidance
Operational Estimates Island Gold Beaufor 2016 Consolidated Estimates
Gold Ounces Produced 62,000-67,000 25,000-30,000 87,000-97,000Cash Costs per Ounce (CAN$)(1) $900-$960 $1,000-$1,060 $930-$1,000Sustaining Capital per Ounce (CAN$) $260-$290 $230-$270 $250-$280Corporate G&A per Ounce (CAN$) - - $95-$110All-in Sustaining Costs per Ounce (CAN$)(1) $1,160-$1,250 $1,230-$1,330 $1,275-$1,390
Cash Costs per Ounce (US$)(1) $660-$705 $735-$780 $680-$730Sustaining Capital per Ounce (US$) $190-$215 $170-$195 $185-$205Corporate G&A per Ounce (US$) - - $70-$80All-in Sustaining Costs per Ounce (US$)(1) $850-$920 $905-$975 $935-$1,015(1) Cash costs and AISC are non-IFRS measures. Refer to the Non-IFRS performance measures section in the First Quarter 2016 Management’s Discussion and Analysis.
Capital and Exploration Investment ($M) Island Gold Quebec Division 2016 Consolidated Estimates
Sustaining Capital (CAN$) $17.3 $6.8 $24.1Project Capital (CAN$)(3) $43.4 $ - $43.4Company-wide Exploration (CAN$) $14.3(1) $1.1(2) $15.4Sustaining Capital (US$) $12.7 $5.0 $17.7Project Capital (US$)(3) $31.8 $ - $31.8Company-wide Exploration (US$) $5.4 $0.8 $6.2(1) Includes $7.0 million of 2016 Phase 2.(2) All delineation and exploration drilling for the Beaufor Mine is included in sustaining capital and $1.1 million is related to the Quebec division outside the Beaufor property.(3) Project Capital for Island Gold includes accelerated underground development of $25.0 million (US$18.3 million) related to the PEA and $6.0 million (US$4.4 million) related to discretionary
development outside the scope of the PEA.
Material assumptions include: an average gold price of CAD$1,500 per ounce (US$1,100 per ounce); and a foreign exchange rate of 1.364 Canadian dollars to the US dollar.

www.richmont-mines.com 23
CONSOLIDATED OPERATIONAL HIGHLIGHTS
Production Growth and In-Line CostsQuarter EndedJune 30, 2016
Quarter EndedJune 30, 2015
6 MonthsJune 30, 2016
6 MonthsJune 30, 2015
Gold produced (oz) 23,320 26,314 55,689 52,173
Gold sold (oz) 34,888 27,566 57,127 52,357
Cash cost per ounce (CAN$)(1) 903 974 848 976
AISC per ounce (CAN$)(1) 1,330 1,304 1,200 1,281
Realized gold price per ounce (CAN$) 1,628 1,468 1,629 1,482
Cash cost per ounce (US$)(1) 701 792 637 790
AISC per ounce (US$)(1) 10,32 1,060 902 1,037
Realized gold price per ounce (US$) 1,263 1,194 1,225 1,200
(1) Refer to the Non-IFRS performance measures contained in the Q2 2016 MD&A.
All amounts are in Canadian Dollars unless otherwise indicated