august 2018 - storage.googleapis.com · adelaide canberra/ q’beyan central coast mildura...
TRANSCRIPT

August 2018Month in Review
Fifty Years of Property Valuation | 1968 - 2018

Feature – New house, old house – 50 years of property 3
Commercial - Office 4
Residential 21
Rural 60
Market Indicators 72
Contents
DisclaimerThis publication presents a generalised overview regarding the state of Australian property markets using property market risk-ranking scales. It is not a guide to individual property assessments and should not be relied upon.
Herron Todd White accepts no responsibility for any reliance placed on the commentary and generalised information. Contact Herron Todd White to obtain formal, specific property advice on any matters of interest arising from this publication.
All rights reserved. This report can not be reproduced or distributed without written permission of Herron Todd White.

3
Like most successful start-up ideas, this one-man practice wouldn’t remain tethered to its humble beginnings for long.
Over the next 50 years it would take on new partners and open offices throughout metro and regional Australia, growing into the nation’s largest independent property valuation firm.
This year, Herron Todd White marks a half-century in business.
Our company is built on an ethos of ethical, professional service and the long-term relationships we’ve had with clients and business partners is a testament to our success.
As part of the celebration, this issue of the Month In Review reflects on the evolution of real estate since 1968.
Property ownership is an entrenched element of our national DNA – so much so that it’s described as “the great Australian dream”. Our aspirations are tied to the idea of acquiring title on our very own piece of Aussie bricks and mortar.
Property is a watercooler event in our workplaces and barbecue-stopper topic on our weekends. It’s
created home-grown billionaires and taken pride of place in our personal spreadsheets.
Throughout all this, real estate hasn’t been a stagnant affair. Property design has been fluid, adapting to changes in household composition, taking advantage of new building materials and incorporating exciting technological breakthroughs.
We’ve also learned to create more from less. A shift in the discussion around housing affordability means clever designers are finding ways to make tiny plots of land and limited floor areas usable and beautiful places to live in.
This month, we’re saluting this change in real estate by looking across two eras.
Firstly, our offices are discussing the great innovations underway right now in construction, planning, design and community that are creating the modern Australian home. They’ve spotted the trends making their marks on bricks and mortar.
Secondly, we consider how our service areas looked 50 years ago to gain an appreciation of just how far our cities and towns have come. Herron Todd White’s talented crew are going to give you some “way
we were” moments, describing the locations and property types that were most prominent 50 years ago. A few might even shock you with their historic knowledge of price points. You’ll be blown away by what you could have bought in 1968 for the cost of a 2018 small car.
For the commercially minded among you, this month’s highlight is the office sector and we are once again taking an evolutionary vibe.
What are the great movements in office property design today? We discuss area-by-area changes in size, tenant demand, location and price point. We look at what features a modern office property requires to attract new tenants and discuss where the next great evolutions will come from – particularly from savvy developers operating in the sector.
There you have it folks – something old and something new to mark a milestone 50 years for Herron Todd White. But don’t get too caught up in the past – if you see property in your future, call your nearest office. We have the depth of knowledge and a half-century of experience, to ensure your next purchase will see you profit.
New house, old house – 50 years of property“Way back in 1968, under a house in suburban Rockhampton, a visionary bloke named Kerry Herron established a small business with a simple goal – to provide professional property valuation services to rural clients.”
Month in ReviewAugust 2018
Feat
ure

Commercial

National Property ClockAugust 2018Office
Liability limited by a scheme approved under Professional Standards Legislation.
This report is not intended to be comprehensive or render advice and neither Herron Todd White nor any persons involved in the preparation of this report accept any form of liability for its contents.
Peak of Market
Approaching Peak of Market
Rising Market
Start of Recovery
Bottom of Market
Starting to decline
Declining Market
Approaching Bottom of Market
BrisbaneCairnsDarwinHobartLaunceston
MackayPerthRockhamptonTownsvilleWide Bay
Far North CoastGold CoastMelbourne
Echuca
Alice SpringsEmerald
GladstoneSouth West WA
Coffs HarbourMid North CoastNewcastleSouth East NSW
BallaratSunshine CoastSydney
AdelaideCanberra/ Q’beyanCentral Coast
MilduraToowoomba
Entries coloured purple indicate positional change from last month.

6
OverviewTalk to the layman about office property and their eyes might glaze over but that reaction fails to recognise the extraordinary advances in design and construction reflecting the evolution of this sector.
Office real estate and the way it’s adapting to the demands of the modern workspace have a direct impact on owners, tenants and their workforce.
This month, we discuss how office property is changing across the nation and what you can look forward to in the future.
SydneyThe market demand for office space in Sydney, both within the CBD and in other commercial centres, has been very strong over the past 18 months. The CBD especially has seen a strong growth in demand from tenants, investors and owner-occupiers. Rental rates have reached in excess of $1,000 per square metre and sales have reached as high as $18,000 to $20,000 per square metre. Capitalisation rates are as low as 4%. According to the PCA, the vacancy rate was 4.7% in June and was the lowest in the country.
The higher price has forced many occupiers to look outside of the Sydney CBD but we are also seeing a trend towards decentralisation with more and more tenants seeking alternative locations. The biggest driver of this is access to public transport, improved
facilities and flexible work spaces along with a drive towards locally positioned work spaces.
In the CBD, flexible floor plans that include common meeting spaces, the ability to hot desk and access to facilities and services remain common requirements for some larger organisations.
An example of suburban, non-traditional office locations with strong demand is Caringbah where a recently completed office development has seen a strong take up of space. The development offered small to medium sized strata lots. The new development includes an on site café, parking, shared meeting rooms, kitchens and breakout spaces. These office suites have been very popular with local owner-occupiers who require small to medium sized offices from which to operate their local businesses such as trades and professional services.
The growth and demand for creative office space has also continued. Areas that remain in demand and popular with owner-occupiers and tenants are the inner city and city fringe areas such as Surry Hills, Alexandria, Chippendale, Rosebery and Pyrmont. Creative office suites are prevalent within these areas and have been driven by the demand for smaller assets catering to start-up companies or established creative and professional businesses.
Developments that remain in demand in Surry Hills
include several on Holt Street that offer creative style space with shared meeting and breakout rooms whilst being close to Central train station. These developments generally attract similar creative and local businesses. Another example is Rosebery, which has seen an increase in demand from local businesses. Several developments feature modern office space with well-designed shared meeting and breakout spaces which have proven popular with tenants.
New development is currently centred around Parramatta, Norwest and Macquarie Park with improvements in infrastructure and continued growth and demand driving the market. Norwest and Macquarie Park have seen a particularly strong increase in demand as buyers and tenants await the completion of the Sydney Metro train line. New developments have focused on modern, adaptable work spaces with a few now offering serviced office spaces.
We are seeing increased demand for serviced office space and the rise of co-working arrangements across several areas of Sydney, particularly the CBD and fringe areas including Pyrmont, Ultimo and Surry Hills. Tenant demand appears to emanate from creative and start up businesses looking for good quality, well located office space at an affordable rate with flexibility of terms.
Com
mer
cial
Month in ReviewAugust 2018
New South Wales

7
For most tenants, end of trip facilities have become popular wish list items, especially in the CBD where many existing buildings have been upgraded to offer tenants more services. Examples of services now provided as part of a building’s end of trip facilities include bike racks, dry cleaning services, fitness classes and showers. In some cases, these are now managed through an online portal.
The outlook for Sydney’s office market looks positive for 2018 as demand continues to drive the market for both traditional type offices and more non-traditional options as more and more occupiers look for flexible working solutions.
NewcastleThe Newcastle office market has been changing rapidly over the past few years in the face of the changing nature of the office work environment as a whole. More office staff are working from home, hot desking or are being provided with more fluid work arrangements that allow a mix of work hours at home or in the office. Such arrangements are beneficial to employers as well as staff given the reduction in net lettable area costs in the city.
We’ve also seen a rise in smaller, single person operations offering professional services primarily from home but require a more professional space for meetings and presentations – hence the rise of professional services offices in and around the
Newcastle CBD. Offices such as Newcleus at 2-6 Dick Street, Newcastle West offers “infrastructure and interaction to help people choose better in how they live and work” according to co-creator Tony Sambell. It has multi-use spaces including three meeting rooms, a large kitchen and a foyer, plus a café in the building. But it’s the innovative and unexpected features that set it apart from other co-working ventures: a pair of sleep pods; a day bed; a walk-talk lane to encourage users to move while on the phone; plus a technology-free deactivation space where users can then tap back into their creativity by playing with board games and even juggling in the reactivation space.
For those who run a professional service that requires office staff and consultation, the Newcastle small office market has been dominated by the rise of the owner-occupier, generally purchasing the property via a self-managed superannuation fund and making the most of the tax benefits that come from a business paying rent to the fund under the terms of a commercial lease.
We’ve found that car parking is coming at more of a premium as kerbside and paid car parking facilities diminish in the face of new developments and infrastructure changes. Once completed, the light rail system will offer a quick way for pedestrians to get from Wickham to the east end of the city. What is required though is an affordable paid parking
solution at the Wickham end of the line given the loss of car parking in the city, in Honeysuckle and at the now demolished ex-David Jones carpark on King Street. There was some hope that any development of The Store Site (adjacent to the Wickham Transport Exchange) may offer such a solution for the parking dilemma, however Canberra based property developer Doma will construct two residential towers, 13,000 square metre of office space and a bus interchange – the latter being a requirement of the Property NSW tender. Interestingly the Property NSW Tender also required 5,000 square metres of office and Doma has pledged well over this minimum office offering. This may indicate that more office space is required in the market at this stage in the property cycle than residential space which has been the star market performer in recent years.
LismoreOffice markets on the Far North Coast of NSW have not seen any significant changes. The biggest driver is government leasing and its influence has been as a result of volume and design requirements. Increasing requirements have included accessibility, standard and quality of AC, environmental ratings, quality of amenities, the need for open collaborative work spaces and open air space. Government tenants will pay a premium for suitable office space, giving landlords sufficient incentives to refurbish or redevelop high quality space. This ultimately
Com
mer
cial
Month in ReviewAugust 2018

8
increases the pool of available office space as they relocate.
Another significant proportion of new tenants includes non-profit organisations and employment companies, helping to balance the supply and demand and taking up spaces vacated by government tenants.
In Byron Bay we are seeing office tenants move out to the industrial space as it is more affordable and has superior parking and less disruption during high peak tourist seasons.
Office space in Ballina is concentrated along Tamar Street with a strong influence from government tenancies, traditionally in the higher quality spaces. This concentration attracts associated private companies and allied health services associated with the ageing population.
Lismore has a very broad range of space from high quality multi storey office buildings to converted dwellings and CBD shop top housing providing a modest standard of office space with a convenience factor. Recently we have seen an increase in shared office space with amenities, which includes sub-letting on a per room basis and provides an affordable option for small business owners and professionals with a superior return for the property owners. Local evidence indicates a premium of a 2.5 to 3.5 multiplier on achievable rent on a per room
basis in comparison to an overall rate for a much larger space or entire office suite.
Rents:• Lismore- $150 to $300 per square metre
• Ballina– $200 to $350 per square metre
• Byron Bay - $300 to $600 per square metre
Sales (smaller to medium sized buildings):• Lismore - $800 to $1,500 per square metre and
yields of 6% to 9%.
• Ballina - $3,000 to $5,500 per square metre and yields of 6% to 7.5%.
• Byron Bay– $11,000 to $15,000 per square metre and yields of 5% to 6.5%.
Our specialist commercial valuers at the Lismore office are experts on rental assessments for negotiations, determinations, commercial lease agreement renewals and the impact leases have on the value of your asset.
Coffs HarbourThere are two major office developments well advanced under construction. The developers have marketed these as open floor plan and adapted to the tenants’ requirements. These developments feature large floor spaces.
There have been a number of developments placed
on hold which plan to deliver small floor areas for single operators or small business. There has not been enough market interest or pre-leasing to meet funding development requirements.
Government departments have tended to centralise in recent years and there has been limited regional expansion. The National Disability Service has promoted some demand for predominantly smaller office accommodation. There remains a slight over supply of CBD located space. There has also been a trend towards the Isles Industrial Estate for quasi office accommodation at lower rental levels.
WollongongSmall and medium sized companies dominate the local office market and as such floor plate requirements are small, generally ranging from 200 to 400 square metres requiring buildings to have flexibility in order to accommodate multiple-suite configuration. It is difficult to finance construction of new office development in the region given pre-leasing requirements, which are difficult to achieve due to the lack of large head office corporations seeking space in the local market. New construction is usually undertaken for government tenants such as the ATO anchored office building which was completed in 2013. New buildings for such tenants need to meet strict environmental performance standards from the outset and over the duration of the lease.
Com
mer
cial
Month in ReviewAugust 2018

9
Construction will commence on Wollongong’s first new office building since 2013. This is a large A-grade office building that will house IMB’s head office, relocating from its dated Crown Street premises (acquired in 2015 by WIN Corporation as part of a significant overall land bank). Meanwhile demolition works have commenced on a new circa 5,300 square metre retail and office development on the corner of Keira and Victoria Streets. Details in respect to pre-committed tenants are not known and it is possible the building is being developed without a large portion of the building being pre-leased. Other large scale office projects are proposed in the Wollongong CBD, including Langs Corner and 25-27 Denison Street, although it is our understanding that approvals and leasing pre-commitments are still being sought for both proposals. If completed it is likely that the rents achieved will set a new benchmark in the local market.
The Illawarra commercial property market has shown clear signs of improvement over the past three years with an increase in sales volumes demonstrating improved confidence after a prolonged period of static conditions post the GFC. Investment transactions have increased as investors are enticed to the market by yield arbitrage not typically found in Sydney or other major capital cities. For investment grade assets at higher price points, yields tend to hover in the 8% to 8.5% range while sitting in the
6% to 8% range for lower valued assets that attract a broader pool of buyers.
Record prices were achieved in 2017 in the Wollongong CBD office market. In addition to local buyers, the region is attracting investors (private and second tier funds) from Sydney, interstate and overseas. Low interest rates and the increased buyer depth have resulted in strong yield compression despite rents largely remaining stagnant over this period. Low interest rates are a significant driver of the property market. There have been no sales of note over the past six to twelve months as no properties have been brought to the market.
Commercial leasing conditions in the Illawarra region have improved with local agents reporting increased enquiry levels and reduced vacancy periods for well-placed tenancies in good quality buildings and with good off street parking availability. However, incentives remain common with discounts between 10% and 20% of gross annual rent typically required to attract a new tenant. This incentive is usually in the form of a rent free period. While we expect rents for B-grade and C-grade space to remain flat, upward pressure is expected on rents for A-grade space due to the low vacancy rate and an increase in appetite from certain businesses to pay the required premium for A-grade. C
omm
erci
al
Month in ReviewAugust 2018

10
MelbourneAccording to the Property Council of Australia’s Office Market Report, Melbourne CBD’s office overall vacancy rate overall reduced to 4.6% over the six months to January 2018. Melbourne CBD is now very close to the Sydney CBD vacancy rate.
The reduction in the vacancy is mainly due to the high net absorption rate of prime Melbourne CBD office stock. Leasing demand is currently very strong for good quality office stock within the CBD and city fringe suburbs, particularly in Cremorne and Richmond which have transformed into thriving technology precincts in recent years. Leasing agents are reporting a shortage of space and strong growth in face rents with reducing incentives. Net rents are in excess of $500 per square metre for new boutique office space in Cremorne and Richmond with minimal incentives offered.
The WELL Building Standard introduced by the International WELL Building Institute (IWBI) is underpinning change in commercial office building design. WELL v1 is a flexible building standard representing the future of modern design. The standard covers seven core concepts of health: air, water, nourishment, light, fitness, comfort and mind. The research of Wellness Team Australia indicates that employee engagement and performance as well as retention rates improve when organisations invest and focus on employee wellness. Tenants are
seeking office buildings which provide good end of trip facilities and landlords now have an emphasis on flexible space and shared facilities in order to attract and retain tenants. For example, 101 Collins Street recently unveiled its luxury end of trip facilities with comparable six-star hotel amenities. A whole level of car parking within the building has been converted to create end-of-trip facilities including 24/7 change rooms with individualised grooming stations, personal lockers, 482 secure bike racks and a bike repair station. These state-of-the-art facilities set the benchmark for premium office buildings. Other A-grade office buildings such as 367 Collins Street and 360 Collins Street have also completed major upgrades of their lobbies and end of trip facilities. Both buildings have also activated any internal space with street exposure to incorporate retail units.
Environmental sustainability is another important aspect in modern workplace design. Large commercial landlords generally have green strategies in place for their buildings to reduce carbon footprints. New office buildings are also required to achieve a minimum 4.5 star NABERS energy rating in order to house government tenants.
Co-working office space is one of the fastest-growing trends of the office work environment. Research reports show the number of co-working spaces in Australia grew by 297% between 2013 and 2017, occupying 193,190 square metres across six cities.
Melbourne has the largest concentration of co-working space with 49% followed by Sydney with 38%. In the Melbourne CBD, global co-working operator, WeWork, opened 11 full floors of new co-working space within a historic building at 401 Collins Street. This is after the recent opening of its first Melbourne office over six floors at 152 Elizabeth Street, the historic London Stores building. WeWork has also pre-committed to occupy 5,000 square metres over three floors at Lendlease’s 839 Collins Street in Docklands Victoria Harbour precinct. We expect the co-working trend will continue to boom and large landlords such as Charter Hall, Lendlease and Mirvac are partnering with co-working operators including The Hub, WeWork and York Butter Factory to operate co-working spaces within their buildings.
We expect that more and more start-ups and small to medium size businesses will consider co-working as part of their accommodation strategies as it provides a sense of community and flexibility in leasing arrangements. Landlords may need to factor in sizeable co-working components within their buildings to maintain their building’s positioning in a highly competitive market or risk losing tenants to those that do.
Com
mer
cial
Month in ReviewAugust 2018
Victoria

11
AdelaideTwenty years ago the millennials were wearing nappies, and while some may suggest they still are, they are now affecting the way we design offices….
Whilst this sounds alarmist, the effect on office design has been gradual and obvious characteristics have been an expectation for better, natural or environmentally friendly materials, designs that allow better sunlight and airflow, and accenting industrial features with timber, stone and plants for improved mental health. It has even extended to a shift in interior paint tones with warmer colours being utilised. Who likes hospital white anyway?
But there have also been less obvious changes, such as integrating technology into workplace design. As desktop computers become obsolete and are replaced by slimmer tablets and laptops, there are products available now which include wireless charging stations and multi-media functions within office furniture.
Or the impacts of an evolving office might be more obvious, at least from a human perspective. The younger generations are less fond of physically coming into the office now and the use of flexible workspaces is increasing with staff creating their personalised home office as the use of Skype, Google documents and video calls become more widely used for business purposes. Workstations that
are completely interchangeable between staff are common now and desk ownership is fast becoming a thing of the past.
A real example of the above trend is the inclusion of end of trip facilities. The end of trip facility used to be the local bar; now it is lockable bike storage with showers and lockers. It has become a major selling point for new buildings and major refurbishments. Adelaide has not been immune to this type of refurbishment with 1 King William Street now providing the ability to store over 200 bikes with lockers.
All in all the older generation can complain about the millennials but in terms of our day to day they are set to give us more than just smashed avo on our toast.
The Adelaide CBD office market is best characterised by low levels of demand and limited new supply, high incentives and recently stabilised vacancy rates.
The net absorption within South Australia over the six months to January 2018 was 9,696 square metres - substantially higher than the previous six month period of 4,624 square metres and well above the ten-year average of 4,963 square metres. This has been driven predominantly by the lower grades, with Prime and A-grades having a combined negative absorption and B- and C-grades making up the difference. This is due to previous new supply creating high vacancies in the mid grades, creating
strong incentive for lower grade tenants to upgrade.
Supply over the six months to January 2018 was low at 984 square metres, which is down on the previous six months of 5,227 square metres and these figures are both well down on the ten-year six-month average of 18,105 square metres.
Supply is expected to remain subdued until the anticipated completion of the Charter Hall building in the GPO Exchange development in the second half of 2019. Located at 2-10 Franklin Street, the two towers project is to provide a combined 24,500 square metres of A-grade office, 3,000 square metres of retail and fully refurbish the 12,500 square metres of the heritage GPO building. Construction started on the 19 level building in September 2017 with nearly half the building pre-committed by the SA Attorney General’s Department. In April 2018, BHP announced a commitment to lease 10,000 square metres of the building, leaving only 10% of the building unoccupied.
Another development is the $100 million 19-storey, mixed use development on Pitt Street. The U City development by Uniting Communities is to provide retirement living, disabled respite accommodation and 6,600 square metres of office space, over 65% of which is proposed to be owner-occupied.
Whilst these two developments are predominantly pre-committed, there will be pressure to backfill vacated space. Adding to this is the 5,671 square
Com
mer
cial
Month in ReviewAugust 2018
South Australia

12
metres of refurbished space due to become available throughout 2018, which will continue the cycle already being seen.
The shuffling of space has seen a strong use of incentives throughout the office market of between 35% and 45% for vacant space.
In general terms and on a gross face basis we are seeing rents within the following ranges:
• Prime grade office space is generally between $475 and $525 per square metre;
• A-grade office space is generally between $425 and $475 per square metre;
• B-grade office space is generally between $350 and $425 per square metre;
• C-grade office space is generally between $300 and $350 per square metre.
Com
mer
cial
Month in ReviewAugust 2018

13
BrisbaneIn July, the PCA reported that Brisbane recorded its highest ever level of office vacancy with a headline rate of 16.9%. This is primarily on the back of the completion of the two major new buildings at 180 Ann Street and 480 Queen Street. There are now only two buildings under construction in the Brisbane CBD, with the imminent completion of 1 William Street and the 48,000 square metre office component of 300 George Street to be completed in late 2018.
Notwithstanding the headline figures, the Brisbane CBD is showing signs of recovery, with the first significant net absorption for some four years, totalling 42,742 square metres. It is now apparent that there has been significant new tenant interest in CBD office buildings, brought about by record high incentive levels and the availability of accommodation which was previously out of reach for many tenants.
In the fringe markets, the picture remains more constrained with further negative net absorption totalling 1,996 square metres. This brings the total vacancy to 12.9%. Of the primary fringe areas, both Spring Hill and the Urban Renewal areas showed positive absorption, whilst South Brisbane, Milton and Toowong continued to show negative net absorption, resulting in an increase in overall vacancies.
We are now however coming to the end of an extended supply cycle both in the CBD and in the fringe and there is unlikely to be any new significant commercial office development until we see recovery in effective rents.
In suburban markets, the overall picture remains relatively stable with very limited new supply, a significant quantity of stock available and difficult leasing conditions in many areas.
In terms of recent sales transactions, there is still good demand for well leased properties but a very significant differential between primary and secondary properties. Within the Brisbane CBD, there has only been one significant sale in the past six months, being that of 300 Queen Street at $188 million, showing a rate of $9,700 per square metre and a passing yield of circa 7%.
In fringe areas, there has been activity with some five significant sales, primarily in the Urban Renewal area. These have generally been of good quality and well leased properties.
There is a strong owner-occupier focus in suburban markets with reasonable demand for well located, near city, strata units in the sub $1 million price bracket. Demand for poorly leased larger properties is poor unless well tenanted.
Some recent notable sales in Brisbane include:
PropertySale Price
(,000) NLA Yield$/m2
of NLA
300 Queen St, Brisbane
$188,000 19,364 7%* $9,708
26 Commercial Rd, Newstead
$13,250 2,195 7.54% $5,308
7 Brandl St, Eight Mile Plains
$20,500 5,264 8.45% $3,680
* Reported
Com
mer
cial
Month in ReviewAugust 2018
Queensland
2018 South East Queensland Property Overview Breakfast
Register your interest here.Guest speaker Hon Peter Costello ACThursday 1 November 2018Tickets on sale soon
For further information, contact Catherine [email protected] or 07 3353 7500

14
There is no doubt that challenging office market conditions will remain for some time, but given a reasonable hiatus in the development cycle we anticipate that conditions are likely to start their slow climb back.
For investors, we foresee slim pickings in the market generally with only properties having reasonable lease covenants and strong locations likely to find buyers easily.
Gold CoastThe Gold Coast office sector does not have a defined CBD. It has traditionally evolved within the five main business and retail hubs of Southport, Surfers Paradise, Bundall, Broadbeach and Robina/Varsity Lakes. Southport and Bundall tend to have dedicated office precincts whereas in the other areas the office buildings are interspersed with retailing or
are in mixed use developments. These five hubs are also monitored by the Property Council of Australia in its biannual Office Market Report. Nerang and Beenleigh have also been other long standing, more prominent office areas, particularly underpinned by the establishment of government department occupied buildings.
Office product ranges from strata office suites to smaller stand-alone buildings to medium or highrise office towers up to 30,000 square metres in size. With a small business-dominated economy, a high percentage of Gold Coast office floor space seeks to cater to smaller end users. Consequently, strata office suites are a dominant office type, although in more recent years, there has been a trend towards small stand-alone type buildings, including the derivation CityPods created by Robina Group encompassing a group title development of 16
Com
mer
cial
Month in ReviewAugust 2018
7 Brandl Street, Eight Mile Plains (Source: www.commercialrealestate.com.au)
300 Queen Street, Brisbane (Source: www.realcommercial.com.au)
26 Commercial Road, Newstead (Source: www.realcommercial.com.au) City Pods (Source: www.realcommercial.com.au)

15
smaller standalone buildings of 150 to 350 square metres that achieve sale prices in the order of $3,850 per square metre including car parking. .
The Gold Coast has a relatively narrow catchment bounded by ocean to the east and mountain ranges to the west. Therefore it expands laterally north and south, although the New South Wales border tends to be another obstacle to southern expansion of the region. Over the past ten years, residential development has expanded north along the M1 Pacific Motorway and now north-west towards Jimboomba and Browns Plains. Nodes of commercial development have followed to service the needs of the residents, with demand for office space satisfied in mixed use premises or smaller office buildings. A good example of this is Siganto Drive at Helensvale. Further, influence of increasing traffic and longer commuting times has exacerbated this trend towards more mixed use premises or smaller office buildings in the beachside business areas such as Miami, Burleigh Heads, Palm Beach and Coolangatta, the more affluent residential areas such as Hope Island and Paradise Point, on main arterial roadways such as the Smith Street Motorway and Ashmore Road and in close proximity to main shopping centres such as New Street at Nerang .
This changing trend of smaller standalone office buildings and provision of office floor space within mixed use premises is likely to continue, particularly
as outer lying areas of the Gold Coast experience more and more residential expansion.
Hot desking, breakout areas, collaborative work spaces, expanded amenities...all of these emerging tenant requirement changes are influencing the Gold Coast office sector although possibly not to the same extent as in the capital city markets. Businesses appear to be looking forward to the ability of a tenancy to be down sized or more efficiently utilised from a business cost perspective. A regular shape, open plan and good natural light are important elements from a leasing up perspective. Reliable, high speed internet connectivity is vital nowadays, particularly with increasing numbers of staff seeking to work from home. Car parking and public transport for business owners and staff is also important.
Com
mer
cial
Month in ReviewAugust 2018
56 Nerang St, Southport – sold April 2018, $6.973M, AY 6.71%, Rate $3,467/m2 NLA (Source: www.commercialrealestate.com.au)
8 New St, Nerang – example of the type of small new office being built

16
Establishment of the Gold Coast light rail, which now runs from Helensvale through Southport and Surfers Paradise to Broadbeach has been a catalyst to attracting tenants back to the traditional office sectors, with this trend likely to continue. Conversely, congestion and a lack of car parking or readily available public transport is now diminishing the attractiveness of Robina and Varsity Lakes.
To close out this month’s office sector review, the Gold Coast office market continues to reflect reasonably buoyant conditions. There continues to be a good number of office premises transactions, including several at the over $7.5 million mark. Yields have continued to firm, with recent transactions reflecting levels down to 6.25%, although the more dominant range would be 6.75% to 7.25% after allowance for permanent vacancies. Rental levels are reflecting growth, albeit moderate, and incentives are still in the range of 8% to 10% of first term rental. The Commonwealth Games in April 2018 has certainly assisted in keeping the Gold Coast in the spotlight. Provided interest rates remain at their current low levels, market conditions are unlikely to vary.
CairnsThe Cairns office market is relatively shallow and experiences limited sales activity and has had limited new development. The last large office building constructed in Cairns was the State Government
office tower completed in 2010. There are no known new developments in the pipeline.
Commercial property sales in Cairns, inclusive of retail and commercial office premises, remain well below the peak levels achieved in the 2005 to 2007 period. Prices paid for secondary strata titled premises have been relatively stable since 2010 at around $2,500 to $3,000 per square metre of floor area.
Most new office space leasing demand is for smaller areas and for modern, good quality green star rated premises, however there is only a handful of such buildings in Cairns. These buildings achieve high levels of occupancy and are experiencing stable rent levels typically of $350 to $400 per square metre per annum. Demand for lesser quality space remains limited and there is a large oversupply of good quality non-inner CBD and well exposed secondary space in the $200 to $275 per square metre per annum rental range. These conditions have placed downward pressure on secondary rents and seen the emergence of incentives.
Overall the Cairns office market has experienced little change thus far during 2018 and is expected to see little change for the remainder of the year.
TownsvilleThe changing office culture over the last decade has seen a transition in how the current modern
day office looks. Townsville is a relatively unsophisticated office market compared to the metro centres, however we too are seeing a trend change in office environments.
Gone are the days of workplaces being nose to the grindstone places, with office layouts becoming more functional, cost effective and flexible working environments. Centralisation has played a key role in the down sizing of areas and making better use of space through hot desking and open plan functional layouts. It is becoming more common to see breakout areas and soft furnishings providing a more relaxed environment with the mental wellbeing of staff being of high importance. On site shower facilities and bike storage areas are becoming important to enable staff to cycle to work or exercise during lunch breaks with an emerging desire for good natural lighting, high quality data speed and close proximity to cafes, parking and other social facilities.
The few major office buildings constructed in Townsville over the past ten years have been mostly for major corporate or government tenancies. It was recently announced that the ATO would relocate to a new building to be constructed in the fringe City Centre. It is reportedly a $25 million, four level lifted office with the ATO to occupy about 4,000 square metres. The current ATO lease is due to expire in 2020, which would see a vacancy in its current office at Stanley Place, resulting in a large amount of
Com
mer
cial
Month in ReviewAugust 2018
17
quality office space hitting the leasing market. The current depth of the local private sector will unlikely absorb this space given the already oversupplied state of the market.
Sunshine CoastThe office market on the Sunshine Coast had significant supply added during 2017, with a current vacancy rate as reported in the latest PCA report of 15% with a total of 25,686 square metres of vacant space. During 2017 there was 22,776 square metres of space added to the market, which accounted for the majority of the new space. Overall absorption was 7,139 square metres, which is circa twice the rate noted for the prior three year period.
The overall market outlook is therefore very cautious with significant white collar workforce growth required to take up the vacant space throughout the region.
There is significant incentive in the office market currently with typically circa 10% to 25% of the overall face rental. This is often given in terms of rent free periods of three to nine months depending on the length of the lease, which is generally from three to six years. Further fit out incentives are also common, particularly for new space.
There has been a significant change across the office market on the Sunshine Coast over the past three years. This has been in the opening and overall
usage of office sharing and co working spaces. A number of operators have commenced these throughout the market and landlords with large office holdings are beginning to use these operators as a way to cultivate businesses and tenants within their office stock.
This co-working concept has been actively embraced by the market with tenants seeing the limited bond (typically no cost, with rent just paid monthly in advance) and limited other office fit out and start up costs as a real benefit. This enables tenants to reinvest and grow their businesses in the start up phase. If successful, they often are promoted by the co working provider to the landlord and placed within the office stock of the landlord.
In the current market, commencing businesses are utilising a number of the co working and serviced office spaces as it offers a low cost base in an overall sense with the flexibility of not having to sign long term leases with rental guarantees etc. This allows higher levels of capital to be invested back into the business.
Established businesses are typically more drawn to the traditional office market which offers longer term security of tenure. It also presents a more significant presence to the market in terms of the longevity of the business.
In heavily supplied markets, tenants generally look at
a number of factors that influence their decision to take office space, including:
• Location and access - office users tend to judge location based on surrounding amenity and ease of access to main transport routes. What has also become more important over the past five years is access to digital services with internet speed crucial for many businesses.
• Quality of accommodation - this includes the quality of the building, lift access to upper levels, views, breakout areas and level of car parking, which is generally in the range of one space per 40 square metres of office space for larger tenancy areas.
• Investment decision of leasing versus purchasing - the overall interest rate environment, which will influence the decision whether to buy or lease. In the current market, there is a range of strata titled offices available across the region and we have seen an increase in overall sale levels in this market, which has improved value levels slightly. The continued low interest rate environment is influencing this market.
The office market is likely to continue to have a range of challenges in the short term to medium term, particularly with the introduction to the market of the Maroochydore Town Centre towards the end of 2018.
Com
mer
cial
Month in ReviewAugust 2018

18
Central QueenslandOne of the greatest changes in office tenancies in central Queensland towns over the past 20 years has been the reduction in space within the CBDs occupied by government and quasi government agencies. As service delivery has contracted to capital cities and to on line platforms, the demand for larger floor areas has declined. Over this time, many of the agencies still in regional areas have relocated out of the traditional main street precincts to secondary fringe locations, thereby fragmenting commercial development in some towns.
Typically office floor space requirements for all businesses are smaller as technology has improved efficiencies, increased the use of hot desks and reduced the amount of paper files and their associated storage space requirements. Smaller businesses have become even more adaptive with staff often working remotely. There has been a rise in shared office space on casual (short term) agreements.
Rockhampton The office sector in Rockhampton has been relatively flat in recent years and without any significant demand for new office accommodation there has been very little development on this front. For modern office accommodation, rentals have stabilised and generally range from about $300 to $400 per square metre gross (including outgoings)
for well located tenancies, with floor areas of up to about 300 square metres. For larger, modern tenancies, we have seen most leasing activity in the $250 to $275 per square metre gross range for better presented tenancies. There has been relatively weaker demand for these larger tenancies as few local businesses require large floor areas.
MackayThe market remains oversupplied, but leasing activity is improving with the resurgence in coal mining improving business confidence and office demand. Small financial and insurance businesses have been the primary tenant group. Recent leasing activity has occurred around the city fringe for ground floor, tenancy areas of 150 to 250 square metres at consistent rates of about $250 per square metre per annum gross. The office rental market has experienced a downward correction. After a period of low activity at inconsistent rental levels, office rents now appear to have consolidated at a new lower level, approximately 20% below the 2012 peak.
Wide BayRecent demand for new office spaces throughout the Wide Bay has been limited and mainly centred on medical uses within the established medical precincts. Businesses have typically looked towards the established town centres such as the Bundaberg CBD and surrounds for office accommodation.
Rental levels for office accommodation have followed the trend of the commercial market in general, remaining stable with little movement in gross rental levels.
Good quality office tenancies that are well located can achieve rental levels in the order of $300 to $400 per square metre gross. The volume of new leases established in this segment is limited. Larger nationally recognised businesses are the most likely tenant, along with other medical businesses within an established medical precinct.
Lesser quality tenancies that are still well located can achieve rental levels in the order of $250 to $300 per square metre gross. Leases within this price segment of the market are more common than the range stated above, however, the total rental amount remains an issue for most businesses.
Lesser quality tenancies considered to be situated within secondary office locations generally achieve rental levels in the order of $150 to $200 per square metre gross. Typically these tenancies will attract smaller businesses or newer businesses that are still establishing themselves.
Com
mer
cial
Month in ReviewAugust 2018

19
DarwinThe Darwin commercial office remains in a moribund condition with limited demand which is commensurate with general economic conditions in Darwin at present.
Demolition of Cavenagh House at the corner of Cavenagh and Knuckey Streets has commenced. This multi-level office block is to be demolished and replaced with a new office building which will accommodate the NT Government’s Health Department. The relocation of the Health Department to this building will displace older accommodation which is currently occupied in the CBD and service centres such as Casuarina. It is therefore not expected to have any positive effect on the net absorption rate for Darwin office space generally.
The Property Council of Australia reports that the vacancy rate is now in excess of 22% however it should be noted that the vast majority of these vacancies are in buildings of a lower B-, C- and D-grade standard. There is actually limited choice for A-grade accommodation around the CBD, however with the NT Government’s accommodation requirements being satisfied there is also very limited demand for any type of office accommodation.
There is not as much of a differential in values between office space in the CBD and office space
in suburban areas of Darwin, compared to the differential seen in other capitals. This is partly attributed to the shorter commuting times in Darwin. It can also be attributable to the various policy settings of the dominant tenant being the NT Government, which at various times has favoured decentralisation of offices to service centres such as Palmerston, Casuarina and (increasingly) Berrimah. However the reality is that Darwin is too small to efficiently operate on such a decentralisation. If the Darwin CBD is to function as the key central business district of the Northern Territory, then it is essential that most administrative operations be based there so that the CBD can enjoy the attendant benefits of a higher daytime population.
Com
mer
cial
Month in ReviewAugust 2018
Northern Territory

20
PerthThe most recent Property Council of Australia figures for the Perth CBD office market indicate the total vacancy rate decreased from 21.1% to 19.8% in the six months to January 2018. The total vacancy rate in West Perth however rose 1.7% to 16.7% for the same period.
Whilst there is some positive news with vacancy rates reducing overall, Perth’s CBD still has the second highest vacancy rate of all capital cities in Australia.
The reduction in the overall vacancy rate can be attributed to a flight to quality phenomenon with the level of vacancy in the Premium and A-grade buildings being significantly less compared to B-, C- and D-grade spaces.
With a glut in the office leasing market and a flight to quality occurring, owners of B- and C-grade buildings are looking for conversion opportunities to residential, educational and even hospitality uses.
The significant deterioration in the Perth CBD and West Perth office leasing markets during 2016 (mainly as a result of reduced demand from resource sector tenants) coupled with historically low occupancy costs for office space in these traditional office districts has caused a rise in tenant migration from peripheral office precincts but also in tenants up-scaling to better quality accommodation.
Property owners have had to become proactive in trying to entice existing tenants to recommit and also in order to attract new tenants. This has resulted in substantial incentives being offered.
Furthermore, landlords are providing their existing and prospective tenants with bespoke floor plates, flexible work spaces, meeting hubs, refurbished foyers, some featuring concierge services, gymnasiums or wellness centres with some more innovative landlords looking at child care or child minding facilities within their buildings, in addition to the obligatory end of trip facilities of bike storage rooms and in some cases, bike repair shops.
Despite the findings of the PCA Office Market Report, discussions with real estate agents active in this sector confirm a generally soft office leasing market with downward pressure still being exerted on asking rental rates and a large volume of space available, coinciding with a lack of demand, particularly for secondary premises. In many cases tenancies are being listed for extended periods and with multiple agents.
In terms of capital transactions, demand for office property in the Perth CBD has been predominantly from institutions and foreign (south-east Asian) buyers seeking counter-cyclical acquisitions of secondary assets with good prospects for re-positioning.
Six major CBD and fringe office buildings transacted during the past six months. One of the more notable was Workzone West, 202 Pier Street, Perth which was purchased by Charter Hall for just over $125 million in June 2018.
Sales activity has however almost ceased within West Perth over the past 12 months. The lack of quality office stock with medium to long term WALEs combined with subdued economic conditions has affected transaction activity.
The outlook for the Perth office leasing market is to see a stabilisation in rental incentives and rents over the short term and no significant new building activity until at least 2020. Some uncertainty still exists as to the effect on the office leasing market of Woodside vacating 240 St Georges Terrace at the end of 2018, however it is understood that some of the impending vacant space is already pre-committed.
Overall, we anticipate that vacancies in the Perth CBD will stabilise and that vacancies in West Perth will increase further as tenants look to relocate back to the Perth CBD.
As tenants make the flight to quality, a two-tier market may eventuate with less attractive, lower grade buildings increasing in vacancy and more attractive Premium and A-grade assets in good central locations showing a decrease in vacancy.
Com
mer
cial
Month in ReviewAugust 2018
Western Australia

Residential

National Property ClockAugust 2018Houses
Liability limited by a scheme approved under Professional Standards Legislation.
This report is not intended to be comprehensive or render advice and neither Herron Todd White nor any persons involved in the preparation of this report accept any form of liability for its contents.
Peak of Market
Approaching Peak of Market
Rising Market
Start of Recovery
Bottom of Market
Starting to decline
Declining Market
Approaching Bottom of Market
AdelaideAdelaide HillsBallaratBarossa ValleyBrisbaneBurnie- DevonportCanberra
EchucaEmeraldIron TriangleLauncestonLismoreMilduraMount Gambier
Central CoastCoffs HarbourMelbourneMid North Coast
BendigoGold CoastIllawarraSouth East NSW
Sydney
Alice SpringsBundabergDarwinPerth
RockhamptonSouth West WAToowoomba
CairnsGladstoneHervey Bay
IpswichMackayTownsville
GippslandHobartNewcastleSunshine Coast
Entries coloured orange indicate positional change from last month.

Peak of Market
Approaching Peak of Market
Rising Market
Start of Recovery
Bottom of Market
Starting to decline
Declining Market
Approaching Bottom of Market
National Property ClockAugust 2018Units
Liability limited by a scheme approved under Professional Standards Legislation.
This report is not intended to be comprehensive or render advice and neither Herron Todd White nor any persons involved in the preparation of this report accept any form of liability for its contents.
BallaratBurnie-DevonportEchucaLaunceston
LismoreMount GambierSunshine Coast
CanberraCentral CoastCoffs Harbour
MelbourneMid North Coast
BendigoGold CoastIllawarraSouth East NSW
BrisbanePerthSydney
AdelaideAdelaide HillsAlice SpringsBarossa ValleyBundabergCairns
DarwinIron TriangleMackayRockhamptonSouth West WAToowoomba
EmeraldGippslandGladstoneHervey Bay
IpswichMilduraTownsville
HobartNewcastle
Entries coloured blue indicate positional change from last month.
24
OverviewFifty years is a long time to be in anything, but to have successfully grown and operated a business for five decades… well, that’s an achievement few get to claim.
This month we celebrate a half century of Herron Todd White by looking at the cutting edge of housing today and reflecting on how our real estate centres have evolved since 1968.
It’s an educational and informative special edition of the Month In Review that will be an excellent conversation starter at your next gathering.
SydneyOver the past fifty years in Sydney we have experienced a substantial shift in how we live, where we live, how we treat housing and what are considered must have items.
In 1968, the median house price for Sydney was approximately $13,000. Fast forward 50 years and that number has increased by over a million dollars with the June median at $1.12 million (source: Domain).
The must have for families back in 1968 was a detached dwelling in the suburbs with a large yard. A detached single garage or carport was standard and internally one living room was fairly common.
Thanks to increasing affordability, urban sprawl and changes to the way we live. Houses have become more than just a place to sleep at night; they have become the focal point of our lives. In many cases people now eat, sleep, entertain and work at home, so houses and housing design have adapted to our changing needs.
These days the kitchen isn’t tucked away in the corner, it has become the focal point of the home, and as such spending $50,000 to $100,000 on this area alone is becoming more common and not just in the more affluent areas of Sydney.
Other items becoming more popular include multiple external cladding and the use of a mixture of materials, dedicated media rooms and the desire to
combine outdoor and indoor living through alfresco areas with substantial outdoor kitchens, pizza ovens, bar fridges and outdoor heaters.
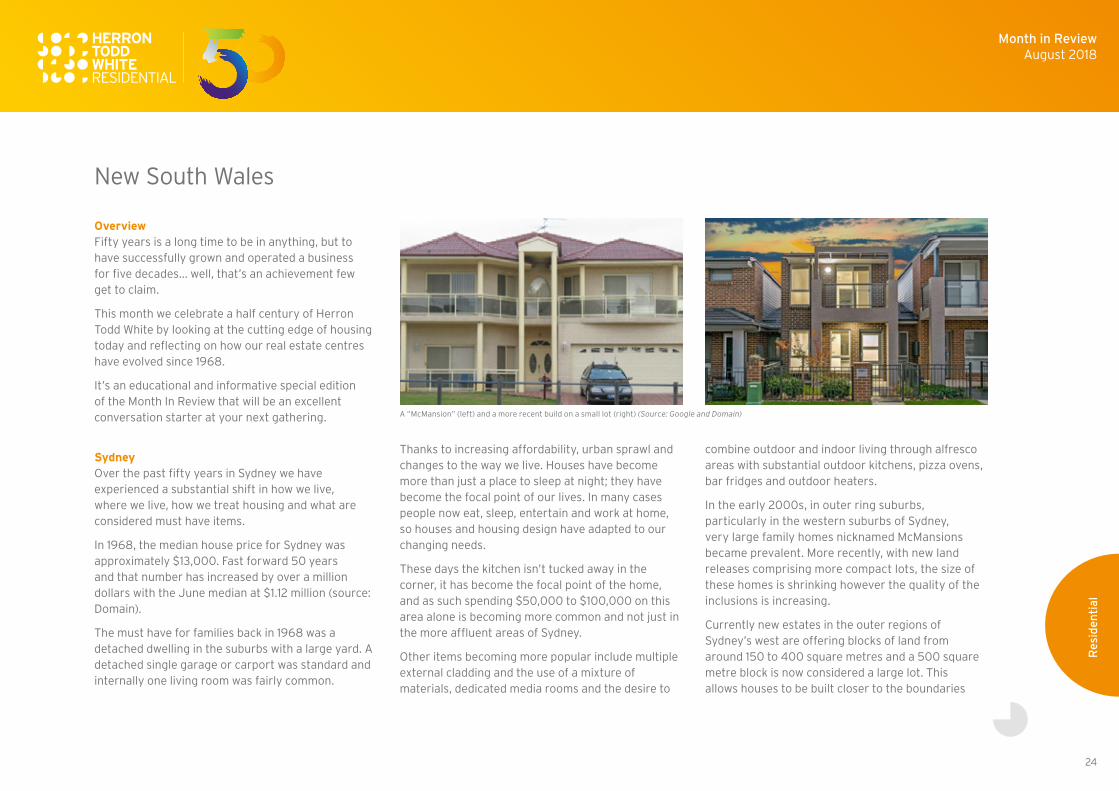
In the early 2000s, in outer ring suburbs, particularly in the western suburbs of Sydney, very large family homes nicknamed McMansions became prevalent. More recently, with new land releases comprising more compact lots, the size of these homes is shrinking however the quality of the inclusions is increasing.
Currently new estates in the outer regions of Sydney’s west are offering blocks of land from around 150 to 400 square metres and a 500 square metre block is now considered a large lot. This allows houses to be built closer to the boundaries
Month in ReviewAugust 2018
Res
iden
tial
New South Wales
A “McMansion” (left) and a more recent build on a small lot (right) (Source: Google and Domain)

25
and have efficient low maintenance yards with little to no wasted space. Whilst it may not appeal to everyone, these smaller lots are being snapped up by young families and individuals who want a home but don’t want to waste the entire weekend on the garden maintenance that is usually required on more traditional 700 to 1,000 square metre parcels.
Planning restrictions throughout many Sydney LGAs have eased, allowing for more medium and high density construction. Lower minimum lot sizes for dual occupancies, smaller minimum living areas for units and an easing of car accommodation requirements have helped reshape a number of established Sydney suburbs.
In 1968 it would be unusual to raise a family in a unit. Now it is more common with families wanting to live in low maintenance accommodation within close proximity to services as a trade off to a larger home in the suburbs.
The centre of Sydney has traditionally been the Harbour and CBD, but over the years the focus has drifted further west as the population has grown along with urban sprawl. Currently Parramatta is seen as not only the geographical centre of Sydney but as a genuine second CBD with large scale infrastructure investment. This will become more the case when the second airport is built at Badgerys Creek, some 50 kilometres west of the Sydney CBD, but only half that from Parramatta.
Closer in, on the Sydney CBD fringe, there have been dramatic changes over the past 50 years with industrial precincts being transformed into new residential areas.
One such area is the Green Square and Zetland precinct, which has had a complete transformation over the past 50-odd years.
During the early to mid-1900s, the area was home to Victoria Park Racecourse and adjoining industrial estates such as the Nuffield Australia motor vehicle assembly facility (pictured top right).
Fifty years ago, these suburbs were not as appealing as places to live as they are today. The job market was not as focused on being close to the CBD, with many manufacturing jobs based around the inner-west and outer-western suburbs of Sydney. As time went by and new industries such as financial services, media and technology grew, demand also
Month in ReviewAugust 2018
Res
iden
tial
Zetland now (left), and Green Square which is currently being developed (Source: Google)
(Source: City of Sydney Archives)

26
started to increase for people wanting to live closer to the CBD. As a result these areas have gentrified significantly and become far more desirable over the past two decades.
Units are now the more popular form of new residential property due to affordability and lifestyle choices for many. These days the demand continues to grow which is the result of affordability, job markets and people wanting to be closer to work to achieve work-life balance or improved lifestyle and of course avoid travelling long distances on public transport or in traffic. The increasing levels of new apartments also make rental accommodation more accessible for tenants. Warehouse and factory conversions have also become particularly popular within these inner city locations, allowing developers to transform older buildings whilst retaining their heritage appeal.
Common facilities are a big part of this lifestyle, with many new complexes having gyms, pools and impressive common areas. Developers are now trying to provide a point of difference by adding in common improvements such as libraries, meeting rooms, rooftop terraces, BBQ facilities, edible (herb) gardens and yoga rooms. In an effort to minimize car use, the City of Sydney Council is reducing the number of car spaces allowed in new developments, which is restricting supply and is pushing up the price of car spaces. Many new complexes now offer motorcycle or bicycle spaces as an alternative.
Proposed Community Park for Green Square named ‘The Drying Green’ in celebration of its industrial past where it was used for drying wool fleeces. (Source: City of Sydney)
In addition to units, developers are also offering alternative options such as townhouses and terraces which offer larger living areas, superior parking provisions and direct street front access which appeal to larger families and those who don’t want to totally give up the more traditional freestanding home style found further away from the inner city. While these property types are a far cry from the quarter acre lot, they still tick many of the boxes in regards to size and functionality, plus they benefit from being close to work, school, shopping centres and everything else that buyers are looking for these days.
The past 50 years has seen Sydney grow out but also up, with increased density throughout most established suburbs, particularly those close to public
Month in ReviewAugust 2018
Res
iden
tial
1F Victoria Park Parade, Zetland - Sold May 2018 for $2,100,000 (Source RP Data and Realestate.com.au)

27
transport infrastructure. The next 50 years is likely to see an even greater shift as the population continues to grow but the workforce continues to decentralise as more people work away from the office.
Lismore/Casino/KyogleIt is rather safe to say that the housing landscape of Lismore, Casino and Kyogle has altered or adapted significantly over the past 50 years. Gone are the days of subdividing of residential land into the traditional freehold quarter acre blocks (1,012 square metres) in the main residential estates. Typically, lots are much smaller, say 650 to 750 square metres (even smaller as infill development within the CBD at less than 450 square metres).
However, what is interesting to note is that the houses have become significantly larger. The standard today for most upgraders or even first home buyers is to secure that 4-bedroom, 2-bathroom, double garage, brick and tile dwelling.
Fifty years ago, some would be very fortunate to get a 3-bedroom, 1-bathroom fibro cement clad house (asbestos anyone?? No problems back then!) after pleading on all fours at the bank manager’s office! Today, the feeling is that finance is much easier to hand out and one is even asked “do you want fries with that?”!
In the environment of a low interest rate generation, the ability to acquire that brand new house is
somewhat easier, but also more expensive. In Lismore, Casino and Kyogle such brand new homes range from $450,000 to $600,000 which pales in comparison to the sales prices closer to the coast and generally in comparison to the major metropolitan NSW centres.
The demand is generally for detached houses, however detached units on a separate, smaller strata tile lot have been flavour of the month for the past five years. The reason is that a smaller detached strata site with a similar sized 4-bedroom, 2-bathroom, double garage dwelling, smaller back yard and garden (meaning less landscaping maintenance and lawn mowing) is a win-win for the property owner who wants the luxury but not the work of looking after the place.
There are still some vestiges of the older style housing development in Lismore City (Girards Hill, East Lismore, Lismore Central) and scattered in parts of Casino and Kyogle. The quality of these homes can vary widely from being fully renovated to being generally untouched.
The local authority and Councils are pretty keen on seeing their respective towns grow and the modus operandi in this regard is typically urban spread. Goonellabah (a suburb of Lismore City) for example has been the mainstay of growth in Lismore as it spreads east along the Bruxner Highway with new
residential estates popping up on the northern and southern sides of the highway.
This spread has seen the creation of more parks, sporting grounds and shopping centres to support these growing suburbs. And to think that vast swathes of Goonelllabah 50 years ago would have been cattle grazing and dairying land.
The consumer’s desire for lifestyle has also garnered strength with the advent of the rural lifestyle block or rural residential property which pretty much kicked off during the 1970s and has gone from strength to strength. Now we can see established rural residential properties commanding sale prices north of $700,000 in Richmond Hill, Mcleans Ridges, Bexhill, Chillcotts Grass, Tregeagle and even Modanville and Dunoon (in selective places).
As a last point, it is interesting to hear some bemoan the loss of the back yard of yesteryear where the kids could be just kids and play all day…….fast forward 50 years and what do we have now? A lot more opportunities to do all sorts of stuff, and yet some look back. Weird....
Ballina and Byron The big issue throughout the Ballina Shire remains affordability, both in properties to purchase and to rent. New housing estates throughout Ballina, Lennox Head and Wollongbar are supplying vacant land product to meet demand for single residential
Month in ReviewAugust 2018
Res
iden
tial

28
dwellings and duplex units however there is comparatively little stock of residential units being constructed. In comparison to dwellings 50 years ago, new houses being constructed are significantly larger and would typically have a double lockup garage. New houses have become far more generic over the past 50 years throughout the Ballina Shire which can be attributed to the affordability and popularity of standard project homes. Whilst the population of the Ballina Shire as a whole has increased significantly over the past 50 years, Lennox Head would appear to have changed the most, going from a small fishing village to a population of 7,741 according to the 2016 census.
In the Byron Shire, housing design and planning is ever changing to address the important issues affecting the local market. In order to highlight these changes we will discuss the comparison and contrast with what the real estate landscape looked like in this local government area 50 years ago.
For detached housing, there have definitely been some changes in new housing design to cater to the current market. This is evident in the shift towards new houses being built to include a fourth bedroom. It is now a very rare occurrence to see a 3-bedroom house being constructed. Whether the fourth bedroom is a need in this local shire for growing families or a consideration for resale is debateable. Lot sizes for new houses are also smaller compared
to land for sale over 50 years ago. All of the new land subdivisions have an average land size of between 450 and 650 square metres compared to that of older allotments which typically have a land area of 750 square metres and above in a built up residential area. Even though there had been a decrease in land size, there has been an increase is housing size. Houses are becoming bigger and as demand has increased and availability shortened, there has also been a shift towards a secondary dwelling or studio. Building materials are also changing, not only to keep constructions low, for example render or styrofoam (green or blue board), but also to ensure the building process is much quicker. On the other hand, prestige dwellings in the suburb of Byron Bay are definitely researching and acquiring new materials to incorporate in their builds such as different external claddings for an architectural design (for example, corten steel, Alucobond, rendered hemp and rammed earth). Changes in building processes have also been a necessity in order to comply with changes to local council requirements such as in relation to bushfire codes and flooding. The most interesting things that have been spotted recently in the Byron Shire in relation to recently constructed housing have been that of imported items of high quality such as marble from Italy for bench tops.
There has been a cultural shift towards unit living in the Byron Shire. As the demand in this area has
increased, the market has pushed the average buyer to revisit the unit market due to the lack of availability and affordability. New units are now catering for the new economy workers, such as freelancers working from home, by incorporating study nooks or recessed study areas within most new builds. In unit duplexes or triplexes, we are seeing a trend of people eradicating garages in order to compensate with a larger office area and compromising by installing carports instead.
There has been a change from the town planning perspective from that of 50 years ago in order for town planners to address issues such as affordable housing. The solution was to aid investors and owner-occupiers by providing a subsidy for a period of time to allow for an easier process for secondary dwellings or studios to be approved via local councils.
In reflecting back on what the Byron Shire would have looked like over 50 years ago, we know that the coastal resort towns would have reflected fishing and surfing villages comprised of fibro-cement housing and brick and tile dwellings on larger allotments.
The suburbs that would have been new back then would have been Lennox Head and what is known today as the Byron Bay industrial estate. As demand increased, urban sprawl has resulted in new subdivisions up and down the coast, resulting
Month in ReviewAugust 2018
Res
iden
tial

29
in larger rural holdings within close proximity to the township to be sold off piece by piece.
Some examples in regard to land and housing price comparisons are:
1979 – There was a deposit of $13,000 made on land located at Wategos Beach. Today, the entry level price well exceeds $2 million.
We believe that people would have had to pay no greater than $100,000 to obtain a land and house built in the Byron Shire. Median house prices today have increased by almost ten-fold:
• Lennox Head - $850,000
• Byron Bay - $1 million to $1.2 million
• Mullumbimby - $700,000 to $850,000
Subdivision potential is the greatest lesson to be learned over the past 50 years in property. As urban sprawl has put pressure on these coastal resort style towns, pressure has also been applied to local councils over the years to re-zone to allow for redevelopment.
The Clarence ValleyThe Pacific Highway upgrade and inflated workforce currently residing in the Clarence Valley has increased rental demand and has aided capital gains across almost all property types.
Across the sectors, there remains a diverse range of property available including large lot rural residential, small town lots and beachside or riverside prestige lots and houses or units. The general trend remains that the affordability of the area drives the steady increase or stable nature of the market with out of towners viewing property as an affordable option when compared to larger cities within close proximity.
In particular, the rural residential sector has seen an increase in interest, likely due to the now convenient proximity of rural localities to amenities.
To look back at the changes in the Clarence Valley property market over the past 50 years, the vintage of house would be familiar and towns, although expanded, have remained true to their vintage in many ways.
To generalise, the major difference to note over this time is the expansion, both in number of lots or houses as well as the reach of towns with better suited amenities now available and the overall accessibility of rural areas.
Coffs HarbourAlthough the property landscape has changed significantly over the past 50 years, a constant has been that icon of all big attractions, the Big Banana, which has also recently celebrated its 50 year anniversary. It should be noted that this icon has also
moved with the times and has come a long way from the original concept, much like the region itself.
A quick background of the origins of Coffs Harbour is important to note. The town was originally named Korff’s Harbour by John Korff in 1847. It was renamed Coffs Harbour when the town site was reserved in 1861.
Timber cutting remained the most important industry well into the 1900s, spurred on by the opening of the Jetty in 1892. Gold mining, fruit growing, dairying and sugar cane farming also became popular, although many of these earlier ventures failed. Bananas were introduced in 1881 and the banana growing industry took off in the early 1900s as the population swelled during construction of the railway and the harbour breakwall. Banana growing gained further momentum in the 1920s as plantations to the north were wiped out by disease.
Tourism took off with the completion of the railway in 1915 and the completion of the link through to Sydney in 1923. The town became popular as a beach getaway for the outer lying rural areas and travellers from Sydney. Much development occurred between the 1960s and 1980s within the beach side locations of the Jetty and Park Beach, mostly a mix of modest style unit accommodation and single homes used for weekend getaways.
Month in ReviewAugust 2018
Res
iden
tial

30
We consider the main drivers in the out of town migration over the years have been affordability, lifestyle and infrastructure upgrades, including a major regional airport having eight flights per day to Sydney, Pacific Highway upgrades that have significantly reduced car travel, and expansion of the hospital and education sectors. One limiting factor which still has an effect on the market is jobs availability and wages. Coffs Harbour is still well under the nation’s average with the 2016 Census statistics showing that only 6.3% of the working population earns over $91,000 per annum, 21% earns between $15,00 and $25,000 per annum and the middle income bracket of $50,000 to $90,000 represents 16.3%.
As property prices increase, the local affordability factor soon becomes an issue, which we are now experiencing.
Today, the landscape has changed. Although many of the older developments in prime beachside locations still exist, the move is for more redevelopment and urban planning. Coffs Harbour is constrained by the lack of available land for development and, as in most urban areas these days, lot sizes have reduced to between 450 and 650 square metres with prices ranging from $250,000 to $400,000 on average. Five years ago, land was available from $150,000 to $250,000 for standard residential lots; fifty years ago, 450 square metres was not even on the radar.
Unit development is also modernising with a recent highrise development, Seashells at Park Beach, just about to open its doors being only one of a handful ever constructed. Sales were very strong off the plan with the majority of buyers being local, and average values ranging from $310,000 to $750,000. More unit developments around the Jetty location are in the pipeline and a significant retirement and aged care complex is underway also within the Park Beach location. All of this is an indication of the changing property demographic.
We are also seeing many dual occupancy properties being developed to accommodate the ever increasing permanent rental market and Airbnb market. As always the push is to develop the more popular beachside locations which mean more units, smaller lot sizes and houses with a view to lifestyle. As a result we will see more innovation in small lot housing and sharing of electricity through solar power and community green spaces. Fifty years ago, the entire Coffs Harbour was a green space. How things change and forever will. We feel Coffs Harbour is equipped for this change and has a diverse range of lifestyles to offer plus the benefits of a major regional town.
Mid North Coast Within the area and surrounds of Port Macquarie, the housing market is being favoured by the metropolitan purchaser who is often trying to escape the inner city lifestyle or looking for an investment
with good growth. This area provides such facilities at an affordable price and only three to four hours from the larger cities. With new commercial development, the recent NBN connection and the modern district hospital facilities, the area is attracting many such people for its lifestyle which in turn is creating growth for the local area.
With the metropolitan centres slowing and prices stabilising in the metropolitan areas, there are pockets in Port Macquarie that are still selling at full purchase price and quickly (mostly the beachside suburbs and villages), however the general overall region is stabilising and we are seeing houses on the market for longer and price reductions becoming more frequent.
Within the developing western areas of Port Macquarie, new houses are mostly 4-bedroom, 2-bathroom standard designs and are often being built to a budget for first home owners or buyers who can’t afford the beachside Port Macquarie areas. Investor demand continues for duplex style homes and homes with separate granny flats.
With further development growth in the Port Macquarie region such as a new Bunnings, expansion of the Bundaleer Care Services and Stage 2 and 3 of the Charles Sturt University yet to commence, it is expected that housing development will continue at a moderate pace.
Month in ReviewAugust 2018
Res
iden
tial

31
Development of residential land subdivisions on the outer areas of Port Macquarie are still in demand with builders looking for sales opportunities within the next stages.
Interestingly, this week we conducted a valuation of a split contract community title townhouse subdivision within the Port Macquarie area. The concept whilst not new is a new trend that is happening in metropolitan areas. We will watch with interest the purchase price and resale of these dwellings.
In reflecting over the past 50 years, standard dwellings consisted of brick, tile roof, 3-bedroom, 1-bathroom and single lock up garage. These dwellings today have increased in value due to their locations and are being extended and modernised. An example of this is the Bellevue Hill and Shelly Beach areas.
At this stage, the Mid North Coast and its major regional centre of Port Macquarie is still a favourable place to live and invest with growth expected to continue.
NewcastleAs with most things in life, things have gotten bigger and more luxurious in the past 50 years, never more so than in the property world. Where a 3-bedroom, 1-bathroom house used to get the job done for many families, it now doesn’t come close to fulfilling the needs a of a modern family.
Four bedrooms and two bathrooms have become the standard starting point for families with entry level aspirations. The only time you generally see 3-bedroom homes being built now is in either infill townhouses or in granny flat format out the back of the existing house!
Single garages have morphed into double garages in that time as we became two (and more) car families. Often times, the double garage isn’t actually used for cars but for additional storage and clutter. Driveways become popular resting spots for the old jalopy.
An interesting deviation from the bigger is better trend is the comparatively smaller blocks in new developments as the unit cost of land gets more expensive and the cost to developers in bringing lots to the market has increased significantly. The old quarter acre these days is about 450 square metres. For those of us unfamiliar with a quarter acre, it’s just around 1,000 square metres. If today you were to find a 1,000 square metre block of dirt on the market in and around a built up area, it would be ripe for the construction of two if not three dwellings depending on zoning constraints etc. Our trend towards higher density is ongoing in line with our desire to appear to be conspicuously virtuous and environmentally friendly.
Another trend we have seen come to the fore over the past 50 years is the emergence of a second
living area, often in the form of a covered outdoor area or alfresco space. The older homes often lack a secondary living space and quite often the layout is not orientated to take in the best aspect the site has to offer. The addition of an outdoor living area allows more natural light into the dwelling and also helps the energy efficiency of the dwelling by allowing natural energy to be stored and retained throughout the day.
IllawarraFifty years ago, the Illawarra was dealing with immigration pressures. Following World War II, the Commonwealth Government launched a migration program which saw a steady supply of immigrants to Australia, mostly from Europe. The Illawarra was a popular place to settle for those arriving under government assistance or by private means. A shortage of labour and materials initially led to the creation of a number of migrant camps such as those in Fairy Meadow, Unanderra and Warrawong.
As the population grew, there was a housing boom between the 1950s and 1970s including the establishment of a number of new land releases for residential dwellings. Areas in suburbs such as Fairy Meadow, Coniston and Warrawong comprise many 1960s and 1970s built red brick single level dwellings which was the style of the times.
Fast forward 50 years and we are seeing a number of different styles of new housing. Current issues which
Month in ReviewAugust 2018
Res
iden
tial

32
are shaping new housing in the Illawarra are the availability of suitable land along with affordability. The result is:
• Smaller lots in new land subdivisions. Some lots are as small as 250 square metres while a large portion are less than 500 square metres.
• Modern infill townhouse developments, typically in suburbs within close proximity to a CBD.
• An unprecedented level of new construction of residential units in the Wollongong CBD.
A generation of settlers created and built new housing throughout the region.
Fifty years on and this generation is now starting to move on and new residents are purchasing homes which are 50 years old and often have only had one owner and are in original condition. The new owners are renovating these properties and the neighbourhoods are transitioning from older established neighbourhoods to trendy popular suburbs.
Southern HighlandsAs we set off on the 2019 financial year, the main property driver for the Southern Highlands remains proximity to Sydney and the increasing attractiveness to that buyer market, particularly families in the up to $1.5 million price point who continue to discover the Southern Highlands
region as an affordable lifestyle alternative to an increasingly congested urban existence.
Fifty years ago, the Southern Highlands was more of an operating rural community with dairy and cattle being the main economic drivers of the region. There was also a healthy amount of investment in the region by wealthy Sydney and Melbourne based families, setting up their rural retreat in the Highlands, mainly accessed by rail line to Bowral and Moss Vale as well as the outlying hamlets of Bundanoon and Robertson. This high level of discretionary expenditure saw the establishment of some trophy properties throughout the region, both town homes and rural lifestyle properties.
The advent of freeway infrastructure beginning with the opening of the M5 in the 1990s and its subsequent extension together with somewhat improved rail infrastructure has reduced the commute time between the Highlands and Sydney. This combined with the NSW Government recognizing and prioritising land release areas across the region is seeing the fabric of the Highlands gradually changing and providing real lifestyle opportunities to the Sydney market, particularly families and recent retirees. In fact the recent announcement by the NSW Government of the Wilton Junction urban release area will see approximately 18,000 new homes developed in the region over the coming years. The challenge as always will be
getting the balance right in providing the social infrastructure to cope with resident growth.
GosfordThe NSW Central Coast Region is located between the Sydney metropolitan area to the south and Newcastle to the north. Being here means we generally know what to expect as market behaviour radiates out from Sydney and we can react before our northern neighbours get wind.
As we write, the Central Coast region seems to have heard and seen how the Sydney market is slowing and we are noticing a fairly obvious slowing of the market. Real estate agents seem to be making strategic moves in their business normally seen in slower time and lenders are becoming tougher.
These are among the big issues facing the region. Other, equally important issues might include how market values will be maintained into the future and do we really need all these new residential releases and unit complexes at the moment.
Significantly, we sought the advice of some of the region’s older people on what were the hot topics 50 years ago in 1968. Those who could remember those times left us with the opinion that essentially little has changed. The worries of too much development was talked about as much then as it is now. This becomes relevant when considering that electrified rail service only came to the coast in 1960, followed
Month in ReviewAugust 2018
Res
iden
tial
33
closely by the opening of the Sydney-Newcastle Freeway in 1965 and combined with other events of the day, this made the Central Coast available to a much larger base of enquirers and potential home buyers.
There appears to have been considerable concern about the area changing too much now that it could be accessed easier by those Sydney types. Many retirees chose the region as the place to live out their retirement years in this newfound, affordable location next to the sea.
Purchases in the region’s older suburbs were discovered for what was thought to be bargain prices and during this latest period in real estate, much of the same was being said by those making the short trip from Sydney to the coast.
Having been opened to the Sydney market during the 1960s, new tourist destinations were also found and adopted. Today, many of the unit complexes built for those people still exist.
We have tried to narrow down prices paid for property back in 1968, but the reality is that records of these times are difficult to come by. According to details found in the Valuer General archives, it seems that a standard residential parcel in Gosford cost less than $10,000 and around $8,000 in Wyong in the late 1960s. A near new 3-bedroom house in East Gosford could be purchased for less than $30,000
and a six to seven year old house in Wyong for less than $26,000.
That same 3-bedroom house in East Gosford today would set you back around $800,000. Vacant land at Narara, just outside the Gosford CBD, can be secured for around $300,000. In the Wyong town centre, an older 3-bedroom house would be around $600,000. There is little vacant residential land remaining in Wyong, but a vacant parcel in nearby Wadalba is going to cost anywhere between $315,000 and $360,000.
In much the same vein as 50 years and with few exceptions, we consider real estate prices across the region to be affordable when compared to the Sydney market and when the ease of access to and from the area is taken into account as travel for employment is no longer the issue it was a few years back. Added to this is the large government expenditure currently, with a large extension to the Gosford Hospital and new government buildings in the Gosford CBD.
This level of development has the potential to underpin the stability of the local market as we move into the phase of the market cycle.
In terms of dwelling style and land size, houses are bigger and land is smaller than they were in 1968. The days of the 3-bedroom, triple fronted red brick and tile with or without a garage on a quarter acre
block are long gone. Granny flats aside (a millennial thing), if it doesn’t have 4-bedrooms, an alfresco, at least a double garage, air conditioning and a pool, then there must be something wrong – such are the times we live in. Those finding and purchasing a traditional 3-bedder will usually extend sooner rather than later or demolish and rebuild rather than risk being given an unflattering label.
The days of the red brick veneer and lowset fibro home are long gone. Bricks these days are either bagged, painted or rendered over, in between the architectural finishes under the metal roof.
We struggle at times trying to keep generic terms for the products used these days without using brand names. Fibro sheeting for example has a negative connotation as a result of the asbestos that was so prevalent 50 years ago. Corrugated metal roof is no longer corrugated metal when everyone is used to calling it Colorbond these days.
When we think of how the region has evolved in the past 50 years, we think of how suburbs such as Warnervale have gone from little more than fields of market gardens, horse paddocks and bush to one of the region’s most vibrant areas and while Warnervale is still a name it has been sliced up to comprise Hamlyn Terrace and Woongarrah. 50 years ago, an outlay of $15,000 would have secured a 20 acre block with a modest 3-bedder and little else.
Month in ReviewAugust 2018
Res
iden
tial

34
Month in ReviewAugust 2018
Res
iden
tial
Today, $750,000 will get you the keys to a large and modern 4-bedroom home on 550 square metres. If you can find one, a 20 acre block will set you back at least a million without a house.
Units are units and always have been, right? Wrong, we think when we look at today’s unit developments compared to yesterday’s. They are larger with more emphasis on lifestyle and look rather more than simply somewhere to live. Common areas are now an extension of the unit’s interior and an encouragement for unit dwellers to get outside. With less reliance on having your transport, these developments are also edging further from the traditional major transport hubs of Gosford and Wyong in many cases. Living on the coast doesn’t always mean being close to public transport, so having your own transport is still sometimes a necessity and for this reason, garageless units have yet to arrive.
Still on the unit market, now that the buoyant market is heading into a slowdown, there is a realisation that without as many buyers, we may be facing an emerging oversupply situation.

35
MelbourneMelbourne has one of Australia’s fastest growing populations and the housing landscape has changed dramatically over the past 50 years to accommodate this. The outer suburbs have boomed with many new estates as city centre prices continue to be out of reach for many first home buyers and families. The city centre has seen a substantial increase in high rise apartments. Lifestyles have also changed over the years, with people seeking more of a work/life balance and as such, property within half an hour of the CBD and close to public transport links continues to be highly coveted. Sustainability has also been an emerging trend in recent times, with the aim to encourage newly built homes to be as energy efficient as possible by utilising passive design principles.
CBD and Inner SuburbsIn the 1960s, the Victorian Government opened the Prahran Housing Commission Estate in an effort to boost the local population and inject life into the suburb. Today, Prahran Chapel Street is lively and buzzing with character from morning til late at night. Dwellers in the area are spoilt with boutique shops and a wide selection of cafes, restaurants, bars and nightclubs.
Prahran is an in-demand, inner-city Melbourne suburb, five kilometres south-east of the CBD. This hustling and bustling trendy suburb attracts young
independent individuals. Growing demand has led to developers seeking opportunities to accommodate this and build large designer apartments. Prahran has a number of architecturally significant commercial buildings, many of which are on the Victorian Heritage Register. This suburb has a mix of historic narrow side streets full of characterful Edwardian and Victorian terraces and renovated Victorian cottages alongside sleek new apartment complexes.
Month in ReviewAugust 2018
Res
iden
tial
Victoria
Prahran City Council, Streetscape 1959 (Source: Museums Victoria, July 2018)
Diverse range of property types in Prahran(Source: realestate.com, July 2018)
(Source: realestate.com, July 2018)

36
Inner and Outer South EastThe outer south-east has shown substantial growth in the past decade with areas such as Clyde, Officer and Pakenham, once vast farmlands, now sprawling residential estates to cater for the increased pressure on the housing market due to population growth.
Aerial view 2018 (Source: Google Earth)
Aerial view 2009 (Source: Landvic 2018)
In 1968, families looked to build modest homes with plenty of outdoor space for children to play and green thumbs to get their hands dirty. Fast forward 50 years and it is clear the shift is towards larger dwellings and smaller back yards with very little maintenance. Unlike the 1960s, most families today consist of two working parents who do not have the time to tend to a garden or a large lifestyle property. Many estates are built around lakes or parklands (such as Berwick Waters) so families can still enjoy the outdoor lifestyle without the hassle. Garages are also a staple in today’s homes, mainly due to council regulations to minimise street parking and the need for many people in these areas to drive to work. Most of the estates in the south-east have strict developer guidelines to ensure that houses all maintain a similar facade and are in keeping with the developer’s vision. There is also a shift towards sustainable homes, with most new developments having energy saving requirements as an essential component of the build, such as gas boosted solar and recycled water connections.
There has been an increase in buyers purchasing house and land packages with large reputable building companies where they can alter the house design to their particular needs. Such examples include deleting living rooms in favour of extra bedrooms or bathrooms, particularly when multiple generations are living under the one roof. Home
offices are also becoming more common as the pressure on the transport system has increased commuting time for many workers and employers have embraced work from home strategies.
Due to such a sharp increase in housing supply in the last decade in the outer south-east, there has been an increased need for public transport, as there is still a lack of industry or business activity centres in the Casey and Cardinia area, although council is actively trying to change this. More established areas still attract higher prices, largely due to proximity to town centres and beaches. Homeowners in this area are increasingly choosing to subdivide their large lots, knowing that supply is limited in established regions such as the Mornington Peninsula.
Inner and Outer WestThe outer western region continues to grow steadily like much of the Melbourne metropolitan area, with significant pressure from population increases driving up demand for housing. The landscapes of now established suburbs such as Truganina and Tarneit have transformed over the decades to fill the appetite for available land, with a number of new housing estates popping up. There are still some remnants of the industrial past of Truganina and Laverton, with a renewed focus from developers on creating residential areas that promote lifestyle living.
Month in ReviewAugust 2018
Res
iden
tial

37
Traditionally the outer west has lagged behind the inner established suburbs for capital growth, with a greater supply of land compressing prices somewhat. This gap has begun to shrink with annual growth in capital values in Williams Landing over the previous five years at 10%.
(Source: Realestate.com.au)
This compares favourably with the growth of 10.3% experienced in the established inner suburb of Footscray over the same period.
(Source: Realestate.com.au)
The main challenge now for the outer western market is to adapt to the increasing concerns over housing affordability. Developers and local government have responded to the issue with an increased focused on density around activity centres and existing transport hubs such as Williams Landing. Recent apartment developments including Newtown, Oxford and the sold out Cedar Woods Lancaster have created living options within close proximity to public transport networks. A 2-bedroom unit in the Cedar Woods development will set you back $415,000.
The push to increase access to transport has been supported by the State and Federal government with plans to build two new train stations at Davis Road in Tarneit West and Wyndham Vale, as part of the Regional Rail Link project. The existing Tarneit railway station is the second busiest in Melbourne behind Southern Cross, highlighting the immense pressure being placed on existing networks from the increase in residents in the outer west region.
Estate developers have also responded to the issue of affordability by offering smaller lots on less than 400 square metres and attached townhouse dwellings. The change in composition of housing types resembles the inner suburbs more closely than previously.
The inner west of Melbourne has seen dramatic change over the past 50 years from its industrial and working class roots of the past. Many of the region’s suburbs within five to ten kilometres of the city have become desirable places to live for many young families and professionals.
Scoring a 4-bedroom weatherboard home in Yarraville for $180,000 in 1996 wouldn’t have seemed so special all those years ago, but you’d be hard pressed to find a decently sized block under the $1 million mark today. The number of buyers for areas in and around social hubs such as Footscray, Seddon, Newport and Williamstown has driven up capital values over the decades. The community feel and aspects outside of the physical house have been attractive to buyers.
(Source: Google.com)
Month in ReviewAugust 2018
Res
iden
tial

38
Connections to the heritage of the area such as the reactivation of the Sun Theatre in Yarraville are attractive to prospective purchasers of residential real estate.
The premium for available space has seen a response from developers and planners to increase density in the inner west region. Newly fitted out 2-bedroom units in the established Seddon area range from $800,000 to upwards of $1 million.
Further afield, the apartment market has hit the suburb of Moonee Ponds, with developments including Rise and Oro offering modern dwellings. The changes in the landscape signify the push to more dense living spaces, a far cry from the dispersed nature of much of the inner west region many decades ago.
Inner and Outer NorthThe property market continues to be heavily influenced within the inner and outer northern suburbs. Significant net immigration in the outer northern areas such as Craigieburn, Mickleham and Kalkallo has led to lower vacancy rates and properties being listed on the market for much shorter periods. This has ultimately led to increased value and rental returns for property in the outer north. The inner northern property market is heavily restricted by the availability of credit from main financial institutions. Twelve months ago there was
more money available for purchase leading to an increase in numbers of properties being purchased and sold, but in 2018 this has not been the case and has led to an overall squeeze on property value.
The housing mix in outer north areas such as Wollert, Diggers Rest and Mernda has increased the amount of smaller sized attached townhouses compared to larger living detached dwellings. The primary focus point of this change is to complement the transport and shopping centre hubs which derive the main source of value in the outer northern areas.
The Melbourne City Council (MCC) has led a sustainable initiative for units in the inner northern suburbs of Collingwood, Brunswick and Carlton. The main focus point is to increase the number of units and apartments by making car spaces obsolete to encourage walking and bike riding. The higher rate of units compared to townhouses in the inner suburbs derives from units proving to have superior floor plans, more access to natural light and caters well for the increasing number of downsizers within Melbourne.
Fifty years ago the housing property was abundant with late post war and rendered triple fronted styled dwellings. Properties located in Balwyn and Bundoora in 1970 would have been worth $34,000 and $33,750 respectively compared to the current price tag of $2.386 million and $750,500. The
property market has expanded massively since 1968 which opens up discussion of just how much more the property market can possibly increase before it plateaus or declines.
(Source: Heritage Council of Victoria, July 2018)
Eastern SuburbsTaking a trip down memory lane 50 years ago, one of our Senior Valuers was able to share that he bought his first home in Lilydale for $31,000 in 1976. He was required to pay a $10,000 deposit and secure a home loan for $20,000. Fast forward to today and the
Month in ReviewAugust 2018
Res
iden
tial

39
median price for a 3-bedroom, 1-bathroom house on an 840 square metre block is about $720,000.
In 1972, a humble 3-bedroom, 1-bathroom double brick house in North Balwyn sold for $23,500. At that same time, houses in Doncaster were about $10,000. Today’s median price for a 3-bedroom house in North Balwyn is $1.795 million and $1.35 million in Doncaster (source: realestate.com, July 2018).
In the 1960s, Blackburn and Nunawading saw a housing boom, where houses replaced orchards. The City of Nunawading Civic Centre opened in 1968, which combined with the City of Box Hill to form the City of Whitehorse in 1994 (Whitehorse City Council, July 2018). In the 1970s, property value was approximately 2.5 to three times the average salary for a single income earner. Today a household would generally have two sources of income and the property value is seven to eight or more times the combined salary.
In the eastern suburbs, a 1970 family home was about 90 to 100 square metres, 3-bedrooms, 1-bathroom, a back yard for the kids to run around and a hills hoist clothes line on a 600 square metre block. Typically now in these popular suburbs, 600 to 800 square metre blocks are being subdivided to accommodate two or three new townhouses that are approximately 200 to 250 square metres of living area plus an alfresco.
48 Trentwood Ave, Balwyn North – 2 townhouses side by side (Source: Domain, July 2018)
The other end of the spectrum is to build a big modern 400 square metre plus home with five bedrooms all with walk in robes and en suites, theatre room, alfresco and swimming pool.
SummaryThe increasing population remains the driving force behind many of the changes seen over the past half century. To accommodate this, the housing market has had to adapt with developing what was once farmland into residential estates, increasing the height of high rise apartments and building low rise apartments and townhouses on the city fringe. Well established suburbs with limited available land have seen an increase in subdivision, with battle-axe blocks becoming increasingly common as home owners look to cash in on the value of land.
Sustainability has also been a key focus of the 21st century with many run down industrial areas being transformed into bustling residential hubs, whilst still maintaining the industrial feel of the town’s roots. Lifestyle changes have also been a contributing factor, with people wanting to be closer to social hubs and within easy access to public transport. This has put pressure on the state’s infrastructure, leading the state government and local councils to push for an increase in public transport and community facilities.
The low interest rate environment has encouraged many first home buyers to enter the market.
Month in ReviewAugust 2018
Res
iden
tial
49 Buchanan Avenue, Balwyn North - French Provincial 5-bedrooms, 4-bathroom (Source: Domain, July 2018)

40
As the banks begin to tighten restrictions on lending, the market looks to remain steady in the short term, although the supposed interest rate increases could change this in the foreseeable future.
MilduraMildura in 1968 was obviously much smaller than today and at the time had an economy which was very reliant on the surrounding patchwork of small dried fruit properties. We know that people lived in smaller houses than are commonly built now and that families rarely owned more than one car. There were no TV shows about doing house renovations and there were fewer real estate agents (and valuers!).
New homes constructed around that time were mostly around 10 to 12 squares in size (metric measurements still hadn’t been thought of), with only one bathroom and generally constructed with either conite or cement sheet cladding. There are some examples of brick homes built in the late 1960s, but these were the minority. Timber floors were the only option. Concrete slab flooring would not be widely adopted for another ten years.
While these houses lacked architectural flair, home builders at the time realised the importance of eaves in aiding energy efficiency and also knew to orientate houses in a north facing direction. In many ways some of the 1960s housing was more suited to our hot summers than what we see being built today.
Houses from this era currently sell for between $160,000 and $200,000 in some of the lesser areas of Mildura and for between $225,000 and $275,000 in the better locations.
While our records don’t stretch back to the late 1960s, a bit of research reveals that a 3-bedroom house at 23 Floral Avenue East sold in 1970 for $7,000, with the land component probably about $3,000. This house resold in 1979 for $29,000. One of our colleagues purchased a 1930s built weatherboard house in the nearby town of Red Cliffs in 1967 for $12,000, which was subsequently sold in 1999 for $81,000.
There were a number of residential unit complexes built in the late 1960s and most of these are still in existence. Most of these complexes are held by investors, although a few were subsequently converted to a strata title. They continue to enjoy good occupancy levels but are not as popular as newer townhouse style developments which have larger rear yard areas, larger living areas and usually undercover parking for two cars.
BallaratBallarat is a city with an old soul; it’s a city which in 1968 was already over 100 year old. By 1968 it had already seen a gold rush, a rebellion, a depression and two world wars. It was in the midst of ongoing angst about its involvement in Vietnam, but still excited that hotel closing hours had been extended.
From a property perspective the suburbs of Alfredton, Ballarat North, Sebastopol and Wendouree were the new kids on the block. I’m sure you could have witnessed spirited debate raging at Craig’s back bar that houses past the Arch of Victory, south of Hertford Street or north of Howitt Street were far too far from town and perhaps even that the new blocks would take a long time to sell. You may have been able to get a bottle of milk from Delacombe Town Centre at the time, but you may have had to BYO bottle, catch a cow and milk it.
Hindsight has proved both arguments false. These suburbs have since and continue to provide a bed, a bath and park and a place to call home for thousands of families.
Many things have however changed. The new areas of the city such as Lucas, Winter Valley and Delacombe still provide homes for families, however the lot sizes have fallen from an average of around 1,000 square metres to around 500 square metres.
The size of dwellings has also moved but in the opposite direction. An average size new dwelling is now around 200 square metres. This has increased from an average size of around 130 square metres. Most new dwellings now have two bathrooms, double garages and alfresco areas. In 1969 these features were considered absolute luxury and very few families had two cars to fill the double garage.
Month in ReviewAugust 2018
Res
iden
tial

41
There are two sections of the Ballarat property market which were almost non existent in 1968. One which is now exceedingly popular is the rural lifestyle market. In 1968, the vast majority of the population lived in town and those who did not lived on agricultural properties which were farmed by the family to earn a living. A hybrid of these two lifestyles has emerged over the past 20 to 30 years and is known as rural residential or rural lifestyle. These properties are typically five to 50 acres in size and are located on the fringes of the built up areas of Ballarat. The owners typically do not farm the land and work in town each day but enjoy the peace, views and space these properties afford. The popularity of this style of property has become such that some of the district’s highest valued properties fall into this category in areas such as Invermay and Buninyong.
Likewise in Ballarat in 1968, there were very few units, townhouses or apartments. This was due to the ample amount of space in the area for people to come and set up a life. There were a couple of unit complexes in the inner CBD area which were built at the time and these were often used as accommodation for hospital staff, religious orders or short term hotel style accommodation. It would be false to say the multi level apartment market has exploded in Ballarat in the ensuing decades. There have been some new developments which have met various levels of triumph and disaster, however in
general, in comparison to similar sized cities such as Bendigo and Geelong, Ballarat has conspicuously less multi level unit developments. We consider this is for the same reason they were not built in 1968; the residents of Ballarat regard space highly and seek it above many other factors in making purchasing decisions. As the city continues to grow and become a satellite city of Melbourne we would be surprised if the supply and demand in this market does not increase dramatically.
Bass Coast ShireThe major change over the years for detached housing on Phillip Island is the decreasing lot size within new subdivisions . In the past, the average lot size ranged between 650 and 750 square metres however in comparison we are seeing the average lot size in new subdivisions of around 500 to 550 square metres with lots as small as 300 square metres. In terms of construction, dwellings are being built to maximize the building envelope with less focus on yard size in some areas, particularly in the coastal areas due to the market appealing to the holiday and investor market.
In terms of construction material used in new dwellings, less homes comprise brick construction compared to 50 years ago with many new constructions comprising a mix of brick veneer and light weight composite or imitation weatherboard cladding .
Month in ReviewAugust 2018
Res
iden
tial

42
BrisbaneWe may be Australia’s third largest city but by many measures, we are a young capital whose evolution into a modern, vibrant centre has only been a few decades in the making.
One of the great advantages of this slower growth path is that, unlike Sydney, we have an abundance of options when it comes to real estate. There are huge tracts of developable land within a short commute of the CBD. These areas are ripe for major, multi-stage community development.
In addition, we have natural features that can fire the imagination of designers and home owners alike - hills with views and a winding river with frontage, not to mention enviable coast lines, clean air and a reasonably uneventful rush hour.
As such, watching the way our city has adapted to modern living over the past decade in particular has been interesting and provides a great example of what contemporary Australia should look like.
Another great advantage for Brisbane is that we remain the frontrunner in capital city affordability. Bigger blocks for less money means more square metres of blank canvas on which to create wonderful housing designs.
And our immediate future continues to look bright as we see an increasing number of interstate migrants
look to take up residence and start cheering for the Maroons come State of Origin.
So, what are the interesting elements of housing design in 2018?
In detached abodes, we continue to love a fusion of the old and new.
Renovations in the inner city like to take advantage of already established old school features that have served us well in the past. Our original Queenslanders are both stunning and functional. Most renovations don’t look to bastardise the design, but rather adopt their advantages and highlight their beauty. If more living space is required, a modern extension is added to the already classic home.
And they’re not being done by half measures either. High-end architects are partnering with well-regarded builders to create their own interpretation of timber and tin using unusual angles, large voids, oversized windows and high-level finishes and fittings on the extensions that complement these grand old dames.
Another evolution in general design we’re seeing is the growth in multi-generational living. Kids are staying home longer as they transition from school to work or university and then look to save for their own home deposit (or overseas adventure). Add to that the ageing population which is resulting in older
family members requiring assistance. All this means that mum, dad, kids and grandparents are ending up in the same space.
Multi-generational construction means diverse living spaces. The kids need their own chill-out zone, study areas and bathrooms, so new constructions over two or more levels will allow for this.
Grandparents require assisted independence with many opting for a contemporary granny flat construction on some of the larger suburban blocks. These constructions are a far cry from the kit homes of yore. Granny flats now are splendid builds with open plan living, balconies and expansive bedrooms all laid out to take advantage of natural light and easy access.
Month in ReviewAugust 2018
Res
iden
tial
Queensland
2018 South East Queensland Property Overview Breakfast
Register your interest here.Guest speaker Hon Peter Costello ACThursday 1 November 2018Tickets on sale soon
For further information, contact Catherine [email protected] or 07 3353 7500

43
In terms of vacant land, we’re seeing new developments adopt smaller blocks to help improve affordability for buyers. The Brisbane of 1968 could never have imagined allotments positioned 20 kilometres from the CBD under 400 square metres in area. And imagine the reaction to infill style projects in inner city suburbs yielding some sites as small as 150 square metres – that’s just over half the size of a tennis court!
The key to making these work is, of course, clever house design incorporating zero-lot lines and internal, tiny courtyards. Open plan living is a must too and if you can have higher than usual ceilings this will help create a sense of space as well.
Another change underway for us Brisbanites is the adoption of long-term unit living. Apartments are no longer just for those looking for a compact and affordable way to be close to town. We now find a mix of younger folk, business professionals and retirees all taking advantage of apartment living.
This has led to the vertical village concept where unit towers will include some cool lifestyle retail at ground level along with excellent residents’ facilities. Examples around town include projects such as Oxley + Stirling which has created a residents’ rooftop club comprising lap and plunge pools, reflection ponds, terraced seating, alfresco and barbeque areas, private dining area with kitchen facilities, day beds
and sun lounges, commercial grade gym, private cinema theatre and library area.
We’re even aware of a residents’ club at Lucent in Newstead which includes a 55-metre rooftop Olympic sized infinity edge pool with underwater speakers. This development has the typical gym and sauna, however also features a private dining room and golf simulator.
Stepping beyond housing types and another way our city has evolved is through town planning. We’ve seen council step up its approach to village nodes which are helping to decentralise our population. A great example is the transport hub at Chermside. Council re-designated areas around the shopping centre to allow for high-rise living and residents are taking advantage of the nearby retail facilities and transport options.
You can see we’re a city on the grow and we’ve come a long way in 50 years.
Back in 1968, the city fringe was a very different offering.
Suburbs such as Aspley, just ten kilometres north of the CBD, had new subdivisions springing up with good sized blocks of land priced at around $8,000. In 2018, that same block of land is likely to cost closer to $500,000.
In fact, the ten kilometre band is probably a reliable measure marking most of the new development around 1968.
To the west of Brisbane, 1960s housing was well established in suburbs such as The Gap where a long trek along the dirt track of Waterworks Road wouldn’t have been for the faint hearted. There was also the question of utilities. The thunderbox outhouse continued to be in use in these areas in the 1960s – in fact it was up to Clem Jones, Brisbane’s Lord Mayor from 1961 to 1975, to make sure sewerage was available to the suburbs which are now considered inner to middle ring.
Head south and you’ll find some fine examples of 1960s housing in Moorooka, including some of the classic lowset brick veneer dwellings that are so solid, a wrecking ball can barely dent them.
Housing remained a timber and tin affair for the
Month in ReviewAugust 2018
Res
iden
tial
Lucent’s in Newstead which includes a 55-metre rooftop Olympic sized infinity edge pool. (Source: realestate.com, July 2018)

44
most part. The 1960s was also the era of the narrow chamferboard homes and elements of mid-century modern design came to the fore. Big walls of windows to capture natural light and take in the views were just the thing.
We’ve seen plenty of change over the past 50 years and we’re pretty excited to see what the next 50 will bring to our once big country town in the great south-east.
Happy birthday Herron Todd White!
Gold CoastAs we look back over the past 50 years on the Gold Coast there is definitely a cultural shift throughout
the housing types and evolution of the area towards lifestyle. Whether it is beachfront, boating, suburban or the hinterland, everyone is catered for with a vast array of housing options across the region.
It wasn’t uncommon 50 years ago to look up the coastline of the Gold Coast and not see a highrise near the ocean until Surfers Paradise. As the Gold Coast became more than a holiday destination, property also started to become a lifestyle choice. Development close to the coastline included unit development, canal estates, and suburbia.
In 1978, you could buy this quaint shack for $103,000. With not much more than a paint and a new kitchen, it recently sold in October 2017 for $5 million. Don’t we all wish we’d had the foresight to buy on the beach!
Beachfront cottages have evolved over the past 40 years from small 3-bedroom, 1-bathroom fibro shacks to prestige quality, two level, 4- or 5-bedroom, 3-bathroom homes with all the latest technology and highest quality fixtures. The architectural style of these luxurious homes has also evolved. Mermaid Beach cottages have been replaced with large, rendered homes and in more recent years, the Hamptons and beach style has emerged as the preferred style.
Beachside of the Gold Coast Highway is very strong at the moment and has outpriced the majority of the market. This has resulted in an increase in value for those properties just west of the Gold Coast Highway, especially in suburbs further south including Palm Beach, Tugun, Coolangatta and in to northern New South Wales.
Moving away from the beachside suburbs, there are a number of smaller hubs being created around main shopping facilities and services. Access from
Month in ReviewAugust 2018
Res
iden
tial
Looking north from Magic Mountain Hill, Miami circa 1979 and circa 2016 Mermaid beach shack (Source: Ray White Mermaid Beach)
Mermaid Beach (Source: Ray White Mermaid Beach)
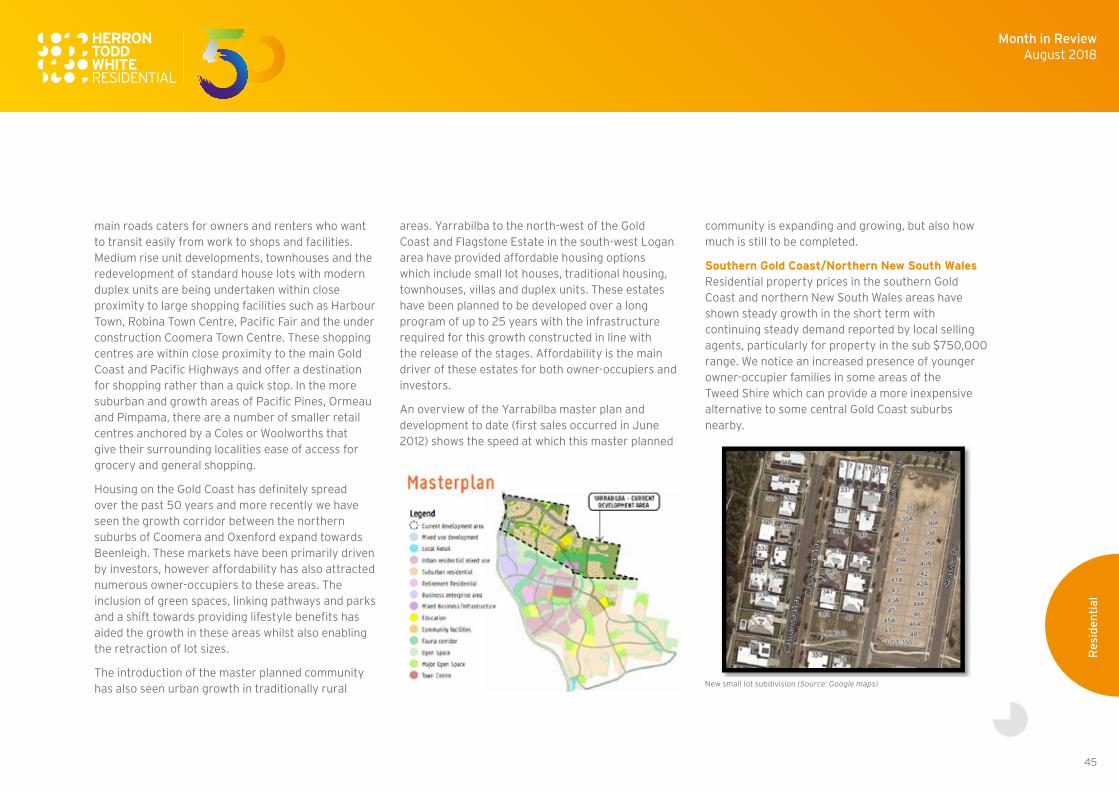
45
main roads caters for owners and renters who want to transit easily from work to shops and facilities. Medium rise unit developments, townhouses and the redevelopment of standard house lots with modern duplex units are being undertaken within close proximity to large shopping facilities such as Harbour Town, Robina Town Centre, Pacific Fair and the under construction Coomera Town Centre. These shopping centres are within close proximity to the main Gold Coast and Pacific Highways and offer a destination for shopping rather than a quick stop. In the more suburban and growth areas of Pacific Pines, Ormeau and Pimpama, there are a number of smaller retail centres anchored by a Coles or Woolworths that give their surrounding localities ease of access for grocery and general shopping.
Housing on the Gold Coast has definitely spread over the past 50 years and more recently we have seen the growth corridor between the northern suburbs of Coomera and Oxenford expand towards Beenleigh. These markets have been primarily driven by investors, however affordability has also attracted numerous owner-occupiers to these areas. The inclusion of green spaces, linking pathways and parks and a shift towards providing lifestyle benefits has aided the growth in these areas whilst also enabling the retraction of lot sizes.
The introduction of the master planned community has also seen urban growth in traditionally rural
areas. Yarrabilba to the north-west of the Gold Coast and Flagstone Estate in the south-west Logan area have provided affordable housing options which include small lot houses, traditional housing, townhouses, villas and duplex units. These estates have been planned to be developed over a long program of up to 25 years with the infrastructure required for this growth constructed in line with the release of the stages. Affordability is the main driver of these estates for both owner-occupiers and investors.
An overview of the Yarrabilba master plan and development to date (first sales occurred in June 2012) shows the speed at which this master planned
community is expanding and growing, but also how much is still to be completed.
Southern Gold Coast/Northern New South WalesResidential property prices in the southern Gold Coast and northern New South Wales areas have shown steady growth in the short term with continuing steady demand reported by local selling agents, particularly for property in the sub $750,000 range. We notice an increased presence of younger owner-occupier families in some areas of the Tweed Shire which can provide a more inexpensive alternative to some central Gold Coast suburbs nearby.
Month in ReviewAugust 2018
Res
iden
tial
New small lot subdivision (Source: Google maps)

46
As a result, we are seeing a trend for smaller, more affordable allotment sizes in newer developments in the area and an increase in medium density subdivisions. The above photo indicates the preference for small lot housing compared to the traditional (albeit smaller than the quarter acre blocks) that were being subdivided in some of the newer estates. We notice a cultural shift towards unit living, particularly in areas of the southern Gold Coast and an increase in transit oriented developments and the future extension of the light rail to Coolangatta. Ease of access to the workplace combined with lifestyle balance has been a main driver for the northern New South Wales location being within close proximity to the beach and having good road infrastructure for commuting.
Tweed Rental Market – Focus on MurwillumbahThe lack of rental accommodation in the Tweed region has been a real issue for some time now, however was exacerbated after the March and April 2017 Cyclone Debbie flooding hit the region severely. Many people became displaced and many sought temporary accommodation until the flood damage to their homes was repaired or sought new permanent rental accommodation. This put more pressure on the rental market and rents soared.
Murwillumbah and surrounding areas have had a few affordable housing options constructed over the past few years such as Horizon Housing in the
Hundred Hills Estate and a couple of new townhouse and villa complexes. However, there have recently been some changes with the type of development applications with a few large unit complexes in Murwillumbah obtaining approval or in the process of being approved. This includes a proposal for a 72 unit complex with a mix of social and affordable housing at 26 George Street, Murwillumbah, mainly consisting of 1-bedroom units. The Precinct at Church Lane, Murwillumbah will comprise 26 2-bedroom units and the construction program should commence in the short term. There is also a current approved development application at 28-34 Riverview Street, Murwillumbah for 28 units with a mix of 3-, 2- and 1-bedroom units. All three sites are located within close proximity of Murwillumbah town centre.
Traditionally the Murwillumbah area has not favoured units, so it will be interesting to see how well these developments do and how this will affect the rental market over the long term. Will this attract more investors to an area that is traditionally owner-occupied? This is a wait and see scenario as the area evolves with higher density accommodation options.
Murwillumbah is a classic example of how the times have changed over the years, from the dwellings built in the early 1900s to the 1960s being within close proximity to town and comprising mainly timber construction. The further you go out, the more you will see the dwellings of the 1970s to the
current times being of brick construction. As you venture further from town to the fringe locations, the housing becomes more modern, larger in living area size and lifestyle is the precursor for design. The newer housing is very popular, however older dwellings close to town that are well maintained and kept plenty of their original features are also popular with buyers.
Sunshine CoastThe Sunshine Coast is considered to be relatively young when compared to other areas and especially when compared to capital cities and the historical townships of Queensland such as Toowoomba and Maryborough. The area was first settled in the 19th century with development progressing slowly until tourism became an important industry around the 1950s and 1960s. Since 1988, Herron Todd White Sunshine Coast has had the pleasure of witnessing the ever changing landscape as it progressed.
Years ago, the Sunshine Coast was a much more relaxed place. When looking at the changing building styles that have evolved over the years, we can see the influences that the faster paced lifestyle is having on property.
The oldest areas of the Sunshine Coast are the railway and hinterland townships located about 15 to 20 minutes from the coastline. The main reason why they were first settled is because of the access
Month in ReviewAugust 2018
Res
iden
tial

47
provided by the railway line heading north up the Queensland coast. Dwellings typically comprised of pre and post war homes, typically of timber construction which then evolved into the 1950s and 1960s fibro housing that many of us have seen around the country. The 1970s and 1980s gave rise to clay brick dwellings. These hinterland townships were mostly modest working class centres and dwellings reflected this. It wasn’t until the early 1990s that we stated to see larger, more expensive dwellings of higher quality.
The coastal areas of Caloundra, Maroochydore and Noosa Heads came to prevalence in the 1950s and 1960s. The rise of the holiday house or beach shack saw the Sunshine Coast grow into a favoured holiday destination. These homes were typically of fibro construction. They were modest but they absolutely served their purpose. Mirroring the railway townships, the 1970s and 1980s saw the rise of clay brick dwellings, however given that access to the coastline had improved greatly, more expansive dwellings were popping up well before they did in the railway and hinterland townships.
Throughout the 2000s, houses have definitely evolved into more contemporary designs with the use of architectural materials (lightweight cladding) and design features. Over recent years the rise of small lot housing has grown significantly to help the affordability issues surrounding home ownership.
Also multi occupancy properties have become increasingly popular for extended families.
The unit market has seen a significant evolution as well. Complexes throughout the 1970s were of a low rise or walk up nature up to say three levels. These were typically modest in nature and once again were catering for the holiday market. Throughout the 1980s and into the 1990s, low rise unit complexes transformed into medium and high rise unit product providing all the services and amenities that you would find in a capital city and in some cases provided a permanent living alternative to a house. This continued throughout the 2000s with unit complexes providing high quality accommodation and significant amenities.
As you can see, the Sunshine Coast provides a diverse range of property types that caters for everyone. Whilst styles change, one thing remains constant - the Sunshine Coast is a great place to live.
ToowoombaDetached housing on small lots is growing in popularity throughout the Toowoomba area, particularly in the older areas close to the CBD. Many infill blocks have been sub-divided into smaller lots or have had unit complexes built on them.
Key development areas including the suburbs of Glenvale, Cotswold Hills, Torrington, Kleinton, Highfields, Cambooya and Westbrook are also seeing
a concentration of small lots which could result in an oversupply of product as infrastructure projects come to a close and workers vacate.
This small lot product is still meeting some local market resistance with buyers often represented by absentee investors buying house and land packages.
The unit market has seen low sales volumes following the oversupply of unit product that became apparent throughout 2016. Land sale volumes steadily increased in the three years between 2012 and 2015, peaking at 1,063 sales in 2015. In 2016, 681 sales were recorded and 677 in 2017 suggesting a cultural shift towards unit living in the Toowoomba region.
The Toowoomba region has experienced strong and steady economic growth with an annual average increase of over 3% in the past decade. To cater for this growth, major infrastructure projects have recently been completed or are underway, including the Toowoomba Second Range Crossing, QIC’s Grand Central Shopping Centre extension and Brisbane Wellcamp airport. Also in the pipeline benefiting the Toowoomba area will be the imminent Inland Rail Project.
Looking back, Centenary Heights, Rangeville, South Toowoomba and parts of Harristown would have been considered new suburbs in 1968, with the development of brick veneer homes featuring aluminium window frames and flooring being the
Month in ReviewAugust 2018
Res
iden
tial

48
most popular housing construction. Most homes of the era featured 3- or 4-bedrooms, 1-bathroom, one living area and single garages. These homes are now popular with first home buyers as they provide relatively affordable price points, say $300,000 to $400,000 and renovation potential.
By comparison, newly built dwellings in suburbs including Kearneys Spring, Middle Ridge and Glenvale feature 4-bedrooms, 2-bathrooms, two living areas and two car attached garages. New homes in these suburbs can be purchased in the $475,000 to $650,000 range.
Toowoomba is now the second largest inland city in Australia and has emerged as one of the most dynamic regional cities in the country in recent years. The property market has been driven by sound economic and population growth which has provided a blend of opportunity and stability. Combined with recent infrastructure and lifestyle enhancements, Toowoomba has cemented its position as the capital of the Darling Downs and south-west Queensland.
CairnsCairns 50 years ago was a mere shadow of the city that it is today. Back in 1968, Cairns had a population of somewhere around the 30,000 mark, no high rises, no units to speak of and absolutely no traffic lights. It was very much a regional frontier city, at
the very end of the Bruce Highway from Brisbane. Although the highway had been sealed since 1962, in those days it was still subject to frequent interruptions and closures, especially during the wet season.
Cairns since 1968 has expanded considerably in both area and population, with one of Australia’s highest population growth rates. Former satellite towns such as Edmonton and Gordonvale have now been engulfed into suburbia with Cairns now supporting a more than five-fold increase to a population of base of just over 160,000 today. In addition or in response to commensurately higher levels of urban infrastructure and services, housing styles have also changed considerably over the period.
The standard Cairns housing of the 1960s was a Queenslander style timber dwelling, raised on stilts for ventilation purposes and vulnerable to extreme weather events such as cyclones. Now aided also by the advent of air conditioning, the standard house is a slab on ground, rendered masonry block home, with considerably greater amenity and improved cyclone resistance. Land sizes have shrunk from typically 1,000 square metre blocks in 1968 to an average new block size of around 600 square metres in the current market. Units and apartments have burst onto the scene, from almost nothing in 1968, to now account for around 28% of the total Cairns housing supply. Apartment development initially
took place in near-city suburbs, before gravitating to also encompass the northern beaches and only over the past twenty years, the Cairns CBD. Apartment developments have also experienced a considerable change of emphasis, from basic residential six packs in the early stages to higher quality resort style and high rise apartments with greater liveability in more recent times.
In terms of prices, the Cairns median house price was somewhere around the $8,000 mark in 1968, compared to a median house price of over $400,000 today. In other words, there has been a more than 50-fold increase over the 50 years.
TownsvilleThe face of residential property in Townsville has evolved over the past 50 years and will continue to evolve as new innovative designs, lifestyle changes and trend issues present to the market.
Construction in the 1970s was dominated by high set timber framed dwellings on traditional sized lots, typically within the suburbs eight to ten kilometres from the city centre.
The 1980s saw a shift to low set masonry block construction possibly due to cost of construction and changed consumer wants and needs. This style of home was typically 3-bedrooms,1-bathroom with single garage or carports on about 800 square metres. During this period multi unit development
Month in ReviewAugust 2018
Res
iden
tial

49
consisted of mostly smaller size masonry block complexes offering basic levels of on site amenity.
The 1990s saw the emergence of a number of new residential land estates within the eight to ten kilometre radius of the city centre with an expansion in house size and design taking off towards late 1990. This entailed larger slab on ground homes typically of 4-bedrooms, 2-bathrooms with double lock-up car accommodation. The late 1990s saw an increase in unit density, with overall amenity of new unit construction offering owner-occupiers an alternative to detached house living.
The early 2000s had rapid growth in new home construction along with a shift in lot size. There was a push for more low maintenance lot sizes within newer estates which offered good levels of amenity to counteract this reducing lot size. Average lot sizes over this decade reduced from 704 to 620 square metres. The unit market also expanded rapidly with new unit construction and benchmarks being set with regards to amenity and levels of fitout being offered.
Over the past ten years, our market has become more affordability driven on the back of a significantly slower market. In particular, the past four years has seen a decrease in land sales to low levels. Small lot estates have emerged and housing size has decreased to cater for affordability concerns
along with more innovative designs to factor in technological and environmental changes. The unit market has also seen a reduction in unit size as the target market shifts to cater for mostly investors and meeting a price point. Over recent years, new unit construction has almost ground to a halt due to continued high holding costs, low levels of investor demand and a general low market sentiment.
As advances in technology, energy efficiencies and lifestyle trends continue to change, further evolution in our housing design will likely follow.
Rockhampton and GladstoneBoth the Rockhampton and Gladstone regions have seen similar trends with regard to housing design and planning changes to address a variety of issues which have influenced the market place.
Looking back to 1968 when Herron Todd White was founded in Rockhampton, new housing of the era looked very different to the new homes of today. For example, a new home in 1968 was a highset chamferboard home, typically around 100 square metres of living area with 3-bedroom, 1-bathroom living accommodation and car accommodation available under the dwelling. 600 square metre allotments were the norm. Areas of Frenchville and Park Avenue were the new suburbs of the time for Rockhampton. Gladstone had evolved to areas on the fringe of the CBD such as Barney Point.
This month’s topic prompted me to delve into some family history. My parents bought their first house in Wandal in 1971 (not quite 50 years ago) for $7,800. Their combined family income was in the order of about $4,000 per year. My grandfather’s commission as a real estate agent was in the order of $150 on a $3,000 home (Mum and Dad’s second house two years later). These were however, not new homes. A brand new home as described above in Frenchville was an option they considered at the time, however it was priced at $10,000 and considered unaffordable. Data shows the median house price for Rockhampton today is $275,000. What a difference 50 years makes!
Over the time Herron Todd White has been working in these areas, the modern home has certainly changed. Buyers’ requirements have changed from a humble 3-bedroom home to much more spacious homes accommodating all members of the family with space. 4-bedrooms, 2-bathrooms and often a minimum of two living areas (150 square metres plus) is now a typical new home. Car accommodation has also become much more sophisticated with family dynamics changing over the past 50 years from one car to now two car families (at a minimum), so 2018 sees double lock up garages expected.
Whilst owner-occupiers are looking for larger homes than they were 50 years ago, the investor market is going the other way, targeting maximisation of their
Month in ReviewAugust 2018
Res
iden
tial

50
estates by reducing lot sizes to 400 to 500 square metres and living areas accordingly.
Design of the internal layout is always changing, with a strong preference towards open plan living areas rather than having a kitchen tucked away in a corner out of view. Materials have also changed from the chamferboard or fibro of the 1960s to a preference for brick as a result of the lower maintenance. Some ultra-modern and prestige homes are adopting the use of lightweight cladding materials which is a happy medium between the appeals of a well presented timber home with less maintenance than the 1960s materials.
Modern housing estates are now often master planned to provide a point of difference and overall sense of functionality and convenience. 1968 would never have seen such a concept, with estates relying on existing facilities such as shopping and medical centres.
Strata titled units (as opposed to flats) were essentially non-existent 50 years ago regionally. This market sector is probably the one that has experienced the most evolution over the years. There is now a market developing in Rockhampton for modern units in the CBD to cater to young professionals seeking low maintenance and convenience factors as well as empty nesters. This has really only come about in the past ten years.
From a town planning perspective, Gladstone has seen the implementation of small lot estates such as Hill Close and Tannum Blue which were developed during a period of rapid growth of both population and capital values, making affordability a key focus within these areas which were both major challenges of the real estate market at the time.
Whilst the new suburbs of 1968 are still well regarded today and the style of home remains mostly functional (the sub floor height seems impractical at times), the buyer profile has altered somewhat from what would have been well off owner-occupiers to now be a solid investor area mixed in with first home buyers.
These design changes have addressed the issues arising in the real estate market over the years by way of natural progression to cater for population growth, changes to personal wealth and evolution of new building products coming to the market.
Bundaberg 50 years ago, Bundaberg was a small sugar town community dominated by older style timber dwellings on larger sized allotments. Move forward into the 1980s and the town started to grow with the construction housing type at the time comprising lowset and highset 3-bedroom hardiplank and brick homes. Moving into the 1990s, larger homes of mostly brick veneer were being constructed. In the
current decade, homes are large and most have a second bathroom, media room and accessible shed in the back yard. Construction type has started to incorporate lightweight, easy to handle cladding. The majority of homes are still lowset with allotment sizes getting bigger for families wanting a tree change and room for their growing families.
MackayIn the 50th year of Herron Todd White, we look back at the changes that have occurred in housing in Mackay over that period. The scary part is that 50 years ago is only 1968!!
Housing in Mackay was traditionally made up of highset and lowset timber clad Queenslanders on larger allotments located in suburbs close to the CBD. In 1968 (or slightly before) we started to see a change in construction methods, with homes being clad with chamferboard and fibro cement sheeting, with internal linings comprising hardboard or gyprock and lower 2.4 metre ceiling heights. We also saw the advent of a Mackay staple, the butter box or highset fibro clad dwelling. In 1968, you could buy a fairly modern, lowset 3-bedroom dwelling in North Mackay for around $10,000.
Fast forward into the 1970s and 1980s and we started to see lowset brick and masonry block dwellings make an appearance across the city. New suburbs and estates were being constructed further from the
Month in ReviewAugust 2018
Res
iden
tial

51
CBD. As mining started to take an ever increasing role in the Mackay economy in the 1990s, we saw new estates in Andergrove, Beaconsfield and Rural View start to open up with larger onground brick dwellings the home of choice.
Into the 2000s, we saw another significant shift in housing in Mackay on the back of the surging resource industry. Rendered masonry dwellings become all the rage, often much larger dwellings comprising at least 4-bedrooms, 2-bathrooms, multiple living areas and larger car accommodation.
Hervey BayBack in the 1970s, Hervey Bay was transitioning from being a number of small coastal villages to one location known as Hervey Bay. It was a holiday or weekender location with residents in Maryborough catching the train to visit the beach for the weekend. The weekender home was constructed of fibro or timber and generally comprised 2- to 3-bedrooms with 1-bathroom. The 1980s through to 2000 saw the urban envelope extend south from Boat Harbour Drive and new residential estates were developed with onground brick homes occupied by predominantly permanent residents. Most homes still comprised 3-bedrooms and 1-bathroom. Since 2000, homes have become larger with 4-bedroom, 2-bathroom accommodation now the norm and lot sizes becoming smaller. Construction includes lightweight cladding and imitation products such
as Styrofoam and Weathertex. Some of the original weekender cottages remain, however these are slowly being renovated with modern fittings.
Emerald50 years ago, Emerald was a small railway town with timber home construction. Move forward into the 1970s and 1980s and the town started to grow with the construction of the third largest dam in Queensland and the beginning of coal mining. Housing types at the time comprised lowset and highset 3-bedroom hardiplank and fibro homes. Moving into the 1990s, larger homes of mostly brick veneer appeared. In the current decade, homes are large and most have a second bathroom, media room and accessible shed in the back yard. Construction type has changed to lightweight, easy to handle cladding and now in 2018, prefabricated steel frames that arrive on a truck and are erected in three days to lockup. Small lot sizes have been trialed in the Central Highlands region but are not popular in the market.
Month in ReviewAugust 2018
Res
iden
tial

52
AdelaideAdelaide, South Australia 1968: Steele Hall defeated Don Dunstan in the state election; the state population was 600,000; the average annual wage was $3,000 and the median house price was pushing towards $12,000. In 2018, the South Australian political, economic and social landscape is looking slightly different to that of 1968. In 2018, Steven Marshall defeated Jay Weatherill in the state election, the state population has tipped over 1.7 million, the average annual wage is $75,000 and the median house price is $470,000. In those 50 years, Adelaide has transformed itself from a big country town to a city continually rated as one of the most liveable in the world.
During the 1960s, housing remained traditional in suburban Adelaide. Single level brick dwellings with 3-bedrooms and 1-bathroom on quarter acre blocks were the norm. Strata units where prevalent during this period and offered a cheaper alternative to the dwelling market.
The dwelling market in 2018 is a stark contrast to 1968. In 2018, children stay at home longer and technology has allowed for decentralised work spaces giving the labour force the ability to work from home. This has caused a shift in housing design. The demand for additional space has given birth to the fourth bedroom, en suite, study and second living space.
The days of double brick construction and quarter acre blocks are long gone as builders and developers look for cheaper and more cost effective alternatives. Brick veneer has become the new norm for single level construction whilst lightweight composite cladding has become the material of choice for the suburban Adelaide townhouse boom.
With the hills to the east and coast to the west, suburban Adelaide has been forced to expand north to south. Former satellite suburbs of Sellicks Beach to the south and Munno Para to the north now form part of suburban Adelaide and stretch 80 kilometres apart. Town planning has been forced to change to counteract the continuing urban sprawl. There has been a push for the construction of higher density accommodation with suburban councils. Development constraints have been relaxed, allowing for high density development of parent allotments. Recent changes have allowed for allotments of 100 to 200 square metres which require two level townhouse style construction.
Examples of this new style of accommodation can be seen throughout suburban Adelaide. The Campbelltown Council north-east of the CBD has become one of the epicentres of this style of construction. In this location this type of product ranges in price from $400,000 to $650,000. Recent examples include 6A Day Avenue, Rostrevor achieving a price of $635,000 and 5/2 Avenida
Street, Campbelltown achieving a price of $443,000.
Many downsizers are reaping the rewards of the zoning changes as their traditional dwellings now have the added benefit of underlying development potential. In the later part of 2017, the Port Adelaide
Month in ReviewAugust 2018
Res
iden
tial
South Australia
6A Day Avenue Rostrevor (Source: www.realestate.com.au)
5/2 Avenida Street Campbelltown (Source: www.realestate.com.au)

53
Enfield Council north of the CBD implemented the Urban Renewal Zone with a focus on higher density development. Prior to this zoning taking effect, 54 Gladstone Avenue, Kilburn was sold for $415,000. This was a 3-bedroom, 1-bathroom dwelling on 975 square metres of land. The house was demolished and the property was offered to the market as a vacant allotment. In this time the zoning changed and the property was sold again in February 2018 for $515,000.
54 Gladstone Avenue Kilburn (Source: www.realestate.com.au)
The increase in community titled accommodation has seen the extinction of the cream brick strata unit in suburban Adelaide. Strata units remain popular with first home buyers and investors as they typically provide the lowest point of entry into the market.
The opposite is true for the Adelaide CBD as the construction and the sale of strata apartments has reached an all-time high. During the 1960s and 1970s, standard CBD apartments comprised complexes of up to five levels in height, no passenger lifts and basic common areas. With the rapid increase in construction of apartments, developers need to provide high quality common areas to stand out from the crowd. We are now seeing infinity pools, roof top terraces, gymnasiums, theatres and technology hubs in new complexes. CoreLogic data indicates that the CBD apartment market appeared to peak in late 2017 into early 2018 with the median price reaching a high of $500,000. The most recent data from April 2018 shows a slight decrease to a median of $495,000. An example of what can be purchased at this median price level is 1501/156 Wright Street, Adelaide which recently achieved a price of $528,000. This is a sixth floor apartment comprising 2-bedrooms, 1-bathroom and a secure car space. This apartment is situated in the recently constructed Bohem apartment complex.
From 1968 to 2018, the median house price grew close to 4000%. At that rate the median house price in 2068, 50 years from now equates to $19.27 million. My response to that is tell him he’s dreaming… but in 1968, they probably said the same thing.
Month in ReviewAugust 2018
Res
iden
tial
1501/156 Wright Street Adelaide (Source: www.realestate.com.au)

54
CanberraOver the past 50 years, the ACT residential market has changed significantly.
Imagine the year is 1968 – the suburbs of Dickson, Downer, Watson and Hackett are less than ten years old and the Belconnen suburbs of Aranda, Cook, Macquarie, Weetangera and Page have just finished construction. These suburbs are freshly built among the already established suburbs of Forrest, Yarralumla, Red Hill and Reid which are already 30 to 40 years old.
Between 1960 and 1975, the population in Canberra went from approximately 50,000 to 220,000 which resulted in a huge requirement for increased residential development. Canberra witnessed a residential boom during this time and Belconnen and the Woden Valley were developed to accommodate the population increase.
Dwelling construction was somewhat standard, with the classic red brick cottage being a stereotype for 1960s Canberra. The average land block size was around 800 square metres, with anything less than 600 square metres considered small. Block sizes have slowly gotten smaller and smaller, with most lots in new subdivisions averaging around 350 square metres and many under 200 square metres.
In 1968, the great Australian dream was alive and well with home ownership being achievable by
many middle class Australians. Fast forward to 2018 and many middle class Australians struggle to buy into the Canberra property market. The median Canberra house price in 1971 was $18,000 (the oldest record available), compared to over $700,000 in 2018, which is over 38 times more expensive than 47 years ago.
Month in ReviewAugust 2018
Res
iden
tial
Australian Capital Territory

55
DarwinThe Darwin of 1968 was a very different place to the Darwin that we see today. The official population in the 1966 census was about 21,000 although this number excluded the indigenous population, which was only included after the 1967 referendum (the 1972 census which included these numbers showed a population of about 36,000). The Greater Darwin area now boasts a population of about 130,000.
Despite the lessons of the 1937 cyclone, the urgent need for post-war housing meant that much of the construction was not of a standard to withstand cyclonic activity, which was to have tragic consequences years later. Nowadays building controls are strictly enforced with the result that Cyclone Marcus caused relatively little damage when it passed by Darwin earlier this year.
In 1968, the Northern Territory was still administered by the Commonwealth. Most of the urban land around Darwin was held under leasehold tenure. This year we are celebrating 40 years of self-government in the Northern Territory which brought in (amongst other things) freehold title to most of Darwin, giving landholders much greater certainty.
Fifty years ago, the urban areas of Darwin extended around the inner suburbs as well as some housing on the old World War II sites at Nightcliff. Areas such as Coconut Grove were still small farmlets and the land
resumptions for the new satellite city of Palmerston had not been considered.
Suburbs such as Fannie Bay and Parap were developed in the early 1960s. A 3-bedroom dwelling in Nightcliff was advertised for sale in the NT News in 1968 for $22,000; a large sum for those days but only a small fraction of its value today.
Month in ReviewAugust 2018
Res
iden
tial
Northern Territory

56
PerthPerth City experienced rapid growth throughout the late 1960s as a result of the commencement of iron ore mining in the Pilbara together with high interstate and overseas immigration. This led to unprecedented demand for housing and the expansion of urban corridors connecting Perth to the east and south-east associated with major industrial development and transportation routes at the time. The south-west corridor was emerging as a result of the creation of the Kwinana industrial area and the north-west corridor had not yet been created although there were some areas in the planning stages at the time. Although there was a peak in construction of residential flats and units during this period, the majority of residential construction comprised single level residences on larger lots and the outskirts of the Perth metropolitan area was generally 12 to 14 kilometres from the Perth GPO. According to a research paper completed by REIWA, the median house price in 1968 was $12,371.
Perth buyers have had a longstanding preference for owner-occupied, detached houses on larger lots with the use of private transport for access to activity centres, shopping centres and the Perth CBD. This preference has been significant in how the Perth metropolitan region has been planned and developed over the past 50 years.
Perth is currently ranked the fourth most populated capital city in Australia on a density per square kilometre basis however is one of the least populated developed cities in the world. As a result of population growth and lifestyle and housing preferences, Perth’s suburban expansion now extends circa 150 kilometres along the coast from Yanchep some 56 kilometres to the north and Dawesville some 90 kilometres to the south. In addition, the Perth metropolitan area has expanded significantly in the north-eastern and south-eastern corridors.
In August 2010, the West Australian Planning Commission released Directions 2031 and Beyond with the view to “creating a more compact and environmentally sustainable city by using land and infrastructure in an efficient manner”. Primary targets of the framework included:
1. “A 50 per cent improvement on current infill residential development trends of 30 and 35 per cent; and a target of 47 per cent or 154,000 of the required 328,000 dwellings as infill development” and
2. “A 50 per cent increase in the current average residential density 10 dwellings per gross urban zoned hectare”; and “has set a target of 15 dwellings per gross urban zoned hectare of land in new development areas”.
In response to the above, lot sizes in developing estates have continued to decrease in recent years with the Housing Industry Forecasting Group’s November 2017 publication stating the lowest ever recorded average lot size of 363 square metres. In addition, the WA Planning Commission issued a new draft position statement in March this year outlining its intentions for the minimum green title lot size to be reduced from 100 square metres to 80 square metres. Subsequent to this, Perth’s first micro lot housing project was announced in April for the north-eastern suburb of Ellenbrook.
Residential apartment construction has also increased significantly throughout the Perth metropolitan area in recent years with infill development around transport hubs encouraged by the government. Despite this, the push for urban infill in some well-established residential areas is proving to be a major hurdle with residents citing fears such as smaller lot sizes, increased noise and crime, decreased privacy, parking problems and decreases in property values.
Well planned urban infill, housing affordability (particularly for first home buyers) and public infrastructure are at the forefront of the city’s challenges in 2018.
Town Planning Scheme and Design guidelines continue to play massive roles in the cost of housing
Month in ReviewAugust 2018
Res
iden
tial
Western Australia

57
at present. Bushfire Attack Level, front elevation design, NatHERS environmental ratings and noise proofing requirements are also adding significant costs to project housing and yet have very little value add in most scenarios.
Furthermore, increasing specifications in new houses are continuing to keep upward cost pressure on construction as the market is continuing to decline in the newly established outer suburbs throughout the Perth metropolitan area.
Decreasing lot sizes have brought fresh design challenges and many builders and developers are challenging the norm by constructing new dwellings in alternative building materials to the traditional double brick which is still far and away the preferred construction method in Perth.
The below picture is a good example of recent experimentation by building companies, comprising non-traditional, single-level, semi-detached townhouses built with Hebel external walls, Colorbond roofing and plasterboard internal walls.
Another new style that is being tested in some of the recently established estates is the industrial two storey designs on 200 to 300 square metre lots. The New York / Brooklyn themed construction seen in the below pictures brings something quite unique to these new estates and has been relatively well received.
Brooklyn, NY Townhouse Design (Source: Express Two Storey Living)
Similarly, the flute design (pictured right) has been successful in the developing suburbs of Ellenbrook and Aveley offering affordable accommodation on a small lot.
Month in ReviewAugust 2018
Res
iden
tial
Hardieplank Construction (Source: Corelogic) “The Cube” - Flute Style Floor Plan (Source: New Choice Homes)

58
Despite the numerous challenges and reluctance for urban infill in some well located suburbs, there are several large-scale medium to high density development projects in the pipeline including plans for a total of 5,000 medium to high density homes in Bentley, Joondalup, Beaconsfield and Cannington. Also currently being developed is the Murdoch Health and Knowledge Precinct which will include residential components. Expansions to several major shopping centres are also underway with the planning approval contingent on the inclusion of a residential apartment component.
In addition, the Metropolitan Redevelopment Authority (MRA), “the delivery arm of the State Government’s planning portfolio”, has recently completed or is in various stages of residential infill developments including the coastal suburb of Scarborough, where the beach foreshore has just received a circa $57 million re-vamp including a $26 million swimming pool, world class skate park and bowl together with extensive public open space areas. The MRA took full control of a large portion of the suburb and is responsible for ensuring that the area becomes a vibrant coastal tourist destination with the master plan for the area outlining four distinct precincts. The MRA recently approved the revised 3 Oceans twin tower development comprising twin 43 and 33 storey towers. This proposed development will definitely change
the landscape of the entry to the Scarborough foreshore.
Another area the MRA is planning includes a riverside redevelopment project in East Perth which adjoins the banks of the Swan River comprising some 40 hectares of land. According to the MRA, “The area will feature a new inlet, urban beach, hotels and short stay accommodation, landscaped boardwalks, public art, walkways, cycle paths, a river playground, local shops and more”.
Despite Perth often being maligned as a backwards city (WA - Wait Awhile) when compared to its eastern states counterparts, much has changed in the past 50 years and particularly in the past ten years. In fact, the Perth CBD has undergone significant change over the past decade with recent projects completed including Northbridge Link and Victoria Quay. In addition, the recently completed Optus Stadium now provides a state of the art stadium suitable for international sporting and entertainment acts with a 60,000 seating capacity and is now linked to the Perth CBD via Matagarup Bridge.
South West WA Given that Herron Todd White is now 50, it is worth looking back to what was happening in the South West of WA back in 1968. Back then the major town in the south-west was Bunbury due to the harbour which provided the main export option in the region
for timber and farming production. The other main coastal towns including Busselton and Augusta were mainly holiday towns or retirement locations as well as supporting rural endeavours in the locality. Inland country towns such as Pemberton, Manjimup, Donnybrook and Bridgetown supported the timber, horticulture, dairy and food production industries in their various locations. Populations of these towns were generally very small and the residential accommodation generally basic comprising Californian bungalows and timber framed asbestos and weatherboard clad basic homes. It would be several years before the establishment of the Margaret River wine region.
Jumping ahead 50 years and these towns have undergone significant development and renewal. Bunbury developed into a city and still remains as a focal hub due to the harbour which is now in the process of being expanded. The city itself has undergone significant gentrification with modern housing along the foreshore and the conversion of the silos in Koombana Bay into luxury residential accommodation. The greater Bunbury region has expanded significantly and now includes several new residential subdivisions in Eaton, Australind to the north, Glen Iris and College Grove to the east and Dalyellup to the south.
The establishment and international success of the Margaret River wine region has seen a much greater
Month in ReviewAugust 2018
Res
iden
tial

59
focus on rural lifestyle living with towns such as Margaret River and Cowaramup seeing significant growth. The greater Busselton region has also expanded with new residential developments in Port Geographe to the east, Yalyalup to the south-east and Vasse to the south-west as well as the development of residential suburbs directly south of the Bussell Highway such as Broadwater, West Busselton and Abbey.
Similar to other areas in Australia, the demand for coastal living has seen an explosion of development of coastal towns such as Dunsborough, Yallingup, Prevelly and Gnarabup which have become major tourist towns and comprise substantial luxury holiday homes, many with expansive ocean views. There are several luxury home builders in the south-west region catering for this end of the market.
The style of housing has also changed significantly over this 50 year period and is now predominantly project style 3- and 4-bedroom, 2-bathroom single level homes on 500 to 700 square metre lots.
As with most areas, affordability is a serious issue across the south-west. There has been minimal unit developments leading to a lack of supply of affordable housing in most regions. This has prompted developers in the region to begin creating cottage blocks of 200 to 300 square metre sites which are appealing to both first home buyers due
to their affordability and to retirees due to the ability to lock and leave with minimal garden maintenance required.
One local builder has also stepped into this section of the market with a cottage block development that is completed in ten weeks and provides for innovative New York style apartment living on a small freehold lot at an affordable cost. Only a few of these have been developed so far but it will be interesting to see the level of demand for this product.
Planners are also addressing decentralisation issues by creating higher residential density codes in the CBD areas. An example of this is the recent rezoning of sections of the Dunsborough CBD.
The future is likely to see our towns continue to expand outwards, however infrastructure restraints are likely to also see infill programs developed in the CBD areas.
Month in ReviewAugust 2018
Res
iden
tial

Rural

61
OverviewA recent trip to Northern NSW highlights the extent of the dry conditions. This has not stopped the money for assets in demand as the team report. I do wonder about the impact if the dry extends deep into spring and what this may do to buyer enthusiasm however.
Those new to the ag space may be wondering what is happening, but experienced players will look beyond the immediate situation and may find longer term value.
Some great insights this month from the team follow.
Contact:Tim Lane ph: 07 3319 4400
North QueenslandWith 57.4% (plus 73 other properties) of Queensland presently drought declared, the ongoing pain of this widespread drought is impacting the eastern seaboard regions like no other. The rural property markets across the state are being affected in varying ways.
In central Queensland grazing, north Queensland grazing and north Queensland sugarcane property markets, there has been positive market movement.
Some of this has been driven by confidence in the underlying commodity (despite current pricing) and the future of the industry.
In recent weeks, the north Queensland cattle market has firmed on the back of Indonesian live export demand.
In June, D2 Steers averaged 243.7 cents per kilogram live weight and in July, 253.2 cents per kilogram live
weight. This is down from a peak in September 2016 of 370.3 cents per kilogram live weight.
The current cattle market pricing range is weaker than the four year average of 295.6 cents per kilogram live weight.
The commodity price confidence of 2016 contributed to a property market value rise from 2010 to 2015. The 2016/17 property market pricing was akin to that of levels back in the 2007/08 financial year.
North Queensland grazing property prices have jumped again this year to similar levels as the peak of the last property cycle in 2008/09.
On reflection, at the time of the last peak from the 2007/08 levels to the 2008/09 peak, there was a dry spell on the Barkly Tableland. So too, is there currently a dry spell on the Barkly Tableland that this time happens to extend down through New South Wales and into Victoria, forming one of the most significant droughts in our history since the arrival of the First Fleet in 1788.
The combination of seasonal conditions, cattle prices (in recent years) and interest rates has been of benefit to the cattle property market in this cycle.
This is despite the trend in the cattle market. Property purchasers from southern areas seeking grass form part of the equation, however locals too are active, which is a good sign.
Month in ReviewAugust 2018
Rur
al
* Average NQ saleyard price of 200-330 kg D2 Restocker SteersSource: RBA, MLA
Dec-2014Mar-2015
Jun-2015Sep-2015
Dec-2015Mar-2016
Jun-2016Sep-2016
Dec-2016Mar-2017
Jun-2017Sep-2017
Dec-2017Mar-2018
Jun-2018150
200
250
300
350
400
$0.60
$0.66
$0.72
$0.78
$0.84
$0.90
North Qld Cattle Price (Ac/kg lwt)* Exchange Rate $US/$A
NQ Cattle Price $A
* Properties > 2500haSource: HTW Analysed Sales
2007-08 2008-09 2009-10 2010-11 2011-12 2012-13 2013-14 2014-15 2015-16 2016-17 2017-18$0
$80
$160
$240
$320
$400
Average Analysed Price per Hectare
Northern Central Downs
Other North Queensland

62
Confidence is one factor in the equation that contributes to property market values increasing despite the contrary commodity trend.
This is not just restricted to the northern cattlemen. Take a look at the following graphs from the sugar industry.
Sugar pricing has fallen too. Sugar last peaked in late 2016. Despite the current slump in pricing, the hectare rates have increased.
Variations do exist for the reasons that both these rural land uses have experienced value rate rises despite the commodity trend.
It is easy to point out that this is compositional. There has not been much second rate (or lesser) quality grazing country actually sold in the last year. The grazing country that has sold this year has typically been well regarded country.
The drivers within the cane fields have included family expansions to set the next generation up and increase enterprise scale.
It is not often that cane and cattle market trends are doing similar things. Usually when one is up, the other is down.
At this stage, both the north Queensland and central Queensland grazing property markets are benefiting from good enquiry and sales activity.
In both central Queensland and north Queensland, there is also a lack of country being advertised for sale. At this stage, the northern market is aware of the sales of Wowra Park (Torrens Creek) and Fairlight (Hughenden) selling well to central Queensland buyers.
This drought not mean that the central Queensland market has halted either. While the dry seasons may have reduced listings, they have not reduced the demand.
There have probably been more sales in central Queensland above $10 million in the past six months than at any other point in the last decade. This effect is also driving the interest in northern Queensland assets.
Take for example, the following central Queensland property sales which have transacted within the last 90 days:
• Athol - Blackall: $23.75 million to Moller family;
• Comanche – Rockhampton: $15.9 million to RFM Group;
• Shauna Hills – Bauhinia: $10.75 million to Pickersgill family; and
• Portland Downs – Isisford: $23 million to NAPCO.
Like minds think alike and despite the drought, there are successful and respected members of the sugar
cane sector and central Queensland and north Queensland grazing sectors making property moves towards the future.
That being said, just keeping up with the Joneses and expanding to buy more land does not suit everyone’s business or situation.
Contact:Roger Hill - ph: 0418 200 046Will McLay - ph: 0428 612 457
Darling DownsCarbon is still a big topic in Australia and especially so in western Queensland and north-western New South Wales. At present there are multiple schemes administered under the Carbon Farming Initiative (CFI). Within western Queensland and north-western New South Wales there are a total of 217 registered projects totalling some 22,941,115 Australian Carbon Credit Units (ACCUs) which is more than 37% of the total Australian projects registered to date. A large percentage of these schemes are administered under the Vegetation Method.
The CFI is a voluntary scheme that allows farmers and landowners to earn carbon credits from activities such as:
• reducing livestock emissions;
• increasing efficiency of fertiliser use;
Month in ReviewAugust 2018
Rur
al

63
• enhancing carbon in agricultural soil; and
• storing carbon through revegetation and reforestation.
• Carbon credits earned under the CFI are called Australian Carbon Credit Units (ACCUs).
• The CFI is administered by the Clean Energy Regulator (CER).
• The Emissions Reduction Fund will allow sequestration projects to choose a permanence period of 25 or 100 years.
• If a 25 year option is chosen, there will be a 20% reduction in the number of ACCUs issued for the project. This is to cover the potential cost to the government of replacing carbon stores after the project ends.
Natural disturbance or third party reduces sequestration.• Landholders are not automatically required to
relinquish ACCUs if the offsets project suffers a significant reversal in which sequestered carbon is lost through a natural disturbance (e.g. bushfire, drought or disease), action to manage fire (e.g. establishing a fire break) or the action of a third party beyond the landholder’s control (e.g. vandalism).
• But if there is a significant reversal in carbon stores, the landholder must notify the CER within 60 days and take reasonable action to ensure that carbon stores are re-established.
• A reversal of carbon stores is considered significant if it occurs on 5% or 50 hectares of the project area, whichever is the smaller.
• In some cases, the re-establishment of carbon stores may require only modest intervention, such as allowing trees to regenerate.
• In other cases, where natural regeneration is unlikely or does not occur, active re-establishment or management may be necessary, for example replanting, stock exclusion or weeding.
• The project proponent or the landowner will not receive further ACCUs until carbon stores exceed pre-disturbance levels. This provides an incentive to manage losses and to re-establish carbon stores as quickly as possible.
What to do if you do not meet your obligation to re-establish carbon stores:• If you do not take reasonable steps to re-establish
carbon stores, you will need to relinquish (hand back) ACCUs to the CER.
• The project proponent has 90 days to comply with this relinquishment requirement.
• If this relinquishment requirement is not met, or if the CER is satisfied that the project proponent will not comply with the requirement to relinquish ACCUs within 90 days, a carbon maintenance obligation may be declared for the land area of the project.
• As the carbon maintenance obligation is attached to the land, the obligation to maintain sequestered carbon dioxide stores will apply to future land owners for 100 years after the first ACCUs were issued for the offsets project. If a new offsets project area is added to the offsets project, the
Month in ReviewAugust 2018
Rur
al
NATIONAL SUMMARY
Method Projects ACCUs Issued
Vegetation 399 28,138,513
Landfill and Waste 137 16,983,535
Agriculture 55 454,364
Savanna Burning 73 5,832,011
Energy Efficiency 46 327,391
Transport 6 0
Industrial Fugitives 15 238,638
Facilities 1 0
Total 732 51,135,184
Source: www.cleanenergyregulator.gov.au

64
obligation will apply to that offsets project for 100 years after the first ACCUs were issued for the new offsets project.
• A carbon maintenance obligation seeks to prevent the landholder from engaging in conduct that results or is likely to result in a reduction in carbon stores below the benchmark sequestration level unless the conduct relates to an activity that is expressly permitted by the carbon maintenance obligation. The benchmark level is the amount of carbon sequestered in the relevant area or areas at the time that the carbon maintenance obligation was made.
• A carbon maintenance obligation will be revoked once any outstanding relinquishment obligation or penalties payable in relation to the offsets project have been met. A civil penalty may be imposed if a carbon maintenance obligation is breached.
Source: www.cleanenergyregulator.gov.au/Carbon-Farming-Initiative
In western Queensland and north-western New South Wales, there are a number of applicable methods utilised, but in a large percentage of instances the method utilised is:
• The “Carbon Credits through Human Induced Regeneration of a Permanent Even-Aged Native Forest – 1.1” on land that was cleared of vegetation
and where regrowth was suppressed for at least ten years prior to the project having commenced.
Ongoing Management of the On Farm ProjectThe land owners have an obligation to manage these projects over the permanency period so as to allow the continued sequestration of carbon within the CFI footprint. This may be undertaken through:
• A reduction in the stocking of the footprint over time;
• Construction of fences around the footprint to control both stock and vermin movement through the footprint;
• Construction of firebreaks around the footprint to mitigate against fires.
Carbon PriceSince April 2015, there have been a total of seven auctions with the price per tonne of abatement ($/ACCU) ranging from a low of $10.23 per tonne in
Month in ReviewAugust 2018
Rur
al
Auction DateAv $/t
AbatementCommitment
(million t)No of Contracts
Awarded$ of Contracts
CommittedACCU’s
Contracted
6/7 June 2018 $13.52 6.67 32 $90m 6,670,000
6/7 Dec 2017 $13.08 7.95 26 $104m 7,950,000
5/6 April 2017 $11.82 11.25 31 $133m 11,250,000
16/17 Nov 2016 $10.69 34.40 47 $367m 34,356.058
27/28 April 2016 $10.23 50.50 73 $516m 50,471,310
4/5 Nov 2015 $12.25 45.00 129 $557m 45,451,010
15/16 April 2015 $13.95 47.00 107 $660m 47,333,140
Total/Average $11.97 202.77m 445 $2,427m 169,159,816
Source: www.cleanenergyregulator.gov.au

65
April 2016 to a high of $13.95 per tonne at the very first auction in April 2015. The latest price in the June 2018 Auction was just below this peak at $13.52 per tonne. This suggests that whilst the tonnes committed at each auction have been reducing, the price appears to be holding up.
Components Linked to a CFI ProjectFrom a landowner perspective, there are two components that are intrinsically linked to a CFI project and its worth to a particular property. These are:
• The physical constraint; and
• The financial benefit.
The Physical Constraint• There is a legal requirement to manage the
footprint by either gradually reducing the carrying capacity or locking the footprint entirely in order to facilitate the capturing and storage of carbon so that the legal obligations of the CFI can be met. Ordinarily therefore this will result in a reduced sustainable carrying capacity over the longer term.
• All things being equal, this lock up will be for the duration of the Permanence Period, either 25 or 100 years.
The Financial Benefit• The financial benefit is the associated cashflow
derived from the sale of the ACCUs.
• This income stream is a separate component to the ongoing maintenance of ACCUs captured and stored on farm with the current landowner able to utilize those funds as he sees fit, i.e. there is no legal requirement for the landowner to reinvest the funds back into the property or pay down debt.
• Therefore should the landowner decide to sell the property, the vendor and not the purchaser receives the benefit of the income stream up until the point of sale.
• The purchaser will only receive the benefits of the sale of any ACCUs post the date of purchase.
• Further, the purchaser will still have to continue to manage the CFI footprint and carry the associated liability of the sale of any ACCUs sold before the date of sale together with any further ACCUs they may sell post the date of purchase.
So how do these projects impact the value of a property?First and foremost, as valuers we are required to put ourselves in the position of a hypothetical prudent purchaser in order to undertake a valuation. In the majority of instances we are required to carry out valuations of these projects for mortgage security to allow the mortgagee to give consent to the sale of the ACCUs in the first instance.
Given that the basis of the instructions from our
client (i.e. the bank) is to determine its market value (inclusive of the CFI Project but excluding the cashflow) to a potential buyer whom we assume to be fully cognizant of all of the issues and benefits associated with both the property and the scheme that is registered upon it.
In effect and as with any mortgage security valuation, we are looking at the value of the holding to a hypothetical prudent purchaser and not the current land owner and vendor.
ConclusionsCFI projects are very property specific and therefore one size does not fit all. As such it is difficult to assess the long term impact on the value of a particular property created by the registering of a CFI project. The encumbrance and liability will ultimately depend not only on the specific characteristics of the agreement relevant to the property, but also on the carbon price of the day.
Should the carbon price continue to increase, there is the potential that a greater liability will be imposed over both the property and the land owner if there is a legal requirement to go to the market and acquire replacement ACCUs at some point in the future. However a price drop over time may well give landholders the potential to reduce their financial burden in the same manner, i.e. it may provide the potential to remove the carbon abatement liability
Month in ReviewAugust 2018
Rur
al

66
by purchasing replacement ACCUs at a reduced price in order to relinquish either part or the whole of the liability over the holding (subject to legal contractual requirements).
All things being equal, the value of a project to a potential buyer may very well be at its highest at the beginning of the project when no or minimal sale proceeds of ACCUs have actually been received. Conversely it may be natural to assume (again, all things being equal) that over time as the amount of future income reduces through the contractual period and the liability associated with the historical sale of the ACCUs increases via its attachment to the land, the value of such projects to a prospective buyer may diminish.
As a result, we foresee potential issues within the market over the next three to ten years. A lack of a general working knowledge and a legal understanding of the scheme by the broader market may well have implications on the market value of properties linked with such schemes over the medium term. Whilst the scheme appears to have gained market acceptance, we do not believe the market is fully cognizant of the potential future legal ramifications the corresponding liability will have on the asset in question.
What limited evidence we do have supports this belief. In some instances, discounts are clearly
evident and in others the price paid is considered to be fully firm at best.
Vegetation Management in Relation to Carbon ProjectsIn light of the recent passing of the Vegetation Management and Other Legislation Amendment Act 2018, our experience indicates that many CFI projects contain a varying mix of country that can encompass both remnant and non remnant classifications (i.e. Category X on the Regulated Vegetation Management Map).
Now, given the legal requirement that a project must only consider regrowth on country that has not been treated for at least ten years, there is a real potential that current Category X country within a Property Map of Assessable Vegetation (PMAV) could ultimately trigger back to remnant at some point in the future if the definition of a PMAV as we know it today should change in the future. This begs the question that if a landowner had the opportunity to remove the carbon abatement liability by purchasing replacement ACCUs at the reduced price in order to relinquish either part or the whole of the liability over the holding (subject to legal contractual requirements), would they then be able to treat this regrowth?
In summary, does the benefit of having a registered PMAV on a property override in perpetuity the legal
restriction of not being able to re-treat regrowth should it ultimately be reclassified as remnant vegetation through a scheme of this nature?
Under the pre-amended Vegetation Management Act, the concept of High Value Regrowth Vegetation (Category C vegetation) only applied to vegetation that was the subject of an agricultural lease under the Land Act 1994 (Qld), where that area had not been cleared since 1989. The Amendment Act now applies Category C to vegetation on freehold land as well as indigenous land that has not been cleared for at least 15 years (since May 2003).
Final CommentsAlways seek legal and valuation advice; and there is no such thing as free money.
Cashflow is the financial benefit but is a completely separate issue removed from the valuation process because the land owner can do with it as they see fit. However the risk is the liability that effectively attaches to the land when ACCUs are sold. This liability may have to be carried by the land owner for the entire Permanency Period.
Contact:Doug Knight and Steve Cameron - ph: 0746 397 600
South East Regional AustraliaWith the end of the financial year behind us, the Herron Todd White (South-East Regional Australia)
Month in ReviewAugust 2018
Rur
al

67
agri team is pleased to have provided advice for in excess of 600 rural portfolios and valued in excess of $2 billion dollars worth of specialist rural assets throughout Victoria, Tasmania and parts of southern New South Wales and South Australia. The privilege to be involved in the forefront of so many transactions has enabled us to continually provide the most up to date advice in what has proved to be a heated rural market in many locations or sectors. Despite the hype of the larger transactions or properties on the market such as Rushy Lagoon, Coomboona Dairy and the Robinvale almond orchards which are few and far between, in excess of 50% of our advice involves one or many smaller farms with an average value of circa $3.2 million.
Not surprisingly, the past twelve months has seen us provide advice on over 200 assets in the horticulture and viticulture space across our region of south-eastern Australia. The horticulture sector in particular has been strongly contested by the corporate sector chasing higher investment returns. Recent trends in enquiry suggest that the viticulture space is also beginning to heat up with increasing values evident following a decade of slow market conditions.
The dairy and poultry sectors remains subdued resulting in less than 100 dairy or poultry assets being assessed in the past few months. The corporate grazing and cropping space remains strongly contested in the south, despite a tight
supply of available assets. The recent sales of Cairn Curran near Maryborough and Lexington near Ararat indicate the current strong competition and value growth in this sector.
Our clients are continually seeking a competitive edge in the pre-purchase space through the use of our research and advisory team. Many of our corporate clients increasingly engage us for rural tax depreciation schedules (TDS) and plant and equipment valuations.
A space to watch over the next twelve months is the renewable sector. Our involvement in many wind and solar projects in the past twelve months in addition to the more recent increase in research and advisory services for this sector suggests that there will be more transactions and funds flowing into this space in coming months.
We look forward to providing our new and existing clients with the highest possible level of service and advice across all sectors throughout the new financial year.’
Contact:Angus Shaw - ph: 0448 906 075
NSW Far North CoastDry seasonal conditions have prevailed for most of the north coast region apart from some rain close to the coastline.
A 40.18 hectare sandy loam soil macadamia nut tree farm at Mororo located about halfway between Ballina and Grafton sold for $2.5 million ($62,220 per hectare) and is planted to 7,000 macadamia nut trees that are eight to ten years old. Structural improvements include two sheds, dehusking line and two silos. This farm is indicative of the macadamia industry expansion as this farm is not located in the historically traditional red basalt soil plateaus of Alstonville and Dunoon.
A 46.47 hectare cattle grazing farm with creek flats, a house and a relatively new piggery at Nimbin has sold for $1.02 million ($21,950 per hectare). Beef cattle properties continue to be in strong demand.
A 204 hectare farm that has been operated as a dairy farm at Backmede near Casino has reportedly been sold for $2.63 million ($12,892 per hectare).
Contact:Paul O’Keeffe - ph: 0409 763 573
Deniliquin NSWFrom 2010 to 2017, seasonal conditions were quite good with generally good average commodity prices.
A huge influence in the market has been the low interest rates and the perception that interest rates will remain at or around this level for the foreseeable future.
Month in ReviewAugust 2018
Rur
al

68
Sales over the past 12 months indicate that a significant rise in levels of value in the area has occurred, particularly the grazing country to the north.
In context of value, cropping, grazing and irrigation has doubled in value since around 2013/2014. Grazing country has increased by around 150% in the same time frame and general security water from both the Murrumbidgee and Murray Valleys has tripled in the same time frame.
In terms of actual values, general security water was around $600 to $750 per megalitre in 2013 and now ranges from $1,900 to $2150. It is worth noting it has probably come off 10% to 15% in the past month.
The dry autumn and winter start to the 2018 season and the dryer than average outlook for the remaining winter and spring sees the season on a knife edge.
The low water allocations and forecast for low water allocations has resulted in high temporary water prices, currently at around $275 to $290 per megalitre. This level of value means summer cropping is not viable and even cotton is considered marginal.
The high temporary water prices will have a significant impact on the terms of trade in the dairy industry in the irrigation areas of northern Victoria and southern New South Wales. We are aware of
ten farmers in the Kyabram district who will cease dairying when their current milk contracts expire at the end of July due to the continued negative terms of trade.
If the season has a dry finish, the rising values will steady, however if the season ends with average or below average rainfall, we expect the trend of rising values to continue.
Contact:John Henderson - ph: 0427 814 947
Southern and Western NSWThe rural market continues to show underlying strength with a number of sales yet to be announced currently underway. As mentioned last month we were aware of a transaction at $8,300 per hectare excluding buildings in the Holbrook district. We are now aware of an additional sale that will show an average increase since purchase of 32%! This is over a number of years. Generally when we hear figures like this we will find that there has been significant capital improvement on the property in terms of buildings or pasture development which is reflected in this increase in value, however in this particular example the property is predominantly the same as purchased and this allows for meaningful comparison of purchase and sale data. Whilst we certainly would not indicate that this is reflected across all areas we cover, it is happening in certain areas that have
perceived reliable rainfall and have seen limited trading due to the tightly held nature of the district.
The sale of Ladykirk in the Holbrook district has now settled. This is a 501 hectare property located 14 kilometres north-west of Holbrook and 17 kilometres east of Coolaman. The sale included a 4-bedroom residence which had been rented for an extended period, an older style fibro cottage, steel cattle yards, four stand shearing shed and an old hay shed. The sale transacted at approximately $5.3 million which equates to $10,532 per hectare on an overall basis or $4,260 per acre. This would be considered one of the strongest sales in the district for a property of this size and we believe is a precursor to a number of transactions at values around this level yet to be announced.
As mentioned last month, we indicated that the Darling River property Buckenbe was off the market and suspected to be under contract, however it appears that it has become a casualty of the
Month in ReviewAugust 2018
Rur
al

69
deteriorating seasonal conditions in the west and is now off the market.
Irrigation entitlements continue to be sought after in all valleys from northern New South Wales into Victoria. One of the strongest performers is Lachlan Valley general security entitlements which are currently quoted at between $900 and $1,000 per megalitre. We are aware of a number of buyers at the $950 per megalitre level and believe we will see some transactions at or slightly higher in the near future. These entitlements three years ago were trading at between $350 and $450 per megalitre. This is all taking place when there is currently a zero percent allocation within the system. Previously we have observed the water market to behave in ways that were inverse to the general supply and demand situation. When the raw material, i.e. the water entitlement, was not available or available only in very limited quantities, we saw the market back away from the asset at a time when you would expect that the lower supply would deliver increased interest and prices. Conversely when there were allocations available within the system, this triggered interest as the asset could be used to irrigate various crops and produce income which then saw increased competition and pricing. The current situation would indicate that the general market feels that there will be limited or reduced availability of entitlements in the future particularly in the Lachlan Valley and as such is looking to gain
or acquire as much entitlement as possible even if there is a zero allocation.
Contact:Scott Fuller - ph: 0427 077 566
Central Northern NSW and Victoria The majority of New South Wales continues to be affected by a prolonged drought. There are few listings which is leading to lower numbers of rural sales however land prices appear to be holding steady with some increases seen in higher rainfall areas particularly to the north and north-east of Armidale.
Looking at properties in excess of 250 hectares throughout the Armidale LGA, the number of sales has dropped from approximately 25 from June 2016 to July 2017 to 14 from July 2017 to June 2018.
Recent sales of note include Emily Park at Ben Lomond (A) which sold at auction in May 2018 for $4.35 million, Yonda at Guyra (C) which sold in April 2018 for $3.97 million and Earlstoun at Guyra (K) for $4 million in December 2017. Conditions in the Tamworth LGA are extremely dry with well below average rainfall over the past six months. Farmers have been unable to plant winter crops due to the lack of moisture and most farmers are having to hand feed their stock or sell the stock due to the lack of feed.
Throughout the Tamworth LGA there has also been a decrease in the number of sales from approximately
34 from July 2016 to June 2017 to 26 from July 2017 to June 2018.
Contact:Scott Fuller - ph: 0427 077 566
Northern VictoriaSolar FarmsSolar farms and solar farm proposals are popping up all across the country and northern Victoria is no different as a recent article in the local paper has reported (https://www.pressreader.com/australia/shepparton-news-country-news/20180703/281496457030478). There are several additional farms proposed in the region which were not included in this article or have been subsequently proposed with the golden row (first row of panels) having been installed at the Swan Hill solar project recently (https://reneweconomy.com.au/victorias-second-large-scale-solar-farm-opened-at-swan-hill-56613/) in close succession to the Gannawarra solar farm (https://www.rcrtom.com.au/latest-projects/gannawarra-solar-farm/).
Herron Todd White has been engaged in various capacities to act for both landholders and developers to provide suitable land advice on options, leasing and purchase of suitable sites with demand continuing. While there are many opportunities afforded by this exciting new technology, there are a variety of key considerations and strategic features developers are looking for in a site - most particularly
Month in ReviewAugust 2018
Rur
al

70
the site proximity to existing electricity infrastructure and the capacity of the infrastructure to carry additional electricity loads.
Landholders or developers interested in finding out more can contact their local Herron Todd White valuer to discuss any proposals.
Contact:David Leeds – ph: 0418 594 416
Northern Territory/KimberleyMount McMinn Station (809 square kilometres in the Roper River district, 180 kilometres east of Mataranka) settled in early June for $7.5 million (WIWO) or around $5 million bare to an Australian based purchaser (with South African ties). The property last sold in September 2005 for around $3.5 million (assessed bare) with several new accommodation buildings, partly new boundary and subdivision fencing and eight new dams developed in the interim. The Mount McMinn sale follows the only other pastoral sale in the Northern Territory in the year to date which was Maryvale (3,244 square kilometres in the Alice Springs district). However, as the live export price now appears to be stabilizing at viable levels for pastoralists and with the dry season property inspection period in full swing, sales activity is picking up and we are aware of a sale under contract for at least one other small
scale (< 5,000 head carrying capacity) station and offers accepted on another three small to medium scale operations in the northern half of the Northern Territory (details remain confidential at this stage). We are also aware of a large freehold grazing block (over 9,500 hectares) north of Katherine that is also under contract for sale and will also be a resale with a four year turn-around. The potential purchasers are predominantly Australian based and it brings this Valuer some confidence to see the smaller holdings attracting the interest of experienced Territory pastoralists looking to expand their operations.
It has also been reported in the media and announced to the ASX that Seafarms, the potential developer of the massive prawn farm on Legune Station (1,789 square kilometres in the northern Victoria River district) has signed a terms sheet with Brisbane based AAM Investment Group (AAMIG) to buy the Legune pastoral lease and then lease an area back to Seafarms for the aquaculture development. Full details of the WIWO deal remain confidential at this stage and Seafarms still has to make its final investment decision on whether to proceed with the project or not (there is an existing option agreement between Seafarms and the current pastoral lessee; the project investment is reportedly $1.45 billion and has achieved Major Project Status under the NT Government). There could be several outcomes to the deal in the end
however AAMIG have reported to the press that the WIWO deal would be in excess of $50 million.
If we assume the above pastoral deals are eventually consummated in settled sales, there will remain around 5.09 million hectares comprising 19 pastoral lease holdings still available for sale across the NT at present .
A significant event for the potential of future pastoral diversification in the NT also occurred in June with the NT Government suspending the decision for the proposed change to the NT Pastoral Lands Act to allow registration of non-pastoral use permits on a pastoral lease title. The decision now rests on the outcome of a model yet to be developed which would grant greater procedural rights for Native Title Holders in the granting of the permit.
The outlook for the NT agriculture and horticulture industry received a confidence boost this month with the NT Government announcing a $4.8 million investment in the Darwin International Airport Freight and Education Hub under the Building Better Regions Fund. The project will include the construction of an on-airport cold storage facility, a vapour heat treatment facility and upgrades to the airside apron and taxiway to accommodate larger aircrafts and a training and education facility to create opportunities for students to learn about export, freight and logistics for the primary industry
Month in ReviewAugust 2018
Rur
al
71
sector. The vapour heat treatment plant is for the Territory’s main high value horticultural crop, mangoes, an industry which has proven its strong viability in the NT over recent decades. Harvested mangoes would be put through the plant to remove fruit fly before export overseas to China, Korea and Japan. Currently, Territory mangoes are sent to Queensland for treatment before being exported.
Contact:Frank Peacocke - ph: 0439 950997
Western AustraliaThe vagaries of Western Australian weather are evident this year with some southern wheat and sheep areas that suffered flooding last year having a very dry start. The reverse can be said for some of the northern cropping regions which had a very dry start last year and have had solid rainfall events, giving crops a good start and producing much needed feed. This was very evident during inspection of crops over the last month and is likely to result in a very mixed cropping season if finishing rains do not eventuate. Will this affect the market in the regions which are having a dry start? There is potential that if whole farm failures occur it will create financial pressure however a number of regions affected have had some good years in the last decade and surely have allowed for the risk of a bad year or two in their planning. The weather is a risk that is as old as the hills the crops grow on and therefore it
will always be one of many factors that influences the land market. However like frost prone areas it is a risk that potential purchasers acting prudently and knowledgeably would be aware of and take into account in their purchasing decisions. I appreciate that long spells of drought and extreme weather events are very difficult to account for and some years farming is like rolling the dice at the casino.
It is unlikely that the land market in the southern regions that are having a dry start will be adversely affected in terms of value however a good result in some of the northern and eastern regions has the potential to trigger some activity after a number of slow years. This is already evident with the reported sale of 3,410 arable hectares at Gabbin (north-east of Perth) for $2 million in July 2018 equating to $586 per arable hectare improved.
Contact:David Abel - ph: 0408 489 667
Month in ReviewAugust 2018
Rur
al

Property Market Indicators

© Herron Todd White Copyright 2018
Mar
ket
Indi
cato
rs
73
1
Month in ReviewAugust 2018
Capital City Property Market Indicators - HousesCapital City Property Market Indicators – Houses
Factor Sydney Melbourne Brisbane Adelaide Perth Hobart Darwin Canberra
Rental Vacancy Situation Balanced market Shortage of available property relative to demand
Over-supply of available property relative to demand
Balanced market Balanced market Severe shortage of available property relative to demand
Over-supply of available property relative to demand
Balanced market
Rental Vacancy Trend Steady Steady Increasing Steady Tightening Steady Steady Steady
Demand for New Houses Fair Fair Strong Fair Soft Strong Soft Strong
Trend in New House Construction Steady Steady Steady Increasing Declining Increasing Declining Increasing
Volume of House Sales Declining Increasing Steady Steady Steady Increasing Steady Increasing
Stage of Property Cycle Declining market Peak of market Rising market Rising market Bottom of market Approaching peak of market
Bottom of market Rising market
Are New Properties Sold at Prices Exceeding Their Potential Resale Value
Occasionally Occasionally Occasionally Occasionally Occasionally Almost never Occasionally Occasionally
Red entries indicate change from previous month to a higher risk-rating Blue entries indicate change from previous month to a lower risk-rating
0
1
2
3
4
5
6
Sydne
y
Melbou
rne
Brisba
ne
Adelai
de
Perth
Hobart
Darwin
Canbe
rra
Rental Vacancy Trend
Increasing Sharply
Increasing
Steady
Tightening
Tightening Sharply
0
1
2
3
4
5
6
7
8
9
Sydne
y
Melbou
rne
Brisba
ne
Adelai
de
Perth
Hobart
Darwin
Canbe
rra
Stage of Property Cycle Peak of Market
Starting to Decline
Approaching Peak
Declining Market
Approaching Bottom
Rising Market
Bottom of Market Start of Recovery
0
1
2
3
4
5
6
Sydne
y
Melbou
rne
Brisba
ne
Adelai
de
Perth
Hobart
Darwin
Canbe
rra
Demand for New Houses
Very Soft
Soft
Fair
Strong
Very Strong

© Herron Todd White Copyright 2018
Mar
ket
Indi
cato
rs
74
Month in ReviewAugust 2018
Capital City Property Market Indicators - UnitsCapital City Property Market Indicators – Units
Factor Sydney Melbourne Brisbane Adelaide Perth Hobart Darwin Canberra
Rental Vacancy Situation Balanced market Shortage of available property relative to demand
Over-supply of available property relative to demand
Balanced market Balanced market Severe shortage of available property relative to demand
Over-supply of available property relative to demand
Balanced market
Rental Vacancy Trend Steady Steady Increasing Steady Tightening Steady Steady Steady
Demand for New Units Fair Fair Strong Fair Soft Strong Soft Strong
Trend in New Unit Construction Steady Steady Steady Increasing Declining Increasing Declining Increasing
Volume of Unit Sales Declining Increasing Steady Steady Steady Increasing Steady Increasing
Stage of Property Cycle Declining market Peak of market Rising market Rising market Bottom of market Approaching peak of market
Bottom of market Rising market
Are New Properties Sold at Prices Exceeding Their Potential Resale Value
Occasionally Occasionally Occasionally Occasionally Occasionally Almost never Occasionally Occasionally
Red entries indicate change from previous month to a higher risk-rating Blue entries indicate change from previous month to a lower risk-rating
0
1
2
3
4
5
6
Sydne
y
Melbou
rne
Brisba
ne
Adelai
de
Perth
Hobart
Darwin
Canbe
rra
Rental Vacancy Trend
Increasing harply
Increasing
Steady
Tightening
Tightening Sharply
0
1
2
3
4
5
6
7
8
9
Sydne
y
Melbou
rne
Brisba
ne
Adelai
de
Perth
Hobart
Darwin
Canbe
rra
Stage of Property Cycle Peak of Market
Starting to Decline
Approaching Peak
Declining Market
Approaching Bottom
Rising Market
Bottom of Market Start of Recovery
0
1
2
3
4
5
6
Sydne
y
Melbou
rne
Brisba
ne
Adelai
de
Perth
Hobart
Darwin
Canbe
rra
Demand for New Units
Very Soft
Soft
Fair
Strong
Very Strong

© Herron Todd White Copyright 2018
Mar
ket
Indi
cato
rs
75
1
1
Month in ReviewAugust 2018
Capital City Property Market Indicators - OfficesCapital City Property Market Indicators – Offices
Factor Sydney Melbourne Brisbane Adelaide Perth Hobart Darwin Canberra
Rental Vacancy Situation Shortage of available property relative to demand
Shortage of available property relative to demand - Balanced market
Large over-supply of available property relative to demand
Over-supply of available property relative to demand
Large over-supply of available property relative to demand
Over-supply of available property relative to demand
Over-supply of available property relative to demand
Over-supply of available property relative to demand
Rental Vacancy Trend Tightening Tightening Tightening Steady Steady Steady Steady Tightening
Rental Rate Trend Increasing Increasing Stable Stable Stable Declining Stable Increasing
Volume of Property Sales Steady Steady - Declining Steady Steady Increasing Steady Steady Steady
Stage of Property Cycle Rising market Peak of market Start of recovery Start of recovery Bottom of market Bottom of market Bottom of market Start of recovery
Local Economic Situation Steady growth Steady growth Steady growth Flat Steady growth Flat Severe contraction Steady growth
Value Difference between Quality Properties with National Tenants, and Comparable Properties with Local Tenants
Small Small - Significant Large Significant Large Significant Large Significant
Red entries indicate change from 3 months ago to a higher risk-rating Blue entries indicate change from 3 months ago to a lower risk-rating
0
1
2
3
4
5
6
Sydne
y
Melbou
rne
Brisba
ne
Adelai
de
Perth
Hobart
Darwin
Canbe
rra
Rental Vacancy Trend
Increasing Sharply
Increasing
Steady
Tightening
Tightening Sharply
0
1
2
3
4
5
6
7
8
9
Sydne
y
Melbou
rne
Brisba
ne
Adelai
de
Perth
Hobart
Darwin
Canbe
rra
Stage of Property Cycle
Peak of Market
Starting to Decline
Approaching Peak
Declining Market
Approaching Bottom
Rising Market
Bottom of Market Start of Recovery
0
1
2
3
4
5
6
Sydne
y
Melbou
rne
Brisba
ne
Adelai
de
Perth
Hobart
Darwin
Canbe
rra
Local Economic Situation
Severe Contraction
Contraction
Flat
Steady Growth
High Growth

© Herron Todd White Copyright 2018
Mar
ket
Indi
cato
rs
76
1
Month in ReviewAugust 2018
New South Wales Property Market Indicators - HousesEast Coast New South Wales Property Market Indicators – Houses
Factor Canberra Central Coast Coffs Harbour Lismore Mid North Coast Newcastle South East NSW Sydney
Rental Vacancy Situation Central Coast Coffs Harbour Lismore Mid North Coast Newcastle South East NSW Sydney Central Coast
Rental Vacancy Trend Balanced market Balanced market Shortage of available property relative to demand
Over-supply of available property relative to demand
Shortage of available property relative to demand
Balanced market Balanced market Balanced market
Demand for New Houses Steady Tightening Tightening - Steady Increasing Tightening Steady Steady Steady
Trend in New House Construction
Fair Very strong Fair - Strong Fair Very strong Fair Fair Fair
Volume of House Sales Steady Steady Steady - Increasing Steady Steady Steady Steady Steady
Stage of Property Cycle Steady Steady Increasing - Steady Declining Steady Declining Declining Steady
Are New Properties Sold at Prices Exceeding Their Potential Resale Value
Peak of market Peak of market Rising market Peak of market Approaching peak of market
Starting to decline Declining market Peak of market
Red entries indicate change from previous month to a higher risk-rating Blue entries indicate change from previous month to a lower risk-rating
0
1
2
3
4
5
6
Canbe
rra
Centra
l Coa
st
Coffs H
arbou
r
Lismore
Mid Nort
h Coa
st
Newca
stle
South
East N
SW
Sydne
y
Rental Vacancy Trend
Increasing Sharply
Increasing
Steady
Tightening 0
1
2
3
4
5
6
7
8
9
Canbe
rra
Centra
l Coa
st
Coffs H
arbou
r
Lismore
Mid Nort
h Coa
st
Newca
stle
South
East N
SW
Sydne
y
Stage of Property Cycle Peak of Market
Starting to Decline
Approaching Peak
Declining Market
Approaching Bottom
Rising Market
Bottom of Market Start of Recovery
0
1
2
3
4
5
6
Canbe
rra
Centra
l Coa
st
Coffs H
arbou
r
Lismore
Mid Nort
h Coa
st
Newca
stle
South
East N
SW
Sydne
y
Demand for New Houses
Very Soft
Soft
Fair
Strong
Very Strong

© Herron Todd White Copyright 2018
Mar
ket
Indi
cato
rs
77
1
Month in ReviewAugust 2018
New South Wales Property Market Indicators - UnitsEast Coast New South Wales Property Market Indicators - Units
Factor Canberra Central Coast Coffs Harbour Lismore Mid North Coast Newcastle South East NSW
Rental Vacancy Situation Balanced market Shortage of available property relative to demand
Balanced market Shortage of available property relative to demand
Over-supply of available property relative to demand
Shortage of available property relative to demand
Balanced market
Rental Vacancy Trend Steady - Increasing Steady Tightening Tightening - Steady Increasing Tightening Steady
Demand for New Units Fair Strong Very strong Fair Fair Strong Fair
Trend in New Unit Construction Increasing Declining Steady Steady Steady Increasing Steady
Volume of Unit Sales Steady Increasing Steady Increasing - Steady Declining Steady Declining
Stage of Property Cycle Peak of market Peak of market Peak of market Rising market Peak of market Approaching peak of market
Starting to decline
Are New Properties Sold at Prices Exceeding Their Potential Resale Value
Almost never Occasionally Almost never Occasionally Almost never Occasionally Frequently
Red entries indicate change from previous month to a higher risk-rating Blue entries indicate change from previous month to a lower risk-rating
0
1
2
3
4
5
6
Canbe
rra
Centra
l Coa
st
Coffs H
arbou
r
Lismore
Mid Nort
h Coa
st
Newca
stle
South
East N
SW
Rental Vacancy Trend
Increasing Sharply
Increasing
Steady
Tightening 0
1
2
3
4
5
6
7
8
9
Canbe
rra
Centra
l Coa
st
Coffs H
arbou
r
Lismore
Mid Nort
h Coa
st
Newca
stle
South
East N
SW
Stage of Property Cycle Peak of Market
Starting to Decline
Approaching Peak
Declining Market
Approaching Bottom
Rising Market
Bottom of Market Start of Recovery
0
1
2
3
4
5
6
Canbe
rra
Centra
l Coa
st
Coffs H
arbou
r
Lismore
Mid Nort
h Coa
st
Newca
stle
South
East N
SW
Demand for New Units
Very Soft
Soft
Fair
Strong
Very Strong

© Herron Todd White Copyright 2018
Mar
ket
Indi
cato
rs
78
1
Month in ReviewAugust 2018
New South Wales Property Market Indicators - OfficeEast Coast New South Wales Property Market Indicators – Office Factor Canberra Coffs Harbour Lismore Mid North Coast Newcastle South East NSW Sydney
Rental Vacancy Situation Balanced market Over-supply of available property relative to demand
Over-supply of available property relative to demand
Over-supply of available property relative to demand
Balanced market Balanced market Balanced market
Rental Vacancy Trend Steady Steady Increasing Steady Tightening Steady Steady
Rental Rate Trend Stable Stable Declining Stable Increasing Stable Stable
Volume of Property Sales Declining Steady Steady Steady Increasing Increasing - Steady Steady
Stage of Property Cycle Approaching peak of market
Approaching peak of market
Starting to decline Approaching peak of market
Rising market Approaching peak of market
Rising market
Local Economic Situation Steady growth Steady growth Flat Steady growth Steady growth Steady growth Steady growth
Value Difference between Quality Properties with National Tenants, and Comparable Properties with Local Tenants
Significant Significant - Large Significant - Large Significant Significant Significant Small
Red entries indicate change from 3 months ago to a higher risk-rating Blue entries indicate change from 3 months ago to a lower risk-rating
0
1
2
3
4
5
6
Canbe
rra
Coffs H
arbou
r
Lismore
Mid Nort
h Coa
st
Newca
stle
South
East N
SW
Sydne
y
Rental Vacancy Trend
Increasing Sharply
Increasing
Steady
Tightening
Tightening Sharply
0
1
2
3
4
5
6
7
8
9
Canbe
rra
Coffs H
arbou
r
Lismore
Mid Nort
h Coa
st
Newca
stle
South
East N
SW
Sydne
y
Stage of Property Cycle Peak of Market
Starting to Decline
Approaching Peak
Declining Market
Approaching Bottom
Rising Market
Bottom of Market Start of Recovery
0
1
2
3
4
5
6
Canbe
rra
Coffs H
arbou
r
Lismore
Mid Nort
h Coa
st
Newca
stle
South
East N
SW
Sydne
y
Local Economic Situation
Severe Contraction
Contraction
Flat
Steady Growth

© Herron Todd White Copyright 2018
Mar
ket
Indi
cato
rs
79
1
Month in ReviewAugust 2018
Victorian and Tasmanian Property Market Indicators - HousesVictorian and Tasmanian Property Market Indicators – Houses
Factor Ballarat Bendigo Echuca Gippsland Melbourne Mildura Burnie/
Devonport Hobart Launceston
Rental Vacancy Situation Balanced market Balanced market Shortage of available property relative to demand
Balanced market
Balanced market Balanced market Balanced market Severe shortage of available property relative to demand
Balanced market
Rental Vacancy Trend Tightening Tightening Tightening Steady Tightening Tightening Tightening Steady Tightening
Demand for New Houses Strong Strong Strong Strong Fair Strong Fair Strong Fair
Trend in New House Construction Increasing Increasing Steady Increasing Declining Steady Declining Increasing Declining
Volume of House Sales Increasing Steady Steady Increasing Steady Steady Steady Increasing Steady
Stage of Property Cycle Rising market Starting to decline Rising market Approaching peak of market
Rising market Rising market Rising market Approaching peak of market
Rising market
Are New Properties Sold at Prices Exceeding Their Potential Resale Value
Occasionally Occasionally Occasionally Frequently Almost never Almost never Almost never Almost never Almost never
Red entries indicate change from previous month to a higher risk-rating Blue entries indicate change from previous month to a lower risk-rating
0
1
2
3
4
5
6
Ballara
t
Bendig
o
Echuc
a
Gippsla
nd
Melbou
rne
Mildura
Burnie-
Hobart
Laun
cesto
n
Rental Vacancy Trend
Increasing Sharply
Increasing
Steady
Tightening
Tightening Sharply
0
1
2
3
4
5
6
7
8
9
Ballara
t
Bendig
o
Echuc
a
Gippsla
nd
Melbou
rne
Mildura
Burnie-
Hobart
Laun
cesto
n
Stage of Property Cycle Peak of Market
Starting to Decline
Approaching Peak
Declining Market
Approaching Bottom
Rising Market
Bottom of Market Start of Recovery
0
1
2
3
4
5
6
Ballara
t
Bendig
o
Echuc
a
Gippsla
nd
Melbou
rne
Mildura
Burnie-
Hobart
Laun
cesto
n
Demand for New Houses
Very Soft
Soft
Fair
Strong
Very Strong

© Herron Todd White Copyright 2018
Mar
ket
Indi
cato
rs
80
1
Month in ReviewAugust 2018
Victorian and Tasmanian Property Market Indicators - UnitsVictorian and Tasmanian Property Market Indicators – Units
Factor Ballarat Bendigo Echuca Gippsland Melbourne Mildura Burnie/ Devonport
Hobart Launceston
Rental Vacancy Situation Balanced market Over-supply of available property relative to demand
Balanced market Balanced market
Shortage of available property relative to demand
Balanced market Balanced market Severe shortage of available property relative to demand
Balanced market
Rental Vacancy Trend Steady Steady Steady Steady Steady Tightening Tightening Steady Tightening
Demand for New Units Fair Strong Fair Fair Soft - Fair Strong Fair Strong Fair
Trend in New Unit Construction Steady Steady Steady Steady Declining Steady Declining Increasing Declining
Volume of Unit Sales Steady Steady Steady Steady Steady Steady Steady Steady Steady
Stage of Property Cycle Rising market Starting to decline Rising market Start of recovery
Peak of market Start of recovery Rising market Approaching peak of market
Rising market
Are New Properties Sold at Prices Exceeding Their Potential Resale Value
Occasionally Occasionally Occasionally Almost never Occasionally Almost never Almost never Almost never Almost never
Red entries indicate change from previous month to a higher risk-rating Blue entries indicate change from previous month to a lower risk-rating
0
1
2
3
4
5
6
Ballara
t
Bendig
o
Echuc
a
Gippsla
nd
Melbou
rne
Mildura
Burnie-
Hobart
Laun
cesto
n
Rental Vacancy Trend
Increasing Sharply
Increasing
Steady
Tightening
Tightening Sharply
0
1
2
3
4
5
6
7
8
9
Ballara
t
Bendig
o
Echuc
a
Gippsla
nd
Melbou
rne
Mildura
Burnie-
Hobart
Laun
cesto
n
Stage of Property Cycle Peak of Market
Starting to Decline
Approaching Peak
Declining Market
Approaching Bottom
Rising Market
Bottom of Market Start of Recovery
0
1
2
3
4
5
6
Ballara
t
Bendig
o
Echuc
a
Gippsla
nd
Melbou
rne
Mildura
Burnie-
Hobart
Laun
cesto
n
Demand for New Units
Very Soft
Soft
Fair
Strong
Very Strong

© Herron Todd White Copyright 2018
Mar
ket
Indi
cato
rs
81
1
Month in ReviewAugust 2018
Victorian and Tasmanian Property Market Indicators - OfficeVictorian and Tasmanian Property Market Indicators – Office
Factor Ballarat Bendigo Echuca Gippsland Melbourne Mildura Burnie/
Devonport Hobart Launceston
Rental Vacancy Situation
Balanced market
Balanced market Balanced market
Over-supply of available property relative to demand
Balanced market Over-supply of available property relative to demand
Over-supply of available property relative to demand
Over-supply of available property relative to demand
Over-supply of available property relative to demand
Rental Vacancy Trend
Steady Steady Steady Steady Increasing Steady Steady Steady Steady
Rental Rate Trend
Stable Stable Stable Stable Declining Stable Declining Declining Declining
Volume of Property Sales
Declining Steady Steady Steady Steady Steady Steady Steady Steady
Stage of Property Cycle
Rising market Rising market Declining market
Declining market
Approaching peak of market
Start of recovery Rising market Rising market Rising market
Local Economic Situation
Steady growth Flat Flat Flat Flat Steady growth Flat Flat Flat
Value Difference between Quality Properties with National Tenants, and Comparable Properties with Local Tenants
Significant Significant Small Significant Significant Large Significant Significant Significant
Red entries indicate change from 3 months ago to a higher risk-rating Blue entries indicate change from 3 months ago to a lower risk-rating
0
1
2
3
4
5
6
Ballara
t
Bendig
o
Echuc
a
Gippsla
nd
Melbou
rne
Mildura
Burnie-
Hobart
Laun
cesto
n
Rental Vacancy Trend
Increasing Sharply
Increasing
Steady
Tightening
Tightening Sharply
0
1
2
3
4
5
6
7
8
9
Ballara
t
Bendig
o
Echuc
a
Gippsla
nd
Melbou
rne
Mildura
Burnie-
Hobart
Laun
cesto
n
Stage of Property Cycle
Peak of Market
Starting to Decline
Approaching Peak
Declining Market
Approaching Bottom
Rising Market
Bottom of Market
Start of Recovery 0
1
2
3
4
5
6
Ballara
t
Bendig
o
Echuc
a
Gippsla
nd
Melbou
rne
Mildura
Burnie-
Hobart
Laun
cesto
n
Local Economic Situation
Severe Contraction
Contraction
Flat
Steady Growth
High Growth

© Herron Todd White Copyright 2018
Mar
ket
Indi
cato
rs
82
1
Month in ReviewAugust 2018
Queensland Property Market Indicators - HousesQueensland Property Market Indicators – Houses
Factor Cairns Towns-ville
Mackay Rockhampton
Emerald Gladstone Bundaberg
Hervey Bay Sunshine Coast
Brisbane Ipswich Gold Coast
Toowoomba
Rental Vacancy Situation Severe shortage - Shortage of available property relative to demand
Shortage of available property relative to demand - Balanced market
Balanced market
Balanced market
Shortage of available property relative to demand
Balanced market
Balanced market
Shortage of available property relative to demand
Balanced market
Over-supply of available property relative to demand
Over-supply of available property relative to demand
Balanced market
Shortage of available property relative to demand
Rental Vacancy Trend Steady Tightening Tightening Tightening Tightening Steady Steady Tightening Steady Increasing Increasing Steady Steady
Demand for New Houses Soft Soft - Fair Fair Soft Soft Fair Fair Fair Strong Strong Fair Fair Fair
Trend in New House Construction
Declining Steady Increasing Declining Increasing Increasing Steady Steady Increasing Steady Increasing Steady Steady
Volume of House Sales Increasing - Steady
Steady Steady Steady Increasing Steady Steady Increasing Steady Steady Steady Declining Declining
Stage of Property Cycle Start of recovery
Start of recovery
Start of recovery
Bottom of market
Rising market Start of recovery
Bottom of market
Start of recovery
Approaching peak of market
Rising market
Start of recovery
Starting to decline
Bottom of market
Are New Properties Sold at Prices Exceeding Their Potential Resale Value
Occasion-ally
Almost never
Occasionally Occasion-ally
Occasionally Occasion-ally
Occasion-ally
Occasionally Occasionally Occasion-ally
Occasion-ally
Very frequently
Occasionally
Red entries indicate change from previous month to a higher risk-rating Blue entries indicate change from previous month to a lower risk-rating
0
1
2
3
4
5
6
Cairns
Towns
ville
Macka
y
Rockh
ampto
n
Emerald
Gladsto
ne
Bunda
berg
Hervey
Bay
Sunsh
ine C
oast
Brisba
ne
Ipswich
Gold C
oast
Toow
oomba
Rental Vacancy Trend
Increasing Sharply
Increasing
Steady
Tightening
Tightening Sharply
0
1
2
3
4
5
6
7
8
9
Cairns
Towns
ville
Macka
y
Rockh
ampto
n
Emerald
Gladsto
ne
Bunda
berg
Hervey
Bay
Sunsh
ine C
oast
Brisba
ne
Ipswich
Gold C
oast
Toow
oomba
Stage of Property Cycle Peak of Market
Starting to Decline
Approaching Peak
Declining Market
Approaching Bottom
Rising Market
Bottom of Market Start of Recovery
0
1
2
3
4
5
6
Cairns
Towns
ville
Macka
y
Rockh
ampto
n
Emerald
Gladsto
ne
Bunda
berg
Hervey
Bay
Sunsh
ine C
oast
Brisba
ne
Ipswich
Gold C
oast
Toow
oomba
Demand for New Houses
Very Soft
Soft
Fair
Strong
Very Strong

© Herron Todd White Copyright 2018
Mar
ket
Indi
cato
rs
83
1
Month in ReviewAugust 2018
Queensland Property Market Indicators - UnitsQueensland Property Market Indicators - Units
Factor Cairns Towns-
ville Mackay Rockham
pton Emerald Gladstone Bundaber
g Hervey Bay Sunshine
Coast Brisbane Ipswich Gold
Coast Toowoomba
Rental Vacancy Situation Severe shortage - Shortage of available property relative to demand
Shortage of available property relative to demand - Balanced market
Balanced market
Balanced market
Shortage of available property relative to demand
Balanced market
Balanced market
Shortage of available property relative to demand
Balanced market
Over-supply of available property relative to demand
Over-supply of available property relative to demand
Balanced market
Shortage of available property relative to demand
Rental Vacancy Trend Steady Tightening Tightening Tightening Tightening Steady Steady Tightening Steady Increasing Increasing Steady Steady
Demand for New Units Soft Soft - Fair Fair Soft Soft Fair Fair Fair Strong Strong Fair Fair Fair
Trend in New Unit Construction
Declining Steady Increasing Declining Increasing Increasing Steady Steady Increasing Steady Increasing Steady Steady
Volume of Unit Sales Increasing - Steady
Steady Steady Steady Increasing Steady Steady Increasing Steady Steady Steady Declining Declining
Stage of Property Cycle Start of recovery
Start of recovery
Start of recovery
Bottom of market
Rising market Start of recovery
Bottom of market
Start of recovery
Approaching peak of market
Rising market
Start of recovery
Starting to decline
Bottom of market
Are New Properties Sold at Prices Exceeding Their Potential Resale Value
Occasion-ally
Almost never
Occasionally Occasion-ally
Occasionally Occasion-ally
Occasion-ally
Occasionally Occasionally Occasion-ally
Occasion-ally
Very frequently
Occasionally
Red entries indicate change from previous month to a higher risk-rating Blue entries indicate change from previous month to a lower risk-rating
0
1
2
3
4
5
6
Cairns
Towns
ville
Macka
y
Rockh
ampto
n
Emerald
Gladsto
ne
Bunda
berg
Hervey
Bay
Sunsh
ine C
oast
Brisba
ne
Ipswich
Gold C
oast
Toow
oomba
Rental Vacancy Trend
Increasing Sharply
Increasing
Steady
Tightening
Tightening Sharply
0
1
2
3
4
5
6
7
8
9
Cairns
Towns
ville
Macka
y
Rockh
ampto
n
Emerald
Gladsto
ne
Bunda
berg
Hervey
Bay
Sunsh
ine C
oast
Brisba
ne
Ipswich
Gold C
oast
Toow
oomba
Stage of Property Cycle Peak of Market
Starting to Decline
Approaching Peak
Declining Market
Approaching Bottom
Rising Market
Bottom of Market Start of Recovery
0
1
2
3
4
5
6
Cairns
Towns
ville
Macka
y
Rockh
ampto
n
Emerald
Gladsto
ne
Bunda
berg
Hervey
Bay
Sunsh
ine C
oast
Brisba
ne
Ipswich
Gold C
oast
Toow
oomba
Demand for New Units
Very Soft
Soft
Fair
Strong
Very Strong

© Herron Todd White Copyright 2018
Mar
ket
Indi
cato
rs
84
1
Month in ReviewAugust 2018
Queensland Property Market Indicators - OfficeQueensland Property Market Indicators – Off ice Factor Cairns Townsville Mackay Rockhampton Gladstone Wide Bay Emerald Sunshine Coast Brisbane Gold Coast Toowoomba
Rental Vacancy Situation Over-supply of available property relative to demand
Over-supply of available property relative to demand
Over-supply of available property relative to demand
Balanced market Over-supply of available property relative to demand
Balanced market
Over-supply of available property relative to demand
Over-supply of available property relative to demand - Large over-supply of available property relative to demand
Large over-supply of available property relative to demand
Over-supply of available property relative to demand
Balanced market - Over-supply of available property relative to demand
Rental Vacancy Trend Steady Steady Steady Steady Steady Steady Increasing Increasing Tightening Tightening Steady
Rental Rate Trend Stable Declining Stable Stable Stable Stable Declining Declining - Stable Stable Declining - Stable
Declining - Stable
Volume of Property Sales Steady Steady Steady Steady Steady Steady Declining Steady Steady Increasing - Steady
Increasing - Steady
Stage of Property Cycle Bottom of market
Bottom of market
Bottom of market
Bottom of market Approaching bottom of market
Bottom of market
Declining market
Rising market Bottom of market
Peak of market Start of recovery
Local Economic Situation Steady growth - Flat
Flat Steady growth Flat Flat Flat Contraction Steady growth Steady growth Steady growth Flat - Contraction
Value Difference between Quality Properties with National Tenants, and Comparable Properties with Local Tenants
Small Small - Significant
Significant Small Large Significant Small Small - Significant Significant Small Significant - Large
Red entries indicate change from 3 months ago to a higher risk-rating Blue entries indicate change from 3 months ago to a lower risk-rating
0
1
2
3
4
5
6
Cairns
Towns
ville
Macka
y
Rockh
ampto
n
Gladsto
ne
Wide
Bay
Emerald
Sunsh
ine C
oast
Brisba
ne
Gold C
oast
Toow
oomba
Rental Vacancy Trend
Increasing Sharply
Increasing
Steady
Tightening
Tightening Sharply
0
1
2
3
4
5
6
7
8
9
Cairns
Towns
ville
Macka
y
Rockh
ampto
n
Gladsto
ne
Wide
Bay
Emerald
Sunsh
ine C
oast
Brisba
ne
Gold C
oast
Toow
oomba
Stage of Property Cycle Peak of Market
Starting to Decline
Approaching Peak
Declining Market
Approaching Bottom
Rising Market
Bottom of Market Start of Recovery
0
1
2
3
4
5
6
Cairns
Towns
ville
Macka
y
Rockh
ampto
n
Gladsto
ne
Wide
Bay
Emerald
Sunsh
ine C
oast
Brisba
ne
Gold C
oast
Toow
oomba
Local Economic Situation
Severe Contraction
Contraction
Flat
Steady Growth
High Growth

© Herron Todd White Copyright 2018
Mar
ket
Indi
cato
rs
85
1
Month in ReviewAugust 2018
SA, NT and WA Property Market Indicators - HousesSA, NT and WA Property Market Indicators - Houses
Factor Adelaide Adelaide Hills Barossa Valley
Iron Triangle Mount Gambier
Alice Springs Darwin Perth South West WA
Rental Vacancy Situation Balanced market Balanced market Balanced market
Balanced market
Balanced market Balanced market Over-supply of available property relative to demand
Balanced market Balanced market
Rental Vacancy Trend Steady Steady Steady Steady Steady Steady Steady Tightening Steady
Demand for New Houses Fair Fair Fair Fair Fair Fair Soft Soft Fair
Trend in New House Construction Increasing Increasing strongly
Increasing Increasing Steady Steady Declining Declining Declining
Volume of House Sales Steady Steady Steady Steady Increasing Steady Steady Steady Declining
Stage of Property Cycle Rising market Rising market Rising market Rising market Rising market Bottom of market Bottom of market Bottom of market Bottom of market
Are New Properties Sold at Prices Exceeding Their Potential Resale Value
Occasionally Occasionally Occasionally Occasionally Occasionally Almost never Occasionally Occasionally Almost never
Red entries indicate change from 3 months ago to a higher risk-rating Blue entries indicate change from 3 months ago to a lower risk-rating
0
1
2
3
4
5
6
Adelai
de
Adelai
de H
ills
Baross
a Vall
ey
Iron T
riang
le
Mount
Gambie
r
Alice S
pring
s
Darwin
Perth
South
West W
A
Rental Vacancy Trend
Increasing Sharply
Increasing
Steady
Tightening
Tightening Sharply
0
1
2
3
4
5
6
7
8
9
Adelai
de
Adelai
de H
ills
Baross
a Vall
ey
Iron T
riang
le
Mount
Gambie
r
Alice S
pring
s
Darwin
Perth
South
West W
A
Stage of Property Cycle Peak of Market
Starting to Decline
Approaching Peak
Declining Market
Approaching Bottom
Rising Market
Bottom of Market Start of Recovery
0
1
2
3
4
5
6
Adelai
de
Adelai
de H
ills
Baross
a Vall
ey
Iron T
riang
le
Mount
Gambie
r
Alice S
pring
s
Darwin
Perth
South
West W
A
Demand for New Houses
Very Soft
Soft
Fair
Strong
Very Strong

© Herron Todd White Copyright 2018
Mar
ket
Indi
cato
rs
86
1
Month in ReviewAugust 2018
SA, NT and WA Property Market Indicators - UnitsSA, NT and WA Property Market Indicators – Units
Factor Adelaide Adelaide Hills Barossa Valley Iron Triangle
Mount Gambier Alice Springs Darwin Perth
South West WA
Rental Vacancy Situation Balanced market Balanced market Balanced market
Balanced market
Balanced market Balanced market Large over-supply of available property relative to demand
Over-supply of available property relative to demand
Shortage of available property relative to demand
Rental Vacancy Trend Steady Steady Steady Steady Steady Steady Increasing Steady Tightening
Demand for New Units Fair Fair Fair Fair Soft Fair Very soft Soft Fair
Trend in New Unit Construction Increasing Increasing Steady Increasing Steady Steady Declining significantly
Declining Declining
Volume of Unit Sales Steady Steady Steady Steady Increasing Steady Declining Steady Declining
Stage of Property Cycle Bottom of market Bottom of market Bottom of market
Bottom of market
Rising market Bottom of market Bottom of market Declining market Bottom of market
Are New Properties Sold at Prices Exceeding Their Potential Resale Value
Occasionally Occasionally Occasionally Occasionally Occasionally Almost never Very frequently Occasionally Almost never
Red entries indicate change from 3 months ago to a higher risk-rating Blue entries indicate change from 3 months ago to a lower risk-rating
0
1
2
3
4
5
6
Adelai
de
Adelai
de H
ills
Baross
a Vall
ey
Iron T
riang
le
Mount
Gambie
r
Alice S
pring
s
Darwin
Perth
South
West W
A
Rental Vacancy Trend
Increasing Sharply
Increasing
Steady
Tightening
Tightening Sharply
0
1
2
3
4
5
6
7
8
9
Adelai
de
Adelai
de H
ills
Baross
a Vall
ey
Iron T
riang
le
Mount
Gambie
r
Alice S
pring
s
Darwin
Perth
South
West W
A
Stage of Property Cycle Peak of Market
Starting to Decline
Approaching Peak
Declining Market
Approaching Bottom
Rising Market
Bottom of Market Start of Recovery
0
1
2
3
4
5
6
Adelai
de
Adelai
de H
ills
Baross
a Vall
ey
Iron T
riang
le
Mount
Gambie
r
Alice S
pring
s
Darwin
Perth
South
West W
A
Demand for New Units
Very Soft
Soft
Fair
Strong
Very Strong

© Herron Todd White Copyright 2018
Mar
ket
Indi
cato
rs
87
1
Month in ReviewAugust 2018
SA, NT and WA Property Market Indicators - OfficeSA, NT and WA Property Market Indicators – Office Factor Adelaide Alice Springs Darwin Perth South West WA
Rental Vacancy Situation Over-supply of available property relative to demand
Over-supply of available property relative to demand
Over-supply of available property relative to demand
Large over-supply of available property relative to demand
Over-supply of available property relative to demand
Rental Vacancy Trend Steady Steady Steady Steady Increasing
Rental Rate Trend Stable Declining Stable Stable Declining
Volume of Property Sales Steady Steady Steady Increasing Declining
Stage of Property Cycle Start of recovery Declining market Bottom of market Bottom of market Approaching bottom of market
Local Economic Situation Flat Flat Severe contraction Steady growth Contraction
Value Difference between Quality Properties with National Tenants, and Comparable Properties with Local Tenants
Significant Small Large Large Small
Red entries indicate change from 3 months ago to a higher risk-rating Blue entries indicate change from 3 months ago to a lower risk-rating
0
1
2
3
4
5
6
Adelai
de
Alice S
pring
s
Darwin
Perth
South
West W
A
Rental Vacancy Trend
Increasing Sharply
Increasing
Steady
Tightening
Tightening Sharply
0
1
2
3
4
5
6
7
8
9
Adelai
de
Alice S
pring
s
Darwin
Perth
South
West W
A
Stage of Property Cycle Peak of Market
Starting to Decline
Approaching Peak
Declining Market
Approaching Bottom
Rising Market
Bottom of Market Start of Recovery
0
1
2
3
4
5
6
Adelai
de
Alice S
pring
s
Darwin
Perth
South
West W
A
Local Economic Situation
Severe Contraction
Contraction
Flat
Steady Growth
High Growth

Telephone 1300 880 [email protected]
Local expertise. National strength. Trusted solutions.Herron Todd White is Australia’s leading independent property valuation and advisory group. For more than 50 years, we’ve helped our customers make the most of their property assets by providing sound valuations and insightful analytical advice.
With offices in every capital city, most regional centres and right across rural Australia, we are where you are. Our valuers work in the property market every day, providing professional services for all classes of property including commercial, industrial, retail, rural and residential.
Herron Todd White is Australian owned and operated. With directors who are owners in the business, our team has a personal stake in providing you with the best service possible.
Liability limited by a scheme approved under Professional Standards Legislation.