august 2021 - s1.q4cdn.com
TRANSCRIPT
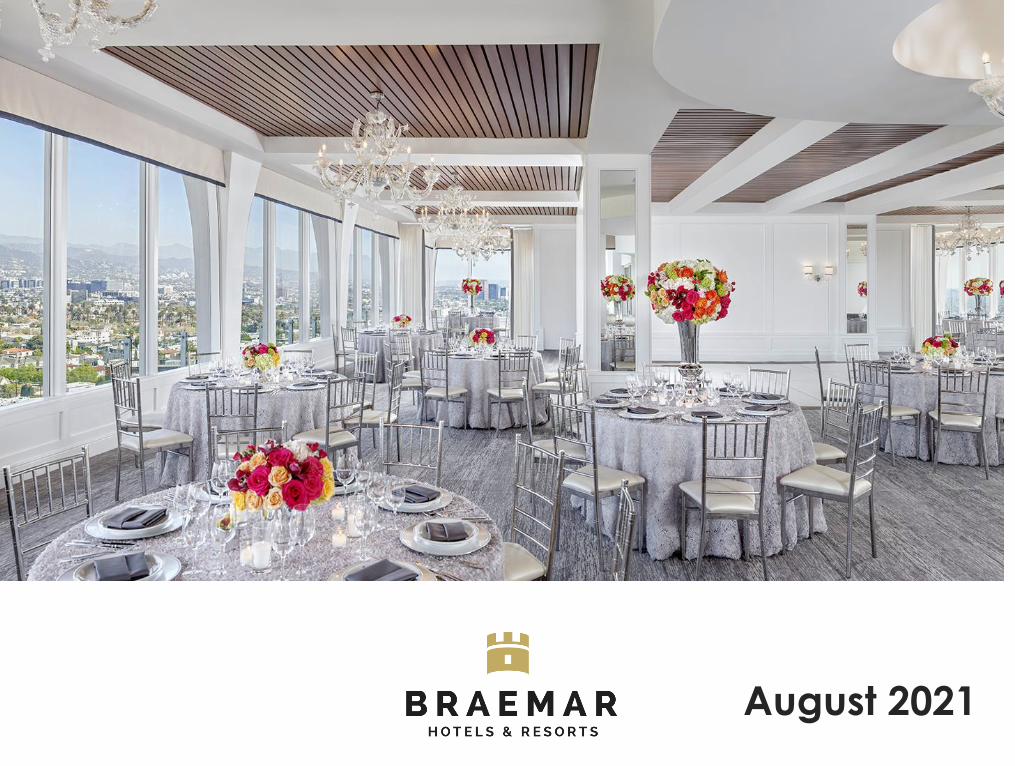
August 2021
Company Presentation | August 2021 2
Forward Looking Statements and Non-GAAP
MeasuresIn keeping with the SEC's "Safe Harbor" guidelines, certain statements made during this presentation could be considered forward-looking and subject to certain risks and uncertainties that
could cause results to differ materially from those projected. When we use the words "will likely result," "may," "anticipate," "estimate," "should," "expect," "believe," "intend," or similar expressions,
we intend to identify forward-looking statements. Such forward-looking statements include, but are not limited to, our business and investment strategy, our understanding of our competition,
current market trends and opportunities, projected operating results, and projected capital expenditures.
These forward-looking statements are subject to known and unknown risks and uncertainties, which could cause actual results to differ materially from those anticipated including, without
limitation: general volatility of the capital markets and the market price of our common stock; changes in our business or investment strategy; availability, terms and deployment of capital;
availability of qualified personnel; changes in our industry and the market in which we operate, interest rates or the general economy, the degree and nature of our competition, legislative
and regulatory changes, including changes to the Internal Revenue Code of 1986, as amended (the “Code”), and related rules, regulations and interpretations governing the taxation of REITs;
and limitations imposed on our business and our ability to satisfy complex rules in order for us to qualify as a REIT for federal income tax purposes. These and other risk factors are more fully
discussed in the company's filings with the Securities and Exchange Commission.
EBITDA is defined as net income (loss) before interest expense and amortization of loan costs, depreciation and amortization, income taxes, equity in (earnings) loss of unconsolidated entity
and after the Company’s portion of EBITDA of OpenKey. In addition, we excluded impairment on real estate, (gain) loss on insurance settlement and disposition of assets and Company’s
portion of EBITDA of OpenKey from EBITDA to calculate EBITDA for real estate, or EBITDAre, as defined by NAREIT. EBITDA yield is defined as trailing twelve month EBITDA divided by the purchase
price or debt amount. A capitalization rate is determined by dividing the property's net operating income by the purchase price. Net operating income is the property's Hotel EBITDA minus a
capital expense reserve of either 4% or 5% of gross revenues. Hotel EBITDA flow-through is the change in Hotel EBITDA divided by the change in total revenues. EBITDA, FFO, AFFO, CAD and
other terms are non-GAAP measures, reconciliations of which have been provided in prior earnings releases and filings with the SEC or in the appendix to this presentation.
The calculation of implied equity value is derived from an estimated blended capitalization rate (“Cap Rate”) for the entire portfolio using the capitalization rate method. The estimated Cap
Rate is based on recent Cap Rates of publically traded peers involving a similar blend of asset types found in the portfolio, which is then applied to Net Operating Income (“NOI”) of the
company’s assets to calculate a Total Enterprise Value (“TEV”) of the company. From the TEV, we deduct debt and preferred equ ity and then add back working capital to derive an equity
value. The capitalization rate method is one of several valuation methods for estimating asset value and implied equity value. Among the limitations of using the capitalization rate method for
determining an implied equity value are that it does not take into account the potential change or variability in future cash flows, potential significant future capital expenditures, the intended
hold period of the asset, or a change in the future risk profile of an asset.
This overview is for informational purposes only and is not an offer to sell, or a solicitation of an offer to buy or sell, any securities of Braemar Hotels & Resorts Inc. or any of its respective affiliates,
and may not be relied upon in connection with the purchase or sale of any such security.
Our business has been and will continue to be materially adversely affected by the impact of, and the public perception of a risk of, a pandemic disease. In December 2019, a novel strain of
coronavirus (COVID-19) was identified in Wuhan, China, which has subsequently spread to other regions of the world, and has resulted in increased travel restrictions and extended shutdown
of certain businesses in affected regions, including in nearly every state in the United States. Since late February, we have experienced a significant decline in occupancy and RevPAR and we
expect the significant occupancy and RevPAR reduction associated with the novel coronavirus (COVID-19) to likely continue as we are recording significant reservation cancellations as well
as a significant reduction in new reservations relative to prior expectations. The continued outbreak of the virus in the U.S. has and will likely continue to further reduce travel and demand at
our hotels. The prolonged occurrence of the virus has resulted in health or other government authorities imposing widespread restrictions on travel or other market impacts. The hotel industry
and our portfolio have and we expect will continue to experience the postponement or cancellation of a significant number of business conferences and similar events. At this time those
restrictions are very fluid and evolving. We have been and will continue to be negatively impacted by those restrictions. Given that the type, degree and length of such restrictions are not
known at this time, we cannot predict the overall impact of such restrictions on us or the overall economic environment. In addition, even after the restrictions are lifted, the propensity of
people to travel and for businesses to hold conferences will likely remain below historical levels for an additional period of time that is difficult to predict. We may also face increased risk of
litigation if we have guests or employees who become ill due to COVID-19.
As such, the impact these restrictions may have on our financial position, operating results and liquidity cannot be reasonably estimated at this time, but the impact will likely be material.
Additionally, the public perception of a risk of a pandemic or media coverage of these diseases, or public perception of health risks linked to perceived regional food and beverage safety
has materially further adversely affected us by reducing demand for our hotels. These events have resulted in a sustained, significant drop in demand for our hotels and could have a material
adverse effect on us.
Prior to investing in Braemar, potential investors should carefully review Braemar’s periodic filings with the Securities and Exchange Commission, including, but not limited to, Braemar’s most
current Form 10-K, Form 10-Q and Form 8-K’s, including the risk factors included therein.

Company Presentation | August 2021 3
Management Team
24 years of hospitality
experience
5 years with the Company
15 years with Morgan Stanley
Cornell School of Hotel
Administration BS
University of Pennsylvania
MBA
RICHARD J. STOCKTON
Chief Executive Officer & President
21 years of hospitality
experience
18 years with the Company
3 years with ClubCorp
CFA charterholder
Southern Methodist University
BBA
DERIC S. EUBANKS, CFAChief Financial Officer
16 years of hospitality
experience
11 years with the Company (5
years with the Company’s
predecessor)
5 years with Stephens
Investment Bank
Oklahoma State University BS
JEREMY J. WELTER
Chief Operating Officer
Company Presentation | August 2021 4
BHR Market Position and Strategy Signal Sharp
Recovery
Market Outlook: Recovery Favors Luxury Resorts
BHR Portfolio: Taking Advantage of Strategic Asset Class
Recent Results & Developments
Balance Sheet Strategy
Ritz-Carlton Sarasota

Market Outlook Recovery Favors Luxury Resort Assets
Company Presentation | August 2021 6
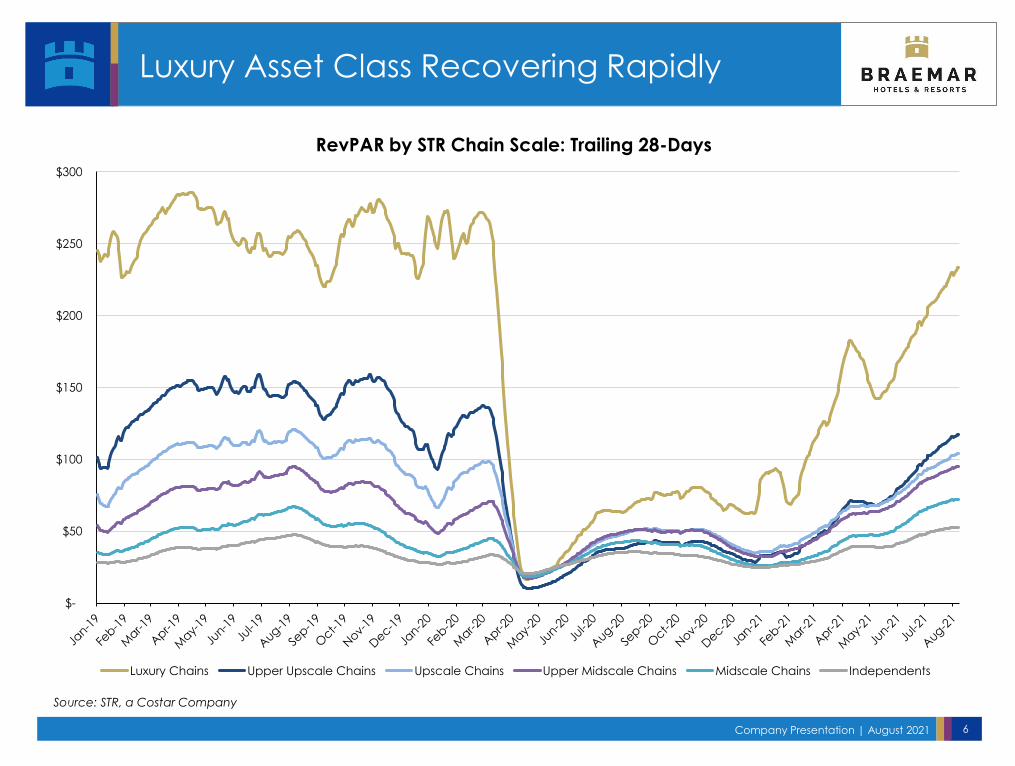
Luxury Asset Class Recovering Rapidly
$-
$50
$100
$150
$200
$250
$300
RevPAR by STR Chain Scale: Trailing 28-Days
Luxury Chains Upper Upscale Chains Upscale Chains Upper Midscale Chains Midscale Chains Independents
Source: STR, a Costar Company
Company Presentation | August 2021 7
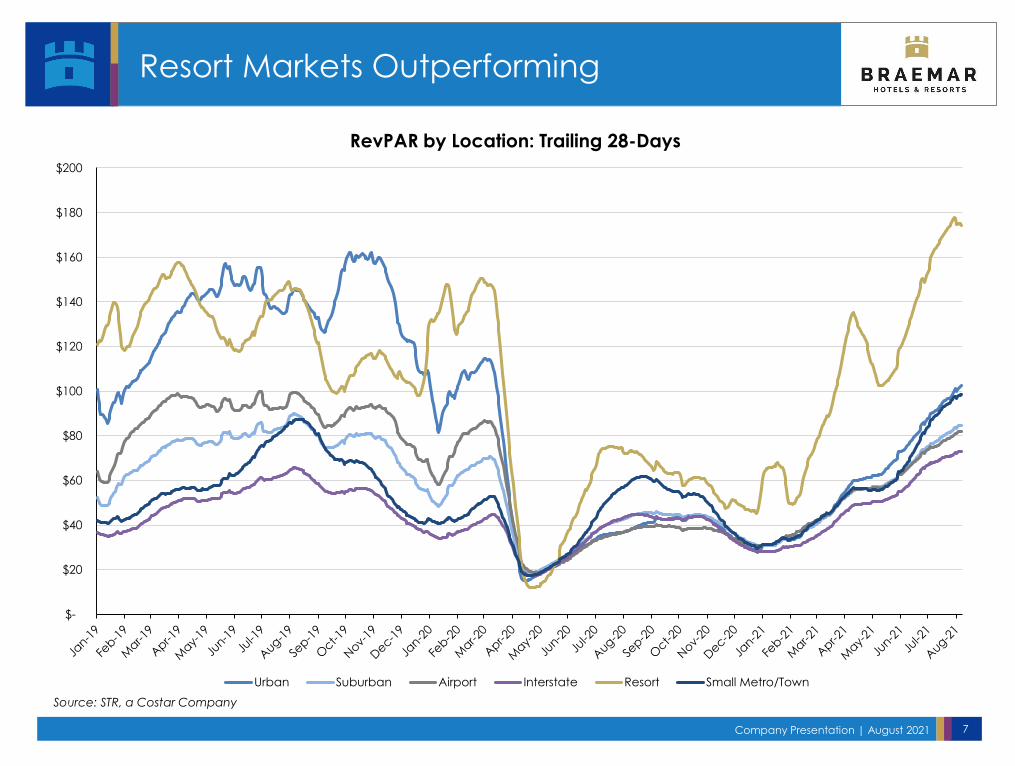
Resort Markets Outperforming
Source: STR, a Costar Company
$-
$20
$40
$60
$80
$100
$120
$140
$160
$180
$200
RevPAR by Location: Trailing 28-Days
Urban Suburban Airport Interstate Resort Small Metro/Town
BHR Portfolio Taking Advantage of Strategic Asset Class
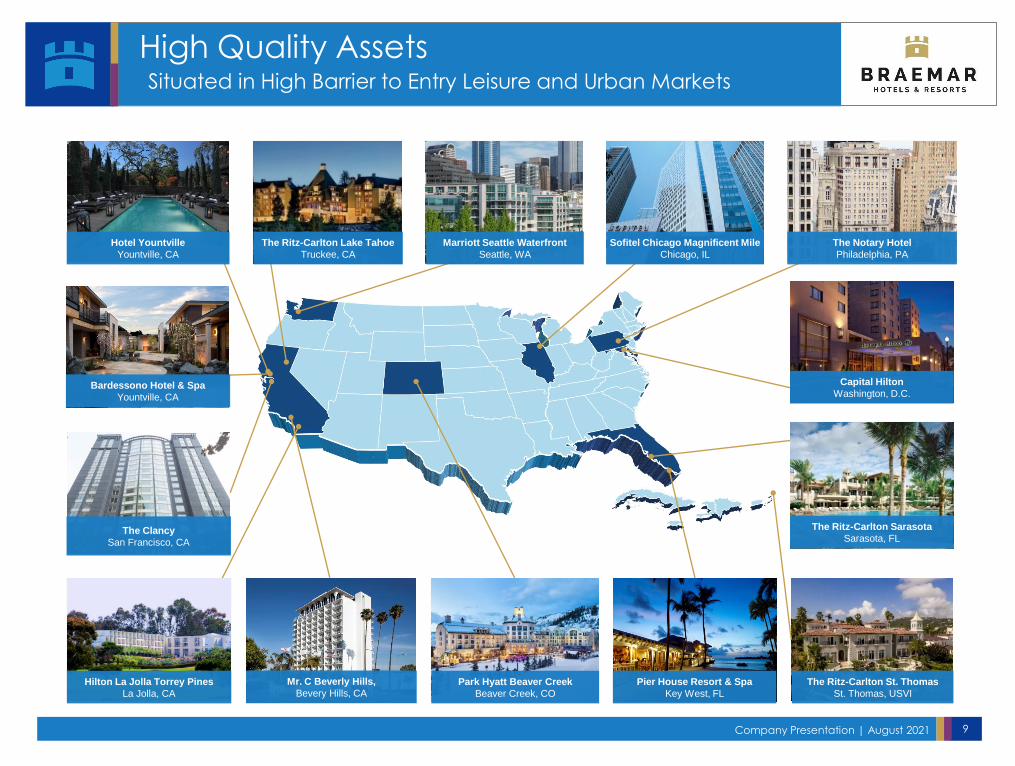
Company Presentation | August 2021 9
The Ritz-Carlton Lake Tahoe
Truckee, CA
Hotel Yountville
Yountville, CA
Marriott Seattle Waterfront
Seattle, WA
Sofitel Chicago Magnificent Mile
Chicago, IL
The Notary Hotel
Philadelphia, PA
Bardessono Hotel & Spa
Yountville, CA
The Clancy
San Francisco, CA
Hilton La Jolla Torrey Pines
La Jolla, CA
Park Hyatt Beaver Creek
Beaver Creek, CO
Pier House Resort & Spa
Key West, FL
The Ritz-Carlton St. Thomas
St. Thomas, USVI
The Ritz-Carlton Sarasota
Sarasota, FL
Capital Hilton
Washington, D.C.
High Quality AssetsSituated in High Barrier to Entry Leisure and Urban Markets
Mr. C Beverly Hills,
Bevery Hills, CA
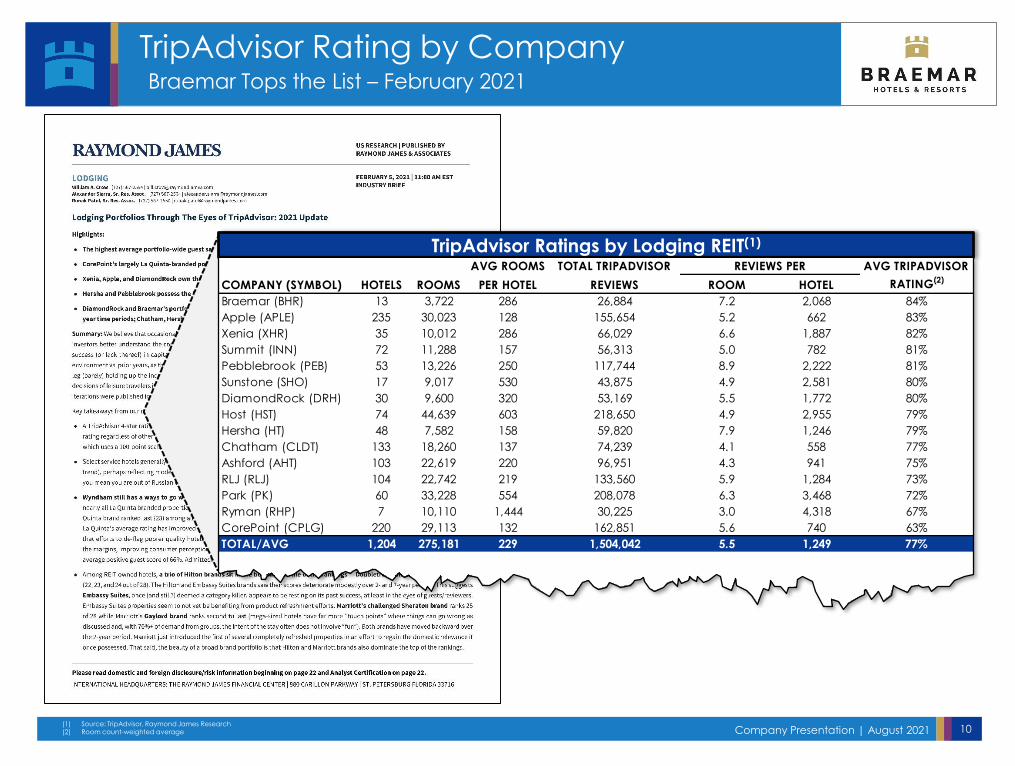
Company Presentation | August 2021 10(1) Source: TripAdvisor, Raymond James Research(2) Room count-weighted average
TripAdvisor Ratings by Lodging REIT(1)
AVG ROOMS TOTAL TRIPADVISOR REVIEWS PER AVG TRIPADVISOR
COMPANY (SYMBOL) HOTELS ROOMS PER HOTEL REVIEWS ROOM HOTEL RATING(2)
Braemar (BHR) 13 3,722 286 26,884 7.2 2,068 84%
Apple (APLE) 235 30,023 128 155,654 5.2 662 83%
Xenia (XHR) 35 10,012 286 66,029 6.6 1,887 82%
Summit (INN) 72 11,288 157 56,313 5.0 782 81%
Pebblebrook (PEB) 53 13,226 250 117,744 8.9 2,222 81%
Sunstone (SHO) 17 9,017 530 43,875 4.9 2,581 80%
DiamondRock (DRH) 30 9,600 320 53,169 5.5 1,772 80%
Host (HST) 74 44,639 603 218,650 4.9 2,955 79%
Hersha (HT) 48 7,582 158 59,820 7.9 1,246 79%
Chatham (CLDT) 133 18,260 137 74,239 4.1 558 77%
Ashford (AHT) 103 22,619 220 96,951 4.3 941 75%
RLJ (RLJ) 104 22,742 219 133,560 5.9 1,284 73%
Park (PK) 60 33,228 554 208,078 6.3 3,468 72%
Ryman (RHP) 7 10,110 1,444 30,225 3.0 4,318 67%
CorePoint (CPLG) 220 29,113 132 162,851 5.6 740 63%
TOTAL/AVG 1,204 275,181 229 1,504,042 5.5 1,249 77%
TripAdvisor Rating by CompanyBraemar Tops the List – February 2021
Company Presentation | August 2021 11
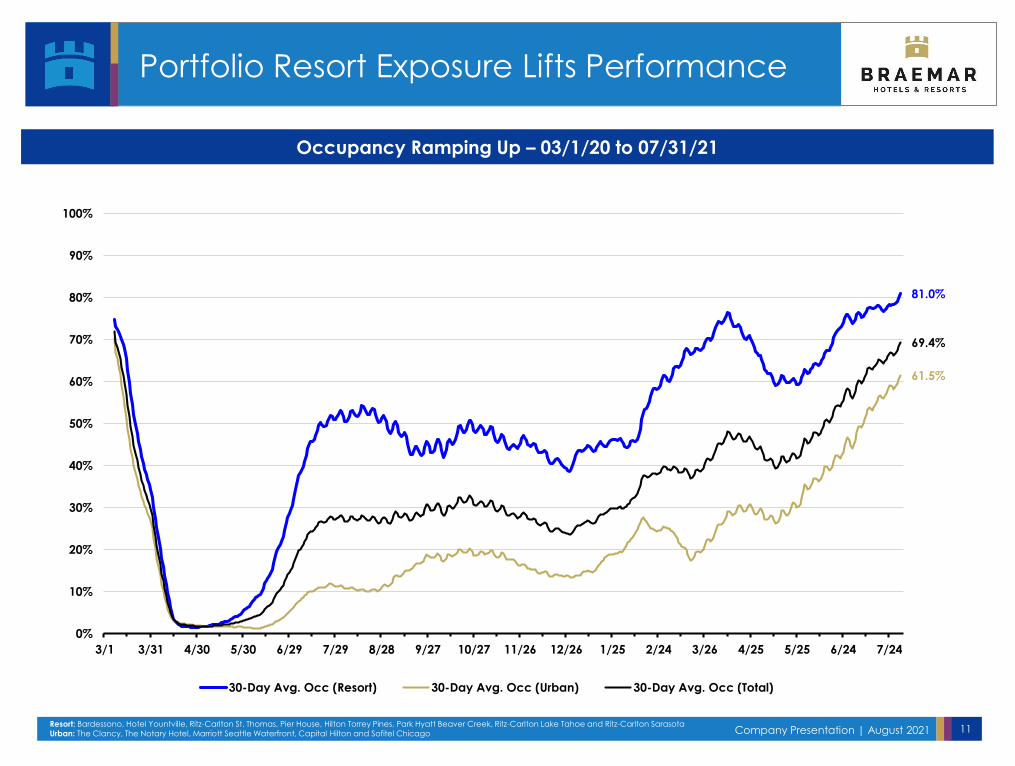
Portfolio Resort Exposure Lifts Performance
Occupancy Ramping Up – 03/1/20 to 07/31/21
Resort: Bardessono, Hotel Yountville, Ritz-Carlton St. Thomas, Pier House, Hilton Torrey Pines, Park Hyatt Beaver Creek, Ritz-Carlton Lake Tahoe and Ritz-Carlton Sarasota
Urban: The Clancy, The Notary Hotel, Marriott Seattle Waterfront, Capital Hilton and Sofitel Chicago
81.0%
61.5%
69.4%
0%
10%
20%
30%
40%
50%
60%
70%
80%
90%
100%
3/1 3/31 4/30 5/30 6/29 7/29 8/28 9/27 10/27 11/26 12/26 1/25 2/24 3/26 4/25 5/25 6/24 7/24
30-Day Avg. Occ (Resort) 30-Day Avg. Occ (Urban) 30-Day Avg. Occ (Total)
Company Presentation | August 2021 12
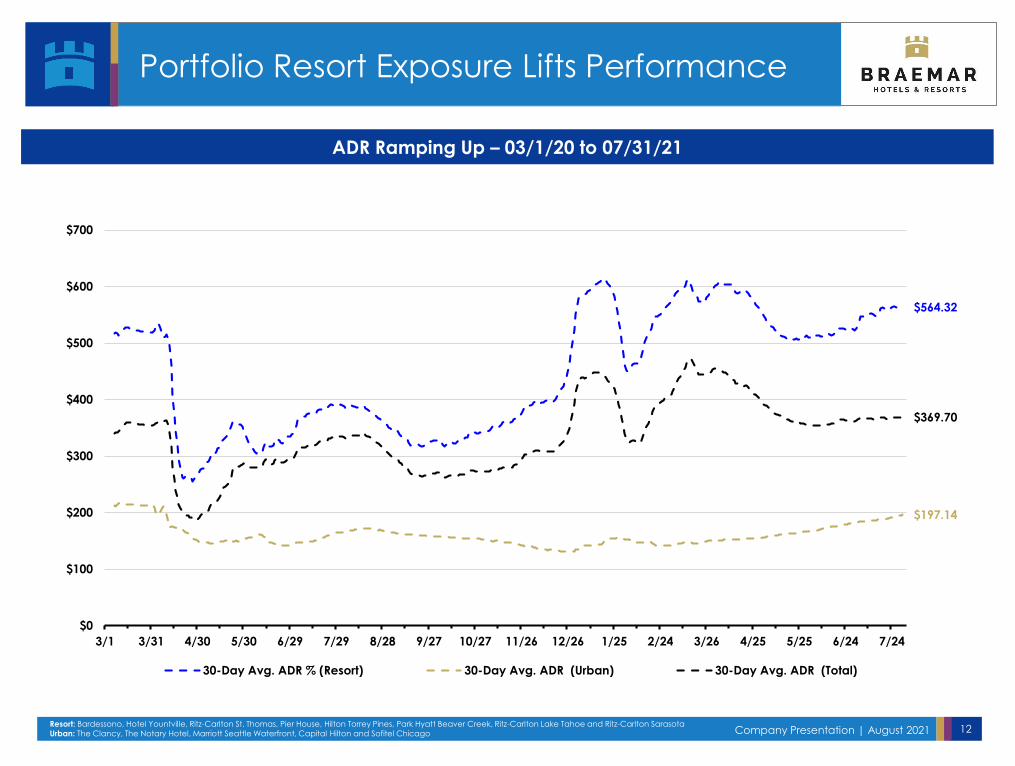
Portfolio Resort Exposure Lifts Performance
ADR Ramping Up – 03/1/20 to 07/31/21
Resort: Bardessono, Hotel Yountville, Ritz-Carlton St. Thomas, Pier House, Hilton Torrey Pines, Park Hyatt Beaver Creek, Ritz-Carlton Lake Tahoe and Ritz-Carlton Sarasota
Urban: The Clancy, The Notary Hotel, Marriott Seattle Waterfront, Capital Hilton and Sofitel Chicago
$564.32
$197.14
$369.70
$0
$100
$200
$300
$400
$500
$600
$700
3/1 3/31 4/30 5/30 6/29 7/29 8/28 9/27 10/27 11/26 12/26 1/25 2/24 3/26 4/25 5/25 6/24 7/24
30-Day Avg. ADR % (Resort) 30-Day Avg. ADR (Urban) 30-Day Avg. ADR (Total)
Company Presentation | August 2021 13
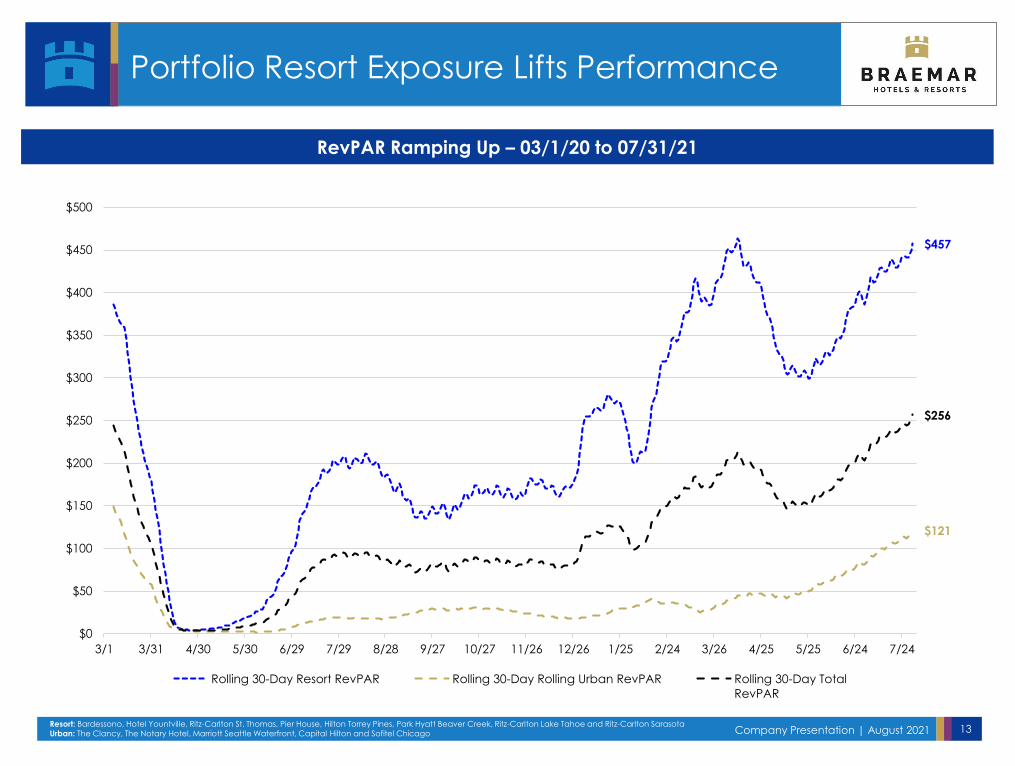
RevPAR Ramping Up – 03/1/20 to 07/31/21
Resort: Bardessono, Hotel Yountville, Ritz-Carlton St. Thomas, Pier House, Hilton Torrey Pines, Park Hyatt Beaver Creek, Ritz-Carlton Lake Tahoe and Ritz-Carlton Sarasota
Urban: The Clancy, The Notary Hotel, Marriott Seattle Waterfront, Capital Hilton and Sofitel Chicago
Portfolio Resort Exposure Lifts Performance
$457
$121
$256
$0
$50
$100
$150
$200
$250
$300
$350
$400
$450
$500
3/1 3/31 4/30 5/30 6/29 7/29 8/28 9/27 10/27 11/26 12/26 1/25 2/24 3/26 4/25 5/25 6/24 7/24
Rolling 30-Day Resort RevPAR Rolling 30-Day Rolling Urban RevPAR Rolling 30-Day Total
RevPAR
Company Presentation | August 2021 14
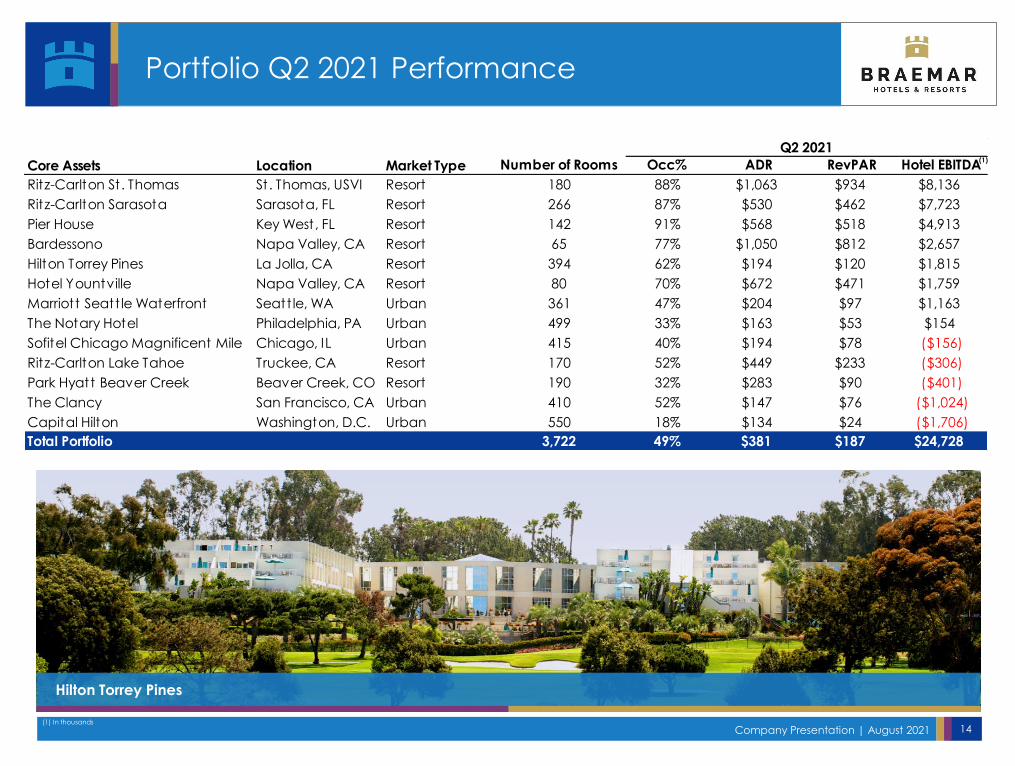
Q2 2021
Core Assets Location Market Type Number of Rooms Occ% ADR RevPAR Hotel EBITDA
Ritz-Carlton St. Thomas St. Thomas, USVI Resort 180 88% $1,063 $934 $8,136
Ritz-Carlton Sarasota Sarasota, FL Resort 266 87% $530 $462 $7,723
Pier House Key West, FL Resort 142 91% $568 $518 $4,913
Bardessono Napa Valley, CA Resort 65 77% $1,050 $812 $2,657
Hilton Torrey Pines La Jolla, CA Resort 394 62% $194 $120 $1,815
Hotel Yountville Napa Valley, CA Resort 80 70% $672 $471 $1,759
Marriott Seatt le Waterfront Seatt le, WA Urban 361 47% $204 $97 $1,163
The Notary Hotel Philadelphia, PA Urban 499 33% $163 $53 $154
Sofitel Chicago Magnificent Mile Chicago, IL Urban 415 40% $194 $78 ($156)
Ritz-Carlton Lake Tahoe Truckee, CA Resort 170 52% $449 $233 ($306)
Park Hyatt Beaver Creek Beaver Creek, CO Resort 190 32% $283 $90 ($401)
The Clancy San Francisco, CA Urban 410 52% $147 $76 ($1,024)
Capital Hilton Washington, D.C. Urban 550 18% $134 $24 ($1,706)
Total Portfolio 3,722 49% $381 $187 $24,728
Portfolio Q2 2021 Performance
Hilton Torrey Pines
(1) In thousands
(1)
Company Presentation | August 2021 15
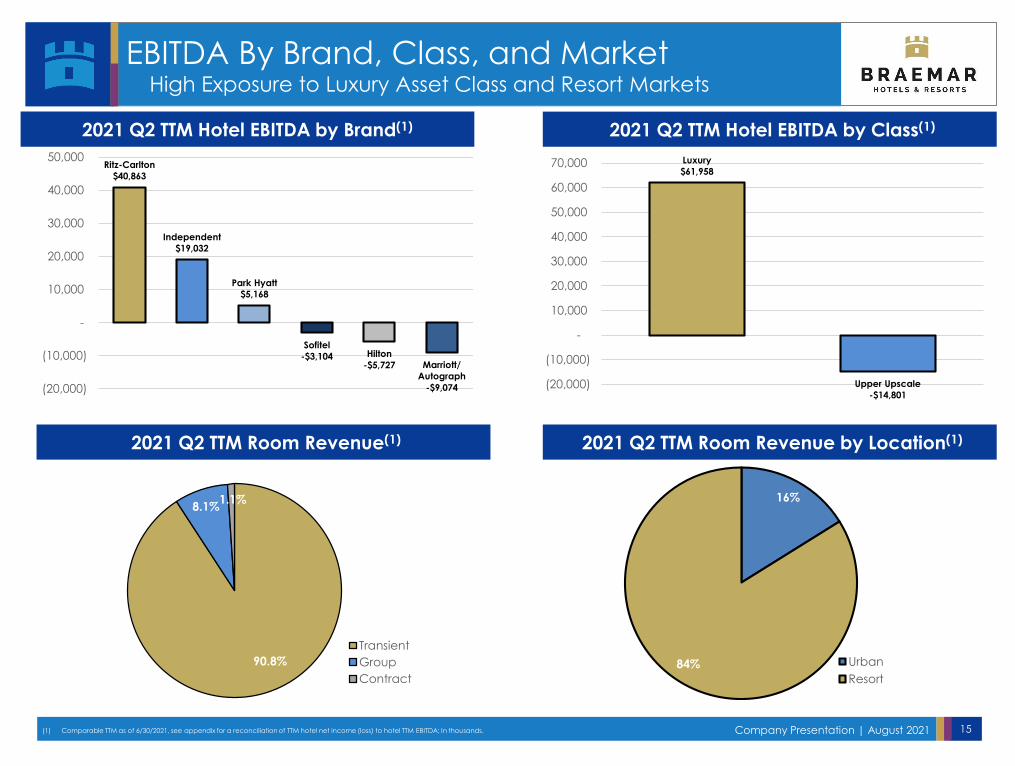
EBITDA By Brand, Class, and Market
2021 Q2 TTM Hotel EBITDA by Brand(1) 2021 Q2 TTM Hotel EBITDA by Class(1)
(1) Comparable TTM as of 6/30/2021, see appendix for a reconciliation of TTM hotel net income (loss) to hotel TTM EBITDA; In thousands.
2021 Q2 TTM Room Revenue(1) 2021 Q2 TTM Room Revenue by Location(1)
Ritz-Carlton
$40,863
Independent
$19,032
Park Hyatt
$5,168
Sofitel
-$3,104 Hilton
-$5,727 Marriott/
Autograph
-$9,074 (20,000)
(10,000)
-
10,000
20,000
30,000
40,000
50,000 Luxury
$61,958
Upper Upscale
-$14,801 (20,000)
(10,000)
-
10,000
20,000
30,000
40,000
50,000
60,000
70,000
High Exposure to Luxury Asset Class and Resort Markets
16%
84% Urban
Resort
90.8%
8.1%1.1%
Transient
Group
Contract
Company Presentation | August 2021 16
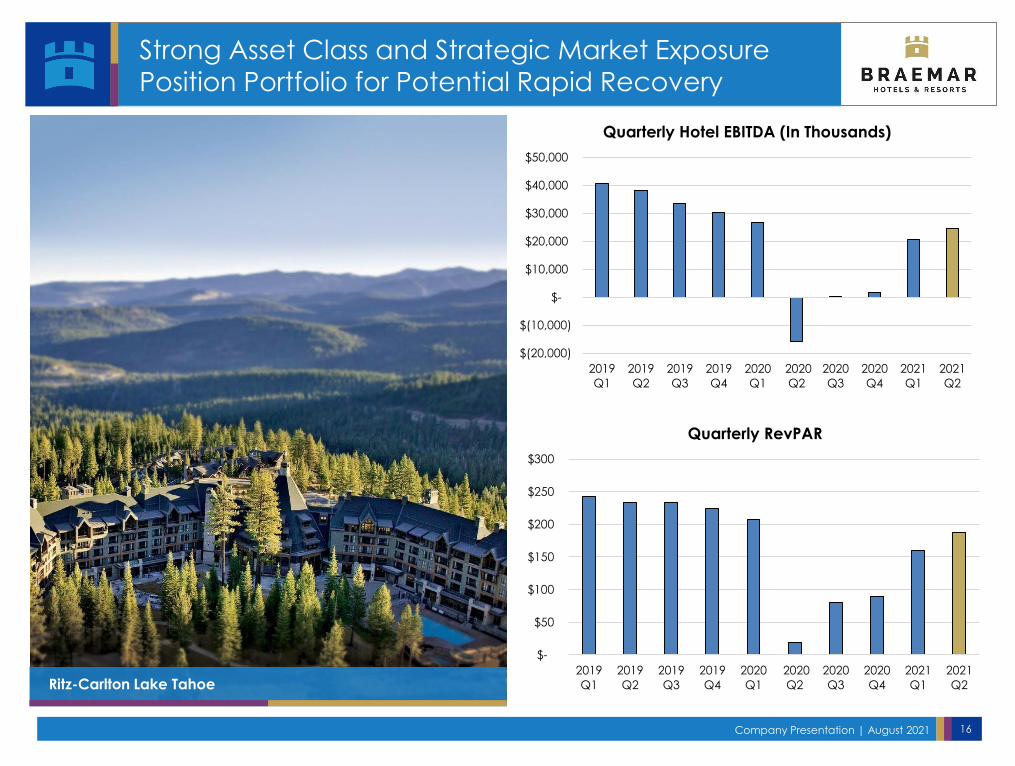
Strong Asset Class and Strategic Market Exposure
Position Portfolio for Potential Rapid Recovery
Ritz-Carlton Lake Tahoe
$(20,000)
$(10,000)
$-
$10,000
$20,000
$30,000
$40,000
$50,000
2019
Q1
2019
Q2
2019
Q3
2019
Q4
2020
Q1
2020
Q2
2020
Q3
2020
Q4
2021
Q1
2021
Q2
Quarterly Hotel EBITDA (In Thousands)
$-
$50
$100
$150
$200
$250
$300
2019
Q1
2019
Q2
2019
Q3
2019
Q4
2020
Q1
2020
Q2
2020
Q3
2020
Q4
2021
Q1
2021
Q2
Quarterly RevPAR
Company Presentation | August 2021 17
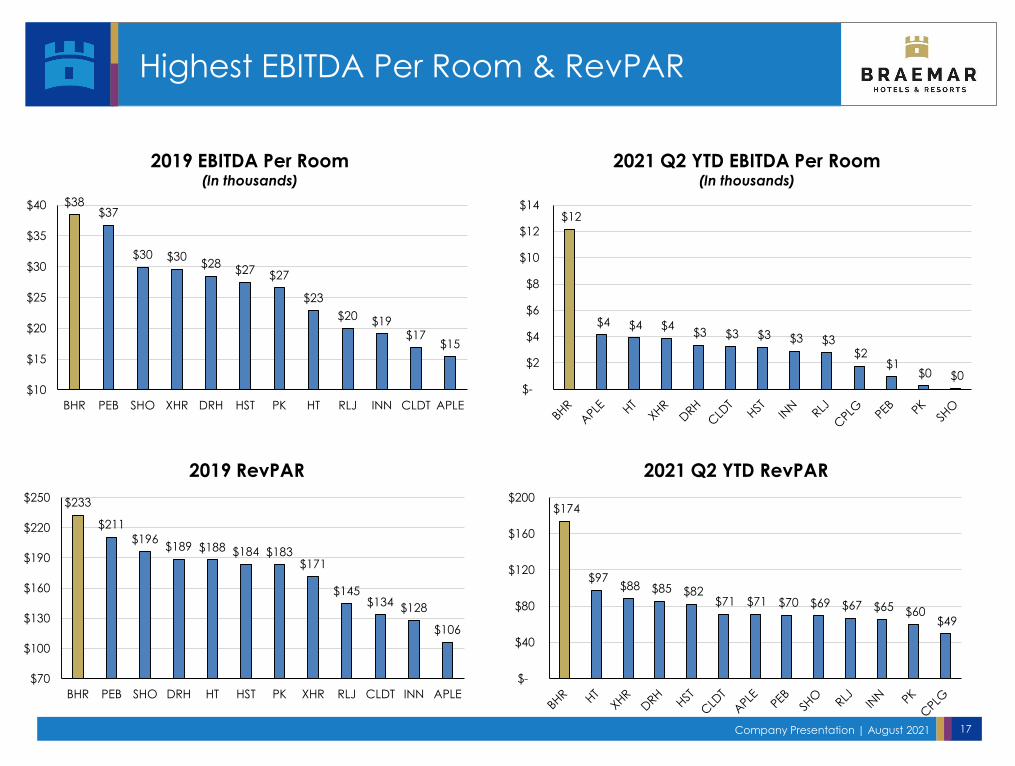
Highest EBITDA Per Room & RevPAR
$38$37
$30 $30$28
$27 $27
$23
$20 $19$17
$15
$10
$15
$20
$25
$30
$35
$40
BHR PEB SHO XHR DRH HST PK HT RLJ INN CLDT APLE
2019 EBITDA Per Room (In thousands)
$233
$211
$196$189 $188 $184 $183
$171
$145$134 $128
$106
$70
$100
$130
$160
$190
$220
$250
BHR PEB SHO DRH HT HST PK XHR RLJ CLDT INN APLE
2019 RevPAR
$12
$4 $4 $4 $3 $3 $3 $3 $3
$2 $1
$0 $0 $-
$2
$4
$6
$8
$10
$12
$14
2021 Q2 YTD EBITDA Per Room(In thousands)
$174
$97 $88 $85 $82
$71 $71 $70 $69 $67 $65 $60 $49
$-
$40
$80
$120
$160
$200
2021 Q2 YTD RevPAR
Recent Results & DevelopmentsSolid Q2 Results Signals Sharp Recovery
Company Presentation | August 2021 19
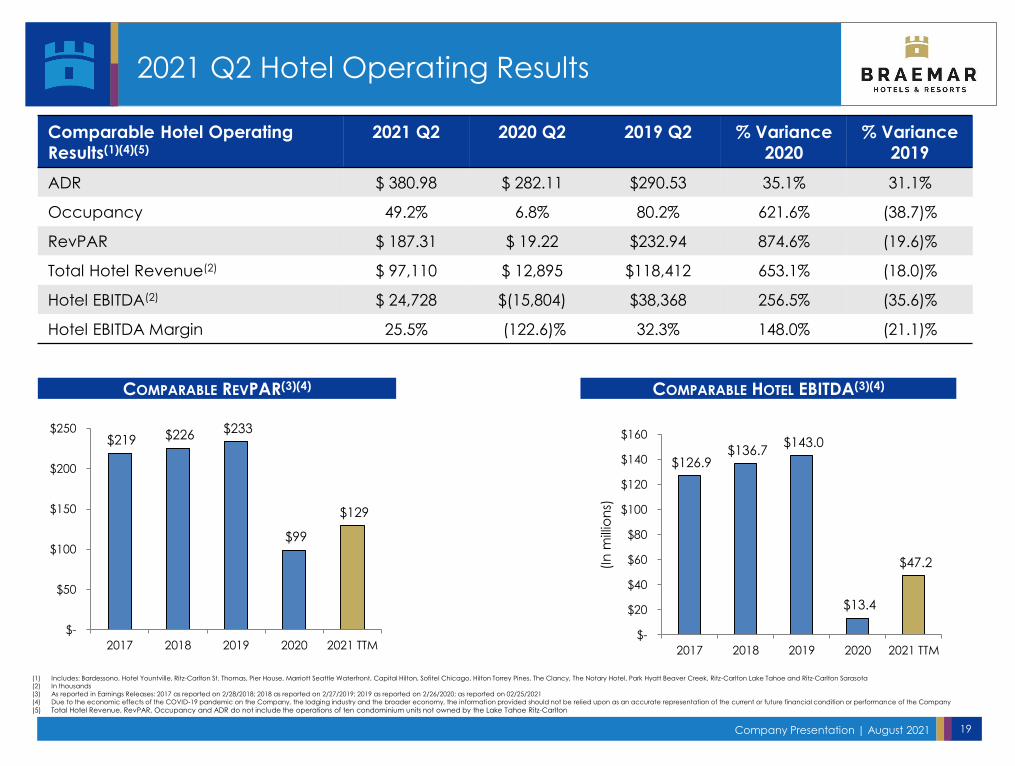
2021 Q2 Hotel Operating Results
Comparable Hotel Operating
Results(1)(4)(5)
2021 Q2 2020 Q2 2019 Q2 % Variance
2020
% Variance
2019
ADR $ 380.98 $ 282.11 $290.53 35.1% 31.1%
Occupancy 49.2% 6.8% 80.2% 621.6% (38.7)%
RevPAR $ 187.31 $ 19.22 $232.94 874.6% (19.6)%
Total Hotel Revenue(2) $ 97,110 $ 12,895 $118,412 653.1% (18.0)%
Hotel EBITDA(2) $ 24,728 $(15,804) $38,368 256.5% (35.6)%
Hotel EBITDA Margin 25.5% (122.6)% 32.3% 148.0% (21.1)%
(1) Includes: Bardessono, Hotel Yountville, Ritz-Carlton St. Thomas, Pier House, Marriott Seattle Waterfront, Capital Hilton, Sofitel Chicago, Hilton Torrey Pines, The Clancy, The Notary Hotel, Park Hyatt Beaver Creek, Ritz-Carlton Lake Tahoe and Ritz-Carlton Sarasota(2) In thousands
(3) As reported in Earnings Releases: 2017 as reported on 2/28/2018; 2018 as reported on 2/27/2019; 2019 as reported on 2/26/2020; as reported on 02/25/2021
(4) Due to the economic effects of the COVID-19 pandemic on the Company, the lodging industry and the broader economy, the information provided should not be relied upon as an accurate representation of the current or future financial condition or performance of the Company
(5) Total Hotel Revenue, RevPAR, Occupancy and ADR do not include the operations of ten condominium units not owned by the Lake Tahoe Ritz-Carlton
COMPARABLE HOTEL EBITDA(3)(4)COMPARABLE REVPAR(3)(4)
$219 $226 $233
$99
$129
$-
$50
$100
$150
$200
$250
2017 2018 2019 2020 2021 TTM
$126.9 $136.7
$143.0
$13.4
$47.2
$-
$20
$40
$60
$80
$100
$120
$140
$160
2017 2018 2019 2020 2021 TTM
(In
mill
ion
s)
Company Presentation | August 2021 20
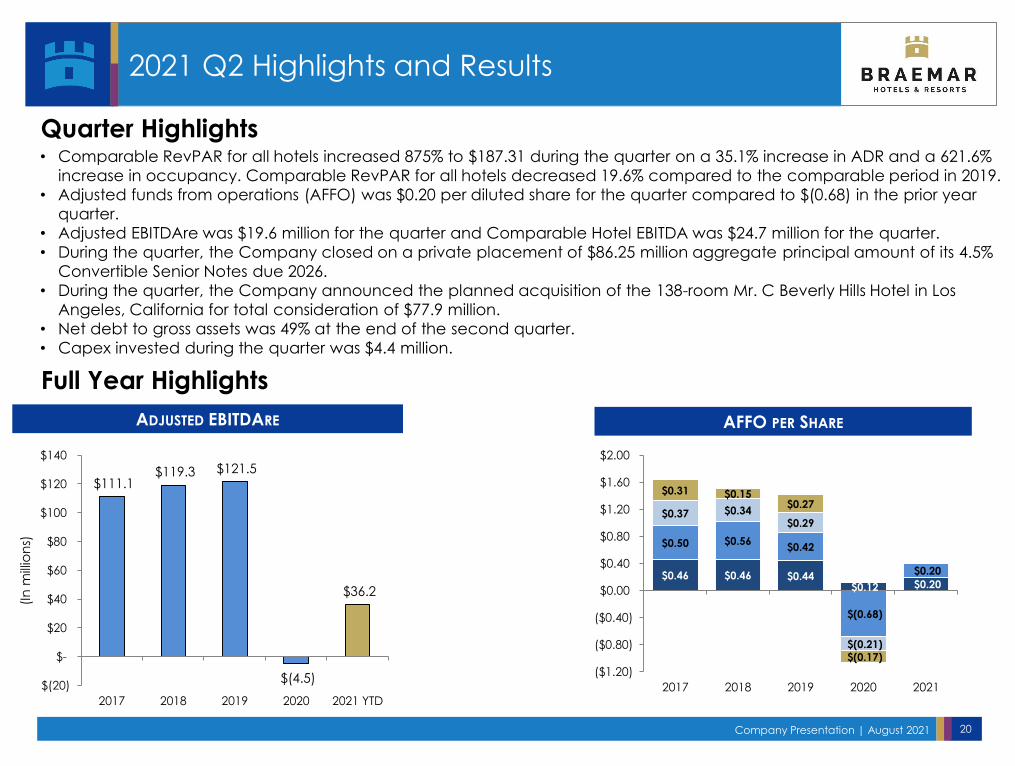
2021 Q2 Highlights and Results
AFFO PER SHAREADJUSTED EBITDARE
Quarter Highlights
Full Year Highlights
$111.1 $119.3 $121.5
$(4.5)
$36.2
$(20)
$-
$20
$40
$60
$80
$100
$120
$140
2017 2018 2019 2020 2021 YTD
(In
mill
ion
s)
$0.46 $0.46 $0.44 $0.12 $0.20
$0.50 $0.56 $0.42
$(0.68)
$0.20
$0.37 $0.34 $0.29
$(0.21)
$0.31 $0.15 $0.27
$(0.17)
($1.20)
($0.80)
($0.40)
$0.00
$0.40
$0.80
$1.20
$1.60
$2.00
2017 2018 2019 2020 2021
• Comparable RevPAR for all hotels increased 875% to $187.31 during the quarter on a 35.1% increase in ADR and a 621.6%
increase in occupancy. Comparable RevPAR for all hotels decreased 19.6% compared to the comparable period in 2019.
• Adjusted funds from operations (AFFO) was $0.20 per diluted share for the quarter compared to $(0.68) in the prior year
quarter.
• Adjusted EBITDAre was $19.6 million for the quarter and Comparable Hotel EBITDA was $24.7 million for the quarter.
• During the quarter, the Company closed on a private placement of $86.25 million aggregate principal amount of its 4.5%
Convertible Senior Notes due 2026.
• During the quarter, the Company announced the planned acquisition of the 138-room Mr. C Beverly Hills Hotel in Los
Angeles, California for total consideration of $77.9 million.
• Net debt to gross assets was 49% at the end of the second quarter.
• Capex invested during the quarter was $4.4 million.
Company Presentation | August 2021 21
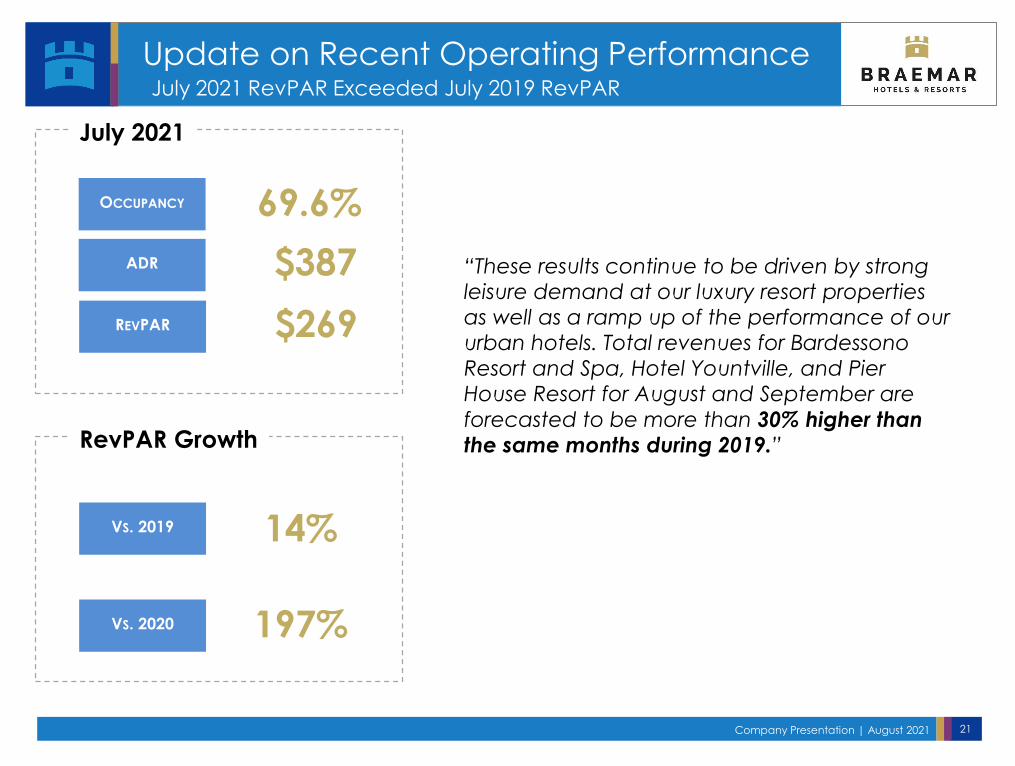
69.6%OCCUPANCY
$387ADR
$269REVPAR
July 2021
Update on Recent Operating PerformanceJuly 2021 RevPAR Exceeded July 2019 RevPAR
14%VS. 2019
197%VS. 2020
RevPAR Growth
“These results continue to be driven by strong
leisure demand at our luxury resort properties
as well as a ramp up of the performance of our
urban hotels. Total revenues for Bardessono
Resort and Spa, Hotel Yountville, and Pier
House Resort for August and September are
forecasted to be more than 30% higher than
the same months during 2019.”
Company Presentation | August 2021 22
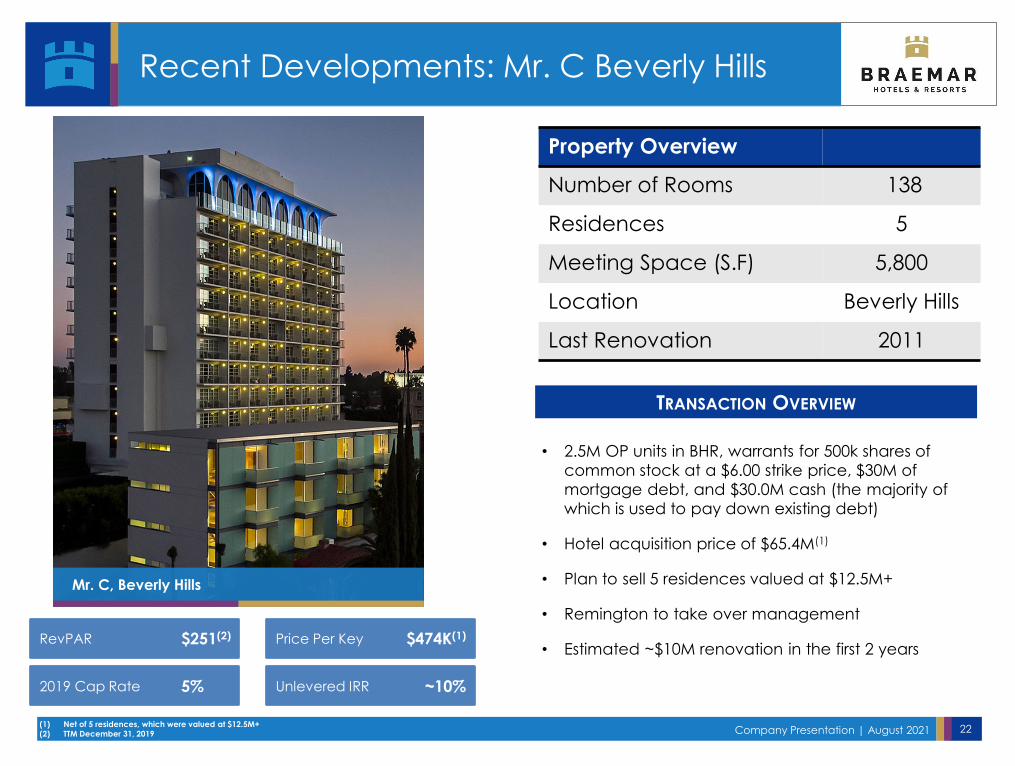
Recent Developments: Mr. C Beverly Hills
TRANSACTION OVERVIEW
• 2.5M OP units in BHR, warrants for 500k shares of
common stock at a $6.00 strike price, $30M of
mortgage debt, and $30.0M cash (the majority of
which is used to pay down existing debt)
• Hotel acquisition price of $65.4M(1)
• Plan to sell 5 residences valued at $12.5M+
• Remington to take over management
• Estimated ~$10M renovation in the first 2 years
Property Overview
Number of Rooms 138
Residences 5
Meeting Space (S.F) 5,800
Location Beverly Hills
Last Renovation 2011
(1) Net of 5 residences, which were valued at $12.5M+
(2) TTM December 31, 2019
Mr. C, Beverly Hills
2019 Cap Rate
RevPAR Price Per Key
Unlevered IRR
$251(2)
5%
$474K(1)
~10%
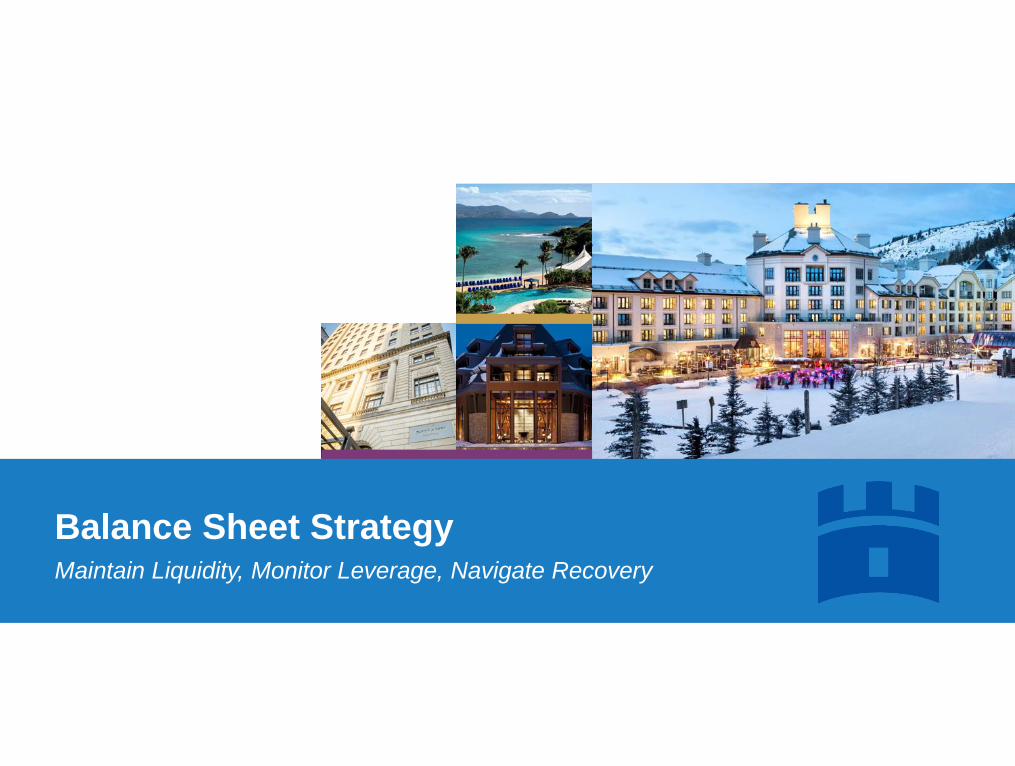
Balance Sheet StrategyMaintain Liquidity, Monitor Leverage, Navigate Recovery
Company Presentation | August 2021 24
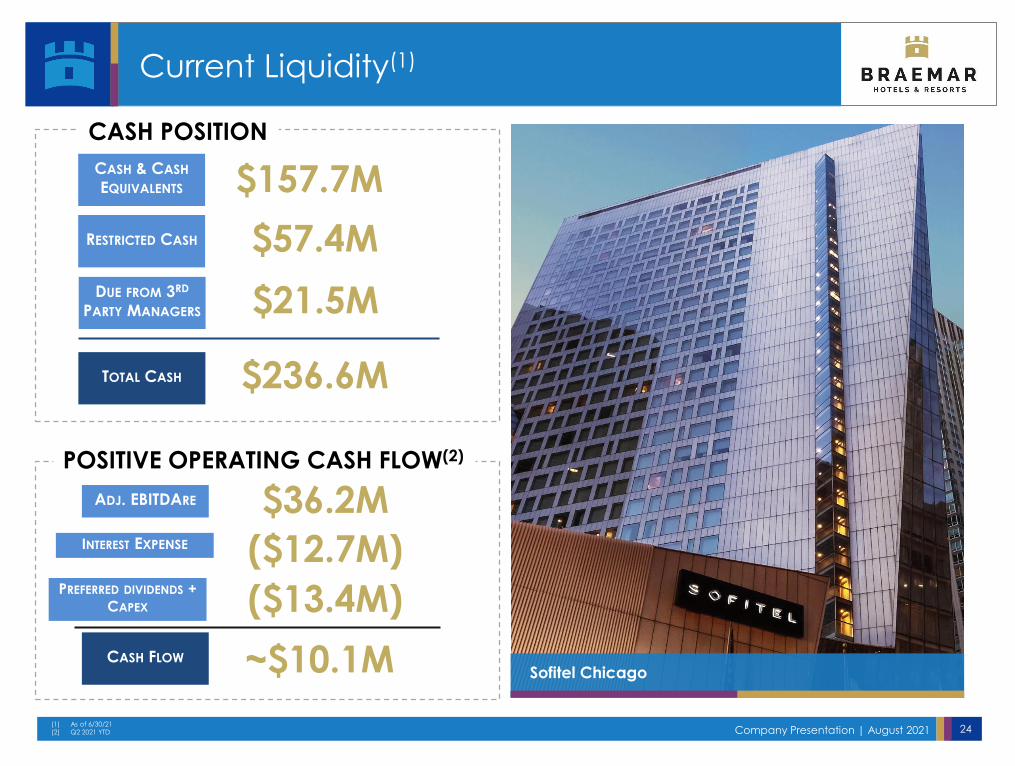
Current Liquidity(1)
$157.7MCASH & CASH
EQUIVALENTS
$57.4MRESTRICTED CASH
73%CAD
PAYOUT RATIO(3)
44%AFFO
PAYOUT RATIO(1)(3)
TOTAL CASH $236.6M
CASH POSITION
(1) As of 6/30/21(2) Q2 2021 YTD
$36.2MADJ. EBITDARE
($12.7M)INTEREST EXPENSE
POSITIVE OPERATING CASH FLOW(2)
CASH FLOW ~$10.1M
$21.5MDUE FROM 3RD
PARTY MANAGERS
($13.4M)
Sofitel Chicago
PREFERRED DIVIDENDS + CAPEX

Company Presentation | August 2021 25
Floating-rate debt provides a natural
hedge to hotel cash flows and maximizes
flexibility in all economic environments
Long-standing lender relationships
Proactive strategy to opportunistically
refinance loans and extend maturities
Overview
Leverage StrategyWell Designed to Handle Pandemic Impact
(1) Pro Forma for Mr. C
Note: the use of debt potentially increases BHR’s returns, as well as the risk of losses associated with the investment
Hold 10% of Gross Debt Balance as cash on the balance sheet
Delever to 35% Net Debt to Gross Assets
0.00%
1.00%
2.00%
3.00%
4.00%
5.00%
6.00%
2018 2019 2020 2Q21
Weighted Avg. Interest rate
(1)
Company Presentation | August 2021 26
Laddered debt maturities(1)(2)(3)
Debt Maturities
2022NEXT HARD DEBT
MATURITY
OVERVIEW
(1) As of 6/30/2021(2) Pro Forma for Mr. C(3) Assumes extension options are exercised. There can be no guaranty that extension options are exercisable on or before maturity. In the event one or more extensions are not exercisable we will be subject to the prevailing conditions of the debt markets at that time, which could result
in increased or decreased borrowing cost or the inability to borrow at all. In such case, our ability to repay the amounts owed under the debt arrangements may not be feasible or could have a negative impact on our financial performance
2.7%WEIGHTED AVG.
INTEREST RATE(1)(2)
The Notary Hotel $158.5
$98.0
$401.5 $435.0
$86.3
$0.0
$50.0
$100.0
$150.0
$200.0
$250.0
$300.0
$350.0
$400.0
$450.0
$500.0
2021 2022 2023 2024 2025 2026
(in
mill
ion
s)
Maturities
Company Presentation | August 2021 27
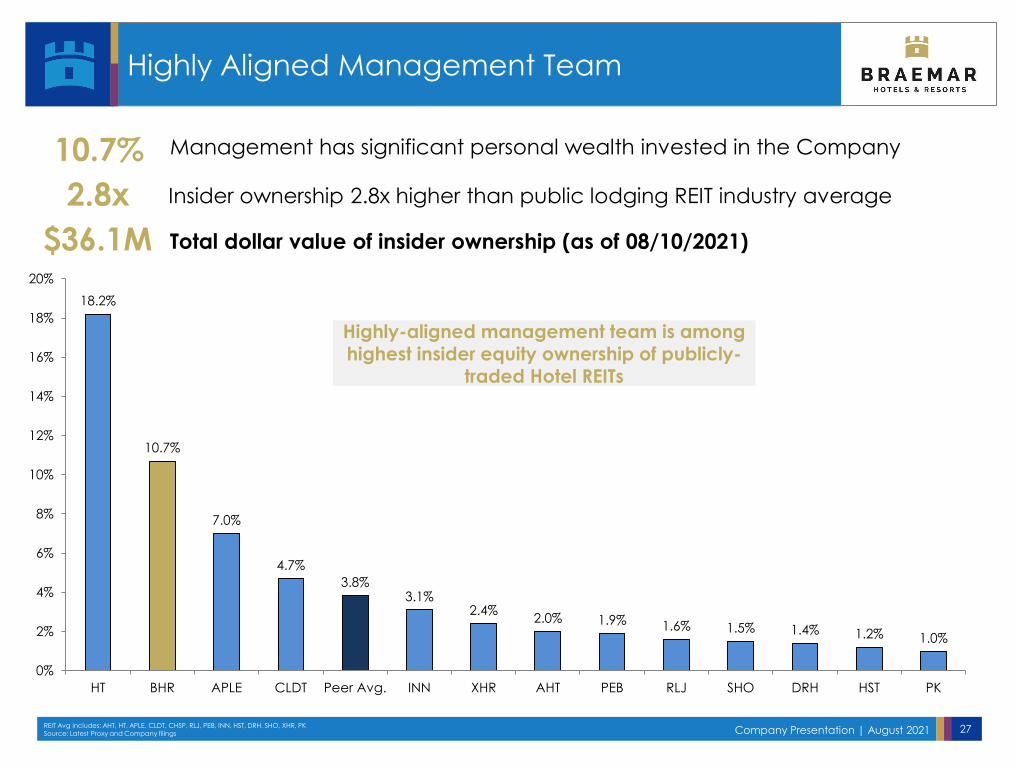
Highly Aligned Management Team
Management has significant personal wealth invested in the Company10.7%
Insider ownership 2.8x higher than public lodging REIT industry average2.8x
Total dollar value of insider ownership (as of 08/10/2021)$36.1M
REIT Avg includes: AHT, HT, APLE, CLDT, CHSP, RLJ, PEB, INN, HST, DRH, SHO, XHR, PKSource: Latest Proxy and Company filings
Highly-aligned management team is among highest insider equity ownership of publicly-
traded Hotel REITs
18.2%
10.7%
7.0%
4.7%
3.8%3.1%
2.4%2.0% 1.9% 1.6% 1.5% 1.4% 1.2% 1.0%
0%
2%
4%
6%
8%
10%
12%
14%
16%
18%
20%
HT BHR APLE CLDT Peer Avg. INN XHR AHT PEB RLJ SHO DRH HST PK
Company Presentation | August 2021 28
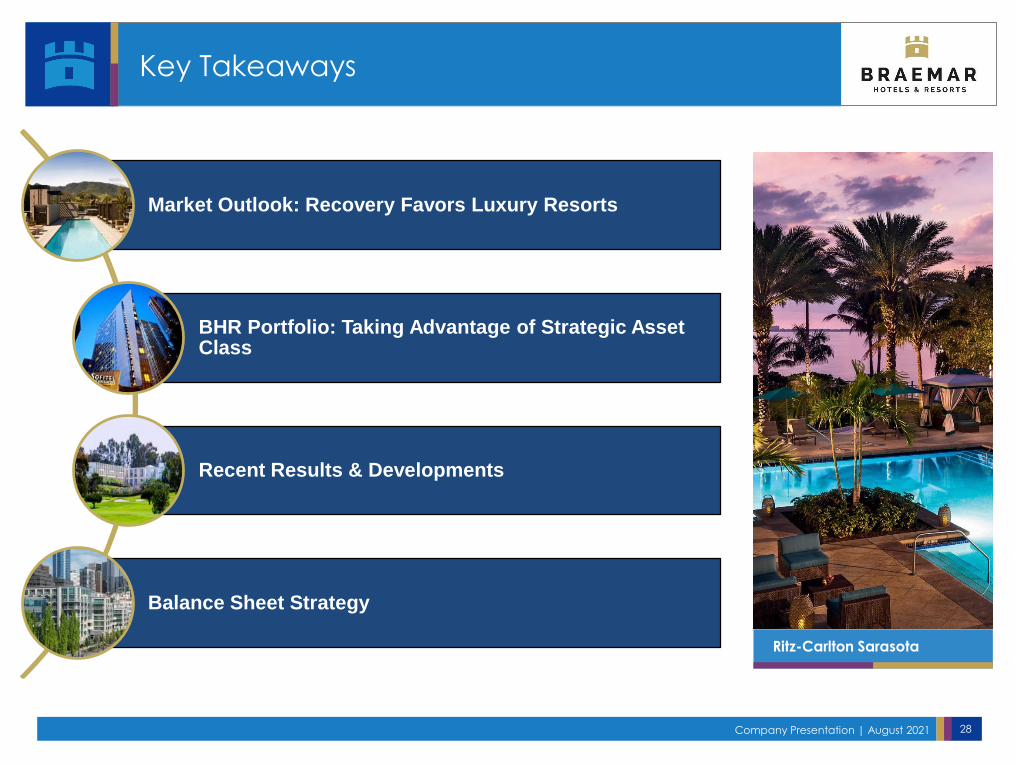
Key Takeaways
Market Outlook: Recovery Favors Luxury Resorts
BHR Portfolio: Taking Advantage of Strategic Asset Class
Recent Results & Developments
Balance Sheet Strategy
Ritz-Carlton Sarasota
Appendix
Company Presentation | August 2021 30
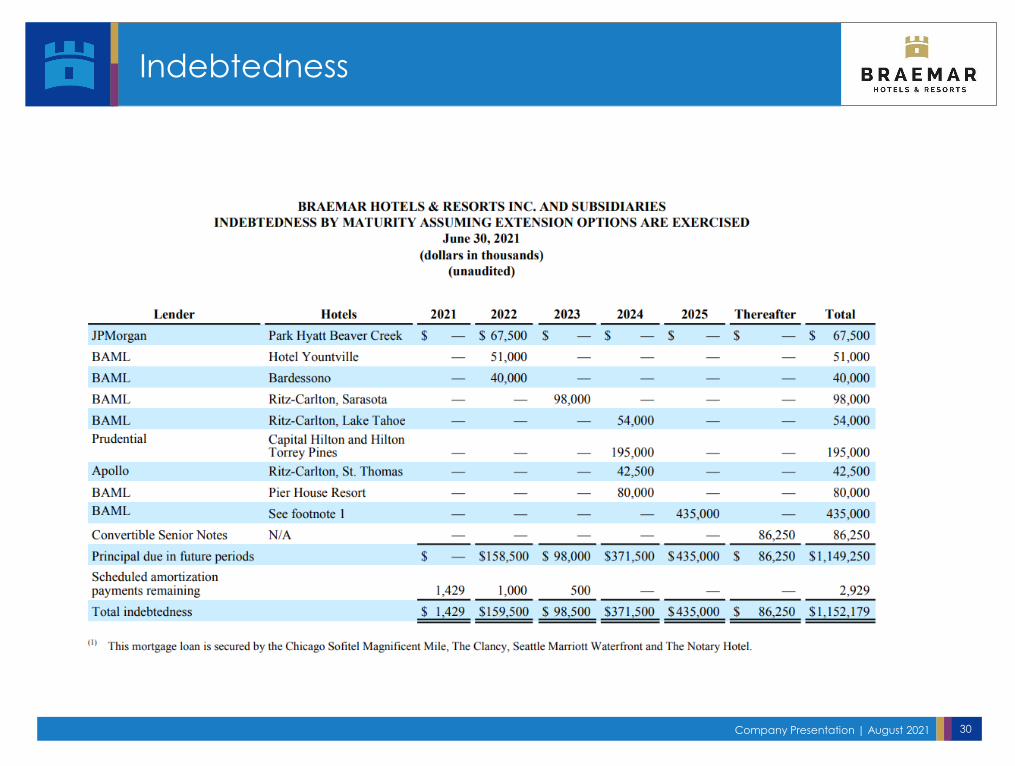
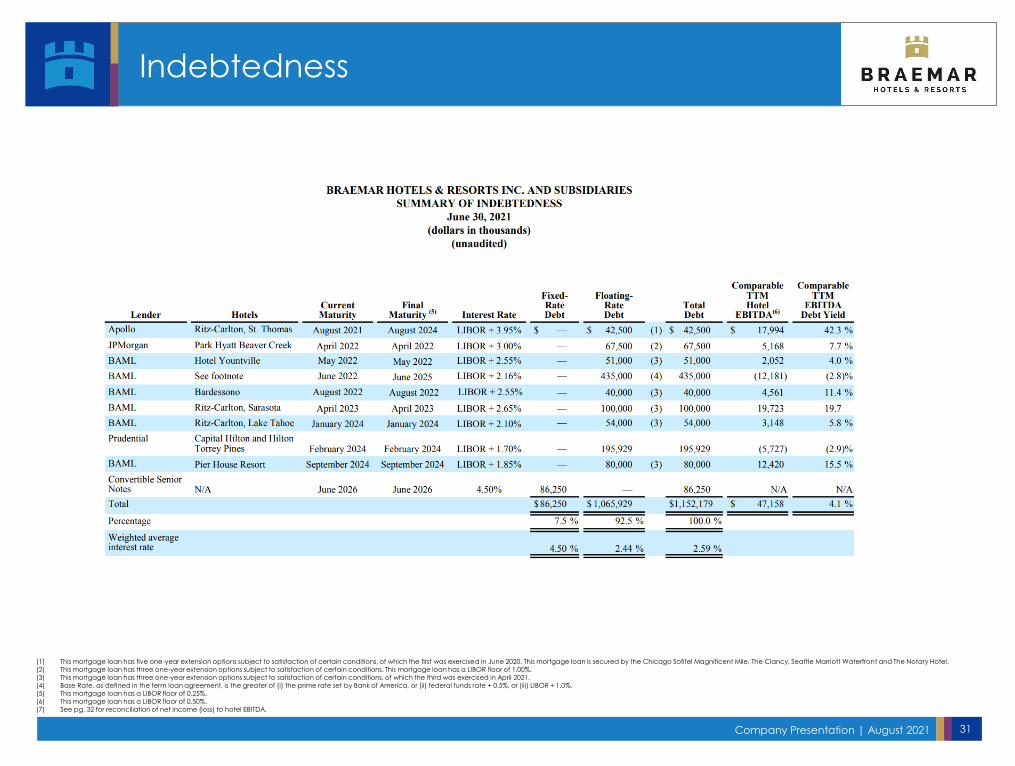
Indebtedness
Company Presentation | August 2021 31
Indebtedness
(1) This mortgage loan has five one-year extension options subject to satisfaction of certain conditions, of which the first was exercised in June 2020. This mortgage loan is secured by the Chicago Sofitel Magnificent Mile, The Clancy, Seattle Marriott Waterfront and The Notary Hotel. (2) This mortgage loan has three one-year extension options subject to satisfaction of certain conditions. This mortgage loan has a LIBOR floor of 1.00%. (3) This mortgage loan has three one-year extension options subject to satisfaction of certain conditions, of which the third was exercised in April 2021.(4) Base Rate, as defined in the term loan agreement, is the greater of (i) the prime rate set by Bank of America, or (ii) federal funds rate + 0.5%, or (iii) LIBOR + 1.0%.(5) This mortgage loan has a LIBOR floor of 0.25%.(6) This mortgage loan has a LIBOR floor of 0.50%.(7) See pg. 32 for reconciliation of net income (loss) to hotel EBITDA.
Company Presentation | August 2021 32
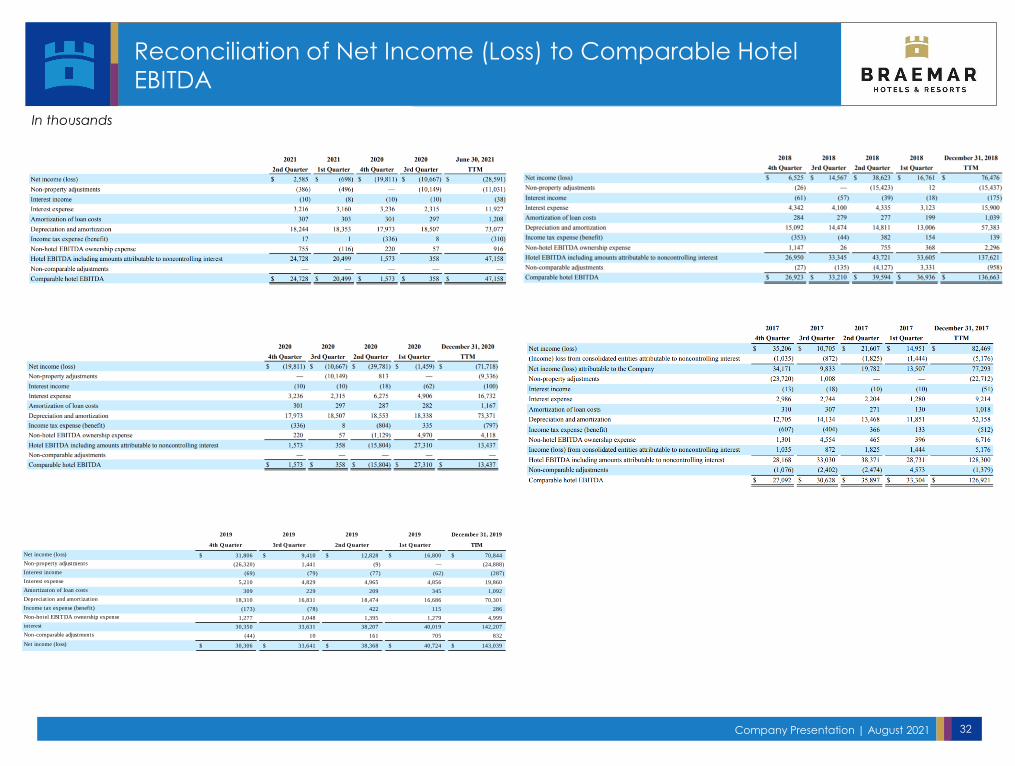
Reconciliation of Net Income (Loss) to Comparable Hotel
EBITDA
In thousands
2019 2019 2019 2019 December 31, 2019
4th Q uarter 3rd Q uarter 2nd Q uarter 1st Q uarter TTM
Net income (loss) 31,806$ 9,410$ 12,828$ 16,800$ 70,844$
Non-property adjustments (26,320) 1,441 (9) — (24,888)
Interest income (69) (79) (77) (62) (287)
Interest expense 5,210 4,829 4,965 4,856 19,860
Amortizaton of loan costs 309 229 209 345 1,092
Depreciation and amortization 18,310 16,831 18,474 16,686 70,301
Income tax expense (benefit) (173) (78) 422 115 286
Non-hotel EBITDA ownership expense 1,277 1,048 1,395 1,279 4,999Hotel EBITDA including amounts attributable to noncontrolling
interest 30,350 33,631 38,207 40,019 142,207
Non-comparable adjustments (44) 10 161 705 832
Net income (loss) 30,306$ 33,641$ 38,368$ 40,724$ 143,039$
Company Presentation | August 2021 33
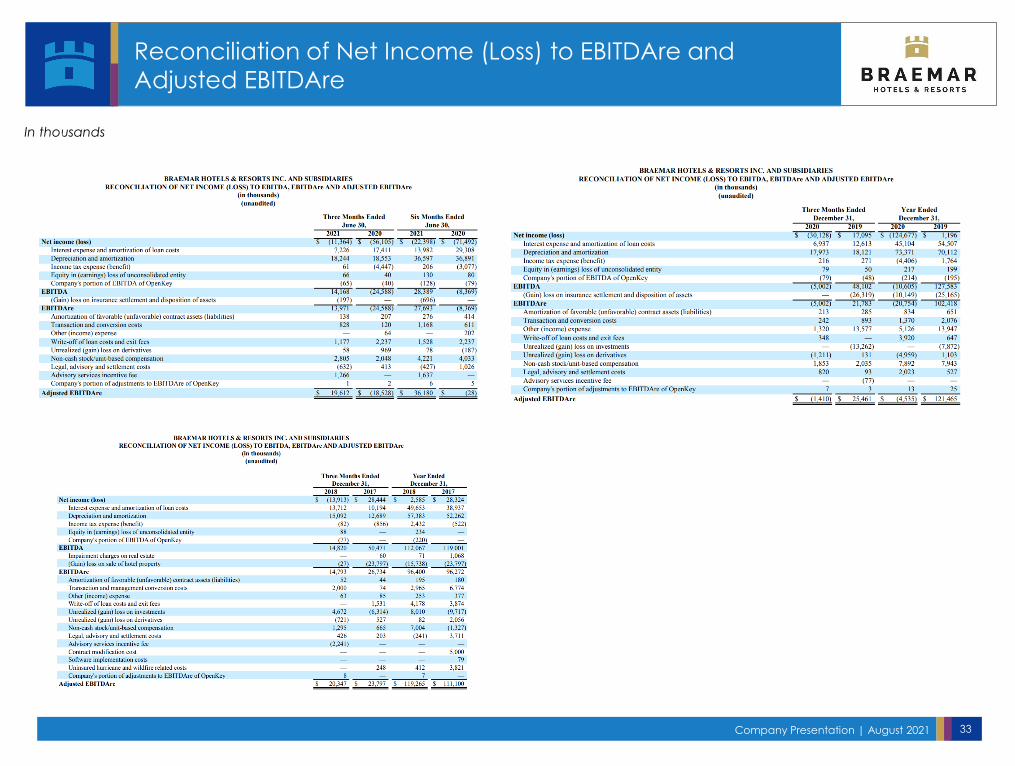
Reconciliation of Net Income (Loss) to EBITDAre and
Adjusted EBITDAre
In thousands
Company Presentation | August 2021 34
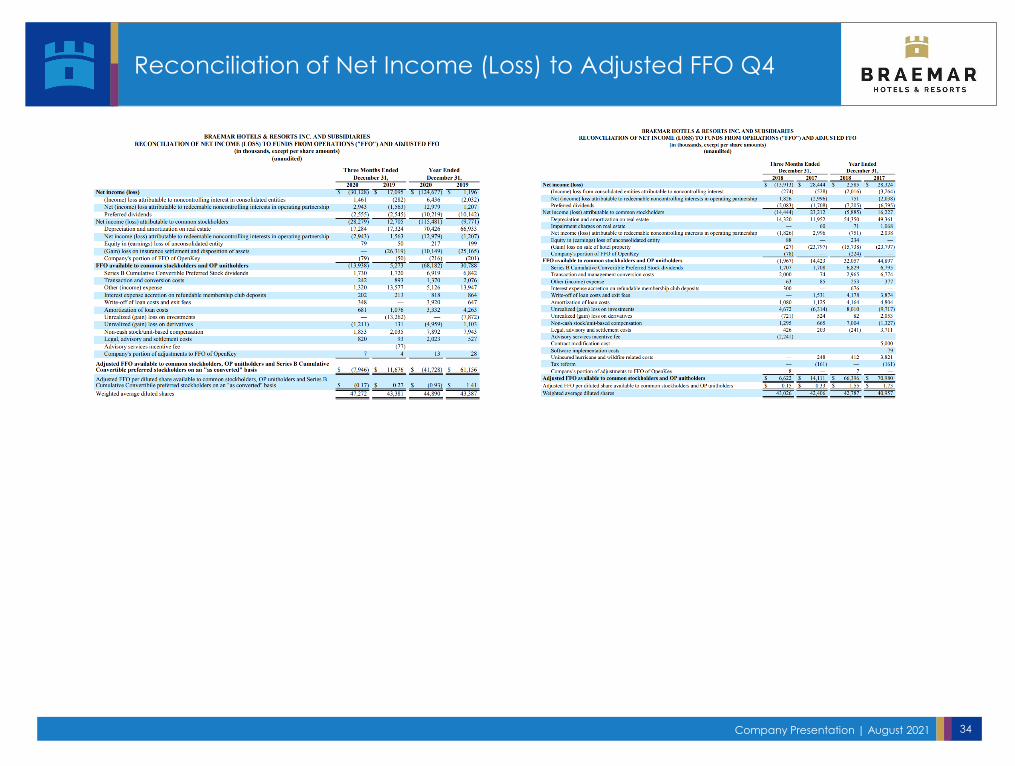
Reconciliation of Net Income (Loss) to Adjusted FFO Q4
Company Presentation | August 2021 35
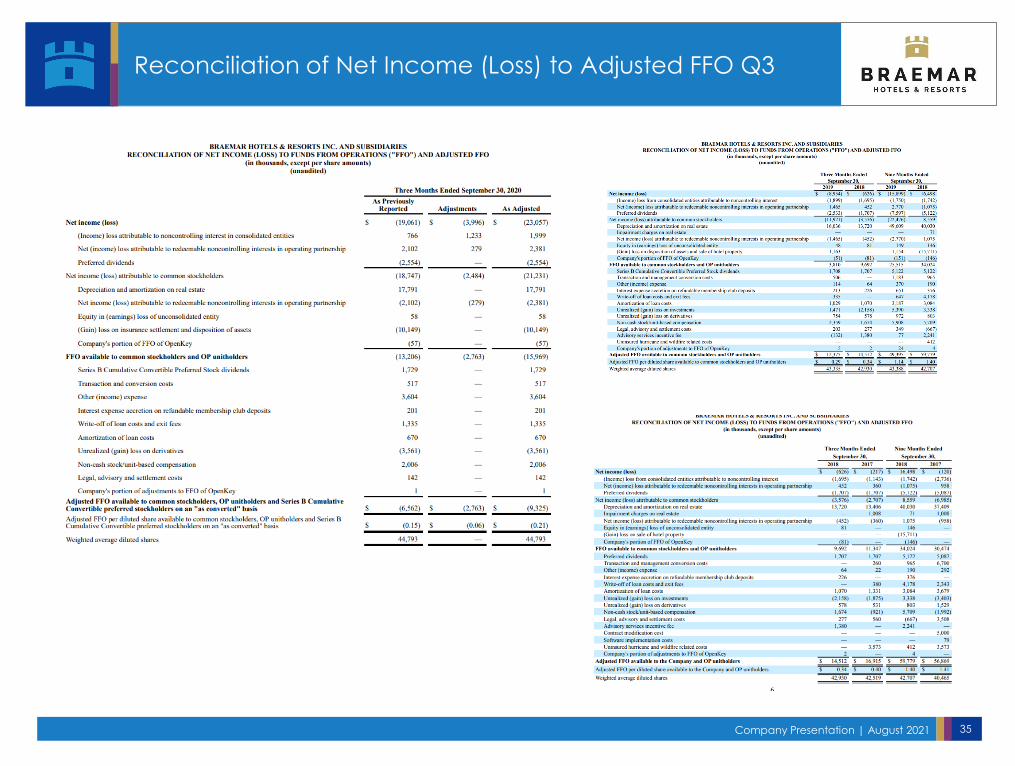
Reconciliation of Net Income (Loss) to Adjusted FFO Q3

Company Presentation | August 2021 36
Reconciliation of Net Income (Loss) to Adjusted FFO Q2
Company Presentation | August 2021 37
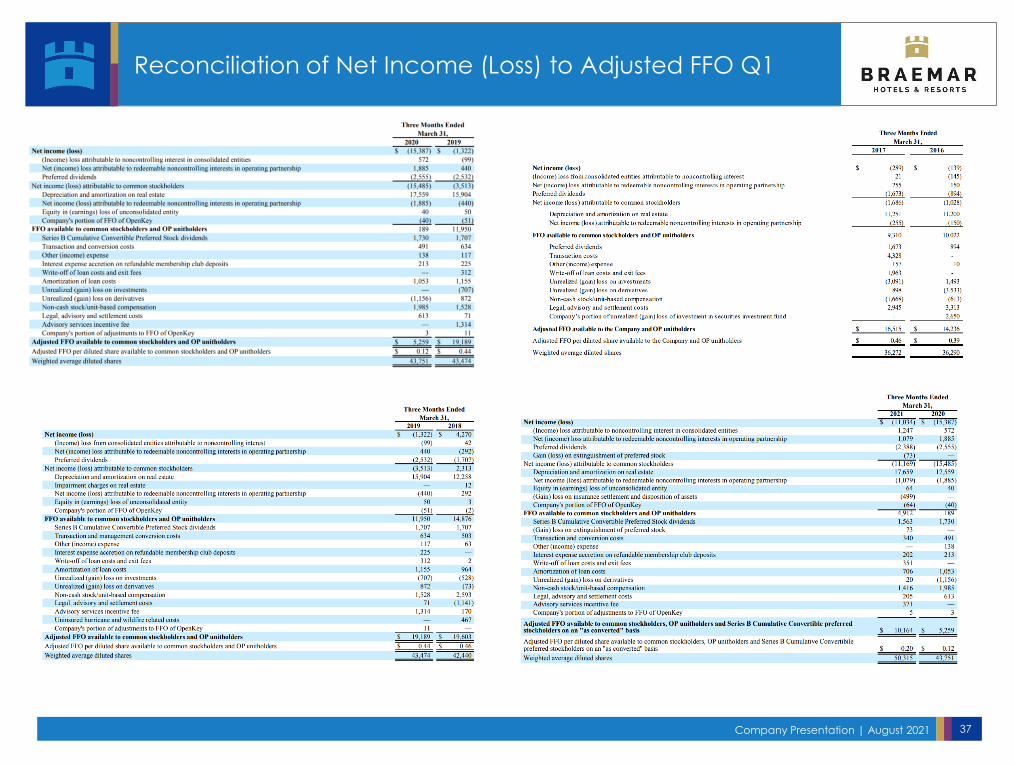
Reconciliation of Net Income (Loss) to Adjusted FFO Q1