australian dairy industry - business council of … · global dairy trade is expected to grow over...
TRANSCRIPT

AUSTRALIAN DAIRY INDUSTRY
SEPTEMBER 2015

>2
Australian Dairy
Industry - 2015
-
50
100
150
200
250
1990 1994 1999 2004 2009 2014
-
160
320
480
640
800
2005 2010 2011 2012 2013Cow Milk Buffalo Milk Other Milk
OUTLOOK ON GLOBAL DAIRY PRODUCTION
According to the OECD-FAO Agricultural Outlook 2014-23, milk production is set to increase to 928 million tonnes by 2023. Developing countries will account for a substantial portion (~78%) of this increase. However, the growth rate for this forecast averages out to 1.9% which is lower than the growth rate (2.2%) of the previous decade. This dampening of milk production growth takes into account growing shortages of water and suitable land in developing countries along with slow adoption of advanced dairy production systems.
The growth in milk production over the next decade will be driven by higher yield growth in developed countries and by increased cow numbers in developing countries. Significant scope remains for higher productivity in dairy production, particularly in developing regions, which will be key to the growth of a sustainable livestock sector.
India is expected to become the largest milk producer in the world through the next decade, overtaking the European Union.
It is expected that developing countries will contribute most to the production of butter and whole milk powder (WMP), while developed countries will contribute to production growth of cheese and skimmed milk powder (SMP).
GLOBAL DAIRY INDUSTRY – OVERVIEW
CURRENT SCENARIO IN GLOBAL DAIRY SECTOR
Global milk production reached 782 million tonnes in 2013, a 1.3% increase over 2012. It is estimated to reach 792 million tonnes in 2014 according to FAO.*
WORLD MILK PRODUCTION BY SPECIES(In million Tonnes)
In 2013, for most dairy commodities global output increased, while most dairy companies witnessed increasing turnovers in the wake of rising dairy prices.
These high prices were attributed to a combination of higher feed costs, adverse weather conditions in Oceania and parts of Europe and significant production shortage in China. Milk production decreased by 5.7% in China in 2013.2 The United States, European Union, New Zealand and Australia produced lower milk in the first half of 2013 as compared to that of 2012, further supporting the upward trend in prices.
However, from April 2014, international dairy prices began nosediving on the back of increased global production23, declining purchases by China (the major importer of whole milk powder (WMP) and second largest importer of skimmed milk powder (SMP)) and the Russian ban on imports of dairy products from several major exporters.
FAO MONTHLY REAL DAIRY PRICE INDEX (2002-04 = 100)
Source : IDF
Source : FAO
- 5 10 16 21 26
Butter/oil
Cheese
SMP
WMP
Growth 2013-23
25%
23%
17%
25%
WORLD DAIRY PRODUCT PRODUCTION FORECAST 2013-23* (In million Tonnes)
* Shaded portion shows production beyond 2013 unto 2023
Source : OECD-FAO
OUTLOOK ON GLOBAL DAIRY PRICES
Real dairy product prices are forecast to decline slightly over the next ten years partly due to the continued productivity growth in the dairy sector. However, real prices will remain substantially higher than in the period before 2007 according to the OECD-FAO Agricultural Outlook 2014-23. Dairy prices have shown sustained volatility since 2007 and are expected to be dynamic in the near future. Changes in global climate along with volatility in input costs lend volatility to dairy prices. Unforeseen events like policy changes, changes in terms of trade and general macroeconomic shifts also enhance volatility in dairy prices.
Note: SMP : Skimmed Milk Powder, WMP : Whole Milk Powder,
Note* : Based on latest data available so far.

>3
Australian Dairy
Industry - 2015
Butter Cheese SMP WMP
Asia & Pacific (413) (633) (1,241) (1,372)
Africa (161) (219) (387) (618)
Latin America & Caribbean
(22) (284) (367) (46)
Other Developed (39) (365) (95) (21)
Oceania Developed 476 518 642 1,656
Europe 80 879 640 379
North America 98 318 826 4
FORECAST TRADE DEFICITS IN 2023, VOLUME OF NET –EXPORTS (In ‘000 Tonnes)
GLOBAL DAIRY CONSUMPTION AND DEMAND OUTLOOK
Population growth and changing dietary preferences are the major factors driving global dairy demand. Consumption is expected to increase substantially in the next decade, as higher economic growth will result in consumers raising their level of protein consumption.
It is expected that fresh dairy products will constitute the bulk of consumption in developing regions. However, total consumption of dairy products will remain considerably higher in developed than in developing countries. This difference largely stems from the per capita consumption of cheese which is more than tenfold higher in developed countries compared to developing ones.
Per capita consumption of dairy products in developing countries is projected to increase by 1.9% p.a. for cheese and butter and at 1.2% p.a. for milk powder over the next decade.2
GLOBAL DAIRY INDUSTRY – OVERVIEW
FACTORS UNDERLYING RISING DEMAND IN DEVELOPING MARKETS22
The following factors contribute to the rising dairy demand in developing markets
> People believe that imported products are safer and more trusted
> Higher economic growth rates as compared to developed economies
> The emergence of a consuming ‘middle class’ due to rising incomes
> High birth rates and young populations
> Consumers becoming more health-conscious
> Growth in ‘modern’ retailing and food service
> Urbanisation enabling access to more consumers
> School milk programs and consumer education
> A desire for parents to include dairy (infant formula) in the diets of children
> Relatively low levels of dairy consumption, with related growth potential.
is liquid milk exported from the European Union to China (100 kilo-tonnes in 2013, up from 56 kilo-tonnes in 2012).
When compared to exports, dairy imports are more diversified and largely destined to the developing countries in Asia and Africa
Cheese is the only product for which sizeable imports occur in developed countries. Cheese imports in developed countries are currently higher than in developing countries, but it is expected that cheese imports in developing countries will grow at a much faster rate (4.4% p.a.) than in developed countries (0.7% p.a.)2.
The Russian Federation is currently the main destination for butter exports, although domestic production is increasing faster than consumption. Increases in butter imports are expected to grow indeveloping countries with Egypt and Saudi Arabia becoming key destinations.
China is the largest importer of SMP, followed by Mexico, Indonesia, Algeria, Malaysia and Egypt. Important destinations for WMP imports are China, Algeria, Nigeria and Saudi Arabia.
GLOBAL TRADE FLOW OUTLOOK
Global dairy trade is expected to grow over the next decade. The major bulk of this growth will be met by increased exports from the United States, European Union, New Zealand and Australia. These four countries account jointly for 74% of world cheese, 74% of world WMP, 81% of world butter and 86% of world SMP exports in 20232.
Considerable growth has occurred in fresh dairy trade in recent years, comprising not only yoghurts and cream but also liquid milk. One important trade flow
Source : OECD-FAO
Note: SMP : Skimmed Milk Powder, WMP : Whole Milk Powder,

>4
Australian Dairy
Industry - 2015
Australia
Brazil
Canada
China
India
Japan
New Zealand
United Kingdom
United States
Indonesia
Philippines
Thailand
Malaysia
-
20
40
60
80
100
120
- 10,000 20,000 30,000 40,000 50,000 60,000 70,000
MARKET POTENTIAL FOR AUSTRALIAN EXPORTS : TRANSFORMING ASIAN DEMOGRAPHICS
THE RISING MIDDLE CLASS IN ASIA PACIFIC
According to McKinsey, two-thirds of the world’s middle class will reside in Asia Pacific by 2030 and will be the growth engine of the world economy.
Large populations and rapid economic growth mean that China and India will become the powerhouses of middle-class consumerism over the next two decades. The global middle class is defined as people earning between USD10-100 per day, the level at which consumers have spending power which transforms their consumption patterns.6
URBANISATION TRANSFORMING CONSUMER TRENDS
“This is the world’s largest migration in history as 300 million people have already urbanised in the decade to 2012 with another 350 million to follow and total 1 billion by 2030.” (Source: Mckinsey and Co)
Changing lifestyle and health consciousness will result in significant westernisation of diets and therefore demand for dairy products from these countries.
Furthermore, developing markets including China, India, Thailand, Philippines, Malaysia, and Indonesia are expected to grow at a CAGR in the range of 6% to 9% from 2012-2019.(Source : IMF)
HIGH YOUNG POPULATION
In 2012, 89.7% of the global population aged below 30 years lived in emerging and developing economies. Of these 48.8% lived in Asia. At the beginning of 2012, China had 497 million people below the age of 30 years and Indonesia had 123 million. (Source: UN &
Euromonitor)
GDP per Capita (USD)
Con
su
mp
tion
per C
ap
ita (
In
Lit
res)
Below graph shows a very high correlation between dairy consumption and per capita GDP
Average Consumption per capita for developed countries
LIQUID MILK CONSUMPTION AND GDP PER CAPITA – 2012
A large youth population can be an opportunity for countries to build a strong economic base and reverse poverty trends in many developing economies. As more people work, aggregate disposable incomes and spending rise. The massive growth in market size will provide opportunities for industries such as dairy to target these economies with an enduring consumer profile comprising rising income levels.
OPPORTUNITY FOR AUSTRALIA
Burgeoning demand for dairy among consumers in China and the ASEAN-6 (the six largest economies of the Association of South East Asian Nations –Indonesia, Thailand, Malaysia, Singapore, the Philippines and Vietnam) is creating substantial trade opportunities for dairy export countries including Australia.
These countries will exhibit annual growth rates in dairy consumption that are well above the world average. Within the ASEAN region, the fastest rate of growth is expected in Indonesia and Vietnam.
With per capita dairy consumption rates among these nations currently very low by global standards, the potential for growth is huge.
It is expected local milk production in these countries will continue to grow, supported by further private and public investment. However, local farmers face difficulties in increasing milk output significantly, meaning local milk production is unlikely to close the gap between demand and production.
Despite Australia having a competitive advantage due to geographical location and a rich tradition of exporting dairy products to these markets, export success is not guaranteed and challenges relating to competitiveness of Australian dairy products need to be addressed.
Source : IMF, USDA, ANZ Analysis

>5
Australian Dairy
Industry - 2015
1.1%
7.9%
3.8%
0.6% -
140
280
420
560
700
Butter Cheese SMP WMPAverage 2011-13 est 2023 Growth 2014-23*
KEY DEMAND REGIONS FOR AUSTRALIA
CHINA
China continues to be a key market for dairy exporting nations including Australia. A number of factors contribute to China being the biggest importer of dairy products.
Consumption and Imports
China’s per capita consumption of dairy products is less than one-third of the world average, an indicator of the great growth potential. This growth will be mainly driven by urbanisation and rapidly rising household incomes.
Liquid milk is the core product of China’s dairy market, representing more than 80% of the total consumption. However, in terms of imports, skim milk powder and whole milk powder are the major products. Imports of milk powders including infant formula represented 38% of the total imports in 2013. In the coming decade, demand for cheese and butter is also expected increase.
A new trend in first-tier Chinese cities is imported UHT milk products, becoming one of the fastest selling products in China. At competitive prices to domestic milk, consumers see imported milk as a safer, healthier option with many product choices (such as skim, low-fat, whole). Imported UHT milk is also growing more popular among older consumers who prefer skim or low fat milk and an uptrend is expected in urban areas. As of 2013, Germany is China’s biggest fluid milk supplier due to price competitiveness.7
Following the 2008 Melamine crisis, demand for imported infant formula has remained very strong as consumers demand high-end infant formula products. The easing of the one child policy is likely to contribute to this uptrend.
Another constraint that limit China’s ability to become self sufficient in milk and dairy products is that the domestic industry is characterised by scattered small-scale production and low milk yields. At the end of 2013, small scale farmers accounted for 40% of the dairy cows.
China has continued to see growth of large scale farms and more efficient processing enterprises that target high productivity. With tighter government regulations, consolidation among domestic farms and milk collection centres is expected in the Chinese dairy sector.
In 2014, the Chinese government announced plans to reduce the number of domestic milk powder manufacturers and to see 10 large dairy entities to take over 70% of the market in five years(since 2013). The government had also introduced dairy breeding subsidy programmes to improve cow yields.
China’s raw milk price leaped from USD 0.46/kg in early 2008 to USD 0.68/kg in Jan 2014.2 Average milk prices in China were about 30% higher than the average world price in 2013, with key factors underlying this increase were rising feed cost and rapid growth in labour and land costs. This led to declining milk production margins despite the increase in milk prices.
These declining margins led China’s dairy cows herd to fall by about 10% in 2013, which caused China’s total milk production to drop by 5.7%, representing China’s biggest annual fall since 1949, even more significant than the fall in milk production caused by the Melamine Crisis of 2008.
Raw milk prices in China began falling in February 2014 and continued for ten consecutive months. This was caused by high inventory levels of dairy products in China and global over-supply in 2014.23
Nevertheless, it is expected that China’s import of dairy imports will continue to increase in the next decade.2
INDONESIA
The World Bank reported that the Indonesian middle class is growing by 7% annually and that it will have expanded to 60% of the total population in 2013. This rising middle class will drive the demand for dairy products.
Consumption and Imports
Indonesian per capita milk consumption is expected to continue to follow a long-term growth path. Indonesian per capita consumption is 13.4 litres which is very low, even when compared to other ASEAN countries (The Philippines: 22.1 litres; Malaysia: 50.9 litres; and Thailand: 33.7 litres, 2013 values), and it is therefore expected that Indonesia’s consumption will reach levels at least close to its neighbours.5 The growth in dairy consumption will be attributed to factors including the expanding middle class, growing consumer awareness of milk’s health benefits, and a growing food and beverage processing sector.5
Challenges and opportunities in Chinese domestic production
China’s domestic production capabilities have been limited so far. In fact China’s self sufficiency in dairy products has decreased in the last five years, following the food safety problems related to the Melamine Crisis of 2008.
(In ‘000 T
onnes)
Source : OECD-FAO
DAIRY PRODUCT IMPORTS TO CHINA FORECAST 2013-23
Note: * represents the least-squares growth rate, r, is estimated by fitting a linear regression trend line to the logarithmic annual values of the variable in the relevant period, as follows: Ln(xt) = a + r * t and is calculated as [exp (r) – 1].
Note: SMP : Skimmed Milk Powder, WMP : Whole Milk Powder, UHT : Ultra High Temperature

>6
Australian Dairy
Industry - 2015
The major imported dairy products in Indonesia are SMP, whey and anhydrous milk fat (AMF).
Indonesia imports high quantities of dairy products from Australia and NZ, historically due to geographic proximity and longstanding supplier-importer relationships. Aggressive marketing strategies by the two countries have helped protect their market share.
Despite this, US dairy products are gaining strength as awareness of US product features grow.
In 2013, the United States overtook New Zealand’s position as the largest supplier of SMP to Indonesia with 36% market share. New Zealand and Australia followed with 22% and 14% market share respectively.
In addition, Indonesian dairy manufacturers sometimes substitute whey for SMP when prices swing in of favour of whey imports. SMP is typically substituted at a 3:1 ratio (three parts whey equal one part SMP).
SOUTH KOREA
Dairy production and consumption have expanded rapidly in South Korea, with 73% of domestic milk production being used for drinking milk, leaving little for products like cheese and butter. Sales of all the dairy products showed positive growth in recent years with sales of unprocessed cheese expected to grow at a rate of 9% in the next five years in constant 2013 prices.
South Korean consumers prefer fresh pasteurised milk products such as chilled flavoured milk, while there is also a strong market for yoghurt.
Drinking milk products value sales are expected to see a 3% increase in the coming five years, at constant 2013 prices.
In contrast, long-life/UHT milk witnessed a 4% decline in sales in 2013, with consumers put off by its long shelf life because of a lack of perceived freshness. Consumers in South Korea are highly health conscious and strongly relate healthy foods to freshness.8
2.8%
5.7%
3.0%3.4%
-
50
100
150
200
250
Butter Cheese SMP WMPAverage 2011-13 est 2023 Growth 2014-23*
DAIRY PRODUCT IMPORTS TO INDONESIA FORECAST 2013-23
(In ‘000 T
onnes)
Source : OECD-FAO
JAPAN
Japan’s ageing population of Japan and stagnant population growth would seemingly indicate limited potential for growth in dairy consumption and demand. However, with high incomes enabling consumers to buy premium dairy products like cheese, it has been the biggest dairy market for Australia till 2012.
However, domestic economic problems including deflation have constrained market growth and reduced price premiums and there is little prospect of this changing in the short-term. Japan has transitioned to a much more price-conscious market than a decade ago.10
The main imported dairy products in Japan are butter, SMP and cheese, mainly supplied by Australia, New Zealand and the United States.
After several years of significant growth in consumption until 2012, cheese consumption and imports slowed in 2013 and actually began to decline in 2014, mainly driven by high import prices. However, it is expected to change with falling AUD and tariff reduction through FTA
Australia and New Zealand are the biggest suppliers of cheese to Japan. Highly price competitive US cheese imports have been eating into Oceania’s share as dairy prices shot up in 2013. However, falling cheese prices are expected to put Oceania’s supplies back on Japan’s imports basket in 2014-15.9
Dairy production has been on a slightly declining trend in Japan in both 2013 and 2014. Dairy producers continue their steady exit from the industry without securing successors, resulting in fewer farms and lower fluid milk production. Within this tight supply environment, the improved profit margins for cream and cheese production have diverted significant supplies away from the production of butter and SMP. This has led to increasing imports of butter and SMP.
Australia will leverage the FTA to extend the $A88m export value and bridge the gap with other principal exporters: United States, European Union, New Zealand. The United States accounted for 38% of South Korea’s dairy imports. Major imported dairy products are cheese and SMP.
Note: * represents the least-squares growth rate, r, is estimated by fitting a linear regression trend line to the logarithmic annual values of the variable in the relevant period, as follows: Ln(xt) = a + r * t and is calculated as [exp (r) – 1].
1.5%
2.8%
-
20
40
60
80
100
Cheese SMPAverage 2011-13 est 2023 Growth 2014-23*
(In ‘000 T
onnes)
DAIRY PRODUCT IMPORTS TO SOUTH KOREA FORECAST 2013-23
Source : OECD-FAO
Note: SMP : Skimmed Milk Powder, WMP : Whole Milk Powder,
KEY DEMAND REGIONS FOR AUSTRALIA

>7
Australian Dairy
Industry - 2015
- 34,000 68,000 102,000 136,000 170,000
New Zealand
EU
USA
Argentina
Australia
Average 2011-13 est 2023
Growth 2014-23*
1.9%
0.5%
0.9%
2.6%
2.0%
KEY SUPPLY REGIONS - COMPETITORS TO AUSTRALIAN EXPORTS
MILK PRODUCTION FORECAST 2013-23 FOR TOP MILK EXPORTING COUNTRIES (In ‘000 Tonnes)
Note: * represents the least-squares growth rate, r, is estimated by fitting a linear regression trend line to the logarithmic annual values of the variable in the relevant period, as follows: Ln(xt) = a + r * t and is calculated as [exp (r) – 1].
NEW ZEALAND (NZ)
The New Zealand dairy sector is dominated by Fonterra, along with several smaller competitive players. Raw milk is produced on a noticeably larger scale compared to Australia. Dairy farming is generally pasture-based with 18.8 billion litres of milk produced in 2012-13. The New Zealand industry is marked by larger plants with greater economies of scale, complemented by a history of learning with longstanding market development, product and processing research and development. NZ is the largest dairy trading nation in the world, supported by industry policy and regulatory framework. The New Zealand dairy industry has greater influence on government policy on account of the sector’s greater contribution to NZ GDP (around 8%) as compared to Australia. NZ exports over 95% of milk production (in milk equivalent terms), with exports (2013) primarily in whole milk powder (WMP) (43%), skim milk powder (SMP) (14%) and cheese (11%).14 In addition, New Zealand remains the primary source of butter on the international market.
EUROPEAN UNION (EU)
While the majority of European dairy production is traded and consumed within the EU, nevertheless, it still remains one of the largest exporters in the world after excluding intra EU trade.
In 2015, the EU will remove dairy production quotas for member states. It is difficult to predict the net effect this might have on EU dairy exports, but market intelligence suggests that several EU member countries and companies anticipate increased production volumes and more product availability for export to regions outside the EU, including the Middle East and South-East Asia.10
Major milk producing nations in the EU are Denmark, Germany, the United Kingdom, France, Ireland and the Netherlands. A brief overview of the production systems and the dairy industry sector is given below for Ireland and the Netherlands.
IRELAND
Most of the dairy farming in Ireland is pasture based, while Ireland also has a similar scale of processing as Australia. There has been aggressive overseas expansion by Irish dairy manufacturers with a smaller raw milk production base (around 5-6 billion litres, 2013) compared to Australia. Six companies process 80% of the milk. Ireland is developing a strong market presence, particularly in value added products and export markets. Recent industry policy and regulatory changes in the EU (in particular, removal of quotas in 2015) are inviting considerable investment from farm to factory.14
Approximately 80% of Irish dairy products are exported annually. Ireland is now the world’s leading producer of infant nutrition products, contributing to 15% of the world’s powdered infant formula supply, and has expanded exports to the Middle East and Asia including China.11
Source : OECD-FAO
Note: SMP : Skimmed Milk Powder, WMP : Whole Milk Powder,
>8
Australian Dairy
Industry - 2015
THE NETHERLANDS
With one dominant company (co-operative structure), Friesland Campina combined and aggressive overseas expansion by Dutch dairy manufacturers, The Netherlands draws on a milk pool of 10 billion litres (2013). The Netherlands exports around two-thirds of all its milk processed, making it the EU’s biggest exporter with 25% of total EU exports. Dutch dairy interests have business around the world and can be found in more than 135 countries. Three-fourths of exports remain in Europe, the rest go further abroad. Demand for Dutch dairy goods is especially high in Asia.12
THE UNITED STATES (US)
The dairy sector in the US is a large, fragmented industry with around 90 billion litre production base (2013).14 Dairy farming mostly depends on non pasture based, high-yielding feed based production platforms.
Historically, the dairy sector in the US has been more centred towards meeting domestic demand but recently it has been showing aggressive interest in exports, with companies and industry bodies cooperating to expand export oriented activity beyond its traditional focus of Mexico.
In Asia, the US dairy sector is expanding its market share in markets such as China, Korea and Japan and South-East Asian countries and growing manufacturing capacities outside of fresh dairy into dairy products such as milk powders and whey. With investments in plants, personnel and products geared specifically for export, US dairy suppliers continued to pursue global markets in 2014, recognising its critical role in the overall health of the US dairy industry.13 US exports (2013) are divided as SMP (26%), whey powder (23%), lactose (16%) and cheese (15%).Total US dairy export volumes have grown at a very high CAGR of 18% (2009-13).14
US exporters have been using the producer funded “Co-operatives Working Together” (CWT) program to subsidise exports into Asian markets. CWT is an industry-funded program that has been carefully constructed to avoid being classified as an export subsidy program under World Trade Organisation protocols.
CWT is being used to subsidise US exports of butterfat and cheese into key Australian export markets such as Japan and South Korea. This depresses the prices paid for these products in these markets. This has led to a reduction in Australia’s market share and revenue from the Japanese cheese market – Australia’s largest international cheese market.10
ARGENTINA
Dairy farming in Argentina is mostly based on pasture-based systems, with a raw milk production base of just over 10 billion litres (2013). According to OECD/FAO, farm based milk production growth is constrained by high land prices and potential competition for land from soy farmers.
The Argentine dairy sector has major growth ambitions to become a major dairy product exporter, and has been growing its manufacturing capabilities in dairy products such as cheese and whey.
Like New Zealand, Argentina’s export product mix by volume is weighted towards WMP: over the last 5 years, 45-50% of Argentine dairy exports have been in WMP; recently there has been an increased proportion in whey powder (20% in 2013 up from 13% in 2009); cheese accounts for the next greatest share (around 13%). Total Argentine dairy export volumes have grown at a CAGR of 5% (2009-13).14
CONCLUSION
With competitor exporting countries expanding their production base, Australia needs to increase its milk production in order to meet the growing demand in emerging economies. In addition, producing higher value added products (such as cheese and infant formula) in Australia provides greater economic benefit to the Australian economy.
Attention needs to be paid to regional trade agreements/ free trade agreements with target export markets, as competitors such as the USA utilise programs like CWT to reduce prices in target export markets.
Note: SMP : Skimmed Milk Powder, WMP : Whole Milk Powder,
KEY SUPPLY REGIONS - COMPETITORS TO AUSTRALIAN EXPORTS

>9
Australian Dairy
Industry - 2015
STATE FACTS
The state of Victoria has very low raw milk production costs (lower than that of New Zealand) and is the highest contributor to Australia’s total milk production.
South Australia had the highest annual yield per cow of 6,724 litres in 2013-14.
Tasmania has experienced the highest increase (48%) in the total number of cows (1980-2014), mainly due to favourable climate, access to water from irrigation, land available for new dairy developments and recent expansions in milk processing capacity.25
Queensland has experienced the highest increase in yield (1980-2014). However, the number of cows has declined the most amongst all states (1980-2014) due to rough weather conditions like droughts (2002-03, 2006-07) and flooding and cyclones(2010-11, 2013-14). This state is also most hit by supermarket price wars forcing farmers to move out of dairy.
AUSTRALIAN DAIRY INDUSTRY – AN OVERVIEW
Australian Dairy Industry (2014) in Summary
1.69 National Dairy Herd (million cows) $4.7 Industry value at farm gate (billion)
268 Average herd size (cow) $3.21 Export value (AUD billion)
9,239 Milk production (million litres) 7%Australia dairy exports as a % of world dairy trade
5,471Average annual milk production per cow (litres)
38% % of Australian milk production - exported
43,000Dairy industry workforce (direct employment)
6,314 Farm numbers
The dairy industry is one of Australia’s major rural industries. Based on a farmgate value of production of AUD 4.7bn in 2014, it ranks third behind the beef and wheat industries. It is estimated that around 43,000 people are directly employed on dairy farms and by dairy companies within Australia.
The bulk of the milk production occurs in south-east seaboard states, with much of the processing occurring close to farming areas, thereby generating significant economic activity and employment in the country. South-east Australia’s climate and natural resources are generally favourable to dairying and allow the industry to be predominantly pasture-based, with approximately 70-75% of the cattle feed requirements coming from grazing in a year of ‘normal’ seasonal conditions.
Owner operated farms dominate the Australian dairy industry. However, there is a high level of foreign ownership in Australian dairy manufacturing sector: four of the six largest dairy manufacturers are owned by foreign corporations or cooperatives.
Source: Dairy Australia
DAIRY FARMING AREAS IN AUSTRALIA AND MILK PRODUCTION
*Box represents milk production regionally and is in million litres
Western Dairy
Dairy SA
West Vic Dairy
Dairy TAS
Gippsland Dairy
Murray Dairy
Dairy NSW
Subtropical Dairy
West Australia 2005/06 : 377 2013/14 : 327
South Australia 2005/06 : 646 2013/14 : 516
Queensland 2005/06 : 597 2013/14 : 433
New South Wales 2005/06 : 1,197 2013/14 : 1,035
Tasmania2005/06 : 622 2013/14 : 805
Victoria
2005/06 : 6,651 2013/14 : 6,123
Milk Production*
The trend in farm numbers often follows the trend in farmgate milk prices. At the time of low farmgate prices farmers do choose to leave industry or temporarily cease dairy operations.15
A range of high quality consumer products, including fresh milks, custards, yogurts and a wide variety of cheese are produced in most Australian states. Nevertheless, the manufacturing of longer shelf life products, such as cheese and specialised milk powders, is steadily becoming more concentrated in south-east Australia including Tasmania.
>10
Australian Dairy
Industry - 2015
Unprocessed milk sold at farmgate price to Dairy Companies
Inputs
Supermarket Chains
Wholesalers, Retailers
Dairy Farming
Groceries
Exports
>DAIRY FARMING >DAIRY MANUFACTURING & PROCESSING >DAIRY MARKETING AND CONSUMPTION
Butter, spreads, Ice Creams
Restaurants and cafes
Cheese Manufacturing
Spray Dryers
UHT Processors
Processing Plants
Cheese
WMP, SMP, Whey, Infant formula
Drinking Milk
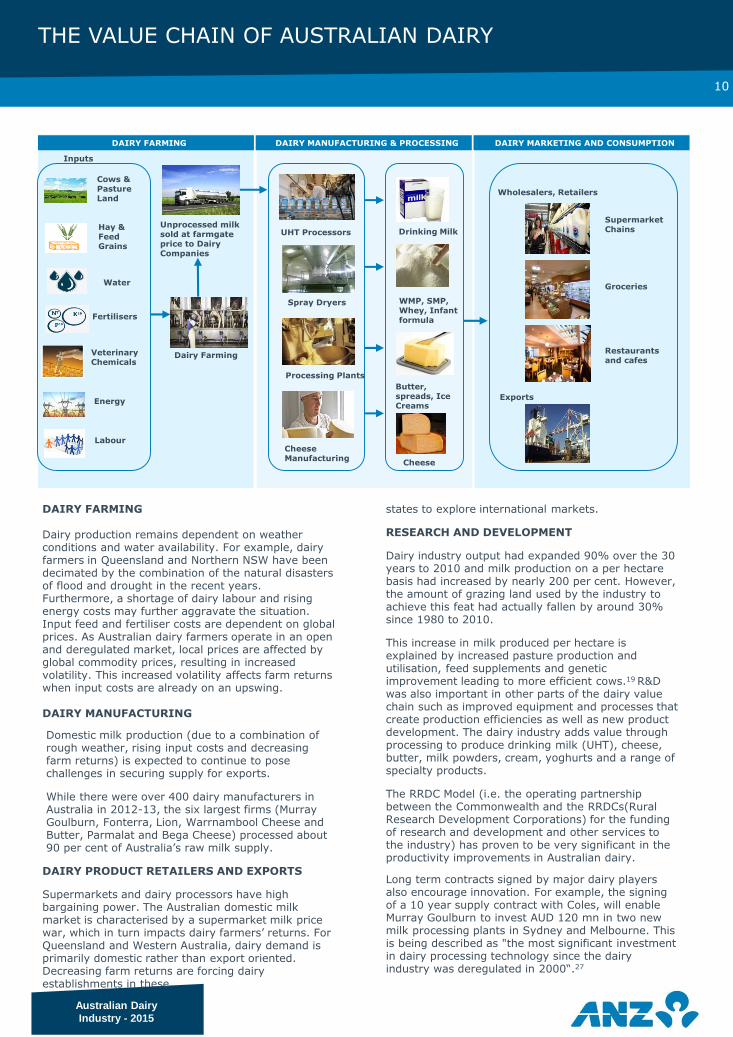
DAIRY FARMING
Dairy production remains dependent on weather conditions and water availability. For example, dairy farmers in Queensland and Northern NSW have been decimated by the combination of the natural disasters of flood and drought in the recent years. Furthermore, a shortage of dairy labour and rising energy costs may further aggravate the situation. Input feed and fertiliser costs are dependent on global prices. As Australian dairy farmers operate in an open and deregulated market, local prices are affected by global commodity prices, resulting in increased volatility. This increased volatility affects farm returns when input costs are already on an upswing.
DAIRY MANUFACTURING
Domestic milk production (due to a combination of rough weather, rising input costs and decreasing farm returns) is expected to continue to pose challenges in securing supply for exports.
While there were over 400 dairy manufacturers in Australia in 2012-13, the six largest firms (Murray Goulburn, Fonterra, Lion, Warrnambool Cheese and Butter, Parmalat and Bega Cheese) processed about 90 per cent of Australia’s raw milk supply.
DAIRY PRODUCT RETAILERS AND EXPORTS
Supermarkets and dairy processors have high bargaining power. The Australian domestic milk market is characterised by a supermarket milk price war, which in turn impacts dairy farmers’ returns. For Queensland and Western Australia, dairy demand is primarily domestic rather than export oriented. Decreasing farm returns are forcing dairy establishments in these
states to explore international markets.
RESEARCH AND DEVELOPMENT
Dairy industry output had expanded 90% over the 30 years to 2010 and milk production on a per hectare basis had increased by nearly 200 per cent. However, the amount of grazing land used by the industry to achieve this feat had actually fallen by around 30% since 1980 to 2010.
This increase in milk produced per hectare is explained by increased pasture production and utilisation, feed supplements and genetic improvement leading to more efficient cows.19 R&D was also important in other parts of the dairy value chain such as improved equipment and processes that create production efficiencies as well as new product development. The dairy industry adds value through processing to produce drinking milk (UHT), cheese, butter, milk powders, cream, yoghurts and a range of specialty products.
The RRDC Model (i.e. the operating partnership between the Commonwealth and the RRDCs(Rural Research Development Corporations) for the funding of research and development and other services to the industry) has proven to be very significant in the productivity improvements in Australian dairy.
Long term contracts signed by major dairy players also encourage innovation. For example, the signing of a 10 year supply contract with Coles, will enable Murray Goulburn to invest AUD 120 mn in two new milk processing plants in Sydney and Melbourne. This is being described as "the most significant investment in dairy processing technology since the dairy industry was deregulated in 2000“.27
THE VALUE CHAIN OF AUSTRALIAN DAIRY
Fertilisers
Water
Hay & Feed Grains
Cows & Pasture Land
Veterinary Chemicals
Energy
Labour

>11
Australian Dairy
Industry - 2015
21,994
15,396
12,896
7,511 6,770 6,398 6,314 85
107
168
220 240
258 268
1980 1990 2000 2010 2012 2013 2014
Number of farms Average herd size (in heads)
AUSTRALIAN DAIRY INDUSTRY – PRODUCTION
> In some cases, the land, capital and labour previously used in dairy farming was reallocated to more productive uses. These developments have led to fewer, but larger and more productive, dairy farms in Australia.
> The impact of severe droughts in the southeast of Australia (2002-03 and 2006-07), and cyclone and flood events in northern Australia (2006-07), on water availability, pastures and fodder.
> The resources investment boom, which resulted in an appreciation of the Australian dollar had a significant impact on the competitiveness of agricultural exports (including dairy). Moreover, strong competition for resources (such as labour) from the mining sector has implications for other domestic industries, including the dairy product manufacturing sector.
> Farmer demography: the average age of Australian dairy farmers has been increasing: up from 48 in 1990 to 53 in 2014. There is some evidence that dairy farmers approaching retirement prefer to repay farm debt, which can contribute to lower levels of investment in herd numbers.
> To a lesser extent, the relative attractiveness of exporting live dairy heifers. One factor contributing to this is the increased volatility in farm cash incomes due to high input costs and fluctuating farmgate prices has led many farmers to participate in the export heifer trade in an attempt to stabilise farm income.
FARMS & AVERAGE HERD SIZE
CONSOLIDATION AND DEREGULATION
The dairy industry in Australia continues to consolidate. The fall in the number of registered dairy farms (from 21,994 in 1980 to 6,314 in 2014) and increase in average herd size (from 85 cows in 1980 to 268 cows in 2014) reflect this key trend.
The decrease in the number of farms is attributed to the dairy deregulation in July 2000, when farmers received AUD 1.73 billion for restructuring.24 The farm numbers fell from 12,500 in year 2000 to 6,314 in 2014.
Average herd size has increased from 85 cows in 1980 to an estimated 268 currently. There is also a strong trend emerging towards very large farm operations of over 1,000 heads of dairy cattle.
Improved herd genetics as well as advances in pasture management and supplementary feeding regimes have seen average annual yield per cow double from 2,900 litres to around 5,900 litres over the period from 1984 to 2014.
Combining this increase in yields per cow with average herd sizes that are nearly two and a half times larger, the average milk production per farm has increased from 295,000 litres to 1,460,000 litres per year over the same period. However, the total national herd size has reduced by 192,000 heads (10% decline) from 1980 to 2014.
MILK PRODUCTION
Raw milk production in Australia increased dramatically through the 1990s until the early 2000s around the time of deregulation, and reached a historic peak of 11.3 billion litres in 2001-02. In 2013-14, Australia produced 9.2 billion litres, 18 per cent below the 2001-02 peak.
The lack of growth in Australia’s raw milk supply in recent years can be attributed to17:
> The structural adjustment associated with industry deregulation. The removal of incentives for overproduction in 2000 encouraged dairy farms to become more productive (to ensure viability in the absence of government assistance).
Source: Dairy Australia
-
6.1 7.2
8.0 8.5 8.9
-
6.1
1.0
0.8
0.5 0.4 0.3
9.2
VIC NSW TAS SA QLD WA Australia
MILK PRODUCTION BY STATE – 2013/14(In billion litres)
Victoria accounts for almost 66% of the total milk produced
by Australia
Source: Dairy Australia
-
1,000
2,000
3,000
4,000
5,000
6,000
7,000
-
2
4
6
8
10
12
1980 1990 2000 2010 2012 2013 2014
litres
billion litre
s
Milk Production Avg annual yield/cow (RHS)
MILK PRODUCTION AND YIELD 2013-14Industry consolidation has been
accompanied by higher yield
Source: Dairy Australia

>12
Australian Dairy
Industry - 2015
-
2.2
4.4
6.6
8.8
11.0
2004 2005 2006 2007 2008 2009 2010 2011 2012 2013 2014
Liquid Milk Milk Processed
30%
27%
27%
11%
5% Cheese
Drinking Milk
SMP/Butter Milk
Powder
WMP
Other
UTILISATION OF AUSTRALIAN MILK (2013-14)
Total Production 9.24 billion
litres
DRINKING MILK Vs MILK FOR MANUFACTURING (2013-14) (In million litres)
CONSUMPTION
Per capita consumption of milk products in Australia is high compared to other countries and has barely changed in the last decade, a trend which is unlikely to change in the foreseeable future.
Around 27% of Australia’s milk supply is consumed in the form of liquid drinking milk, with the balance employed in the production of dairy products.
MAJOR CONSUMPTION TRENDS
The major Australian consumer dairy products are drinking milk, cheese, butter and butter blends, and yogurt.
Australian per capita consumption trends over the past 20 years have varied remarkably for each individual dairy product, reflecting changes in consumer tastes and preferences.
These changes have been a response to a number of factors such as multicultural influences on food trends, health perceptions around dairy products and manufacturers’ responses (with low-fat variants), new product development, flavour and packaging innovations, competitive category offerings, and the distribution and hence availability of products.20
Per capita consumption of drinking milk is currently estimated at just over 106 litres, remaining at very high levels compared to many other countries partly attributed to the “coffee culture” in Australia during the last decade. Demand in Australian fresh milk consumption is shifting from regular milk to modified milk types such as reduced and low-fat milks.
Cheese consumption has stabilised at nearly 13.5 kg per person in the recent years—with approximately 55% being cheddar types and the remaining 45% spread across the wide varieties available in Australia.
Annual per capita consumption of butter in Australia is 3.9 kgs. Consumers continue to remain interested in the ‘naturalness’ of butter, together with its superior taste and cooking functionality.
MANUFACTURING OF VALUE ADDED PRODUCTS
Many successful dairy manufacturers are shifting resources towards higher value dairy products and using quality as a point of differentiation. Other manufacturers have successfully differentiated their products based on image, size and ownership.17
One noteworthy example is lactoferrin, a nutrient found in milk which is used as an ingredient in a range of products. The major producer of lactoferrin in Australia is Bega Cheese at its Tatura plant in northern Victoria. With rapidly increasing demand it now sells for as much $1000 a kilogram.17
Some manufacturers have chosen to highlight their presence in local communities, often combined with their relatively small size or farmer-based ownership, to differentiate their products and extract additional margin.
The domestic wholesale of milk powders increased more than four times from 12,324 tonnes in 2012 to 59,732 tonnes in 2014
Although per capita consumption has stabilised for cheese and liquid milk and even fallen for butter, population growth of 1.8% per annum will continue to increase domestic demand for dairy products.15
Increasingly, yoghurt is seen as a snack of choice for busy consumers, merging the best of both convenience and health with per capita consumption at over 7.5kg per year (2013-14)20.
Source: Dairy Australia
Source: Dairy Australia
AUSTRALIAN DAIRY INDUSTRY – CONSUMPTION AND DEMAND DRIVERS

>13
Australian Dairy
Industry - 2015
33%
24%
18%
11%
2%
5%
2%5%
South-East
Other Asia
Greater China
Middle East
Americas
Europe
Africa
Other
594
425
276
239
217
190
128
117
GreaterChina
Japan
Singapore
Indonesia
Malaysia
Thailand
NewZealand
UAE
Exports are the key driver of growth for the Australian dairy sector. Australian dairy exports have grown from AUD 969m in 1980 to AUD 3.2bn in 2014 at a CAGR of 3.6%.15
While Australia accounts for an estimated 2% of the world’s milk production, it is a significant exporter of dairy products. As of 2013 Australia ranks fourth in terms of world dairy trade—with 7% share—behind New Zealand, the European Union and the United States.
Australia’s share of global dairy exports has declined by 15% between 2002 to 2012, due to factors mostly outside government or manufacturer control, such as drought, the removal of incentives for over-production, dairy farmer demography, strong domestic demand for dairy products, volatile international commodity prices and the appreciation of the Australian dollar.17
During the same period international competitors have increased production volumes (significantly for New Zealand) and increased market focus (the USA).
In the international market, Australian dairy products are perceived as safe, attractive due to pasture-based feeding, and of higher quality.
Australia’s variety of processing companies, factory sizes and broad product range could be an advantage compared to some competitors who are more aligned to large-volume commodity business. These factors can allow Australian processors to supply more value-added dairy products that can better meet customer needs in terms of specifications, logistics, innovations and support. A growing component of total Australian dairy exports is ‘finished’ products that are processed and packaged into their final saleable format prior to export. These value-added products provide significant economic benefit within Australia and help maintain the reputable image of Australian dairy.10
The Australian dairy industry is also open to imports of dairy products (mostly from New Zealand) with imported products contributing an estimated 25% of domestic cheese market and 30% of domestic butter consumption in 2013/14.
$765
$708
$613
$243
$150
$732
$3,211
Cheese SMP WMP Butter/AMF Milk Other Total Exports
DAIRY EXPORTS BY PRODUCTS (2014) (In AUD million)
AUSTRALIAN DAIRY INDUSTRY – TRADE
KEY EXPORT DESTINATIONS
The Australian dairy industry exports almost 38% of its manufactured products. Most of these exports are destined to Asian countries (key markets include China, Japan and Indonesia) which account for approximately 75% of total export value in 2014, markets which Australian dairy companies have been supplying over a number of decades.
Greater China (including China, Hong Kong and Macau) is now the single most important export market for Australia, accounting for 19% of exports by both volume and value. The recently signed China Australia Free Trade Agreement bodes well for Australian Dairy as it will ultimately remove all the export tariffs faced by Australian exporters.
This concentration of exports in Asia reflects both Australia’s geographic proximity to these markets and the extent to which Australia is excluded from other major markets by direct restrictions (as in the case of the EU or the impact of the export subsidy programs of major competitor countries).
South East Asian developing markets have considerable potential for consumption growth as incomes rise and diets become more ‘westernised’ and will therefore deliver volume growth. Conversely established markets like Japan and South Korea offer pockets of competitive advantage for certain Australian export products resulting in higher value per unit of volume. FTAs with these markets will provide an improved market access and extended comparative advantage
Source: Dairy Australia
AUSTRALIA DAIRY EXPORTS BY GEOGRAPHY (2014)
TOTAL EXPORTS
AUD 3,211m
Source: Dairy Australia
TOP EXPORT COUNTRIES (2014) (In AUD million)
Source: Dairy Australia

>14
Australian Dairy
Industry - 2015
5.1%4.7%
3.8%
5.2% 5.5%
-
1.2%
2.4%
3.6%
4.8%
6.0%
40
52
64
76
88
100
2009-10 2010-11 2011-12 2012-13 2013-14Dairy Cattle Exports % of Milking Cows
('000 h
eads)
Dairy heifer exports have been steadily rising since 2008-09, with about 90,000 heifers exported in the past year, some fetching near record prices of more than AUD 2,000.The value of dairy cattle exports has increased from AUD 102.6 million in 2008-09 to ~AUD 200 million in 2013-14, witnessing an increase of almost 100%.26
What drives farmers to sell live heifers?
After struggling with drought for years, many Australian dairy farmers are now coping with low farm gate milk prices. The high premium paid by importing countries such as China provide a welcome source of non-milk income
Is this export trend sustainable in the long term ?
According to some industry sources, with about one million heifers available to the Australian industry, losing more than 5% a year is not sustainable. The national herd size has been steady in recent years, but numbers need to be built up to cope with the growth in export demand for dairy products.
Is China’s import of dairy herd sustainable in the long term?
China’s rapidly increasing milk demand has been supported by 70% imports. This import dependency is anticipated to continue into the future even if domestic production grows at the estimated 5% per annum rate as supported by life heifer trade. The China supply demand gap keeps widening, while domestic markets stall for principal exporters as such they will seek to extend export flow to leverage their productive capacity.
China is the largest export destination for Australian heifers
Herd rebuilding and the stocking of new large-scale farms saw strong demand from China. Dairy cattle exports from Australia increased by 33% during 2013-14 as China took in 78,896 herd with an estimated value of A$170m FOB.
NUMBER OF DAIRY CATLE EXPORTS FROM AUSTRALIA, AS A PERCENTAGE OF MILKING HERD
The CHAFTA may deliver immediate benefits to Australia's dairy heifer export trade. The current 10% tariff on live cattle export will be eliminated in 4 years. As China builds its own cow inventory to satisfy the growing domestic demand of milk products, a long term continuation of this export trend could make China a competitor rather than a customer for Australian dairy products.
After China’s 85% share, Pakistan and Russia have a of 7% and 4% market share respectively in Australian dairy cattle exports.
Overall benefits of heifer trade
For ongoing farmers, this serves as an alternative source of income to mitigate regimes of adverse farm gate milk price. On the other hand this broadens asset exit outlets and deep liquidity for retiring farmers who lack personnel for a succession plan. For vertically integrated international operations it supports relationship building and value adding alliances
AUSTRALIAN DAIRY INDUSTRY – TRADE
CHALLENGE FOR AUSTRALIA: LIVE DAIRY HEIFER EXPORT?
Source: Meat & Livestock Australia

>15
Australian Dairy
Industry - 2015
-
1,200
2,400
3,600
4,800
6,000
Q1 08 Q3 09 Q1 11 Q3 12 Q1 14 Q3 15 Q1 17 Q3 18Milk Powder
MILK POWDER PRICES IN AUSTRALIA (In USD/ Tonne)
AUSTRALIAN DAIRY INDUSTRY – DRIVERS OF AUSTRALIAN DAIRY PRICES
-
$2
$4
$6
$8
$10
$12
-
¢10
¢20
¢30
¢40
¢50
¢60
2007 2008 2009 2010 2011 2012 2013 2014
$/k
g m
ilk s
olidC
ents
/litre
Milk Milk Solids (RHS)
TYPICAL FACTORY PAID PRICES IN AUSTRALIA
Government involvement is largely limited to the administration of food standards and food safety assurance systems.
Manufacturers’ demand for raw milk is based on demand (and expected returns) in domestic and export dairy product markets – i.e. demand for raw milk is a derived demand. With manufacturers competing to purchase raw milk from farmers. This competition ensures that the price for raw milk will be equal to the maximum price that the marginal manufacturer is prepared to pay. As such, world prices of heavily traded dairy products play a significant role in determining the raw milk price paid by all manufacturers, given the degree of trade exposure of the Australian industry. In practice, however, supply agreements between manufacturers and farmers are complex. They include a range of incentives, bonuses and penalties to encourage raw milk supply of a particular quantity, quality, reliability, or at particular times, and can therefore lead to some differences in prices offered by manufacturers to farmers for raw milk.17
At an average of approximately USD 50 per 100kg of milk solids in 2013, Australian dairy farmers generally received a price comparable to many of the major producing countries, changing the past trend where one of the lowest prices were received by Australian farmers.15
VARIATION IN FARMGATE PRICES RECEIVED ACROSS AUSTRALIA
Farmgate milk prices farmers receive can vary significantly around Australia and simply reflect how milk is used in the marketplace. In some dairy regions (such as in Queensland and Western Australia), it is not cost-effective for dairy processors to produce heavily traded products, as farmgate milk prices are higher than in South Eastern Australia. As a result, dairy processors in these regions generally only produce more perishable dairy products for local markets.
CONCERNS RAISED BY $1 MILK
Lower retail prices for private-label milk in supermarkets have caused concern among some sections of the dairy farming community, especially where dairy production is more highly oriented towards drinking milk products, such as in Queensland and Western Australia.
DAIRY PRODUCT PRICES: IMPACT OF INTERNATIONAL DAIRY PRICES
The Australian dairy industry is highly dependent on international markets, with 73% of milk production being exposed to world prices for butter, cheese and milk powders. As such, average Australian milk prices are strongly correlated with export returns. Over the last three decades more than 90 per cent of the annual variation in milk prices can be explained by movements in average export returns.15
Moreover, as Australian dairy exports accounted for only 7% of global dairy trade in 2013-14, domestic dairy producers are ‘price takers’ on international dairy prices rather than being ‘price makers ’. Further, domestic prices for dairy products (mostly less perishable products such as milk powder and cheese) closely follow international prices.
Australian dairy manufacturers will generally not sell into the domestic market at a lower price than can be obtained in export markets, and competition amongst domestic manufacturers and from imports (noting import barriers such as tariffs are low) will ensure that domestic consumers do not pay more than the world price (notwithstanding there will be some divergence in prices due to quality differences).
The properties of more perishable dairy products (such as drinking milk and cream) make them costly to transport long distances, meaning Australia conducts little trade in these markets. For these products, domestic prices reflect the intersection of domestic supply and domestic demand.
That said, raw milk is an input for both heavily traded and less-traded products. Because world prices for heavily traded dairy products have a significant impact on the raw milk price (discussed below), the supply (and price) of less-traded dairy products in Australia is influenced by world prices through the raw milk price.17
FARMGATE PRICES
As a consequence of deregulation Australian dairy farmers have been operating in a deregulated and open market environment for over a decade now.
Forecast
Source: ANZ
Source: Dairy Australia

>16
Australian Dairy
Industry - 2015
67,250 64,700
(9,600)
Average Farm Profit
2010-11 2011-12 2012-13
AVERAGE FARM PROFIT IN AUSTRALIA (In AUD)
COMPETITIVENESS OF AUSTRALIAN MILK PRODUCTION COSTS - INPUTS TO MILK PRODUCTION
MAJOR COST DRIVERS FOR RAW MILK PRODUCTION IN AUSTRALIA
Australian dairy farmers face a number of challenges, including growing farm debt (and the associated interest costs), and a highly competitive global trading environment.
Fodder and labour have the highest share in total raw milk production costs
Fodder and labour represent the most significant recurrent costs for Australian dairy farms. Over time, dairy farms have used proportionally less labour and more fodder to produce a given volume of milk. Over the period 1989-90 to 2012-13, fodder costs per litre of raw milk more than tripled in nominal terms (from 3.1 cents per litre to 11.6 cents per litre). For other key dairy farming inputs (such as labour, repairs and maintenance, fertiliser and water), costs per litre have remained relatively stable since 1989-90 (in nominal terms). 17
An increasing reliance on fodder over pasture is driving up fodder costs
Although most Australian dairy farmers rely on pasture for the bulk of herd feeding requirements, fodder is often used as a supplementary source of feed (to varying degrees). Reliance on fodder tends to be greatest in drier areas.
A high number of drought years over the last decade, and an increasing shift towards year-round production systems, have also contributed to the increase in fodder use by Australian dairy farmers.
Labour costs have been contained
Declining imputed labour costs is the most important factor that helped in containing labour costs. The imputed labour cost is an estimate of the cost of the time spent in the business by people with a share in the business, such as the owner, the owner’s family, or a sharefarmer that owns assets in the business (as compared to hired labour). 17
BREAK UP OF AVERAGE COST PER DAIRY FARM AUSTRALIA 2012-13 Per cent of average total costs per farm
Source : ABARES (2014b)
Source : ABARES
Debt costs have risen in Australia
The average Australian dairy farm business debt rose, in nominal terms, from about $289,000 in 2001-02, to about $780,000 in 2012-13. Much of this rise is attributable to consolidation in the industry and the increased average size of dairy farms.
FARM PROFITABILITY TRENDS IN AUSTRALIA
Dairy farm business profitability (total cash receipts less total cash costs, depreciation and imputed labour costs) has been more volatile since industry deregulation and the average Australian dairy farm did not return a business profit for six of the last ten years. However, when viewed across the decade as a whole, the average dairy farm has been profitable (and more profitable than in the ten year period immediately prior to deregulation) owing to near record returns in profitable years, despite the effects of severe droughts.17
It is important to note that these averages mask that, in any given year, a significant portion of Australian dairy farms will fail to cover cash costs or make a profit — for example, although the average Australian dairy farm recorded a nominal farm business profit of about $64,700 in 2011-12, about 5% of dairy farms did not earn enough revenue to cover their cash costs that year.17
Note: Other costs include Animal health and breeding (3%), Cropping (3%), Water (3%) and Other Operating costs
24%
19%
9%
8% 6%
4% 3%
27%
-Fodder Labour Repairs D&A Fertiliser Fuel Electricity Other Total

>17
Australian Dairy
Industry - 2015
-
7
14
21
28
35
Brazil AUS NZ Ireland
2002 2012
-
9
18
27
36
45
1998 2000 2002 2004 2006 2008 2010 2012 2014
AUS NZ US Italy
64
47
58
49
36
43
34
-
14
28
42
56
70
Western Europe CEEC and MiddleEast
Africa North America South America Asia Oceania
Feed Costs Total Labor Costs Total Land costs Total Capital Costs Machinery and building Other Costs
COMPETITIVENESS OF AUSTRALIAN MILK PRODUCTION COSTS - GLOBAL COMPARISON
GEOGRAPHIC BREAK UP OF RAW MILK PRODUCTION COSTS IN 2012 : IS AUSTRALIA LOSING COST ADVANTAGE? (In USD per 100Kg ECM*)
Note: * The IFCN database on milk production standardises milk to 4% fat and 3.3% protein using the energy corrected milk formula (ECM), ECM formula: ECM milk = (milk production * (0.383 * % fat + 0.242 * % protein + 0.7832) / 3.1138)
On a broader geographic level, until 2012, Oceania had the lowest raw milk production costs.18 Lower cost pasture-based production system used in Australia and New Zealand was the key driver for lower cost production in Oceania region.
Raw milk production costs in Australia are competitive with other major dairy producing regions (including New Zealand). This reflects continuous on-farm productivity gains over the past two decades, natural (including climatic) advantages and Australia’s commitment to dairy industry deregulation.17
However, in recent years, farm cost structures have increased in response to the need to adapt to drier conditions as rain fed pastures are contributing a lower share of the total feed base available to the national herd. Further reasons to shift to grain feed systems are to realise higher yield per cow (purely pasture fed produce on an average 4,605 litres per cow (2013) compared to 8,388 litres per cow for herds fed over 2.5 tonnes grain feed per cow per year) and to reduce seasonality in production.
These factors, along with the appreciating AUD in recent years has narrowed the cost-gap between low-cost producers, such as Australia, and regions with traditionally higher on-farm costs, such as Europe and the United States. However, this convergence of production costs (farmgate prices) has not removed the wide differences in cost components between different farming systems. Feed comprises around 60% to 65% of total production costs for intensive feedlot dairy systems, such as those used in the US. In pastoral systems (AU & NZ) feed is only 20% to 40% of total costs, while other farm costs play a larger role.
Increasing cost of other inputs (land, farm debt, labour) have affected the competitiveness of pasture based dairy farming
Increase in prices for dairy land continue to converge with western competitors. However the prices in Australia remain significantly lower when compared to New Zealand, a major attraction for foreign investors.
DAIRY LAND PRICE 2002-12 : GEOGRAPHIC COMPARISON (In ‘000 USD per ha)
CONVERGING INTERNATIONAL FARMGATE PRICES (Euro per 100 Kg)
Thus, the increase in feed costs and land costs (hence, rising farm debt costs) has resulted in convergence of farmgate prices. Farmgate prices being the largest input for dairy processors, this increase poses a significant challenge to the competitiveness of Australian dairy products in the international market.
Source: IFCN study 18
Source: CLAT
Source: Rabobank
These costs have changed significantly since 2012, as shown in the convergence of farmgate price graph. These costs are indicative of a break up of input costs globally.

>18
Australian Dairy
Industry - 2015
COMPETITIVENESS OF AUSTRALIAN DAIRY PRODUCT PRODUCTION COSTS
INPUTS TO DAIRY PRODUCT MANUFACTURING17
Raw milk is the largest input cost for dairy product manufacturers. Other costs include manufactured food and beverage inputs (often milk-based), labour, packaging, transport, energy and capital.
RAW MILK PRICE
Raw milk prices paid by dairy product manufacturers in Australia are generally lower than those paid in Ireland, the United Kingdom and United States (although the cost gap has narrowed), and broadly on a par with those in New Zealand. These prices are set according to the demand and supply of raw milk and reflect the relatively low cost of raw milk production in Australia. This suggests that Australian dairy manufacturers enjoy a raw milk unit cost advantage relative to several of their key competitors.
Manufacturing costs are also affected by other (non-price) characteristics of raw milk supply, such as the seasonal variability of milk supply which will influence the capacity utilisation of manufacturing plants and the scale of these plants, and the reliability and quality of milk.
LABOUR COSTS
The input cost share of labour into Australian dairy product manufacturing has increased over time along with rising labour costs. Moreover, labour represents a greater proportion of input costs for Australian dairy product manufacturers than for manufacturers in New Zealand, the United States and the United Kingdom. Possible reasons for this include greater labour intensity in Australian dairy product manufacturing, higher wages, or lower productivity.
Australian hourly labour costs in the food, beverage and tobacco product manufacturing sector in Australia were substantially higher than those in the United Kingdom, United States and New Zealand in 2012 (in common currency terms).
DIRECT AGRICULTURAL SUPPORT ESTIMATES BY COUNTRY : AS A PERCENTAGE OF GROSS FARM RECEIPTS (2012)
Source : OECD & Rabobank 2013
PRODUCTIVITY PERFORMANCE
Productivity performance highlights the real costs of production and thus, along with input prices, is an important driver of an industry’s ability to compete. Australia’s productivity performance in the food, beverage and tobacco manufacturing sector has been relatively poor — multifactor productivity in the sector steadily declined between 2001 and 2011, while total factor productivity declined between 2000 and 2007. These data are not necessarily reflective of productivity in the dairy manufacturing sector, but some of the factors explaining low productivity growth in the sector are likely to be relevant.
ENERGY COSTS
There is a high degree of variation in the energy intensity of production across countries — likely to be due to differences in production techniques, technology and the scale of production. For comparison Fonterra’s New Zealand operations’ overall energy use in 2010 of just under 10GJ/MT of product is similar to Australia’s energy use in milk powder production. For manufacturers of high-energy products such as milk powder, energy price increases would have had a more substantial bearing on cost-competitiveness.
OTHER COSTS AND ISSUES
Apart from these costs, transport cost is another major cost that can impact competitiveness of Australian dairy products compared to other countries.
Government Support: Also, a major factor impacting competiveness is the amount of government support a country’s dairy sector receives. Australian government support to the industry through marketing and price support schemes and subsidies led to inefficiencies and impeded increasing in productivity. Further, it prevented more efficient farmers from expanding operations.
63%56%
21% 19% 16% 14%7% 5% 3% 3% 2% 1%
19%
Norw
ay
Japan
Indonesia
EU
Chin
a
Canada
USA
Bra
zil
South
Afr
ica
Austr
alia
Ukra
ine
New
Zeala
nd
OECD

>19
Australian Dairy
Industry - 2015
-
2.8
5.6
8.4
11.2
14.0
1989 1992 1995 1998 2001 2004 2007 2010 2013
NZ AUS
Dairy Industry Restructuring Act
Deregulation;11c levy on retail milk 11c levy Ceases
Drought
NZ signed FTA wih China
Australia still to realize benefits of CHAFTA signed in November 2014
AUSTRALIAN Vs NEW ZEALAND - COMPARISON OF DAIRY EXPORTS
NEW ZEALAND’S DAIRY EXPORTS HAVE SHOT UP, WHILE AUSTRALIA’S HAVE FLATLINED (In AUD billion)
At the start of the 2000s, Australia’s dairy industry exports were at par with those of New Zealand. A decade later, New Zealand’s exports have doubled while Australia’s exports remained more or less stagnant. The following factors helped New Zealand become the largest exporter of dairy products in the world.
In particular, the New Zealand dairy industry is oriented toward exports. It has much larger processing plants, which give a scale advantage, and an industry model which keeps raw milk costs down by allowing production to surge in spring, whereas the Australian industry is more domestically focused and smooths monthly production by grain feeding, which increases raw milk costs.
Helping its competitiveness even more, in 2008 New Zealand signed an FTA with China, giving them a 36 c/kg* landed cost advantage over Australia. Despite the high utilisation of Australian processing plants from milk volume smoothing, they still lack scale and are higher cost compared to plants in New Zealand.This renders Australian dairy products 0.2 c/kg* costlier than products manufactured in New Zealand.16
Currently, the average New Zealand dairy farm is 80% larger than a Victorian one, and processing plant utilisation is 15 percent higher.21 Fonterra, the New Zealand dairy products monopoly, spends proportionately 40% more on R&D and 300% more on marketing than Australia’s Murray Goulburn Co-operative.16
Apart from the China-New Zealand FTA there are other factors that give New Zealand more advantage to improve its dairy sector as compared to Australia.
One obvious example is the absence of drought compared with Australia, in 2002-03 and 2006-07. 2,000
3,000
4,000
5,000
6,000
1978–79
1980–81
1982–83
1984–85
1986–87
1988–89
1990–91
1992–93
1994–95
1996–97
1998–99
2000–01
2002–03
2004–05
2006–07
2008–09
2010–11
2012–13
New Zealand Australia
COW YIELD COMPARISON BETWEEN AUSTRALIA AND NEW ZEALAND (In Litres per cow per year)
Note: * represents the landed cost per kilo of skim milk powder
Previously lower-valued currency regimes were beneficial to trade levels at a time when in contrast Australia’s resources investment boom increased the value of the AUD, adversely affecting dairy exports. However as at March 2015, NZD appreciation exposes the currency to heightened macro economic sensitivity which could affect exports going forward. During deregulation removal of price controls led to strong productivity growth, with many smaller, less-viable (post-deregulation) producers exiting the industry leading to declining national herd size. Competition for land, labour and expertise amongst domestic industries is more intense in Australia over recent years due to the resource boom.17
Arguably, it is not entirely correct to conclude that had Australia’s dairy sector followed New Zealand’ dairy industry structure its exports would have witnessed a similar growth. The scale of processing plants, though very important, varies within both Australia and New Zealand and is not the only factor which can create cost competitiveness between countries. Other factors, such as Victoria having lower costs of raw milk production than New Zealand and Australia’s higher yield per cow than New Zealand can be capitalised upon.

>20
Australian Dairy
Industry - 2015
AUSTRALIAN DAIRY INDUSTRY –BARRIERS TO COMPETITIVENESS
POTENTIAL BARRIERS TO COMPETITIVENESS OF AUSTRALIAN DAIRY EXPORTS
EXTERNAL FACTORS
> The removal of production quotas in 2015, is widely expected to drive efficiency gains and increase dairy production in the EU. Some of this increased production will be exported to Asian markets, the key markets for Australian growth.
> The continued growth of exports from the United States could increase competition in Australia’s export markets. The US dairy industry is seeking to increase its export presence and has experienced a fourth consecutive year of record exports by volume.
> Expected growth in raw milk production volumes in other competitor countries such as Argentina could also dampen the competitiveness of Australian dairy exports.
> Russia’s import ban, which is expected to direct supplies from EU and the US to Australian export markets in Asia, increasing competition in these markets.
> Exchange rates - though the current AUD exchange rate is very much in favour of Australian dairy exports, an opposite swing in this trend could be a threat to Australian dairy exporters.
> Falling international dairy prices - with 7% share in global dairy trade, Australia is a price taker of dairy commodity prices, a fall in these could cause declining export returns which will in turn impact farm returns, leading to sluggish growth in milk production.
> Impact of RTAs/FTAs and other programmes Australia’s ability to negotiate significant FTAs with commercially meaningful outcomes will be critical to maximising returns for the industry. The bilateral agreements negotiated by competitor countries will also have an important bearing on trade flows, access to, and profitability in markets of choice.14
The estimated trade and financial benefits for the New Zealand dairy industry have grown rapidly since implementation of the China - New Zealand FTA on 1st January 2008. The six year period (2008-2013) has witnessed a four and a half fold increase in WMP imports and an almost eight fold increase in SMP imports. The financial benefits to New Zealand origin milk powders from lower tariffs versus those paid by competitors are estimated to have risen to between $40 and $50 million in 2014. This advantage grows annually as the NZ-China FTA tariff reduction schedule matures each year. (Source : ADIC) .
The China Australia Free Trade Agreement will help Australian exports, but it is expected to take some time for Australia to realise economic benefits.
Programmes like the US’s Co-operatives Working Together are reducing Australia’s market share in key markets like Japan.
INTERNAL FACTORS
> Strong competition for resources (land, capital and skilled labour) among domestic industries is set to persist in Australia. Labour is one of the largest costs facing dairy product manufacturers in Australia. Labour costs — and difficulties attracting experienced and skilled labour — also present challenges for Australian dairy farmers.
> Growing farm debt (and the associated interest costs) - since deregulation the cost of debt servicing has increased while earnings have been pegged (estimated now to be at the same level as in the 1960s). Further debt has occurred as farmers have borrowed to maintain liquidity. Banks have downgraded the value of dairy farms because of their falling profitability, so that some farm values now offer insufficient security against current debts. This has increased the number of foreclosures. Investment on-farm is desperately needed for the growth of the Australian dairy sector.
> Australia’s relatively seasonal (by international standards) raw milk supply can present various challenges for manufacturers. For example, if seasonal variability means that capacity utilisation rates fall significantly outside of the peak raw milk production period, this may increase dairy manufacturing costs, all else equal. This is true for manufacturing plants of various scale, but is especially the case for small plants, where overhead and investment costs typically form a higher share of total costs.
> Transport issues: Transport costs represent one of the more significant cost elements for the dairy manufacturing industry. Transport has been identified as an area where government policy impedes the performance of the dairy manufacturing sector.
>21
Australian Dairy
Industry - 2015
POLICY BARRIERS AND IMPLICATIONS
LABOUR SHORTAGES
According to Australia Dairy Industry Council (ADIC), the dairy industry, like other agricultural commodities, experiences labour shortages in critical on-farm and manufacturing roles, particularly in rural and regional areas. The dairy industry has been actively developing and implementing strategies to attract, retain and develop a skilled workforce, but in the short term, immigrant labour is expected to help fill dairy’s acute skills shortage.
Government should work with industry to streamline and fast-track the application and approvals process for 457 visas for skilled dairy workers.
There should be more support for the dairy industry’s application for a Labour Agreement to improve access to skilled overseas workers.
It would also help to extend the duration of 417 and 462 visas from 6 to 12 months. Dairy should be included on the list of eligible industries for the Seasonal Worker Scheme and on Schedule 1 of the Skilled Occupation List. Australian and New Zealand Standard Classification of Occupations (ANZSCO) skills descriptions for dairy farm managers and workers should be revised to align with the Pastoral Award and relevant courses under the Australian Qualifications Framework.14
CONCESSIONAL LOANS
Some forms of drought assistance, such as interest rate subsidies and concessional loans provided to farmers might have shortcomings.
For example, these might discourage unviable farmers from exiting the industry. This, in turn, might prevent more efficient farm businesses from buying the land and other assets, and thereby expanding their operations. This might act as a dampener towards improving scale efficiencies in dairy farming.17
TRANPORT ISSUES
RURAL ROADS: There would potentially be efficiency benefits from using bigger tankers to transport milk when collecting it from farms. The main impediment to this, however, has been the quality of rural roads rather than specific regulatory barriers. Rural roads also affect the grain supply chain, and given the increasing contribution of grain feeds to the competitiveness of Australian dairy producers, improvements in the efficiency of grain supply chains is expected to reduce input costs for dairy farmers.17
TASMANIA DOMESTIC SHIPPING: Tasmania is home to a number of dairy product manufacturers, and Murray Goulburn has identified a lack of direct international shipping options from Tasmania as reducing the potential to export from the state, with products needing to be shipped to Melbourne initially and then re-loaded on to another ship for export.17
DISTORTIONS FROM BIOFUEL SUBSIDIES
According to ADIC and Dairy Australia, policies that mandate and/or subsidise biofuels production will increase the demand for resources required for food production leading to increasing feed grain prices, which may decrease the capacity of the Australian dairy industry to adapt to increased climate variability.17
ENERGY PRICES
Manufacturing of export oriented dairy products like milk powder and whey requires a substantial amount of electricity. Poor regulatory frameworks governing electricity markets, policies designed to reduce carbon emissions and to promote renewable energy, and the integration of Australian gas markets with global markets have added to spiralling energy costs in Australia, hurting the burden on Australia’s competitiveness in international dairy markets. 17
FOREIGN INVESTMENT
There has been active interest from a broad range of Chinese investors in Australian dairy assets particularly at farm level. This interest has been driven by enhancing supply continuity and in other cases as a learning opportunity to then later replicate best practise onshore in China. In either case Australia’s proximity and reputation for quality products has attracted the capital. There has also been a reasonable amount of assets available for sale based on failed succession planning as ageing farmers seek an exit strategy from active farming. The best cases of foreign investment have followed optimum asset size to attract investment, supported by experienced on-farm management and investors with distribution networks in Asian markets. There have still been active transaction enquiries despite the government’s counter intuitive signal of reducing FIRB thresholds from A$252m to A$15m. A more conducive signal would have been to model that threshing floor at the optimum level of a scalable investable farm which would then usher in much needed foreign (and domestic) investment.

>22
Australian Dairy
Industry - 2015
AUSTRALIAN DAIRY INDUSTRY – SWOT ANALYSIS AND CONCLUSION
•Adaptability & sustainability of proven production system
•Availability of plentiful feed grain supplies (with volatile cost)
•Highly cost effective production system
STR
EN
GTH
S
•Limited supplies of milking cows and replacement heifers
•Increased competition for irrigation water
•Potential competition from emerging low exporters
WE
AK
NE
SS
ES
•Global dairy demand is expected to outpace supply
•Changing economies for competing food ingredients
•Adopting technology for production gains
•Transformational advances in plant & animal technologiesO
PP
OR
TU
NITIES
•Threat of dairy’s ethical proposition
•Competition for skilled people
•Producers operating on volatile production margin
•Uncertainty regarding emission regulations
TH
REA
T
>Australian Dairy Industry SWOT Analysis
CONCLUDING REMARKS
The rising demand for dairy products in emerging economies (especially Asia) underpinned by rising incomes, urbanisation and encouraging demographics creates a highly valuable opportunity for Australian dairy trade.
The challenge, however lies in ensuring that Australian dairy products are highly competitive in the global market in terms of both price and quality.
In view of the current focus shown by competitor countries (the USA, EU and New Zealand) towards Asian markets, the challenge becomes even more pronounced.
With a sluggish milk production growth and declining farm returns, there is a lot to be accomplished in the upper end of the value chain. Despite the huge leaps in productivity as a result of the consolidation post-deregulation, the size of the national herd has declined.
Convergence of international farmgate prices could be a potential dampener for dairy processors in Australia as low farmgate prices used to be a competitive advantage for the Australian dairy sector until recently.
Significant investment is needed for both on farm activities and value adding milk processing activities.
A lot depends on the ability of the manufacturing sector to add value and earn the highest possible return on raw milk and to gain more access to international markets in order to increase the competitiveness of Australian dairy products.

>23
Australian Dairy
Industry - 2015
References
1. “The World Dairy Situation 2014”, Bulletin of the International Dairy Federation 476/2014
2. OECD/Food and Agriculture Organization of the United Nations (2014), OECD-FAO Agricultural Outlook 2014, OECD Publishing http://dx.doi.org/10.1787/agr_outlook-2014-en
3. “Dairy: World Markets and Trade”, United States Department of Agriculture, Dec 2014
4. “China’s Growing Dairy Demand A Boon For Quality Local And Foreign Brands”, International Business Times, March 2014 http://www.ibtimes.com/chinas-growing-dairy-demand-boon-quality-local-foreign-brands-1562191
5. “Indonesia Dairy and Products Annual Report 2014”, USDA Foreign Agricultural Service, Oct 2014
6. “Hitting the sweet spot : The growth of the middle class in emerging markets”, ERNST & YOUNG, 2013
7. “Peoples Republic of China Dairy and Products Annual Report 2014”, USDA Foreign Agricultural Service, Dec 2013
8. “Republic of Korea Dairy and Products Annual Report 2014”, USDA Foreign Agricultural Service, Oct 2014
9. “Japan Dairy and Products 2015 Market Outlook and 2014 Situation Update Summary”, USDA Foreign Agricultural Service, Oct 2014
10. “Trade and the Australian Dairy Industry”, Dairy Australia, 2013
11. “Industry Overview” http://www.fdii.ie/idia, The Irish Dairy Industries Association, 2015
12. “Dairy accounts for nearly 10 cents of every euro the Dutch earn abroad”, http://www.nzo.nl/en/, 2013
13. “2014 Year in Review”, U.S. Dairy Export Council, Dec 2014
14. “Australian Dairy Industry Response to the Productivity Commission Study : Costs of Doing Business: Dairy Product Manufacturing”, Australian Dairy Industry Council and Dairy Australia, May 2014
15. “Australian Dairy Industry in Focus 2014”, Dairy Australia, 2014
16. “Compete to Prosper : Improving Australia’s global competitiveness”, McKinsey Australia, July 2014
17. “Relative Costs of Doing Business in Australia: Dairy Product Manufacturing”, Productivity Commission 2014, Research Report, Canberra, Sep 2014
18. Torsten Hemme, Mohammad Mohi Uddin and Oghaiki Asaah Ndambi “Benchmarking Cost of Milk Production in 46 Countries”, Journal of Reviews on Global Economics, 2014
19. “The Impact of Innovation on the Dairy Industry over the Past 30 Years”, commissioned by the Department of Primary Industries and Dairy Australia, 2011
20. Consumption Summary, Dairy Australia website, http://www.dairyaustralia.com.au/Markets-and-statistics/Production-and-sales/Consumption-Summary.aspx, 2014
21. “What it takes to compete in the global dairy industry?” by Dr. Jon Hauser, Nov 2013
22. Bellamy, Kevin (Rabobank International) “Global emerging dairy in context”, IDF World Dairy Summit 2013
23. “Will milk be the next commodity to turn sour?”, Business Spectator, Jan 2015
24. “The Australian Dairy Industry : From family farm to international markets”, PriceWaterhouseCoopers, 2011
25. “IntoDairy -A business case for the growth of Tasmanian dairy industry “, Dairy Australia and DairyTas Board, May 2014
26. “Australia livestock export industry statistical review”, Meat & Livestock Australia, 2013-14
27. “Murray Goulburn and Coles enter long term deal”, The Standard, April 2013