australian equity research - baillieu holst online reports... · baillieu holst research top stock...
TRANSCRIPT
BAILLIEU HOLST RESEARCH 19 October 2015
Baillieu Holst Ltd ABN 74 006 519 393 www.baillieuholst.com.au Please read the disclaimer at the end of this report.
RESEARCH TEAM Nicolas Burgess
Head of Research
+61 3 9602 9379
Nick Caley
Analyst – Industrials
+61 3 9602 9283
Luke Macnab
Analyst – Industrials
+61 2 9250 8930
Josh Kannourakis
Analyst – Industrials
+61 3 9602 9265 [email protected]
Warren Edney
Analyst – Resources
+61 3 9602 9384
Mathan Somasundaram
Analyst – Equity Strategy, Quant
+61 2 9250 8947
Piers Flanagan
Associate Analyst
+61 3 9282 8127
Australian Equity Research
OCTOBER 2015
Top Stock Picks
Overall: We select the top picks across our 71 mid and small cap stock universe, as well as the outlook for the economy and equity market. We also provide our key insights from our listed investment company (LIC) coverage.
Equity market outlook: We maintain a bullish long term view on the Australian equity market with a 12 month index target level of 6100. Recent profit taking by global investors on currency worries has lowered the market to a fair value level of 5000 with no premium being paid for the substantially high dividend yield. We maintain our positive long term view on the yield trade (i.e. Banks, Div Financials and Telcos) while health care looks the best growth/currency story. We continue to favour the new economy (i.e. MITCH Universe – Media, Information, Telecom, Consumer and Health) over the old economy on a long term view. We expect short term profit taking with US reporting season risk, while China releases long term growth plans and the US Fed pushes back rate rise plans to help drive markets higher for a Christmas rally.
Key trends in stock picks: The top stock picks are shown in the table below (alphabetical order). Although Baillieu Holst employs a bottom-up, fundamental approach to stock analysis and valuation, there are some key themes common across the top picks. These include offshore earnings and upside to ongoing AUD weakness, technology and telecommunications, professional services, and, in resources, gold.
Listed Investment Companies (LICs): Baillieu Holst provides performance reporting and insights across a universe of 46 listed investment companies. Based on that analysis, our top picks include Diversified United Investments (DUI) in large caps, Future Generation Fund (FGX) in small caps, PM Capital Global Opportunities Fund (PGF) and Magellan Flagship Fund (MFF) in international, and Acorn Capital Investment Fund (ACQ) in the specialty sector.
Rating System: The Baillieu Holst stock rating system is based on BUY (stock’s total return is expected to increase by at least 10-15% from the current share price over the next 12 months), HOLD (total return is expected to trade within a range of ±10-15%) and SELL (total return is expected to decrease by at least 10-15%). Each stock is also assigned a risk rating of Low, Medium, High or Speculative.
SUMMARY OF TOP PICKS
Share Price
Stock Code Rating Risk Price Target Analyst
Donaco International DNA BUY High 0.80 1.15 Nick Caley
Empired EPD BUY High 0.85 1.20 Josh Kannourakis
Henderson Group HGG BUY Medium 5.65 7.00 Nicolas Burgess
M2 Group MTU BUY Medium 9.50 10.88 Luke Macnab
Mantra Group MTR BUY Low 4.11 4.40 Nick Caley
Northern Star NST BUY High 3.09 3.57 Warren Edney
QMS Media QMS BUY High 0.92 1.10 Nicolas Burgess
Saracen Minerals SAR BUY High 0.58 0.64 Warren Edney
Shine Corporate SHJ BUY Medium 2.01 3.50 Nick Caley
Speedcast International SDA BUY High 4.55 5.01 Luke Macnab
Steadfast Group SDF BUY Medium 1.48 1.80 Nicolas Burgess
Vita Group VTG BUY Medium 1.67 2.10 Josh Kannourakis
Page 1
BAILLIEU HOLST RESEARCH Top Stock Picks – October 2015
Baillieu Holst Ltd ABN 74 006 519 393 www.baillieuholst.com.au Please read the disclaimer at the end of this report.
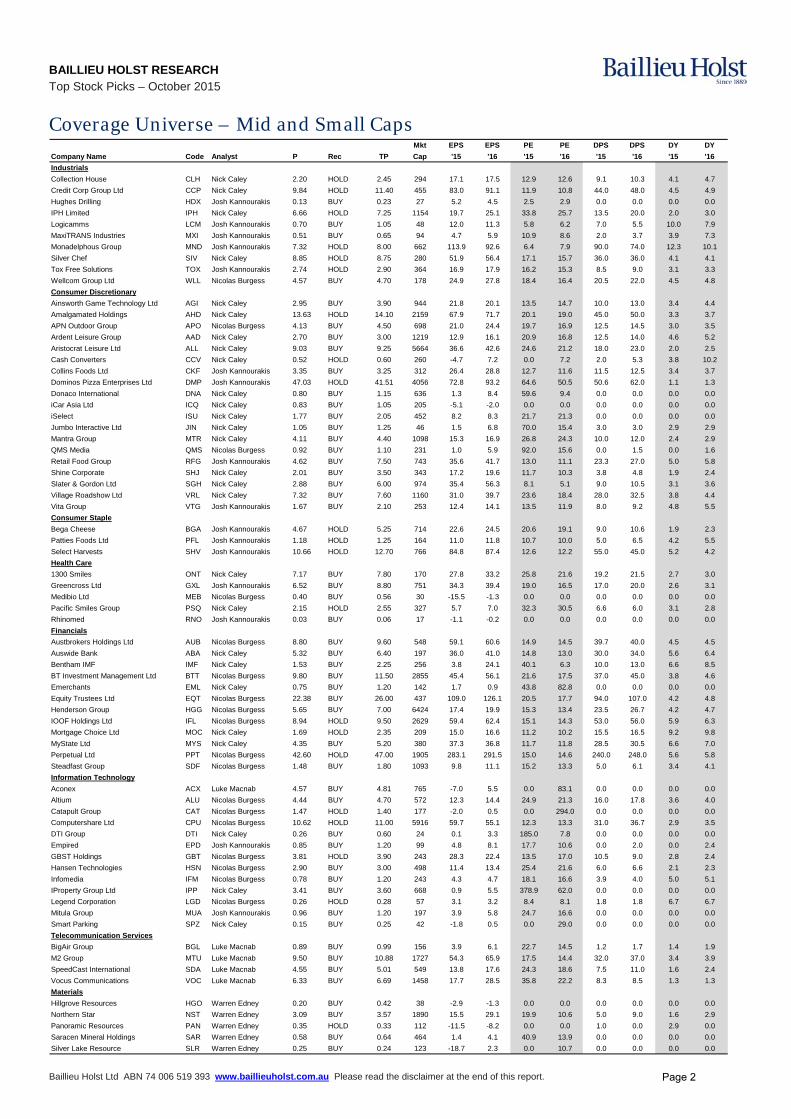
Coverage Universe – Mid and Small Caps Mkt EPS EPS PE PE DPS DPS DY DY
Company Name Code Analyst P Rec TP Cap '15 '16 '15 '16 '15 '16 '15 '16
Industrials
Collection House CLH Nick Caley 2.20 HOLD 2.45 294 17.1 17.5 12.9 12.6 9.1 10.3 4.1 4.7
Credit Corp Group Ltd CCP Nick Caley 9.84 HOLD 11.40 455 83.0 91.1 11.9 10.8 44.0 48.0 4.5 4.9
Hughes Drilling HDX Josh Kannourakis 0.13 BUY 0.23 27 5.2 4.5 2.5 2.9 0.0 0.0 0.0 0.0
IPH Limited IPH Nick Caley 6.66 HOLD 7.25 1154 19.7 25.1 33.8 25.7 13.5 20.0 2.0 3.0
Logicamms LCM Josh Kannourakis 0.70 BUY 1.05 48 12.0 11.3 5.8 6.2 7.0 5.5 10.0 7.9
MaxiTRANS Industries MXI Josh Kannourakis 0.51 BUY 0.65 94 4.7 5.9 10.9 8.6 2.0 3.7 3.9 7.3
Monadelphous Group MND Josh Kannourakis 7.32 HOLD 8.00 662 113.9 92.6 6.4 7.9 90.0 74.0 12.3 10.1
Silver Chef SIV Nick Caley 8.85 HOLD 8.75 280 51.9 56.4 17.1 15.7 36.0 36.0 4.1 4.1
Tox Free Solutions TOX Josh Kannourakis 2.74 HOLD 2.90 364 16.9 17.9 16.2 15.3 8.5 9.0 3.1 3.3
Wellcom Group Ltd WLL Nicolas Burgess 4.57 BUY 4.70 178 24.9 27.8 18.4 16.4 20.5 22.0 4.5 4.8
Consumer Discretionary
Ainsworth Game Technology Ltd AGI Nick Caley 2.95 BUY 3.90 944 21.8 20.1 13.5 14.7 10.0 13.0 3.4 4.4
Amalgamated Holdings AHD Nick Caley 13.63 HOLD 14.10 2159 67.9 71.7 20.1 19.0 45.0 50.0 3.3 3.7
APN Outdoor Group APO Nicolas Burgess 4.13 BUY 4.50 698 21.0 24.4 19.7 16.9 12.5 14.5 3.0 3.5
Ardent Leisure Group AAD Nick Caley 2.70 BUY 3.00 1219 12.9 16.1 20.9 16.8 12.5 14.0 4.6 5.2
Aristocrat Leisure Ltd ALL Nick Caley 9.03 BUY 9.25 5664 36.6 42.6 24.6 21.2 18.0 23.0 2.0 2.5
Cash Converters CCV Nick Caley 0.52 HOLD 0.60 260 -4.7 7.2 0.0 7.2 2.0 5.3 3.8 10.2
Collins Foods Ltd CKF Josh Kannourakis 3.35 BUY 3.25 312 26.4 28.8 12.7 11.6 11.5 12.5 3.4 3.7
Dominos Pizza Enterprises Ltd DMP Josh Kannourakis 47.03 HOLD 41.51 4056 72.8 93.2 64.6 50.5 50.6 62.0 1.1 1.3
Donaco International DNA Nick Caley 0.80 BUY 1.15 636 1.3 8.4 59.6 9.4 0.0 0.0 0.0 0.0
iCar Asia Ltd ICQ Nick Caley 0.83 BUY 1.05 205 -5.1 -2.0 0.0 0.0 0.0 0.0 0.0 0.0
iSelect ISU Nick Caley 1.77 BUY 2.05 452 8.2 8.3 21.7 21.3 0.0 0.0 0.0 0.0
Jumbo Interactive Ltd JIN Nick Caley 1.05 BUY 1.25 46 1.5 6.8 70.0 15.4 3.0 3.0 2.9 2.9
Mantra Group MTR Nick Caley 4.11 BUY 4.40 1098 15.3 16.9 26.8 24.3 10.0 12.0 2.4 2.9
QMS Media QMS Nicolas Burgess 0.92 BUY 1.10 231 1.0 5.9 92.0 15.6 0.0 1.5 0.0 1.6
Retail Food Group RFG Josh Kannourakis 4.62 BUY 7.50 743 35.6 41.7 13.0 11.1 23.3 27.0 5.0 5.8
Shine Corporate SHJ Nick Caley 2.01 BUY 3.50 343 17.2 19.6 11.7 10.3 3.8 4.8 1.9 2.4
Slater & Gordon Ltd SGH Nick Caley 2.88 BUY 6.00 974 35.4 56.3 8.1 5.1 9.0 10.5 3.1 3.6
Village Roadshow Ltd VRL Nick Caley 7.32 BUY 7.60 1160 31.0 39.7 23.6 18.4 28.0 32.5 3.8 4.4
Vita Group VTG Josh Kannourakis 1.67 BUY 2.10 253 12.4 14.1 13.5 11.9 8.0 9.2 4.8 5.5
Consumer Staple
Bega Cheese BGA Josh Kannourakis 4.67 HOLD 5.25 714 22.6 24.5 20.6 19.1 9.0 10.6 1.9 2.3
Patties Foods Ltd PFL Josh Kannourakis 1.18 HOLD 1.25 164 11.0 11.8 10.7 10.0 5.0 6.5 4.2 5.5
Select Harvests SHV Josh Kannourakis 10.66 HOLD 12.70 766 84.8 87.4 12.6 12.2 55.0 45.0 5.2 4.2
Health Care
1300 Smiles ONT Nick Caley 7.17 BUY 7.80 170 27.8 33.2 25.8 21.6 19.2 21.5 2.7 3.0
Greencross Ltd GXL Josh Kannourakis 6.52 BUY 8.80 751 34.3 39.4 19.0 16.5 17.0 20.0 2.6 3.1
Medibio Ltd MEB Nicolas Burgess 0.40 BUY 0.56 30 -15.5 -1.3 0.0 0.0 0.0 0.0 0.0 0.0
Pacific Smiles Group PSQ Nick Caley 2.15 HOLD 2.55 327 5.7 7.0 32.3 30.5 6.6 6.0 3.1 2.8
Rhinomed RNO Josh Kannourakis 0.03 BUY 0.06 17 -1.1 -0.2 0.0 0.0 0.0 0.0 0.0 0.0
Financials
Austbrokers Holdings Ltd AUB Nicolas Burgess 8.80 BUY 9.60 548 59.1 60.6 14.9 14.5 39.7 40.0 4.5 4.5
Auswide Bank ABA Nick Caley 5.32 BUY 6.40 197 36.0 41.0 14.8 13.0 30.0 34.0 5.6 6.4
Bentham IMF IMF Nick Caley 1.53 BUY 2.25 256 3.8 24.1 40.1 6.3 10.0 13.0 6.6 8.5
BT Investment Management Ltd BTT Nicolas Burgess 9.80 BUY 11.50 2855 45.4 56.1 21.6 17.5 37.0 45.0 3.8 4.6
Emerchants EML Nick Caley 0.75 BUY 1.20 142 1.7 0.9 43.8 82.8 0.0 0.0 0.0 0.0
Equity Trustees Ltd EQT Nicolas Burgess 22.38 BUY 26.00 437 109.0 126.1 20.5 17.7 94.0 107.0 4.2 4.8
Henderson Group HGG Nicolas Burgess 5.65 BUY 7.00 6424 17.4 19.9 15.3 13.4 23.5 26.7 4.2 4.7
IOOF Holdings Ltd IFL Nicolas Burgess 8.94 HOLD 9.50 2629 59.4 62.4 15.1 14.3 53.0 56.0 5.9 6.3
Mortgage Choice Ltd MOC Nick Caley 1.69 HOLD 2.35 209 15.0 16.6 11.2 10.2 15.5 16.5 9.2 9.8
MyState Ltd MYS Nick Caley 4.35 BUY 5.20 380 37.3 36.8 11.7 11.8 28.5 30.5 6.6 7.0
Perpetual Ltd PPT Nicolas Burgess 42.60 HOLD 47.00 1905 283.1 291.5 15.0 14.6 240.0 248.0 5.6 5.8
Steadfast Group SDF Nicolas Burgess 1.48 BUY 1.80 1093 9.8 11.1 15.2 13.3 5.0 6.1 3.4 4.1
Information Technology
Aconex ACX Luke Macnab 4.57 BUY 4.81 765 -7.0 5.5 0.0 83.1 0.0 0.0 0.0 0.0
Altium ALU Nicolas Burgess 4.44 BUY 4.70 572 12.3 14.4 24.9 21.3 16.0 17.8 3.6 4.0
Catapult Group CAT Nicolas Burgess 1.47 HOLD 1.40 177 -2.0 0.5 0.0 294.0 0.0 0.0 0.0 0.0
Computershare Ltd CPU Nicolas Burgess 10.62 HOLD 11.00 5916 59.7 55.1 12.3 13.3 31.0 36.7 2.9 3.5
DTI Group DTI Nick Caley 0.26 BUY 0.60 24 0.1 3.3 185.0 7.8 0.0 0.0 0.0 0.0
Empired EPD Josh Kannourakis 0.85 BUY 1.20 99 4.8 8.1 17.7 10.6 0.0 2.0 0.0 2.4
GBST Holdings GBT Nicolas Burgess 3.81 HOLD 3.90 243 28.3 22.4 13.5 17.0 10.5 9.0 2.8 2.4
Hansen Technologies HSN Nicolas Burgess 2.90 BUY 3.00 498 11.4 13.4 25.4 21.6 6.0 6.6 2.1 2.3
Infomedia IFM Nicolas Burgess 0.78 BUY 1.20 243 4.3 4.7 18.1 16.6 3.9 4.0 5.0 5.1
IProperty Group Ltd IPP Nick Caley 3.41 BUY 3.60 668 0.9 5.5 378.9 62.0 0.0 0.0 0.0 0.0
Legend Corporation LGD Nicolas Burgess 0.26 HOLD 0.28 57 3.1 3.2 8.4 8.1 1.8 1.8 6.7 6.7
Mitula Group MUA Josh Kannourakis 0.96 BUY 1.20 197 3.9 5.8 24.7 16.6 0.0 0.0 0.0 0.0
Smart Parking SPZ Nick Caley 0.15 BUY 0.25 42 -1.8 0.5 0.0 29.0 0.0 0.0 0.0 0.0
Telecommunication Services
BigAir Group BGL Luke Macnab 0.89 BUY 0.99 156 3.9 6.1 22.7 14.5 1.2 1.7 1.4 1.9
M2 Group MTU Luke Macnab 9.50 BUY 10.88 1727 54.3 65.9 17.5 14.4 32.0 37.0 3.4 3.9
SpeedCast International SDA Luke Macnab 4.55 BUY 5.01 549 13.8 17.6 24.3 18.6 7.5 11.0 1.6 2.4
Vocus Communications VOC Luke Macnab 6.33 BUY 6.69 1458 17.7 28.5 35.8 22.2 8.3 8.5 1.3 1.3
Materials
Hillgrove Resources HGO Warren Edney 0.20 BUY 0.42 38 -2.9 -1.3 0.0 0.0 0.0 0.0 0.0 0.0
Northern Star NST Warren Edney 3.09 BUY 3.57 1890 15.5 29.1 19.9 10.6 5.0 9.0 1.6 2.9
Panoramic Resources PAN Warren Edney 0.35 HOLD 0.33 112 -11.5 -8.2 0.0 0.0 1.0 0.0 2.9 0.0
Saracen Mineral Holdings SAR Warren Edney 0.58 BUY 0.64 464 1.4 4.1 40.9 13.9 0.0 0.0 0.0 0.0
Silver Lake Resource SLR Warren Edney 0.25 BUY 0.24 123 -18.7 2.3 0.0 10.7 0.0 0.0 0.0 0.0
Page 2
BAILLIEU HOLST RESEARCH Top Stock Picks – October 2015
Baillieu Holst Ltd ABN 74 006 519 393 www.baillieuholst.com.au Please read the disclaimer at the end of this report.
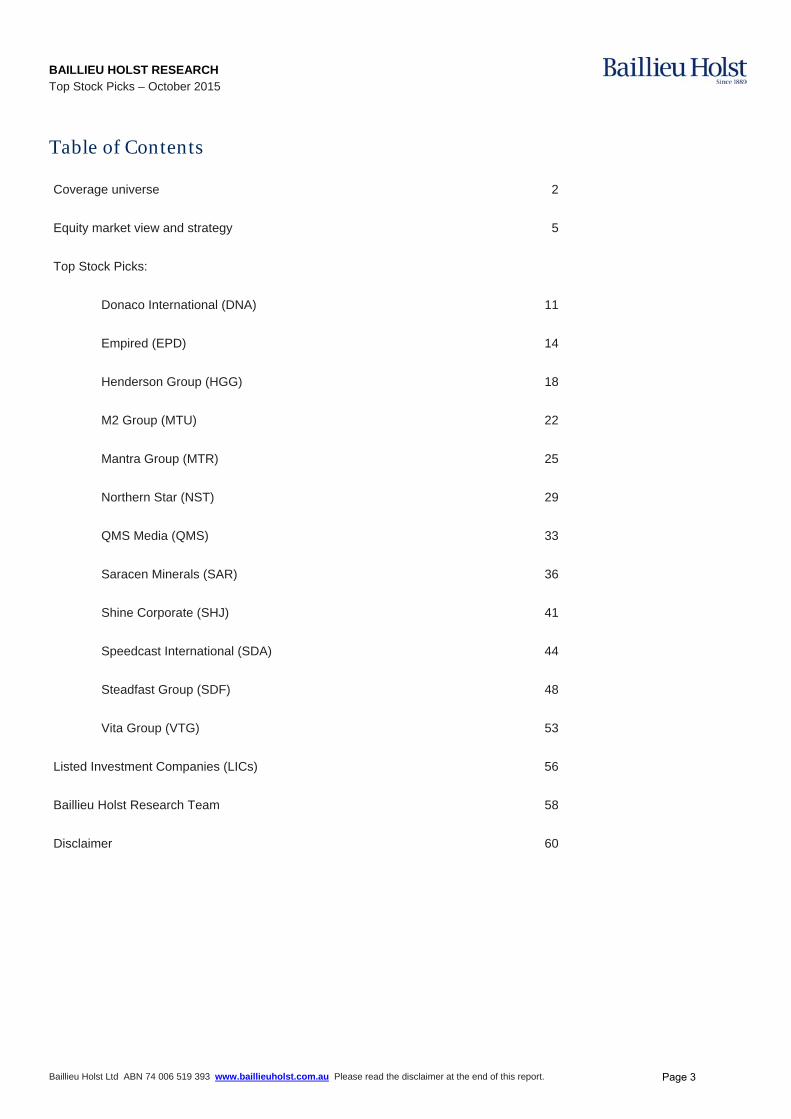
Table of Contents
Coverage universe 2
Equity market view and strategy 5
Top Stock Picks:
Donaco International (DNA) 11
Empired (EPD) 14
Henderson Group (HGG) 18
M2 Group (MTU) 22
Mantra Group (MTR) 25
Northern Star (NST) 29
QMS Media (QMS) 33
Saracen Minerals (SAR) 36
Shine Corporate (SHJ) 41
Speedcast International (SDA) 44
Steadfast Group (SDF) 48
Vita Group (VTG) 53
Listed Investment Companies (LICs) 56
Baillieu Holst Research Team 58
Disclaimer 60
Page 3

This page has been left blank intentionally
Page 4
BAILLIEU HOLST QUANT RESEARCH
Top Stock Picks – October 2015 INTERNAL ONLY
Baillieu Holst Ltd ABN 74 006 519 393 www.baillieuholst.com.au Please read the disclaimer at the end of this report.
RESEARCH ANALYST
Mathan Somasundaram
+612 9250 8947 [email protected]
Equity Engineer – October 2015
EQUITY STRATEGY
Christmas rally to start after US reporting season profit taking
Global market outlook: Declining global growth has sparked a currency war amongst major economies in a bid for a bigger slice of the shrinking growth pie. Markets are getting used to a slowing China, stabilising Euro, risky Japan and a slowing US heading towards below trend growth. Global markets had a decent recovery in early October, while the US reporting season will continue to test recent optimism. The US Fed continues to support a rate rise in 2015, but the exact timing, magnitude and future moves are likely to be heavily linked to domestic economic recovery and global growth slowdown. We expect the US Fed to push back the rate rise timetable to allow for global economies to absorb and recover from the China slowdown and the Euro refugee issues. We continue to expect the Chinese government to deliver more stimulus and currency devaluation in order to improve manufacturing and domestic spending. We also assume small targeted stimulus in Japan, while substantial QE and refugee spending will be stimulatory for Europe. We continue to see low global growth outlook and a falling domestic currency to support our equity market recovery on the chase for yield.
Local market outlook: Equities will continue to benefit from global demand for better than bond yield income streams from the rising older global demographic. A tidal wave of unemployment, falling real wages, falling living standards, falling disposable income, and a government in survival mode are factors expected to see an ongoing decrease in local consumer sentiment and business capex. The mining boom to manufacturing doom has left Australia with asset bubbles that can’t be sustained without employment and wages growth. The big global consumer bases are the US, Europe and Asia. Global manufacturing will always gravitate towards big consumer bases and low cost regions. Manufacturing will only survive in Australia with government support due to the relative wage cost to FTA partners. Major regions in the currency war are delivering lower cost of production and cost to the market than what Australia can deliver. Australia will continue to attract recession fears as the country sleep walks past a low growth global economy in transition. Corporates are expected to protect their balance sheets, cut costs, buy back shares, drive industry consolidation and maintain yield to drive share price performance. We expect global investors to buy into Australian equity dividend yield as the currency sees support in the high 60s.
Market view: We maintain a bullish long term view on the Australian equity market with a 12 month index target level of 6100. The RBA move in February and May has enabled equities to become the preferred risk/return option for investors wanting better than bond yield return in a rising cost environment. Recent profit taking by global investors on currency worries has lowered the market to a fair value level of 5000 with no premium being paid for the substantially high dividend yield. We maintain our positive long term view on the yield trade (i.e. Banks, Div Financials and Telecommunication services) while health care looks the best growth/currency story. We continue to favour the new economy (i.e. MITCH Universe – Media, Information, Telecom, Consumer and Health) over the old economy on a long term view. We expect short term profit taking with US reporting season risk; while China releases long term growth plans and the US Fed pushes back rate rise plans to help drive markets higher for a Christmas rally.
quan
tstra
tegy
Page 5
BAILLIEU HOLST QUANT RESEARCH
Top Stock Picks – October 2015
Baillieu Holst Ltd ABN 74 006 519 393 www.baillieuholst.com.au Please read the disclaimer at the end of this report.
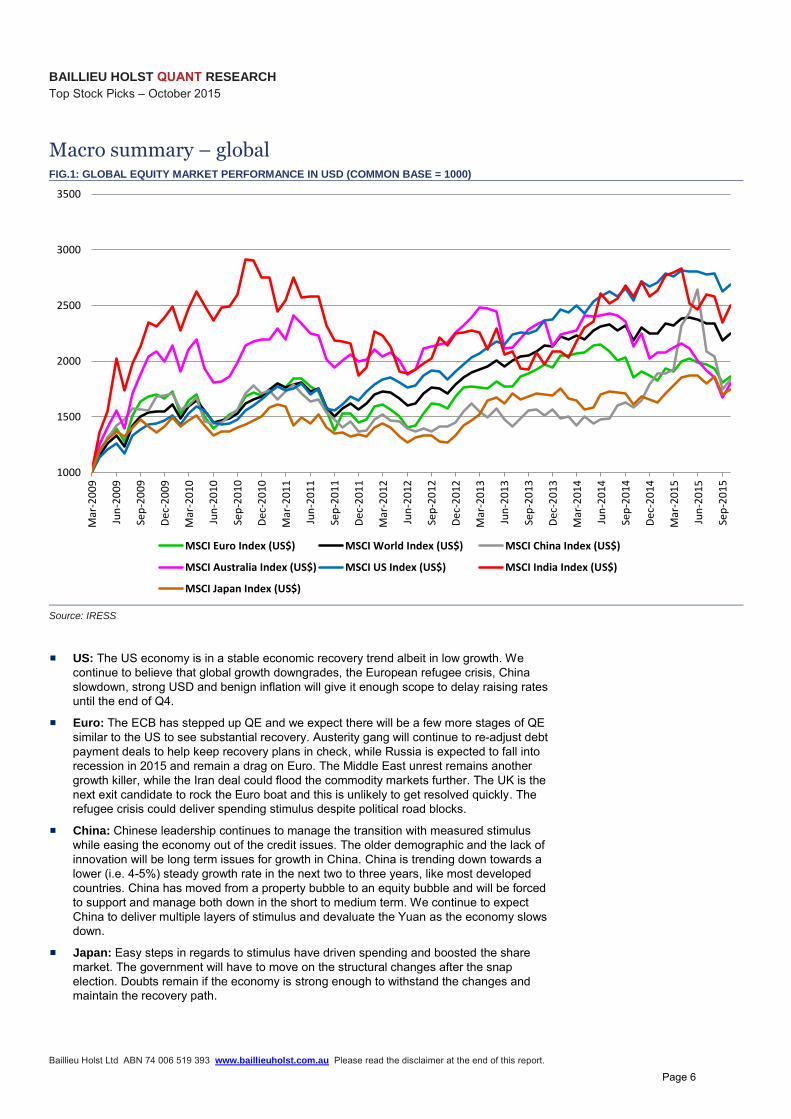
Macro summary – global FIG.1: GLOBAL EQUITY MARKET PERFORMANCE IN USD (COMMON BASE = 1000)
1000
1500
2000
2500
3000
3500
Mar-2009
Jun-2009
Sep-2009
Dec-2009
Mar-2010
Jun-2010
Sep-2010
Dec-2010
Mar-2011
Jun-2011
Sep-2011
Dec-2011
Mar-2012
Jun-2012
Sep-2012
Dec-2012
Mar-2013
Jun-2013
Sep-2013
Dec-2013
Mar-2014
Jun-2014
Sep-2014
Dec-2014
Mar-2015
Jun-2015
Sep-2015
MSCI Euro Index (US$) MSCI World Index (US$) MSCI China Index (US$)
MSCI Australia Index (US$) MSCI US Index (US$) MSCI India Index (US$)
MSCI Japan Index (US$)
Source: IRESS
US: The US economy is in a stable economic recovery trend albeit in low growth. We continue to believe that global growth downgrades, the European refugee crisis, China slowdown, strong USD and benign inflation will give it enough scope to delay raising rates until the end of Q4.
Euro: The ECB has stepped up QE and we expect there will be a few more stages of QE similar to the US to see substantial recovery. Austerity gang will continue to re-adjust debt payment deals to help keep recovery plans in check, while Russia is expected to fall into recession in 2015 and remain a drag on Euro. The Middle East unrest remains another growth killer, while the Iran deal could flood the commodity markets further. The UK is the next exit candidate to rock the Euro boat and this is unlikely to get resolved quickly. The refugee crisis could deliver spending stimulus despite political road blocks.
China: Chinese leadership continues to manage the transition with measured stimulus while easing the economy out of the credit issues. The older demographic and the lack of innovation will be long term issues for growth in China. China is trending down towards a lower (i.e. 4-5%) steady growth rate in the next two to three years, like most developed countries. China has moved from a property bubble to an equity bubble and will be forced to support and manage both down in the short to medium term. We continue to expect China to deliver multiple layers of stimulus and devaluate the Yuan as the economy slows down.
Japan: Easy steps in regards to stimulus have driven spending and boosted the share market. The government will have to move on the structural changes after the snap election. Doubts remain if the economy is strong enough to withstand the changes and maintain the recovery path.
Page 6
BAILLIEU HOLST QUANT RESEARCH
Top Stock Picks – October 2015
Baillieu Holst Ltd ABN 74 006 519 393 www.baillieuholst.com.au Please read the disclaimer at the end of this report.
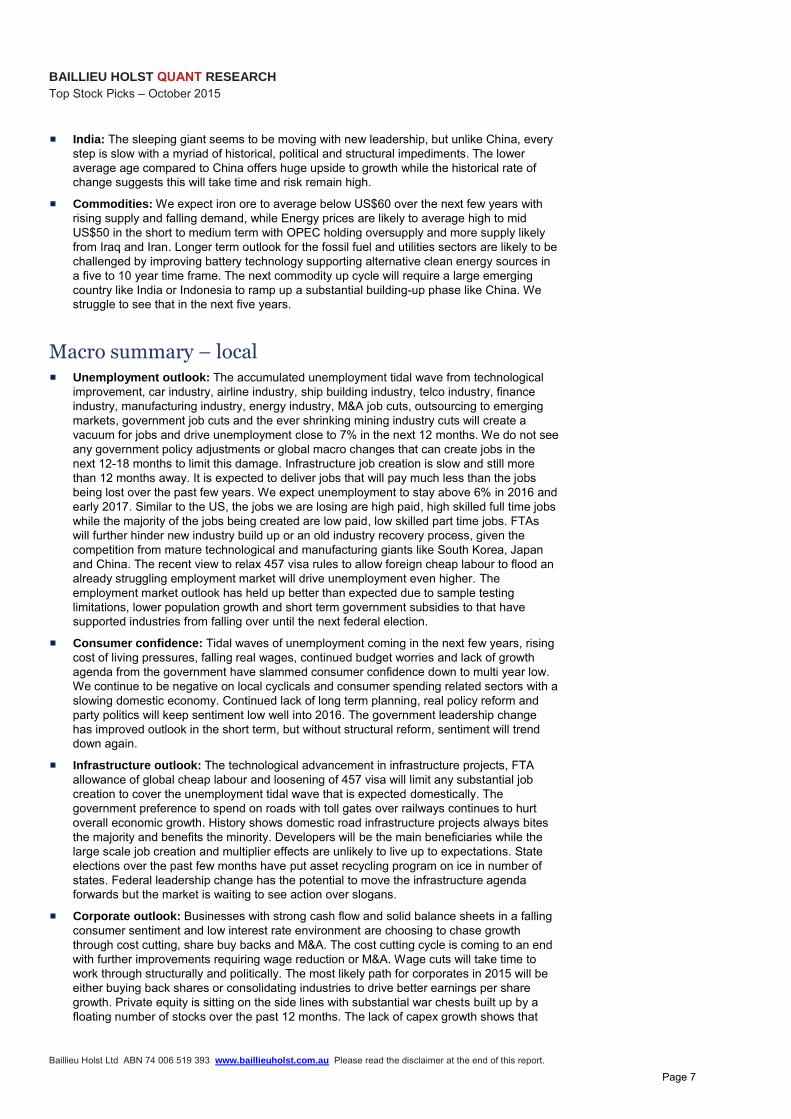
India: The sleeping giant seems to be moving with new leadership, but unlike China, every step is slow with a myriad of historical, political and structural impediments. The lower average age compared to China offers huge upside to growth while the historical rate of change suggests this will take time and risk remain high.
Commodities: We expect iron ore to average below US$60 over the next few years with rising supply and falling demand, while Energy prices are likely to average high to mid US$50 in the short to medium term with OPEC holding oversupply and more supply likely from Iraq and Iran. Longer term outlook for the fossil fuel and utilities sectors are likely to be challenged by improving battery technology supporting alternative clean energy sources in a five to 10 year time frame. The next commodity up cycle will require a large emerging country like India or Indonesia to ramp up a substantial building-up phase like China. We struggle to see that in the next five years.
Macro summary – local
Unemployment outlook: The accumulated unemployment tidal wave from technological improvement, car industry, airline industry, ship building industry, telco industry, finance industry, manufacturing industry, energy industry, M&A job cuts, outsourcing to emerging markets, government job cuts and the ever shrinking mining industry cuts will create a vacuum for jobs and drive unemployment close to 7% in the next 12 months. We do not see any government policy adjustments or global macro changes that can create jobs in the next 12-18 months to limit this damage. Infrastructure job creation is slow and still more than 12 months away. It is expected to deliver jobs that will pay much less than the jobs being lost over the past few years. We expect unemployment to stay above 6% in 2016 and early 2017. Similar to the US, the jobs we are losing are high paid, high skilled full time jobs while the majority of the jobs being created are low paid, low skilled part time jobs. FTAs will further hinder new industry build up or an old industry recovery process, given the competition from mature technological and manufacturing giants like South Korea, Japan and China. The recent view to relax 457 visa rules to allow foreign cheap labour to flood an already struggling employment market will drive unemployment even higher. The employment market outlook has held up better than expected due to sample testing limitations, lower population growth and short term government subsidies to that have supported industries from falling over until the next federal election.
Consumer confidence: Tidal waves of unemployment coming in the next few years, rising cost of living pressures, falling real wages, continued budget worries and lack of growth agenda from the government have slammed consumer confidence down to multi year low. We continue to be negative on local cyclicals and consumer spending related sectors with a slowing domestic economy. Continued lack of long term planning, real policy reform and party politics will keep sentiment low well into 2016. The government leadership change has improved outlook in the short term, but without structural reform, sentiment will trend down again.
Infrastructure outlook: The technological advancement in infrastructure projects, FTA allowance of global cheap labour and loosening of 457 visa will limit any substantial job creation to cover the unemployment tidal wave that is expected domestically. The government preference to spend on roads with toll gates over railways continues to hurt overall economic growth. History shows domestic road infrastructure projects always bites the majority and benefits the minority. Developers will be the main beneficiaries while the large scale job creation and multiplier effects are unlikely to live up to expectations. State elections over the past few months have put asset recycling program on ice in number of states. Federal leadership change has the potential to move the infrastructure agenda forwards but the market is waiting to see action over slogans.
Corporate outlook: Businesses with strong cash flow and solid balance sheets in a falling consumer sentiment and low interest rate environment are choosing to chase growth through cost cutting, share buy backs and M&A. The cost cutting cycle is coming to an end with further improvements requiring wage reduction or M&A. Wage cuts will take time to work through structurally and politically. The most likely path for corporates in 2015 will be either buying back shares or consolidating industries to drive better earnings per share growth. Private equity is sitting on the side lines with substantial war chests built up by a floating number of stocks over the past 12 months. The lack of capex growth shows that
Page 7
BAILLIEU HOLST QUANT RESEARCH
Top Stock Picks – October 2015
Baillieu Holst Ltd ABN 74 006 519 393 www.baillieuholst.com.au Please read the disclaimer at the end of this report.
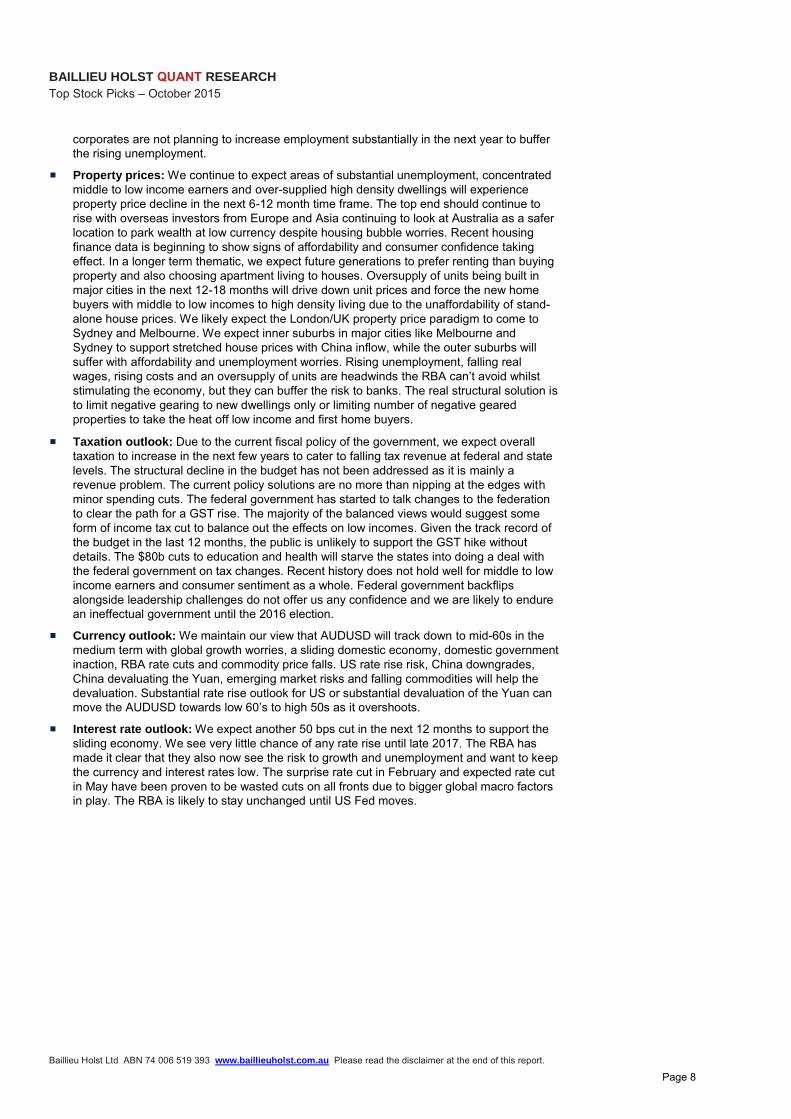
corporates are not planning to increase employment substantially in the next year to buffer the rising unemployment.
Property prices: We continue to expect areas of substantial unemployment, concentrated middle to low income earners and over-supplied high density dwellings will experience property price decline in the next 6-12 month time frame. The top end should continue to rise with overseas investors from Europe and Asia continuing to look at Australia as a safer location to park wealth at low currency despite housing bubble worries. Recent housing finance data is beginning to show signs of affordability and consumer confidence taking effect. In a longer term thematic, we expect future generations to prefer renting than buying property and also choosing apartment living to houses. Oversupply of units being built in major cities in the next 12-18 months will drive down unit prices and force the new home buyers with middle to low incomes to high density living due to the unaffordability of stand-alone house prices. We likely expect the London/UK property price paradigm to come to Sydney and Melbourne. We expect inner suburbs in major cities like Melbourne and Sydney to support stretched house prices with China inflow, while the outer suburbs will suffer with affordability and unemployment worries. Rising unemployment, falling real wages, rising costs and an oversupply of units are headwinds the RBA can’t avoid whilst stimulating the economy, but they can buffer the risk to banks. The real structural solution is to limit negative gearing to new dwellings only or limiting number of negative geared properties to take the heat off low income and first home buyers.
Taxation outlook: Due to the current fiscal policy of the government, we expect overall taxation to increase in the next few years to cater to falling tax revenue at federal and state levels. The structural decline in the budget has not been addressed as it is mainly a revenue problem. The current policy solutions are no more than nipping at the edges with minor spending cuts. The federal government has started to talk changes to the federation to clear the path for a GST rise. The majority of the balanced views would suggest some form of income tax cut to balance out the effects on low incomes. Given the track record of the budget in the last 12 months, the public is unlikely to support the GST hike without details. The $80b cuts to education and health will starve the states into doing a deal with the federal government on tax changes. Recent history does not hold well for middle to low income earners and consumer sentiment as a whole. Federal government backflips alongside leadership challenges do not offer us any confidence and we are likely to endure an ineffectual government until the 2016 election.
Currency outlook: We maintain our view that AUDUSD will track down to mid-60s in the medium term with global growth worries, a sliding domestic economy, domestic government inaction, RBA rate cuts and commodity price falls. US rate rise risk, China downgrades, China devaluating the Yuan, emerging market risks and falling commodities will help the devaluation. Substantial rate rise outlook for US or substantial devaluation of the Yuan can move the AUDUSD towards low 60’s to high 50s as it overshoots.
Interest rate outlook: We expect another 50 bps cut in the next 12 months to support the sliding economy. We see very little chance of any rate rise until late 2017. The RBA has made it clear that they also now see the risk to growth and unemployment and want to keep the currency and interest rates low. The surprise rate cut in February and expected rate cut in May have been proven to be wasted cuts on all fronts due to bigger global macro factors in play. The RBA is likely to stay unchanged until US Fed moves.
Page 8
BAILLIEU HOLST QUANT RESEARCH
Top Stock Picks – October 2015
Baillieu Holst Ltd ABN 74 006 519 393 www.baillieuholst.com.au Please read the disclaimer at the end of this report.
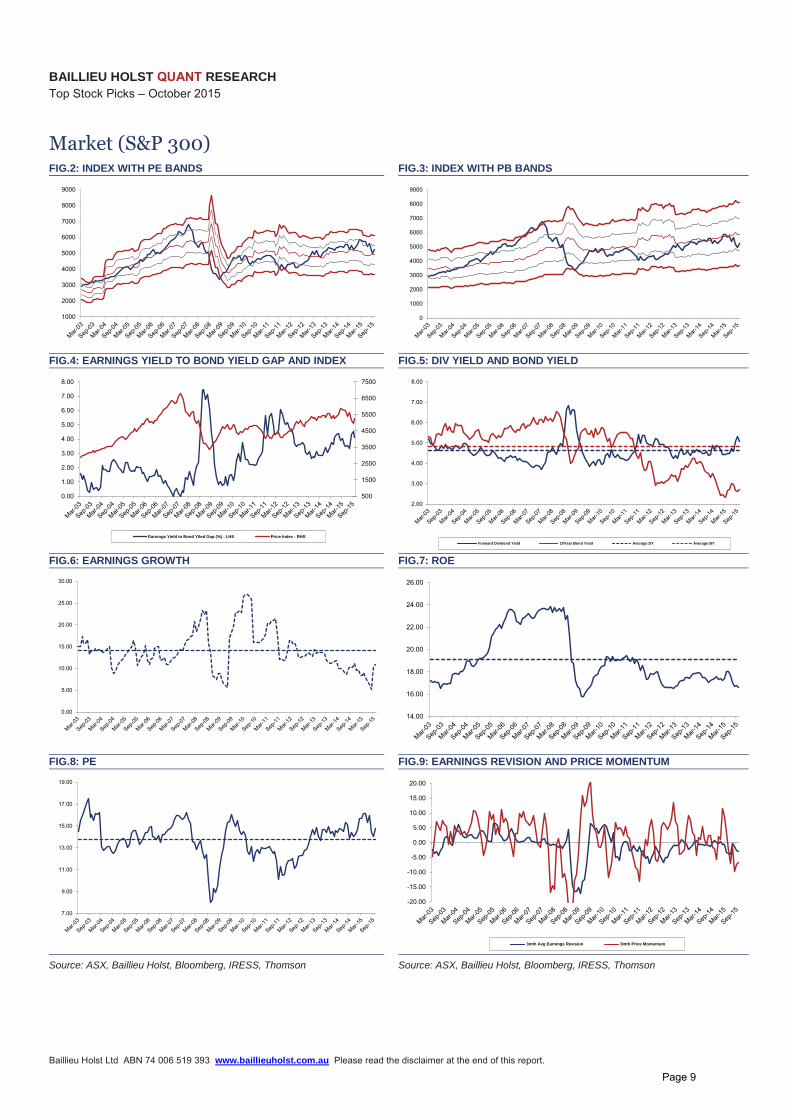
Market (S&P 300) FIG.2: INDEX WITH PE BANDS FIG.3: INDEX WITH PB BANDS
1000
2000
3000
4000
5000
6000
7000
8000
9000
0
1000
2000
3000
4000
5000
6000
7000
8000
9000
FIG.4: EARNINGS YIELD TO BOND YIELD GAP AND INDEX FIG.5: DIV YIELD AND BOND YIELD
500
1500
2500
3500
4500
5500
6500
7500
0.00
1.00
2.00
3.00
4.00
5.00
6.00
7.00
8.00
Earnings Yield to Bond Yiled Gap (%) - LHS Price Index - RHS
2.00
3.00
4.00
5.00
6.00
7.00
8.00
Forward Dividend Yield 10Year Bond Yield Average DY Average BY
FIG.6: EARNINGS GROWTH FIG.7: ROE
0.00
5.00
10.00
15.00
20.00
25.00
30.00
14.00
16.00
18.00
20.00
22.00
24.00
26.00
FIG.8: PE FIG.9: EARNINGS REVISION AND PRICE MOMENTUM
7.00
9.00
11.00
13.00
15.00
17.00
19.00
-20.00
-15.00
-10.00
-5.00
0.00
5.00
10.00
15.00
20.00
3mth Avg Earnings Revision 3mth Price Momentum
Source: ASX, Baillieu Holst, Bloomberg, IRESS, Thomson Source: ASX, Baillieu Holst, Bloomberg, IRESS, Thomson
Page 9

This page has been left blank intentionally
Page 10
BAILLIEU HOLST RESEARCH
Top Stock Picks – October 2015 INTERNAL ONLY
Baillieu Holst Ltd ABN 74 006 519 393 www.baillieuholst.com.au Please read the disclaimer at the end of this report.
RECOMMENDATIONS
Rating BUY ▲
Risk High Price Target $1.15
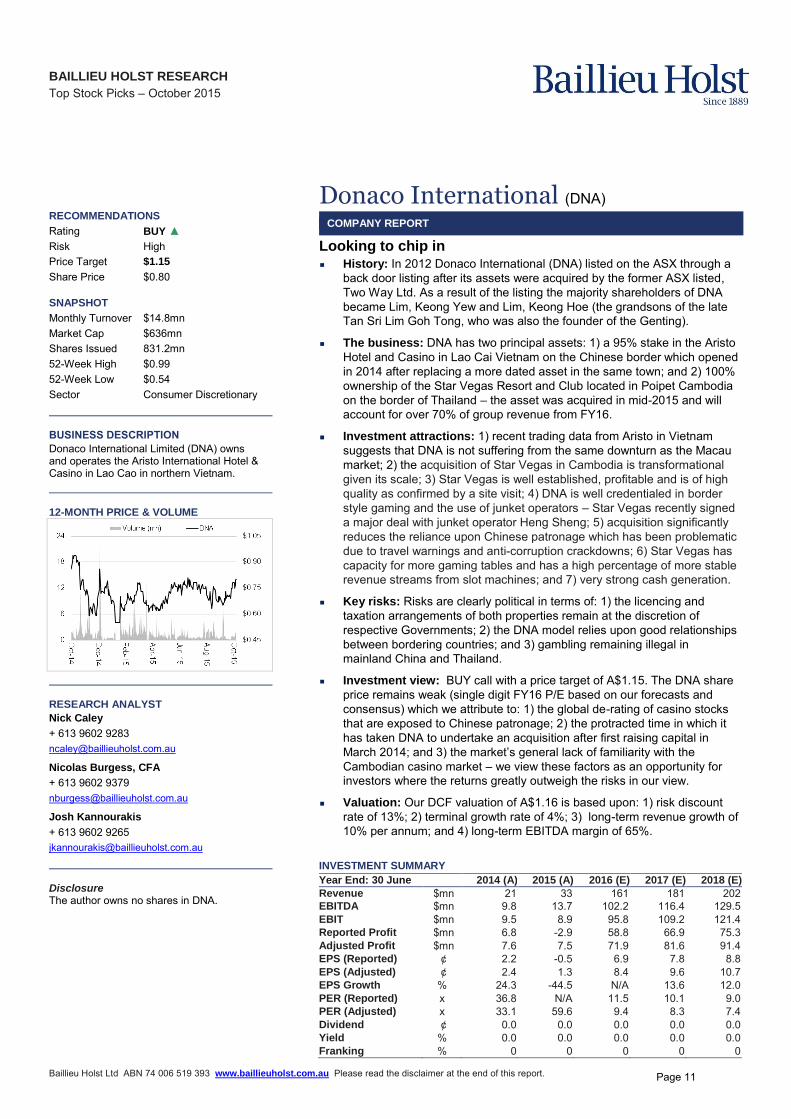
Share Price $0.80 SNAPSHOT Monthly Turnover $14.8mn Market Cap $636mn Shares Issued 831.2mn 52-Week High $0.99 52-Week Low $0.54 Sector Consumer Discretionary BUSINESS DESCRIPTION
Donaco International Limited (DNA) owns and operates the Aristo International Hotel & Casino in Lao Cao in northern Vietnam.
12-MONTH PRICE & VOLUME
RESEARCH ANALYST
Nick Caley
+ 613 9602 9283 [email protected]
Nicolas Burgess, CFA
+ 613 9602 9379 [email protected]
Josh Kannourakis
+ 613 9602 9265 [email protected] Disclosure The author owns no shares in DNA.
Donaco International (DNA)
COMPANY REPORT
Looking to chip in History: In 2012 Donaco International (DNA) listed on the ASX through a
back door listing after its assets were acquired by the former ASX listed, Two Way Ltd. As a result of the listing the majority shareholders of DNA became Lim, Keong Yew and Lim, Keong Hoe (the grandsons of the late Tan Sri Lim Goh Tong, who was also the founder of the Genting).
The business: DNA has two principal assets: 1) a 95% stake in the Aristo Hotel and Casino in Lao Cai Vietnam on the Chinese border which opened in 2014 after replacing a more dated asset in the same town; and 2) 100% ownership of the Star Vegas Resort and Club located in Poipet Cambodia on the border of Thailand – the asset was acquired in mid-2015 and will account for over 70% of group revenue from FY16.
Investment attractions: 1) recent trading data from Aristo in Vietnam suggests that DNA is not suffering from the same downturn as the Macau market; 2) the acquisition of Star Vegas in Cambodia is transformational given its scale; 3) Star Vegas is well established, profitable and is of high quality as confirmed by a site visit; 4) DNA is well credentialed in border style gaming and the use of junket operators – Star Vegas recently signed a major deal with junket operator Heng Sheng; 5) acquisition significantly reduces the reliance upon Chinese patronage which has been problematic due to travel warnings and anti-corruption crackdowns; 6) Star Vegas has capacity for more gaming tables and has a high percentage of more stable revenue streams from slot machines; and 7) very strong cash generation.
Key risks: Risks are clearly political in terms of: 1) the licencing and taxation arrangements of both properties remain at the discretion of respective Governments; 2) the DNA model relies upon good relationships between bordering countries; and 3) gambling remaining illegal in mainland China and Thailand.
Investment view: BUY call with a price target of A$1.15. The DNA share price remains weak (single digit FY16 P/E based on our forecasts and consensus) which we attribute to: 1) the global de-rating of casino stocks that are exposed to Chinese patronage; 2) the protracted time in which it has taken DNA to undertake an acquisition after first raising capital in March 2014; and 3) the market’s general lack of familiarity with the
Cambodian casino market – we view these factors as an opportunity for investors where the returns greatly outweigh the risks in our view.
Valuation: Our DCF valuation of A$1.16 is based upon: 1) risk discount rate of 13%; 2) terminal growth rate of 4%; 3) long-term revenue growth of 10% per annum; and 4) long-term EBITDA margin of 65%.
INVESTMENT SUMMARY
Year End: 30 June 2014 (A) 2015 (A) 2016 (E) 2017 (E) 2018 (E)
Revenue $mn 21 33 161 181 202 EBITDA $mn 9.8 13.7 102.2 116.4 129.5 EBIT $mn 9.5 8.9 95.8 109.2 121.4 Reported Profit $mn 6.8 -2.9 58.8 66.9 75.3 Adjusted Profit $mn 7.6 7.5 71.9 81.6 91.4 EPS (Reported) ¢ 2.2 -0.5 6.9 7.8 8.8 EPS (Adjusted) ¢ 2.4 1.3 8.4 9.6 10.7 EPS Growth % 24.3 -44.5 N/A 13.6 12.0 PER (Reported) x 36.8 N/A 11.5 10.1 9.0 PER (Adjusted) x 33.1 59.6 9.4 8.3 7.4 Dividend ¢ 0.0 0.0 0.0 0.0 0.0 Yield % 0.0 0.0 0.0 0.0 0.0 Franking % 0 0 0 0 0
Page 11
BAILLIEU HOLST RESEARCH
Top Stock Picks – October 2015
Baillieu Holst Ltd ABN 74 006 519 393 www.baillieuholst.com.au Please read the disclaimer at the end of this report.
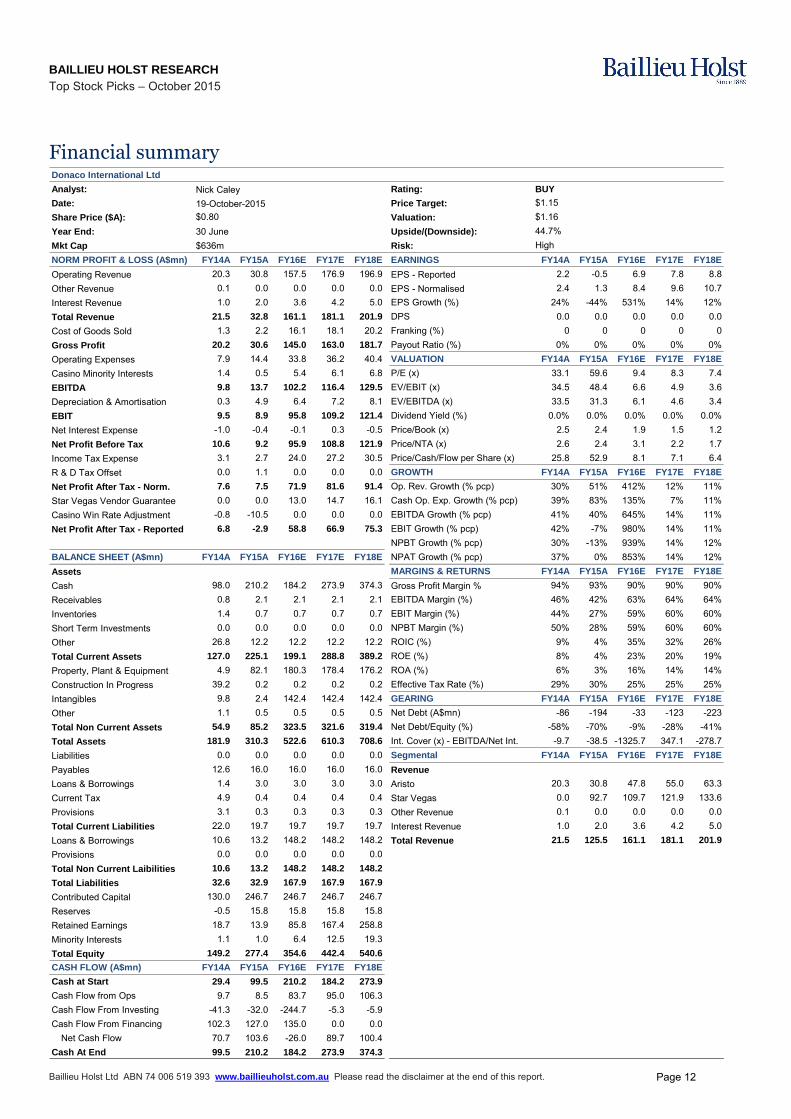
Financial summary Donaco International Ltd
Analyst: Rating: BUY
Date: Price Target:
Share Price ($A): Valuation:
Year End: 30 June Upside/(Downside):
Mkt Cap $636m Risk:
NORM PROFIT & LOSS (A$mn) FY14A FY15A FY16E FY17E FY18E EARNINGS FY14A FY15A FY16E FY17E FY18E
Operating Revenue 20.3 30.8 157.5 176.9 196.9 EPS - Reported 2.2 -0.5 6.9 7.8 8.8Other Revenue 0.1 0.0 0.0 0.0 0.0 EPS - Normalised 2.4 1.3 8.4 9.6 10.7Interest Revenue 1.0 2.0 3.6 4.2 5.0 EPS Growth (%) 24% -44% 531% 14% 12%Total Revenue 21.5 32.8 161.1 181.1 201.9 DPS 0.0 0.0 0.0 0.0 0.0Cost of Goods Sold 1.3 2.2 16.1 18.1 20.2 Franking (%) 0 0 0 0 0Gross Profit 20.2 30.6 145.0 163.0 181.7 Payout Ratio (%) 0% 0% 0% 0% 0%Operating Expenses 7.9 14.4 33.8 36.2 40.4 VALUATION FY14A FY15A FY16E FY17E FY18E
Casino Minority Interests 1.4 0.5 5.4 6.1 6.8 P/E (x) 33.1 59.6 9.4 8.3 7.4EBITDA 9.8 13.7 102.2 116.4 129.5 EV/EBIT (x) 34.5 48.4 6.6 4.9 3.6Depreciation & Amortisation 0.3 4.9 6.4 7.2 8.1 EV/EBITDA (x) 33.5 31.3 6.1 4.6 3.4EBIT 9.5 8.9 95.8 109.2 121.4 Dividend Yield (%) 0.0% 0.0% 0.0% 0.0% 0.0%Net Interest Expense -1.0 -0.4 -0.1 0.3 -0.5 Price/Book (x) 2.5 2.4 1.9 1.5 1.2Net Profit Before Tax 10.6 9.2 95.9 108.8 121.9 Price/NTA (x) 2.6 2.4 3.1 2.2 1.7Income Tax Expense 3.1 2.7 24.0 27.2 30.5 Price/Cash/Flow per Share (x) 25.8 52.9 8.1 7.1 6.4R & D Tax Offset 0.0 1.1 0.0 0.0 0.0 GROWTH FY14A FY15A FY16E FY17E FY18E
Net Profit After Tax - Norm. 7.6 7.5 71.9 81.6 91.4 Op. Rev. Growth (% pcp) 30% 51% 412% 12% 11%Star Vegas Vendor Guarantee 0.0 0.0 13.0 14.7 16.1 Cash Op. Exp. Growth (% pcp) 39% 83% 135% 7% 11%Casino Win Rate Adjustment -0.8 -10.5 0.0 0.0 0.0 EBITDA Growth (% pcp) 41% 40% 645% 14% 11%Net Profit After Tax - Reported 6.8 -2.9 58.8 66.9 75.3 EBIT Growth (% pcp) 42% -7% 980% 14% 11%
NPBT Growth (% pcp) 30% -13% 939% 14% 12%BALANCE SHEET (A$mn) FY14A FY15A FY16E FY17E FY18E NPAT Growth (% pcp) 37% 0% 853% 14% 12%Assets MARGINS & RETURNS FY14A FY15A FY16E FY17E FY18E
Cash 98.0 210.2 184.2 273.9 374.3 Gross Profit Margin % 94% 93% 90% 90% 90%Receivables 0.8 2.1 2.1 2.1 2.1 EBITDA Margin (%) 46% 42% 63% 64% 64%Inventories 1.4 0.7 0.7 0.7 0.7 EBIT Margin (%) 44% 27% 59% 60% 60%Short Term Investments 0.0 0.0 0.0 0.0 0.0 NPBT Margin (%) 50% 28% 59% 60% 60%Other 26.8 12.2 12.2 12.2 12.2 ROIC (%) 9% 4% 35% 32% 26%Total Current Assets 127.0 225.1 199.1 288.8 389.2 ROE (%) 8% 4% 23% 20% 19%Property, Plant & Equipment 4.9 82.1 180.3 178.4 176.2 ROA (%) 6% 3% 16% 14% 14%Construction In Progress 39.2 0.2 0.2 0.2 0.2 Effective Tax Rate (%) 29% 30% 25% 25% 25%Intangibles 9.8 2.4 142.4 142.4 142.4 GEARING FY14A FY15A FY16E FY17E FY18E
Other 1.1 0.5 0.5 0.5 0.5 Net Debt (A$mn) -86 -194 -33 -123 -223Total Non Current Assets 54.9 85.2 323.5 321.6 319.4 Net Debt/Equity (%) -58% -70% -9% -28% -41%Total Assets 181.9 310.3 522.6 610.3 708.6 Int. Cover (x) - EBITDA/Net Int. -9.7 -38.5 -1325.7 347.1 -278.7Liabilities 0.0 0.0 0.0 0.0 0.0 Segmental FY14A FY15A FY16E FY17E FY18E
Payables 12.6 16.0 16.0 16.0 16.0 Revenue
Loans & Borrowings 1.4 3.0 3.0 3.0 3.0 Aristo 20.3 30.8 47.8 55.0 63.3Current Tax 4.9 0.4 0.4 0.4 0.4 Star Vegas 0.0 92.7 109.7 121.9 133.6Provisions 3.1 0.3 0.3 0.3 0.3 Other Revenue 0.1 0.0 0.0 0.0 0.0Total Current Liabilities 22.0 19.7 19.7 19.7 19.7 Interest Revenue 1.0 2.0 3.6 4.2 5.0Loans & Borrowings 10.6 13.2 148.2 148.2 148.2 Total Revenue 21.5 125.5 161.1 181.1 201.9
Provisions 0.0 0.0 0.0 0.0 0.0Total Non Current Laibilities 10.6 13.2 148.2 148.2 148.2
Total Liabilities 32.6 32.9 167.9 167.9 167.9
Contributed Capital 130.0 246.7 246.7 246.7 246.7Reserves -0.5 15.8 15.8 15.8 15.8Retained Earnings 18.7 13.9 85.8 167.4 258.8Minority Interests 1.1 1.0 6.4 12.5 19.3Total Equity 149.2 277.4 354.6 442.4 540.6
CASH FLOW (A$mn) FY14A FY15A FY16E FY17E FY18E
Cash at Start 29.4 99.5 210.2 184.2 273.9
Cash Flow from Ops 9.7 8.5 83.7 95.0 106.3Cash Flow From Investing -41.3 -32.0 -244.7 -5.3 -5.9Cash Flow From Financing 102.3 127.0 135.0 0.0 0.0
Net Cash Flow 70.7 103.6 -26.0 89.7 100.4Cash At End 99.5 210.2 184.2 273.9 374.3
$1.1644.7%
Nick Caley
$0.8019-October-2015
High
$1.15
Page 12

BAILLIEU HOLST RESEARCH
Top Stock Picks – October 2015
Baillieu Holst Ltd ABN 74 006 519 393 www.baillieuholst.com.au Please read the disclaimer at the end of this report.
FIG.1: STAR VEGAS RESORT & CLUB
Source: DNA
FIG.2: ARISTO INTERNATIONAL HOTEL
Source: DNA
Page 13

BAILLIEU HOLST RESEARCH
Top Stock Picks – October 2015
Baillieu Holst Ltd ABN 74 006 519 393 www.baillieuholst.com.au Please read the disclaimer at the end of this report.
RECOMMENDATIONS
Rating BUY ▲
Risk High Price Target $1.20
Share Price $0.85 SNAPSHOT Monthly Turnover $4.2mn Market Cap $99mn Shares Issued 116.9mn 52-Week High $0.89 52-Week Low $0.58 Sector Information Technology BUSINESS DESCRIPTION EPD is an IT services provider with a diverse range of capabilities aimed at delivering complete (end-to-end) IT solutions for clients in order for them to reach their business objectives.
12-MONTH PRICE & VOLUME
RESEARCH ANALYST
Josh Kannourakis
+ 613 9602 9265 [email protected]
Nicolas Burgess, CFA
+ 613 9602 9379 [email protected]
Nick Caley
+ 613 9602 9283 [email protected] Disclosure The author owns no shares in EPD.
Empired (EPD)
COMPANY REPORT
Rise of the Empired
Investment view: We believe EPD is undervalued in light of its strong growth outlook, high proportion of contracted revenue, positive industry tail-winds driven by market trends and track record of execution. On a relative basis, EPD is trading at substantial discounts to listed peers and we expect this valuation gap to narrow over time. We have a BUY recommendation with a $1.20 price target.
High growth stock: We expect EPD to continue its growth momentum with FY15A to FY18F sales, EBITDA and NPAT CAGRs of 18%, 29% and 37% respectively. Growth will be underpinned by consolidating and extracting value from its recent acquisitions as well as capitalising on positive industry trends which are strongly aligned to EPD’s offering.
High proportion of contracted revenue: EPD has guided to FY16F revenue in the range of $155m to $175m, up 21% to 36% on the pcp. (Our estimate is $165m). Approximately 67% of this estimate is already covered by contracted infrastructure and application managed services, contracted project work and other work in hand. 50% of EPD’s FY16F revenue is on multi-year managed service or project contracts. These contracts have an average weighted contract length of four years.
Positive industry trends: We observe positive industry tail-winds and data supporting the IT services market. This is driven by companies modernizing or replacing older business systems with cloud-based software-as-a-service (SaaS). We expect this trend to support growth across EPD’s core capabilities in cloud services, application development and integration (incl. ERP, CRM and ECM), data analytics, internet of things and mobility solutions for enterprise. We also observe indications of a cyclical upswing, including growth in IT Professional vacancies (a proxy for labour demand) and material earnings revisions from listed peers.
Valuation and price target: Our blended valuation and price target is $1.20 ($1.19 DCF, $1.22 EV/EBITDA), using a blended EV/EBITDA (10% discount to market and comparable peers) and DCF methodology.
Key investment risks: The key risks to our investment thesis and price target include: 1) contract execution with regard to delivery and quality of work and contract renewal risks from counterparties; 2) loss of key personnel within particular business segments; 3) acquisitions not delivering expected returns; and 4) downturn in economic conditions restricting capital allocated to IT spend.
INVESTMENT SUMMARY
Year End: 30 June 2014 (A) 2015 (A) 2016 (E) 2017 (E) 2018 (E)
Revenue $mn 67 128 165 190 210 EBITDA $mn 7.0 11.2 18.1 21.4 24.0 EBIT $mn 5.0 7.3 13.7 16.3 18.7 Reported Profit $mn 3.8 5.3 9.4 11.5 13.7 Adjusted Profit $mn 3.8 5.2 9.4 11.5 13.7 EPS (Reported) ¢ 4.3 4.8 8.1 9.9 11.7 EPS (Adjusted) ¢ 4.3 4.8 8.1 9.9 11.7 EPS Growth % 92.9 11.8 69.2 22.9 18.5 PER (Reported) x 20.0 17.7 10.6 8.6 7.2 PER (Adjusted) x 20.0 17.9 10.6 8.6 7.2 Dividend ¢ 1.0 0.0 2.0 3.0 4.0 Yield % 1.2 0.0 2.4 3.5 4.7 Franking % 100 100 100 100 100
Page 14
BAILLIEU HOLST RESEARCH
Top Stock Picks – October 2015
Baillieu Holst Ltd ABN 74 006 519 393 www.baillieuholst.com.au Please read the disclaimer at the end of this report.
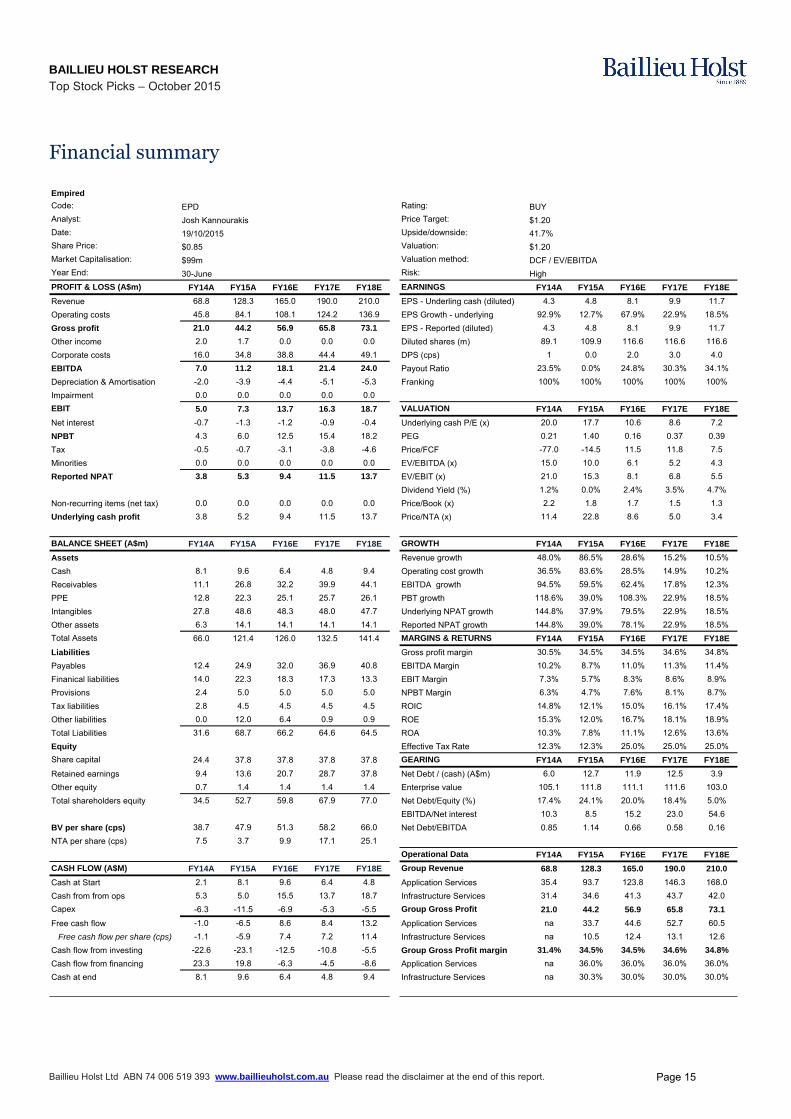
Financial summary Empired
Code: EPD Rating: BUYAnalyst: Josh Kannourakis Price Target: $1.20Date: Upside/downside: 41.7%Share Price: Valuation: $1.20Market Capitalisation: $99m Valuation method:Year End: Risk: HighPROFIT & LOSS (A$m) FY14A FY15A FY16E FY17E FY18E EARNINGS FY14A FY15A FY16E FY17E FY18E
Revenue 68.8 128.3 165.0 190.0 210.0 EPS - Underling cash (diluted) 4.3 4.8 8.1 9.9 11.7Operating costs 45.8 84.1 108.1 124.2 136.9 EPS Growth - underlying 92.9% 12.7% 67.9% 22.9% 18.5%Gross profit 21.0 44.2 56.9 65.8 73.1 EPS - Reported (diluted) 4.3 4.8 8.1 9.9 11.7Other income 2.0 1.7 0.0 0.0 0.0 Diluted shares (m) 89.1 109.9 116.6 116.6 116.6Corporate costs 16.0 34.8 38.8 44.4 49.1 DPS (cps) 1 0.0 2.0 3.0 4.0EBITDA 7.0 11.2 18.1 21.4 24.0 Payout Ratio 23.5% 0.0% 24.8% 30.3% 34.1%Depreciation & Amortisation -2.0 -3.9 -4.4 -5.1 -5.3 Franking 100% 100% 100% 100% 100%Impairment 0.0 0.0 0.0 0.0 0.0EBIT 5.0 7.3 13.7 16.3 18.7 VALUATION FY14A FY15A FY16E FY17E FY18E
Net interest -0.7 -1.3 -1.2 -0.9 -0.4 Underlying cash P/E (x) 20.0 17.7 10.6 8.6 7.2NPBT 4.3 6.0 12.5 15.4 18.2 PEG 0.21 1.40 0.16 0.37 0.39Tax -0.5 -0.7 -3.1 -3.8 -4.6 Price/FCF -77.0 -14.5 11.5 11.8 7.5Minorities 0.0 0.0 0.0 0.0 0.0 EV/EBITDA (x) 15.0 10.0 6.1 5.2 4.3Reported NPAT 3.8 5.3 9.4 11.5 13.7 EV/EBIT (x) 21.0 15.3 8.1 6.8 5.5
Dividend Yield (%) 1.2% 0.0% 2.4% 3.5% 4.7%Non-recurring items (net tax) 0.0 0.0 0.0 0.0 0.0 Price/Book (x) 2.2 1.8 1.7 1.5 1.3Underlying cash profit 3.8 5.2 9.4 11.5 13.7 Price/NTA (x) 11.4 22.8 8.6 5.0 3.4
BALANCE SHEET (A$m) FY14A FY15A FY16E FY17E FY18E GROWTH FY14A FY15A FY16E FY17E FY18E
Assets Revenue growth 48.0% 86.5% 28.6% 15.2% 10.5%Cash 8.1 9.6 6.4 4.8 9.4 Operating cost growth 36.5% 83.6% 28.5% 14.9% 10.2%Receivables 11.1 26.8 32.2 39.9 44.1 EBITDA growth 94.5% 59.5% 62.4% 17.8% 12.3%PPE 12.8 22.3 25.1 25.7 26.1 PBT growth 118.6% 39.0% 108.3% 22.9% 18.5%Intangibles 27.8 48.6 48.3 48.0 47.7 Underlying NPAT growth 144.8% 37.9% 79.5% 22.9% 18.5%Other assets 6.3 14.1 14.1 14.1 14.1 Reported NPAT growth 144.8% 39.0% 78.1% 22.9% 18.5%Total Assets 66.0 121.4 126.0 132.5 141.4 MARGINS & RETURNS FY14A FY15A FY16E FY17E FY18E
Liabilities Gross profit margin 30.5% 34.5% 34.5% 34.6% 34.8%Payables 12.4 24.9 32.0 36.9 40.8 EBITDA Margin 10.2% 8.7% 11.0% 11.3% 11.4%Finanical liabilities 14.0 22.3 18.3 17.3 13.3 EBIT Margin 7.3% 5.7% 8.3% 8.6% 8.9%Provisions 2.4 5.0 5.0 5.0 5.0 NPBT Margin 6.3% 4.7% 7.6% 8.1% 8.7%Tax liabilities 2.8 4.5 4.5 4.5 4.5 ROIC 14.8% 12.1% 15.0% 16.1% 17.4%Other liabilities 0.0 12.0 6.4 0.9 0.9 ROE 15.3% 12.0% 16.7% 18.1% 18.9%Total Liabilities 31.6 68.7 66.2 64.6 64.5 ROA 10.3% 7.8% 11.1% 12.6% 13.6%Equity Effective Tax Rate 12.3% 12.3% 25.0% 25.0% 25.0%Share capital 24.4 37.8 37.8 37.8 37.8 GEARING FY14A FY15A FY16E FY17E FY18E
Retained earnings 9.4 13.6 20.7 28.7 37.8 Net Debt / (cash) (A$m) 6.0 12.7 11.9 12.5 3.9Other equity 0.7 1.4 1.4 1.4 1.4 Enterprise value 105.1 111.8 111.1 111.6 103.0Total shareholders equity 34.5 52.7 59.8 67.9 77.0 Net Debt/Equity (%) 17.4% 24.1% 20.0% 18.4% 5.0%
EBITDA/Net interest 10.3 8.5 15.2 23.0 54.6BV per share (cps) 38.7 47.9 51.3 58.2 66.0 Net Debt/EBITDA 0.85 1.14 0.66 0.58 0.16NTA per share (cps) 7.5 3.7 9.9 17.1 25.1
Operational Data FY14A FY15A FY16E FY17E FY18E
CASH FLOW (A$M) FY14A FY15A FY16E FY17E FY18E Group Revenue 68.8 128.3 165.0 190.0 210.0
Cash at Start 2.1 8.1 9.6 6.4 4.8 Application Services 35.4 93.7 123.8 146.3 168.0Cash from from ops 5.3 5.0 15.5 13.7 18.7 Infrastructure Services 31.4 34.6 41.3 43.7 42.0Capex -6.3 -11.5 -6.9 -5.3 -5.5 Group Gross Profit 21.0 44.2 56.9 65.8 73.1
Free cash flow -1.0 -6.5 8.6 8.4 13.2 Application Services na 33.7 44.6 52.7 60.5Free cash flow per share (cps) -1.1 -5.9 7.4 7.2 11.4 Infrastructure Services na 10.5 12.4 13.1 12.6
Cash flow from investing -22.6 -23.1 -12.5 -10.8 -5.5 Group Gross Profit margin 31.4% 34.5% 34.5% 34.6% 34.8%
Cash flow from financing 23.3 19.8 -6.3 -4.5 -8.6 Application Services na 36.0% 36.0% 36.0% 36.0%Cash at end 8.1 9.6 6.4 4.8 9.4 Infrastructure Services na 30.3% 30.0% 30.0% 30.0%
19/10/2015$0.85
30-JuneDCF / EV/EBITDA
Page 15

BAILLIEU HOLST RESEARCH
Top Stock Picks – October 2015
Baillieu Holst Ltd ABN 74 006 519 393 www.baillieuholst.com.au Please read the disclaimer at the end of this report.
Investment overview
High proportion of contracted revenue and robust pipeline
Strong revenue guidance: EPD has guided to FY16 revenue in the range of $155m to $175m, up 21% to 36% on the pcp. We have adopted the mid-point of guidance, $165m. Around 67% of this estimate is already covered from contracted infrastructure and application managed services, project work related to managed contracts and other work in hand. Therefore, we are comfortable with this estimate despite it being declared at an early stage in the year.
Managed services and work in hand: EPD has ~50% of our FY16F revenue estimate contracted on multi-year managed service and application contracts. We estimate 70-75% of the contracted revenue base (or 35-37.5% of total revenue) is base contracted infrastructure and application managed services, with the remaining 25-30% being from contracted project specific work, generally for managed service clients. Additional work in hand for the beginning of FY16 was ~$30m, with almost all of this from existing clients.
FIG.1: EBITDA GROWTH: ACQUISITION VERSUS ORGANIC ESTIMATES
$60M
$20M
$30M
$55M $165M
0
50
100
150
200
250
Base contractedrevenue
Contracted project work Work in hand Work to be won FY16 Revenue
$M
Weighted average contract length of ~4 years
We assume a revenuepipeline conversion
rate of ~22%
Mid-point of
guidance
Source: Company Reports, Baillieu Holst forecasts
Project pipeline: The Company expects the tangible FY16 revenue pipeline to be ~$250m in FY16. We see this growing over coming years as EPD leverages its strength in Microsoft business solutions and its own “Cohesion” records management software (which is one of three on a panel to upgrade NZ government records management). We currently forecast a 22% conversion rate on the FY16 pipeline ($55m). However, we note historical conversion rates have been between 30% to 50%, albeit on a smaller pipeline of work. EPD has seen strong momentum in conversion rates on contested multi-year contracts. In 2H15, EPD won $65m of the $100m it contested in multi-year managed infrastructure and application services contracts.
Weighted average contract length: We understand ~$50m in long-term contracted revenue were renewed in FY15. Thus, the current weighted average contract length is approximately four years, the longest it has ever been.
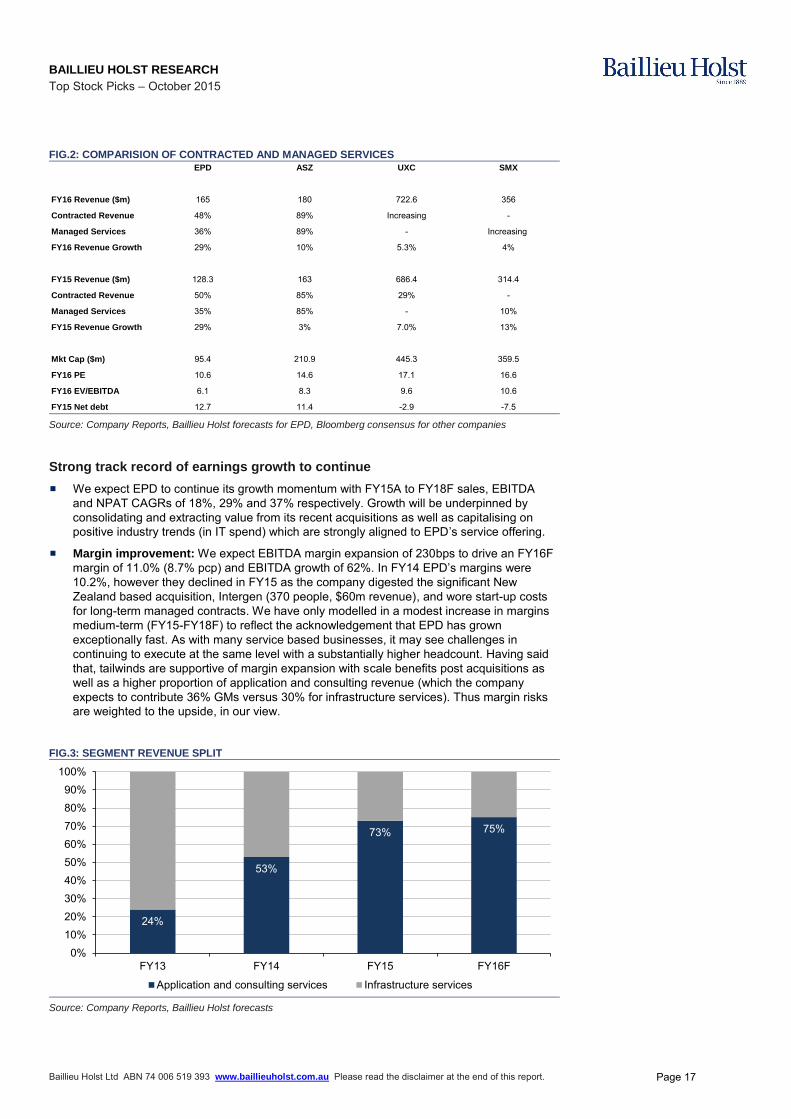
Compares favourably to peers: We provide a snapshot of EPD’s comparable companies and their respective revenue analyses looking into contracted and managed services. ASG Group (ASZ) is more or less a pure managed services business and ranks highest in terms of managed services. EPD is clear second, with UXC and SMS Management and Technology (SMX) following in third and fourth respectively. Whilst EPD does deserve to trade at a discount due to its size; ASZ, SMX and UXC are trading on 36%, 57% and 73% EV/EBITDA premiums respectively. Different companies refer to these revenue streams with different wording so the analysis below may not be a completely accurate on a like for like basis. However, it does demonstrate the strength of EPD’s contracted revenue relative to its peers and its attractive valuation differential. We note larger players such as UXC and SMX have managed and contracted services (annuities) as a core strategic growth focus.
Page 16
BAILLIEU HOLST RESEARCH
Top Stock Picks – October 2015
Baillieu Holst Ltd ABN 74 006 519 393 www.baillieuholst.com.au Please read the disclaimer at the end of this report.
FIG.2: COMPARISION OF CONTRACTED AND MANAGED SERVICES EPD ASZ UXC SMX
FY16 Revenue ($m) 165 180 722.6 356
Contracted Revenue 48% 89% Increasing -
Managed Services 36% 89% - Increasing
FY16 Revenue Growth 29% 10% 5.3% 4%
FY15 Revenue ($m) 128.3 163 686.4 314.4
Contracted Revenue 50% 85% 29% -
Managed Services 35% 85% - 10%
FY15 Revenue Growth 29% 3% 7.0% 13%
Mkt Cap ($m) 95.4 210.9 445.3 359.5
FY16 PE 10.6 14.6 17.1 16.6
FY16 EV/EBITDA 6.1 8.3 9.6 10.6
FY15 Net debt 12.7 11.4 -2.9 -7.5 Source: Company Reports, Baillieu Holst forecasts for EPD, Bloomberg consensus for other companies
Strong track record of earnings growth to continue
We expect EPD to continue its growth momentum with FY15A to FY18F sales, EBITDA and NPAT CAGRs of 18%, 29% and 37% respectively. Growth will be underpinned by consolidating and extracting value from its recent acquisitions as well as capitalising on positive industry trends (in IT spend) which are strongly aligned to EPD’s service offering.
Margin improvement: We expect EBITDA margin expansion of 230bps to drive an FY16F margin of 11.0% (8.7% pcp) and EBITDA growth of 62%. In FY14 EPD’s margins were 10.2%, however they declined in FY15 as the company digested the significant New Zealand based acquisition, Intergen (370 people, $60m revenue), and wore start-up costs for long-term managed contracts. We have only modelled in a modest increase in margins medium-term (FY15-FY18F) to reflect the acknowledgement that EPD has grown exceptionally fast. As with many service based businesses, it may see challenges in continuing to execute at the same level with a substantially higher headcount. Having said that, tailwinds are supportive of margin expansion with scale benefits post acquisitions as well as a higher proportion of application and consulting revenue (which the company expects to contribute 36% GMs versus 30% for infrastructure services). Thus margin risks are weighted to the upside, in our view.
FIG.3: SEGMENT REVENUE SPLIT
24%
53%
73% 75%
0%10%20%30%40%50%60%70%80%90%
100%
FY13 FY14 FY15 FY16F
Application and consulting services Infrastructure services Source: Company Reports, Baillieu Holst forecasts
Page 17
BAILLIEU HOLST RESEARCH
Top Stock Picks – October 2015 INTERNAL ONLY
Baillieu Holst Ltd ABN 74 006 519 393 www.baillieuholst.com.au Please read the disclaimer at the end of this report.
RECOMMENDATIONS
Rating BUY ▲
Risk Medium Price Target $7.00
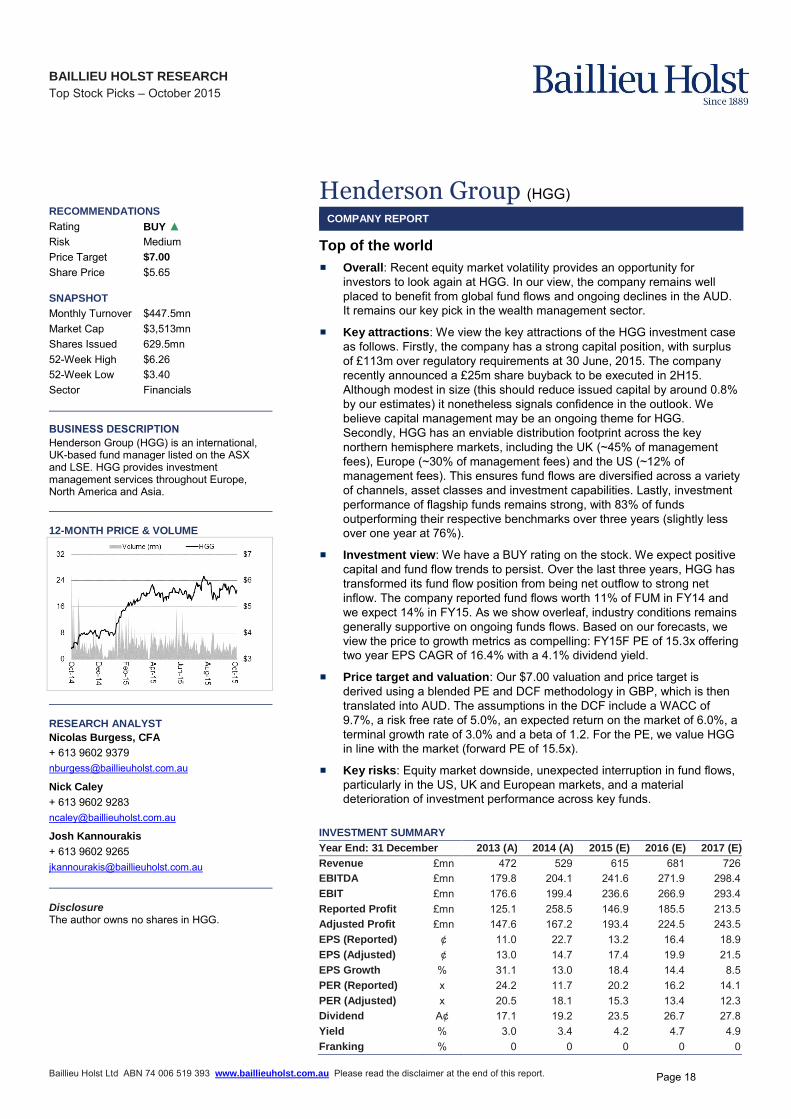
Share Price $5.65 SNAPSHOT Monthly Turnover $447.5mn Market Cap $3,513mn Shares Issued 629.5mn 52-Week High $6.26 52-Week Low $3.40 Sector Financials BUSINESS DESCRIPTION
Henderson Group (HGG) is an international, UK-based fund manager listed on the ASX and LSE. HGG provides investment management services throughout Europe, North America and Asia.
12-MONTH PRICE & VOLUME
RESEARCH ANALYST
Nicolas Burgess, CFA
+ 613 9602 9379 [email protected]
Nick Caley
+ 613 9602 9283 [email protected]
Josh Kannourakis
+ 613 9602 9265 [email protected] Disclosure The author owns no shares in HGG.
Henderson Group (HGG)
COMPANY REPORT
Top of the world
Overall: Recent equity market volatility provides an opportunity for investors to look again at HGG. In our view, the company remains well placed to benefit from global fund flows and ongoing declines in the AUD. It remains our key pick in the wealth management sector.
Key attractions: We view the key attractions of the HGG investment case as follows. Firstly, the company has a strong capital position, with surplus of £113m over regulatory requirements at 30 June, 2015. The company recently announced a £25m share buyback to be executed in 2H15. Although modest in size (this should reduce issued capital by around 0.8% by our estimates) it nonetheless signals confidence in the outlook. We believe capital management may be an ongoing theme for HGG. Secondly, HGG has an enviable distribution footprint across the key northern hemisphere markets, including the UK (~45% of management fees), Europe (~30% of management fees) and the US (~12% of management fees). This ensures fund flows are diversified across a variety of channels, asset classes and investment capabilities. Lastly, investment performance of flagship funds remains strong, with 83% of funds outperforming their respective benchmarks over three years (slightly less over one year at 76%).
Investment view: We have a BUY rating on the stock. We expect positive capital and fund flow trends to persist. Over the last three years, HGG has transformed its fund flow position from being net outflow to strong net inflow. The company reported fund flows worth 11% of FUM in FY14 and we expect 14% in FY15. As we show overleaf, industry conditions remains generally supportive on ongoing funds flows. Based on our forecasts, we view the price to growth metrics as compelling: FY15F PE of 15.3x offering two year EPS CAGR of 16.4% with a 4.1% dividend yield.
Price target and valuation: Our $7.00 valuation and price target is derived using a blended PE and DCF methodology in GBP, which is then translated into AUD. The assumptions in the DCF include a WACC of 9.7%, a risk free rate of 5.0%, an expected return on the market of 6.0%, a terminal growth rate of 3.0% and a beta of 1.2. For the PE, we value HGG in line with the market (forward PE of 15.5x).
Key risks: Equity market downside, unexpected interruption in fund flows, particularly in the US, UK and European markets, and a material deterioration of investment performance across key funds.
INVESTMENT SUMMARY
Year End: 31 December 2013 (A) 2014 (A) 2015 (E) 2016 (E) 2017 (E)
Revenue £mn 472 529 615 681 726 EBITDA £mn 179.8 204.1 241.6 271.9 298.4 EBIT £mn 176.6 199.4 236.6 266.9 293.4 Reported Profit £mn 125.1 258.5 146.9 185.5 213.5 Adjusted Profit £mn 147.6 167.2 193.4 224.5 243.5 EPS (Reported) ¢ 11.0 22.7 13.2 16.4 18.9 EPS (Adjusted) ¢ 13.0 14.7 17.4 19.9 21.5 EPS Growth % 31.1 13.0 18.4 14.4 8.5 PER (Reported) x 24.2 11.7 20.2 16.2 14.1 PER (Adjusted) x 20.5 18.1 15.3 13.4 12.3 Dividend A¢ 17.1 19.2 23.5 26.7 27.8 Yield % 3.0 3.4 4.2 4.7 4.9 Franking % 0 0 0 0 0
Page 18
BAILLIEU HOLST RESEARCH
Top Stock Picks – October 2015
Baillieu Holst Ltd ABN 74 006 519 393 www.baillieuholst.com.au Please read the disclaimer at the end of this report.
Financial summary Code: Rating: BUY
Analyst: Price Target: $7.00
Date: Upside/downside: 23.9%Share Price: Valuation: $7.00Market Capitalisation: Valuation method: DCF / PE blendYear End: Risk: MediumPROFIT & LOSS (GBPm) FY13A FY14A FY15E FY16E FY17E EARNINGS FY13A FY14A FY15E FY16E FY17E
Total fee income 461.3 518.8 595.0 671.4 716.0 EPS - Underling cash (diluted) 13.0 14.7 17.4 19.9 21.5Investment/interest income 12.0 15.2 21.0 11.0 11.0 EPS Growth - underlying 5.2% 13.0% 18.4% 14.4% 8.5%Total revenue 473.3 534.0 616.0 682.4 727.0 EPS - Reported (diluted) 11.0 22.7 13.2 16.4 18.9Operating expenses -293.5 -329.9 -374.4 -410.5 -428.7 Diluted shares (m) 1137 1140 1114 1130 1130Underlying EBITDA 179.8 204.1 241.6 271.9 298.4 DPS (pps) 8.0 9.0 11.0 12.5 13.0Depreciation -3.2 -4.7 -5.0 -5.0 -5.0 Payout Ratio 62% 61% 63% 63% 60%Underlying EBITA 176.6 199.4 236.6 266.9 293.4 Franking 0% 0% 0% 0% 0%Interest cost -11.1 -11.6 -11.7 -2.8 0.0 VALUATION FY13A FY14A FY15E FY16E FY17E
Underlying PBT 165.5 187.8 224.9 264.1 293.4 P/E (x) 20.5 18.1 15.3 13.4 12.3Tax -17.9 -20.6 -31.5 -39.6 -49.9 EV/EBITA (x) 16.7 14.7 12.3 10.8 9.6Minorities 0.0 0.0 0.0 0.0 0.0 EV/EBITDA (x) 16.4 14.4 12.0 10.6 9.5Underlying cash NPAT 147.6 167.2 193.4 224.5 243.5 Dividend Yield (%) 3.0% 3.4% 4.1% 4.7% 4.9%Amortisation -58.4 -53.7 -60 -50 -40 Price/Book (x) 3.6 3.0 2.8 2.7 2.6Non-recurring items (net tax) 35.9 145.0 13.5 11.0 10.0 Price/NTA (x) 15.3 8.9 6.7 5.6 4.7Reported profit 125.1 258.5 146.9 185.5 213.5 Price/FCF per Share (x) 17.6 25.0 23.9 19.5 15.2
GROWTH FY13A FY14A FY15E FY16E FY17E
BALANCE SHEET (GBPm) FY13A FY14A FY15E FY16E FY17E Revenue growth 24.2% 12.5% 14.7% 12.8% 6.7%Assets Operating cost growth 21.3% 12.4% 13.5% 9.6% 4.4%Cash 216.4 234.5 266.7 141.5 197.5 EBITDA growth 25.1% 13.5% 18.4% 12.6% 9.7%Receivables 217.1 275.9 261.8 302.1 329.4 EBITA growth 25.3% 12.9% 18.6% 12.8% 9.9%Other current assets 277.4 469.9 455.8 496.1 523.4 PBT growth 8.2% 13.5% 19.8% 17.4% 11.1%Fixed Assets 17.0 15.1 15.1 15.1 15.1 Underlying NPAT growth 10.6% 13.3% 15.7% 16.0% 8.5%Intangibles 637.9 677.9 617.9 567.9 527.9 Reported NPAT growth 17.6% 106.6% -43.2% 26.2% 15.1%Other non-current assets -67.9 -36.1 -22.0 -62.3 -89.6 MARGINS & RETURNS FY13A FY14A FY15E FY16E FY17E
Total Assets 1297.9 1637.2 1595.3 1460.4 1503.7 EBITDA Margin 39.0% 39.3% 40.6% 40.5% 41.7%Liabilities EBITA Margin 38.3% 38.4% 39.8% 39.8% 41.0%Debt 148.9 149.4 149.7 0.3 0.3 NPBT Margin 35.9% 36.2% 37.8% 39.3% 41.0%Payables 337.7 316.0 297.5 335.7 358.0 ROIC 19.4% 19.8% 20.8% 22.9% 24.2%Current tax liabilities 60.4 61.9 61.9 61.9 61.9 ROE 18.3% 18.1% 18.7% 20.8% 21.5%Provisions 17.6 12.8 12.8 12.8 12.8 ROA 12.7% 13.6% 14.6% 17.5% 19.8%Other liabilities -102.5 79.1 13.8 -54.0 -99.7 Effective Tax Rate 10.8% 11.0% 14.0% 15.0% 17.0%Total Liabilities 462.1 619.2 535.7 356.7 333.3 GEARING FY13A FY14A FY15E FY16E FY17E
Equity Net Debt / (cash) (GBPm) -67.5 -85.1 -117.0 -141.2 -197.2Share capital 140.4 142.4 161.5 161.5 161.5 Enterprise value (GBPm) 2957 2939 2907 2883 2827Retained earnings 47.8 216.4 238.9 283.0 349.6 Net Debt/Equity (%) -8.1% -8.4% -11.0% -12.8% -16.8%Other equity 647.6 659.2 659.2 659.2 659.2 EBITDA/Net interest -199.8 -56.7 -25.9 -33.3 -27.2Total shareholders equity 835.8 1018.0 1059.6 1103.7 1170.3 OPERATIONAL DATA FY13A FY14A FY15E FY16E FY17E
Group Fees 461.3 518.8 595.0 671.4 716.0
BV per share (pps) 73.5 89.3 95.1 97.7 103.5 Management fees 331.9 403.5 470.4 545.8 612.0NTA per share (pps) 17.4 29.8 39.6 47.4 56.8 Transaction fees 34.9 32.5 35.3 38.2 30.6
Performance fees 94.5 82.8 89.4 87.3 73.4CASH FLOW (GBPm) FY13A FY14A FY15E FY16E FY17E Management fees 331.9 403.5 470.4 545.8 612.0
Cash at start 196.9 216.4 234.5 266.7 141.5 Retail 257.2 315.5 379.8 442.9 503.6Cash flow from Ops 174.9 123.0 125.5 156.3 199.6 Institutional 79.5 83.7 90.6 103.0 108.4Capex -2.8 -1.6 -1.8 -1.9 -2.1Free cash flow 172.1 121.4 123.8 154.4 197.4 Flows 2.9 6.7 10.3 6.3 5.2
Free cash flow per share (pps) 15.1 10.7 11.1 13.7 17.5 Retail 4.4 6.8 8.3 5.6 5.2Cash flow from investing -44.5 0.8 39.7 -0.4 -0.6 Institutional -1.5 -0.1 2.1 0.7 0.0Cash flow from financing -93.3 -112.9 -133.1 -281.1 -143.0Cash at end 216.4 234.5 266.7 141.5 197.5 FUM 63.7 75.5 89.5 105.6 115.8
Retail 39.3 46.0 56.5 64.8 73.1GOCF / EBITDA 132% 116% 100% 104% 104% Institutional 24.5 29.5 33.0 40.7 42.7FCF / Underlying cash NPAT 117% 73% 64% 69% 81%
$6424m31 December
HGGNicolas Burgess19 October, 2015$5.65
Page 19

BAILLIEU HOLST RESEARCH
Top Stock Picks – October 2015
Baillieu Holst Ltd ABN 74 006 519 393 www.baillieuholst.com.au Please read the disclaimer at the end of this report.
Operating environment Overall: Despite some volatility in recent months, the UK and European wealth
management markets have been reasonably resilient in terms of aggregate fund flows, which is positive for HGG.
UK market (~45% of HGG group management fees): After peaking in July, fund flows moderated in August given global equity markets volatility. Interestingly, bond funds suffered net outflows but equity and mixed asset funds were solid.
FIG.1: UK RETAIL WEALTH MANAGEMENT – FUND FLOWS BY MONTH (£BN)
-0.5
0.0
0.5
1.0
1.5
2.0
2.5
3.0
3.5
4.0
Jan-
09M
ar-0
9M
ay-0
9Ju
l-09
Sep-
09N
ov-0
9Ja
n-10
Mar
-10
May
-10
Jul-1
0Se
p-10
Nov
-10
Jan-
11M
ar-1
1M
ay-1
1Ju
l-11
Sep-
11N
ov-1
1Ja
n-12
Mar
-12
May
-12
Jul-1
2Se
p-12
Nov
-12
Jan-
13M
ar-1
3M
ay-1
3Ju
l-13
Sep-
13N
ov-1
3Ja
n-14
Mar
-14
May
-14
Jul-1
4Se
p-14
Nov
-14
Jan-
15M
ar-1
5M
ay-1
5Ju
l-15
Source: Investment Management Association
FIG.2: UK RETAIL WEALTH MANAGEMENT – FUND FLOWS BY ASSET CLASS (£M)
-1000
-500
0
500
1000
1500
2000
Jan-
10
Mar
-10
May
-10
Jul-1
0
Sep-
10
Nov
-10
Jan-
11
Mar
-11
May
-11
Jul-1
1
Sep-
11
Nov
-11
Jan-
12
Mar
-12
May
-12
Jul-1
2
Sep-
12
Nov
-12
Jan-
13
Mar
-13
May
-13
Jul-1
3
Sep-
13
Nov
-13
Jan-
14
Mar
-14
May
-14
Jul-1
4
Sep-
14
Nov
-14
Jan-
15
Mar
-15
May
-15
Jul-1
5
Equities Bonds Mixed asset Source: Investment Management Association
Page 20
BAILLIEU HOLST RESEARCH
Top Stock Picks – October 2015
Baillieu Holst Ltd ABN 74 006 519 393 www.baillieuholst.com.au Please read the disclaimer at the end of this report.
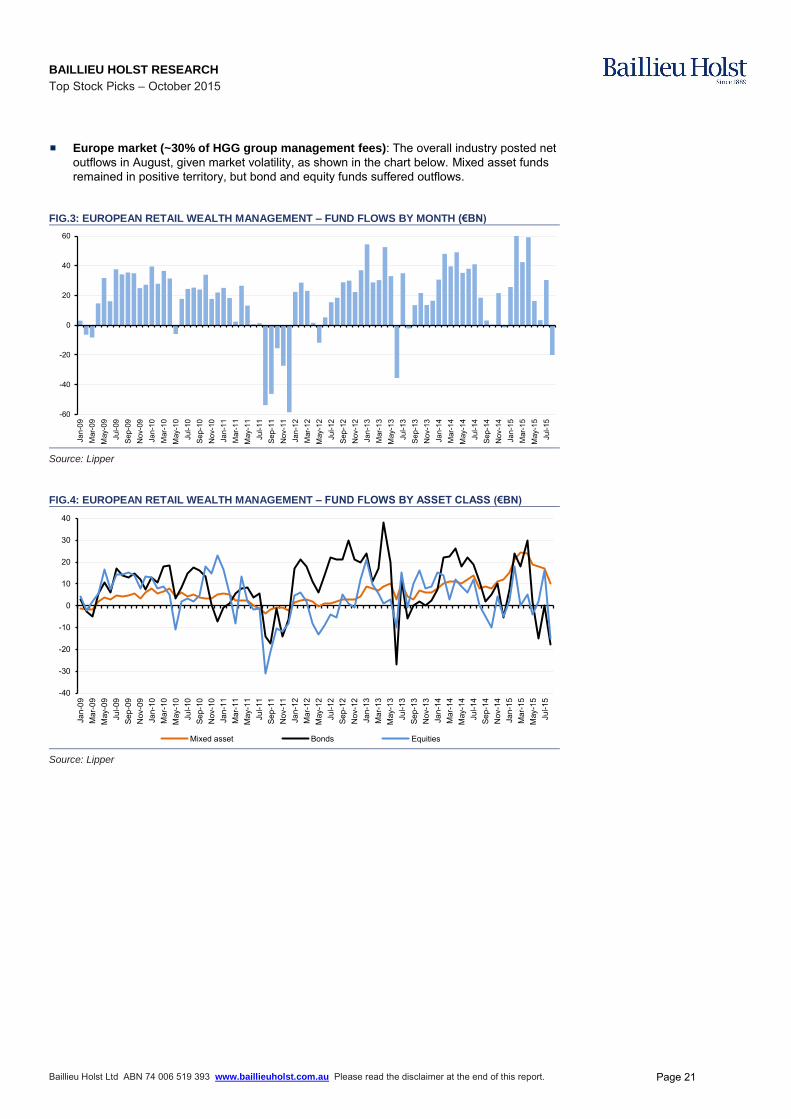
Europe market (~30% of HGG group management fees): The overall industry posted net outflows in August, given market volatility, as shown in the chart below. Mixed asset funds remained in positive territory, but bond and equity funds suffered outflows.
FIG.3: EUROPEAN RETAIL WEALTH MANAGEMENT – FUND FLOWS BY MONTH (€BN)
-60
-40
-20
0
20
40
60
Jan-
09M
ar-0
9M
ay-0
9Ju
l-09
Sep-
09N
ov-0
9Ja
n-10
Mar
-10
May
-10
Jul-1
0Se
p-10
Nov
-10
Jan-
11M
ar-1
1M
ay-1
1Ju
l-11
Sep-
11N
ov-1
1Ja
n-12
Mar
-12
May
-12
Jul-1
2Se
p-12
Nov
-12
Jan-
13M
ar-1
3M
ay-1
3Ju
l-13
Sep-
13N
ov-1
3Ja
n-14
Mar
-14
May
-14
Jul-1
4Se
p-14
Nov
-14
Jan-
15M
ar-1
5M
ay-1
5Ju
l-15
Source: Lipper
FIG.4: EUROPEAN RETAIL WEALTH MANAGEMENT – FUND FLOWS BY ASSET CLASS (€BN)
-40
-30
-20
-10
0
10
20
30
40
Jan-
09M
ar-0
9M
ay-0
9Ju
l-09
Sep-
09N
ov-0
9Ja
n-10
Mar
-10
May
-10
Jul-1
0Se
p-10
Nov
-10
Jan-
11M
ar-1
1M
ay-1
1Ju
l-11
Sep-
11N
ov-1
1Ja
n-12
Mar
-12
May
-12
Jul-1
2Se
p-12
Nov
-12
Jan-
13M
ar-1
3M
ay-1
3Ju
l-13
Sep-
13N
ov-1
3Ja
n-14
Mar
-14
May
-14
Jul-1
4Se
p-14
Nov
-14
Jan-
15M
ar-1
5M
ay-1
5Ju
l-15
Mixed asset Bonds Equities Source: Lipper
Page 21
BAILLIEU HOLST RESEARCH
Top Stock Picks – October 2015
INTERNAL ONLY
Baillieu Holst Ltd ABN 74 006 519 393 www.baillieuholst.com.au Please read the disclaimer at the end of this report.
RECOMMENDATIONS
Rating BUY ▲
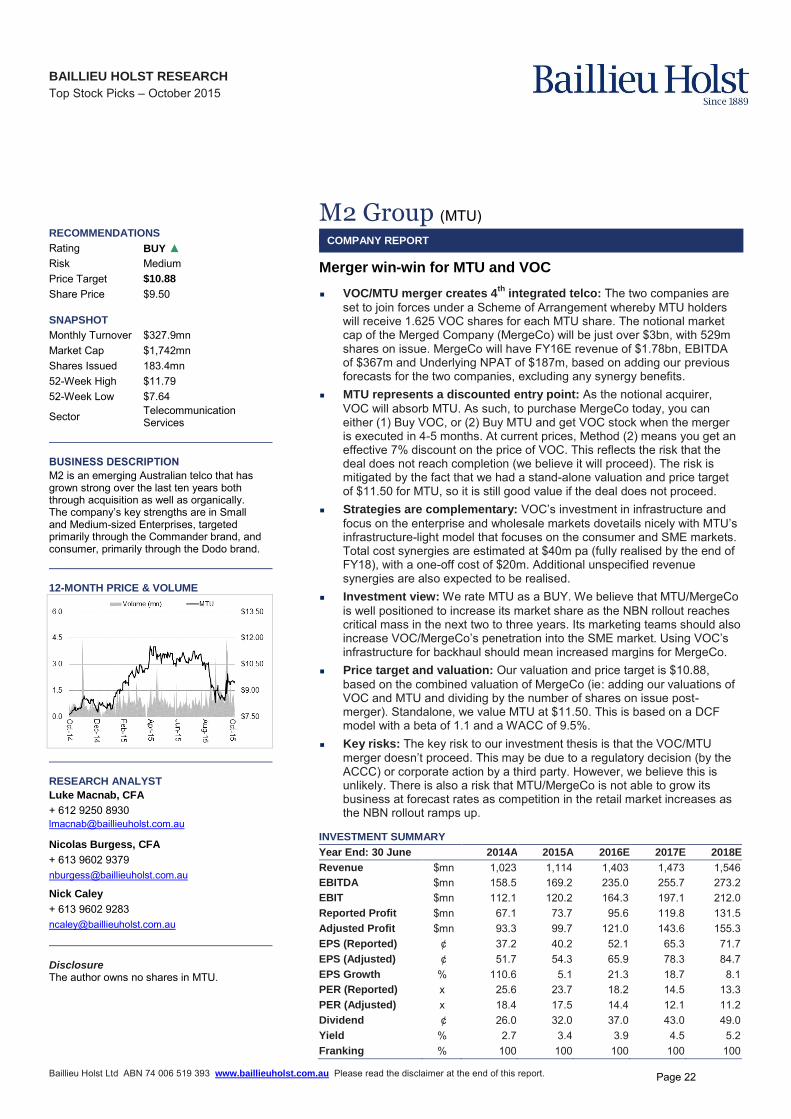
Risk Medium Price Target $10.88
Share Price $9.50 SNAPSHOT Monthly Turnover $327.9mn Market Cap $1,742mn Shares Issued 183.4mn 52-Week High $11.79 52-Week Low $7.64
Sector Telecommunication Services
BUSINESS DESCRIPTION
M2 is an emerging Australian telco that has grown strong over the last ten years both through acquisition as well as organically. The company’s key strengths are in Small and Medium-sized Enterprises, targeted primarily through the Commander brand, and consumer, primarily through the Dodo brand.
12-MONTH PRICE & VOLUME
RESEARCH ANALYST
Luke Macnab, CFA
+ 612 9250 8930 [email protected]
Nicolas Burgess, CFA
+ 613 9602 9379 [email protected]
Nick Caley
+ 613 9602 9283 [email protected] Disclosure The author owns no shares in MTU.
M2 Group (MTU)
COMPANY REPORT
Merger win-win for MTU and VOC
VOC/MTU merger creates 4th
integrated telco: The two companies are set to join forces under a Scheme of Arrangement whereby MTU holders will receive 1.625 VOC shares for each MTU share. The notional market cap of the Merged Company (MergeCo) will be just over $3bn, with 529m shares on issue. MergeCo will have FY16E revenue of $1.78bn, EBITDA of $367m and Underlying NPAT of $187m, based on adding our previous forecasts for the two companies, excluding any synergy benefits.
MTU represents a discounted entry point: As the notional acquirer, VOC will absorb MTU. As such, to purchase MergeCo today, you can either (1) Buy VOC, or (2) Buy MTU and get VOC stock when the merger is executed in 4-5 months. At current prices, Method (2) means you get an effective 7% discount on the price of VOC. This reflects the risk that the deal does not reach completion (we believe it will proceed). The risk is mitigated by the fact that we had a stand-alone valuation and price target of $11.50 for MTU, so it is still good value if the deal does not proceed.
Strategies are complementary: VOC’s investment in infrastructure and
focus on the enterprise and wholesale markets dovetails nicely with MTU’s infrastructure-light model that focuses on the consumer and SME markets. Total cost synergies are estimated at $40m pa (fully realised by the end of FY18), with a one-off cost of $20m. Additional unspecified revenue synergies are also expected to be realised.
Investment view: We rate MTU as a BUY. We believe that MTU/MergeCo is well positioned to increase its market share as the NBN rollout reaches critical mass in the next two to three years. Its marketing teams should also increase VOC/MergeCo’s penetration into the SME market. Using VOC’s infrastructure for backhaul should mean increased margins for MergeCo.
Price target and valuation: Our valuation and price target is $10.88, based on the combined valuation of MergeCo (ie: adding our valuations of VOC and MTU and dividing by the number of shares on issue post-merger). Standalone, we value MTU at $11.50. This is based on a DCF model with a beta of 1.1 and a WACC of 9.5%.
Key risks: The key risk to our investment thesis is that the VOC/MTU merger doesn’t proceed. This may be due to a regulatory decision (by the ACCC) or corporate action by a third party. However, we believe this is unlikely. There is also a risk that MTU/MergeCo is not able to grow its business at forecast rates as competition in the retail market increases as the NBN rollout ramps up.
INVESTMENT SUMMARY
Year End: 30 June 2014A 2015A 2016E 2017E 2018E
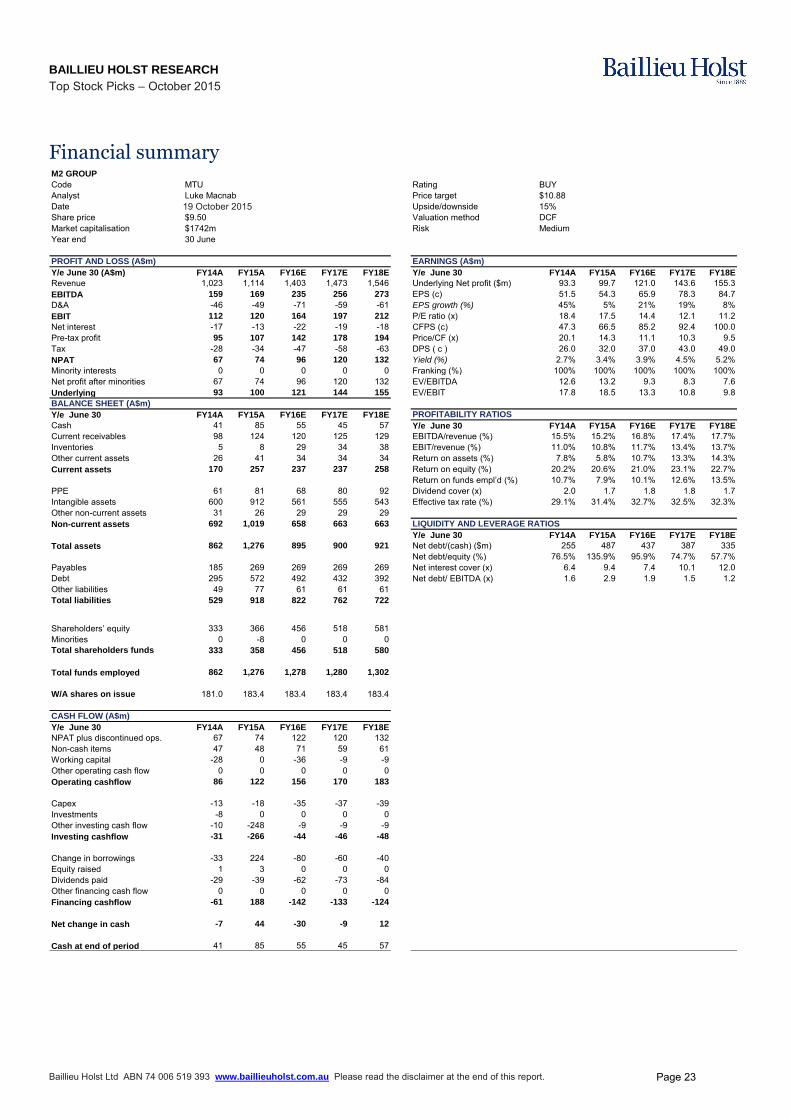
Revenue $mn 1,023 1,114 1,403 1,473 1,546 EBITDA $mn 158.5 169.2 235.0 255.7 273.2 EBIT $mn 112.1 120.2 164.3 197.1 212.0 Reported Profit $mn 67.1 73.7 95.6 119.8 131.5 Adjusted Profit $mn 93.3 99.7 121.0 143.6 155.3 EPS (Reported) ¢ 37.2 40.2 52.1 65.3 71.7 EPS (Adjusted) ¢ 51.7 54.3 65.9 78.3 84.7 EPS Growth % 110.6 5.1 21.3 18.7 8.1 PER (Reported) x 25.6 23.7 18.2 14.5 13.3 PER (Adjusted) x 18.4 17.5 14.4 12.1 11.2 Dividend ¢ 26.0 32.0 37.0 43.0 49.0 Yield % 2.7 3.4 3.9 4.5 5.2 Franking % 100 100 100 100 100
Page 22
BAILLIEU HOLST RESEARCH
Top Stock Picks – October 2015
Baillieu Holst Ltd ABN 74 006 519 393 www.baillieuholst.com.au Please read the disclaimer at the end of this report.
Financial summary M2 GROUP
Code MTU Rating BUYAnalyst Luke Macnab Price target $10.88Date Upside/downside 15%Share price $9.50 Valuation method DCFMarket capitalisation $1742m Risk MediumYear end 30 June
PROFIT AND LOSS (A$m) EARNINGS (A$m)
Y/e June 30 (A$m) FY14A FY15A FY16E FY17E FY18E Y/e June 30 FY14A FY15A FY16E FY17E FY18E
Revenue 1,023 1,114 1,403 1,473 1,546 Underlying Net profit ($m) 93.3 99.7 121.0 143.6 155.3EBITDA 159 169 235 256 273 EPS (c) 51.5 54.3 65.9 78.3 84.7D&A -46 -49 -71 -59 -61 EPS growth (%) 45% 5% 21% 19% 8%EBIT 112 120 164 197 212 P/E ratio (x) 18.4 17.5 14.4 12.1 11.2Net interest -17 -13 -22 -19 -18 CFPS (c) 47.3 66.5 85.2 92.4 100.0Pre-tax profit 95 107 142 178 194 Price/CF (x) 20.1 14.3 11.1 10.3 9.5Tax -28 -34 -47 -58 -63 DPS ( c ) 26.0 32.0 37.0 43.0 49.0NPAT 67 74 96 120 132 Yield (%) 2.7% 3.4% 3.9% 4.5% 5.2%Minority interests 0 0 0 0 0 Franking (%) 100% 100% 100% 100% 100%Net profit after minorities 67 74 96 120 132 EV/EBITDA 12.6 13.2 9.3 8.3 7.6Underlying 93 100 121 144 155 EV/EBIT 17.8 18.5 13.3 10.8 9.8BALANCE SHEET (A$m)
Y/e June 30 FY14A FY15A FY16E FY17E FY18E PROFITABILITY RATIOS
Cash 41 85 55 45 57 Y/e June 30 FY14A FY15A FY16E FY17E FY18E
Current receivables 98 124 120 125 129 EBITDA/revenue (%) 15.5% 15.2% 16.8% 17.4% 17.7%Inventories 5 8 29 34 38 EBIT/revenue (%) 11.0% 10.8% 11.7% 13.4% 13.7%Other current assets 26 41 34 34 34 Return on assets (%) 7.8% 5.8% 10.7% 13.3% 14.3%Current assets 170 257 237 237 258 Return on equity (%) 20.2% 20.6% 21.0% 23.1% 22.7%
Return on funds empl’d (%) 10.7% 7.9% 10.1% 12.6% 13.5%PPE 61 81 68 80 92 Dividend cover (x) 2.0 1.7 1.8 1.8 1.7Intangible assets 600 912 561 555 543 Effective tax rate (%) 29.1% 31.4% 32.7% 32.5% 32.3%Other non-current assets 31 26 29 29 29Non-current assets 692 1,019 658 663 663 LIQUIDITY AND LEVERAGE RATIOS
Y/e June 30 FY14A FY15A FY16E FY17E FY18E
Total assets 862 1,276 895 900 921 Net debt/(cash) ($m) 255 487 437 387 335Net debt/equity (%) 76.5% 135.9% 95.9% 74.7% 57.7%
Payables 185 269 269 269 269 Net interest cover (x) 6.4 9.4 7.4 10.1 12.0Debt 295 572 492 432 392 Net debt/ EBITDA (x) 1.6 2.9 1.9 1.5 1.2Other liabilities 49 77 61 61 61Total liabilities 529 918 822 762 722
Shareholders’ equity 333 366 456 518 581Minorities 0 -8 0 0 0Total shareholders funds 333 358 456 518 580
Total funds employed 862 1,276 1,278 1,280 1,302
W/A shares on issue 181.0 183.4 183.4 183.4 183.4
CASH FLOW (A$m)
Y/e June 30 FY14A FY15A FY16E FY17E FY18E
NPAT plus discontinued ops. 67 74 122 120 132Non-cash items 47 48 71 59 61Working capital -28 0 -36 -9 -9Other operating cash flow 0 0 0 0 0Operating cashflow 86 122 156 170 183
Capex -13 -18 -35 -37 -39Investments -8 0 0 0 0Other investing cash flow -10 -248 -9 -9 -9Investing cashflow -31 -266 -44 -46 -48
Change in borrowings -33 224 -80 -60 -40Equity raised 1 3 0 0 0Dividends paid -29 -39 -62 -73 -84Other financing cash flow 0 0 0 0 0Financing cashflow -61 188 -142 -133 -124
Net change in cash -7 44 -30 -9 12
Cash at end of period 41 85 55 45 57
16 October, 2015
19 October 2015
Page 23
BAILLIEU HOLST RESEARCH
Top Stock Picks – October 2015
Baillieu Holst Ltd ABN 74 006 519 393 www.baillieuholst.com.au Please read the disclaimer at the end of this report.
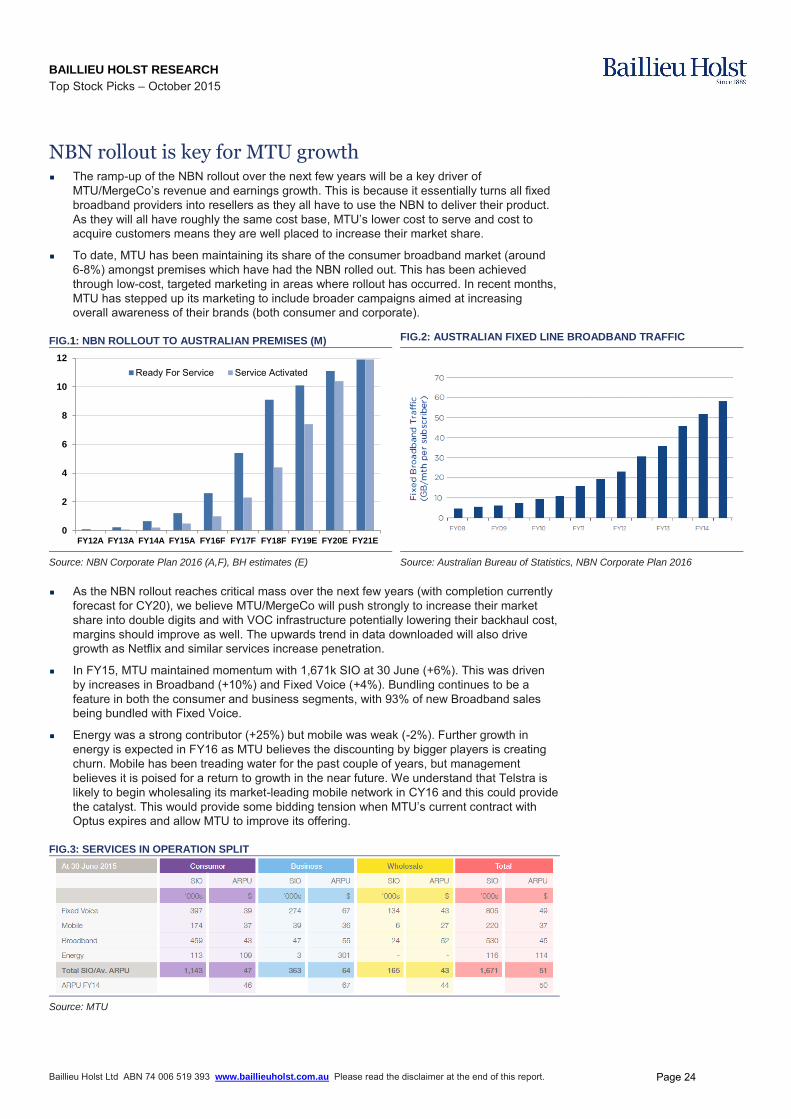
NBN rollout is key for MTU growth The ramp-up of the NBN rollout over the next few years will be a key driver of
MTU/MergeCo’s revenue and earnings growth. This is because it essentially turns all fixed broadband providers into resellers as they all have to use the NBN to deliver their product. As they will all have roughly the same cost base, MTU’s lower cost to serve and cost to
acquire customers means they are well placed to increase their market share.
To date, MTU has been maintaining its share of the consumer broadband market (around 6-8%) amongst premises which have had the NBN rolled out. This has been achieved through low-cost, targeted marketing in areas where rollout has occurred. In recent months, MTU has stepped up its marketing to include broader campaigns aimed at increasing overall awareness of their brands (both consumer and corporate).
FIG.1: NBN ROLLOUT TO AUSTRALIAN PREMISES (M) FIG.2: AUSTRALIAN FIXED LINE BROADBAND TRAFFIC
0
2
4
6
8
10
12
FY12A FY13A FY14A FY15A FY16F FY17F FY18F FY19E FY20E FY21E
Ready For Service Service Activated
Source: NBN Corporate Plan 2016 (A,F), BH estimates (E) Source: Australian Bureau of Statistics, NBN Corporate Plan 2016
As the NBN rollout reaches critical mass over the next few years (with completion currently forecast for CY20), we believe MTU/MergeCo will push strongly to increase their market share into double digits and with VOC infrastructure potentially lowering their backhaul cost, margins should improve as well. The upwards trend in data downloaded will also drive growth as Netflix and similar services increase penetration.
In FY15, MTU maintained momentum with 1,671k SIO at 30 June (+6%). This was driven by increases in Broadband (+10%) and Fixed Voice (+4%). Bundling continues to be a feature in both the consumer and business segments, with 93% of new Broadband sales being bundled with Fixed Voice.
Energy was a strong contributor (+25%) but mobile was weak (-2%). Further growth in energy is expected in FY16 as MTU believes the discounting by bigger players is creating churn. Mobile has been treading water for the past couple of years, but management believes it is poised for a return to growth in the near future. We understand that Telstra is likely to begin wholesaling its market-leading mobile network in CY16 and this could provide the catalyst. This would provide some bidding tension when MTU’s current contract with
Optus expires and allow MTU to improve its offering.
FIG.3: SERVICES IN OPERATION SPLIT
Source: MTU
Page 24
BAILLIEU HOLST RESEARCH Top Stock Picks – October 2015
INTERNAL ONLY
Baillieu Holst Ltd ABN 74 006 519 393 www.baillieuholst.com.au Please read the disclaimer at the end of this report.
RECOMMENDATIONS
Rating BUY ▲ Risk Low
Price Target $4.40
Share Price $4.11 SNAPSHOT
Monthly Turnover $129.4mn
Market Cap $1,100mn
Shares Issued 267.7mn
52-Week High $4.39
52-Week Low $2.25
Sector Consumer Discretionary
BUSINESS DESCRIPTION Mantra Group Limited (MTR) is an Australian accommodation operator. MTR's portfolio consists of over 110 properties using the Mantra, Peppers and BreakFree brands across Australia, New Zealand and in Indonesia. Currently, MTR operates in three main business divisions which are CBD, Resorts and Central Revenue and Distribution.
12-MONTH PRICE & VOLUME
RESEARCH ANALYST Nick Caley
+ 613 9602 9283
Nicolas Burgess, CFA
+ 613 9602 9379
Josh Kannourakis
+ 613 9602 9265
Disclosure The author owns no shares in MTR.
Mantra Group (MTR)
COMPANY REPORT
No room at the inn
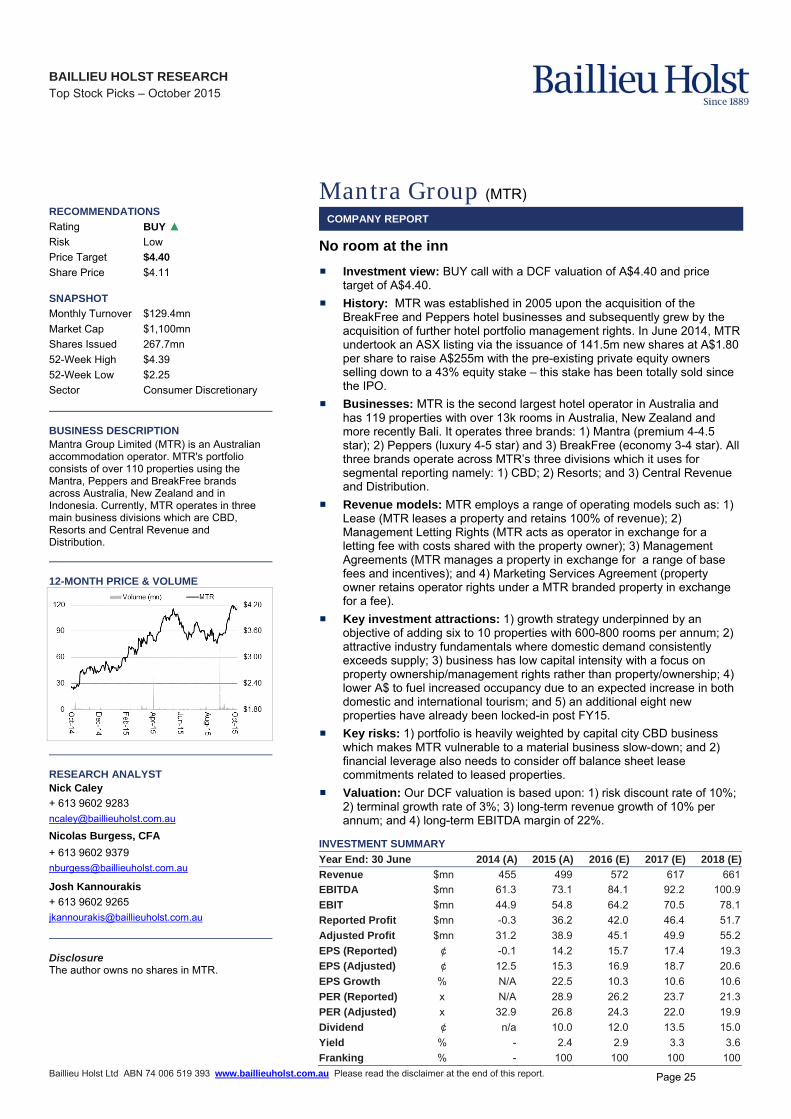
Investment view: BUY call with a DCF valuation of A$4.40 and price target of A$4.40.
History: MTR was established in 2005 upon the acquisition of the BreakFree and Peppers hotel businesses and subsequently grew by the acquisition of further hotel portfolio management rights. In June 2014, MTR undertook an ASX listing via the issuance of 141.5m new shares at A$1.80 per share to raise A$255m with the pre-existing private equity owners selling down to a 43% equity stake – this stake has been totally sold since the IPO.
Businesses: MTR is the second largest hotel operator in Australia and has 119 properties with over 13k rooms in Australia, New Zealand and more recently Bali. It operates three brands: 1) Mantra (premium 4-4.5 star); 2) Peppers (luxury 4-5 star) and 3) BreakFree (economy 3-4 star). All three brands operate across MTR’s three divisions which it uses for segmental reporting namely: 1) CBD; 2) Resorts; and 3) Central Revenue and Distribution.
Revenue models: MTR employs a range of operating models such as: 1) Lease (MTR leases a property and retains 100% of revenue); 2) Management Letting Rights (MTR acts as operator in exchange for a letting fee with costs shared with the property owner); 3) Management Agreements (MTR manages a property in exchange for a range of base fees and incentives); and 4) Marketing Services Agreement (property owner retains operator rights under a MTR branded property in exchange for a fee).
Key investment attractions: 1) growth strategy underpinned by an objective of adding six to 10 properties with 600-800 rooms per annum; 2) attractive industry fundamentals where domestic demand consistently exceeds supply; 3) business has low capital intensity with a focus on property ownership/management rights rather than property/ownership; 4) lower A$ to fuel increased occupancy due to an expected increase in both domestic and international tourism; and 5) an additional eight new properties have already been locked-in post FY15.
Key risks: 1) portfolio is heavily weighted by capital city CBD business which makes MTR vulnerable to a material business slow-down; and 2) financial leverage also needs to consider off balance sheet lease commitments related to leased properties.
Valuation: Our DCF valuation is based upon: 1) risk discount rate of 10%; 2) terminal growth rate of 3%; 3) long-term revenue growth of 10% per annum; and 4) long-term EBITDA margin of 22%.
INVESTMENT SUMMARY
Year End: 30 June 2014 (A) 2015 (A) 2016 (E) 2017 (E) 2018 (E)
Revenue $mn 455 499 572 617 661
EBITDA $mn 61.3 73.1 84.1 92.2 100.9
EBIT $mn 44.9 54.8 64.2 70.5 78.1
Reported Profit $mn -0.3 36.2 42.0 46.4 51.7
Adjusted Profit $mn 31.2 38.9 45.1 49.9 55.2
EPS (Reported) ¢ -0.1 14.2 15.7 17.4 19.3
EPS (Adjusted) ¢ 12.5 15.3 16.9 18.7 20.6
EPS Growth % N/A 22.5 10.3 10.6 10.6
PER (Reported) x N/A 28.9 26.2 23.7 21.3
PER (Adjusted) x 32.9 26.8 24.3 22.0 19.9
Dividend ¢ n/a 10.0 12.0 13.5 15.0
Yield % - 2.4 2.9 3.3 3.6
Franking % - 100 100 100 100
Page 25
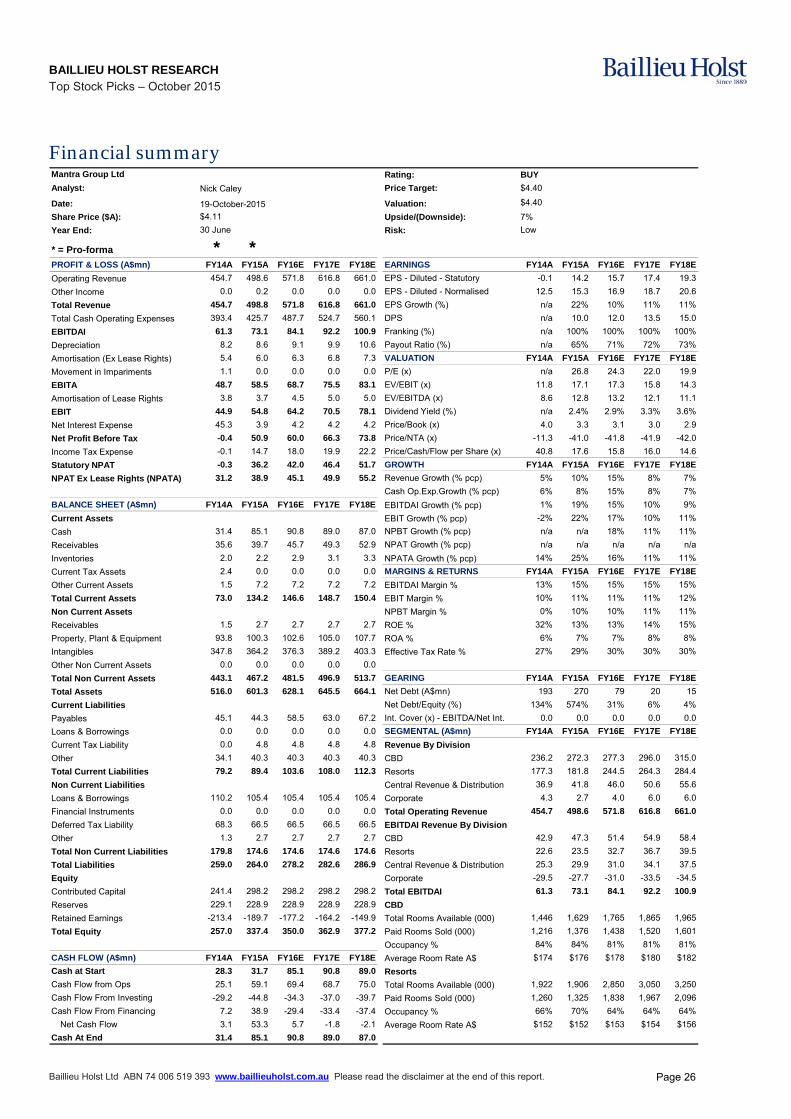
BAILLIEU HOLST RESEARCH Top Stock Picks – October 2015
Baillieu Holst Ltd ABN 74 006 519 393 www.baillieuholst.com.au Please read the disclaimer at the end of this report.
Financial summary Rating: BUY
Analyst: Price Target: $4.40
Date: Valuation: $4.40
Share Price ($A): Upside/(Downside): 7%
Year End: Risk:
* = Pro-forma * *PROFIT & LOSS (A$mn) FY14A FY15A FY16E FY17E FY18E EARNINGS FY14A FY15A FY16E FY17E FY18E
Operating Revenue 454.7 498.6 571.8 616.8 661.0 EPS - Diluted - Statutory -0.1 14.2 15.7 17.4 19.3
Other Income 0.0 0.2 0.0 0.0 0.0 EPS - Diluted - Normalised 12.5 15.3 16.9 18.7 20.6
Total Revenue 454.7 498.8 571.8 616.8 661.0 EPS Growth (%) n/a 22% 10% 11% 11%
Total Cash Operating Expenses 393.4 425.7 487.7 524.7 560.1 DPS n/a 10.0 12.0 13.5 15.0
EBITDAI 61.3 73.1 84.1 92.2 100.9 Franking (%) n/a 100% 100% 100% 100%
Depreciation 8.2 8.6 9.1 9.9 10.6 Payout Ratio (%) n/a 65% 71% 72% 73%
Amortisation (Ex Lease Rights) 5.4 6.0 6.3 6.8 7.3 VALUATION FY14A FY15A FY16E FY17E FY18E
Movement in Impariments 1.1 0.0 0.0 0.0 0.0 P/E (x) n/a 26.8 24.3 22.0 19.9
EBITA 48.7 58.5 68.7 75.5 83.1 EV/EBIT (x) 11.8 17.1 17.3 15.8 14.3
Amortisation of Lease Rights 3.8 3.7 4.5 5.0 5.0 EV/EBITDA (x) 8.6 12.8 13.2 12.1 11.1
EBIT 44.9 54.8 64.2 70.5 78.1 Dividend Yield (%) n/a 2.4% 2.9% 3.3% 3.6%
Net Interest Expense 45.3 3.9 4.2 4.2 4.2 Price/Book (x) 4.0 3.3 3.1 3.0 2.9
Net Profit Before Tax -0.4 50.9 60.0 66.3 73.8 Price/NTA (x) -11.3 -41.0 -41.8 -41.9 -42.0
Income Tax Expense -0.1 14.7 18.0 19.9 22.2 Price/Cash/Flow per Share (x) 40.8 17.6 15.8 16.0 14.6
Statutory NPAT -0.3 36.2 42.0 46.4 51.7 GROWTH FY14A FY15A FY16E FY17E FY18E
NPAT Ex Lease Rights (NPATA) 31.2 38.9 45.1 49.9 55.2 Revenue Growth (% pcp) 5% 10% 15% 8% 7%
Cash Op.Exp.Growth (% pcp) 6% 8% 15% 8% 7%
BALANCE SHEET (A$mn) FY14A FY15A FY16E FY17E FY18E EBITDAI Growth (% pcp) 1% 19% 15% 10% 9%
Current Assets EBIT Growth (% pcp) -2% 22% 17% 10% 11%
Cash 31.4 85.1 90.8 89.0 87.0 NPBT Growth (% pcp) n/a n/a 18% 11% 11%
Receivables 35.6 39.7 45.7 49.3 52.9 NPAT Growth (% pcp) n/a n/a n/a n/a n/a
Inventories 2.0 2.2 2.9 3.1 3.3 NPATA Growth (% pcp) 14% 25% 16% 11% 11%
Current Tax Assets 2.4 0.0 0.0 0.0 0.0 MARGINS & RETURNS FY14A FY15A FY16E FY17E FY18E
Other Current Assets 1.5 7.2 7.2 7.2 7.2 EBITDAI Margin % 13% 15% 15% 15% 15%
Total Current Assets 73.0 134.2 146.6 148.7 150.4 EBIT Margin % 10% 11% 11% 11% 12%
Non Current Assets NPBT Margin % 0% 10% 10% 11% 11%
Receivables 1.5 2.7 2.7 2.7 2.7 ROE % 32% 13% 13% 14% 15%
Property, Plant & Equipment 93.8 100.3 102.6 105.0 107.7 ROA % 6% 7% 7% 8% 8%
Intangibles 347.8 364.2 376.3 389.2 403.3 Effective Tax Rate % 27% 29% 30% 30% 30%
Other Non Current Assets 0.0 0.0 0.0 0.0 0.0
Total Non Current Assets 443.1 467.2 481.5 496.9 513.7 GEARING FY14A FY15A FY16E FY17E FY18E
Total Assets 516.0 601.3 628.1 645.5 664.1 Net Debt (A$mn) 193 270 79 20 15
Current Liabilities Net Debt/Equity (%) 134% 574% 31% 6% 4%
Payables 45.1 44.3 58.5 63.0 67.2 Int. Cover (x) - EBITDA/Net Int. 0.0 0.0 0.0 0.0 0.0
Loans & Borrowings 0.0 0.0 0.0 0.0 0.0 SEGMENTAL (A$mn) FY14A FY15A FY16E FY17E FY18E
Current Tax Liability 0.0 4.8 4.8 4.8 4.8 Revenue By Division
Other 34.1 40.3 40.3 40.3 40.3 CBD 236.2 272.3 277.3 296.0 315.0
Total Current Liabilities 79.2 89.4 103.6 108.0 112.3 Resorts 177.3 181.8 244.5 264.3 284.4
Non Current Liabilities Central Revenue & Distribution 36.9 41.8 46.0 50.6 55.6
Loans & Borrowings 110.2 105.4 105.4 105.4 105.4 Corporate 4.3 2.7 4.0 6.0 6.0
Financial Instruments 0.0 0.0 0.0 0.0 0.0 Total Operating Revenue 454.7 498.6 571.8 616.8 661.0
Deferred Tax Liability 68.3 66.5 66.5 66.5 66.5 EBITDAI Revenue By Division
Other 1.3 2.7 2.7 2.7 2.7 CBD 42.9 47.3 51.4 54.9 58.4
Total Non Current Liabilities 179.8 174.6 174.6 174.6 174.6 Resorts 22.6 23.5 32.7 36.7 39.5
Total Liabilities 259.0 264.0 278.2 282.6 286.9 Central Revenue & Distribution 25.3 29.9 31.0 34.1 37.5
Equity Corporate -29.5 -27.7 -31.0 -33.5 -34.5
Contributed Capital 241.4 298.2 298.2 298.2 298.2 Total EBITDAI 61.3 73.1 84.1 92.2 100.9
Reserves 229.1 228.9 228.9 228.9 228.9 CBD
Retained Earnings -213.4 -189.7 -177.2 -164.2 -149.9 Total Rooms Available (000) 1,446 1,629 1,765 1,865 1,965
Total Equity 257.0 337.4 350.0 362.9 377.2 Paid Rooms Sold (000) 1,216 1,376 1,438 1,520 1,601
Occupancy % 84% 84% 81% 81% 81%
CASH FLOW (A$mn) FY14A FY15A FY16E FY17E FY18E Average Room Rate A$ $174 $176 $178 $180 $182
Cash at Start 28.3 31.7 85.1 90.8 89.0 Resorts
Cash Flow from Ops 25.1 59.1 69.4 68.7 75.0 Total Rooms Available (000) 1,922 1,906 2,850 3,050 3,250
Cash Flow From Investing -29.2 -44.8 -34.3 -37.0 -39.7 Paid Rooms Sold (000) 1,260 1,325 1,838 1,967 2,096
Cash Flow From Financing 7.2 38.9 -29.4 -33.4 -37.4 Occupancy % 66% 70% 64% 64% 64%
Net Cash Flow 3.1 53.3 5.7 -1.8 -2.1 Average Room Rate A$ $152 $152 $153 $154 $156
Cash At End 31.4 85.1 90.8 89.0 87.0
30 June
Mantra Group Ltd
Nick Caley
Low
19-October-2015
$4.11
Page 26

BAILLIEU HOLST RESEARCH Top Stock Picks – October 2015
Baillieu Holst Ltd ABN 74 006 519 393 www.baillieuholst.com.au
FIG.1: MANTRA GROUP LOCATIONS
Source: MTR
FIG.2: MANTRA GROUP OVERVIEW
Source: Company prospectus
Page 27

This page has been left blank intentionally
Page 28
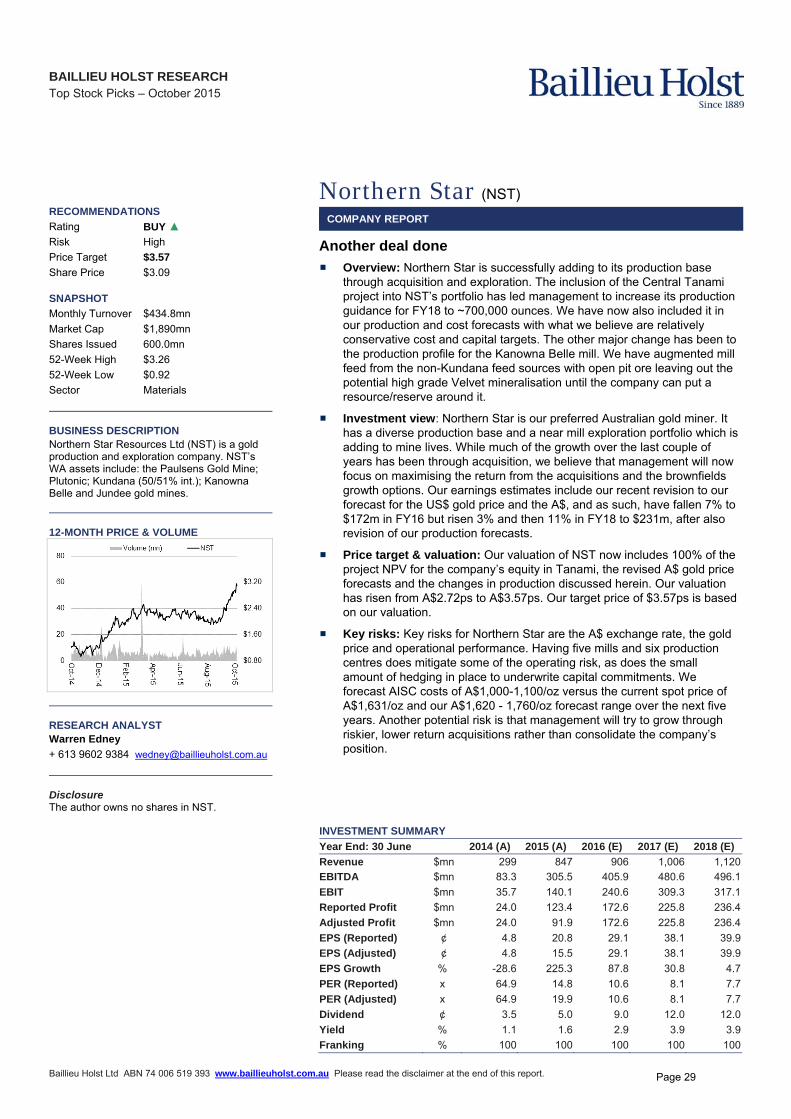
BAILLIEU HOLST RESEARCH Top Stock Picks – October 2015
INTERNAL ONLY
Baillieu Holst Ltd ABN 74 006 519 393 www.baillieuholst.com.au Please read the disclaimer at the end of this report.
RECOMMENDATIONS
Rating BUY ▲ Risk High
Price Target $3.57
Share Price $3.09 SNAPSHOT
Monthly Turnover $434.8mn
Market Cap $1,890mn
Shares Issued 600.0mn
52-Week High $3.26
52-Week Low $0.92
Sector Materials
BUSINESS DESCRIPTION Northern Star Resources Ltd (NST) is a gold production and exploration company. NST’s WA assets include: the Paulsens Gold Mine; Plutonic; Kundana (50/51% int.); Kanowna Belle and Jundee gold mines.
12-MONTH PRICE & VOLUME
RESEARCH ANALYST Warren Edney
+ 613 9602 9384 [email protected]
Disclosure The author owns no shares in NST.
Northern Star (NST)
COMPANY REPORT
Another deal done
Overview: Northern Star is successfully adding to its production base through acquisition and exploration. The inclusion of the Central Tanami project into NST’s portfolio has led management to increase its production guidance for FY18 to ~700,000 ounces. We have now also included it in our production and cost forecasts with what we believe are relatively conservative cost and capital targets. The other major change has been to the production profile for the Kanowna Belle mill. We have augmented mill feed from the non-Kundana feed sources with open pit ore leaving out the potential high grade Velvet mineralisation until the company can put a resource/reserve around it.
Investment view: Northern Star is our preferred Australian gold miner. It has a diverse production base and a near mill exploration portfolio which is adding to mine lives. While much of the growth over the last couple of years has been through acquisition, we believe that management will now focus on maximising the return from the acquisitions and the brownfields growth options. Our earnings estimates include our recent revision to our forecast for the US$ gold price and the A$, and as such, have fallen 7% to $172m in FY16 but risen 3% and then 11% in FY18 to $231m, after also revision of our production forecasts.
Price target & valuation: Our valuation of NST now includes 100% of the project NPV for the company’s equity in Tanami, the revised A$ gold price forecasts and the changes in production discussed herein. Our valuation has risen from A$2.72ps to A$3.57ps. Our target price of $3.57ps is based on our valuation.
Key risks: Key risks for Northern Star are the A$ exchange rate, the gold price and operational performance. Having five mills and six production centres does mitigate some of the operating risk, as does the small amount of hedging in place to underwrite capital commitments. We forecast AISC costs of A$1,000-1,100/oz versus the current spot price of A$1,631/oz and our A$1,620 - 1,760/oz forecast range over the next five years. Another potential risk is that management will try to grow through riskier, lower return acquisitions rather than consolidate the company’s position.
INVESTMENT SUMMARY
Year End: 30 June 2014 (A) 2015 (A) 2016 (E) 2017 (E) 2018 (E)
Revenue $mn 299 847 906 1,006 1,120
EBITDA $mn 83.3 305.5 405.9 480.6 496.1
EBIT $mn 35.7 140.1 240.6 309.3 317.1
Reported Profit $mn 24.0 123.4 172.6 225.8 236.4
Adjusted Profit $mn 24.0 91.9 172.6 225.8 236.4
EPS (Reported) ¢ 4.8 20.8 29.1 38.1 39.9
EPS (Adjusted) ¢ 4.8 15.5 29.1 38.1 39.9
EPS Growth % -28.6 225.3 87.8 30.8 4.7
PER (Reported) x 64.9 14.8 10.6 8.1 7.7
PER (Adjusted) x 64.9 19.9 10.6 8.1 7.7
Dividend ¢ 3.5 5.0 9.0 12.0 12.0
Yield % 1.1 1.6 2.9 3.9 3.9
Franking % 100 100 100 100 100
Page 29
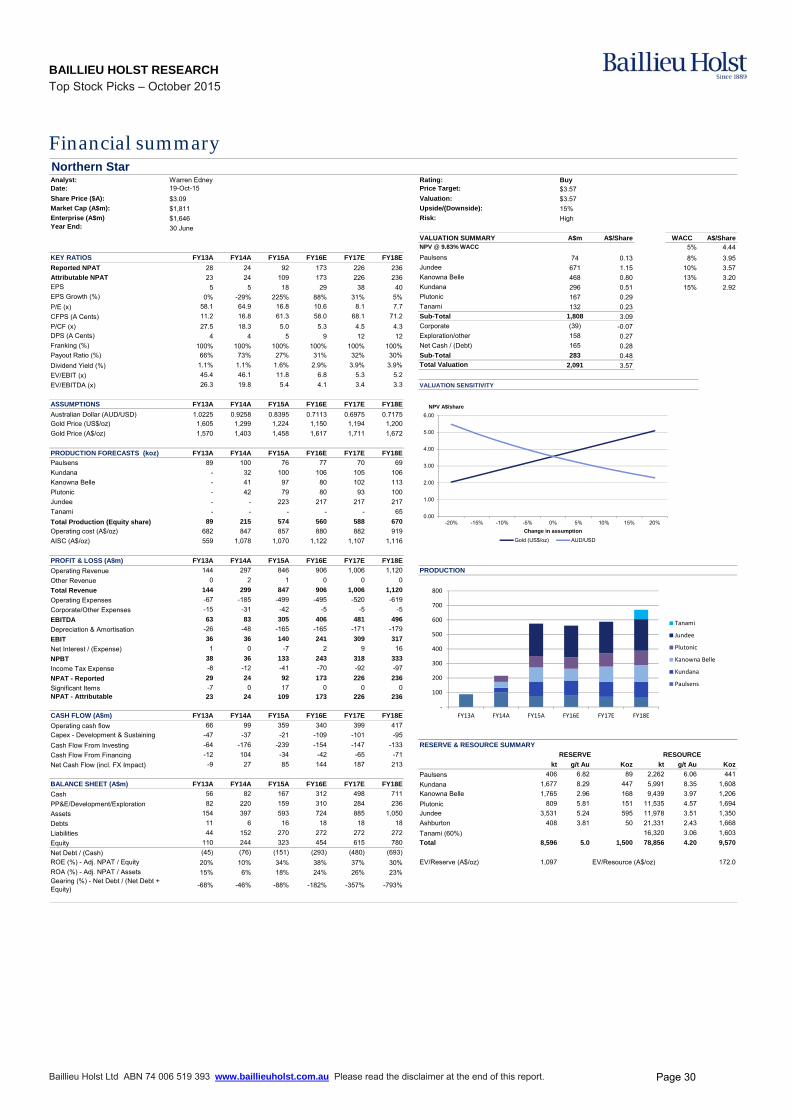
BAILLIEU HOLST RESEARCH Top Stock Picks – October 2015
Baillieu Holst Ltd ABN 74 006 519 393 www.baillieuholst.com.au Please read the disclaimer at the end of this report.
Financial summary Northern StarAnalyst: Warren Edney Rating: BuyDate: 19-Oct-15 Price Target: $3.57Share Price ($A): $3.09 Valuation: $3.57Market Cap (A$m): $1,811 Upside/(Downside): 15%Enterprise (A$m) $1,646 Risk: HighYear End: 30 June
VALUATION SUMMARY A$m A$/Share WACC A$/ShareNPV @ 9.83% WACC 5% 4.44
KEY RATIOS FY13A FY14A FY15A FY16E FY17E FY18E Paulsens 74 0.13 8% 3.95
Reported NPAT 28 24 92 173 226 236 Jundee 671 1.15 10% 3.57
Attributable NPAT 23 24 109 173 226 236 Kanowna Belle 468 0.80 13% 3.20EPS 5 5 18 29 38 40 Kundana 296 0.51 15% 2.92EPS Growth (%) 0% -29% 225% 88% 31% 5% Plutonic 167 0.29
P/E (x) 58.1 64.9 16.8 10.6 8.1 7.7 Tanami 132 0.23
CFPS (A Cents) 11.2 16.8 61.3 58.0 68.1 71.2 Sub-Total 1,808 3.09
P/CF (x) 27.5 18.3 5.0 5.3 4.5 4.3 Corporate (39) -0.07DPS (A Cents) 4 4 5 9 12 12 Exploration/other 158 0.27Franking (%) 100% 100% 100% 100% 100% 100% Net Cash / (Debt) 165 0.28Payout Ratio (%) 66% 73% 27% 31% 32% 30% Sub-Total 283 0.48
Dividend Yield (%) 1.1% 1.1% 1.6% 2.9% 3.9% 3.9% Total Valuation 2,091 3.57
EV/EBIT (x) 45.4 46.1 11.8 6.8 5.3 5.2
EV/EBITDA (x) 26.3 19.8 5.4 4.1 3.4 3.3 VALUATION SENSITIVITY
ASSUMPTIONS FY13A FY14A FY15A FY16E FY17E FY18E
Australian Dollar (AUD/USD) 1.0225 0.9258 0.8395 0.7113 0.6975 0.7175Gold Price (US$/oz) 1,605 1,299 1,224 1,150 1,194 1,200
Gold Price (A$/oz) 1,570 1,403 1,458 1,617 1,711 1,672
PRODUCTION FORECASTS (koz) FY13A FY14A FY15A FY16E FY17E FY18E
Paulsens 89 100 76 77 70 69
Kundana - 32 100 106 105 106
Kanowna Belle - 41 97 80 102 113
Plutonic - 42 79 80 93 100
Jundee - - 223 217 217 217
Tanami - - - - - 65
Total Production (Equity share) 89 215 574 560 588 670
Operating cost (A$/oz) 682 847 857 880 882 919
AISC (A$/oz) 559 1,078 1,070 1,122 1,107 1,116
PROFIT & LOSS (A$m) FY13A FY14A FY15A FY16E FY17E FY18E
Operating Revenue 144 297 846 906 1,006 1,120 PRODUCTION
Other Revenue 0 2 1 0 0 0
Total Revenue 144 299 847 906 1,006 1,120
Operating Expenses -67 -185 -499 -495 -520 -619
Corporate/Other Expenses -15 -31 -42 -5 -5 -5
EBITDA 63 83 305 406 481 496
Depreciation & Amortisation -26 -48 -165 -165 -171 -179
EBIT 36 36 140 241 309 317
Net Interest / (Expense) 1 0 -7 2 9 16
NPBT 38 36 133 243 318 333
Income Tax Expense -8 -12 -41 -70 -92 -97
NPAT - Reported 29 24 92 173 226 236
Significant Items -7 0 17 0 0 0NPAT - Attributable 23 24 109 173 226 236
CASH FLOW (A$m) FY13A FY14A FY15A FY16E FY17E FY18E
Operating cash flow 66 99 359 340 399 417
Capex - Development & Sustaining -47 -37 -21 -109 -101 -95
Cash Flow From Investing -64 -176 -239 -154 -147 -133 RESERVE & RESOURCE SUMMARY
Cash Flow From Financing -12 104 -34 -42 -65 -71 RESERVE RESOURCE
Net Cash Flow (incl. FX Impact) -9 27 85 144 187 213 kt g/t Au Koz kt g/t Au Koz
Paulsens 406 6.82 89 2,262 6.06 441
BALANCE SHEET (A$m) FY13A FY14A FY15A FY16E FY17E FY18E Kundana 1,677 8.29 447 5,991 8.35 1,608
Cash 56 82 167 312 498 711 Kanowna Belle 1,765 2.96 168 9,439 3.97 1,206
PP&E/Development/Exploration 82 220 159 310 284 236 Plutonic 809 5.81 151 11,535 4.57 1,694
Assets 154 397 593 724 885 1,050 Jundee 3,531 5.24 595 11,978 3.51 1,350
Debts 11 6 16 18 18 18 Ashburton 408 3.81 50 21,331 2.43 1,668
Liabilities 44 152 270 272 272 272 Tanami (60%) 16,320 3.06 1,603
Equity 110 244 323 454 615 780 Total 8,596 5.0 1,500 78,856 4.20 9,570
Net Debt / (Cash) (45) (76) (151) (293) (480) (693)
ROE (%) - Adj. NPAT / Equity 20% 10% 34% 38% 37% 30% EV/Reserve (A$/oz) 1,097 EV/Resource (A$/oz) 172.0
ROA (%) - Adj. NPAT / Assets 15% 6% 18% 24% 26% 23%Gearing (%) - Net Debt / (Net Debt + Equity)
-68% -46% -88% -182% -357% -793%
0.00
1.00
2.00
3.00
4.00
5.00
6.00
-20% -15% -10% -5% 0% 5% 10% 15% 20%
NPV A$/share
Change in assumption
Gold (US$/oz) AUD/USD
‐
100
200
300
400
500
600
700
800
FY13A FY14A FY15A FY16E FY17E FY18E
Tanami
Jundee
Plutonic
Kanowna Belle
Kundana
Paulsens
Page 30
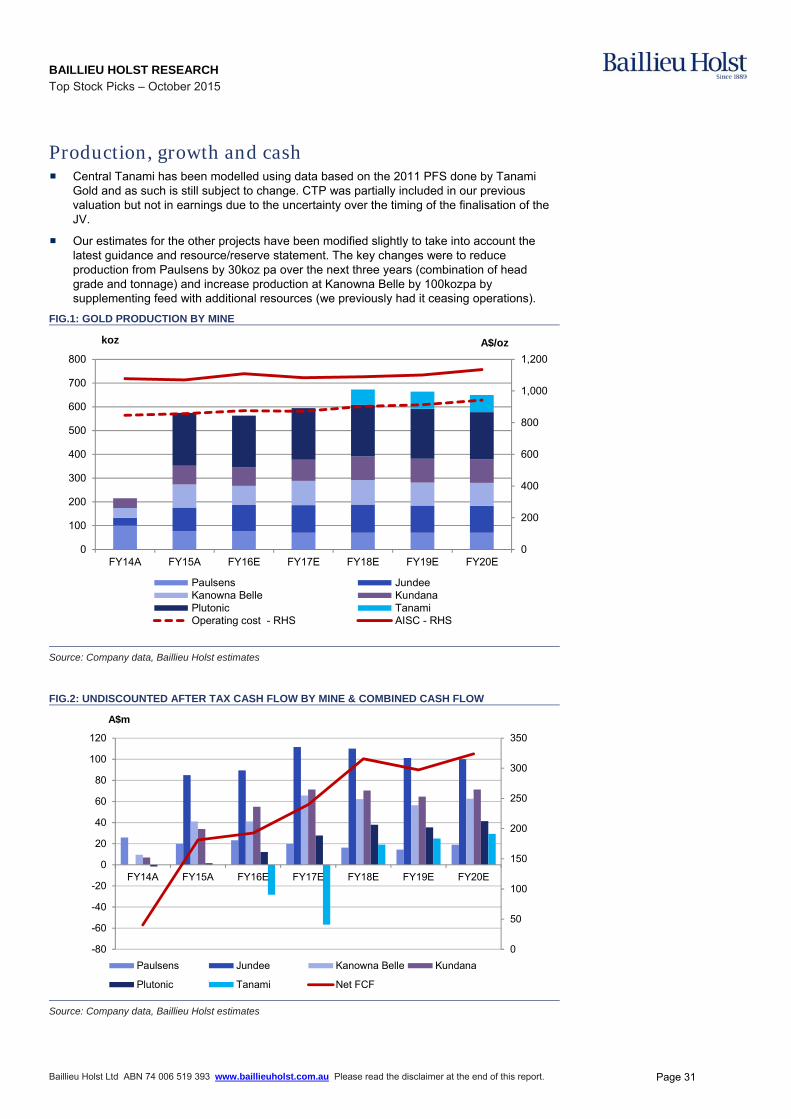
BAILLIEU HOLST RESEARCH Top Stock Picks – October 2015
Baillieu Holst Ltd ABN 74 006 519 393 www.baillieuholst.com.au Please read the disclaimer at the end of this report.
Production, growth and cash Central Tanami has been modelled using data based on the 2011 PFS done by Tanami
Gold and as such is still subject to change. CTP was partially included in our previous valuation but not in earnings due to the uncertainty over the timing of the finalisation of the JV.
Our estimates for the other projects have been modified slightly to take into account the latest guidance and resource/reserve statement. The key changes were to reduce production from Paulsens by 30koz pa over the next three years (combination of head grade and tonnage) and increase production at Kanowna Belle by 100kozpa by supplementing feed with additional resources (we previously had it ceasing operations).
FIG.1: GOLD PRODUCTION BY MINE
0
200
400
600
800
1,000
1,200
0
100
200
300
400
500
600
700
800
FY14A FY15A FY16E FY17E FY18E FY19E FY20E
A$/ozkoz
Paulsens JundeeKanowna Belle KundanaPlutonic TanamiOperating cost - RHS AISC - RHS
Source: Company data, Baillieu Holst estimates
FIG.2: UNDISCOUNTED AFTER TAX CASH FLOW BY MINE & COMBINED CASH FLOW
0
50
100
150
200
250
300
350
-80
-60
-40
-20
0
20
40
60
80
100
120
FY14A FY15A FY16E FY17E FY18E FY19E FY20E
A$m
Paulsens Jundee Kanowna Belle Kundana
Plutonic Tanami Net FCF
Source: Company data, Baillieu Holst estimates
Page 31

This page has been left blank intentionally
Page 32
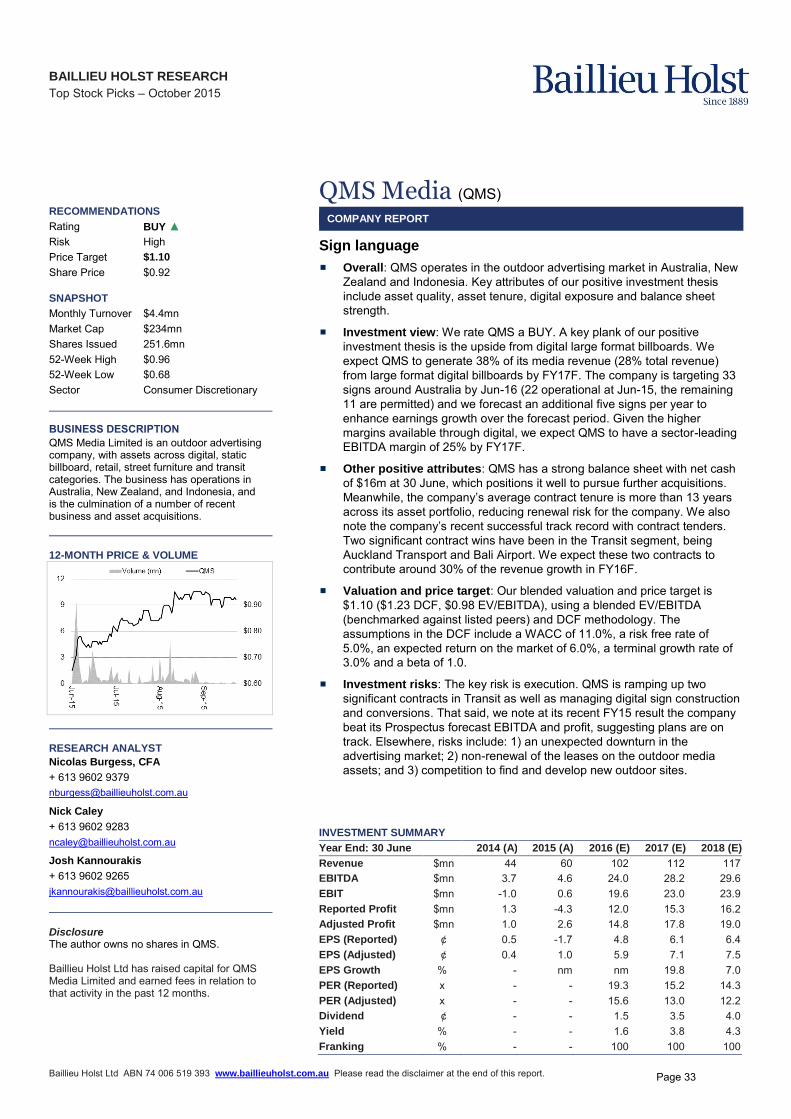
BAILLIEU HOLST RESEARCH
Top Stock Picks – October 2015 INTERNAL ONLY
Baillieu Holst Ltd ABN 74 006 519 393 www.baillieuholst.com.au Please read the disclaimer at the end of this report.
RECOMMENDATIONS
Rating BUY ▲
Risk High Price Target $1.10
Share Price $0.92 SNAPSHOT Monthly Turnover $4.4mn Market Cap $234mn Shares Issued 251.6mn 52-Week High $0.96 52-Week Low $0.68 Sector Consumer Discretionary BUSINESS DESCRIPTION
QMS Media Limited is an outdoor advertising company, with assets across digital, static billboard, retail, street furniture and transit categories. The business has operations in Australia, New Zealand, and Indonesia, and is the culmination of a number of recent business and asset acquisitions.
12-MONTH PRICE & VOLUME
RESEARCH ANALYST
Nicolas Burgess, CFA
+ 613 9602 9379 [email protected]
Nick Caley
+ 613 9602 9283 [email protected]
Josh Kannourakis
+ 613 9602 9265 [email protected] Disclosure The author owns no shares in QMS. Baillieu Holst Ltd has raised capital for QMS Media Limited and earned fees in relation to that activity in the past 12 months.
QMS Media (QMS)
COMPANY REPORT
Sign language
Overall: QMS operates in the outdoor advertising market in Australia, New Zealand and Indonesia. Key attributes of our positive investment thesis include asset quality, asset tenure, digital exposure and balance sheet strength.
Investment view: We rate QMS a BUY. A key plank of our positive investment thesis is the upside from digital large format billboards. We expect QMS to generate 38% of its media revenue (28% total revenue) from large format digital billboards by FY17F. The company is targeting 33 signs around Australia by Jun-16 (22 operational at Jun-15, the remaining 11 are permitted) and we forecast an additional five signs per year to enhance earnings growth over the forecast period. Given the higher margins available through digital, we expect QMS to have a sector-leading EBITDA margin of 25% by FY17F.
Other positive attributes: QMS has a strong balance sheet with net cash of $16m at 30 June, which positions it well to pursue further acquisitions. Meanwhile, the company’s average contract tenure is more than 13 years
across its asset portfolio, reducing renewal risk for the company. We also note the company’s recent successful track record with contract tenders. Two significant contract wins have been in the Transit segment, being Auckland Transport and Bali Airport. We expect these two contracts to contribute around 30% of the revenue growth in FY16F.
Valuation and price target: Our blended valuation and price target is $1.10 ($1.23 DCF, $0.98 EV/EBITDA), using a blended EV/EBITDA (benchmarked against listed peers) and DCF methodology. The assumptions in the DCF include a WACC of 11.0%, a risk free rate of 5.0%, an expected return on the market of 6.0%, a terminal growth rate of 3.0% and a beta of 1.0.
Investment risks: The key risk is execution. QMS is ramping up two significant contracts in Transit as well as managing digital sign construction and conversions. That said, we note at its recent FY15 result the company beat its Prospectus forecast EBITDA and profit, suggesting plans are on track. Elsewhere, risks include: 1) an unexpected downturn in the advertising market; 2) non-renewal of the leases on the outdoor media assets; and 3) competition to find and develop new outdoor sites.
INVESTMENT SUMMARY
Year End: 30 June 2014 (A) 2015 (A) 2016 (E) 2017 (E) 2018 (E)
Revenue $mn 44 60 102 112 117 EBITDA $mn 3.7 4.6 24.0 28.2 29.6 EBIT $mn -1.0 0.6 19.6 23.0 23.9 Reported Profit $mn 1.3 -4.3 12.0 15.3 16.2 Adjusted Profit $mn 1.0 2.6 14.8 17.8 19.0 EPS (Reported) ¢ 0.5 -1.7 4.8 6.1 6.4 EPS (Adjusted) ¢ 0.4 1.0 5.9 7.1 7.5 EPS Growth % - nm nm 19.8 7.0 PER (Reported) x - - 19.3 15.2 14.3 PER (Adjusted) x - - 15.6 13.0 12.2 Dividend ¢ - - 1.5 3.5 4.0 Yield % - - 1.6 3.8 4.3 Franking % - - 100 100 100
Page 33
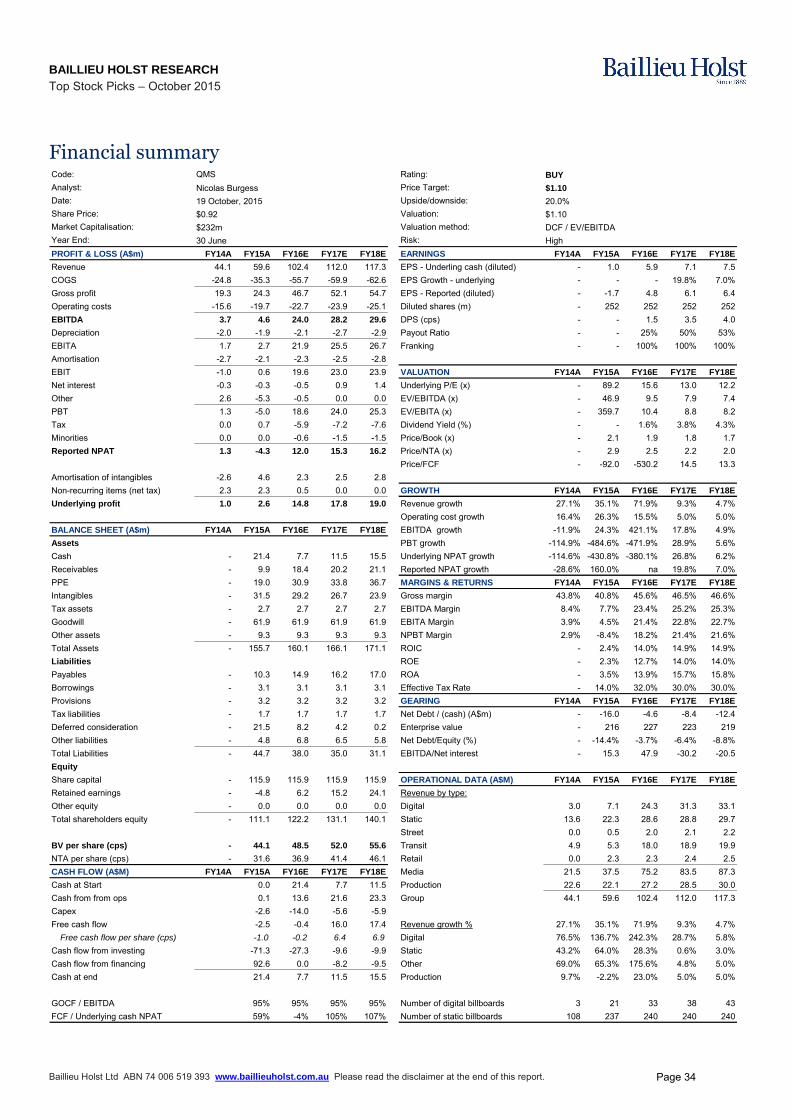
BAILLIEU HOLST RESEARCH
Top Stock Picks – October 2015
Baillieu Holst Ltd ABN 74 006 519 393 www.baillieuholst.com.au Please read the disclaimer at the end of this report.
Financial summary Code: QMS Rating: BUY
Analyst: Price Target:Date: Upside/downside:Share Price: Valuation:Market Capitalisation: Valuation method:Year End: Risk:PROFIT & LOSS (A$m) FY14A FY15A FY16E FY17E FY18E EARNINGS FY14A FY15A FY16E FY17E FY18E
Revenue 44.1 59.6 102.4 112.0 117.3 EPS - Underling cash (diluted) - 1.0 5.9 7.1 7.5COGS -24.8 -35.3 -55.7 -59.9 -62.6 EPS Growth - underlying - - - 19.8% 7.0%Gross profit 19.3 24.3 46.7 52.1 54.7 EPS - Reported (diluted) - -1.7 4.8 6.1 6.4Operating costs -15.6 -19.7 -22.7 -23.9 -25.1 Diluted shares (m) - 252 252 252 252EBITDA 3.7 4.6 24.0 28.2 29.6 DPS (cps) - - 1.5 3.5 4.0Depreciation -2.0 -1.9 -2.1 -2.7 -2.9 Payout Ratio - - 25% 50% 53%EBITA 1.7 2.7 21.9 25.5 26.7 Franking - - 100% 100% 100%Amortisation -2.7 -2.1 -2.3 -2.5 -2.8EBIT -1.0 0.6 19.6 23.0 23.9 VALUATION FY14A FY15A FY16E FY17E FY18E
Net interest -0.3 -0.3 -0.5 0.9 1.4 Underlying P/E (x) - 89.2 15.6 13.0 12.2Other 2.6 -5.3 -0.5 0.0 0.0 EV/EBITDA (x) - 46.9 9.5 7.9 7.4PBT 1.3 -5.0 18.6 24.0 25.3 EV/EBITA (x) - 359.7 10.4 8.8 8.2Tax 0.0 0.7 -5.9 -7.2 -7.6 Dividend Yield (%) - - 1.6% 3.8% 4.3%Minorities 0.0 0.0 -0.6 -1.5 -1.5 Price/Book (x) - 2.1 1.9 1.8 1.7Reported NPAT 1.3 -4.3 12.0 15.3 16.2 Price/NTA (x) - 2.9 2.5 2.2 2.0
Price/FCF - -92.0 -530.2 14.5 13.3Amortisation of intangibles -2.6 4.6 2.3 2.5 2.8Non-recurring items (net tax) 2.3 2.3 0.5 0.0 0.0 GROWTH FY14A FY15A FY16E FY17E FY18E
Underlying profit 1.0 2.6 14.8 17.8 19.0 Revenue growth 27.1% 35.1% 71.9% 9.3% 4.7%Operating cost growth 16.4% 26.3% 15.5% 5.0% 5.0%
BALANCE SHEET (A$m) FY14A FY15A FY16E FY17E FY18E EBITDA growth -11.9% 24.3% 421.1% 17.8% 4.9%Assets PBT growth -114.9% -484.6% -471.9% 28.9% 5.6%Cash - 21.4 7.7 11.5 15.5 Underlying NPAT growth -114.6% -430.8% -380.1% 26.8% 6.2%Receivables - 9.9 18.4 20.2 21.1 Reported NPAT growth -28.6% 160.0% na 19.8% 7.0%PPE - 19.0 30.9 33.8 36.7 MARGINS & RETURNS FY14A FY15A FY16E FY17E FY18E
Intangibles - 31.5 29.2 26.7 23.9 Gross margin 43.8% 40.8% 45.6% 46.5% 46.6%Tax assets - 2.7 2.7 2.7 2.7 EBITDA Margin 8.4% 7.7% 23.4% 25.2% 25.3%Goodwill - 61.9 61.9 61.9 61.9 EBITA Margin 3.9% 4.5% 21.4% 22.8% 22.7%Other assets - 9.3 9.3 9.3 9.3 NPBT Margin 2.9% -8.4% 18.2% 21.4% 21.6%Total Assets - 155.7 160.1 166.1 171.1 ROIC - 2.4% 14.0% 14.9% 14.9%Liabilities ROE - 2.3% 12.7% 14.0% 14.0%Payables - 10.3 14.9 16.2 17.0 ROA - 3.5% 13.9% 15.7% 15.8%Borrowings - 3.1 3.1 3.1 3.1 Effective Tax Rate - 14.0% 32.0% 30.0% 30.0%Provisions - 3.2 3.2 3.2 3.2 GEARING FY14A FY15A FY16E FY17E FY18E
Tax liabilities - 1.7 1.7 1.7 1.7 Net Debt / (cash) (A$m) - -16.0 -4.6 -8.4 -12.4Deferred consideration - 21.5 8.2 4.2 0.2 Enterprise value - 216 227 223 219Other liabilities - 4.8 6.8 6.5 5.8 Net Debt/Equity (%) - -14.4% -3.7% -6.4% -8.8%Total Liabilities - 44.7 38.0 35.0 31.1 EBITDA/Net interest - 15.3 47.9 -30.2 -20.5Equity
Share capital - 115.9 115.9 115.9 115.9 OPERATIONAL DATA (A$M) FY14A FY15A FY16E FY17E FY18E
Retained earnings - -4.8 6.2 15.2 24.1 Revenue by type:Other equity - 0.0 0.0 0.0 0.0 Digital 3.0 7.1 24.3 31.3 33.1Total shareholders equity - 111.1 122.2 131.1 140.1 Static 13.6 22.3 28.6 28.8 29.7
Street 0.0 0.5 2.0 2.1 2.2BV per share (cps) - 44.1 48.5 52.0 55.6 Transit 4.9 5.3 18.0 18.9 19.9NTA per share (cps) - 31.6 36.9 41.4 46.1 Retail 0.0 2.3 2.3 2.4 2.5CASH FLOW (A$M) FY14A FY15A FY16E FY17E FY18E Media 21.5 37.5 75.2 83.5 87.3Cash at Start 0.0 21.4 7.7 11.5 Production 22.6 22.1 27.2 28.5 30.0Cash from from ops 0.1 13.6 21.6 23.3 Group 44.1 59.6 102.4 112.0 117.3Capex -2.6 -14.0 -5.6 -5.9Free cash flow -2.5 -0.4 16.0 17.4 Revenue growth % 27.1% 35.1% 71.9% 9.3% 4.7%
Free cash flow per share (cps) -1.0 -0.2 6.4 6.9 Digital 76.5% 136.7% 242.3% 28.7% 5.8%Cash flow from investing -71.3 -27.3 -9.6 -9.9 Static 43.2% 64.0% 28.3% 0.6% 3.0%Cash flow from financing 92.6 0.0 -8.2 -9.5 Other 69.0% 65.3% 175.6% 4.8% 5.0%Cash at end 21.4 7.7 11.5 15.5 Production 9.7% -2.2% 23.0% 5.0% 5.0%
GOCF / EBITDA 95% 95% 95% 95% Number of digital billboards 3 21 33 38 43FCF / Underlying cash NPAT 59% -4% 105% 107% Number of static billboards 108 237 240 240 240
$232m30 June
DCF / EV/EBITDAHigh
$0.92
Nicolas Burgess $1.10
20.0%$1.10
19 October, 2015
Page 34
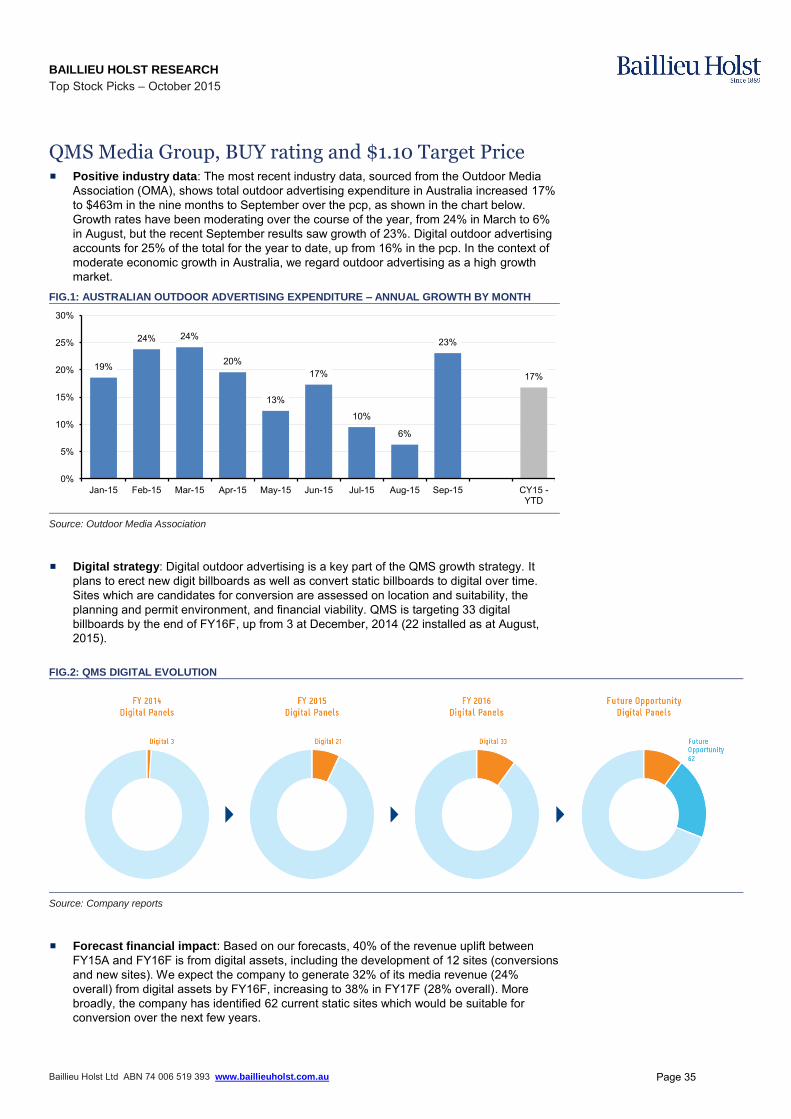
BAILLIEU HOLST RESEARCH
Top Stock Picks – October 2015
Baillieu Holst Ltd ABN 74 006 519 393 www.baillieuholst.com.au
QMS Media Group, BUY rating and $1.10 Target Price Positive industry data: The most recent industry data, sourced from the Outdoor Media
Association (OMA), shows total outdoor advertising expenditure in Australia increased 17% to $463m in the nine months to September over the pcp, as shown in the chart below. Growth rates have been moderating over the course of the year, from 24% in March to 6% in August, but the recent September results saw growth of 23%. Digital outdoor advertising accounts for 25% of the total for the year to date, up from 16% in the pcp. In the context of moderate economic growth in Australia, we regard outdoor advertising as a high growth market.
FIG.1: AUSTRALIAN OUTDOOR ADVERTISING EXPENDITURE – ANNUAL GROWTH BY MONTH
19%
24% 24%
20%
13%
17%
10%
6%
23%
17%
0%
5%
10%
15%
20%
25%
30%
Jan-15 Feb-15 Mar-15 Apr-15 May-15 Jun-15 Jul-15 Aug-15 Sep-15 CY15 -YTD
Source: Outdoor Media Association
Digital strategy: Digital outdoor advertising is a key part of the QMS growth strategy. It plans to erect new digit billboards as well as convert static billboards to digital over time. Sites which are candidates for conversion are assessed on location and suitability, the planning and permit environment, and financial viability. QMS is targeting 33 digital billboards by the end of FY16F, up from 3 at December, 2014 (22 installed as at August, 2015).
FIG.2: QMS DIGITAL EVOLUTION
Source: Company reports
Forecast financial impact: Based on our forecasts, 40% of the revenue uplift between FY15A and FY16F is from digital assets, including the development of 12 sites (conversions and new sites). We expect the company to generate 32% of its media revenue (24% overall) from digital assets by FY16F, increasing to 38% in FY17F (28% overall). More broadly, the company has identified 62 current static sites which would be suitable for conversion over the next few years.
Page 35
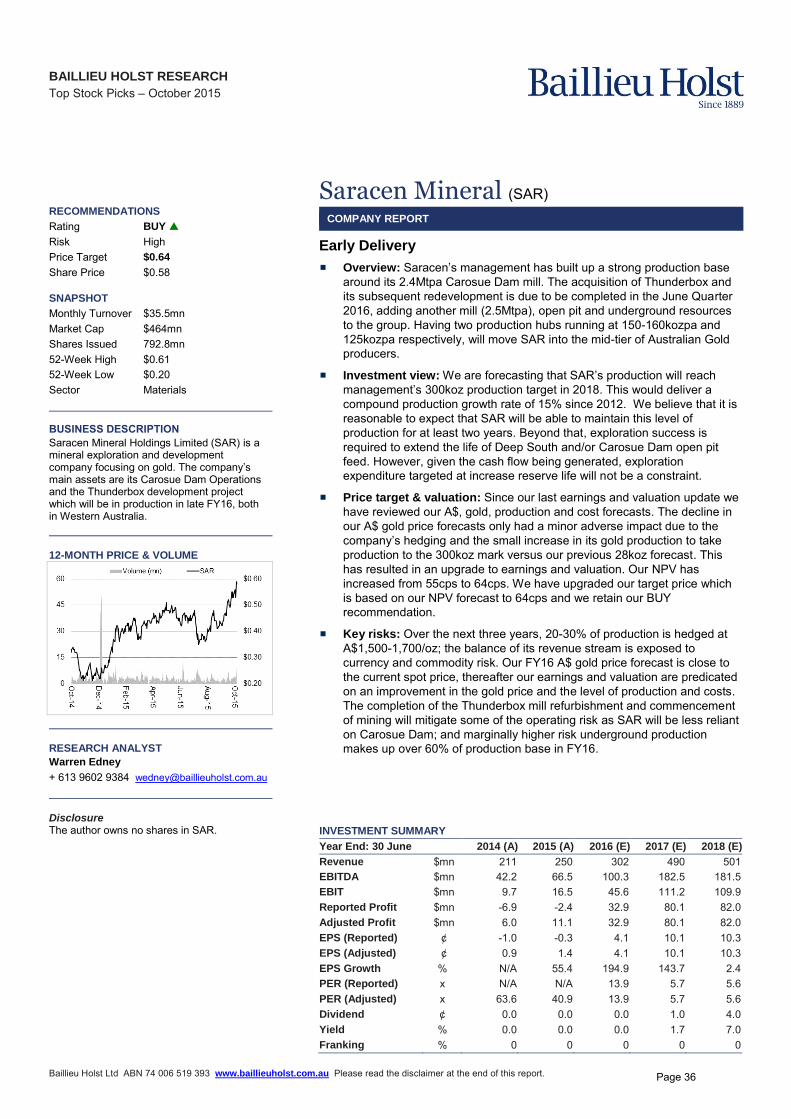
BAILLIEU HOLST RESEARCH
Top Stock Picks – October 2015 INTERNAL ONLY
Baillieu Holst Ltd ABN 74 006 519 393 www.baillieuholst.com.au Please read the disclaimer at the end of this report.
RECOMMENDATIONS
Rating BUY
Risk High Price Target $0.64
Share Price $0.58 SNAPSHOT Monthly Turnover $35.5mn Market Cap $464mn Shares Issued 792.8mn 52-Week High $0.61 52-Week Low $0.20 Sector Materials BUSINESS DESCRIPTION
Saracen Mineral Holdings Limited (SAR) is a mineral exploration and development company focusing on gold. The company’s main assets are its Carosue Dam Operations and the Thunderbox development project which will be in production in late FY16, both in Western Australia.
12-MONTH PRICE & VOLUME
RESEARCH ANALYST
Warren Edney
+ 613 9602 9384 [email protected] Disclosure The author owns no shares in SAR.
Saracen Mineral (SAR)
COMPANY REPORT
Early Delivery
Overview: Saracen’s management has built up a strong production base around its 2.4Mtpa Carosue Dam mill. The acquisition of Thunderbox and its subsequent redevelopment is due to be completed in the June Quarter 2016, adding another mill (2.5Mtpa), open pit and underground resources to the group. Having two production hubs running at 150-160kozpa and 125kozpa respectively, will move SAR into the mid-tier of Australian Gold producers.
Investment view: We are forecasting that SAR’s production will reach management’s 300koz production target in 2018. This would deliver a compound production growth rate of 15% since 2012. We believe that it is reasonable to expect that SAR will be able to maintain this level of production for at least two years. Beyond that, exploration success is required to extend the life of Deep South and/or Carosue Dam open pit feed. However, given the cash flow being generated, exploration expenditure targeted at increase reserve life will not be a constraint.
Price target & valuation: Since our last earnings and valuation update we have reviewed our A$, gold, production and cost forecasts. The decline in our A$ gold price forecasts only had a minor adverse impact due to the company’s hedging and the small increase in its gold production to take production to the 300koz mark versus our previous 28koz forecast. This has resulted in an upgrade to earnings and valuation. Our NPV has increased from 55cps to 64cps. We have upgraded our target price which is based on our NPV forecast to 64cps and we retain our BUY recommendation.
Key risks: Over the next three years, 20-30% of production is hedged at A$1,500-1,700/oz; the balance of its revenue stream is exposed to currency and commodity risk. Our FY16 A$ gold price forecast is close to the current spot price, thereafter our earnings and valuation are predicated on an improvement in the gold price and the level of production and costs. The completion of the Thunderbox mill refurbishment and commencement of mining will mitigate some of the operating risk as SAR will be less reliant on Carosue Dam; and marginally higher risk underground production makes up over 60% of production base in FY16.
INVESTMENT SUMMARY
Year End: 30 June 2014 (A) 2015 (A) 2016 (E) 2017 (E) 2018 (E)
Revenue $mn 211 250 302 490 501 EBITDA $mn 42.2 66.5 100.3 182.5 181.5 EBIT $mn 9.7 16.5 45.6 111.2 109.9 Reported Profit $mn -6.9 -2.4 32.9 80.1 82.0 Adjusted Profit $mn 6.0 11.1 32.9 80.1 82.0 EPS (Reported) ¢ -1.0 -0.3 4.1 10.1 10.3 EPS (Adjusted) ¢ 0.9 1.4 4.1 10.1 10.3 EPS Growth % N/A 55.4 194.9 143.7 2.4 PER (Reported) x N/A N/A 13.9 5.7 5.6 PER (Adjusted) x 63.6 40.9 13.9 5.7 5.6 Dividend ¢ 0.0 0.0 0.0 1.0 4.0 Yield % 0.0 0.0 0.0 1.7 7.0 Franking % 0 0 0 0 0
Page 36
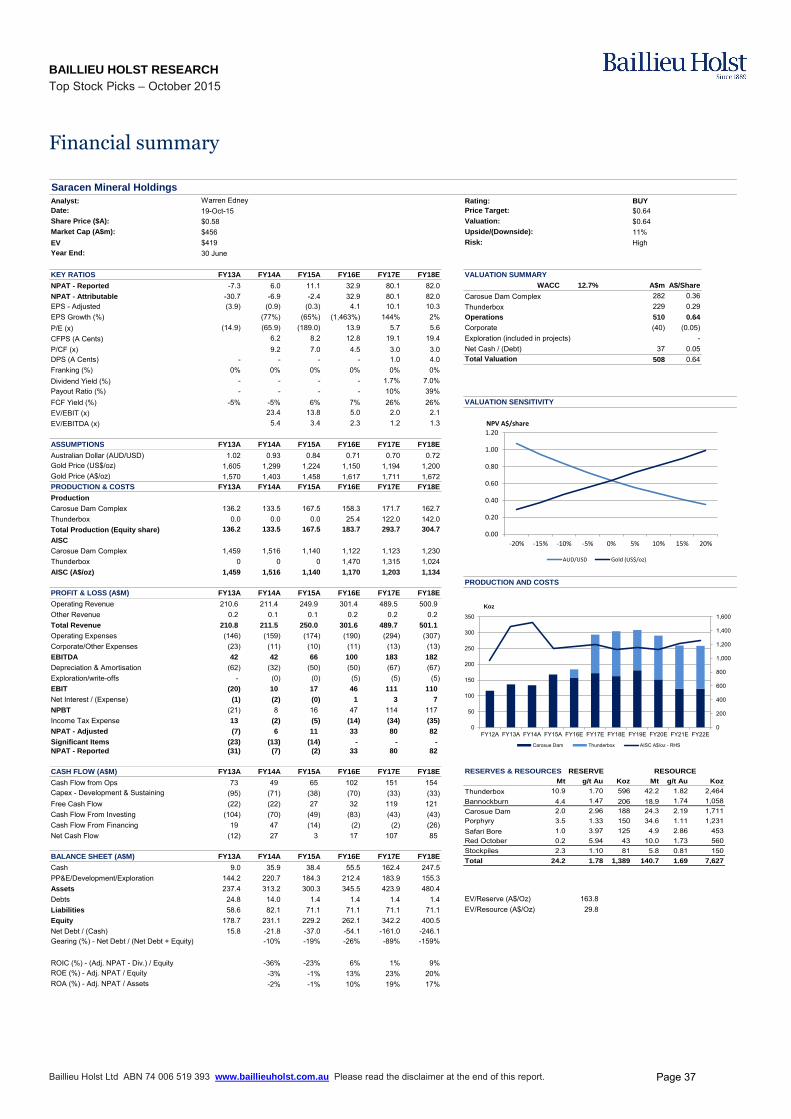
BAILLIEU HOLST RESEARCH
Top Stock Picks – October 2015
Baillieu Holst Ltd ABN 74 006 519 393 www.baillieuholst.com.au Please read the disclaimer at the end of this report.
Financial summary
Saracen Mineral Holdings
Analyst: Warren Edney Rating: BUY
Date: 19-Oct-15 Price Target: $0.64Share Price ($A): $0.58 Valuation: $0.64Market Cap (A$m): $456 Upside/(Downside): 11%EV $419 Risk: HighYear End: 30 June
KEY RATIOS FY13A FY14A FY15A FY16E FY17E FY18E VALUATION SUMMARY
NPAT - Reported -7.3 6.0 11.1 32.9 80.1 82.0 WACC 12.7% A$m A$/Share
NPAT - Attributable -30.7 -6.9 -2.4 32.9 80.1 82.0 Carosue Dam Complex 282 0.36EPS - Adjusted (3.9) (0.9) (0.3) 4.1 10.1 10.3 Thunderbox 229 0.29EPS Growth (%) (77%) (65%) (1,463%) 144% 2% Operations 510 0.64
P/E (x) (14.9) (65.9) (189.0) 13.9 5.7 5.6 Corporate (40) (0.05)CFPS (A Cents) 6.2 8.2 12.8 19.1 19.4 Exploration (included in projects) -P/CF (x) 9.2 7.0 4.5 3.0 3.0 Net Cash / (Debt) 37 0.05DPS (A Cents) - - - - 1.0 4.0 Total Valuation 508 0.64Franking (%) 0% 0% 0% 0% 0% 0%Dividend Yield (%) - - - - 1.7% 7.0%Payout Ratio (%) - - - - 10% 39%FCF Yield (%) -5% -5% 6% 7% 26% 26% VALUATION SENSITIVITY
EV/EBIT (x) 23.4 13.8 5.0 2.0 2.1EV/EBITDA (x) 5.4 3.4 2.3 1.2 1.3
ASSUMPTIONS FY13A FY14A FY15A FY16E FY17E FY18E
Australian Dollar (AUD/USD) 1.02 0.93 0.84 0.71 0.70 0.72Gold Price (US$/oz) 1,605 1,299 1,224 1,150 1,194 1,200Gold Price (A$/oz) 1,570 1,403 1,458 1,617 1,711 1,672PRODUCTION & COSTS FY13A FY14A FY15A FY16E FY17E FY18E
Production
Carosue Dam Complex 136.2 133.5 167.5 158.3 171.7 162.7Thunderbox 0.0 0.0 0.0 25.4 122.0 142.0Total Production (Equity share) 136.2 133.5 167.5 183.7 293.7 304.7
AISC
Carosue Dam Complex 1,459 1,516 1,140 1,122 1,123 1,230Thunderbox 0 0 0 1,470 1,315 1,024AISC (A$/oz) 1,459 1,516 1,140 1,170 1,203 1,134
PRODUCTION AND COSTS
PROFIT & LOSS (A$M) FY13A FY14A FY15A FY16E FY17E FY18E
Operating Revenue 210.6 211.4 249.9 301.4 489.5 500.9Other Revenue 0.2 0.1 0.1 0.2 0.2 0.2Total Revenue 210.8 211.5 250.0 301.6 489.7 501.1
Operating Expenses (146) (159) (174) (190) (294) (307)Corporate/Other Expenses (23) (11) (10) (11) (13) (13)EBITDA 42 42 66 100 183 182
Depreciation & Amortisation (62) (32) (50) (50) (67) (67)Exploration/write-offs - (0) (0) (5) (5) (5)EBIT (20) 10 17 46 111 110
Net Interest / (Expense) (1) (2) (0) 1 3 7
NPBT (21) 8 16 47 114 117Income Tax Expense 13 (2) (5) (14) (34) (35)
NPAT - Adjusted (7) 6 11 33 80 82
Significant Items (23) (13) (14) - - -
NPAT - Reported (31) (7) (2) 33 80 82
CASH FLOW (A$M) FY13A FY14A FY15A FY16E FY17E FY18E
Cash Flow from Ops 73 49 65 102 151 154Capex - Development & Sustaining (95) (71) (38) (70) (33) (33)Free Cash Flow (22) (22) 27 32 119 121Cash Flow From Investing (104) (70) (49) (83) (43) (43)Cash Flow From Financing 19 47 (14) (2) (2) (26)Net Cash Flow (12) 27 3 17 107 85
BALANCE SHEET (A$M) FY13A FY14A FY15A FY16E FY17E FY18E
Cash 9.0 35.9 38.4 55.5 162.4 247.5PP&E/Development/Exploration 144.2 220.7 184.3 212.4 183.9 155.3Assets 237.4 313.2 300.3 345.5 423.9 480.4Debts 24.8 14.0 1.4 1.4 1.4 1.4 EV/Reserve (A$/Oz) 163.8Liabilities 58.6 82.1 71.1 71.1 71.1 71.1 EV/Resource (A$/Oz) 29.8Equity 178.7 231.1 229.2 262.1 342.2 400.5Net Debt / (Cash) 15.8 -21.8 -37.0 -54.1 -161.0 -246.1Gearing (%) - Net Debt / (Net Debt + Equity) -10% -19% -26% -89% -159%
ROIC (%) - (Adj. NPAT - Div.) / Equity -36% -23% 6% 1% 9%ROE (%) - Adj. NPAT / Equity -3% -1% 13% 23% 20%ROA (%) - Adj. NPAT / Assets -2% -1% 10% 19% 17%
0.00
0.20
0.40
0.60
0.80
1.00
1.20
-20% -15% -10% -5% 0% 5% 10% 15% 20%
NPV A$/share
AUD/USD Gold (US$/oz)
0
200
400
600
800
1,000
1,200
1,400
1,600
0
50
100
150
200
250
300
350
FY12A FY13A FY14A FY15A FY16E FY17E FY18E FY19E FY20E FY21E FY22E
Koz
Carosue Dam Thunderbox AISC A$/oz - RHS
RESERVES & RESOURCES RESERVE RESOURCE
Mt g/t Au Koz Mt g/t Au Koz
Thunderbox 10.9 1.70 596 42.2 1.82 2,464Bannockburn 4.4 1.47 206 18.9 1.74 1,058Carosue Dam 2.0 2.96 188 24.3 2.19 1,711Porphyry 3.5 1.33 150 34.6 1.11 1,231Safari Bore 1.0 3.97 125 4.9 2.86 453Red October 0.2 5.94 43 10.0 1.73 560Stockpiles 2.3 1.10 81 5.8 0.81 150Total 24.2 1.78 1,389 140.7 1.69 7,627
Page 37
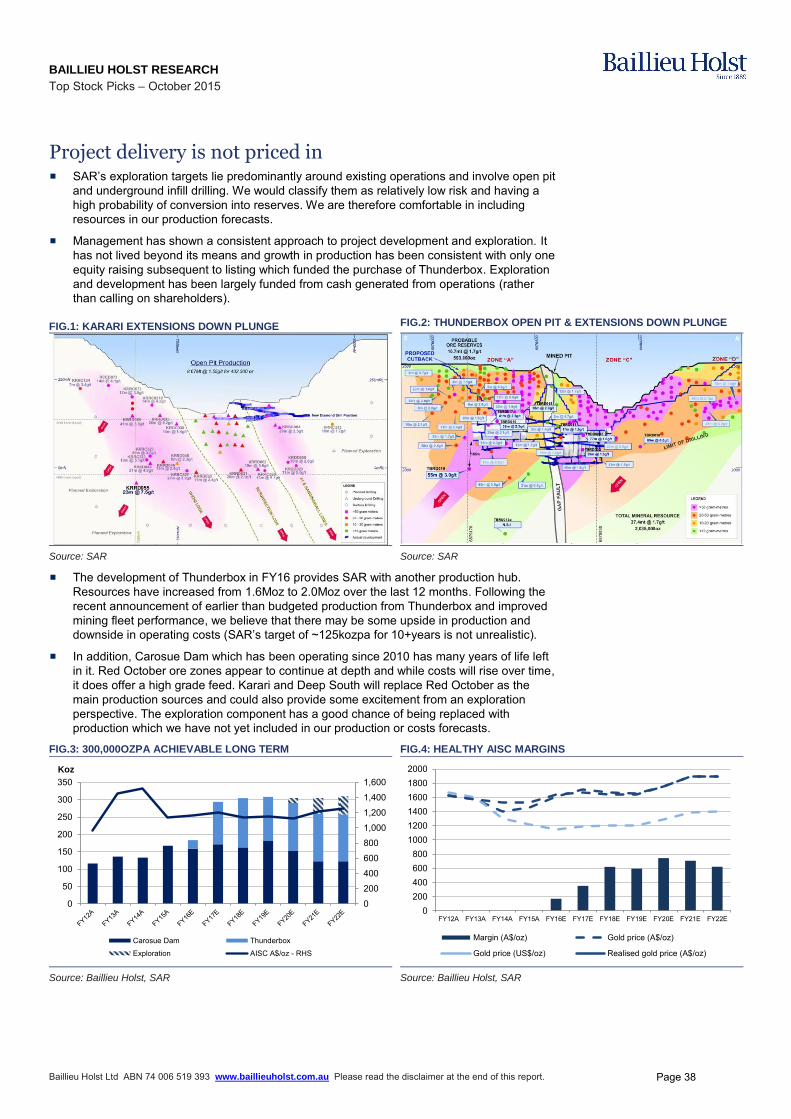
BAILLIEU HOLST RESEARCH
Top Stock Picks – October 2015
Baillieu Holst Ltd ABN 74 006 519 393 www.baillieuholst.com.au Please read the disclaimer at the end of this report.
Project delivery is not priced in SAR’s exploration targets lie predominantly around existing operations and involve open pit
and underground infill drilling. We would classify them as relatively low risk and having a high probability of conversion into reserves. We are therefore comfortable in including resources in our production forecasts.
Management has shown a consistent approach to project development and exploration. It has not lived beyond its means and growth in production has been consistent with only one equity raising subsequent to listing which funded the purchase of Thunderbox. Exploration and development has been largely funded from cash generated from operations (rather than calling on shareholders).
FIG.1: KARARI EXTENSIONS DOWN PLUNGE FIG.2: THUNDERBOX OPEN PIT & EXTENSIONS DOWN PLUNGE
Source: SAR Source: SAR
The development of Thunderbox in FY16 provides SAR with another production hub. Resources have increased from 1.6Moz to 2.0Moz over the last 12 months. Following the recent announcement of earlier than budgeted production from Thunderbox and improved mining fleet performance, we believe that there may be some upside in production and downside in operating costs (SAR’s target of ~125kozpa for 10+years is not unrealistic).
In addition, Carosue Dam which has been operating since 2010 has many years of life left in it. Red October ore zones appear to continue at depth and while costs will rise over time, it does offer a high grade feed. Karari and Deep South will replace Red October as the main production sources and could also provide some excitement from an exploration perspective. The exploration component has a good chance of being replaced with production which we have not yet included in our production or costs forecasts.
FIG.3: 300,000OZPA ACHIEVABLE LONG TERM FIG.4: HEALTHY AISC MARGINS
0
200
400
600
800
1,000
1,200
1,400
1,600
0
50
100
150
200
250
300
350Koz
Carosue Dam Thunderbox
Exploration AISC A$/oz - RHS
0200400600800
100012001400160018002000
FY12A FY13A FY14A FY15A FY16E FY17E FY18E FY19E FY20E FY21E FY22E
Margin (A$/oz) Gold price (A$/oz)
Gold price (US$/oz) Realised gold price (A$/oz)
Source: Baillieu Holst, SAR Source: Baillieu Holst, SAR
Page 38

BAILLIEU HOLST RESEARCH
Top Stock Picks – October 2015
Baillieu Holst Ltd ABN 74 006 519 393 www.baillieuholst.com.au Please read the disclaimer at the end of this report.
Gold price outlook
In the near-term, we expect support for gold on seasonal pickup (Asian buying - Diwali 18 Nov and the Indian wedding season 22 Nov- 14 Dec) muted by headwinds of the first Fed rate hike rate since 2006, and a potential further strengthening in the USD. Steady ETF liquidation ~100-200tpa to reflect the stronger USD is predicted rather than a massive outflow. We estimate gold supply will peak in 2015 and decline thereafter in the current price environment. It will likely take until 1Q-16 for the impact of supply constraints (lack of new projects and depletion, and longer term, ultimate impact of high grading near term) to become apparent. We forecast steady jewellery and bar & coin investment demand from India as increased consumer wealth creates more ability to purchase, and in China, flight to safety and wealth preservation (as we saw in 2013 in India) become the key drivers of investment demand. We see positive fundamentals in the gold market and we forecast a small deficit by 2016, thus we are forecasting a price above current spot. Our long term estimate is US$1,200/oz (our long term A$US$ exchange rate is 75c – A$1600/oz).
FIG.5: GOLD PRICE FORECASTS
2014
E
1Q-15 2Q-15 3Q-15 4Q-15 2015E 1Q-16 2Q-16 3Q-16 4Q-16 2016E 2017E 2018E 2019E
New US$/oz 1,266 1,218 1,194 1,125 1,150 1,172 1,175 1,150 1,175 1,200 1,175 1,200 1,200 1,200 Old US$/oz 1,266 1,218 1,194 1,225 1,250 1,222 1,250 1,225 1,250 1,275 1,250 1,250 1,250 1,250 Chg % 0% 0% 0% -8% -8% -4% -6% -6% -6% -6% -6% -4% -4% -4%
Source: Baillieu Holst
Page 39

This page has been left blank intentionally
Page 40

BAILLIEU HOLST RESEARCH
Top Stock Picks – October 2015 ONLY
Baillieu Holst Ltd ABN 74 006 519 393 www.baillieuholst.com.au Please read the disclaimer at the end of this report.
RECOMMENDATIONS
Rating BUY ▲
Risk Medium Price Target $3.50
Share Price $2.01 SNAPSHOT Monthly Turnover $5.3mn Market Cap $347mn Shares Issued 172.8mn 52-Week High $3.45 52-Week Low $1.90 Sector Consumer Discretionary BUSINESS DESCRIPTION
Shine Corporate Ltd (SHJ) is an Australian law firm that focuses on plaintiff litigation with a focus on the personal injury market in addition to range of emerging practice areas. SHJ is based in Queensland but has grown a national footprint through a series of acquisitions.
12-MONTH PRICE & VOLUME
RESEARCH ANALYST
Nick Caley
+ 613 9602 9283 [email protected]
Nicolas Burgess, CFA
+ 613 9602 9379 [email protected]
Josh Kannourakis
+ 613 9602 9265 [email protected] Disclosure The author owns no shares in SHJ.
Shine Corporate (SHJ)
COMPANY REPORT
Little brother sitting in the corner
History: Shine Corporate (SHJ) was initially established as generalist law firm, KG Shine in 1976 in Toowoomba, QLD. In 1995 a strategic decision was made to specialise in personal injury litigation. SHJ has since grown through a combination of establishing greenfield offices and the acquisition of 20 legal firms. SHJ now has a strong, geographic presence on the Australian eastern seaboard. In May 2013, SHF undertook a share market listing on the ASX via the issuance of 45m shares (including 30m vendor shares) at A$1.00 each which equated to a free float of 29% post the IPO.
The business: Australia’s third largest plaintiff litigation firm behind market
leaders, Slater & Gordon (ASX listed) and Maurice Blackburn (private). SHJ operates on a no-win/no-fee basis in the personal injury market. Main areas of focus are: 1) workers’ compensation; 2) motor vehicle accidents;
3) medical negligence; 4) public liability; 5) insolvency; and 6) specialist law.
Investment attractions: 1) track record of execution since IPO included the acquisition of a number of legal firms - Emanates/Stephen Browne Legal (August 2014), Sciaccas Legal (October 2014) and Bradley Bayly Legal (August 2015); 2) ongoing growth from acquisitions and file purchases; 3) potential upside from tort reform wind-back in NSW and QLD.
Investment risks: 1) acquisition risk, particularly if SHJ decides to diversify into offshore markets such as the UK; and 2) adverse legislative changes that have a negative impact on state-based statutory awards related to personal injury.
Investment view: BUY call with DCF valuation of A$3.51 and price target of A$3.50. In the absence of any negative earnings revisions or legislative changes we attribute the de-rating of the SHJ share price to current negative market sentiment related to listed peer, Slater & Gordon (ASX:SGH) – the market is concerned that: 1) ASIC review of SGH may negatively impact personal injury legal firms such as SHJ and SGH; and 2) earnings guidance for SGH’s recent acquisition in the UK (PSD) may not be realised. We view the release of FY15 audited accounts without material revision as major confidence point for SHJ. Other concerns about the value of UK acquisitions for SGH are un-related to SHJ.
Valuation: Our DCF valuation is based upon: 1) risk discount rate of 10%; 2) terminal growth rate of 3%; 3) long-term revenue growth of 7% per annum; and 4) long-term EBITDA margin of 30%.
INVESTMENT SUMMARY
Year End: 30 June 2014 (A) 2015 (A) 2016 (E) 2017 (E) 2018 (E)
Revenue $mn 116 151 179 199 219 EBITDA $mn 34.4 44.4 52.7 58.7 64.7 EBIT $mn 32.6 42.1 50.0 55.7 61.4 Reported Profit $mn 22.2 29.6 33.8 37.8 41.7 Adjusted Profit $mn 22.2 29.6 33.8 37.8 41.7 EPS (Reported) ¢ 14.3 17.2 19.6 21.9 24.2 EPS (Adjusted) ¢ 14.3 17.2 19.6 21.9 24.2 EPS Growth % 15.9 20.4 13.8 11.7 10.4 PER (Reported) x 14.0 11.7 10.3 9.2 8.3 PER (Adjusted) x 14.0 11.7 10.3 9.2 8.3 Dividend ¢ 3.5 3.8 4.8 5.8 7.0 Yield % 1.7 1.9 2.4 2.9 3.5 Franking % 12 0 30 50 50
Page 41
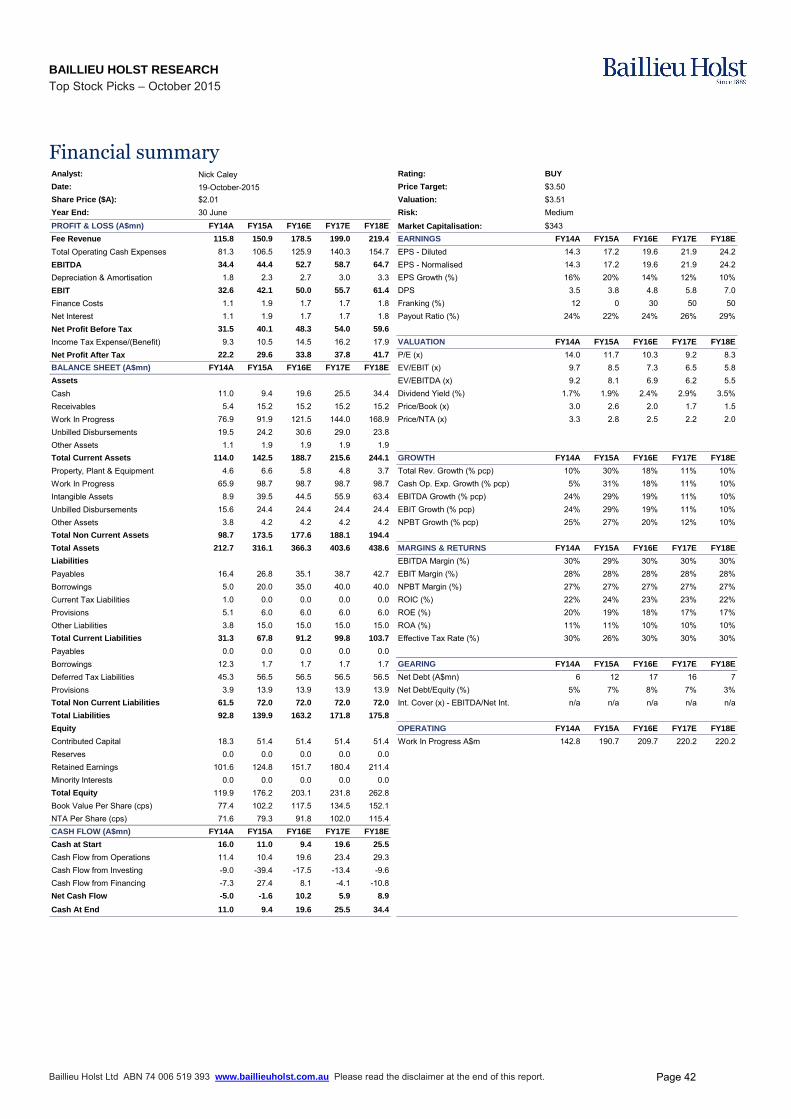
BAILLIEU HOLST RESEARCH
Top Stock Picks – October 2015
Baillieu Holst Ltd ABN 74 006 519 393 www.baillieuholst.com.au Please read the disclaimer at the end of this report.
Financial summary Analyst: Rating:
Date: Price Target:
Share Price ($A): Valuation:
Year End: Risk:
PROFIT & LOSS (A$mn) FY14A FY15A FY16E FY17E FY18E Market Capitalisation: $343Fee Revenue 115.8 150.9 178.5 199.0 219.4 EARNINGS FY14A FY15A FY16E FY17E FY18E
Total Operating Cash Expenses 81.3 106.5 125.9 140.3 154.7 EPS - Diluted 14.3 17.2 19.6 21.9 24.2EBITDA 34.4 44.4 52.7 58.7 64.7 EPS - Normalised 14.3 17.2 19.6 21.9 24.2Depreciation & Amortisation 1.8 2.3 2.7 3.0 3.3 EPS Growth (%) 16% 20% 14% 12% 10%EBIT 32.6 42.1 50.0 55.7 61.4 DPS 3.5 3.8 4.8 5.8 7.0Finance Costs 1.1 1.9 1.7 1.7 1.8 Franking (%) 12 0 30 50 50Net Interest 1.1 1.9 1.7 1.7 1.8 Payout Ratio (%) 24% 22% 24% 26% 29%Net Profit Before Tax 31.5 40.1 48.3 54.0 59.6
Income Tax Expense/(Benefit) 9.3 10.5 14.5 16.2 17.9 VALUATION FY14A FY15A FY16E FY17E FY18E
Net Profit After Tax 22.2 29.6 33.8 37.8 41.7 P/E (x) 14.0 11.7 10.3 9.2 8.3BALANCE SHEET (A$mn) FY14A FY15A FY16E FY17E FY18E EV/EBIT (x) 9.7 8.5 7.3 6.5 5.8Assets EV/EBITDA (x) 9.2 8.1 6.9 6.2 5.5Cash 11.0 9.4 19.6 25.5 34.4 Dividend Yield (%) 1.7% 1.9% 2.4% 2.9% 3.5%Receivables 5.4 15.2 15.2 15.2 15.2 Price/Book (x) 3.0 2.6 2.0 1.7 1.5Work In Progress 76.9 91.9 121.5 144.0 168.9 Price/NTA (x) 3.3 2.8 2.5 2.2 2.0Unbilled Disbursements 19.5 24.2 30.6 29.0 23.8Other Assets 1.1 1.9 1.9 1.9 1.9Total Current Assets 114.0 142.5 188.7 215.6 244.1 GROWTH FY14A FY15A FY16E FY17E FY18E
Property, Plant & Equipment 4.6 6.6 5.8 4.8 3.7 Total Rev. Growth (% pcp) 10% 30% 18% 11% 10%Work In Progress 65.9 98.7 98.7 98.7 98.7 Cash Op. Exp. Growth (% pcp) 5% 31% 18% 11% 10%Intangible Assets 8.9 39.5 44.5 55.9 63.4 EBITDA Growth (% pcp) 24% 29% 19% 11% 10%Unbilled Disbursements 15.6 24.4 24.4 24.4 24.4 EBIT Growth (% pcp) 24% 29% 19% 11% 10%Other Assets 3.8 4.2 4.2 4.2 4.2 NPBT Growth (% pcp) 25% 27% 20% 12% 10%Total Non Current Assets 98.7 173.5 177.6 188.1 194.4
Total Assets 212.7 316.1 366.3 403.6 438.6 MARGINS & RETURNS FY14A FY15A FY16E FY17E FY18E
Liabilities EBITDA Margin (%) 30% 29% 30% 30% 30%Payables 16.4 26.8 35.1 38.7 42.7 EBIT Margin (%) 28% 28% 28% 28% 28%Borrowings 5.0 20.0 35.0 40.0 40.0 NPBT Margin (%) 27% 27% 27% 27% 27%Current Tax Liabilities 1.0 0.0 0.0 0.0 0.0 ROIC (%) 22% 24% 23% 23% 22%Provisions 5.1 6.0 6.0 6.0 6.0 ROE (%) 20% 19% 18% 17% 17%Other Liabilities 3.8 15.0 15.0 15.0 15.0 ROA (%) 11% 11% 10% 10% 10%Total Current Liabilities 31.3 67.8 91.2 99.8 103.7 Effective Tax Rate (%) 30% 26% 30% 30% 30%Payables 0.0 0.0 0.0 0.0 0.0Borrowings 12.3 1.7 1.7 1.7 1.7 GEARING FY14A FY15A FY16E FY17E FY18E
Deferred Tax Liabilities 45.3 56.5 56.5 56.5 56.5 Net Debt (A$mn) 6 12 17 16 7Provisions 3.9 13.9 13.9 13.9 13.9 Net Debt/Equity (%) 5% 7% 8% 7% 3%Total Non Current Liabilities 61.5 72.0 72.0 72.0 72.0 Int. Cover (x) - EBITDA/Net Int. n/a n/a n/a n/a n/aTotal Liabilities 92.8 139.9 163.2 171.8 175.8
Equity OPERATING FY14A FY15A FY16E FY17E FY18E
Contributed Capital 18.3 51.4 51.4 51.4 51.4 Work In Progress A$m 142.8 190.7 209.7 220.2 220.2Reserves 0.0 0.0 0.0 0.0 0.0Retained Earnings 101.6 124.8 151.7 180.4 211.4Minority Interests 0.0 0.0 0.0 0.0 0.0Total Equity 119.9 176.2 203.1 231.8 262.8Book Value Per Share (cps) 77.4 102.2 117.5 134.5 152.1NTA Per Share (cps) 71.6 79.3 91.8 102.0 115.4CASH FLOW (A$mn) FY14A FY15A FY16E FY17E FY18E
Cash at Start 16.0 11.0 9.4 19.6 25.5
Cash Flow from Operations 11.4 10.4 19.6 23.4 29.3Cash Flow from Investing -9.0 -39.4 -17.5 -13.4 -9.6Cash Flow from Financing -7.3 27.4 8.1 -4.1 -10.8Net Cash Flow -5.0 -1.6 10.2 5.9 8.9
Cash At End 11.0 9.4 19.6 25.5 34.4
$3.51
Nick Caley BUY
30 June Medium
19-October-2015 $3.50$2.01
Page 42

BAILLIEU HOLST RESEARCH
Top Stock Picks – October 2015
Baillieu Holst Ltd ABN 74 006 519 393 www.baillieuholst.com.au
FIG.1: ACQUISITIONAL TIMELINE FOR SHJ VERSUS SHARE PRICE (AUD/SHARE)
$1.00
$1.50
$2.00
$2.50
$3.00
$3.50
04-Oct-13 04-Jan-14 04-Apr-14 04-Jul-14 04-Oct-14 04-Jan-15 04-Apr-15 04-Jul-15 04-Oct-15
Acquisition of Emanate Legal and Stephen Browne Personal Injury Lawyers
Acquisition of SciaccasPersonal Injury and Family Law Practice
Acquisition of Bradley Bayly
Source: IRESS, company announcements
FIG.2: SLATER & GORDON SHARE PRICE VERSUS SHINE CORPORATE (AUD/SHARE)
$-
$0.50
$1.00
$1.50
$2.00
$2.50
$3.00
$3.50
$4.00
$4.50
$5.00
$5.50
$6.00
$6.50
$7.00
$7.50
$8.00
$8.50
1/01/2014 1/04/2014 1/07/2014 1/10/2014 1/01/2015 1/04/2015 1/07/2015 1/10/2015
Slater & Gordon (SGH) Shine Corporate
Source: IRESS
Page 43
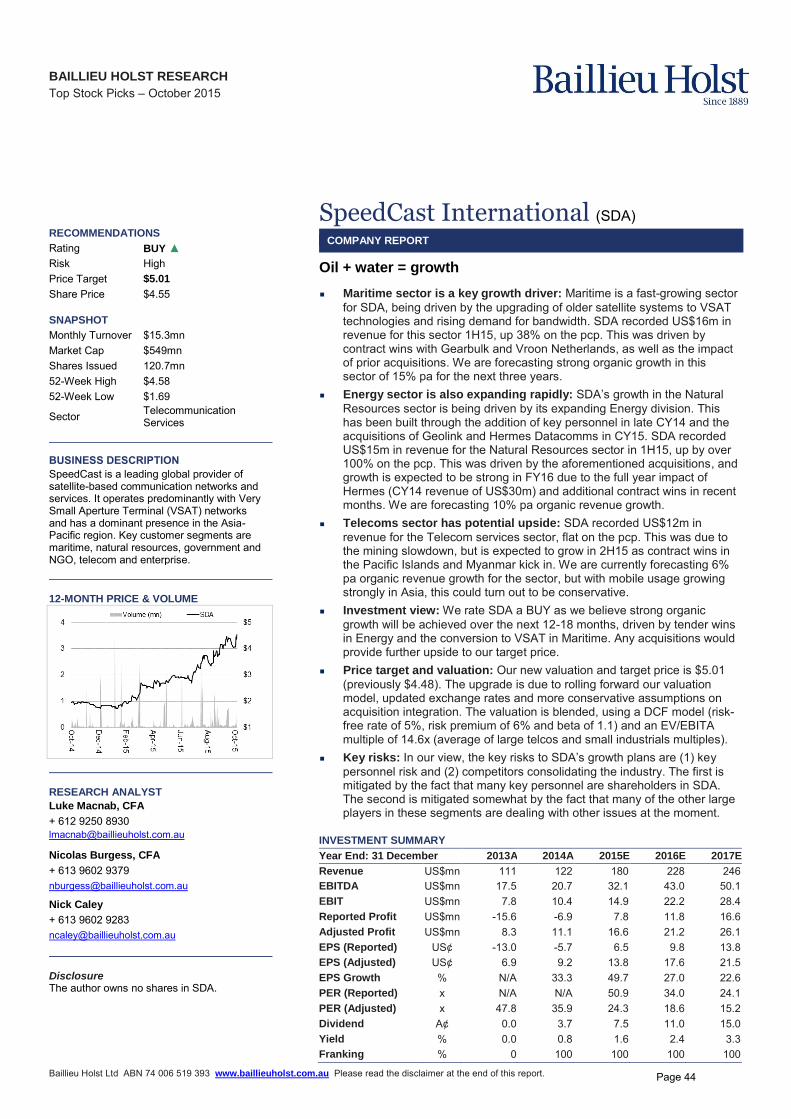
BAILLIEU HOLST RESEARCH
Top Stock Picks – October 2015
INTERNAL ONLY
Baillieu Holst Ltd ABN 74 006 519 393 www.baillieuholst.com.au Please read the disclaimer at the end of this report.
RECOMMENDATIONS
Rating BUY ▲
Risk High Price Target $5.01
Share Price $4.55 SNAPSHOT Monthly Turnover $15.3mn Market Cap $549mn Shares Issued 120.7mn 52-Week High $4.58 52-Week Low $1.69
Sector Telecommunication Services
BUSINESS DESCRIPTION
SpeedCast is a leading global provider of satellite-based communication networks and services. It operates predominantly with Very Small Aperture Terminal (VSAT) networks and has a dominant presence in the Asia-Pacific region. Key customer segments are maritime, natural resources, government and NGO, telecom and enterprise.
12-MONTH PRICE & VOLUME
RESEARCH ANALYST
Luke Macnab, CFA
+ 612 9250 8930 [email protected]
Nicolas Burgess, CFA
+ 613 9602 9379 [email protected]
Nick Caley
+ 613 9602 9283 [email protected] Disclosure The author owns no shares in SDA.
SpeedCast International (SDA)
COMPANY REPORT
Oil + water = growth
Maritime sector is a key growth driver: Maritime is a fast-growing sector for SDA, being driven by the upgrading of older satellite systems to VSAT technologies and rising demand for bandwidth. SDA recorded US$16m in revenue for this sector 1H15, up 38% on the pcp. This was driven by contract wins with Gearbulk and Vroon Netherlands, as well as the impact of prior acquisitions. We are forecasting strong organic growth in this sector of 15% pa for the next three years.
Energy sector is also expanding rapidly: SDA’s growth in the Natural
Resources sector is being driven by its expanding Energy division. This has been built through the addition of key personnel in late CY14 and the acquisitions of Geolink and Hermes Datacomms in CY15. SDA recorded US$15m in revenue for the Natural Resources sector in 1H15, up by over 100% on the pcp. This was driven by the aforementioned acquisitions, and growth is expected to be strong in FY16 due to the full year impact of Hermes (CY14 revenue of US$30m) and additional contract wins in recent months. We are forecasting 10% pa organic revenue growth.
Telecoms sector has potential upside: SDA recorded US$12m in revenue for the Telecom services sector, flat on the pcp. This was due to the mining slowdown, but is expected to grow in 2H15 as contract wins in the Pacific Islands and Myanmar kick in. We are currently forecasting 6% pa organic revenue growth for the sector, but with mobile usage growing strongly in Asia, this could turn out to be conservative.
Investment view: We rate SDA a BUY as we believe strong organic growth will be achieved over the next 12-18 months, driven by tender wins in Energy and the conversion to VSAT in Maritime. Any acquisitions would provide further upside to our target price.
Price target and valuation: Our new valuation and target price is $5.01 (previously $4.48). The upgrade is due to rolling forward our valuation model, updated exchange rates and more conservative assumptions on acquisition integration. The valuation is blended, using a DCF model (risk-free rate of 5%, risk premium of 6% and beta of 1.1) and an EV/EBITA multiple of 14.6x (average of large telcos and small industrials multiples).
Key risks: In our view, the key risks to SDA’s growth plans are (1) key personnel risk and (2) competitors consolidating the industry. The first is mitigated by the fact that many key personnel are shareholders in SDA. The second is mitigated somewhat by the fact that many of the other large players in these segments are dealing with other issues at the moment.
INVESTMENT SUMMARY
Year End: 31 December 2013A 2014A 2015E 2016E 2017E
Revenue US$mn 111 122 180 228 246 EBITDA US$mn 17.5 20.7 32.1 43.0 50.1 EBIT US$mn 7.8 10.4 14.9 22.2 28.4 Reported Profit US$mn -15.6 -6.9 7.8 11.8 16.6 Adjusted Profit US$mn 8.3 11.1 16.6 21.2 26.1 EPS (Reported) US¢ -13.0 -5.7 6.5 9.8 13.8 EPS (Adjusted) US¢ 6.9 9.2 13.8 17.6 21.5 EPS Growth % N/A 33.3 49.7 27.0 22.6 PER (Reported) x N/A N/A 50.9 34.0 24.1 PER (Adjusted) x 47.8 35.9 24.3 18.6 15.2 Dividend A¢ 0.0 3.7 7.5 11.0 15.0 Yield % 0.0 0.8 1.6 2.4 3.3 Franking % 0 100 100 100 100
Page 44
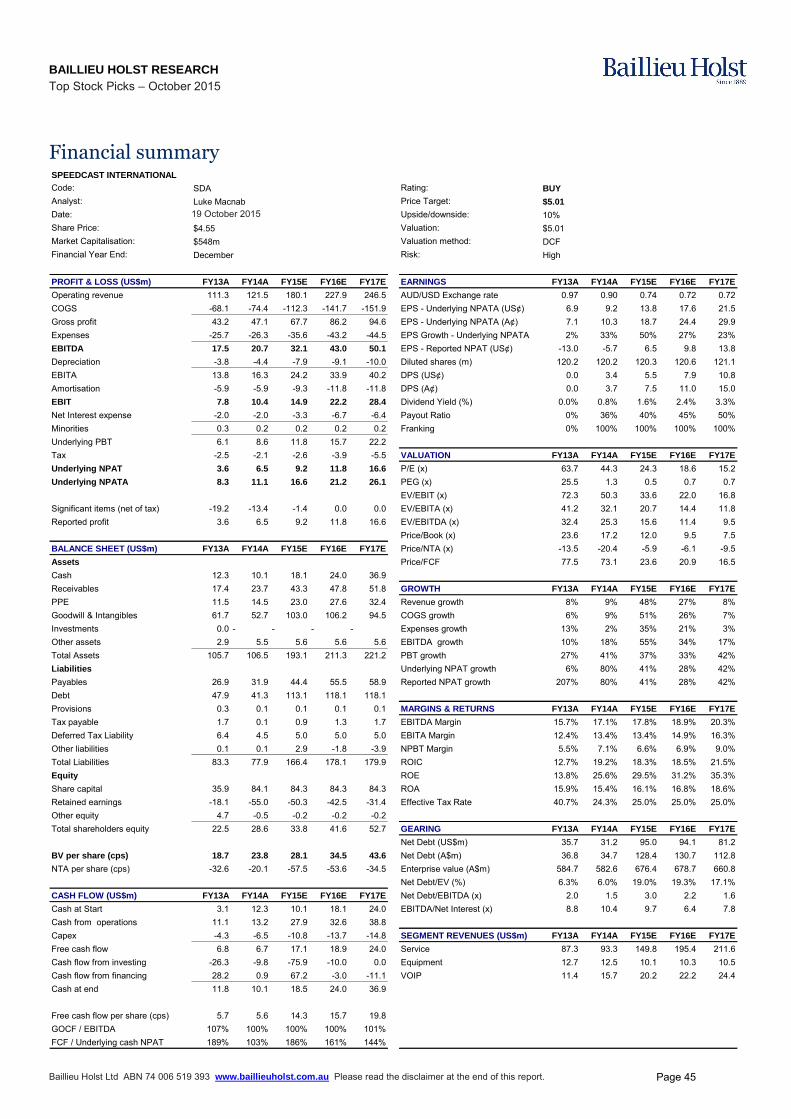
BAILLIEU HOLST RESEARCH
Top Stock Picks – October 2015
Baillieu Holst Ltd ABN 74 006 519 393 www.baillieuholst.com.au Please read the disclaimer at the end of this report.
Financial summary SPEEDCAST INTERNATIONAL
Code: Rating:Analyst: Price Target:Date: Upside/downside:Share Price: Valuation:Market Capitalisation: Valuation method:Financial Year End: Risk:
PROFIT & LOSS (US$m) FY13A FY14A FY15E FY16E FY17E EARNINGS FY13A FY14A FY15E FY16E FY17E
Operating revenue 111.3 121.5 180.1 227.9 246.5 AUD/USD Exchange rate 0.97 0.90 0.74 0.72 0.72COGS -68.1 -74.4 -112.3 -141.7 -151.9 EPS - Underlying NPATA (US¢) 6.9 9.2 13.8 17.6 21.5Gross profit 43.2 47.1 67.7 86.2 94.6 EPS - Underlying NPATA (A¢) 7.1 10.3 18.7 24.4 29.9Expenses -25.7 -26.3 -35.6 -43.2 -44.5 EPS Growth - Underlying NPATA 2% 33% 50% 27% 23%EBITDA 17.5 20.7 32.1 43.0 50.1 EPS - Reported NPAT (US¢) -13.0 -5.7 6.5 9.8 13.8Depreciation -3.8 -4.4 -7.9 -9.1 -10.0 Diluted shares (m) 120.2 120.2 120.3 120.6 121.1EBITA 13.8 16.3 24.2 33.9 40.2 DPS (US¢) 0.0 3.4 5.5 7.9 10.8Amortisation -5.9 -5.9 -9.3 -11.8 -11.8 DPS (A¢) 0.0 3.7 7.5 11.0 15.0EBIT 7.8 10.4 14.9 22.2 28.4 Dividend Yield (%) 0.0% 0.8% 1.6% 2.4% 3.3%Net Interest expense -2.0 -2.0 -3.3 -6.7 -6.4 Payout Ratio 0% 36% 40% 45% 50%Minorities 0.3 0.2 0.2 0.2 0.2 Franking 0% 100% 100% 100% 100%Underlying PBT 6.1 8.6 11.8 15.7 22.2Tax -2.5 -2.1 -2.6 -3.9 -5.5 VALUATION FY13A FY14A FY15E FY16E FY17E
Underlying NPAT 3.6 6.5 9.2 11.8 16.6 P/E (x) 63.7 44.3 24.3 18.6 15.2Underlying NPATA 8.3 11.1 16.6 21.2 26.1 PEG (x) 25.5 1.3 0.5 0.7 0.7
EV/EBIT (x) 72.3 50.3 33.6 22.0 16.8Significant items (net of tax) -19.2 -13.4 -1.4 0.0 0.0 EV/EBITA (x) 41.2 32.1 20.7 14.4 11.8Reported profit 3.6 6.5 9.2 11.8 16.6 EV/EBITDA (x) 32.4 25.3 15.6 11.4 9.5
Price/Book (x) 23.6 17.2 12.0 9.5 7.5BALANCE SHEET (US$m) FY13A FY14A FY15E FY16E FY17E Price/NTA (x) -13.5 -20.4 -5.9 -6.1 -9.5Assets Price/FCF 77.5 73.1 23.6 20.9 16.5Cash 12.3 10.1 18.1 24.0 36.9Receivables 17.4 23.7 43.3 47.8 51.8 GROWTH FY13A FY14A FY15E FY16E FY17E
PPE 11.5 14.5 23.0 27.6 32.4 Revenue growth 8% 9% 48% 27% 8%Goodwill & Intangibles 61.7 52.7 103.0 106.2 94.5 COGS growth 6% 9% 51% 26% 7%Investments 0.0 - - - - Expenses growth 13% 2% 35% 21% 3%Other assets 2.9 5.5 5.6 5.6 5.6 EBITDA growth 10% 18% 55% 34% 17%Total Assets 105.7 106.5 193.1 211.3 221.2 PBT growth 27% 41% 37% 33% 42%Liabilities Underlying NPAT growth 6% 80% 41% 28% 42%Payables 26.9 31.9 44.4 55.5 58.9 Reported NPAT growth 207% 80% 41% 28% 42%Debt 47.9 41.3 113.1 118.1 118.1Provisions 0.3 0.1 0.1 0.1 0.1 MARGINS & RETURNS FY13A FY14A FY15E FY16E FY17E
Tax payable 1.7 0.1 0.9 1.3 1.7 EBITDA Margin 15.7% 17.1% 17.8% 18.9% 20.3%Deferred Tax Liability 6.4 4.5 5.0 5.0 5.0 EBITA Margin 12.4% 13.4% 13.4% 14.9% 16.3%Other liabilities 0.1 0.1 2.9 -1.8 -3.9 NPBT Margin 5.5% 7.1% 6.6% 6.9% 9.0%Total Liabilities 83.3 77.9 166.4 178.1 179.9 ROIC 12.7% 19.2% 18.3% 18.5% 21.5%Equity ROE 13.8% 25.6% 29.5% 31.2% 35.3%Share capital 35.9 84.1 84.3 84.3 84.3 ROA 15.9% 15.4% 16.1% 16.8% 18.6%Retained earnings -18.1 -55.0 -50.3 -42.5 -31.4 Effective Tax Rate 40.7% 24.3% 25.0% 25.0% 25.0%Other equity 4.7 -0.5 -0.2 -0.2 -0.2Total shareholders equity 22.5 28.6 33.8 41.6 52.7 GEARING FY13A FY14A FY15E FY16E FY17E
Net Debt (US$m) 35.7 31.2 95.0 94.1 81.2BV per share (cps) 18.7 23.8 28.1 34.5 43.6 Net Debt (A$m) 36.8 34.7 128.4 130.7 112.8NTA per share (cps) -32.6 -20.1 -57.5 -53.6 -34.5 Enterprise value (A$m) 584.7 582.6 676.4 678.7 660.8
Net Debt/EV (%) 6.3% 6.0% 19.0% 19.3% 17.1%CASH FLOW (US$m) FY13A FY14A FY15E FY16E FY17E Net Debt/EBITDA (x) 2.0 1.5 3.0 2.2 1.6Cash at Start 3.1 12.3 10.1 18.1 24.0 EBITDA/Net Interest (x) 8.8 10.4 9.7 6.4 7.8Cash from operations 11.1 13.2 27.9 32.6 38.8Capex -4.3 -6.5 -10.8 -13.7 -14.8 SEGMENT REVENUES (US$m) FY13A FY14A FY15E FY16E FY17E
Free cash flow 6.8 6.7 17.1 18.9 24.0 Service 87.3 93.3 149.8 195.4 211.6Cash flow from investing -26.3 -9.8 -75.9 -10.0 0.0 Equipment 12.7 12.5 10.1 10.3 10.5Cash flow from financing 28.2 0.9 67.2 -3.0 -11.1 VOIP 11.4 15.7 20.2 22.2 24.4Cash at end 11.8 10.1 18.5 24.0 36.9
Free cash flow per share (cps) 5.7 5.6 14.3 15.7 19.8GOCF / EBITDA 107% 100% 100% 100% 101%FCF / Underlying cash NPAT 189% 103% 186% 161% 144%
$4.55 $5.01$548m DCFDecember High
SDA BUY
Luke Macnab $5.01
16 October, 2015 10%
19 October 2015
Page 45

BAILLIEU HOLST RESEARCH
Top Stock Picks – October 2015
Baillieu Holst Ltd ABN 74 006 519 393 www.baillieuholst.com.au Please read the disclaimer at the end of this report.
Strong growth expected in key sectors Maritime driven by upgrading to VSAT and increasing demand: Growth in Maritime is
being driven by the upgrading of older MSS-based systems to VSAT networks. This is because vessels’ IT systems require greater bandwidth to monitor and control, along with increasing data demands for crew welfare. VSAT services are usually more cost-effective as they offer a fixed bandwidth for a fixed price, rather than the pay-per-usage model typical of MSS networks. Growth in VSAT terminals and bandwidth demands are illustrated below.
FIG.1: MARITIME BANDWIDTH DEMAND FIG.2: ACTIVE MARITIME VSAT TERMINALS
Source: Euroconsult, “Maritime Telecom Solutions by
Satellite”, 3rd edition (2014)
Source: Source: Euroconsult, “Maritime Telecom Solutions
by Satellite”, 3rd edition (2014)
Natural resources driven by expanding Energy market share: Rising demand is again driven by an increasing bandwidth requirements for operational and recreational purposes. However, SDA’s growth will be driven primarily by increasing their share of the Energy market. There exists an opportunity for SDA to become the No.3 player in the market and two recent tender wins against strong competition demonstrate that it is competitive.
FIG.3: MINING VSAT UNITS FIG.4: ONSHORE ENERGY VSAT UNITS
Source: NSR, “Energy Markets via Satellite”, 4
th ed. (2014) Source: NSR, “Energy Markets via Satellite”, 4
th ed. (2014)
Telecom industry also has potential: Telecom industry research forecasts that the number of backhaul sites in Asia will grow by 5% pa to 2022 and backhaul bandwidth requirements will grow by 13% pa over the same period. This means that the revenue for satellite backhaul providers will grow from around US$200m to over US$400m between 2012 and 2022, a CAGR of around 7% pa, which we have used as our forecast growth rate.
FIG.5: MOBILE DATA TRAFFIC FIG.6: ASIAN SMARTPHONES PENETRATION
Source: Cisco, “Visual Networking Index: Forecast and
Methodology,2013–2018”, (2014)
Source: AC Nielsen, “The Asian Mobile Consumer
Decoded”, (2013)
Page 46
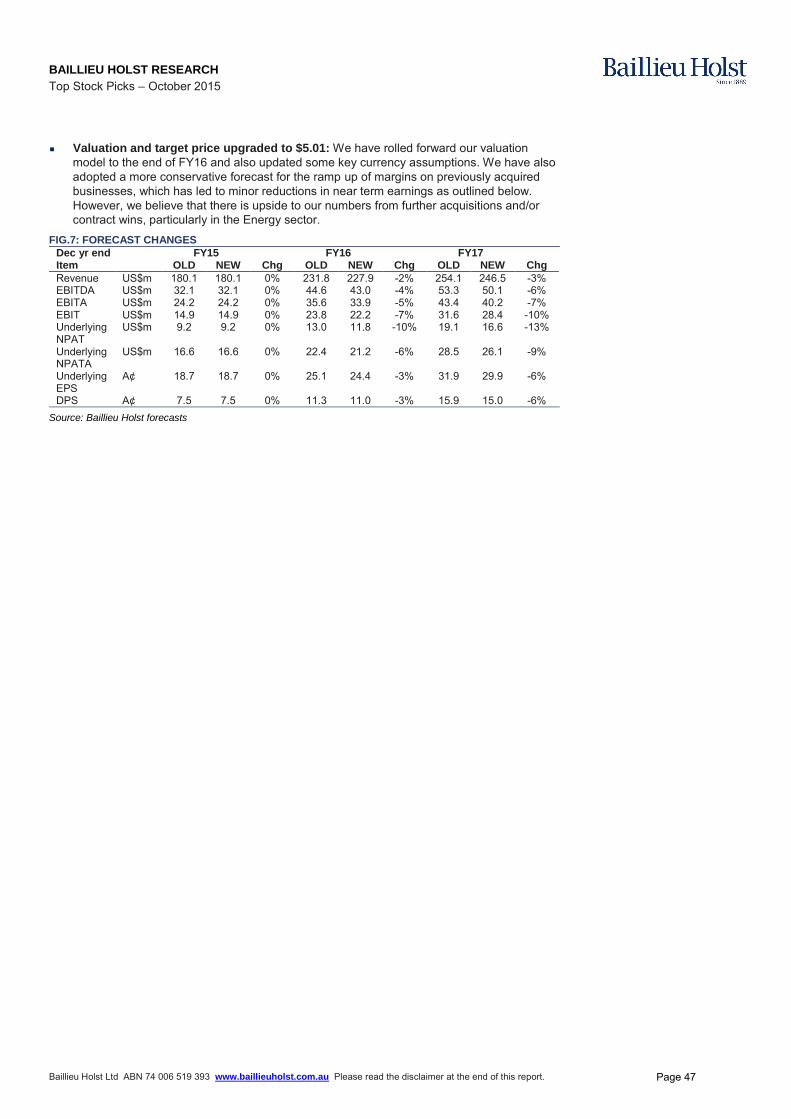
BAILLIEU HOLST RESEARCH
Top Stock Picks – October 2015
Baillieu Holst Ltd ABN 74 006 519 393 www.baillieuholst.com.au Please read the disclaimer at the end of this report.
Valuation and target price upgraded to $5.01: We have rolled forward our valuation model to the end of FY16 and also updated some key currency assumptions. We have also adopted a more conservative forecast for the ramp up of margins on previously acquired businesses, which has led to minor reductions in near term earnings as outlined below. However, we believe that there is upside to our numbers from further acquisitions and/or contract wins, particularly in the Energy sector.
FIG.7: FORECAST CHANGES Dec yr end FY15 FY16 FY17 Item OLD NEW Chg OLD NEW Chg OLD NEW Chg
Revenue US$m 180.1 180.1 0% 231.8 227.9 -2% 254.1 246.5 -3% EBITDA US$m 32.1 32.1 0% 44.6 43.0 -4% 53.3 50.1 -6% EBITA US$m 24.2 24.2 0% 35.6 33.9 -5% 43.4 40.2 -7% EBIT US$m 14.9 14.9 0% 23.8 22.2 -7% 31.6 28.4 -10% Underlying NPAT
US$m 9.2 9.2 0% 13.0 11.8 -10% 19.1 16.6 -13%
Underlying NPATA
US$m 16.6 16.6 0% 22.4 21.2 -6% 28.5 26.1 -9%
Underlying EPS
A¢ 18.7 18.7 0% 25.1 24.4 -3% 31.9 29.9 -6%
DPS A¢ 7.5 7.5 0% 11.3 11.0 -3% 15.9 15.0 -6%
Source: Baillieu Holst forecasts
Page 47
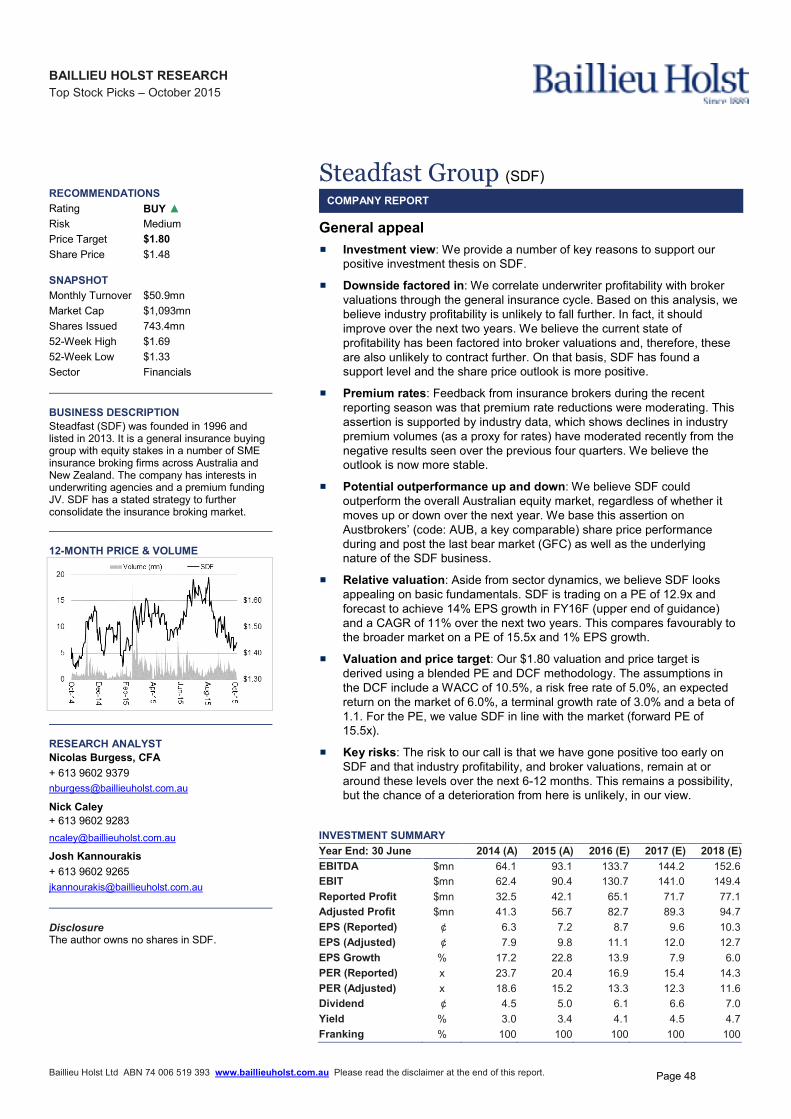
BAILLIEU HOLST RESEARCH
Top Stock Picks – October 2015
Baillieu Holst Ltd ABN 74 006 519 393 www.baillieuholst.com.au Please read the disclaimer at the end of this report.
RECOMMENDATIONS
Rating BUY ▲
Risk Medium
Price Target $1.80
Share Price $1.48
SNAPSHOT
Monthly Turnover $50.9mn
Market Cap $1,093mn
Shares Issued 743.4mn
52-Week High $1.69
52-Week Low $1.33
Sector Financials
BUSINESS DESCRIPTION
Steadfast (SDF) was founded in 1996 and listed in 2013. It is a general insurance buying group with equity stakes in a number of SME insurance broking firms across Australia and New Zealand. The company has interests in underwriting agencies and a premium funding JV. SDF has a stated strategy to further consolidate the insurance broking market.
12-MONTH PRICE & VOLUME
RESEARCH ANALYST
Nicolas Burgess, CFA
+ 613 9602 9379
Nick Caley
+ 613 9602 9283
Josh Kannourakis
+ 613 9602 9265
Disclosure The author owns no shares in SDF.
Steadfast Group (SDF)
COMPANY REPORT
General appeal
� Investment view: We provide a number of key reasons to support our positive investment thesis on SDF.
� Downside factored in: We correlate underwriter profitability with broker valuations through the general insurance cycle. Based on this analysis, we believe industry profitability is unlikely to fall further. In fact, it should improve over the next two years. We believe the current state of profitability has been factored into broker valuations and, therefore, these are also unlikely to contract further. On that basis, SDF has found a support level and the share price outlook is more positive.
� Premium rates: Feedback from insurance brokers during the recent reporting season was that premium rate reductions were moderating. This assertion is supported by industry data, which shows declines in industry premium volumes (as a proxy for rates) have moderated recently from the negative results seen over the previous four quarters. We believe the outlook is now more stable.
� Potential outperformance up and down: We believe SDF could outperform the overall Australian equity market, regardless of whether it moves up or down over the next year. We base this assertion on Austbrokers’ (code: AUB, a key comparable) share price performance during and post the last bear market (GFC) as well as the underlying nature of the SDF business.
� Relative valuation: Aside from sector dynamics, we believe SDF looks appealing on basic fundamentals. SDF is trading on a PE of 12.9x and forecast to achieve 14% EPS growth in FY16F (upper end of guidance) and a CAGR of 11% over the next two years. This compares favourably to the broader market on a PE of 15.5x and 1% EPS growth.
� Valuation and price target: Our $1.80 valuation and price target is derived using a blended PE and DCF methodology. The assumptions in the DCF include a WACC of 10.5%, a risk free rate of 5.0%, an expected return on the market of 6.0%, a terminal growth rate of 3.0% and a beta of 1.1. For the PE, we value SDF in line with the market (forward PE of 15.5x).
� Key risks: The risk to our call is that we have gone positive too early on SDF and that industry profitability, and broker valuations, remain at or around these levels over the next 6-12 months. This remains a possibility, but the chance of a deterioration from here is unlikely, in our view.
INVESTMENT SUMMARY
Year End: 30 June 2014 (A) 2015 (A) 2016 (E) 2017 (E) 2018 (E)
EBITDA $mn 64.1 93.1 133.7 144.2 152.6
EBIT $mn 62.4 90.4 130.7 141.0 149.4
Reported Profit $mn 32.5 42.1 65.1 71.7 77.1
Adjusted Profit $mn 41.3 56.7 82.7 89.3 94.7
EPS (Reported) ¢ 6.3 7.2 8.7 9.6 10.3
EPS (Adjusted) ¢ 7.9 9.8 11.1 12.0 12.7
EPS Growth % 17.2 22.8 13.9 7.9 6.0
PER (Reported) x 23.7 20.4 16.9 15.4 14.3
PER (Adjusted) x 18.6 15.2 13.3 12.3 11.6
Dividend ¢ 4.5 5.0 6.1 6.6 7.0
Yield % 3.0 3.4 4.1 4.5 4.7
Franking % 100 100 100 100 100
Page 48
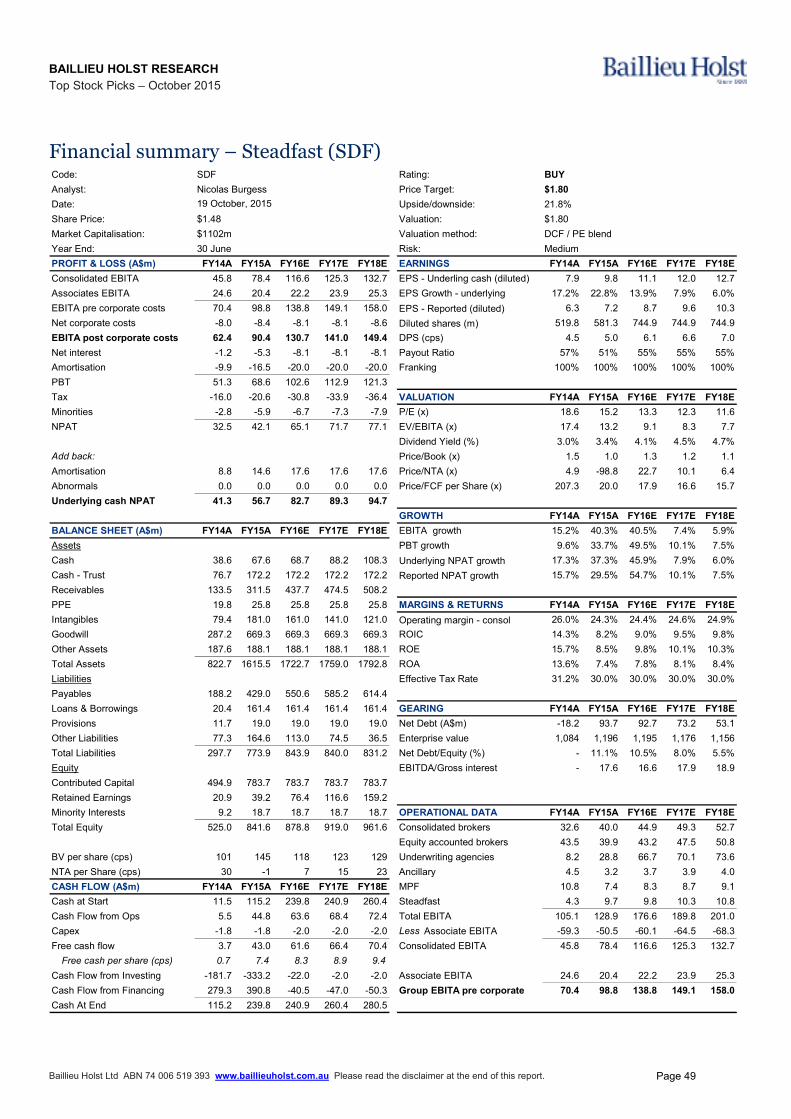
BAILLIEU HOLST RESEARCH
Top Stock Picks – October 2015
Baillieu Holst Ltd ABN 74 006 519 393 www.baillieuholst.com.au Please read the disclaimer at the end of this report.
Financial summary – Steadfast (SDF) Code: SDF Rating: BUY
Analyst: Nicolas Burgess Price Target: $1.80
Date: Upside/downside: 21.8%
Share Price: $1.48 Valuation: $1.80
Market Capitalisation: $1102m Valuation method: DCF / PE blend
Year End: 30 June Risk: Medium
PROFIT & LOSS (A$m) FY14A FY15A FY16E FY17E FY18E EARNINGS FY14A FY15A FY16E FY17E FY18E
Consolidated EBITA 45.8 78.4 116.6 125.3 132.7 EPS - Underling cash (diluted) 7.9 9.8 11.1 12.0 12.7
Associates EBITA 24.6 20.4 22.2 23.9 25.3 EPS Growth - underlying 17.2% 22.8% 13.9% 7.9% 6.0%
EBITA pre corporate costs 70.4 98.8 138.8 149.1 158.0 EPS - Reported (diluted) 6.3 7.2 8.7 9.6 10.3
Net corporate costs -8.0 -8.4 -8.1 -8.1 -8.6 Diluted shares (m) 519.8 581.3 744.9 744.9 744.9
EBITA post corporate costs 62.4 90.4 130.7 141.0 149.4 DPS (cps) 4.5 5.0 6.1 6.6 7.0
Net interest -1.2 -5.3 -8.1 -8.1 -8.1 Payout Ratio 57% 51% 55% 55% 55%
Amortisation -9.9 -16.5 -20.0 -20.0 -20.0 Franking 100% 100% 100% 100% 100%
PBT 51.3 68.6 102.6 112.9 121.3
Tax -16.0 -20.6 -30.8 -33.9 -36.4 VALUATION FY14A FY15A FY16E FY17E FY18E
Minorities -2.8 -5.9 -6.7 -7.3 -7.9 P/E (x) 18.6 15.2 13.3 12.3 11.6
NPAT 32.5 42.1 65.1 71.7 77.1 EV/EBITA (x) 17.4 13.2 9.1 8.3 7.7
Dividend Yield (%) 3.0% 3.4% 4.1% 4.5% 4.7%
Add back: Price/Book (x) 1.5 1.0 1.3 1.2 1.1
Amortisation 8.8 14.6 17.6 17.6 17.6 Price/NTA (x) 4.9 -98.8 22.7 10.1 6.4
Abnormals 0.0 0.0 0.0 0.0 0.0 Price/FCF per Share (x) 207.3 20.0 17.9 16.6 15.7
Underlying cash NPAT 41.3 56.7 82.7 89.3 94.7
GROWTH FY14A FY15A FY16E FY17E FY18E
BALANCE SHEET (A$m) FY14A FY15A FY16E FY17E FY18E EBITA growth 15.2% 40.3% 40.5% 7.4% 5.9%
Assets PBT growth 9.6% 33.7% 49.5% 10.1% 7.5%
Cash 38.6 67.6 68.7 88.2 108.3 Underlying NPAT growth 17.3% 37.3% 45.9% 7.9% 6.0%
Cash - Trust 76.7 172.2 172.2 172.2 172.2 Reported NPAT growth 15.7% 29.5% 54.7% 10.1% 7.5%
Receivables 133.5 311.5 437.7 474.5 508.2
PPE 19.8 25.8 25.8 25.8 25.8 MARGINS & RETURNS FY14A FY15A FY16E FY17E FY18E
Intangibles 79.4 181.0 161.0 141.0 121.0 Operating margin - consol 26.0% 24.3% 24.4% 24.6% 24.9%
Goodwill 287.2 669.3 669.3 669.3 669.3 ROIC 14.3% 8.2% 9.0% 9.5% 9.8%
Other Assets 187.6 188.1 188.1 188.1 188.1 ROE 15.7% 8.5% 9.8% 10.1% 10.3%
Total Assets 822.7 1615.5 1722.7 1759.0 1792.8 ROA 13.6% 7.4% 7.8% 8.1% 8.4%
Liabilities Effective Tax Rate 31.2% 30.0% 30.0% 30.0% 30.0%
Payables 188.2 429.0 550.6 585.2 614.4
Loans & Borrowings 20.4 161.4 161.4 161.4 161.4 GEARING FY14A FY15A FY16E FY17E FY18E
Provisions 11.7 19.0 19.0 19.0 19.0 Net Debt (A$m) -18.2 93.7 92.7 73.2 53.1
Other Liabilities 77.3 164.6 113.0 74.5 36.5 Enterprise value 1,084 1,196 1,195 1,176 1,156
Total Liabilities 297.7 773.9 843.9 840.0 831.2 Net Debt/Equity (%) - 11.1% 10.5% 8.0% 5.5%
Equity EBITDA/Gross interest - 17.6 16.6 17.9 18.9
Contributed Capital 494.9 783.7 783.7 783.7 783.7
Retained Earnings 20.9 39.2 76.4 116.6 159.2
Minority Interests 9.2 18.7 18.7 18.7 18.7 OPERATIONAL DATA FY14A FY15A FY16E FY17E FY18E
Total Equity 525.0 841.6 878.8 919.0 961.6 Consolidated brokers 32.6 40.0 44.9 49.3 52.7
Equity accounted brokers 43.5 39.9 43.2 47.5 50.8
BV per share (cps) 101 145 118 123 129 Underwriting agencies 8.2 28.8 66.7 70.1 73.6
NTA per Share (cps) 30 -1 7 15 23 Ancillary 4.5 3.2 3.7 3.9 4.0
CASH FLOW (A$m) FY14A FY15A FY16E FY17E FY18E MPF 10.8 7.4 8.3 8.7 9.1
Cash at Start 11.5 115.2 239.8 240.9 260.4 Steadfast 4.3 9.7 9.8 10.3 10.8
Cash Flow from Ops 5.5 44.8 63.6 68.4 72.4 Total EBITA 105.1 128.9 176.6 189.8 201.0
Capex -1.8 -1.8 -2.0 -2.0 -2.0 Less Associate EBITA -59.3 -50.5 -60.1 -64.5 -68.3
Free cash flow 3.7 43.0 61.6 66.4 70.4 Consolidated EBITA 45.8 78.4 116.6 125.3 132.7
Free cash per share (cps) 0.7 7.4 8.3 8.9 9.4
Cash Flow from Investing -181.7 -333.2 -22.0 -2.0 -2.0 Associate EBITA 24.6 20.4 22.2 23.9 25.3
Cash Flow from Financing 279.3 390.8 -40.5 -47.0 -50.3 Group EBITA pre corporate 70.4 98.8 138.8 149.1 158.0
Cash At End 115.2 239.8 240.9 260.4 280.5
19 October, 2015
Page 49
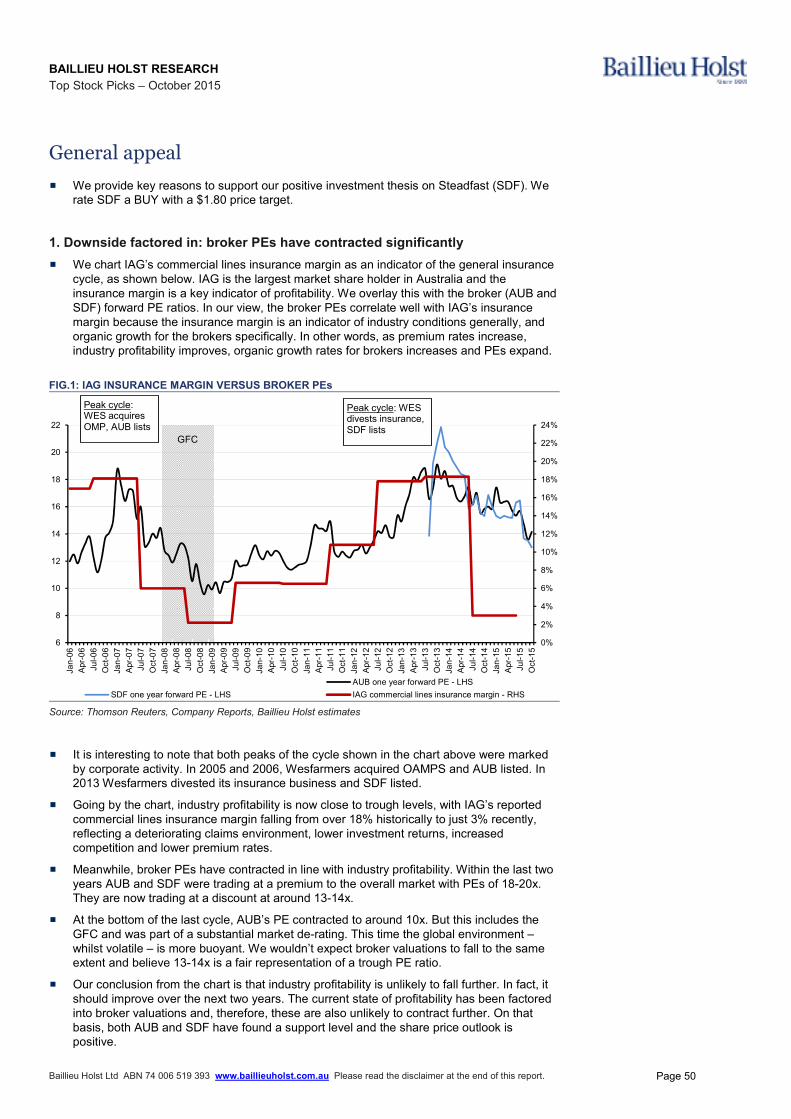
BAILLIEU HOLST RESEARCH
Top Stock Picks – October 2015
Baillieu Holst Ltd ABN 74 006 519 393 www.baillieuholst.com.au Please read the disclaimer at the end of this report.
General appeal
� We provide key reasons to support our positive investment thesis on Steadfast (SDF). We rate SDF a BUY with a $1.80 price target.
1. Downside factored in: broker PEs have contracted significantly
� We chart IAG’s commercial lines insurance margin as an indicator of the general insurance cycle, as shown below. IAG is the largest market share holder in Australia and the insurance margin is a key indicator of profitability. We overlay this with the broker (AUB and SDF) forward PE ratios. In our view, the broker PEs correlate well with IAG’s insurance margin because the insurance margin is an indicator of industry conditions generally, and organic growth for the brokers specifically. In other words, as premium rates increase, industry profitability improves, organic growth rates for brokers increases and PEs expand.
FIG.1: IAG INSURANCE MARGIN VERSUS BROKER PEs
0%
2%
4%
6%
8%
10%
12%
14%
16%
18%
20%
22%
24%
6
8
10
12
14
16
18
20
22
Jan-0
6
Apr-
06
Jul-06
Oct-
06
Jan-0
7
Apr-
07
Jul-07
Oct-
07
Jan-0
8
Apr-
08
Jul-08
Oct-
08
Jan-0
9
Apr-
09
Jul-09
Oct-
09
Jan-1
0
Apr-
10
Jul-10
Oct-
10
Jan-1
1
Apr-
11
Jul-11
Oct-
11
Jan-1
2
Apr-
12
Jul-12
Oct-
12
Jan-1
3
Apr-
13
Jul-13
Oct-
13
Jan-1
4
Apr-
14
Jul-14
Oct-
14
Jan-1
5
Apr-
15
Jul-15
Oct-
15
AUB one year forward PE - LHS
SDF one year forward PE - LHS IAG commercial lines insurance margin - RHS
GFC
Peak cycle: WES acquires OMP, AUB lists
Peak cycle: WES divests insurance, SDF lists
Source: Thomson Reuters, Company Reports, Baillieu Holst estimates
� It is interesting to note that both peaks of the cycle shown in the chart above were marked by corporate activity. In 2005 and 2006, Wesfarmers acquired OAMPS and AUB listed. In 2013 Wesfarmers divested its insurance business and SDF listed.
� Going by the chart, industry profitability is now close to trough levels, with IAG’s reported commercial lines insurance margin falling from over 18% historically to just 3% recently, reflecting a deteriorating claims environment, lower investment returns, increased competition and lower premium rates.
� Meanwhile, broker PEs have contracted in line with industry profitability. Within the last two years AUB and SDF were trading at a premium to the overall market with PEs of 18-20x. They are now trading at a discount at around 13-14x.
� At the bottom of the last cycle, AUB’s PE contracted to around 10x. But this includes the GFC and was part of a substantial market de-rating. This time the global environment – whilst volatile – is more buoyant. We wouldn’t expect broker valuations to fall to the same extent and believe 13-14x is a fair representation of a trough PE ratio.
� Our conclusion from the chart is that industry profitability is unlikely to fall further. In fact, it should improve over the next two years. The current state of profitability has been factored into broker valuations and, therefore, these are also unlikely to contract further. On that basis, both AUB and SDF have found a support level and the share price outlook is positive.
Page 50
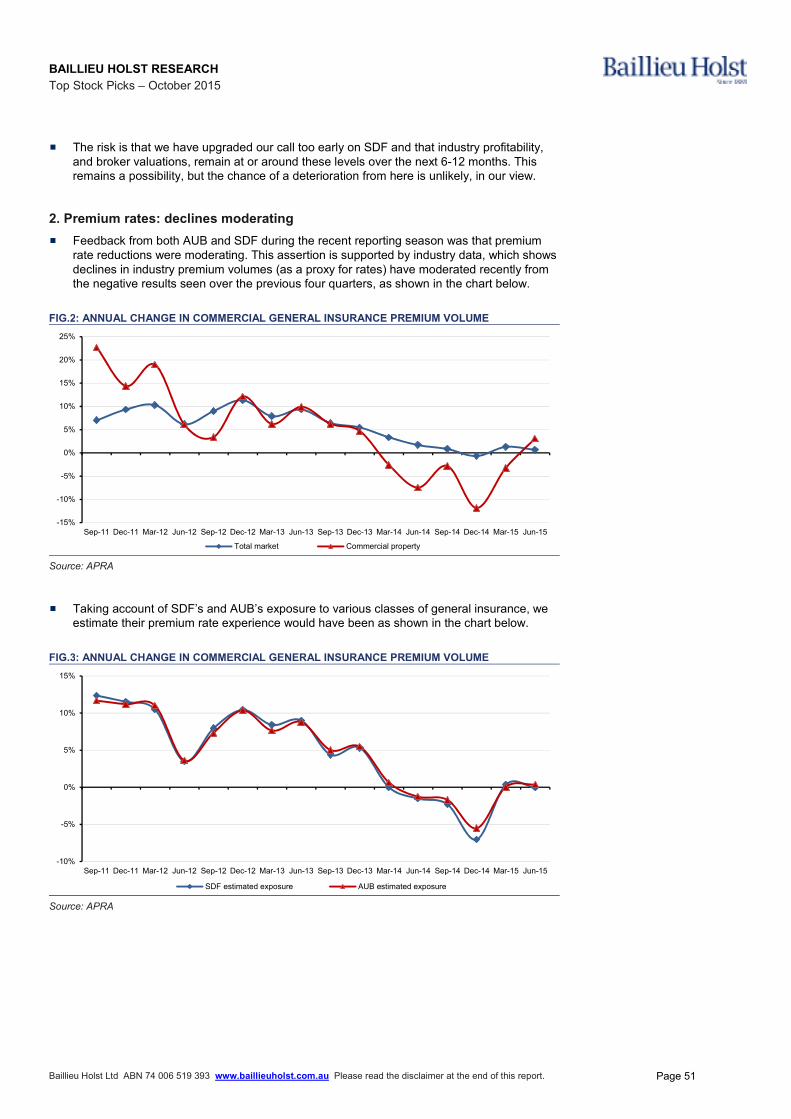
BAILLIEU HOLST RESEARCH
Top Stock Picks – October 2015
Baillieu Holst Ltd ABN 74 006 519 393 www.baillieuholst.com.au Please read the disclaimer at the end of this report.
� The risk is that we have upgraded our call too early on SDF and that industry profitability, and broker valuations, remain at or around these levels over the next 6-12 months. This remains a possibility, but the chance of a deterioration from here is unlikely, in our view.
2. Premium rates: declines moderating
� Feedback from both AUB and SDF during the recent reporting season was that premium rate reductions were moderating. This assertion is supported by industry data, which shows declines in industry premium volumes (as a proxy for rates) have moderated recently from the negative results seen over the previous four quarters, as shown in the chart below.
FIG.2: ANNUAL CHANGE IN COMMERCIAL GENERAL INSURANCE PREMIUM VOLUME
-15%
-10%
-5%
0%
5%
10%
15%
20%
25%
Sep-11 Dec-11 Mar-12 Jun-12 Sep-12 Dec-12 Mar-13 Jun-13 Sep-13 Dec-13 Mar-14 Jun-14 Sep-14 Dec-14 Mar-15 Jun-15
Total market Commercial property Source: APRA
� Taking account of SDF’s and AUB’s exposure to various classes of general insurance, we estimate their premium rate experience would have been as shown in the chart below.
FIG.3: ANNUAL CHANGE IN COMMERCIAL GENERAL INSURANCE PREMIUM VOLUME
-10%
-5%
0%
5%
10%
15%
Sep-11 Dec-11 Mar-12 Jun-12 Sep-12 Dec-12 Mar-13 Jun-13 Sep-13 Dec-13 Mar-14 Jun-14 Sep-14 Dec-14 Mar-15 Jun-15
SDF estimated exposure AUB estimated exposure Source: APRA
Page 51

This page has been left blank intentionally
Page 52

BAILLIEU HOLST RESEARCH
Top Stock Picks – October 2015 INTERNAL ONLY
Baillieu Holst Ltd ABN 74 006 519 393 www.baillieuholst.com.au Please read the disclaimer at the end of this report.
RECOMMENDATIONS
Rating BUY ▲
Risk Medium Price Target $2.10
Share Price $1.67 SNAPSHOT Monthly Turnover $7.1mn Market Cap $253mn Shares Issued 151.4mn 52-Week High $2.15 52-Week Low $1.03 Sector Consumer Discretionary BUSINESS DESCRIPTION
Vita Group Limited (VTG) is an Australian electronics and telecommunications retailer, comprising six brands: Fone Zone, One Zero, Next Byte, iConcierge, Vita Networks and Sprout Accessories along with selected Telstra Shops and Telstra Business Centres.
12-MONTH PRICE & VOLUME
RESEARCH ANALYST
Josh Kannourakis
+ 613 9602 9265 [email protected]
Nick Caley
+ 613 9602 9283 [email protected]
Nicolas Burgess, CFA
+ 613 9602 9379 [email protected] Disclosure The author owns no shares in VTG.
Vita Group (VTG)
COMPANY REPORT
Dialling growth and yield
Investment view: We upgraded to BUY post VTG’s strong FY15 result
and our increased confidence in its medium-term outlook. We expect VTG to deliver 13% EPS CAGR across FY15-FY18F and it is trading on an attractive FY16F PE of 11.9x, a ~20% discount to the broader market. Its dividend yield is also a key attribute, at 5.5% fully franked with upside risks through the resumption of special dividends with an aim of extracting its 30cps of franking credits. We are very confident about our FY16 earnings estimates which are largely driven by store acquisitions and continued momentum in VTG’s retail network optimisation program.
■ High confidence in FY16 growth: Our FY16 EPS growth forecast of 14% (EBITDA growth of 12%) is underpinned by confidence due to the expected impact from acquisitions during FY15 and in early FY16. Acquisitions during FY15 contributed to EBITDA of $4.1m (with an incremental $1m expected to flow through in FY16). We expect the FY16 acquisitions in the year to date to contribute ~$1.9m and see upside risk to this from additional acquisition opportunities.
Retail optimisation continues: Whilst VTG has reached its limit of 100 retail stores; we continue to expect strong earnings growth from this segment. A strategy to replace the bottom performing 20% of its network with higher performing stores could lead to a potential EBITDA uplift of $10m over the next three years, by our estimates.
Business segment to materialise: The business segment remains immature relative to the retail segment and we estimate Telstra Business Centres (TBCs) contributed ~$4m in EBITDA in FY15, corresponding to an average EBITDA per store of ~$0.3m. Mature TBCs are expected to reach $0.7m to $0.8m per store, and we believe this is achievable over the next three years. Therefore we see a potential $6.4m to $8m uplift from existing stores over the medium-term. The uplift from YTD acquired stores is ~$1.9m and there is a high likelihood of further TBC acquisitions in FY16.
Valuation and price target: Our blended valuation and price target is $2.10 ($2.05 DCF, $2.16 EV/EBITDA), using a blended EV/EBITDA (15% discount to market) and DCF methodology.
Key investment risks: The key risks to our investment thesis and price target include: 1) unfavourable changes to VTG’s Telstra Master Licence Agreement upon renewal; 2.) a material reduction in Telstra’s market share
driving lower foot traffic to Telstra stores; and 3) a greater shift to online sales of Telstra’s products detracting from foot traffic into its stores.
INVESTMENT SUMMARY
Year End: 30 June 2014 (A) 2015 (A) 2016 (E) 2017 (E) 2018 (E)
Revenue $mn 450 601 636 659 715 EBITDA $mn 27.0 39.2 43.9 47.7 53.1 EBIT $mn 16.2 27.4 31.7 35.0 39.7 Reported Profit $mn -4.6 25.4 23.4 23.6 26.9 Adjusted Profit $mn 10.3 18.1 21.3 23.6 26.9 EPS (Reported) ¢ -3.3 17.4 15.5 15.6 17.8 EPS (Adjusted) ¢ 7.2 12.4 14.1 15.6 17.8 EPS Growth % 66.0 71.5 13.6 10.8 14.1 PER (Reported) x N/A 9.6 10.8 10.7 9.4 PER (Adjusted) x 23.1 13.5 11.9 10.7 9.4 Dividend ¢ 4.6 8.0 9.2 10.1 11.6 Yield % 2.8 4.8 5.5 6.1 6.9 Franking % 100 100 100 100 100
Page 53
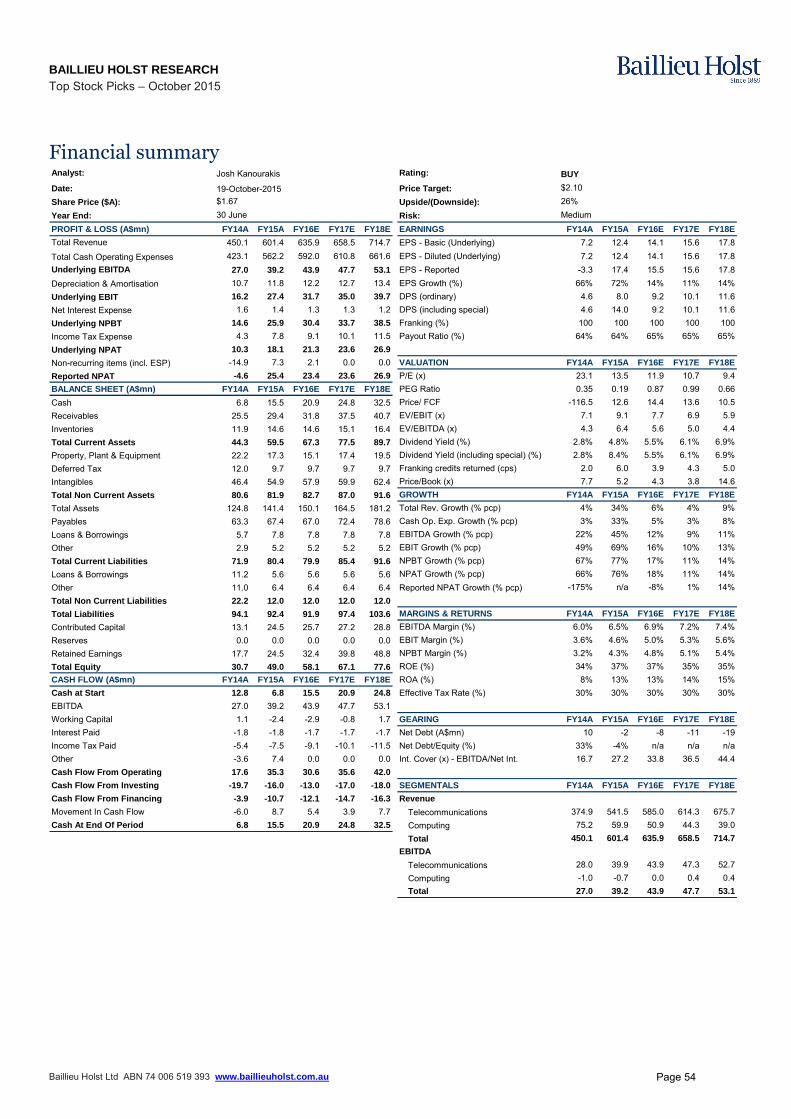
BAILLIEU HOLST RESEARCH
Top Stock Picks – October 2015
Baillieu Holst Ltd ABN 74 006 519 393 www.baillieuholst.com.au
Financial summary Analyst: Rating:
Date: Price Target:
Share Price ($A): Upside/(Downside):
Year End: Risk:
PROFIT & LOSS (A$mn) FY14A FY15A FY16E FY17E FY18E EARNINGS FY14A FY15A FY16E FY17E FY18E
Total Revenue 450.1 601.4 635.9 658.5 714.7 EPS - Basic (Underlying) 7.2 12.4 14.1 15.6 17.8
Total Cash Operating Expenses 423.1 562.2 592.0 610.8 661.6 EPS - Diluted (Underlying) 7.2 12.4 14.1 15.6 17.8Underlying EBITDA 27.0 39.2 43.9 47.7 53.1 EPS - Reported -3.3 17.4 15.5 15.6 17.8Depreciation & Amortisation 10.7 11.8 12.2 12.7 13.4 EPS Growth (%) 66% 72% 14% 11% 14%Underlying EBIT 16.2 27.4 31.7 35.0 39.7 DPS (ordinary) 4.6 8.0 9.2 10.1 11.6Net Interest Expense 1.6 1.4 1.3 1.3 1.2 DPS (including special) 4.6 14.0 9.2 10.1 11.6Underlying NPBT 14.6 25.9 30.4 33.7 38.5 Franking (%) 100 100 100 100 100Income Tax Expense 4.3 7.8 9.1 10.1 11.5 Payout Ratio (%) 64% 64% 65% 65% 65%Underlying NPAT 10.3 18.1 21.3 23.6 26.9
Non-recurring items (incl. ESP) -14.9 7.3 2.1 0.0 0.0 VALUATION FY14A FY15A FY16E FY17E FY18E
Reported NPAT -4.6 25.4 23.4 23.6 26.9 P/E (x) 23.1 13.5 11.9 10.7 9.4BALANCE SHEET (A$mn) FY14A FY15A FY16E FY17E FY18E PEG Ratio 0.35 0.19 0.87 0.99 0.66Cash 6.8 15.5 20.9 24.8 32.5 Price/ FCF -116.5 12.6 14.4 13.6 10.5Receivables 25.5 29.4 31.8 37.5 40.7 EV/EBIT (x) 7.1 9.1 7.7 6.9 5.9Inventories 11.9 14.6 14.6 15.1 16.4 EV/EBITDA (x) 4.3 6.4 5.6 5.0 4.4Total Current Assets 44.3 59.5 67.3 77.5 89.7 Dividend Yield (%) 2.8% 4.8% 5.5% 6.1% 6.9%Property, Plant & Equipment 22.2 17.3 15.1 17.4 19.5 Dividend Yield (including special) (%) 2.8% 8.4% 5.5% 6.1% 6.9%Deferred Tax 12.0 9.7 9.7 9.7 9.7 Franking credits returned (cps) 2.0 6.0 3.9 4.3 5.0Intangibles 46.4 54.9 57.9 59.9 62.4 Price/Book (x) 7.7 5.2 4.3 3.8 14.6Total Non Current Assets 80.6 81.9 82.7 87.0 91.6 GROWTH FY14A FY15A FY16E FY17E FY18E
Total Assets 124.8 141.4 150.1 164.5 181.2 Total Rev. Growth (% pcp) 4% 34% 6% 4% 9%Payables 63.3 67.4 67.0 72.4 78.6 Cash Op. Exp. Growth (% pcp) 3% 33% 5% 3% 8%Loans & Borrowings 5.7 7.8 7.8 7.8 7.8 EBITDA Growth (% pcp) 22% 45% 12% 9% 11%Other 2.9 5.2 5.2 5.2 5.2 EBIT Growth (% pcp) 49% 69% 16% 10% 13%Total Current Liabilities 71.9 80.4 79.9 85.4 91.6 NPBT Growth (% pcp) 67% 77% 17% 11% 14%Loans & Borrowings 11.2 5.6 5.6 5.6 5.6 NPAT Growth (% pcp) 66% 76% 18% 11% 14%Other 11.0 6.4 6.4 6.4 6.4 Reported NPAT Growth (% pcp) -175% n/a -8% 1% 14%Total Non Current Liabilities 22.2 12.0 12.0 12.0 12.0
Total Liabilities 94.1 92.4 91.9 97.4 103.6 MARGINS & RETURNS FY14A FY15A FY16E FY17E FY18E
Contributed Capital 13.1 24.5 25.7 27.2 28.8 EBITDA Margin (%) 6.0% 6.5% 6.9% 7.2% 7.4%Reserves 0.0 0.0 0.0 0.0 0.0 EBIT Margin (%) 3.6% 4.6% 5.0% 5.3% 5.6%Retained Earnings 17.7 24.5 32.4 39.8 48.8 NPBT Margin (%) 3.2% 4.3% 4.8% 5.1% 5.4%Total Equity 30.7 49.0 58.1 67.1 77.6 ROE (%) 34% 37% 37% 35% 35%CASH FLOW (A$mn) FY14A FY15A FY16E FY17E FY18E ROA (%) 8% 13% 13% 14% 15%Cash at Start 12.8 6.8 15.5 20.9 24.8 Effective Tax Rate (%) 30% 30% 30% 30% 30%EBITDA 27.0 39.2 43.9 47.7 53.1Working Capital 1.1 -2.4 -2.9 -0.8 1.7 GEARING FY14A FY15A FY16E FY17E FY18E
Interest Paid -1.8 -1.8 -1.7 -1.7 -1.7 Net Debt (A$mn) 10 -2 -8 -11 -19Income Tax Paid -5.4 -7.5 -9.1 -10.1 -11.5 Net Debt/Equity (%) 33% -4% n/a n/a n/aOther -3.6 7.4 0.0 0.0 0.0 Int. Cover (x) - EBITDA/Net Int. 16.7 27.2 33.8 36.5 44.4Cash Flow From Operating 17.6 35.3 30.6 35.6 42.0
Cash Flow From Investing -19.7 -16.0 -13.0 -17.0 -18.0 SEGMENTALS FY14A FY15A FY16E FY17E FY18E
Cash Flow From Financing -3.9 -10.7 -12.1 -14.7 -16.3 Revenue
Movement In Cash Flow -6.0 8.7 5.4 3.9 7.7 Telecommunications 374.9 541.5 585.0 614.3 675.7Cash At End Of Period 6.8 15.5 20.9 24.8 32.5 Computing 75.2 59.9 50.9 44.3 39.0
Total 450.1 601.4 635.9 658.5 714.7
EBITDA
Telecommunications 28.0 39.9 43.9 47.3 52.7Computing -1.0 -0.7 0.0 0.4 0.4Total 27.0 39.2 43.9 47.7 53.1
30 June Medium
$2.10$1.67 26%19-October-2015
Josh Kanourakis BUY
Page 54
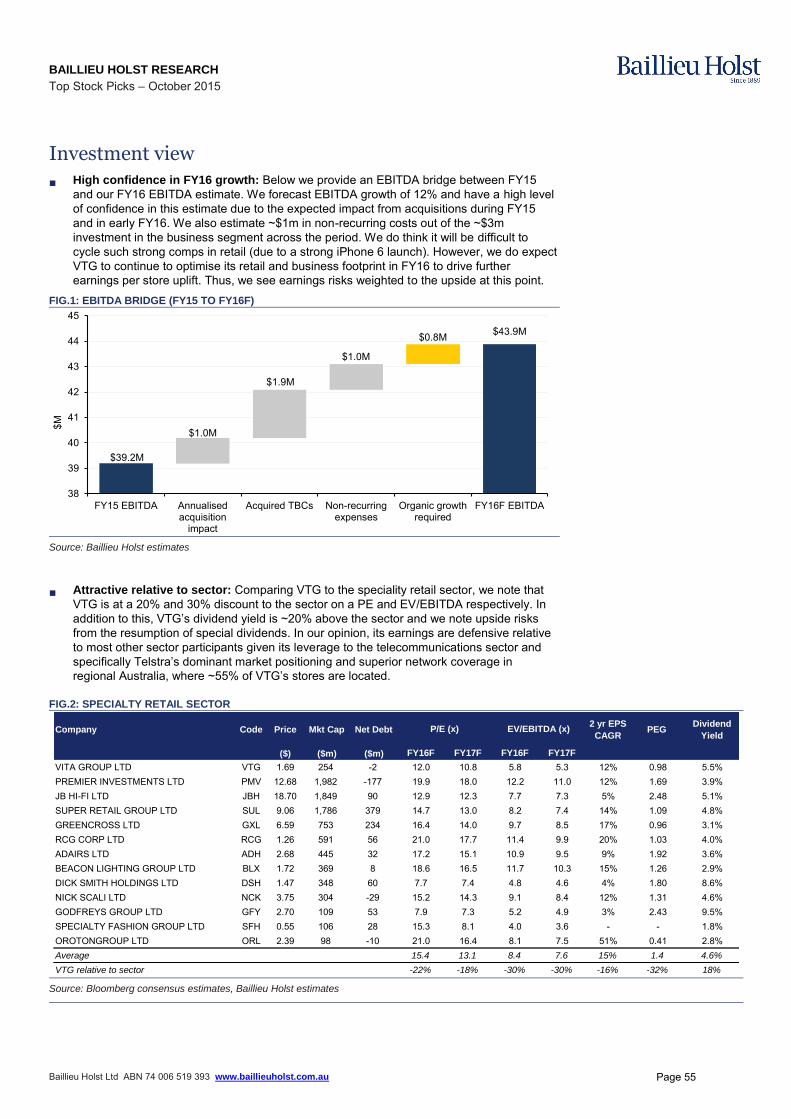
BAILLIEU HOLST RESEARCH
Top Stock Picks – October 2015
Baillieu Holst Ltd ABN 74 006 519 393 www.baillieuholst.com.au
Investment view
■ High confidence in FY16 growth: Below we provide an EBITDA bridge between FY15 and our FY16 EBITDA estimate. We forecast EBITDA growth of 12% and have a high level of confidence in this estimate due to the expected impact from acquisitions during FY15 and in early FY16. We also estimate ~$1m in non-recurring costs out of the ~$3m investment in the business segment across the period. We do think it will be difficult to cycle such strong comps in retail (due to a strong iPhone 6 launch). However, we do expect VTG to continue to optimise its retail and business footprint in FY16 to drive further earnings per store uplift. Thus, we see earnings risks weighted to the upside at this point.
FIG.1: EBITDA BRIDGE (FY15 TO FY16F)
$39.2M
$43.9M
$1.0M
$1.9M
$1.0M
$0.8M
38
39
40
41
42
43
44
45
FY15 EBITDA Annualisedacquisition
impact
Acquired TBCs Non-recurringexpenses
Organic growthrequired
FY16F EBITDA
$M
Source: Baillieu Holst estimates
■ Attractive relative to sector: Comparing VTG to the speciality retail sector, we note that VTG is at a 20% and 30% discount to the sector on a PE and EV/EBITDA respectively. In addition to this, VTG’s dividend yield is ~20% above the sector and we note upside risks
from the resumption of special dividends. In our opinion, its earnings are defensive relative to most other sector participants given its leverage to the telecommunications sector and specifically Telstra’s dominant market positioning and superior network coverage in
regional Australia, where ~55% of VTG’s stores are located.
FIG.2: SPECIALTY RETAIL SECTOR
Company Code Price Mkt Cap Net Debt2 yr EPS
CAGRPEG
Dividend
Yield
($) ($m) ($m) FY16F FY17F FY16F FY17F
VITA GROUP LTD VTG 1.69 254 -2 12.0 10.8 5.8 5.3 12% 0.98 5.5%PREMIER INVESTMENTS LTD PMV 12.68 1,982 -177 19.9 18.0 12.2 11.0 12% 1.69 3.9%JB HI-FI LTD JBH 18.70 1,849 90 12.9 12.3 7.7 7.3 5% 2.48 5.1%SUPER RETAIL GROUP LTD SUL 9.06 1,786 379 14.7 13.0 8.2 7.4 14% 1.09 4.8%GREENCROSS LTD GXL 6.59 753 234 16.4 14.0 9.7 8.5 17% 0.96 3.1%RCG CORP LTD RCG 1.26 591 56 21.0 17.7 11.4 9.9 20% 1.03 4.0%ADAIRS LTD ADH 2.68 445 32 17.2 15.1 10.9 9.5 9% 1.92 3.6%BEACON LIGHTING GROUP LTD BLX 1.72 369 8 18.6 16.5 11.7 10.3 15% 1.26 2.9%DICK SMITH HOLDINGS LTD DSH 1.47 348 60 7.7 7.4 4.8 4.6 4% 1.80 8.6%NICK SCALI LTD NCK 3.75 304 -29 15.2 14.3 9.1 8.4 12% 1.31 4.6%GODFREYS GROUP LTD GFY 2.70 109 53 7.9 7.3 5.2 4.9 3% 2.43 9.5%SPECIALTY FASHION GROUP LTD SFH 0.55 106 28 15.3 8.1 4.0 3.6 - - 1.8%OROTONGROUP LTD ORL 2.39 98 -10 21.0 16.4 8.1 7.5 51% 0.41 2.8%Average 15.4 13.1 8.4 7.6 15% 1.4 4.6%
VTG relative to sector -22% -18% -30% -30% -16% -32% 18%
P/E (x) EV/EBITDA (x)
Source: Bloomberg consensus estimates, Baillieu Holst estimates
Page 55
BAILLIEU HOLST RESEARCH Top Stock Picks – October 2015
Baillieu Holst Ltd ABN 74 006 519 393 www.baillieuholst.com.au Please read the disclaimer at the end of this report.
RESEARCH ANALYST Piers Flanagan)
+ 613 9602 9127v. Co. (AUI) [email protected]
Josh Kannourakis
+ 613 9602 9265Australian [email protected]
Baillieu Holst Ltd acted as sub-underwriter for PGF and in a corporate advisory role for FGX and earned fees in relation to those activities in the past 12 months.
Listed Investment Companies (LICs) SECTOR REPORT
LIC update – top picks
Top picks: Our top picks refer to preferred exposures within each sector based on numerous quantitative and qualitative factors. However, they should not be treated as official stock recommendations but merely as a guide to where we would apportion funds at this particular point in time.
Large capitalisation: The performance of a number of our traditional large cap LICs continue to move broadly in-line with the market and this has resulted in the recent premium to Net Tangible Assets (NTA) trading trend, holding true. While the trading premiums of a number of the traditional large cap LICs have decreased significantly from the highs seen in August, we do note that LICs such as Australian Foundation Investment Company (AFI) and Argo Investments (ARG) continue to trade at elevated premiums to NTA. Milton Corporation (MLT) with ~35% of its portfolio invested in banks is currently trading at an estimated 1.4% premium to NTA with a 4.3% fully franked (FF) dividend yield; Milton offers investors an attractive entry point relative to its three month and one year historical (premium/discount) trading levels (5.5 % and 2.7% premium to NTA respectively). Our top value pick within the large cap space is Diversified United Investments (DUI). On a relative basis, DUI currently trades at a discount to its peers as well as a discount to its underlying NTA. DUI is currently trading at an estimated 1.4% discount to NTA with a 4.0% dividend yield (FF).
Small capitalisation: Future Generation Fund (FGX) remains our top pick within this space. We continue to look favourably upon the unique proposition FGX offers investors looking for exposure to domestic small cap equities. The current 4.1% discount to NTA of FGX provides investors an attractive entry point to invest with a number of Australia’s top Fund Managers. We are also positively predisposed to Perpetual Equity Investment (PIC), now that management has reached its full deployment threshold. PIC utilises a concentrated, mid-cap investment strategy, with the option for an international allocation (currently 23% of the portfolio). PIC is currently trading at an estimated 4.7% discount to NTA.
International: PM Capital Global Opportunities Fund (PGF) remains a preferred exposure within the international space; we continue to look favourably upon PGF’s investment themes, in particular, its current holdings within the global brewery industry (~9.5% of the overall portfolio). Magellan Flagship Fund (MFF) is also a preferred exposure within the international space. MFF employs a high conviction strategy predominately investing in blue-chip American corporations (i.e. Visa, MasterCard, Bank of America). PGF and MFF are currently trading at an estimated 13.4% and 9.4% discount to NTA respectively. We have increased our international coverage list with the inclusion of Ellerston Asia Investment (EAI), Future Generation Global Investment (FGG) and Platinum Asia Investments (PAI), all of which commenced trading on the ASX in September.
Specialty: Acorn Capital Investment Fund (ACQ) commenced its share buy-back on 24 September 2015 and since then has seen a marked decrease in its discount to NTA from ~23.0% to our current estimate of 19.2%. The positive capital management initiative to address the discount of ACQ’s share price to NTA has stabilised the share price with ACQ up 4.1% since 24 September. In our view we continue to see upside to ACQ’s portfolio positioning within the micro-cap sector as well a number of its unlisted holdings (i.e. Carbon Revolution).
Please refer to the table overleaf for an update on current dividend yields, September NTAs and our current NTA estimates for selected LICs ahead of the upcoming NTA releases for October.
Page 56
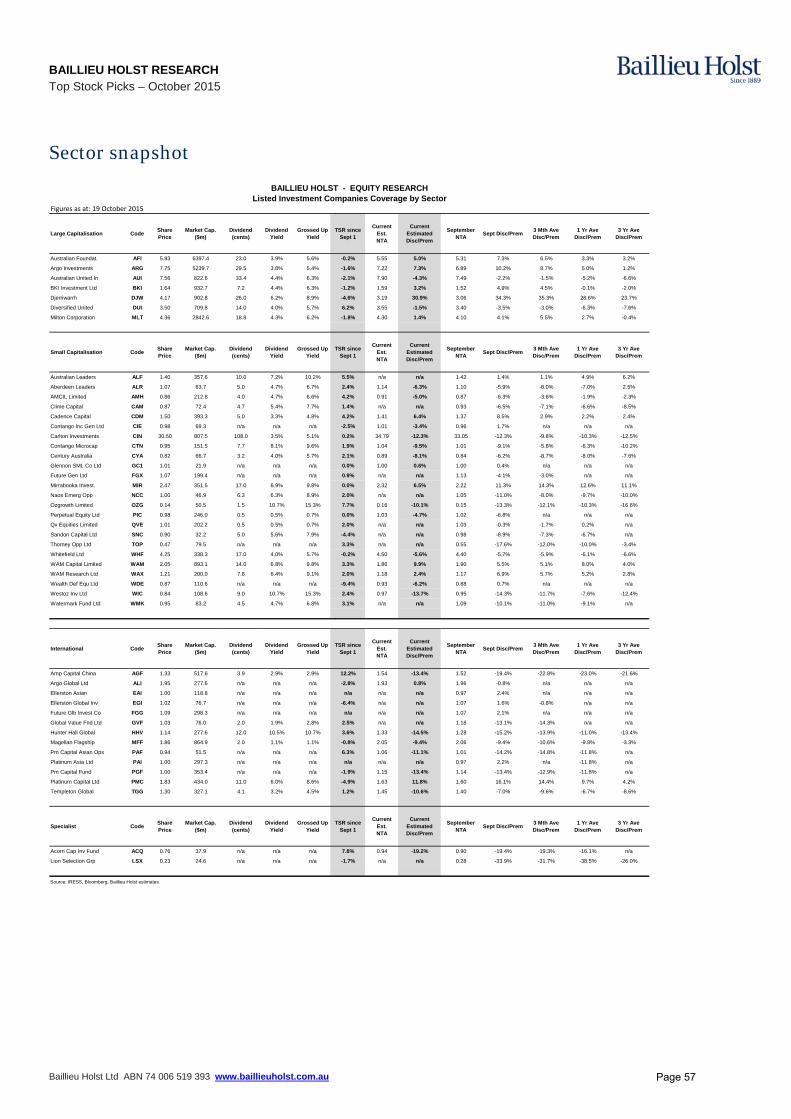
BAILLIEU HOLST RESEARCH Top Stock Picks – October 2015
Baillieu Holst Ltd ABN 74 006 519 393 www.baillieuholst.com.au
Sector snapshot
Figures as at: 19 October 2015
Large Capitalisation CodeShare Price
Market Cap. ($m)
Dividend (cents)
Dividend Yield
Grossed Up Yield
TSR since Sept 1
Current Est.NTA
Current Estimated Disc/Prem
September NTA
Sept Disc/Prem3 Mth Ave Disc/Prem
1 Yr Ave Disc/Prem
3 Yr AveDisc/Prem
Australian Foundat. AFI 5.83 6397.4 23.0 3.9% 5.6% -0.2% 5.55 5.0% 5.31 7.3% 6.5% 3.3% 3.2%
Argo Investments ARG 7.75 5239.7 29.5 3.8% 5.4% -1.6% 7.22 7.3% 6.89 10.2% 8.7% 5.0% 1.2%
Australian United In AUI 7.56 822.6 33.4 4.4% 6.3% -2.1% 7.90 -4.3% 7.49 -2.2% -1.5% -5.2% -6.6%
BKI Investment Ltd BKI 1.64 932.7 7.2 4.4% 6.3% -1.2% 1.59 3.2% 1.52 4.9% 4.5% -0.1% -2.0%
Djerriwarrh DJW 4.17 902.8 26.0 6.2% 8.9% -4.6% 3.19 30.9% 3.06 34.3% 35.3% 28.6% 23.7%
Diversified United DUI 3.50 709.8 14.0 4.0% 5.7% 6.2% 3.55 -1.5% 3.40 -3.5% -3.0% -6.3% -7.6%
Milton Corporation MLT 4.36 2842.6 18.8 4.3% 6.2% -1.8% 4.30 1.4% 4.10 4.1% 5.5% 2.7% -0.4%
Small Capitalisation CodeShare Price
Market Cap. ($m)
Dividend (cents)
Dividend Yield
Grossed Up Yield
TSR since Sept 1
Current Est.NTA
Current Estimated Disc/Prem
September NTA
Sept Disc/Prem3 Mth Ave Disc/Prem
1 Yr Ave Disc/Prem
3 Yr AveDisc/Prem
Australian Leaders ALF 1.40 357.6 10.0 7.2% 10.2% 5.5% n/a n/a 1.42 1.4% 1.1% 4.9% 6.2%
Aberdeen Leaders ALR 1.07 63.7 5.0 4.7% 6.7% 2.4% 1.14 -6.3% 1.10 -5.9% -8.0% -7.0% 2.5%
AMCIL Limited AMH 0.86 212.8 4.0 4.7% 6.6% 4.2% 0.91 -5.0% 0.87 -6.3% -3.6% -1.9% -2.3%
Clime Capital CAM 0.87 72.4 4.7 5.4% 7.7% 1.4% n/a n/a 0.93 -6.5% -7.1% -6.6% -8.5%
Cadence Capital CDM 1.50 393.3 5.0 3.3% 4.8% 4.2% 1.41 6.4% 1.37 8.5% 2.9% 2.2% 2.4%
Contango Inc Gen Ltd CIE 0.98 69.3 n/a n/a n/a -2.5% 1.01 -3.4% 0.96 1.7% n/a n/a n/a
Carlton Investments CIN 30.50 807.5 108.0 3.5% 5.1% 0.2% 34.79 -12.3% 33.05 -12.3% -9.8% -10.3% -12.5%
Contango Microcap CTN 0.95 151.5 7.7 8.1% 9.6% 1.9% 1.04 -9.5% 1.01 -9.1% -5.8% -6.3% -10.2%
Century Australia CYA 0.82 66.7 3.2 4.0% 5.7% 2.1% 0.89 -8.1% 0.84 -6.2% -8.7% -8.0% -7.6%
Glennon SML Co Ltd GC1 1.01 21.9 n/a n/a n/a 0.0% 1.00 0.6% 1.00 0.4% n/a n/a n/a
Future Gen Ltd FGX 1.07 199.4 n/a n/a n/a 0.9% n/a n/a 1.13 -4.1% -3.0% n/a n/a
Mirrabooka Invest. MIR 2.47 351.5 17.0 6.9% 9.8% 0.0% 2.32 6.5% 2.22 11.3% 14.3% 12.6% 11.1%
Naos Emerg Opp NCC 1.00 46.9 6.3 6.3% 8.9% 2.0% n/a n/a 1.05 -11.0% -8.0% -9.7% -10.0%
Ozgrowth Limited OZG 0.14 50.5 1.5 10.7% 15.3% 7.7% 0.16 -10.1% 0.15 -13.3% -12.1% -10.3% -16.6%
Perpetual Equity Ltd PIC 0.98 246.0 0.5 0.5% 0.7% 0.0% 1.03 -4.7% 1.02 -6.8% n/a n/a n/a
Qv Equities Limited QVE 1.01 202.2 0.5 0.5% 0.7% 2.0% n/a n/a 1.03 -0.3% -1.7% 0.2% n/a
Sandon Capital Ltd SNC 0.90 32.2 5.0 5.6% 7.9% -4.4% n/a n/a 0.98 -8.9% -7.3% -6.7% n/a
Thorney Opp Ltd TOP 0.47 79.5 n/a n/a n/a 3.3% n/a n/a 0.55 -17.6% -12.0% -10.0% -3.4%
Whitefield Ltd WHF 4.25 338.3 17.0 4.0% 5.7% -0.2% 4.50 -5.6% 4.40 -5.7% -5.9% -6.1% -6.6%
WAM Capital Limited WAM 2.05 893.1 14.0 6.8% 9.8% 3.3% 1.86 9.9% 1.90 5.5% 5.1% 8.0% 4.0%
WAM Research Ltd WAX 1.21 200.0 7.8 6.4% 9.1% 2.0% 1.18 2.4% 1.17 6.9% 5.7% 5.2% 2.8%
Wealth Def Equ Ltd WDE 0.87 110.6 n/a n/a n/a -9.4% 0.93 -6.2% 0.88 0.7% n/a n/a n/a
Westoz Inv Ltd WIC 0.84 108.6 9.0 10.7% 15.3% 2.4% 0.97 -13.7% 0.95 -14.3% -11.7% -7.6% -12.4%
Watermark Fund Ltd WMK 0.95 83.2 4.5 4.7% 6.8% 3.1% n/a n/a 1.09 -10.1% -11.0% -9.1% n/a
International CodeShare Price
Market Cap. ($m)
Dividend (cents)
Dividend Yield
Grossed Up Yield
TSR since Sept 1
Current Est.NTA
Current Estimated Disc/Prem
September NTA
Sept Disc/Prem3 Mth Ave Disc/Prem
1 Yr Ave Disc/Prem
3 Yr AveDisc/Prem
Amp Capital China AGF 1.33 517.6 3.9 2.9% 2.9% 12.2% 1.54 -13.4% 1.52 -19.4% -22.8% -23.0% -21.6%
Argo Global Ltd ALI 1.95 277.6 n/a n/a n/a -2.8% 1.93 0.8% 1.96 -0.8% n/a n/a n/a
Ellerston Asian EAI 1.00 118.8 n/a n/a n/a n/a n/a n/a 0.97 2.4% n/a n/a n/a
Ellerston Global Inv EGI 1.02 76.7 n/a n/a n/a -6.4% n/a n/a 1.07 1.6% -0.8% n/a n/a
Future Glb Invest Co FGG 1.09 298.3 n/a n/a n/a n/a n/a n/a 1.07 2.1% n/a n/a n/a
Global Value Fnd Ltd GVF 1.03 76.0 2.0 1.9% 2.8% 2.5% n/a n/a 1.18 -13.1% -14.3% n/a n/a
Hunter Hall Global HHV 1.14 277.6 12.0 10.5% 10.7% 3.6% 1.33 -14.5% 1.28 -15.2% -13.9% -11.0% -13.4%
Magellan Flagship MFF 1.86 864.9 2.0 1.1% 1.1% -0.8% 2.05 -9.4% 2.06 -9.4% -10.6% -9.8% -3.3%
Pm Capital Asian Ops PAF 0.94 51.5 n/a n/a n/a 6.3% 1.06 -11.1% 1.01 -14.2% -14.8% -11.8% n/a
Platinum Asia Ltd PAI 1.00 297.3 n/a n/a n/a n/a n/a n/a 0.97 2.2% n/a -11.8% n/a
Pm Capital Fund PGF 1.00 353.4 n/a n/a n/a -1.9% 1.15 -13.4% 1.14 -13.4% -12.9% -11.8% n/a
Platinum Capital Ltd PMC 1.83 434.0 11.0 6.0% 8.6% -4.9% 1.63 11.8% 1.60 16.1% 14.4% 9.7% 4.2%
Templeton Global TGG 1.30 327.1 4.1 3.2% 4.5% 1.2% 1.45 -10.6% 1.40 -7.0% -9.6% -6.7% -8.6%
Specialist CodeShare Price
Market Cap. ($m)
Dividend (cents)
Dividend Yield
Grossed Up Yield
TSR since Sept 1
Current Est.NTA
Current Estimated Disc/Prem
September NTA
Sept Disc/Prem3 Mth Ave Disc/Prem
1 Yr Ave Disc/Prem
3 Yr AveDisc/Prem
Acorn Cap Inv Fund ACQ 0.76 37.9 n/a n/a n/a 7.8% 0.94 -19.2% 0.90 -19.4% -19.3% -16.1% n/a
Lion Selection Grp LSX 0.23 24.6 n/a n/a n/a -1.7% n/a n/a 0.28 -33.9% -31.7% -38.5% -26.0%
Source: IRESS, Bloomberg, Baillieu Holst estimates
BAILLIEU HOLST - EQUITY RESEARCHListed Investment Companies Coverage by Sector
Page 57

BAILLIEU HOLST RESEARCH
Top Stock Picks – October 2015
Baillieu Holst Ltd ABN 74 006 519 393 www.baillieuholst.com.au
Baillieu Holst Research Team Nicolas Burgess, CFA Nick Caley Josh Kannourakis Luke Macnab, CFA
Head of Research Research Analyst – Industrials Research Analyst – Industrials Research Analyst – Industrials
Nicolas joined Baillieu Holst in September 2012. He has been an equity analyst since 2003, when he started with ABN AMRO in the insurance sector. In 2005 he joined the Small and Mid Cap team, covering a wide variety of industrial stocks, and later led that team to Top 3 ratings in client surveys (East Coles, Peter Lee) between 2007-2009. Nicolas then spent a period in London as the European Diversified Financials Analyst for RBS Equities from 2010 to 2012. Nicolas holds a Bachelor of Economics from the University of Sydney and is a CFA® charterholder.
Nick joined Baillieu Holst in December 2011. He has been an equity analyst since 1996, prior to which he had a sixteen year career with Westpac Banking Corporation. Nick was Head of Insurance and Gaming Research for ABN AMRO between 1996-2008. Between 2008 and joining Baillieu Holst in 2011, Nick was Chairman of Greyhound Racing Victoria and Director of Greyhounds Australasia.
Josh joined Baillieu Holst in October 2009 and has been an equity analyst since 2012. He has a Bachelor of Commerce (Double Major in Accounting and Finance) from the University of Melbourne.
Luke joined Baillieu Holst in March 2015 and has been an equity analyst since 1999. Luke previously was at ABN AMRO/RBS and covered the Infrastructure and Utilities sectors between 2004-2011; there he achieved consistent Top 3 rankings in client surveys (Peter Lee, East Coles/BRW) over that time. Prior to that, Luke was an Associate Director and Analyst at Macquarie Bank (1999-2003) and a Credit Analyst at ANZ Investment Bank (1997-1999). Luke holds a Bachelor of Economics and a Bachelor of Laws from the University of Sydney, and is a CFA® charterholder.
Years in the market: 13
Sectors: Software Services, Wealth Management, Insurance Services, Diversified Industrials
Years in the market: 19
Sectors: Gaming & Leisure, Consumer Finance, Banks, Professional Services, Online, Diversified Industrials
Years in the market: 6
Sectors: Consumer Discretionary & Staples, Agriculture, Mining Services, Technology, Industrials, Listed Investment Companies
Years in the market: 16
Sectors: Infrastructure, Utilities, Telecommunications, Diversified Industrials
Page 58
BAILLIEU HOLST RESEARCH
Top Stock Picks – October 2015
Baillieu Holst Ltd ABN 74 006 519 393 www.baillieuholst.com.au
Warren Edney Mathan Somasundaram Piers Flanagan Research Analyst – Resources Analyst – Equity Strategy,Quant Associate Analyst
Warren joined Baillieu Holst in April 2015. Previously he was Director of Equities (Commodity Strategy) at RBS, with global responsibility for Iron Ore, Coal and Uranium. In the period 1998-2010, he was Director Australia Equities at RBS / ABN AMRO, analysing companies ranging from BHP and Rio Tinto to Kingsgate and Newcrest, during that time he received awards from Starmine as most accurate analyst and best stock picker. From 1991-1998, Warren was an investment analyst and portfolio manager at Colonial Investment Management. Warren holds a Bachelor of Applied Science (Applied Geology) from RMIT and a Master of Science (Earth Science – Modern Volcanics) from Monash University. Warren is a Graduate of the Australian Institute of Company Directors.
Mathan joined Baillieu Holst in April 2012 and has been a macro equity analyst since 1996. He was previously a Director of Macro Research (Strategy, Quantitative and Data) at CitiBank between 1996-2007, followed by two years as Head of Global Equity Products at LIM (Global IT firm based in Austin, Texas, US) from 2007 to 2009. Mathan was also Head of Quantitative and Data in Macro Research at Bell Potter between 2009-2012. Mathan holds a Bachelor of Electrical Engineering from the University of Sydney University and an Executive MBA from the Australian Graduate School of Management (University of NSW).
Piers joined Baillieu Holst in January 2014 and has been a research associate since November 2014. Prior to this he worked at Avestra Capital. Piers is currently completing his final year of a Bachelor of Business degree (Double Major in Banking and Finance) from Monash University.
Years in the market: 30
Sectors: Base Metals, Gold & Precious Metals, Coal, Oil & Gas, Bulk Commodities.
Years in the market: 19
Sectors: Mathan produces a range of research across Equity Strategy, Economics, Quantitative Analytics and Asset Allocation.
Years in the market: 1
Sectors: Listed Investment Companies.
Page 59
BAILLIEU HOLST RESEARCH
Baillieu Holst Ltd ABN 74 006 519 393 www.baillieuholst.com.au
This document has been prepared and issued by:
Baillieu Holst Ltd
ABN 74 006 519 393 Australian Financial Service Licence No. 245421 Participant of ASX Group Participant of NSX Ltd
Analysts’ stock ratings are defined as follows:
Buy: The stock’s total return is expected to increase by at least 10-15 percent from the current share price over the next 12 months.
Hold: The stock’s total return is expected to trade within a range of ±10-15 percent from the current share price over the next 12 months.
Sell: The stock’s total return is expected to decrease by at least 10-15 percent from the current share price over the next 12 months.
Disclosure of potential interest and disclaimer: Baillieu Holst Ltd (Baillieu Holst) and/or its associates may receive commissions, calculated at normal client rates, from transactions involving securities of the companies mentioned herein and may hold interests in securities of the companies mentioned herein from time to time. Your adviser will earn a commission of up to 55% of any brokerage resulting from any transactions you may undertake as a result of this advice. When we provide advice to you, it is based on the information you have provided to us about your personal circumstances, financial objectives and needs. If you wish to rely on our advice, it is important that you inform us of any changes to your personal investment needs, objectives and financial circumstances. If you do not provide us with the relevant information (including updated information) regarding your investment needs, objectives and financial circumstances, our advice may be based on inaccurate information, and you will need to consider whether the advice is suitable to you given your personal investment needs, objectives and financial circumstances. Please do not hesitate to contact our offices if you need to update your information held with us. Please be assured that we keep your information strictly confidential. No representation, warranty or undertaking is given or made in relation to the accuracy of information contained in this advice, such advice being based solely on public information which has not been verified by Baillieu Holst Ltd. Save for any statutory liability that cannot be excluded, Baillieu Holst Ltd and its employees and agents shall not be liable (whether in negligence or otherwise) for any error or inaccuracy in, or omission from, this advice or any resulting loss suffered by the recipient or any other person. Past performance should not be taken as an indication or guarantee of future performance, and no representation or warranty, express or implied, is made regarding future performance. Information, opinions and estimates contained in this report reflect a judgment at its original date of publication and are subject to change without notice. The price, value of and income from any of the securities or financial instruments mentioned in this report can fall as well as rise. The value of securities and financial instruments is subject to exchange rate fluctuation that may have a positive or adverse effect on the price or income of such securities or financial instruments. Baillieu Holst Ltd assumes no obligation to update this advice or correct any inaccuracy which may become apparent after it is given.
Baillieu Holst Ltd
ABN 74 006 519 393 Australian Financial Service Licence No. 245421 Participant of ASX Group Participant of NSX Ltd www.baillieuholst.com.au
Melbourne (Head Office)
Address Level 26, 360 Collins Street Melbourne, VIC 3000 Australia
Postal PO Box 48, Collins Street West Melbourne, VIC 8007 Australia Phone +61 3 9602 9222
Facsimile +61 3 9602 2350
Email [email protected]
Bendigo Office
Address Cnr Bridge & Baxter Streets Bendigo, VIC 3550 Australia Postal PO Box 40 North Bendigo, VIC 3550 Australia Phone +61 3 5443 7966 Facsimile +61 3 5442 4728 Email [email protected] Geelong Office
Address 16 Aberdeen Street Geelong West Vic 3218 Postal PO Box 364 Geelong Vic 3220 Australia Phone +61 3 5229 4637 Facsimile +61 3 4229 4142 Email [email protected] Newcastle Office
Address Level 1, 120 Darby Street Cooks Hill, NSW 2300 Australia Postal PO Box 111 The Junction, NSW 2291 Australia Phone +61 2 4925 2330
Facsimile +61 2 4929 1954
Email [email protected] Perth Office
Address Level 10, 191 St Georges Terrace Perth WA 6000 Australia Postal PO Box 7662, Cloisters Square Perth, WA 6850 Australia Phone +61 8 6141 9450 Facsimile +61 8 6141 9499 Email [email protected] Sydney Office
Address Level 18, 1 Alfred Street Sydney, NSW 2000 Australia Postal PO Box R1797 Royal Exchange, NSW 1225 Australia Phone +61 2 9250 8900 Facsimile +61 2 9247 4092 Email [email protected]
Page 60