australian farm business management journal 2017, volume ... · increasing greenhouse gas (ghg)...
TRANSCRIPT

Economics of No-till Farming in the Eyre Peninsula Dzoma
AFBM Journal, 2017, Volume 14, Paper 2 Page 12
Australian Farm Business Management Journal 2017, Volume 14, Paper 2
ISSN: 1449-7875 --------------------------------------------------------------------------------------------------------------------------
An Economic Analysis of No-till Farming on the Upper Eyre Peninsula SA: A Case Study1
Bernard B. Dzomaa
a South Australian Research and Development Institute, Livestock and Farming Systems Division, Minnipa Agricultural Centre., South Australia -------------------------------------------------------------------------------------------------------------------------- Abstract Reduced soil disturbance through farming methods such as no-till and reduced tillage is seen as a key practice change that can lead to greater profitability and sustainability in Australian cropping regions. Grain growers in low rainfall farming systems of the Eyre Peninsula, South Australia are not only interested in reaping private economic benefits, but also in generating public benefits that arise from adopting environmentally friendly farming practices. Hence, the adoption of no-till farming has been steadily increasing over the past decade. The aim of this case study was to compare no-till systems against conventional tillage systems, using physical and socio-economic data collected from a grain cropping farm located on the upper Eyre Peninsula over a five year period. Results for this case study showed that no-till can be profitable with a higher average gross margin ($339/ha/year) than conventional tillage ($321/ha/year). As well there are additional public benefits like soil erosion mitigation, improved air quality, soil moisture retention and an increase in soil biodiversity. Adding these benefits into the analysis gave a Benefit Cost Ratio of 1.14 and a positive Net Present Value of $220/ha for no-till over conventional tillage over five years. This indicates that the perceived benefits (private, public and environmental) of adopting no-till farming are greater than the associated costs and hence profitable and sustainable in the long run. Key words: No-till, conventional tillage, Cost Benefit Analysis, Eyre Peninsula Introduction Increasing greenhouse gas (GHG) emissions have become a growing concern for Australia and the global economy as a whole. These increases are being cited for contributing to increasing temperatures, erratic rainfall, rising sea levels and adverse geographical changes which are affecting grain cropping regions (Janssen and Harer, 2010). The Eyre Peninsula (EP) is one of South Australia’s (SA) most productive cropping regions but the prospect of a drying, warming climate coupled with decreasing soil fertility is cause for concern within this region. This has led to an emphasis on conservation cropping in its various guises of minimum tillage, reduced tillage, direct drilling, no-till and zero-till which has increased throughout the cropping zones of South Eastern Australia over the 1 The author would like to thank the growers, Bruce Heddle and Scott Forrest for their valuable time and providing the data. I am grateful for the helpful comments and contributions from Dr Garry Griffith which greatly improved the quality of this paper.

Economics of No-till Farming in the Eyre Peninsula Dzoma
AFBM Journal, 2017, Volume 14, Paper 2 Page 13
last two decades (Lewis et al., 2006). The dual aim has been on improving the profitability and sustainability of farming enterprises, while mitigating or sequestering GHG emissions. Emissions or sequestration of greenhouse gases in soils are determined directly by both soil properties and external factors acting on soils. Hence, changes in soil moisture, structure, organic matter content, cation exchange capacity, and pH brought about by tillage practice, soil management or climate may affect fundamentally both emissions and sequestration of greenhouse gases (Ugalde et al., 2007). Tillage, which is the ploughing of land to prepare for seeding and weed and pest control, has long been part of the grain cropping enterprise. Tillage is one of the management variables that may enhance or retard emissions of greenhouse gases from agriculture, and may help maintain or improve the productive base under the conditions of climate change. No-till (NT) can be defined as tillage practices including sowing techniques using either zero-till with disc machines, knifepoints, super-seeder, or inverted equipment, provided that there is no prior cultivation (D’Emden and Llewellyn, 2009). Grain growers on the upper EP are adopting NT mainly to improve soil fertility, soil conservation and moisture retention, however the benefits of NT are numerous and include: carbon sequestration; reduced soil erosion; improved soil structure, water holding capacity and soil biodiversity; better yields; and seeding accuracy. Research commissioned by the SA No-Till Farmers Association (SANTFA) in 2003 found that the regions with the highest proportion of growers who have used NT were on the Lower and Upper EP, and in the mid-North (D’Emden and Llewellyn, 2003). A survey of 73 Lower EP land managers (Truscott, 1997) reflected what continues to occur in the mixed farming systems zone of Southern Australia: 70 % had changed stubble handling in the last five years by purchasing and altering machinery and burning less; and 30 % had reduced cultivation by three or more workings, 36 % by two workings and 48 % by one working. The uptake of NT farming is an ongoing process and 42 % of respondents in a survey in SA (D’Emden and Llewellyn, 2006) were reported to have used NT for a proportion of their cropping, but only 24 % of SA adopters used NT on all of their cropping land in 2003. In another survey (D’Emden and Llewellyn, 2009), 71 % of respondents had used NT prior to 2004, and 84 % were using NT in 2008 on the upper EP. As with any other agricultural practice, there is still a proportion of growers that are sceptical about the real benefits of NT farming. Most growers, however, believe that herbicide costs, herbicide resistance, and glyphosate resistance in particular, would be higher under long-term use of NT with stubble retention. Within this context, the purpose of this analysis was to evaluate NT farming as a climate change adaptation and mitigation practice change, and to compare NT against conventional tillage (CT) using gross margins and cost benefit analysis (CBA) of five years of data collected from a farm located on the Upper EP, SA. Methods The case study farm is a cropping property owned by Bruce and Kathryn Heddle and is located in a low rainfall region just 1km from Minnipa on the Upper EP, SA. The farm has a total area of 1750 hectares (ha) arable land and it is predominately used for cropping on a wheat/canola – wheat/annual medic rotation. Soils are variable with sandy clay loams, calcareous grey loams and sandy loams, with smaller areas of sand and shallow red soils with limestone. The Heddles adopted a one-pass crop establishment using knife points and closer plates in 1994, and currently have around half of their farm under NT farming. The rest of the farm is under conventional and reduced tillage with minor adjustments to suit the varying seasons. A gross margin analysis was done to assess the farm’s profitability on canola and wheat, using the 2015 Farm Gross Margin Guide (Rural Solutions, PIRSA, 2015). The broader economic analyses used

Economics of No-till Farming in the Eyre Peninsula Dzoma
AFBM Journal, 2017, Volume 14, Paper 2 Page 14
CBA to determine whether there are any merits or demerits of adopting NT farming as a sustainable farming practice (i.e. “With NT” scenario) or continuing with the conventional tillage (i.e. “Without NT” scenario). The CBA was undertaken over a five-year period (2011 – 2015) and private and public benefits were factored in to determine, for each scenario, the Benefit Cost Ratio (BCR), which is the ratio of discounted benefits and discounted costs, and Net Present Value (NPV), which is obtained by subtracting the present value of costs from the present value of benefits. For these analyses, the decision rule was that NT can only be concluded as better than CT if the NPV is greater than zero, or the BCR is greater than 1. Results and Discussion Yield and gross margin analysis Yield results for this wheat-canola rotation farming system indicate that wheat yield was better under NT over the five-year study period, while the canola yields were not affected by tillage practices. Wheat yield over the five-year period averaged 2.42 t/ha and 2.34 t/ha under NT and CT respectively (Figure 1 and Appendix 1). The results also show that in drier years, i.e. 2012 in this sample, relatively better yields can be obtained from wheat under NT, and the opposite can be said for canola which performed better in a drier year under CT. This can be attributed to the fact that canola is a deep-rooted crop that has the ability to utilise sub-soil moisture when moisture becomes limiting.
Figure 1: Annual rainfall (mm) and no-till vs. conventional yield (t/ha) over a 5-year period
Wheat and canola were weighted equally in the whole-farm gross margin analysis for the two tillage practices over the five-year period (Appendix 1 and 2). This analysis indicated that NT ($339/ha/year) has a higher average gross margin than CT ($321/ha/year), as shown in Figure 2. Gross income was also higher under NT because of better wheat yields; however, the total variable costs (TVC) appear to be similar under both systems over five years.
0
50
100
150
200
250
300
350
400
450
0.00
0.50
1.00
1.50
2.00
2.50
3.00
3.50
2011 2012 2013 2014 2015 5-Yrmean
2011 2012 2013 2014 2015 5-Yrmean
Wheat Canola
Annu
al ra
infa
ll (m
m)
Yiel
d (t
/ha)
No-till Conventional Annual Rainfall (mm)

Economics of No-till Farming in the Eyre Peninsula Dzoma
AFBM Journal, 2017, Volume 14, Paper 2 Page 15
When considering only the private profitability, there was a $13/ha difference between NT and CT when averaged over the five years. However, the initial investment on machinery can be the biggest cost ($75,000) when converting to a no-till system; while a saving on labour from the one-pass NT system reduces the labour requirements (Forrest, 2016). The labour required for machinery operations is around $1.18/hr/ha. Using a labour cost of $25/hr, an additional $29.50 can be added to the conventional budget, which converts to a 50% ($14.75/ha) saving on labour for NT systems (Forrest, 2016).
Figure 2: Gross margin analysis, no-till vs. conventional tillage ($/ha/year) over the 5-year period
The gross margin analyses have been done based on private costs and benefits alone and did not include private co-benefits and costs, or public/social costs and benefits. From a whole farming systems perspective, the adoption of no-till farming is affected by quite a number of factors. High costs have a tendency to divide growers as to whether to adopt NT or not. But, according to Heddle (2016) pers com, there are other much bigger issues with NT than the high cost of adoption, the biggest one being herbicide resistance. “No-till is placing the knock down herbicides under ever increasing pressure. I don’t believe we have weeds resistant to either of the knock down chemistry groups significantly impacting our system yet, but we have modified our approach significantly to avoid developing a major issue. We rarely depend upon Glyphosate alone for pre seeding weed control and almost always aim for a ‘double knock’ of some kind” (Heddle, 2016, pers com). Other benefits and costs There are likely to be other benefits to be realised from NT farming besides direct economic advantages in crop productivity and profitability, that may offset the higher costs. These include environmental benefits from reduced soil erosion, improved air quality, soil organic carbon (SOC) sequestration and reduced use of machinery and fuel. A potential revenue of $8.30/ha can be realised with NT through selling carbon credits for carbon sequestration under the Federal
0
100
200
300
400
500
600
700
800
Wheat Canola Wholefarm
Wheat Canola Wholefarm
Wheat Canola Wholefarm
Gross income Total variable costs Gross margin
$/ha
No-till Conventional

Economics of No-till Farming in the Eyre Peninsula Dzoma
AFBM Journal, 2017, Volume 14, Paper 2 Page 16
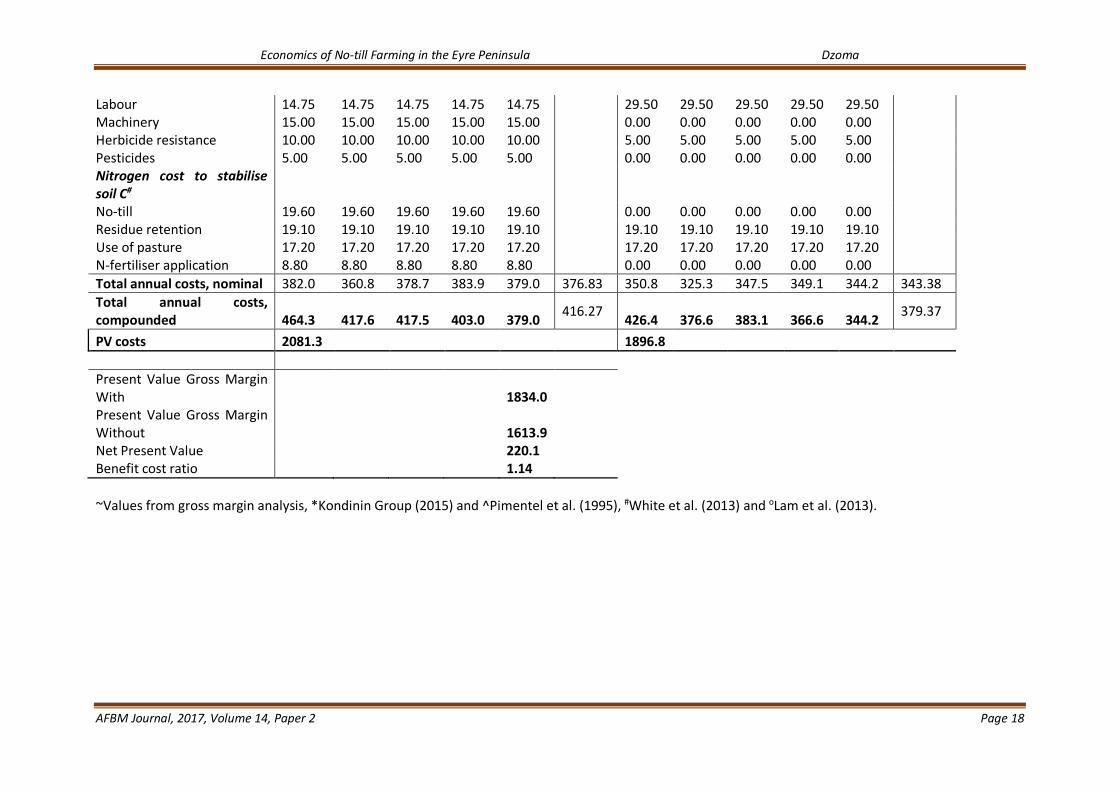
Government’s Emission Reduction Fund (ERF). However, in Australia studies have shown that long-term cultivation of soil in rainfed cropping regions decreases soil carbon, and that NT may only reduce this rate of decline (Dalal et al., 1991; Slattery and Surapaneni, 2002). Studies by Chan et al (2003) and Liu et al (2009) show significantly higher SOC storage under NT than under CT in the higher rainfall areas, i.e. >500 mm. However, as most of the cropping on upper EP is found in areas with low-medium annual rainfall (250–500 mm (Siebentritt et al., 2014), the potential of NT as a way to store carbon and therefore mitigate greenhouse-gas emission is likely to be rather limited. A recent study by Robertson et al (2015) corresponds with findings elsewhere that the effects of NT on SOC stocks are small (<1.7MgC ha–1 or 9%) or non-significant. For growers in marginal low rainfall farming systems, there is a potential public benefit of $4/ha to be realised through reducing soil erosion. Crop residues in NT systems are known to cause both a reduction in the erosive runoff power and an increase in the topsoil erosion resistance (Knapen et al., 2008). Caroll et al. (1997) estimated that NT (1.42) and reduced tillage (1.92) had consistently lower average annual soil loss (t/ha) than CT (4.01). Using estimates of savings on erosion losses from research in northern New South Wales, it is estimated that up to 18 million tonnes of soil are saved annually from adoption of NT and reduced tillage systems compared to CT (Scott and Farquharson, 2004). NT with residue cover reduced the mean annual runoff by 38 mm (19%) and increased yield by an average of 183 kg/ha (5%), while NT combined with controlled traffic reduced annual runoff by more than 100 mm (46%) and increased grain yield by 602 kg/ha (16%) on average, when compared with CT. Like most new technology, there may be some potential environmental detriments associated with persistence of herbicides in soil (and possible leaching into ground or surface water), a possible shift in the weed populations, and developing weed resistance to herbicides such as glyphosate. Conventional tillage can be effective in managing weeds like onion weed (Asphodelus fistulosus), and the move to no-till requires a shift towards more chemical based weed-control strategies. As a result, the incidence of herbicide-resistant weeds has grown exponentially with fewer new chemistries and a narrower range of options available each time a herbicide group fails (Conyers and Dang, 2014). A 5-year average of nominal annual benefits was higher under NT ($707) than CT ($634), however, nominal annual costs were also higher with NT ($377) versus CT ($343). Overall NT produces a nominal net benefit of $330 compared with $291 for CT. Cost benefit analysis The pattern of costs and benefits varies over the five year period of the data, so there is a need to bring them all to a common point in time (2015). Thus values from earlier years need to be compounded forward to bring them to 2015 values. The South Australian government suggests a 4.7 to 10% discount rate. However, a 5% risk-free rate derived from the Commonwealth, Department of Finance benchmark rate (Sinden and Thampapillai, 1995) has been used in this study. The results are shown in Table 1. Present values of benefits ($/ha/year) were higher under the With NT scenario ($3915) as compared to the Without NT scenario ($3510). However, present values of costs were much lower under the Without NT scenario ($1897) as compared to the With NT scenario

Economics of No-till Farming in the Eyre Peninsula Dzoma
AFBM Journal, 2017, Volume 14, Paper 2 Page 17
Table 1: Present values of costs and benefits ‘With and Without NT’
Benefits With NT Without NT Annual benefit ($/ha) 5-Yr
average Annual benefit ($/ha) 5-Yr
average 2011 2012 2013 2014 2015 2011 2012 2013 2014 2015 Gross income (Crop)~ 746.90 421.80 638.70 708.50 516.90 606.56 737.80 390.80 631.60 693.20 514.70 593.62 Potential revenue (soil C sequestrationo)
Residue retention 8.10 8.10 8.10 8.10 8.10 8.10 8.10 8.10 8.10 8.10 Use of pasture 7.20 7.20 7.20 7.20 7.20 7.20 7.20 7.20 7.20 7.20 No-till 8.30 8.30 8.30 8.30 8.30 0.00 0.00 0.00 0.00 0.00 Nitrogen fertiliser application 3.70 3.70 3.70 3.70 3.70 0.00 0.00 0.00 0.00 0.00
Private co-benefits*
Soil erosion mitigation 10.00 10.00 10.00 10.00 10.00 0.00 0.00 0.00 0.00 0.00 Fodder 10.00 10.00 10.00 10.00 10.00 10.00 10.00 10.00 10.00 10.00 Public benefits#
Soil erosion mitigation 4.00 4.00 4.00 4.00 4.00 0.00 0.00 0.00 0.00 0.00 Increased soil biodiversity 29.00 29.00 29.00 29.00 29.00 15.00 15.00 15.00 15.00 15.00 Improved air quality less wind erosion)^ 20.00 20.00 20.00 20.00 20.00 0.00 0.00 0.00 0.00 0.00
Total annual benefits, nominal 847.2 522.1 739.0 808.8 617.2 706.86 778.1 431.1 671.9 733.5 555.0 633.92
Total annual benefits, compounded 1,029.8 604.4 814.7 849.2 617.2 783.07 945.8 499.1 740.8 770.2 555.0 702.16
PV benefits 3915.4 3510.8
Costs With NT Without NT Annual costs ($/ha) 5-Yr
average Annual costs ($/ha) 5-Yr
average 2011 2012 2013 2014 2015 2011 2012 2013 2014 2015 Private costs
Total variable costs~ 272.50 251.30 269.20 274.40 269.50 267.38 280.00 254.50 276.70 278.30 273.40 272.58
Economics of No-till Farming in the Eyre Peninsula Dzoma
AFBM Journal, 2017, Volume 14, Paper 2 Page 18
Labour 14.75 14.75 14.75 14.75 14.75 29.50 29.50 29.50 29.50 29.50 Machinery 15.00 15.00 15.00 15.00 15.00 0.00 0.00 0.00 0.00 0.00 Herbicide resistance 10.00 10.00 10.00 10.00 10.00 5.00 5.00 5.00 5.00 5.00 Pesticides 5.00 5.00 5.00 5.00 5.00 0.00 0.00 0.00 0.00 0.00 Nitrogen cost to stabilise soil C#
No-till 19.60 19.60 19.60 19.60 19.60 0.00 0.00 0.00 0.00 0.00 Residue retention 19.10 19.10 19.10 19.10 19.10 19.10 19.10 19.10 19.10 19.10 Use of pasture 17.20 17.20 17.20 17.20 17.20 17.20 17.20 17.20 17.20 17.20 N-fertiliser application 8.80 8.80 8.80 8.80 8.80 0.00 0.00 0.00 0.00 0.00 Total annual costs, nominal 382.0 360.8 378.7 383.9 379.0 376.83 350.8 325.3 347.5 349.1 344.2 343.38 Total annual costs, compounded 464.3 417.6 417.5 403.0 379.0 416.27 426.4 376.6 383.1 366.6 344.2 379.37
PV costs 2081.3 1896.8
Present Value Gross Margin With 1834.0
Present Value Gross Margin Without
1613.9
Net Present Value
220.1 Benefit cost ratio 1.14
~Values from gross margin analysis, *Kondinin Group (2015) and ^Pimentel et al. (1995), #White et al. (2013) and oLam et al. (2013).
Economics of No-till Farming in the Eyre Peninsula Dzoma
AFBM Journal, 2017, Volume 14, Paper 2 Page 19
($2081) (Table 1). A positive NPV of $220 and a BCR greater than 1 (1.14) indicate that the perceived benefits (private, public and environmental) of adopting NT farming are greater than the associated costs. In another study (Scott and Farquharson, 2004), a BCR of 4:6:1 for NT, reduced tillage and CT indicated that NT was a better farming practice than CT. Therefore, adopting NT as a climate change adaptation and mitigation pathway is economically justifiable from a farm profitability point of view and is environmentally sustainable. A decent proportion of both private and public benefits and costs are assumed values from the literature (Kondinin Group, 2015; White et al., 2013; Lam et al., 2013). Hence, if a policy change occurs and the figures are adjusted, the resulting NPV and BCR might increase or decrease. For example, an average price of $10.69/t CO2-e per tonne of abatement (Clean Energy Regulator, 2016) was used to calculate the potential revenue from carbon sequestration. This potential revenue will change depending on the results of the next Emissions Reduction Fund auction and might end up changing the outcome of the analysis. The other limitation for this case study farm is a lack of diversity because of a restricted cropping program (i.e. wheat-canola-wheat with a medic pasture phase). Therefore, flexibility and diversity are important, particularly in marginal low rainfall farming systems. A study by D’Emden et al. (2008), based on interviews with 384 grain growers using a questionnaire aimed at eliciting perceptions relating to a range of possible long- and short-term agronomic interactions associated with the relative economic advantage of shifting to a NT cropping system, provides evidence that adoption of NT systems is an information-intensive process and that there are likely to be opportunities for extension and localised information to accelerate the use of NT by Australian grain growers. The most economical tillage system depends upon a number of factors, and the most economical system for one farm may not be the most economical for an adjacent farm (Epplin, 2007). It has been argued in another paper (Farell, 2008), that benefits from the adoption of NT farming need to be assessed over a period of at least eight years, and preferably 10 to 12 years, to account for the improvement in soil quality and the corresponding capacity to increase crop yields through an increase in water holding capacity and soil structure and fertility. Conclusion Grain cropping on low rainfall farming systems on upper EP is likely to become a challenge under a warmer and drier future climate. Improving soil fertility and soil moisture conservation will be key in adapting to a variable climate, and this can be done by adopting farming practices like no-till farming and reduced tillage. No-till was more profitable with a higher average gross margin ($339/ha/year) than conventional tillage ($321/ha/year). Adoption of NT can increase or decrease yields depending on environmental conditions, and in turn, the change in yield will impact residue carbon inputs to soils, wind erosion, soil biodiversity and moisture retention. The NPV ($220/ha) was positive at the 5% social rate of discount and the BCR (1.14) exceeded 1.0; therefore, adopting NT farming can be regarded as a feasible climate change mitigation and adaptation strategy for low rainfall farming systems in South Australia for the whole community. For the future, NT systems combined with controlled traffic, precision farming and best practice management will further increase the productivity base of farms in low rainfall farming systems and deliver benefits beyond that expected when considered in isolation. References Carroll, C., Halpin, M., Burger, P., Bell, K., Sallaway, M. and Yule, F, (1997), “The effect of crop type, crop rotation, and tillage practice on runoff and soil loss on a Vertisol in central Queensland”, Australian Journal of Soil Research, 35, 925-39.
Economics of No-till Farming in the Eyre Peninsula Dzoma
AFBM Journal, 2017, Volume 14, Paper 2 Page 20
Chan, K.Y., Heenan, D.P. and So, H.B. (2003), “Sequestration of carbon and changes in soil quality under conservation tillage on light-textured soils in Australia: a review”, Australian Journal of Experimental Agriculture, 43, 325-334. Clean Energy Regulator (2016), Australian Government: Emission Reduction Fund. http://www.cleanenergyregulator.gov.au/ERF/Auctions-results/November-2016. Accessed on 30/11/2016 Conyers, M. and Dang, Y. (2014), Is there room for strategic tillage in a no-till system? Strategic Tillage Fact Sheet: Northern and Southern Regions. Grains Research and Development Corporation, Canberra. Dalal, R.C., Henderson, P.A. and Glasby, J.M. (1991), “Organic matter and microbial biomass in a vertisol after 20 years of zero-tillage”, Soil Biology and Biochemistry, 23, 435–441. D’Emden, F.H. and Llewellyn, R.S. (2003), Adoption of no-till farming systems in SA – Report for the SA No-Till Farmers Association, University of WA/CRC for Australian Weed Management, Perth. D’Emden, F.H. and Llewellyn, R.S. (2006), “No-till adoption decisions in southern Australian cropping and the role of weed management”, Australian Journal of Experimental Agriculture, 46 (4), 563-569. D’Emden, F.H. and Llewellyn, R.S. (2009), Adoption of conservation tillage in Australian cropping regions, Grains Research and Development Corporation, Canberra. D'Emden, F.H., Llewellyn, R.S. and Burton, M.P. (2008), “Factors influencing adoption of conservation tillage in Australian cropping regions”, Australian Journal of Agricultural and Resource Economics, 52, 169-182. Epplin, F.M. (2007), “Economics: No-till vs. Conventional Tillage”, In No-till Cropping Systems in Oklahoma, Oklahoma Cooperative Extension Service, Stillwater, OK, USA, 27-36. Ezigrain (2016), http://ezigrain.abb.com.au/reports/LatestPrices.asp Farrell, T.C. (2008), “An Economic Evaluation of Conservation Farming Practices for the Central West of NSW”, Australasian Agribusiness Review, 16, Paper 5. Forrest, S. (2016), Upper Eyre Peninsula no-till farmer, Pers. comm., 29/06/2016 Heddle, B. (2016), Upper Eyre Peninsula no-till farmer, Pers. comm., 12/10/2015 Janssen, L. and Harer, J. (2010), An Economic Analysis of No-Till Rotations and Effects on Carbon Sequestration and Long Term Sustainability of Agriculture. Selected Paper prepared for presentation at the Agricultural and Applied Economics Association, Denver, Colorado, US, July 25/27. Knapen, A., Poesen, J., Govers, G. and De Baets, S. (2008), “The effect of conservation tillage on runoff erosivity and soil erodibility during concentrated flow”, Hydrological Processes, 22, 1497-1508. Kondinin Group (2015), The business case for carbon farming: Improving your farm’s sustainability, Workshop manual, The Centre for International Economics, Canberra.

Economics of No-till Farming in the Eyre Peninsula Dzoma
AFBM Journal, 2017, Volume 14, Paper 2 Page 21
Lam, S.K., Chen, D., Mosier, A.R. and Roush, R. (2013), “The potential for carbon sequestration in Australian agricultural soils is technically and economically limited”, Science Report, 3, 2179; DOI:10.1038/srep02179 (2013). Lewis, P., Malcolm, B. and Steed, G. (2006), “Conservation Crop Farming: A Farm Management Perspective”, Australian Agribusiness Perspectives, Paper 69. Liu, D.L., Chan, K.Y. and Conyers, M.K. (2009), “Simulation of soil organic carbon under different tillage and stubble management practices using the Rothamsted carbon model”, Soil and Tillage Research, 104, 65-73. Pimentel, D., Harvey, C., Resosudarmo, P., Sinclair, K., Kurz, D., McNair, M. and Crist, S. (1995), “Environmental and economic costs of soil erosion and conservation benefits”, Science, New series, 267, 5201. Robertson, F., Armstrong, R., Partington, D., Perris, R., Oliver, I., Aumann, C., Crawford, D. and Rees, D. (2015), “Effect of cropping practices on soil organic carbon: evidence from long-term field experiments in Victoria, Australia”, Soil Research, 53, 636–646 http://dx.doi.org/10.1071/SR14227 Rural Solutions, PIRSA (2015), Farm gross margin guide. A gross margin template for crop and livestock enterprises, PIRSA, Adelaide. Scott, J.F. and Farquharson, R.J. (2004), An Assessment of the Economic Impacts of NSW Agriculture Research and Extension - Conservation Farming and Reduced Tillage in Northern NSW, Economic Research Report No. 19, NSW Department of Primary Industries, Tamworth. Siebentritt, M., Halsey, N. and Stafford-Smith, M. (2014), Regional Climate Change Adaptation Plan for the Eyre Peninsula. Prepared for the Eyre Peninsula Integrated Climate Change Agreement Committee. Sinden, J.A. and Thampapillai, D.J. (1995), Introduction to Benefit-Cost Analysis, Longman, Melbourne. Slattery, W.J. and Surapaneni, A. (2002), “Effect of soil management practices on the sequestration of carbon in duplex soils of south-eastern Australia”, In: Kimble, J.M., Lal, R. and Follett, R.F. (Eds.), Agricultural Practices and Policies for Carbon Sequestration in Soil, CRC Press, USA, 107–117. Truscott, M.A. (1997), Land management practices on the lower Eyre Peninsula, South Australia – a survey, CRC for Soil and Land Management, July. Ugalde, D., Brungs, A., Kaebernick, M., McGregor, A. and Slattery, B. (2007), ”Implications of climate change for tillage practice in Australia”, Soil and Tillage Research, 97, 318-330. White, I., Pearce, D. and de Fegely, R. (2013), Policy options and strategies for renewed plantation investment: Stage 2 report, Forest and Wood Products Australia.

Economics of No-till Farming in the Eyre Peninsula Dzoma
AFBM Journal, 2017, Volume 14, Paper 2 Page 22
Appendix 1: Gross margin analysis - WHEAT
Tillage practice NO TILL CONVENTIONAL
YEAR 2011 2012 2013 2014 2015 5 Year mean 2011 2012 2013 2014 2015 5 Year mean
INCOME
Yield (t/ha)
3.00 1.50 2.40 3.00 2.20 2.42 3.10 1.20 2.60 2.80 2.00 2.34 Price ($/t) 265.00 331.00 324.00 282.00 226.00 285.60 265.00 331.00 324.00 282.00 226.00 285.60
GROSS INCOME $/Ha 795.00 496.50 777.60 846.00 497.20 682.46 821.50 397.20 842.40 789.60 452.00 660.54
VARIABLE COSTS Rate/ha Cost ($/unit)
Seed
Wheat (mace) 80kg $350/t 24.80 25.60 29.20 27.20 28.00 Wheat (mace) 60kg $350/t 18.60 19.20 21.90 20.40 21.00 Fertiliser
DAP (18:20:0) 50kg 655/t 32.75 32.75 32.75 32.75 32.75
DAP (18:20:0) 80kg 655/t
52.40 52.40 52.40 52.40 52.40 Urea 120kg 560/t
66.00 66.00 68.40 67.20 68.40 Urea 80kg 560/t 27.50 27.50 28.50 28.00 28.50
Herbicides
Wipe-Out 450 1.2L $7.40/L 8.88 8.88 8.88 8.88 8.88 RoundUp 2.5L $7.40/L 18.50 18.50 18.50 18.50 18.50
RoundUp 1.5L $7.40/L 11.10 11.10 11.10 11.10 11.10
LI700 0.1L $6.50/L 0.65 0.65 0.65 0.65 0.65 0.65 0.65 0.65 0.65 0.65 Ester 680 0.8L $7.60/L 6.08 6.08 6.08 6.08 6.08 6.08 6.08 6.08 6.08 6.08 Lontrel Advanced 600 0.075L $30.00/L 2.25 2.25 2.25 2.25 2.25 2.25 2.25 2.25 2.25 2.25 Sprayseed 250 1.6L $11.00/L 17.60 17.60 17.60 17.60 17.60 17.60 17.60 17.60 17.60 17.60 Hammer 0.08L $280.00/L 22.40 22.40 22.40 22.40 22.40 Hammer 0.03L $280.00/L 8.40 8.40 8.40 8.40 8.40 LVE MCPA 500 0.6L $9.00/kg 5.40 5.40 5.40 5.40 5.40 5.40 5.40 5.40 5.40 5.40 Triflurex 1L $6.00/L 6.00 6.00 6.00 6.00 6.00 Treflan 1.5L $6.00/L 9.00 9.00 9.00 9.00 9.00
Amicide 0.7L $5.00/L 3.50 3.50 3.50 3.50 3.50 3.50 3.50 3.50 3.50 3.50 Fungicides
Tebuconazole 0.29L $12.00/L 3.48 3.48 3.48 3.48 3.48 3.48 3.48 3.48 3.48 3.48 Pesticides
Lorsban 1L $10.00/L 10.00 10.00 10.00 10.00 10.00 10.00 10.00 10.00 10.00 10.00 Slugger (snail bait) 1kg $1.10/kg 1.10 1.10 1.10 1.10 1.10
Operations cost ($/ha)
Fuel and Oil $10.11 $10.11 $10.11 $10.11 $10.11 $10.11 12.39 12.39 12.39 12.39 12.39 Repairs/Maintenance $14.66 14.66 14.66 14.66 14.66 14.66 14.66 14.66 14.66 14.66 14.66

Economics of No-till Farming in the Eyre Peninsula Dzoma
AFBM Journal, 2017, Volume 14, Paper 2 Page 23
Freight cost ($/t)
Grain (t) $20.00 60.00 30.00 48.00 60.00 44.00 62.00 24.00 52.00 56.00 40.00 Fertiliser (t) $20.00 2.60 2.60 2.60 2.60 2.60 4.00 4.00 4.00 4.00 4.00 Contract Work
Aerial fungicide spraying $14.00/ha 14.00 14.00 14.00 14.00 14.00 14.00 14.00 14.00 14.00 14.00
TOTAL VARIABLE COSTS $/ha 291.28 261.88 283.58 293.58 278.68 281.80 297.69 259.69 290.09 292.89 278.09 283.69
GROSS MARGIN $/Ha 503.72 234.62 494.02 552.42 218.52 400.66 523.81 137.51 552.31 496.71 173.91 376.85
Input and grain prices based on 2011, 2012, 2013, 2014 and 2015 Farm gross margin guide. Rural Solutions SA/PIRSA Grain prices based on: http://ezigrain.abb.com.au/reports/LatestPrices.asp
Appendix 2: Gross margin analysis - CANOLA
Tillage practice NO TILL CONVENTIONAL YEAR 2011 2012 2013 2014 2015 5 year mean 2011 2012 2013 2014 2015 5 year mean
INCOME
Yield (t/ha)
1.25 0.65 0.95 1.10 1.05 1.00 1.17 0.72 0.80 1.15 1.13 0.99 Price ($/t) 559.00 534.00 526.00 519.00 511.00 529.80 559.00 534.00 526.00 519.00 511.00 529.80 GROSS INCOME $/Ha 698.75 347.10 499.70 570.90 536.55 530.60 654.03 384.48 420.80 596.85 577.43 526.72
VARIABLE COSTS
Rate
kg/ha Cost ($/unit)
Seed
Canola 2 $25/kg 16.00 20.00 20.00 50.00 50.00 16.00 20.00 20.00 50.00 50.00 Fertiliser $/t
DAP 50 $750 30.00 32.00 34.50 32.75 37.50 30.00 32.00 34.50 32.75 37.50 Urea 200 $570 110.00 110.00 114.00 112.00 114.00 110.00 110.00 114.00 112.00 114.00 Chemicals
Herbicides Rate L/ha Cost ($/L)
RoundUp Attack 1.3 $7.00 9.10 9.10 9.10 9.62 9.10 9.10 9.10 9.10 9.62 9.10 LI700 0.05 $5.50 0.28 0.28 0.28 0.28 0.28 0.28 0.28 0.28 0.28 0.28 Sprayseed 250 0.95 $11.00 10.45 10.45 10.45 10.45 10.45
Select 0.3 $14.00 4.20 4.20 4.20 4.20 4.20 4.20 4.20 4.20 4.20 4.20 Leopard 200 0.3 $10.00 3.00 3.00 3.00 3.00 3.00 3.00 3.00 3.00 3.00 3.00 Hasten 1 $5.50 5.50 5.50 5.50 5.50 5.50
BS 1000 0.06 $6.00 0.36 0.36 0.36 0.36 0.36
Pesticide
Chlopyrifos 0.5 $10.00 5.00 5.00 5.00 5.00 5.00 5.00 5.00 5.00 5.00 5.00 Karte zeon -aphids 0.024 165 3.96 3.96 3.96 3.96 3.96 3.96 3.96 3.96 3.96 3.96

Economics of No-till Farming in the Eyre Peninsula Dzoma
AFBM Journal, 2017, Volume 14, Paper 2 Page 24
Lemat 0.2 $29.00 5.80 5.80 5.80 5.80 5.80 5.80 5.80 5.80 5.80 5.80 Talstar 0.04 $44.00 1.76 1.76 1.76 1.76 1.76 1.76 1.76 1.76 1.76 1.76 Operations
Fuel and Oil 11.20 11.20 11.20 11.20 11.20 22.35 22.35 22.35 22.35 22.35 Repairs/Maintenance 18.92 18.92 18.92 18.92 18.92 32.53 32.53 32.53 32.53 32.53 Freight cost ($/t)
Grain (t) 25.00 31.25 16.25 23.75 27.50 26.25 31.25 16.25 23.75 27.50 26.25 Fertiliser (t) 20.00 3.00 3.00 3.00 3.00 3.00 3.00 3.00 3.00 3.00 3.00
TOTAL VARIABLE COSTS $/ha 253.78 240.78 254.78 255.30 260.28 252.98 262.23 249.23 263.23 263.75 268.73 261.43
GROSS MARGIN $/Ha 444.98 106.33 244.93 315.61 276.28 277.62 391.81 135.26 157.58 333.11 308.71 265.29
Input and grain prices based on 2011, 2012, 2013, 2014 and 2015 Farm gross margin guide. Rural Solutions SA/PIRSA