australian fertilizer industry value and issues august 2010
TRANSCRIPT
1
The Australian fertilizer
industry -- values and issues
Australian Fertilizer Industry Conference 2010
Fertilizer Industry Federation of Australia
Terry Ryan
Meta Economics Consulting Group

2
3
Contents Abbreviations ............................................................................................................................. 5
Executive summary .................................................................................................................... 7
Chapter 1: Fertilizer Industry Contribution to the Australian Economy ................................... 9
Chapter 2: The Fertilizer Industry in Australian History ......................................................... 13
Chapter 3: The Fertilizer Industry in Australia ........................................................................ 16
Chapter 4: The contribution of fertilizer to agricultural productivity ...................................... 34
Chapter 5: Productivity improvements in agriculture .............................................................. 42
Chapter 6: The Australian fertilizer industry in a world context ............................................. 50
Chapter 7: Feeding the world in 2050...................................................................................... 56
Chapter 8: The International Food Price Spike of 2008 .......................................................... 64
Chapter 9: Carbon Pollution Reduction Scheme ..................................................................... 70
References ................................................................................................................................ 82
Appendix 6.1: Australian and International Production, Consumption, Exports and Imports of the Major Fertilizer Products -- 2008 ....................................................................................... 86

4
5
Abbreviations ABS Australian Bureau of Statistics
ABARE Australian Bureau of Agricultural and Resource Economics
ACCC Australian Competition and Consumer Commission
CAN Calcium Ammonium Nitrate
CPRS Carbon Pollution Reduction Scheme
CSIRO Commonwealth Scientific and Industrial Research Organisation
DAP Diammonium Phosphate
DSE Dry Sheep Equivalent
FAO Food and Agriculture Organisation
FIFA Fertilizer Industry Federation of Australia
GRDC Grains Research and Development Corporation
IFA International Fertilizer Association
IMF International Monetary Fund
LNG Liquefied Natural Gas
MAP Monammoniumphosphate
MOP Muriate of Potash
NPK Nitrogen, Phosphorus and Potassium Fertilizers
TSP Triple Superphosphate
UAN Urea Ammonium Nitrate

6
7
Executive summary
The value of the fertilizer industry to the Australian economy is much greater than its value of output or value-added to the broad economic aggregates. Its downstream contribution to the total economy is magnified by its impact on the productivity and production potential of Australia's agricultural sector.
If there was no chemical fertilizer available for the agricultural sector then:
• the agricultural sector would bear a direct economic cost from reduced production of $12.7 billion;
• the entire economy would be reduced by $40 billion from flow on effects; • the employment loss in the agricultural sector alone would have totalled 107,000
workers; • for the economy, it would have been 300,000 jobs; and • exports from the agricultural sector would have decreased by $9 billion.
The fertilizer industry in Australia has been growing in its own right, and as an increasing input into Australian agriculture, with fluctuations in demand because of seasonal conditions. It is no longer entirely dependent upon imports of products or raw materials and has become an exporter of products in the Australian off-season.
On a world scale, the Australian industry is generally small in nearly all fertilizer products and has no influence on world prices.
There are major challenges for the industry and the agricultural sector in the future. The fertilizer industry in Australia has been a major contributor to our enhanced agricultural productivity for over a century now. An analysis of field trials shows that without fertilizer agricultural production in Australia would decline by approximately 20 percent for the broad acre cropping industries and by two thirds for the grazing industries.
There are signs that productivity improvements in agriculture are on the decline, not just in Australia, but internationally. If this trend continues the importance of getting more out of the existing technologies that we have will rise. A world with a bigger, richer population will require a lot more agricultural production. The role of fertilizers as a crucial technology for increasing agricultural production will rise in importance.
A carbon constrained world will also pose new challenges, not just for the fertilizer industry but also for the agricultural sector generally. If the Carbon Pollution Reduction Scheme was in place, the Australian fertilizer manufacturing industry would face an additional cost impost equivalent to an increased payroll tax of six percentage points.

8
9
Chapter 1: Fertilizer Industry Contribution to the Australian Economy
The Australian fertilizer industry has been an unsung hero of the Australian economy. It has
been a crucial component in our history for delivering the agricultural production and
productivity growth that has helped develop Australia.
Its value is much greater to the economy than the value of its sales alone. Its downstream
contribution to the total economy is magnified by its impact on the productivity and
production potential of Australia's agricultural sector.
Its current value to the Australian economy is measured in our national statistical accounts,
but a truer measure is what would be the impact on the economy if there was no chemical
fertilizer industry to supply our agricultural sector.
Important as the industry is now, it will be even more essential for meeting the challenges of
the future, not just for Australia, but for the world, in feeding the richer, larger population we
will have in 2050 but also in helping combat problems arising from climate change and the
continuing likely expansion of biofuels production.
From the various studies provided in this paper a scenario can be developed to show what
happens to the agricultural sector, and the economy generally, if there is no fertilizer usage in
Australian agriculture. A detailed analysis of the impact on agricultural production of
fertilizer is provided in Chapter 4. The analysis presented here is the summary effects from a
review of a series of field trials. The impacts are measured primarily on the broadacre
industries, as the smaller horticultural industries are highly variable in their response to
fertilizer and tend to be located on much better soils. Also the intensive livestock industries
will not be directly impacted as they do not use fertilizer. There can be indirect impacts from
less feed availability from the broadacre cropping industries but these have not been
estimated.
10
The livestock numbers and values of production have been adjusted to take account of the
production from the rangelands of Australia where fertilizer is not generally used. This is a
broad approach to provide indicative estimates as there will be areas outside the rangelands
that also do not use fertilizer, as well as some areas within them that will have fertilised
paddocks. Approximately 12 percent of sheep numbers and 28 percent of cattle numbers are
located in the areas defined as rangelands. The values from livestock products serve as the
base for assessing the impact of fertilizers and have therefore been adjusted by these
percentages.
There is, as noted a lesser effect on the grains, oilseeds and sugar industries from ceasing the
use of fertilizer than on the improved pasture lands, which have been generally shown to be
highly dependent upon superphosphate use for improved pastures, compared to the native
pastures.
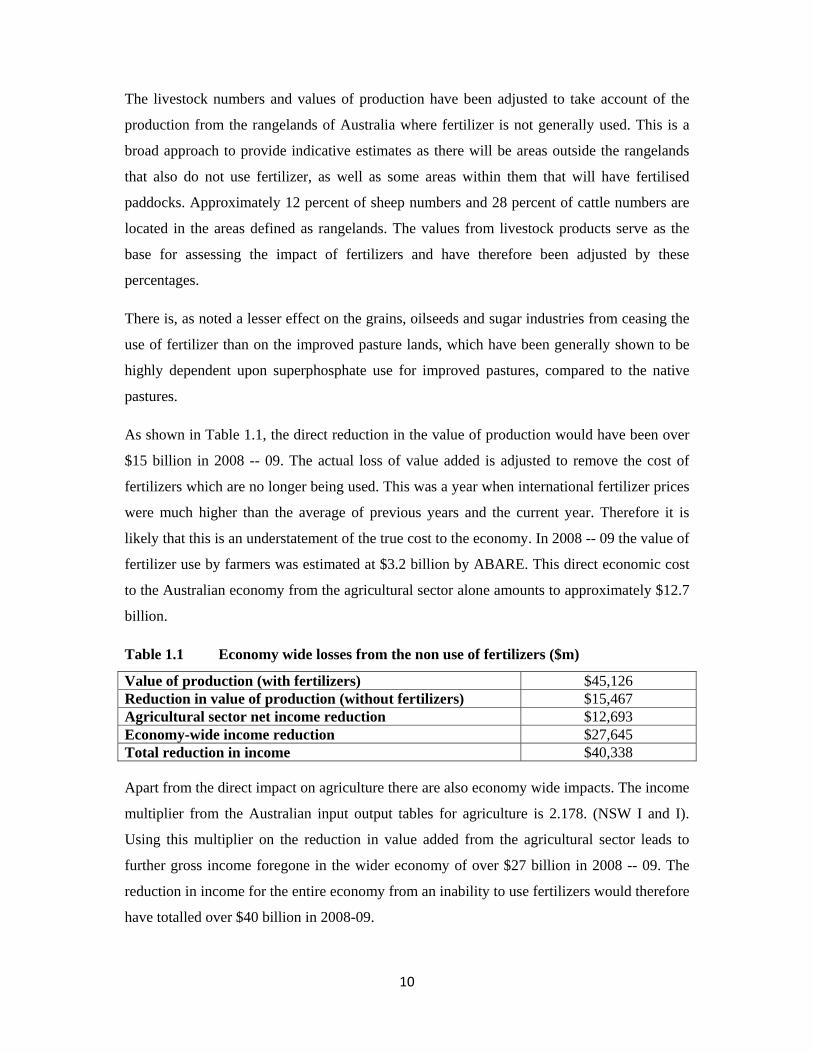
As shown in Table 1.1, the direct reduction in the value of production would have been over
$15 billion in 2008 -- 09. The actual loss of value added is adjusted to remove the cost of
fertilizers which are no longer being used. This was a year when international fertilizer prices
were much higher than the average of previous years and the current year. Therefore it is
likely that this is an understatement of the true cost to the economy. In 2008 -- 09 the value of
fertilizer use by farmers was estimated at $3.2 billion by ABARE. This direct economic cost
to the Australian economy from the agricultural sector alone amounts to approximately $12.7
billion.
Table 1.1 Economy wide losses from the non use of fertilizers ($m)
Value of production (with fertilizers) $45,126 Reduction in value of production (without fertilizers) $15,467 Agricultural sector net income reduction $12,693 Economy-wide income reduction $27,645 Total reduction in income $40,338 Apart from the direct impact on agriculture there are also economy wide impacts. The income
multiplier from the Australian input output tables for agriculture is 2.178. (NSW I and I).
Using this multiplier on the reduction in value added from the agricultural sector leads to
further gross income foregone in the wider economy of over $27 billion in 2008 -- 09. The
reduction in income for the entire economy from an inability to use fertilizers would therefore
have totalled over $40 billion in 2008-09.
11
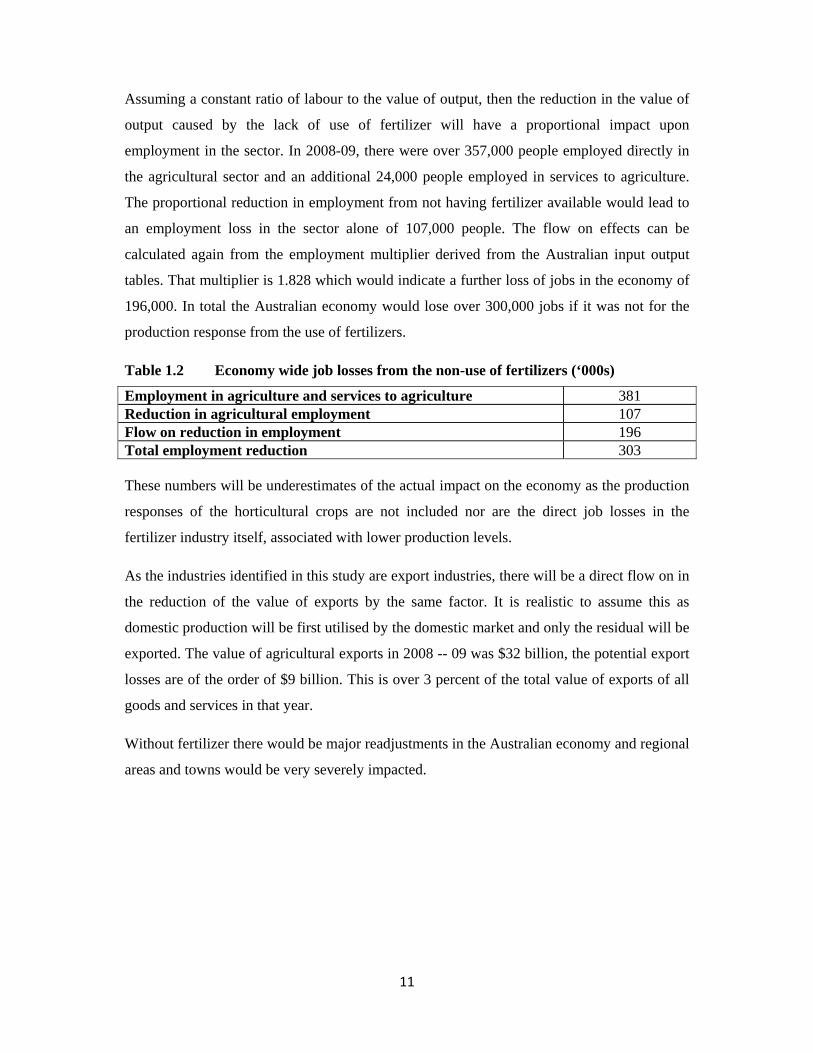
Assuming a constant ratio of labour to the value of output, then the reduction in the value of
output caused by the lack of use of fertilizer will have a proportional impact upon
employment in the sector. In 2008-09, there were over 357,000 people employed directly in
the agricultural sector and an additional 24,000 people employed in services to agriculture.
The proportional reduction in employment from not having fertilizer available would lead to
an employment loss in the sector alone of 107,000 people. The flow on effects can be
calculated again from the employment multiplier derived from the Australian input output
tables. That multiplier is 1.828 which would indicate a further loss of jobs in the economy of
196,000. In total the Australian economy would lose over 300,000 jobs if it was not for the
production response from the use of fertilizers.
Table 1.2 Economy wide job losses from the non-use of fertilizers (‘000s)
Employment in agriculture and services to agriculture 381 Reduction in agricultural employment 107 Flow on reduction in employment 196 Total employment reduction 303 These numbers will be underestimates of the actual impact on the economy as the production
responses of the horticultural crops are not included nor are the direct job losses in the
fertilizer industry itself, associated with lower production levels.
As the industries identified in this study are export industries, there will be a direct flow on in
the reduction of the value of exports by the same factor. It is realistic to assume this as
domestic production will be first utilised by the domestic market and only the residual will be
exported. The value of agricultural exports in 2008 -- 09 was $32 billion, the potential export
losses are of the order of $9 billion. This is over 3 percent of the total value of exports of all
goods and services in that year.
Without fertilizer there would be major readjustments in the Australian economy and regional
areas and towns would be very severely impacted.

12
13
Chapter 2: The Fertilizer Industry in Australian History
The value of fertilizer has long been recognised in agriculture and one of the earliest non
manure sources was guano, which was extracted from South American deposits primarily.
In Australia the first mining of guano started in 1850 in Western Australia. This can be said
to be the start of the fertilizer industry in Australia.
The major advance for the industry was when the impact of phosphate on agricultural
productivity was recognised by farmers. The first imports of phosphate rock occurred in
1905. The increasing demand led to organisations such as the Pivot Phosphate Cooperative
being formed in 1919.
The fertilizer industry has continued to expand and diversify its product range to meet the
needs of Australian agriculture. Superphosphate was the first major fertilizer product found
necessary for Australian soils. Agriculture has diversified from a very heavy dependence on
the products of the pastoral industries to a more mixed base with an expanded cropping focus.
The mix of products for maintaining the nutrient balance of the soils has changed in line with
this, with a greater reliance on high analysis nitrogen and phosphorus compounds and straight
nitrogenous fertilizers.
The fertilizer industry has played a vital role in Australia’s economic and agricultural success
as Australia has always been classified as a "continent of soils with a low plant nutrient
supply" (Smith 2000). Combating this problem has required a major research effort over our
history. Today all farming systems know the value of fertilizer in enhancing productivity, and
agronomic practices have evolved to deliver the most efficient means of determining how
much fertilizer to apply and how and when to apply it.
The use of fertilizers has delivered major improvements to the agricultural environment of
Australia. As the Bureau of Rural Resources (1992) in an audit of our agricultural systems
comment

14
"… it is pertinent to indicate that some soil properties, including levels of phosphorus and
beneficial trace elements, have been markedly improved over millions of hectares in the last
200 years".
Without this fertilizer input our agriculture would not have been able to deliver the
development of Australia as the native grasses of Australia evolved under conditions of low
nutrient levels and generally do not
"… have the capacity to give large growth responses to high levels of nutrients". (BRR)
From the 1930s the introduction of subterranean clover to pasture systems and the use of
phosphate fertilizers was attributed as increasing the carrying capacity from around 2 to at
least 10 dry sheep equivalents per hectare over significant parts of the continent (Smith).
Early trials showed the benefits that could be derived from the use of subterranean clover and
superphosphate. An example in South Australia showed that unfertilized padlocks could only
carry 2.8 dry sheep equivalents but with the application of superphosphate to improve
pasture, that carrying capacity could rise to 12.6 DSE per hectare (Kybybolite Research
Station).
Australia's agricultural production capacity depended upon the establishment of improved
pasture species, which depended upon fertilizer inputs to deliver huge increments in
productivity. There were also a series of other technological developments such as better
machinery to spread the superphosphate on the paddocks. It was the combination of seeds,
super and spreaders that helped in this first Australian agricultural technological revolution.
As the Australian agricultural sector diversified away from the grazing industries to cropping
and horticulture, the mix of fertilizers used in Australia switched away from reliance on
single superphosphate to include fertilizers with a much greater proportion of nitrogen. The
cropping industries, and sugar in particular, as they expanded from the 1960s led this surge
for additional nitrogen in the broadacre industries. A review of nitrogen fertilizer research for
the sugar industry commented:
“The Australian sugar industry has a history of high N fertiliser usage, with applications
increasing from the 1960s.” (Thorburn)

15
The importance of fertilizers in delivering the productivity and production levels in
Australian agriculture are still recognised in today's technological world. Figure 2.1
demonstrates the rise in agricultural production over the last three decades and the increasing
use of fertilizer inputs (ie. nitrogen, phosphorous and potassium shorthanded as ‘NPK’) to
achieve that level of real production. This Figure provides an indication of the enhancements
in production due to fertilizer, whilst acknowledging that other factors such as better
herbicides and insecticides are also making a contribution.
Figure 2.1: Fertilizer use and agricultural production: Australia
Source: ABS 2010b, FIFA
The importance of fertilizers for Australian agriculture has long been recognised. Subsidies
were introduced for their consumption in the 1930s. Payments were made to Australian
manufacturers of eligible phosphatic and nitrogenous fertilizers, on the condition that they
passed on the subsidy to users by charging lower fertilizer prices. The subsidies were
eventually removed in the 1980s after a number of public inquiries and along with
progressive reductions in tariffs on manufactured items.
600
800
1,000
1,200
1,400
1,600
1,800
1980 1985 1990 1995 2000 2005 2010 2015
N+P
+K 0
00t /
Vol
ume
Inde
x
NPKVI

16
Chapter 3: The Fertilizer Industry in Australia
3. 1 Fertilizer manufacturing industry
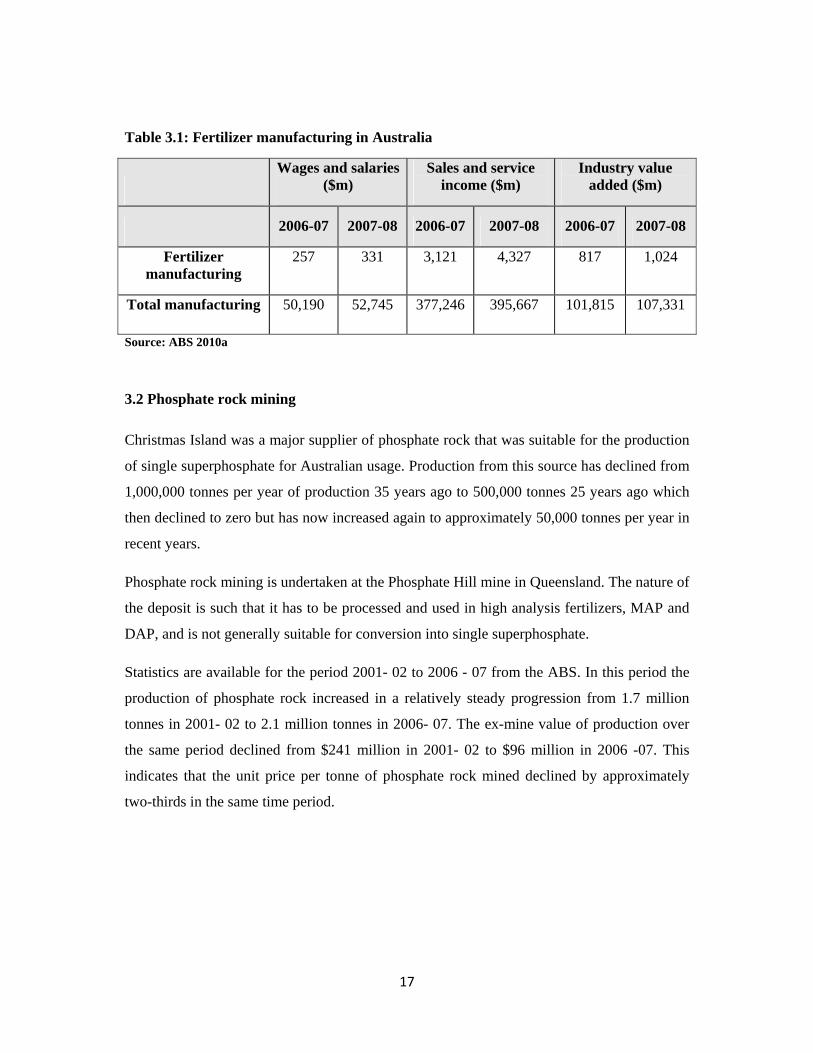
Since its establishment the fertilizer manufacturing industry in Australia has been growing in
importance, in its contribution to the Australian economy. The latest data available from the
Australian Bureau of Statistics (ABS 2008 Manufacturing Census 8221.0), states turnover of
fertilizer manufacturing in 2007 -- 08 climbed to over $4.3 billion up more than $1 billion on
the previous year. ABARE statistics state that only $3 billion of fertilizer was consumed by
Australian farmers in that year. The value added in the industry increased from $817 million
to $1024 million. As a proportion of the entire manufacturing sector, it has risen to over one
percent of in terms of output value and just under one percent in terms of value added. It is a
capital intensive industry with wages and salaries in the latest year accounting for 0.63
percent of the total wages and salaries paid in the manufacturing sector.
The importance of the Australian industry has been increasing steadily over time. In 1996 -97
the industry only accounted for 0.52 percent of manufacturing sector turnover and 0.5 percent
of the value added. In the same period, direct employment in the fertilizer manufacturing
industry has increased from 2300 to 3300.
In 2006-07, the latest year for which ABS has provided statistics, intermediate inputs such as
phosphate rock and natural gas into the production of fertilizer accounted for over 70 percent
of the value of output. Sales and service income was $888,000 per employee, well ahead of
the manufacturing average of $373,000 per employee. The value added per employee in
fertilizer manufacturing equates to $247,000 yet for manufacturing as a whole it was only
$98,000 per employee.
Manufacturers source raw materials from imports, or from domestic sources, as well as
importing finished fertilizer products from international suppliers.
17
Table 3.1: Fertilizer manufacturing in Australia
Wages and salaries
($m) Sales and service
income ($m) Industry value
added ($m)
2006-07 2007-08 2006-07 2007-08 2006-07 2007-08
Fertilizer manufacturing
257 331 3,121 4,327 817 1,024
Total manufacturing 50,190 52,745 377,246 395,667 101,815 107,331
Source: ABS 2010a
3.2 Phosphate rock mining
Christmas Island was a major supplier of phosphate rock that was suitable for the production
of single superphosphate for Australian usage. Production from this source has declined from
1,000,000 tonnes per year of production 35 years ago to 500,000 tonnes 25 years ago which
then declined to zero but has now increased again to approximately 50,000 tonnes per year in
recent years.
Phosphate rock mining is undertaken at the Phosphate Hill mine in Queensland. The nature of
the deposit is such that it has to be processed and used in high analysis fertilizers, MAP and
DAP, and is not generally suitable for conversion into single superphosphate.
Statistics are available for the period 2001- 02 to 2006 - 07 from the ABS. In this period the
production of phosphate rock increased in a relatively steady progression from 1.7 million
tonnes in 2001- 02 to 2.1 million tonnes in 2006- 07. The ex-mine value of production over
the same period declined from $241 million in 2001- 02 to $96 million in 2006 -07. This
indicates that the unit price per tonne of phosphate rock mined declined by approximately
two-thirds in the same time period.

18
Table 3.2:Phosphate rock mining production
$m tonnes 2001-02 241 1,712,639 2002-03 131 1,910,241 2003-04 129 1,890,519 2004-05 135 1,935,679 2005-06 94 2,083,454 2006-07 96 2,131,046 Source: ABS 2008
3.3 Natural gas
Natural gas is a major input into the production of nitrogenous fertilizers. The price of
nitrogenous fertilizers is now very much linked to prices in energy markets especially for
natural gas.
Inputs into the production of nitrogenous fertilizers such as the plant, equipment and
materials are internationally traded with the exception of natural gas on the eastern seaboard
of Australia. With the development of a coal seam methane liquefied natural gas (LNG)
industry and terminal in Queensland, the price of natural gas will be set at the international
export price. Currently the international export price for LNG from all LNG export terminals
in the world is higher than the long-term contract prices that have prevailed for natural gas on
the eastern seaboard. Natural gas prices have been able to be lower than export prices in this
market because it is what is known in economic terms as a non-traded industry. This does not
mean that there is no commercial trading but that there has been no international trading from
this market either importing or exporting. Prices were therefore set by domestic demand and
supply conditions. The recent growth in the world's LNG industry and its likely establishment
on the eastern seaboard will bring international prices to this important input to the fertilizer
industry.
Helping to off- set this likely rise in prices for this important input, is the recent technological
development, primarily in the United States, allowing the fracturing of rocks and the capture
of large amounts of gas from these rocks which previously was not available for production.
This technological development has helped lead to a major surge in production of natural gas
in North America and its further likely development and implementation in many other
countries, including Australia, where the prospective basins and rock seams are accessible.
19
The gas production response from this technology could be very significant and widespread
even though its implementation has been occurring only relatively recently.
3.4 Fertilizer industry downstream contribution
The transport task
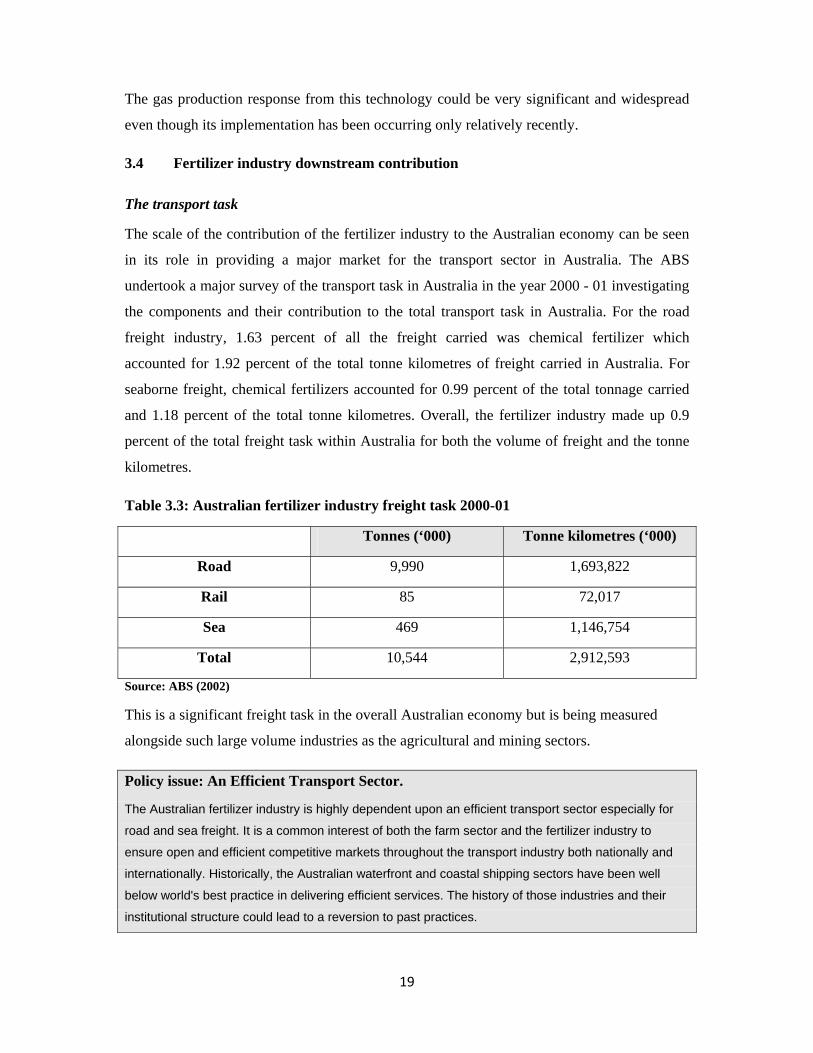
The scale of the contribution of the fertilizer industry to the Australian economy can be seen
in its role in providing a major market for the transport sector in Australia. The ABS
undertook a major survey of the transport task in Australia in the year 2000 - 01 investigating
the components and their contribution to the total transport task in Australia. For the road
freight industry, 1.63 percent of all the freight carried was chemical fertilizer which
accounted for 1.92 percent of the total tonne kilometres of freight carried in Australia. For
seaborne freight, chemical fertilizers accounted for 0.99 percent of the total tonnage carried
and 1.18 percent of the total tonne kilometres. Overall, the fertilizer industry made up 0.9
percent of the total freight task within Australia for both the volume of freight and the tonne
kilometres.
Table 3.3: Australian fertilizer industry freight task 2000-01
Tonnes (‘000) Tonne kilometres (‘000)
Road 9,990 1,693,822
Rail 85 72,017
Sea 469 1,146,754
Total 10,544 2,912,593
Source: ABS (2002)
This is a significant freight task in the overall Australian economy but is being measured
alongside such large volume industries as the agricultural and mining sectors.
Policy issue: An Efficient Transport Sector.
The Australian fertilizer industry is highly dependent upon an efficient transport sector especially for
road and sea freight. It is a common interest of both the farm sector and the fertilizer industry to
ensure open and efficient competitive markets throughout the transport industry both nationally and
internationally. Historically, the Australian waterfront and coastal shipping sectors have been well
below world's best practice in delivering efficient services. The history of those industries and their
institutional structure could lead to a reversion to past practices.

20
3.5 Distribution services
The fertilizer industry provides its product throughout Australia's agricultural lands. To
ensure availability and efficient delivery of product to farmers most major country towns
have fertilizer depots to provide local storage and services. These depots are in many cases
integral components of businesses that also provide other agricultural services. The provision
of fertilizer products is an incremental service in the suite of services provided to farmers and
makes a contribution to the overall profitability of the local agricultural service provider.
Spreading services are undertaken by farmers themselves or by specialist contractors. There
are estimated to be over 1000 specialised spreading vehicles used by contractors providing
this service for farmers.
3.6 Fertilizer consumption
Table 2.3 outlines details of fertilizer consumption in Australia for the major products and
elements. The most noticeable characteristic is the high degree of variability in consumption
between years. Over the period the trend lines for consumption of the different fertilizers are
all on the rise but with major downturns in consumption occurring regularly. Nitrogen
consumption over the long term has tended to increase but over the most recent decade there
has been a minor downward trend due primarily to the poor seasonal conditions. Demand for
other fertilizers has also fallen.

21
Table 3.4: Fertilizer consumption in Australia: by product and element
N (t) P (t P2O5) K (t K2O) P K kt kt kt kt kt
1983 258 741 127 326 105 1984 305 764 141 336 117 1985 344 684 141 301 117 1986 340 727 130 320 108 1987 333 873 136 384 113 1988 363 843 147 371 122 1989 393 791 160 348 133 1990 440 580 163 255 135 1991 439 580 146 255 121 1992 462 680 142 299 118 1993 488 802 146 353 121 1994 548 791 172 348 143 1995 565 950 201 418 167 1996 671 977 219 430 182 1997 825 1,016 196 447 163 1998 839 1,148 249 505 207 1999 941 1,059 223 466 185 2000 1,099 1,034 207 455 172 2001 1,002 1,098 202 483 168 2002 972 1,068 216 470 179 2003 933 1,011 220 445 183 2004 1,056 1,107 259 487 215 2005 1,009 1,034 222 455 184 2006 858 984 224 433 186 2007 848 982 227 432 189 2008 835 818 214 360 177 2009 850 642 157 282 130
Source: FIFA
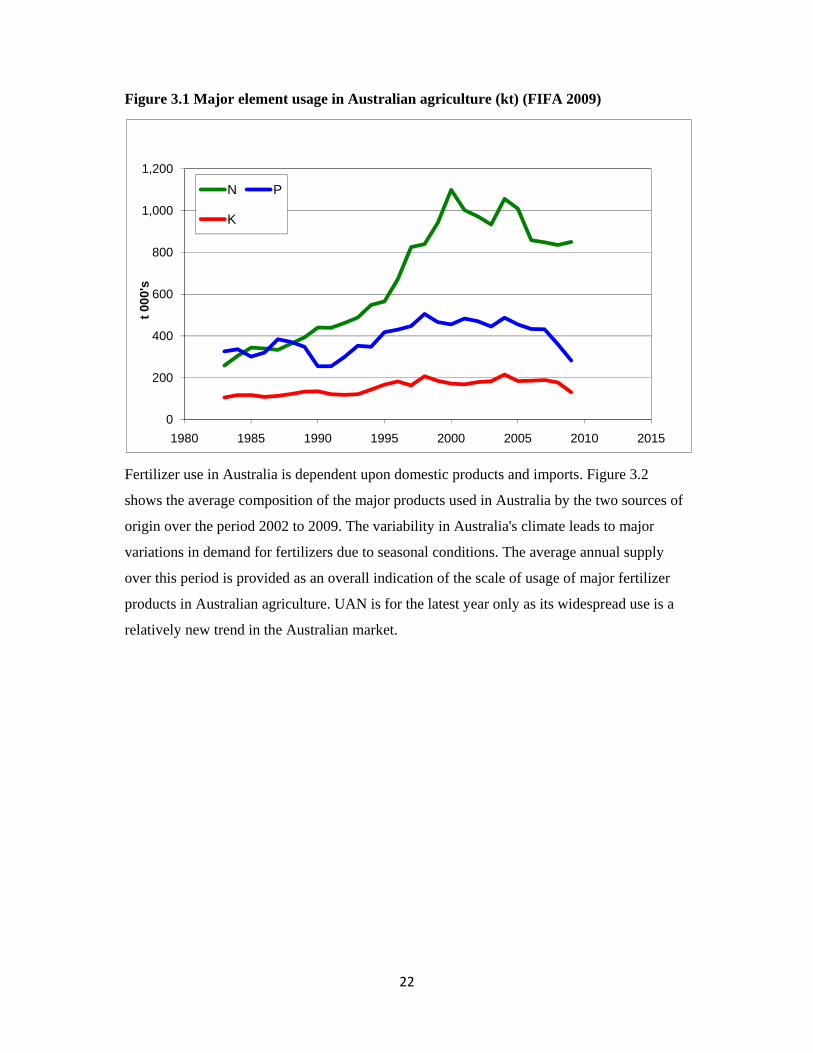
The overall pattern of the consumption of the different elements in Australian agriculture is
presented in Figure 3.1.
22
Figure 3.1 Major element usage in Australian agriculture (kt) (FIFA 2009)
Fertilizer use in Australia is dependent upon domestic products and imports. Figure 3.2
shows the average composition of the major products used in Australia by the two sources of
origin over the period 2002 to 2009. The variability in Australia's climate leads to major
variations in demand for fertilizers due to seasonal conditions. The average annual supply
over this period is provided as an overall indication of the scale of usage of major fertilizer
products in Australian agriculture. UAN is for the latest year only as its widespread use is a
relatively new trend in the Australian market.
0
200
400
600
800
1,000
1,200
1980 1985 1990 1995 2000 2005 2010 2015
t 000
's
N P
K

23
Figure 3.2: Major products by origin (t) (FIFA 2009)
Apart from the major elements there are secondary elements required to ensure effective
plant growth Calcium and magnesium deficiencies can occur on some soil types and are
remedied by the application of lime, dolomite or gypsum. Sulphur deficiencies are more
widespread. Single superphosphate has been the most common fertilizer used to supply
sulphur to pastures although more recently very fine elemental sulphur coated on high
analysis phosphorus products has become a common alternative. Sulphate of ammonia is also
used in situations where nitrogen is also required.
Gypsum supplies sulphur and calcium, lime provides calcium and dolomite provides calcium
and magnesium. Lime and dolomite also act to neutralise soil acidity whilst gypsum provides
soluble calcium useful in improving soil structure in sodic soils.
3.7 Trace elements
The trace nutrients necessary for plant growth are boron, cobalt, copper, manganese,
molybdenum and zinc but only in very small quantities. Soil and plant tests can show the
deficiencies in these trace elements and the industry can blend the appropriate product to
make up for the identified deficiencies in the soils of particular paddocks and farms. As an
0
200000
400000
600000
800000
1000000
1200000
1400000
Imported Domestic

24
indication of the trace nature of the elements, in 2009 the total amount distributed of all these
elements in fertilizer compounds added up to only 9500 tonnes of the over 1.5 million tonnes
of fertilizer elements used in Australia that year.
Table 3.5: Trace element usage: Australia (t)
Element 2009 Average usage 2002 - 09 Boron (B) 135 1,667
Cobalt (Co) 0 11
Copper (Cu) 438 1,491
Manganese (Mn) 655 1,165
Molybdenum (Mo) 9 54
Zinc (Zn) 2,247 5,071
Source: FIFA
Trace element requirements can be determined through soil and plant tests and from typical
outward symptoms on plants suffering from trace element deficiency.
25
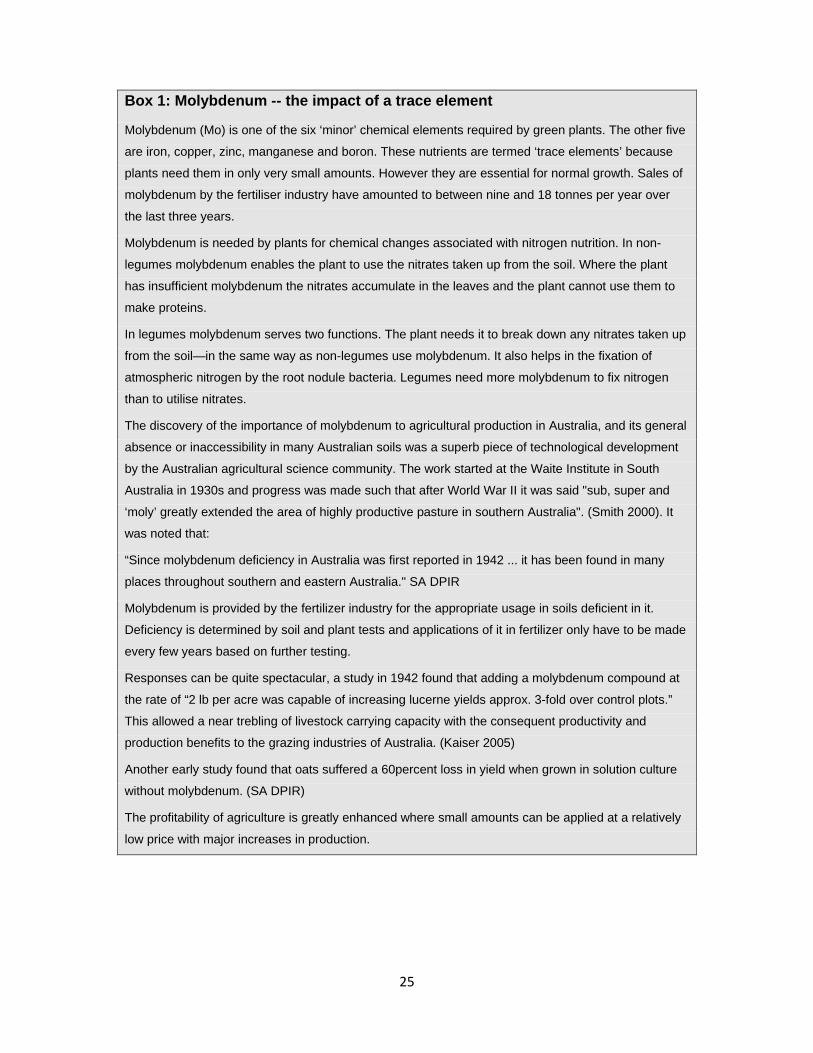
Box 1: Molybdenum -- the impact of a trace element
Molybdenum (Mo) is one of the six ‘minor’ chemical elements required by green plants. The other five
are iron, copper, zinc, manganese and boron. These nutrients are termed ‘trace elements’ because
plants need them in only very small amounts. However they are essential for normal growth. Sales of
molybdenum by the fertiliser industry have amounted to between nine and 18 tonnes per year over
the last three years.
Molybdenum is needed by plants for chemical changes associated with nitrogen nutrition. In non-
legumes molybdenum enables the plant to use the nitrates taken up from the soil. Where the plant
has insufficient molybdenum the nitrates accumulate in the leaves and the plant cannot use them to
make proteins.
In legumes molybdenum serves two functions. The plant needs it to break down any nitrates taken up
from the soil—in the same way as non-legumes use molybdenum. It also helps in the fixation of
atmospheric nitrogen by the root nodule bacteria. Legumes need more molybdenum to fix nitrogen
than to utilise nitrates.
The discovery of the importance of molybdenum to agricultural production in Australia, and its general
absence or inaccessibility in many Australian soils was a superb piece of technological development
by the Australian agricultural science community. The work started at the Waite Institute in South
Australia in 1930s and progress was made such that after World War II it was said "sub, super and
‘moly’ greatly extended the area of highly productive pasture in southern Australia". (Smith 2000). It
was noted that:
“Since molybdenum deficiency in Australia was first reported in 1942 ... it has been found in many
places throughout southern and eastern Australia." SA DPIR
Molybdenum is provided by the fertilizer industry for the appropriate usage in soils deficient in it.
Deficiency is determined by soil and plant tests and applications of it in fertilizer only have to be made
every few years based on further testing.
Responses can be quite spectacular, a study in 1942 found that adding a molybdenum compound at
the rate of “2 lb per acre was capable of increasing lucerne yields approx. 3-fold over control plots.”
This allowed a near trebling of livestock carrying capacity with the consequent productivity and
production benefits to the grazing industries of Australia. (Kaiser 2005)
Another early study found that oats suffered a 60percent loss in yield when grown in solution culture
without molybdenum. (SA DPIR)
The profitability of agriculture is greatly enhanced where small amounts can be applied at a relatively
low price with major increases in production.
26
3.8 Domestic fertilizer suppliers
To get fertilizers from a port or factory to the end user requires an extensive supply chain.
Distributors source fertilizer products from either domestic manufacturers or directly from
international suppliers. Many distributors also value add the final product by blending,
mixing and coating of finished fertilizer products to suit the specific requirements of
individual farmer orders. This allows farmers to match applications to expected crop and soil
conditions and application strategies.
Fertilizer agents and dealers receive their supplies from the distributors and are involved in
the day-to-day sales of fertilizer to end users. Agents and dealers also value added services by
providing a range of complimentary products, advice and services like finance and spreading
services.
There are a range of marketing models with some companies involved in only one part of the
supply chain and some filling all the links from manufacture to end user.
Following is a list of the major fertilizer suppliers in Australia though there are other
independents that will import and distribute from time to time.
• Impact Fertilizers • Incitec Pivot • Hi Fert • Viterra • Grow Force (Ruralco) • Megafert • Summit Fertilizers • Superfert • Whitfert • Ravensdown • CSBP • Landmark • Elders
Recent market entrants include large international firms Koch and Weng-fu.
Many of the companies operate simultaneously through the different levels of the industry.
Manufacturers may import product as well as distribute and retail. However a large part of
the retail market is made up of small independent businesses.
27
This should be recognised as a strong signal that the domestic market is highly competitive,
as the different firms can compete throughout the value chain offering services that meet their
customer requirements and their corporate knowledge. With minimal barriers to imports,
domestic producers have little market power to raise prices above world prices. The number
of companies involved in the different levels of the fertilizer value adding chain ensures that
there are multiple competitive pressures to deliver efficient services at competitive prices.
None of the distributors or retailers has market shares that would allow them to exercise
market power. On the eastern seaboard of Australia the two largest distributors account for
approximately only one quarter of total fertilizer sales.
Apart from the manufacturing plants, the port facilities for imports and the transport services
used for both, there are significant other value adding activities in the fertilizer industry
chain. These activities include marketing activities such as agronomic advice, blending and
on-farm spreading services. This last service is often undertaken by specialist contractors,
rather than by farmers. This allows greater specialization in equipment which helps to deliver
productivity improvements to the farm sector.
The provision of agronomic advice by the fertilizer industry and other private sector
organisations is becoming much more important with the gradual, or in some cases already
complete, withdrawal of State Government Departments of Agriculture from the provision of
extension services. This withdrawal has been occurring since 1996 when the South Australian
government announced that it was going to withdraw from the provision of agricultural
extension advice, which includes advice on appropriate fertilizer usage and applications.
Other states have followed the South Australian precedent at varying degrees of speed. The
reduction in State Government extension services has become a major policy issue being
investigated as part of the current Productivity Commission Inquiry into the Rural Research
and Development Corporations. It has been raised as an issue in a number of submissions to
the Inquiry. As noted by the multi-industry submission (which included industry
organisations representing the majority of Australian agricultural production):
"State government agencies previously had a major role in rural extension, this is changing quickly as the States reduce rural sector funding and personnel." And the implications for this are: "The rural extension system plays a critical role in encouraging the adoption of new technologies, and is therefore a fundamental element in terms of the success of a national
28
rural R&D system. The withdrawal or downscaling of rural extension services by State Governments will impact on adoption rates and ultimately productivity growth in the rural sector ..." (PC submission 2010) This traditional service provided by state governments to farmers is expected to continue to
decline. This service is still needed by farmers and is now being provided by other sources
such as the fertilizer industry and private consultants.
As a guide to the level of investment by the industry in providing advisory services, almost
1000 people have completed the Fertcare training program for advisors with nearly 2500
trained across all levels of the program which includes training for sales and logistics staff as
well as advisors.
3.9 International trade
The Australian fertilizer industry is an importing and exporting industry, primarily of
nitrogenous fertilizers and ammonium phosphates. However, all potassium-based fertilizers
and some other products such as triple superphosphate are all imported. Australia lacks any
operating mines of the feedstock to make potassium-based fertilizers.
Australia also imports rock phosphate, which is used to manufacture single superphosphate.
The Australian fertilizer industry has reduced the dependence upon imports of manufactured
products through increasing production and consequent exports of nitrogen fertilizers and
ammonium phosphates. The increase of production and consequent exports in the off-season
for Australian fertilizer demand has reduced the net imports required of these fertilizers and
thus helped ensure a better security of supply in case of potentially adverse impacts on
security of supply due to actions by overseas producers or Governments.
Details of the trade position for all the major chemical fertilizers are provided in Table 3.6.

29
Table 3.6: Net trade in fertilizer products
Imports Exports Net exports
TSP DAP MAP Ammonium fertilizers
K
Nitrogenfertilizer
MAP/ DAP
Nitrogen fertilizer
MAP/ DAP
Sulphate Nitrate Urea kt kt kt kt kt kt kt kt kt kt kt
2003-04 163.5 211.6 740.5 8.3 8.3 1, 156.6 447.0 135.7 264.6 1, 083.0 687.62004-05 231.8 286.7 926.3 4.9 4.9 1, 288.6 496.7 205.5 313.5 1, 263.3 899.52005-06 310.3 202.5 528.2 8.8 8.8 1, 056.1 403.7 186.6 312.3 1, 013.9 418.42006-07 165.6 83.0 443.1 8.6 8.6 794.6 306.1 269.4 154.9 633.1 371.32007-08 106.8 312.8 582.5 10.4 10.4 1, 032.5 465.0 310.8 237.0 835.2 658.42008-09 107.3 214.0 455.3 78.7 78.7 884.8 331.2 398.6 480.8 714.3 188.5Source: ABARE
30
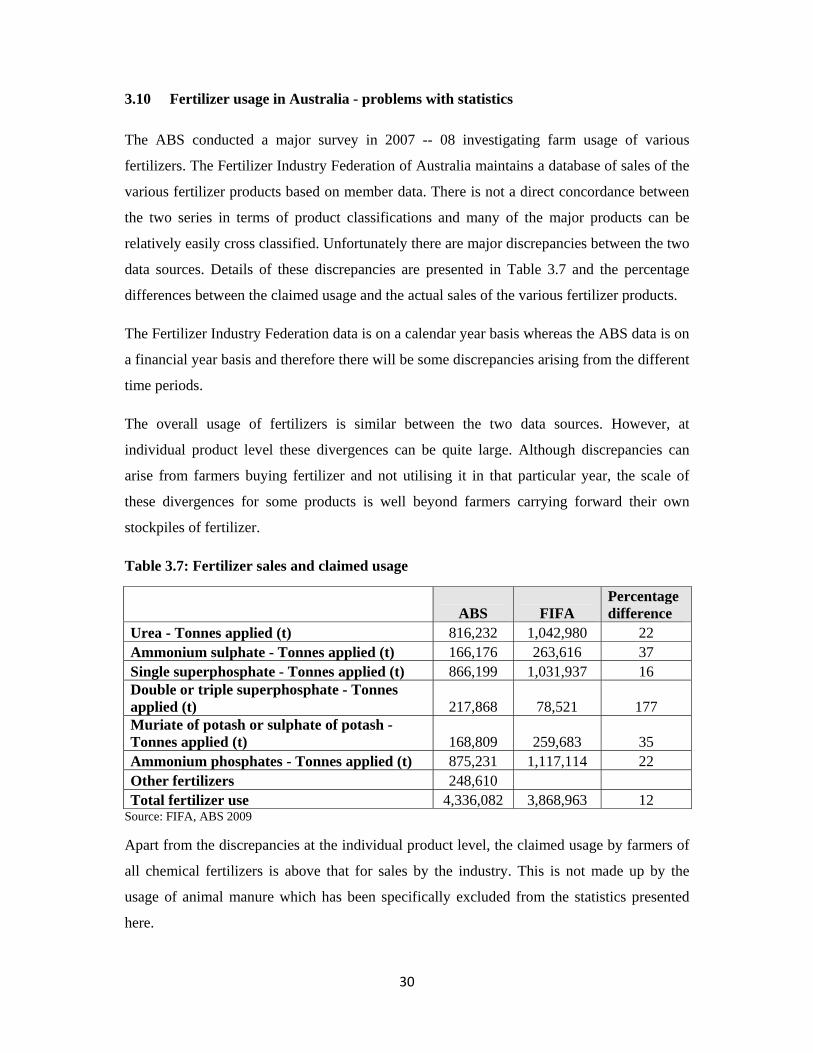
3.10 Fertilizer usage in Australia - problems with statistics
The ABS conducted a major survey in 2007 -- 08 investigating farm usage of various
fertilizers. The Fertilizer Industry Federation of Australia maintains a database of sales of the
various fertilizer products based on member data. There is not a direct concordance between
the two series in terms of product classifications and many of the major products can be
relatively easily cross classified. Unfortunately there are major discrepancies between the two
data sources. Details of these discrepancies are presented in Table 3.7 and the percentage
differences between the claimed usage and the actual sales of the various fertilizer products.
The Fertilizer Industry Federation data is on a calendar year basis whereas the ABS data is on
a financial year basis and therefore there will be some discrepancies arising from the different
time periods.
The overall usage of fertilizers is similar between the two data sources. However, at
individual product level these divergences can be quite large. Although discrepancies can
arise from farmers buying fertilizer and not utilising it in that particular year, the scale of
these divergences for some products is well beyond farmers carrying forward their own
stockpiles of fertilizer.
Table 3.7: Fertilizer sales and claimed usage
ABS FIFA Percentage difference
Urea - Tonnes applied (t) 816,232 1,042,980 22 Ammonium sulphate - Tonnes applied (t) 166,176 263,616 37 Single superphosphate - Tonnes applied (t) 866,199 1,031,937 16 Double or triple superphosphate - Tonnes applied (t) 217,868 78,521 177 Muriate of potash or sulphate of potash - Tonnes applied (t) 168,809 259,683 35 Ammonium phosphates - Tonnes applied (t) 875,231 1,117,114 22 Other fertilizers 248,610 Total fertilizer use 4,336,082 3,868,963 12
Source: FIFA, ABS 2009
Apart from the discrepancies at the individual product level, the claimed usage by farmers of
all chemical fertilizers is above that for sales by the industry. This is not made up by the
usage of animal manure which has been specifically excluded from the statistics presented
here.

31
The only issue to note from these discrepancies is to always be aware of the differences that
people claim and the actual hard data of physical sales.
Policy issue: the divergence between the different statistical sources and the inaccuracies from the
farm survey information could lead to public and policy misconceptions of the actual state of affairs
and possible outcomes from alternative policy proposals.

32
Box 2: Manure as a fertilizer resource
According to the ABS Land Management and Farming Survey for 2007-08, there was
2,286,388 tonnes of animal manure used as a fertilizer by the agricultural sector. This is in
comparison to the 3.8 million tonnes of chemical fertilizer used in the same year. The
contribution to soil nutrients is greatly overstated if tonnages alone are used as the
appropriate measure. There are differing measures of the amount of nitrogen provided per
tonne of manure but as an indication of the scale of the contribution, there are studies
showing that animal manure provides between seven and 30 kg of nitrogen per tonne of
manure used. There are similar divergences in range for phosphorus and potassium content
in dry manure. Estimates of the elemental composition of manures vary according to types
of manure and the different types of feed the livestock are on. However they are all within
the same order of magnitude. The analysis in Figure 3.3 is based upon attributing 24 kg of
nitrogen, 7.5 kg of phosphorus and 26 kg of potassium per tonne of dry manure. Even
though over 2,000,000 tonnes of manure were dispersed on Australian soils according to
the ABS survey, their contribution to the overall nutrient supply in Australian agriculture
is still minor.
Figure 3.3: Nutrients from animal manures compared to chemical fertilizers (t)
This is not to dispute the valuable contribution made by recycling animal wastes back into
the soil to reduce the need for additional chemical fertilizer but its contribution must be
kept in perspective in terms of providing the additional agricultural crop output necessary
to maintain required food production.
0
100000
200000
300000
400000
500000
600000
700000
800000
900000
N P K
Manure nutrients Chemical fertilizer nutrients

33

34
Chapter 4: The contribution of fertilizer to agricultural productivity
The productivity enhancements in agriculture have come from a combination of factors
working together. For example, better varieties of crops that are more disease resistant or
efficient, combined with better chemicals that target specific pests, and more advanced
machinery ensuring better applications of the technologies that are available. It is difficult to
separate any one aspect from the other factors because they are usually adopted together and
deliver a combined productivity effect.
As fertilizers provide the basic building blocks of plant growth and yield, any increase in
yield potential is likely to require increased fertilizer to reach full expression.
There are a number of tools that have been developed to help the farmers maximise profitable
production while minimising input costs and potential external environmental costs from
fertilizer usage such as loss of nutrients in water run-off.
4.1 Fertilizer use modelling
In determining the appropriate amount of fertilizer to apply to farms there are a number of
models to assist in decision-making to ensure the most efficient use of fertilizers for the target
production levels. These models have been used in Australia for many years, however they
are becoming more capable of incorporating more and better quality information to ensure
more informed decision making on all aspects of fertilizer usage. As an example the variables
that are utilised in some of these decision-making models are provided below. The values for
these variables are an input into the model to minimise fertilizer losses from the farm and
maximising their use efficiency. As can be noted from the number and type of variables the
models are becoming very sophisticated. The variables used in the Farm Nutrient Loss Index
model from the Victorian Department of Primary Industries include:
• surplus water
• soil profile
• slope
• land shape
35
• waterlogged area
• run-off modifiers
• proximity to waterway
• groundcover
• pasture type
• timing of fertilizer application
• rate of fertilizer application
• stocking rate
• groundcover
• soil test
This information can be used by the farmer, often working with an advisor, to help determine
the most appropriate fertilizer treatments, taking account of specific characteristics unique to
that farm.
The fertilizer industry is also delivering these specific skills and information through their
Fertcare program. Fertcare lifts the skills and knowledge of everyone involved in the supply
of fertilizer and soil products. The program is designed to ensure that high quality advice is
provided to users of fertilizers to allow them to maximise productivity and minimise
environmental and food safety risks.
This technological development has helped ensure the fertilizer industry contributes to
productivity improvements in the agricultural sector with minimal environmental
consequences.
4.2 Soil testing
The efficiency of fertilizer usage has been greatly improved by developments in soil and
plant testing which allow the targeting of specific amounts of various elements; both major
nutrients and trace elements. This improves the efficiency of usage of fertilizers and
minimizes any consequential environmental effects from overusage.
Many farmers at the forefront of this technology are now doing within paddock testing and
within paddock distribution of fertilizer. Unfortunately there are still a large number of
36
farmers to take up this productivity enhancing development. As demonstrated in the ABS
survey the numbers of farmers using these technologies are a minority.
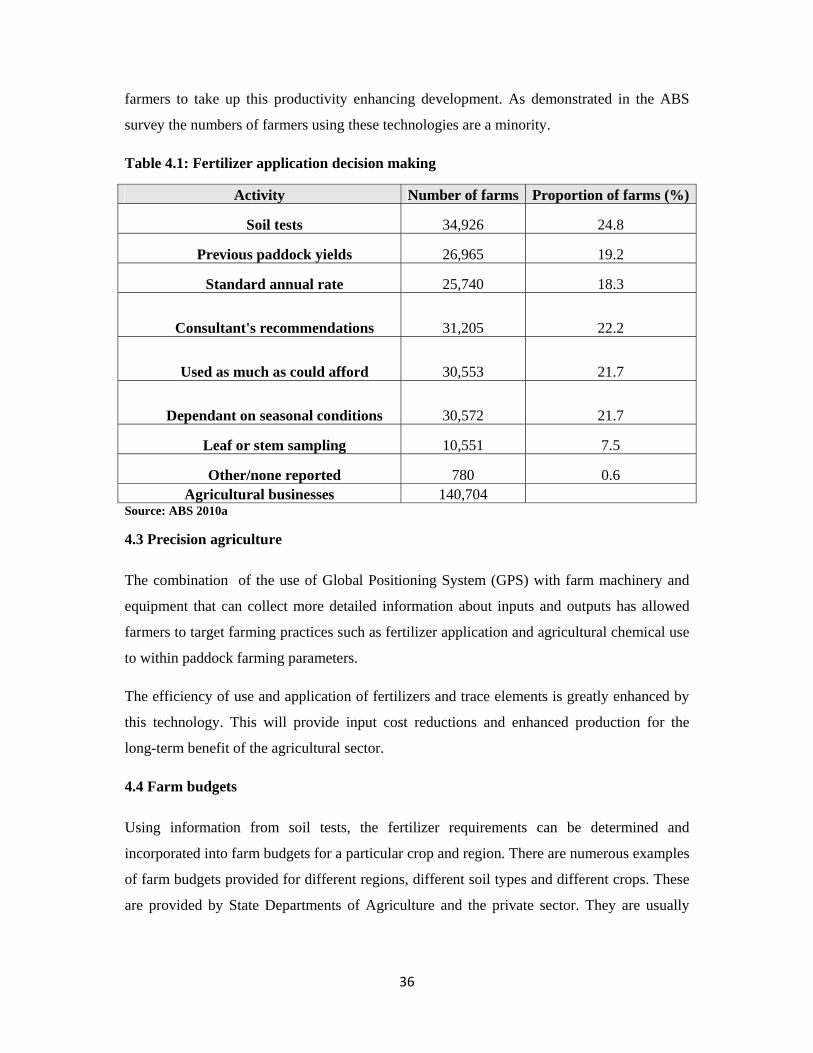
Table 4.1: Fertilizer application decision making
Activity Number of farms Proportion of farms (%)
Soil tests 34,926 24.8
Previous paddock yields 26,965 19.2
Standard annual rate 25,740 18.3
Consultant's recommendations 31,205 22.2
Used as much as could afford 30,553 21.7
Dependant on seasonal conditions 30,572 21.7
Leaf or stem sampling 10,551 7.5
Other/none reported 780 0.6 Agricultural businesses 140,704
Source: ABS 2010a
4.3 Precision agriculture
The combination of the use of Global Positioning System (GPS) with farm machinery and
equipment that can collect more detailed information about inputs and outputs has allowed
farmers to target farming practices such as fertilizer application and agricultural chemical use
to within paddock farming parameters.
The efficiency of use and application of fertilizers and trace elements is greatly enhanced by
this technology. This will provide input cost reductions and enhanced production for the
long-term benefit of the agricultural sector.
4.4 Farm budgets
Using information from soil tests, the fertilizer requirements can be determined and
incorporated into farm budgets for a particular crop and region. There are numerous examples
of farm budgets provided for different regions, different soil types and different crops. These
are provided by State Departments of Agriculture and the private sector. They are usually
37
updated regularly. They are comprehensive and detailed tools to provide baseline gross
margins analyses for different potential yields and prices.
Farm budgets by their nature relate the likely production outcomes with the costs and
potential price benefits. Dealing with the uncertainties of the climate is still the major
management tasks of the farmer.
The provision of this information from the models, soil testing and farm budgets help ensure
the most efficient use of fertilizers for the prevailing market circumstances. It means that the
farmers, the customers of the fertilizer industry, have more information and analyses
available to help in decision-making every year. Climatic conditions are still the great
unknown but nearly all other aspects of the decision-making process in farming are informed
by increasingly sophisticated information.
Increasing the penetration rates of use amongst farmers for existing technologies such as soil
testing and precision agriculture can help lift the average productivity of the farm sector in
the medium term. However, it will require new technologies to lift the future productivity
growth rate of the sector.
4.5 Measuring the contribution of the fertilizer sector to agricultural productivity
The need for fertilizers
Every crop and pasture grown in Australia removes nutrients from the soil. As has been
shown in our history many of these nutrients are not readily available in our soils. The
addition of these nutrients through fertilizer application has enabled the productivity
revolution in Australian agriculture, starting with the addition of superphosphate and trace
elements such as molybdenum. The foods we eat or grasses we feed to our livestock all take
nutrients out of our soil system that have to be replaced. Examples of the composition of
elements in some of our crops that are removed for our benefit are provided in Table 4.2. The
examples are indicative and are in kilograms per tonne of dry matter.

38
Table 4.2: Nutrient removal from soils by various crops (kg per tonne of dry matter)
Nitrogen Phosphorus Potassium Sulphur Calcium Magnesium
Oats 17.0 3.2 4.1 2.3 1.0 1.4
Wheat 22.0 3.8 4.7 2.2 0.4 1.6
Barley 18.0 3.8 4.8 1.7 0.6 1.5
Maize 15.0 2.8 3.6 1.2 0.2 1.6
Sorghum 21.0 3.2 3.9 1.8 0.4 1.4
Lucerne hay 35.0 2.3 17.4 2.0 13.3 1.3
Ryegrass hay 30.0 3.0 20.0 3.0 4.0 3.0
Maize silage 14.4 2.7 9.2 1.2 2.6 2.9
Lupins 51.5 3.0 8.1 2.3 2.2 1.6
Source: NSW DPI 2005
There have been a very large number of field trials conducted in Australia to assess the extent
of production improvements for various crops under a range of different levels of fertilizer
application, whether by type or amount. These field trials are conducted in a variety of
regions and soil types.
Widespread soil testing clearly shows that there is variation in soil fertility within paddocks
let alone between farms and regions. This variability in soil nutrient levels mean there is no
single measure that could be derived for the increase in production from the application of
fertilizer to Australian soils.
A number of field trials have been conducted using control treatments where there has been
no fertilizer application tested against other treatments with varying amounts of fertilizer
applied. These field trials provide a basis of determining what would happen to agricultural
production and productivity if there was no fertilizer applied.
If no fertilizer is applied there will be a gradual diminution back to the pre-fertilizer and
improved pasture nature of the Australian rural sector as the previously added nutrients are
mined by future agricultural production.
39
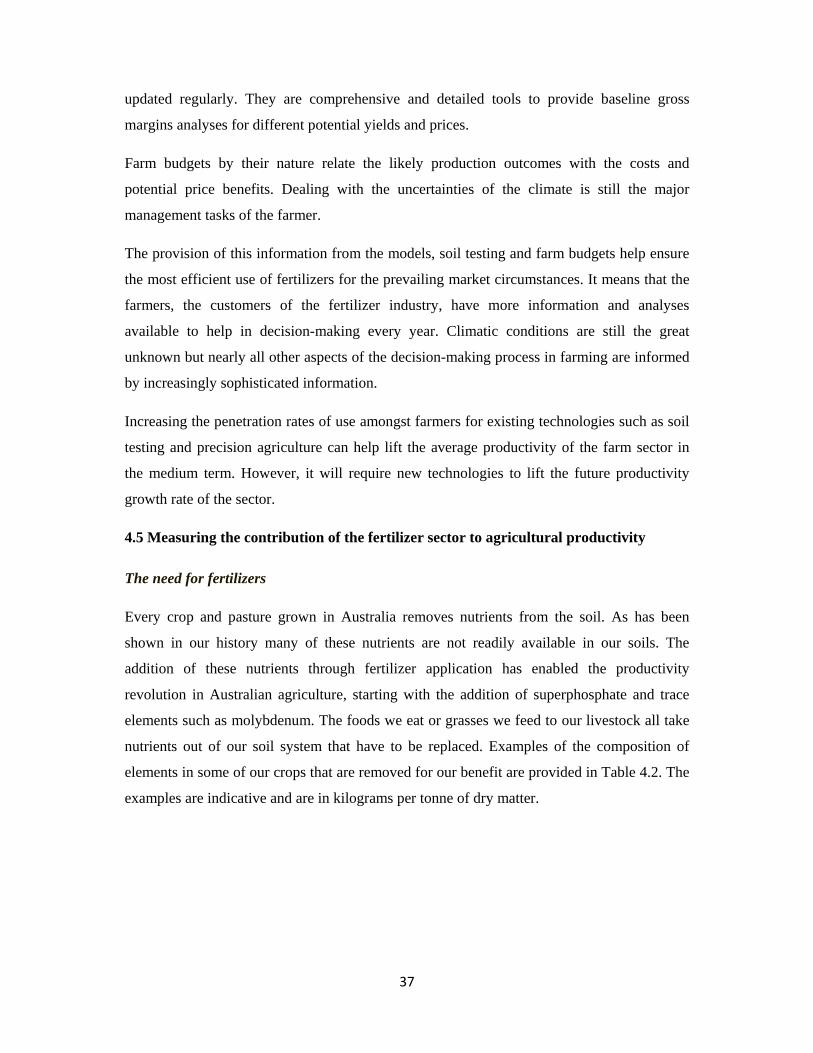
Table 4.3 presents a summary of the carrying capacities, in dry sheep equivalents, for field
trials comparing unimproved pastures with improved pastures and the application of
fertilizers. There is a great deal of variation in both the carrying capacities for unimproved
pastures and improved pastures by region.
The improved pastures require the addition of phosphorus fertilizer compared to the native
grasses that dominated before the introduction of species such as subterranean clover. The
improved species and fertilizers are crucial for raising the carrying capacity of our pasture
lands, outside the remote grazing areas of inland Australia. Without the combination of the
two technologies production from the grazing industries in the higher rainfall regions of
Australia of the coast, tablelands and slopes could well decline to only a third of their existing
level.
Table 4.3: Production comparisons on field trials with and without fertilizer for the pastoral industry
Location Unimproved pasture
Improved pasture+ fertilizer
Carrying Capacity- old
technology
DSE DSE %
Southern tablelands(NSW) 1 9 11 Northern tablelands(NSW) 3 10 30 Northern slopes(NSW) 2.1 10.3 20 Coastal (NSW) 4.5 19 24 Hunter(NSW) 3 15 20 Gloucester(NSW) 2.3 15 15 NSW 6.3 11.8 53 Bothwell 2.8 3.8 74 Pawtella 3.3 6 55 Nile 2.5 6 42 Average production 34 Source: NSW Agriculture (various), Tasmania DPIW (2006)
An analysis of field trials in the grains industry in a number of regions shows that without the
application of fertilizer there is an average reduction in production of around 20 percent.
These field trials were conducted in a variety of regions and for a variety of crops with some
having multi-year time spans.
40
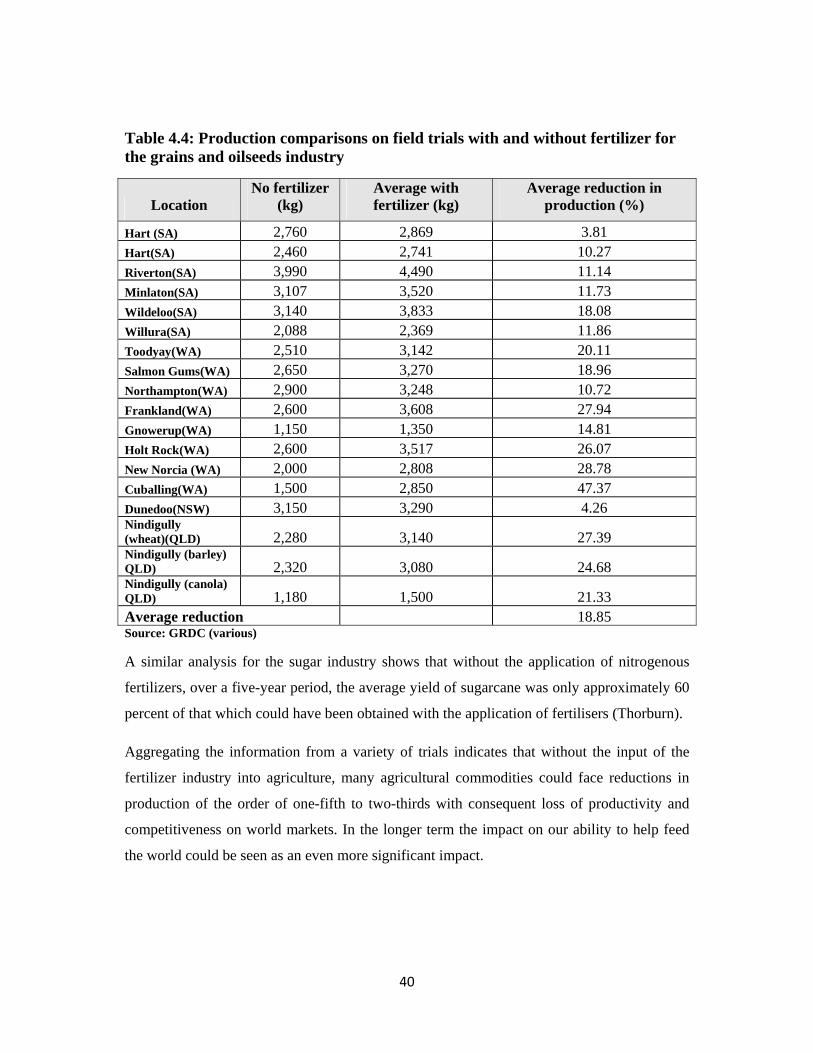
Table 4.4: Production comparisons on field trials with and without fertilizer for the grains and oilseeds industry
Location No fertilizer
(kg) Average with fertilizer (kg)
Average reduction in production (%)
Hart (SA) 2,760 2,869 3.81 Hart(SA) 2,460 2,741 10.27 Riverton(SA) 3,990 4,490 11.14 Minlaton(SA) 3,107 3,520 11.73 Wildeloo(SA) 3,140 3,833 18.08 Willura(SA) 2,088 2,369 11.86 Toodyay(WA) 2,510 3,142 20.11 Salmon Gums(WA) 2,650 3,270 18.96 Northampton(WA) 2,900 3,248 10.72 Frankland(WA) 2,600 3,608 27.94 Gnowerup(WA) 1,150 1,350 14.81 Holt Rock(WA) 2,600 3,517 26.07 New Norcia (WA) 2,000 2,808 28.78 Cuballing(WA) 1,500 2,850 47.37 Dunedoo(NSW) 3,150 3,290 4.26 Nindigully (wheat)(QLD) 2,280 3,140 27.39 Nindigully (barley) QLD) 2,320 3,080 24.68 Nindigully (canola) QLD) 1,180 1,500 21.33 Average reduction 18.85 Source: GRDC (various)
A similar analysis for the sugar industry shows that without the application of nitrogenous
fertilizers, over a five-year period, the average yield of sugarcane was only approximately 60
percent of that which could have been obtained with the application of fertilisers (Thorburn).
Aggregating the information from a variety of trials indicates that without the input of the
fertilizer industry into agriculture, many agricultural commodities could face reductions in
production of the order of one-fifth to two-thirds with consequent loss of productivity and
competitiveness on world markets. In the longer term the impact on our ability to help feed
the world could be seen as an even more significant impact.

41

42
Chapter 5: Productivity improvements in agriculture
Achieving major productivity improvements in agriculture will be essential to meeting the
increased production challenges of feeding the world's growing population. Without
significant growth in agricultural land, the production challenge becomes much greater and
will rely on further intensifying agriculture, primarily through greater use of inputs such as
fertilizers.
In an international context, the contribution of fertilizers to increasing agricultural
productivity has long been recognised. The Green Revolution in Asia delivered major
increases in food production to a significant proportion of the world population and helped
avert the threat of starvation that appeared to be looming. Fertilizer was one component along
with improved varieties and water usage in helping to more than double world cereal
production. Fertilizer was an essential component to ensure all other parts of the Revolution
delivered their potential.
As the US Department of Agriculture noted:
“Increased fertilizer use accounted for one-third of the growth in world cereal production in the 1970s and 1980s. Among developing regions, per hectare fertilizer consumption increased most rapidly in land-scarce areas (such as in Asia) and most slowly in Africa. Plant breeders have succeeded in developing crop varieties with high yields that will produce under particular pest pressures or environmental stresses. To obtain these benefits, however, investments in complementary crop management technologies such as irrigation or fertilizer use may be necessary. In countries with poor soils and climate, basic inputs such as fertilizer and water are more important than they are in countries that are better endowed.” USDA 2003 It is worthwhile reviewing where Australian agriculture has come from in the productivity
race to assess what has helped deliver the increased productivity and where we could possibly
be heading.
Australian agriculture has long been reliant upon technology and productivity improvements
to ensure its long-term viability. There have been many studies looking at the big picture of
agricultural productivity improvements in Australia. An analysis of those studies shows a
divergence between the analytical studies of the economists and the views of the farmers

43
actually delivering the productivity improvements. Probably the most notable omission from
the macro studies on agricultural productivity is any mention of fertilizer contributing to the
productivity improvements in Australian agriculture.
This neglect is in the economics literature but in the practical and agricultural understanding
of productivity, fertilizer usage is well understood.
Improvements in productivity in agriculture have always been a primary concern of
Australian farmers. Australia's long history as a pre-eminent agricultural export nation has
been based upon the long tradition of productivity improvements at least matching the long
term decline in the terms of trade. This farm level impact has generally been mirrored at a
macro level for the Australian economy over most of our history as import prices have tended
to rise at a faster rate than our export prices.
Productivity growth has been attributed to changes at the farm level such as structural
adjustment, adoption of improved technologies and techniques, better management practices,
reduced use of inputs because of greater efficiency improvements and economies of scale.
Off farm contributors to productivity have come from the microeconomic reforms undertaken
in the Australian economy, improvements in market access and technological developments
in other sectors of the economy.
There have been studies trying to determine the sources of productivity growth in Australian
agriculture. However none have come to a definitive conclusion on the relative contributions
of the different sources. The sources analysed included:
• Improvements in public infrastructure
• Improvements in the education levels of farmers
• Domestic research
• Adaptation of foreign research.
The productivity growth derived from research is generally accepted as the major driver for
these improvements. One study attributed almost half the value of agricultural output in 2003
to new technology generated by Australian research since 1953. (Mullen)
The definition and measures of productivity have been well established in the economic
literature. The standard definition of productivity is that it reflects the level of production of
44
outputs relative to the level of inputs used. The most common overall measure used is total
factor productivity. This measures total productivity by comparing a ratio of total outputs
relative to total inputs used in the production of that output.
Productivity trends are measured over time in terms of average annual growth in total factor
productivity. A high level of growth is sought after as it reflects either an increase in the level
of outputs relative to the resources used or alternatively a reduction in the use of those real
resources required to achieve a particular output level. There are also a number of other
productivity measures which are of a partial nature such as the measurement of outputs
relative to the amount of specific resources such as labour used in the creation of those
outputs. This is called labour productivity. It does not take account of changes in the amounts
of capital, for example, that are used in boosting the level of outputs.
There have been a large number of studies undertaken in Australia looking at changes in total
factor productivity for agriculture. Many of these have been undertaken using the databases
from ABARE farm surveys. Total factor productivity is usually measured over long time
spans as short term deviations in production and use of inputs can disguise the overall
improvements in productivity that are occurring over the long term. This is primarily because
of the impacts of varying climatic conditions on production between seasons.
This is not unique to the agricultural sector, as Treasury has noted that for the economy as a
whole, productivity growth varies over the business cycle. They recommend that care be
taken in choosing periods over which to average productivity growth to ensure that similar
parts of the business cycle are appropriately compared. The many productivity studies on
agriculture have differing time periods for their calculation of annual productivity growth and
are thus not generally directly comparable. However, they all tend to give similar trends and
relativities between the different agricultural industries over roughly similar timeframes.
Even before the development of detailed economic studies into measuring productivity, there
was considerable evidence of greatly enhanced partial productivity measures such as sheep
carrying capacity being utilised in Australian agriculture throughout much of our history.
Specific examples of productivity enhancing measures include the use of the stump jump
plough and the use of superphosphate and subterranean clover. These were widely adopted in
large parts of Australian agriculture and the various Departments of Agriculture measured the
major partial productivity improvements arising from the adoption of these technologies.

45
From the various studies on productivity in agriculture certain general trends can be
highlighted.
Productivity over the long term has generally managed to keep pace with the general decline
in the terms of trade or prices received versus prices paid by Australian farmers, as shown in
Figure 5.1. The terms of trade reflect the relative changes in prices of outputs compared to
inputs. As shown in the graph over the last three decades the relative prices of agricultural
products have been declining at an average rate of 1.6 percent per year. Improvements in the
productivity of agriculture, as measured by the total factor productivity improvements, have
been rising at a slightly lower rate of 1.4 percent per year.
Figure 5.1: Productivity changes in Australian agriculture compared to the changing terms of trade
There has been a great deal of variability in time periods and between different types of
enterprises on rates of productivity improvement. As shown in Table 5.1, the ABARE
analyses demonstrate that over the last decade there have been major decreases in
productivity in the broad acre industries of Australia with most of the decline driven by
reduced productivity levels in the cropping industries. In the previous two decades, the
cropping industries had rates of productivity improvement exceeding all other broad acre
industries and for the period 1979-80 to 1988-89, annual rates of productivity improvement
were nearly 5 percent per year.
46
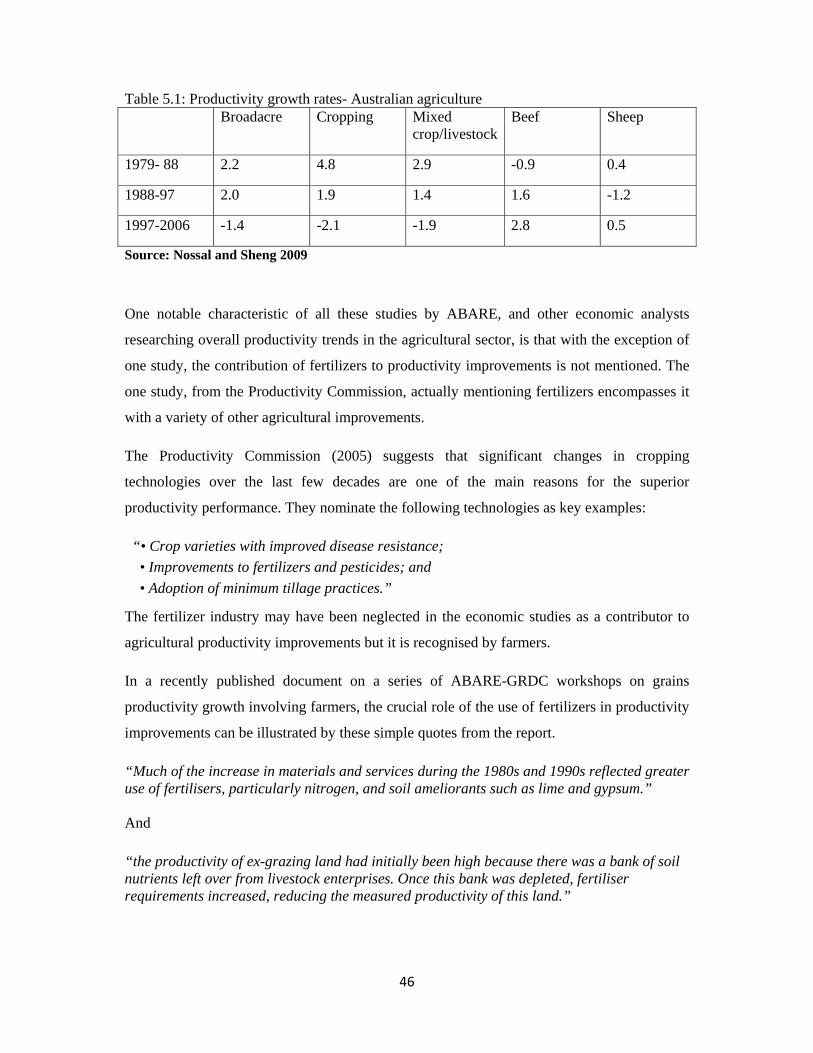
Table 5.1: Productivity growth rates- Australian agriculture Broadacre Cropping Mixed
crop/livestockBeef Sheep
1979- 88 2.2 4.8 2.9 -0.9 0.4
1988-97 2.0 1.9 1.4 1.6 -1.2
1997-2006 -1.4 -2.1 -1.9 2.8 0.5
Source: Nossal and Sheng 2009
One notable characteristic of all these studies by ABARE, and other economic analysts
researching overall productivity trends in the agricultural sector, is that with the exception of
one study, the contribution of fertilizers to productivity improvements is not mentioned. The
one study, from the Productivity Commission, actually mentioning fertilizers encompasses it
with a variety of other agricultural improvements.
The Productivity Commission (2005) suggests that significant changes in cropping
technologies over the last few decades are one of the main reasons for the superior
productivity performance. They nominate the following technologies as key examples:
“• Crop varieties with improved disease resistance; • Improvements to fertilizers and pesticides; and • Adoption of minimum tillage practices.”
The fertilizer industry may have been neglected in the economic studies as a contributor to
agricultural productivity improvements but it is recognised by farmers.
In a recently published document on a series of ABARE-GRDC workshops on grains
productivity growth involving farmers, the crucial role of the use of fertilizers in productivity
improvements can be illustrated by these simple quotes from the report.
“Much of the increase in materials and services during the 1980s and 1990s reflected greater use of fertilisers, particularly nitrogen, and soil ameliorants such as lime and gypsum.” And
“the productivity of ex-grazing land had initially been high because there was a bank of soil nutrients left over from livestock enterprises. Once this bank was depleted, fertiliser requirements increased, reducing the measured productivity of this land.”
47
All the workshops nominated greater use and efficiency of use of fertilizers as one of the
primary productivity drivers.
As noted in Table 5.1 there are now claims that indicators of productivity growth in the
agricultural sector have been slowing this century. For example, ABARE have estimated
productivity growth as 3.6 percent on average between 1989-90 and 1998-99 compared to a
negative trend whereby productivity growth rates have been falling at an average rate of 1.3
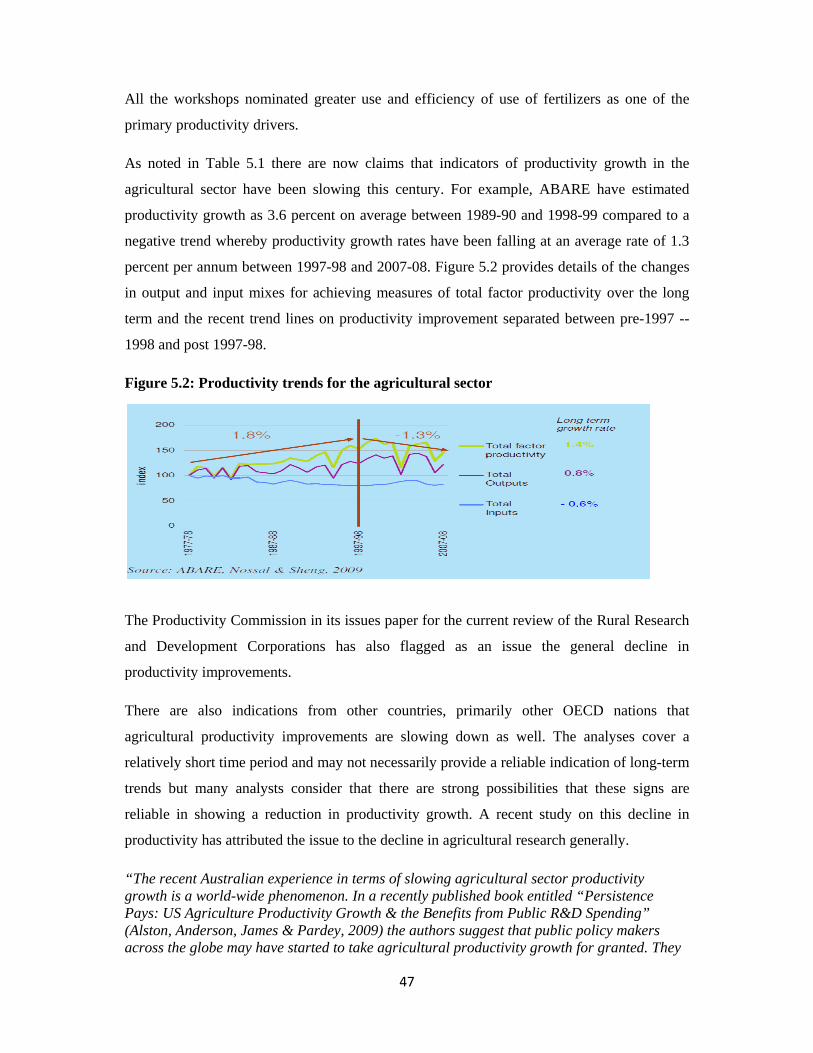
percent per annum between 1997-98 and 2007-08. Figure 5.2 provides details of the changes
in output and input mixes for achieving measures of total factor productivity over the long
term and the recent trend lines on productivity improvement separated between pre-1997 --
1998 and post 1997-98.
Figure 5.2: Productivity trends for the agricultural sector
The Productivity Commission in its issues paper for the current review of the Rural Research
and Development Corporations has also flagged as an issue the general decline in
productivity improvements.
There are also indications from other countries, primarily other OECD nations that
agricultural productivity improvements are slowing down as well. The analyses cover a
relatively short time period and may not necessarily provide a reliable indication of long-term
trends but many analysts consider that there are strong possibilities that these signs are
reliable in showing a reduction in productivity growth. A recent study on this decline in
productivity has attributed the issue to the decline in agricultural research generally.
“The recent Australian experience in terms of slowing agricultural sector productivity growth is a world-wide phenomenon. In a recently published book entitled “Persistence Pays: US Agriculture Productivity Growth & the Benefits from Public R&D Spending” (Alston, Anderson, James & Pardey, 2009) the authors suggest that public policy makers across the globe may have started to take agricultural productivity growth for granted. They

48
claim that worldwide growth in public agricultural investments has slowed and that given agricultural research takes time to generate benefits, public policy makers have become impatient in demanding more immediate outcomes.” (Brown)
However, if this trend should continue the dilemmas for world agriculture, let alone
Australian agriculture, become much more serious in providing the necessary agricultural
production to feed the growing world population.

49
50
Chapter 6: The Australian fertilizer industry in a world context
6.1 The price of fertilizers
When fertilizer prices spiked upwards dramatically in 2008, there were a series of complaints
and investigations into the competitive structure of the Australian fertilizer industry.
The ACCC undertook an investigation into the industry and concluded:
”The significant rises in fertiliser prices in Australia are mainly attributable to rapidly increasing global fertiliser prices. These increases have been caused by a substantial increase in world demand for fertilisers associated with an expansion in agricultural production (particularly grains for food, feed for livestock and bio-fuels) and by rises in costs of production associated with the increasing cost of energy. This is occurring in a market where the global supply capacity is limited in the short-to-medium term.”
and
“A number of interested parties who made submissions to the ACCC as part of this inquiry raised concerns about the way in which fertiliser markets in Australia operated during the period from late 2007 to early 2008. Much of the conduct that raised concerns was caused by a situation of deficiency in short-term supply associated with an unexpected bringing forward of demand by end users in the context of rapidly increasing world prices.”
However this did not put an end to the debate and the controversy, as a Senate Inquiry was
convened and it concluded:
“Increases in biofuel production has resulted in less arable land being available for other agricultural production, which in turn puts pressure on supply and prices for food products. In addition, as the world population increases more land must be allocated to housing, therefore reducing the amount of land available for crops. The increased demand for agricultural products is being met by increasing productivity, primarily through the use of fertiliser. Evidence to the inquiry suggested that the high degree of industry concentration enables key market players to heavily influence prices in this market. The committee considers that the ACCC report is flawed, especially in terms of providing a thoroughgoing analysis of the industry. The committee notes that while global increases in fertiliser prices have influenced, to some degree, domestic price increases, it also believes that industry concentration in Australia and
51
consequent market manipulation also play a part in explaining high fertiliser prices paid by Australian farmers.” After the various inquiries into the competitive nature of the Australian fertilizer industry,
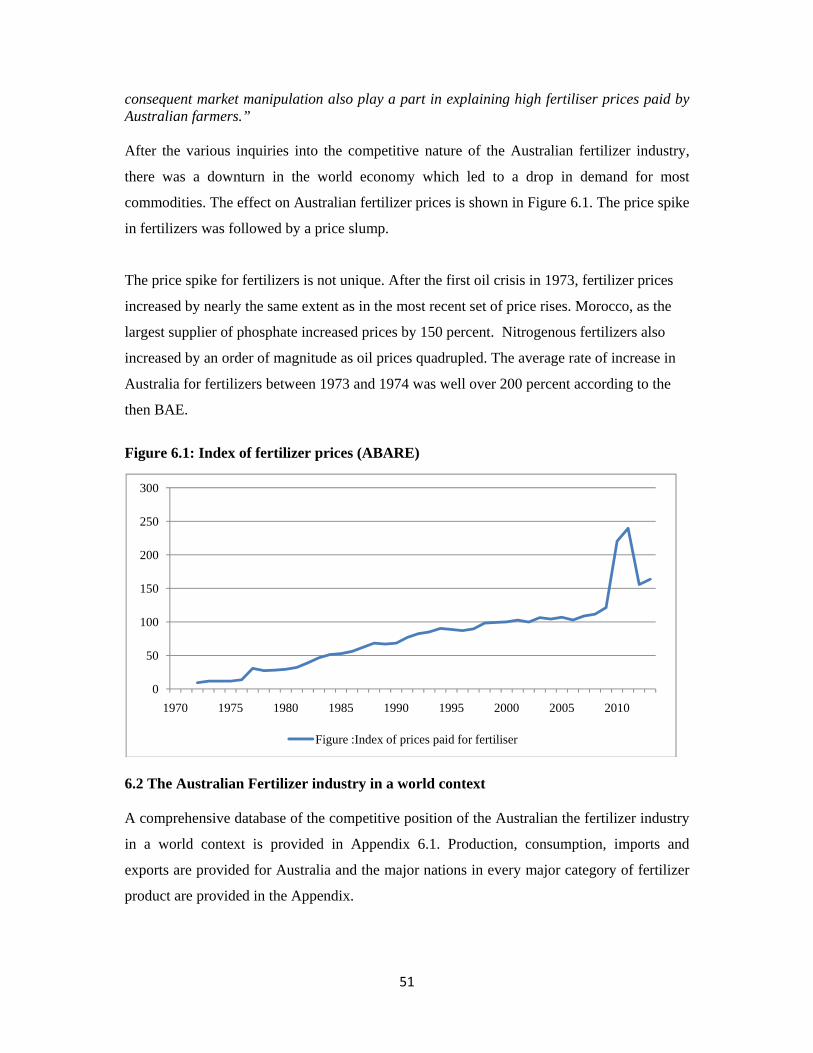
there was a downturn in the world economy which led to a drop in demand for most
commodities. The effect on Australian fertilizer prices is shown in Figure 6.1. The price spike
in fertilizers was followed by a price slump.
The price spike for fertilizers is not unique. After the first oil crisis in 1973, fertilizer prices
increased by nearly the same extent as in the most recent set of price rises. Morocco, as the
largest supplier of phosphate increased prices by 150 percent. Nitrogenous fertilizers also
increased by an order of magnitude as oil prices quadrupled. The average rate of increase in
Australia for fertilizers between 1973 and 1974 was well over 200 percent according to the
then BAE.
Figure 6.1: Index of fertilizer prices (ABARE)
6.2 The Australian Fertilizer industry in a world context A comprehensive database of the competitive position of the Australian the fertilizer industry
in a world context is provided in Appendix 6.1. Production, consumption, imports and
exports are provided for Australia and the major nations in every major category of fertilizer
product are provided in the Appendix.
0
50
100
150
200
250
300
1970 1975 1980 1985 1990 1995 2000 2005 2010
Figure :Index of prices paid for fertiliser
52
The top 10 nations in every category plus Australia, if it did not make the top 10, are
provided in the detailed product tables in the Appendix . For the purposes of this analysis, the
European Union is treated as one country as it allows free trade and free investment flows for
the industry amongst all the member nations of the union.
Table 6.1 provides a summary of Australia's production and consumption of the major
fertilizer products and their proportion compared to world production and consumption.
Some very simple observations to make from the analysis:
• Australia is generally a very small component of the world market for any of these
products. It only occasionally makes the top 10 of any of the nations in any category,
whether production or consumption. Except for ammonium nitrate, which is primarily
used in the Australian mining industry and not as a fertilizer, there is no fertilizer
product where Australian production exceeds 2.5 percent of world production.
• Even in the case of a product such as diammonium phosphate where we make the top
10 in imports, exports, production and consumption, the Australian industry is still a
small player compared to the major countries in each category. In production of DAP
Australia produces only 7 percent that of China, the major producer. In exports we
account for 8 percent of the level of exports from the USA, the major exporter. In
imports Australia is less than 9 percent of the imports of India and in consumption 5.5
percent of their consumption.
• In exports the only categories where we rank in the top 10 are for ammonium nitrate
and diammonium phosphate. Again, despite being in the top 10, Australia is very
much a small participant in the world market.
• Reflecting the seasonal demand surge for fertilizer in Australia, we also make the top
10 in imports of diammonium phosphate and for monammonium phosphate we come
in at number three. Other products where we make the top 10 in imports are for
phosphate rock and urea.
• For ammonia, where we rank number 18 in the world in production and consumption,
Australian production is only 2.6 percent of the production in China. Our
consumption level is only 28 percent of that in Indonesia, the number six producer
and consumer in the world.
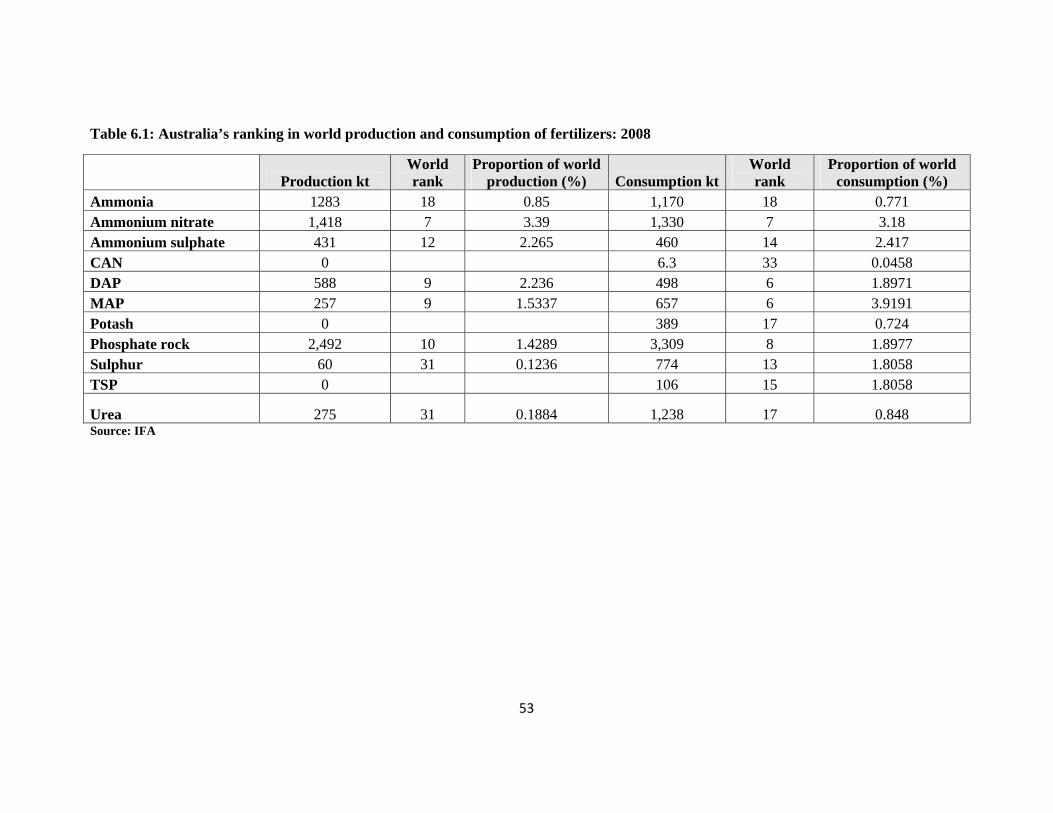
53
Table 6.1: Australia’s ranking in world production and consumption of fertilizers: 2008
Production kt World rank
Proportion of world production (%) Consumption kt
World rank
Proportion of world consumption (%)
Ammonia 1283 18 0.85 1,170 18 0.771 Ammonium nitrate 1,418 7 3.39 1,330 7 3.18 Ammonium sulphate 431 12 2.265 460 14 2.417 CAN 0 6.3 33 0.0458 DAP 588 9 2.236 498 6 1.8971 MAP 257 9 1.5337 657 6 3.9191 Potash 0 389 17 0.724 Phosphate rock 2,492 10 1.4289 3,309 8 1.8977 Sulphur 60 31 0.1236 774 13 1.8058 TSP 0 106 15 1.8058
Urea 275 31 0.1884 1,238 17 0.848 Source: IFA

54
• Our ammonium sulphate production is only 9.4 percent of European Union
production and our imports are the equivalent of only 2.5 percent of Russian exports,
the major exporter.
• Australia's monammoniumphosphate production is only 3.6 percent of China's and 6.4
percent of the US, the two largest producers. Yet for this fertilizer we rank number six
in the world in consumption and number nine in production.
• In phosphate rock our consumption is only 10 percent of that of the US the largest
consumer. Australia is the 10th largest producer but only produces 10 percent of that
of Morocco, the largest exporter.
• For sulphur, a fertilizer mainly imported, our consumption is the equivalent of only 9
percent of China's imports and just over 10 percent of European Union exports, the
largest exporter.
• In triple superphosphate, another entirely imported product, our consumption is only
6.3 percent of that of Brazil, the largest consumer.
• Our urea consumption is only 20 percent of that of India, the number five consumer in
the world.
• There is no potash fertilizer production in Australia and therefore all usage is
dependent upon imports. In this category Australia still only ranks number 12 in the
world as an importer and number 17 as a consumer. Our imports are only 2.4 percent
of Canadian exports, the largest exporter.
On a world scale, the Australian industry can be said to have no market power on world
markets because it is such a small buyer and seller of fertilizer products in every category. In
economic terms Australia would be considered a small country without the ability to
influence prices on world markets.
6.3 Peak phosphorus?
An issue that has been raised in the public domain is that we are running out of rock phosphate. When this happens, agriculture will go into a serious decline in production because of the lack of phosphatic fertilizers.
It has even reached the stage where CSIRO can state in one of their publications:
“Scientists predict that peak P, the point where supply falls behind demand, may occur in as little as 25 years and high global demand will increase its price dramatically. Other estimates show that the time available may be longer. But in all cases predictions indicate

55
that phosphorus is a finite and valuable resource and that it is becoming an urgent matter to find ways to use P more efficiently so as to secure the profitability and competitiveness of Australian farming Industries.” (CSIRO Plant Industry) A simple analysis using current estimated reserves and production and inferred reserves using data provided by the US Geological Survey is presented in Table 6.2.
Table 6.2: World phosphate production and reserves
As well as the existing reserves, identified and inferred, an inventory of more than 1,600 world phosphate mines, deposits, and occurrences was compiled by the U.S. Geological Survey. The great majority of these are not operational as mines, primarily because they are not economic at this stage because of many factors such as location or being of lower grade deposits. If prices rise significantly enough they can become additional sources of supply.
There will be no ‘Peak Phosphorus’ for some time yet.
Production Reserves Reserve
base
Production years-
reserves
Production years-reserve
base Morocco and Western Sahara 25,200 5,700,000 21,000,000 226 833 China 32,000 6,600,000 13,000,000 206 406 United States 30,700 12,000,000 3,400,000 391 111 Senegal 2,600 1,500,000 2,500,000 577 962 Jordan 6,400 900,000 1,700,000 141 266 Australia 2,050 77,000 1,200,000 38 585 Russia 11,000 2,000,000 1,000,000 182 91 Israel 3,000 180,000 800,000 60 267 Syria 3,600 100,000 800,000 28 222 Egypt 2,740 100,000 760,000 36 277 Tunisia 8,400 100,000 600,000 12 71 Brazil 5,500 260,000 370,000 47 67 Canada 1,000 25,000 200,000 25 200 Senegal 1,500 50,000 160,000 33 107 Togo 1,200 30,000 60,000 25 50 Other countries 6,700 890,000 2,200,000 133 328 World 145,000 18,000,000 50,000,000 124 345
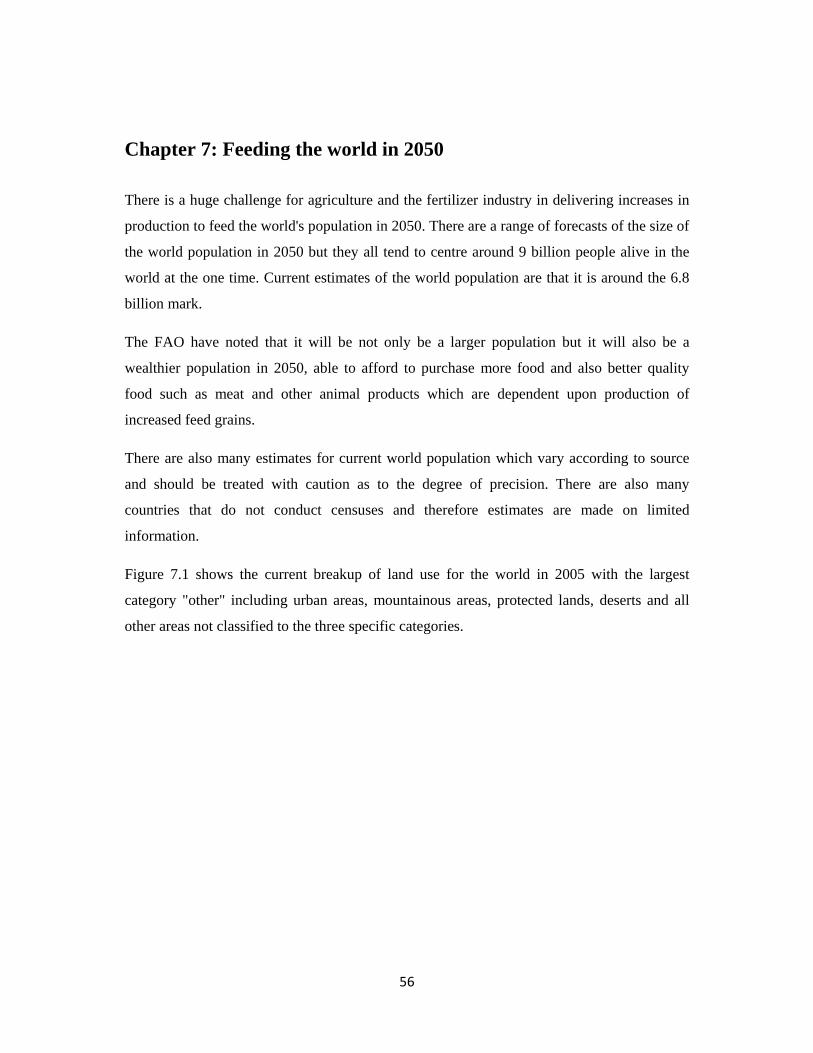
56
Chapter 7: Feeding the world in 2050
There is a huge challenge for agriculture and the fertilizer industry in delivering increases in
production to feed the world's population in 2050. There are a range of forecasts of the size of
the world population in 2050 but they all tend to centre around 9 billion people alive in the
world at the one time. Current estimates of the world population are that it is around the 6.8
billion mark.
The FAO have noted that it will be not only be a larger population but it will also be a
wealthier population in 2050, able to afford to purchase more food and also better quality
food such as meat and other animal products which are dependent upon production of
increased feed grains.
There are also many estimates for current world population which vary according to source
and should be treated with caution as to the degree of precision. There are also many
countries that do not conduct censuses and therefore estimates are made on limited
information.
Figure 7.1 shows the current breakup of land use for the world in 2005 with the largest
category "other" including urban areas, mountainous areas, protected lands, deserts and all
other areas not classified to the three specific categories.
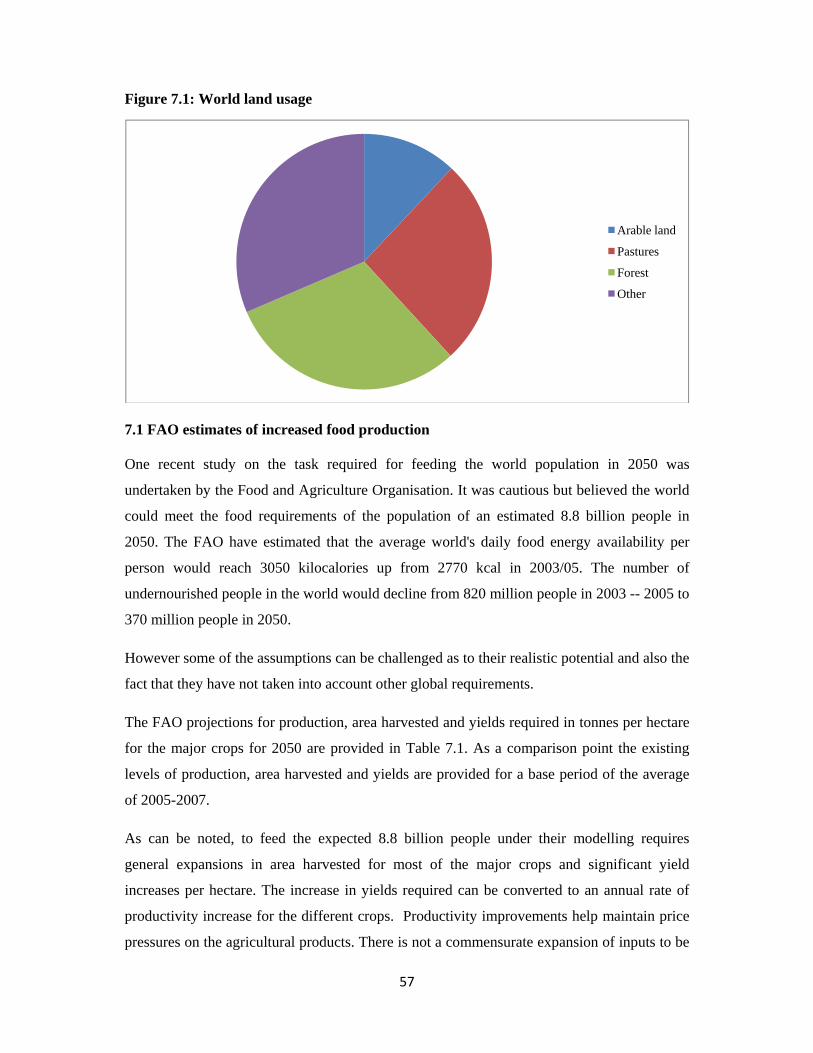
57
Figure 7.1: World land usage
7.1 FAO estimates of increased food production One recent study on the task required for feeding the world population in 2050 was
undertaken by the Food and Agriculture Organisation. It was cautious but believed the world
could meet the food requirements of the population of an estimated 8.8 billion people in
2050. The FAO have estimated that the average world's daily food energy availability per
person would reach 3050 kilocalories up from 2770 kcal in 2003/05. The number of
undernourished people in the world would decline from 820 million people in 2003 -- 2005 to
370 million people in 2050.
However some of the assumptions can be challenged as to their realistic potential and also the
fact that they have not taken into account other global requirements.
The FAO projections for production, area harvested and yields required in tonnes per hectare
for the major crops for 2050 are provided in Table 7.1. As a comparison point the existing
levels of production, area harvested and yields are provided for a base period of the average
of 2005-2007.
As can be noted, to feed the expected 8.8 billion people under their modelling requires
general expansions in area harvested for most of the major crops and significant yield
increases per hectare. The increase in yields required can be converted to an annual rate of
productivity increase for the different crops. Productivity improvements help maintain price
pressures on the agricultural products. There is not a commensurate expansion of inputs to be
Arable land
Pastures
Forest
Other

58
purchased to cover the increase in outputs. This does not mean that there is an absolute
reduction in the inputs required but a relative reduction to achieve higher rates of output per
unit of input. Expanding production will still require additional inputs such as fertilizer but
the relative amount required may decline due to management improvements such as reduced
competition for the nutrients in the soils from fewer competing weed species.
In 2009, the FAO convened an expert forum to further consider the issue of feeding the
world's population in 2050. For their experts’ consideration, the following points were made:
“Increasing input use efficiencies in agricultural production will be essential as natural resources are getting scarcer, and prices of non-renewable resources like fossil fuels, nitrogen, and phosphorus are expected to increase over the next decades.” and
“...globally the rate of growth in yields of the major cereal crops has been steadily declining. The rate of growth in global cereal yields, for example, dropped from 3.2 percent per year in 1960 to 1.5 percent in 2000. The challenge for technology is to reverse this decline, given that a continuous linear increase in yields at a global level following the pattern established over the past five decades would not be sufficient to meet food needs.”
“Crop yields would continue to grow but at a slower rate than in the past. This process of decelerating growth has already been under way for some time. On average, annual crop yield growth rate over the projection period would be about half (0.8 percent) of its historical growth rate (1.7 percent ;). Cereal yield growth would slow down to 0.7 percent per annum , and average cereal yield would by 2050 reach some 4.3 tonne/ha, up from 3.2 tonne/ha at present.”
Table 7.1: FAO 2050 forecasts and base year data
Production Mt Area harvested m Ha Yield t/Ha 2005 -- 07 2050 2005 -- 07 2050 2005-07 2050
Wheat 611 907 224 242 2.72 3.75 Rice
(paddy) 641 784 158 150 4.05 5.23 Maize 733 1153 155 190 4.73 6.06
Soybeans 218 514 95 141 2.29 3.66 Pulses 60 88 71 66 0.84 1.33 Barley 138 189 57 58 2.43 3.24
Sorghum 61 111 44 47 1.39 2.36 Millet 32 43 35 34 0.86 1.43
Seed cotton 71 90 36 32 1.95 2.8 Rape seed 50 106 31 36 1.61 2.91
Groundnuts 36 74 24 39 1.49 1.91 Sunflower 30 55 23 32 1.29 1.72 Sugarcane 1413 3386 21 30 67.02 112.34
The most obvious assumption available for challenge is that there would be an expansion of
farmland on a global scale. They acknowledged that east and south Asia generally are likely
59
to have reductions in farmland similar to that which has happened in Western industrial
societies. The expansion of farmland is to occur primarily in South America and sub-Saharan
Africa. The countries with the greatest potential expansion of farmland are those that are in
the Amazon basin in South America with the biggest expansion meant to occur in Brazil. The
next major potential country source of increased arable land is the Democratic Republic of
Congo which again is primarily rainforest. They are also forecasting major increases in arable
land expansion in Indonesia primarily in the less densely populated tropical rainforest regions
of Kalimantan and Sumatra.
These lands have other values on a global scale such as acting as major carbon sinks in a
carbon constrained world. As part of the international negotiations on climate change,
discussions have taken place on whether wealthier countries should pay to maintain these
rainforest regions as carbon sinks rather than allowing them to be developed for agricultural
and other purposes. It is therefore not definite that by 2050 major proportions of these lands
will be available for expanded agricultural production.
The FAO study noted for these lands that:
"much of the remaining land also suffers from constraints such as ecological fragility, low fertility, toxicity, high incidence of disease or lack of infrastructure. These reduce its productivity, require high input use and management skills to permit its sustainable use, or require prohibitively high investments to be made accessible or disease-free."
The continuing urbanisation and industrialisation is taking usually productive agricultural
lands out of use as cities and their required infrastructure expand into them. Even a nation as
large and relatively un-populated as Australia has seen a decline in the area of farmland over
the last four decades. Figure 7.2 shows the amounts and trends over that time for Australia.
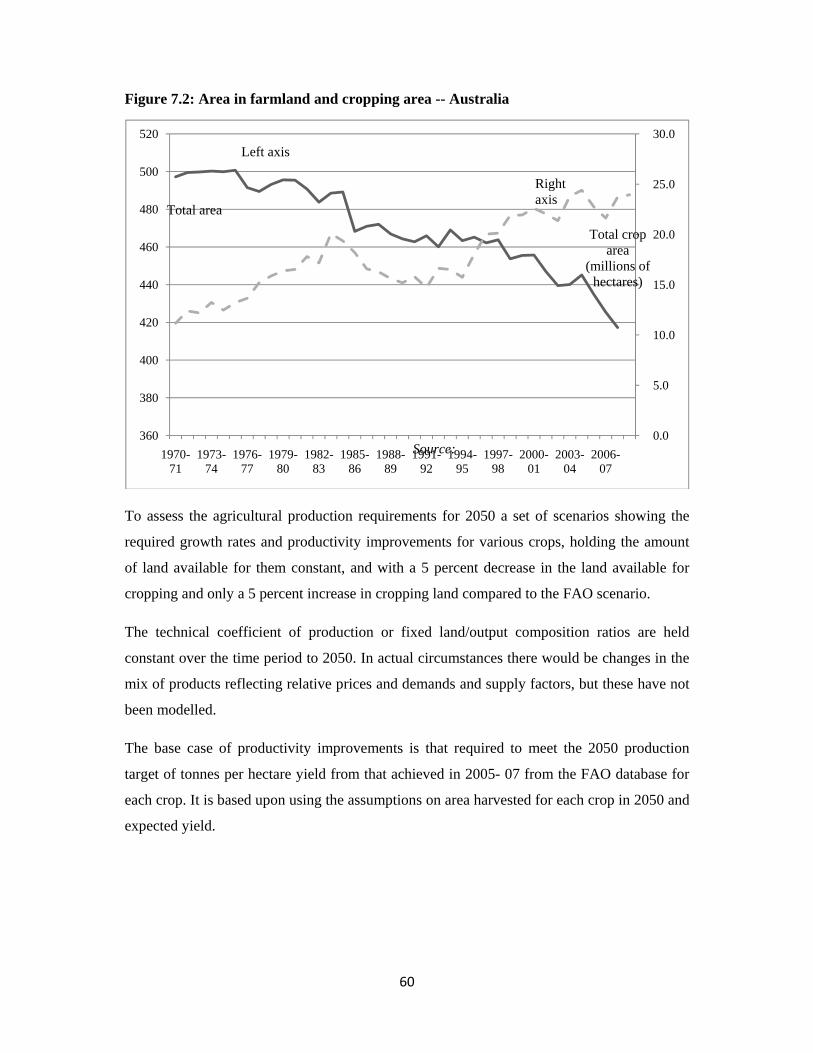
60
Figure 7.2: Area in farmland and cropping area -- Australia
To assess the agricultural production requirements for 2050 a set of scenarios showing the
required growth rates and productivity improvements for various crops, holding the amount
of land available for them constant, and with a 5 percent decrease in the land available for
cropping and only a 5 percent increase in cropping land compared to the FAO scenario.
The technical coefficient of production or fixed land/output composition ratios are held
constant over the time period to 2050. In actual circumstances there would be changes in the
mix of products reflecting relative prices and demands and supply factors, but these have not
been modelled.
The base case of productivity improvements is that required to meet the 2050 production
target of tonnes per hectare yield from that achieved in 2005- 07 from the FAO database for
each crop. It is based upon using the assumptions on area harvested for each crop in 2050 and
expected yield.
0.0
5.0
10.0
15.0
20.0
25.0
30.0
360
380
400
420
440
460
480
500
520
1970-71
1973-74
1976-77
1979-80
1982-83
1985-86
1988-89
1991-92
1994-95
1997-98
2000-01
2003-04
2006-07
Total area
Total crop area
(millions of hectares)
Left axis
Right axis
Source:
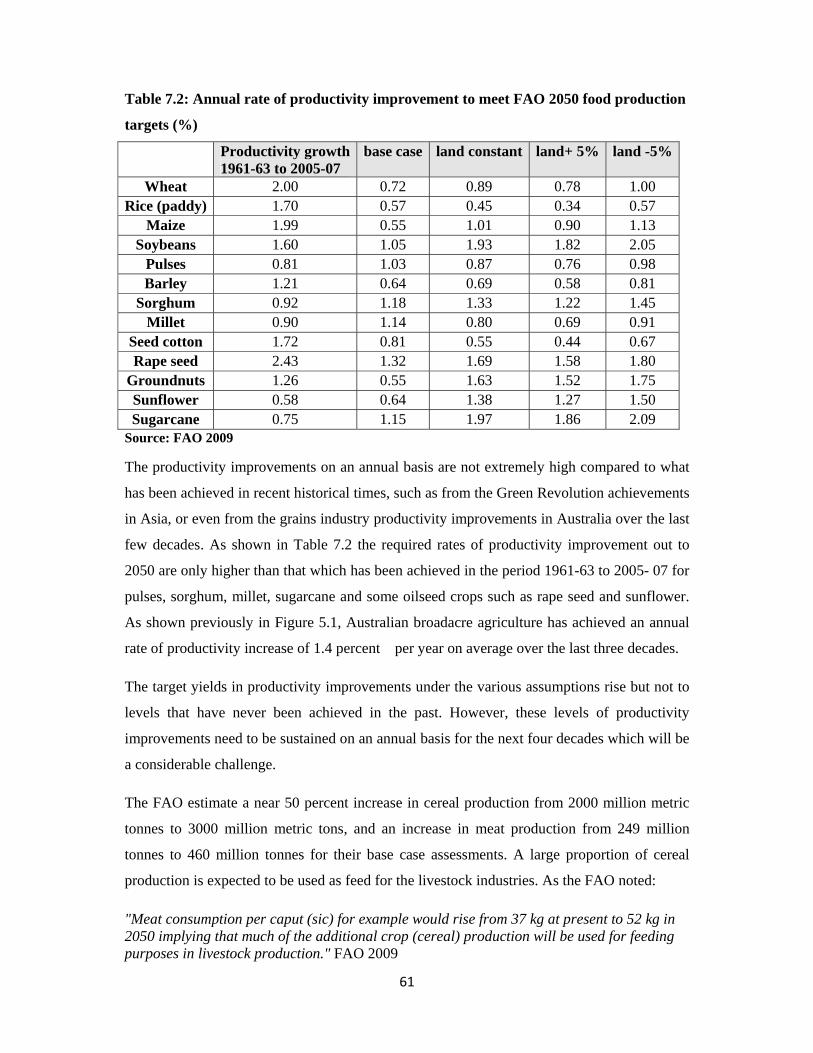
61
Table 7.2: Annual rate of productivity improvement to meet FAO 2050 food production
targets (%)
Productivity growth1961-63 to 2005-07
base case land constant land+ 5% land -5%
Wheat 2.00 0.72 0.89 0.78 1.00Rice (paddy) 1.70 0.57 0.45 0.34 0.57
Maize 1.99 0.55 1.01 0.90 1.13Soybeans 1.60 1.05 1.93 1.82 2.05
Pulses 0.81 1.03 0.87 0.76 0.98Barley 1.21 0.64 0.69 0.58 0.81
Sorghum 0.92 1.18 1.33 1.22 1.45Millet 0.90 1.14 0.80 0.69 0.91
Seed cotton 1.72 0.81 0.55 0.44 0.67Rape seed 2.43 1.32 1.69 1.58 1.80
Groundnuts 1.26 0.55 1.63 1.52 1.75Sunflower 0.58 0.64 1.38 1.27 1.50Sugarcane 0.75 1.15 1.97 1.86 2.09
Source: FAO 2009
The productivity improvements on an annual basis are not extremely high compared to what
has been achieved in recent historical times, such as from the Green Revolution achievements
in Asia, or even from the grains industry productivity improvements in Australia over the last
few decades. As shown in Table 7.2 the required rates of productivity improvement out to
2050 are only higher than that which has been achieved in the period 1961-63 to 2005- 07 for
pulses, sorghum, millet, sugarcane and some oilseed crops such as rape seed and sunflower.
As shown previously in Figure 5.1, Australian broadacre agriculture has achieved an annual
rate of productivity increase of 1.4 percent per year on average over the last three decades.
The target yields in productivity improvements under the various assumptions rise but not to
levels that have never been achieved in the past. However, these levels of productivity
improvements need to be sustained on an annual basis for the next four decades which will be
a considerable challenge.
The FAO estimate a near 50 percent increase in cereal production from 2000 million metric
tonnes to 3000 million metric tons, and an increase in meat production from 249 million
tonnes to 460 million tonnes for their base case assessments. A large proportion of cereal
production is expected to be used as feed for the livestock industries. As the FAO noted:
"Meat consumption per caput (sic) for example would rise from 37 kg at present to 52 kg in 2050 implying that much of the additional crop (cereal) production will be used for feeding purposes in livestock production." FAO 2009
62
7.2 The potential impact of biofuels
There was no allowance made for potential expansion of crops for bio-fuels which could have
a significant impact on future food availability in the FAO study.
If agricultural products such as sugar, grains and oilseeds are diverted to bio-fuel production
then there will be increasing demand for them. The current estimates of conversion ratios are:
• 1 tonne of sugar will produce 560 litres of ethanol
• 1 tonne of grain (wheat or coarse grains ) will produce 360 litres of ethanol
• 1 tonne of oilseeds will produce 400 litres of bio-diesel.
Current world consumption for diesel has approximated 750 billion litres per year, and for
petrol over 1100 billion litres per year.
A number of countries have mandated the use of these bio-fuels on various grounds such as
enhanced energy security or for perceived environmental benefits in reduced greenhouse
emissions. Brazil, the European Union and the United States are examples who have been
moving to mandated consumption levels of these fuels. There are regular changes or
attempting to increase the proportion of bio-fuels relative to fossil fuel derived petroleum
products.
If agriculture should be required to meet 1 percent of the current world consumption of petrol
and bio-diesel on an annual basis over the period to 2050 then that target can be met on an
annual basis by:
• 30 million tonnes of grain or approximately two percent of production in 2005- 07 for
conversion into bio ethanol as a substitute for petrol; or
• 20 million tonnes of sugar or approximately 1.5 percent of production in the 2005- 07
base period to meet the same target; and
• 19 million tonnes of oilseeds or 10 percent of production in the base period (excluding
soya bean) to meet the 1 percent bio-diesel target.
Any diversion into bio-fuels will increase the productivity improvements required in
agricultural crop production to meet the food plus biofuel requirements of the expanded
population.
63
Research is being undertaken into developing alternative sources of plant material to provide
the feedstock for bio-fuels. The intent of this research is to provide an alternative to using
food grade plants for the production of these bio-fuels and therefore reduce the demand and
hence price of foodstuffs. An example of this is the idea to use a plant called switchgrass in
the US with hoped-for technological developments in enzymes to allow the breakdown of the
cellulose in the plant for conversion into ethanol.
Even if this should work and be grown on marginal land that is unsuitable for producing
foodstuffs there is still no magic pudding for resource use for the world. The fertilizer
industry could be one of the hidden beneficiaries if these developments should prove viable.
Whenever the switchgrass is harvested it would be removing nutrients from the soil which
would have to be compensated with additional chemical fertilizers.
Harvesting switchgrass or other plant materials for the production of cellulosic ethanol will
require major additional nutrients to ensure sustainable production.
7.3 The challenge?
The Royal Society published an assessment of the needs for productivity improvements in
agriculture to feed the world's growing population. It concluded from the review that:
“Different assessments place different emphases on science, technology, markets, trade and social and political interventions. Most agree that the challenge of food security can only be met through a combination of measures across all relevant science and policy arenas. Those that focus on science and technology offer various options for improvement, but all agree that there is no simple ‘magic bullet’. Their shared conclusion is that the complacency about food availability over the last two decades has resulted in a steady erosion of investment in relevant scientific research and that this needs to change. (Royal Society 2009)
If the productivity improvements cannot be delivered in the time frame required then the only
solution to delivering the food required to feed the growing population is an intensification of
production using existing technologies. Fertilizer is the crucial fall back technology to deliver
the increased production necessary.

64
Chapter 8: The International Food Price Spike of 2008 The downward trend of real food prices for the past 25 years came to an end when world
prices started to rise in 2006 and escalated into a surge of price inflation in 2007 and 2008. A
new peak in world agricultural prices was seen in 2008. Figure 8.1 shows the rise in the food
price index in SDRs from the International Monetary Fund. The upturn in these agricultural
prices also coincided with record petroleum and fertilizer prices. The ramifications of this
will be long term and are still being worked through. However there is no doubt that there
will be major impacts on both the Australian agricultural sector and the Australian and
international fertilizer industries.
Figure 8.1: IMF Food index- monthly
There were riots, demonstrations and protests about the rise in prices in many countries
around the world. Governments responded to these price increases and protest actions with a
suite of policies, some rational and unfortunately some irrational that could have serious
negative impacts in the long run.
0
20
40
60
80
100
120
140
160
180
200
1980 1985 1990 1995 2000 2005 2010

65
Apart from the political developments and problems in many countries there were also some
serious humanitarian issues raised. For example, an FAO mission visiting Bangladesh in
April/May 2008 estimated that about 37 percent of households were consuming fewer than
three meals per day because of high food prices.
Though prices have come back down, this episode provides an advance view of what could
happen, but on a longer term and more serious scale, if agricultural production and
productivity do not continue to rise well into the long-term.
For this particular episode, a number of factors contributed to raising food prices according to
the FAO (2009). On the demand side:
• food consumption expanded rapidly in developing countries as a result of strong
global economic growth from 2004.
• A dietary transition from cereals toward more animal protein has also increased
demand for feed crops, such as maize, in emerging economies
• Demand for non-food agricultural products, such as timber, fibre and bio-fuel, had
also increased sharply.
On the supply side, there was a reduction attributed to:
• stagnation in area under cultivation and yield, as well as low investment
• Bad weather reduced production levels in many important exporting countries,
notably Australia
• World cereals stocks as a proportion of production also declined to one of their
lowest levels in recent years, exacerbating the crisis.
The then record high oil prices, which resulted in higher food production and transport
(including freight) costs, the weak US dollar, speculative activities and trade policies are also
said to have contributed to high food prices.
Table 8.1 provides details of the subset of countries imposing export restrictions on their
agricultural products which were major exporters of fertilizer products. Their ranking as a
fertilizer product exporter is also provided for the individual products. Though these
countries imposed export restrictions on foodstuffs, they did not necessarily impose

66
restrictions on fertilizer exports. The potential for future interferences in the export market
will be dependent upon many factors other than food security such as dependence upon
particular export commodities for trade purposes and more than adequate domestic self-
sufficiency in fertilizer products.
As was observed at the time of the food price spike, some major fertilizer exporters such as
China were prepared to interfere in some of their markets for domestic political reasons. This
sends a signal to customers that market supply conditions may well be subject to interference
and manipulation by governments in the future. Other major suppliers of fertilizer products
on world markets also took policy action to reduce prices in their domestic market.
These were not always negative policy initiatives — some moved to redress or remove
restrictive trade policy positions. For instance, Morocco cut tariffs on wheat imports from
130 percent to 2.5 percent, a positive move for Morocco's economic welfare and its domestic
consumers. The scale of this action indicates the serious degree of concern that was held over
food security. Having undertaken this major reform in response to the Food Price Spike
shock, a question remains as to the types of policies it might be willing to adopt to ameliorate
domestic food supply and price concerns in the future.
A significant number of agricultural product exporting countries imposed export restrictions
on various agricultural products because of the Food Price Spike. These restrictions took
many forms including export embargos, export taxes and domestic subsidies to divert product
from export to domestic markets. In many cases the policy intention was to protect domestic
consumers from the much higher prices then prevailing in the international market.
Some members of the Cairns Group were amongst the countries imposing export restrictions.
The Cairns Group is a group of agricultural trading nations who have combined together in
international trade negotiations to try and achieve reductions in import barriers and other
trade restrictions in world agricultural markets.
Because of the restrictions imposed on food exports, there is a great deal of uncertainty as to
where the long-term policies of many of these food importing countries will go, but the issue
is likely to be important for many of them.

67
Table 8.1: Countries Applying Food Export Restrictions and Exports of Fertilizer Commodities
Country Fertilizer commodity exports
World rank as exporter of product
Brazil TSP 9
China TSP 1
Urea 1
Ammonium nitrate 9
Ammonium sulphate 5
CAN 8
MAP 3
DAP 5
Egypt Phosphate Rock 6
TSP 8
Urea 7
Iran Ammonia 3
Sulphur 9
Jordan Phosphate rock 3
Potash 6
DAP 6
Kazakhstan Ammonium nitrate 10
MAP 8
Sulphur 5
Syria Phosphate rock 3
Source: IFA, FAO
68
This is not the first time that sovereign risk has been introduced into world agricultural
markets by governments seeking to manipulate domestic food prices and availability.
However, history has shown that the consequences of such action can be long term and
extremely damaging to the countries and industries involved. US action to protect its feed
grain using livestock industries is a good example. Following a disease outbreak and major
drop in the availability of feed grain, the United States imposed a soybean export embargo in
1973. Japan, a major importing country, diverted its demand elsewhere and fuelled the rapid
expansion of the Argentinean and Brazilian Soybean industries. Today, US dominance in the
production and export of this commodity has been significantly diminished.
As well as the riots from consumers over high food prices in the 2008 Food Price Spike,
simultaneous high fertilizer prices also led to riots among farmers in developing countries.
Fertilizer protests had been reported in Egypt, India, Kenya, Nepal, Nigeria, Pakistan, Taiwan
and Viet Nam.
The IFA noted that for fertilizer-consuming countries for Fertilizer Year (FY) 2007/08, the
majority of those implementing fertilizer subsidies are among the major fertilizer exporting
countries, with China topping the list.
A number of countries implemented policies that had an impact on the price and demand for
fertilizers by farmers:
• In Bangladesh the existing fertilizer subsidy was increased significantly;
• In Indonesia the government aimed to achieve food self-sufficiency through
increasing subsidies for seeds, fertilizers and loan schemes for farmers;
• India expanded in some cases its subsidy on fertilizer that was paid to manufacturers
and importers;
• China imposed a 150 percent export tax on fertilizer;
• A few African countries, including Madagascar, Malawi, Tanzania and Zambia
attempted to introduce or expand input (mainly fertilizer) subsidy programmes; and
• Kenya, Uganda and Tanzania are discussing the possibility of setting up a regional
fertilizer plant to offset high costs and ensure long-term sustainable supplies.
The implications of the 2008 Food Price Spike and the policy reactions of governments auger
potential difficulties for agricultural producers around the world including in major food

69
exporters such as Australia. The interference in fertilizer markets and the potential for future
trade restrictions in reaction to high prices should be of concern for economic policymakers,
and the fertilizer industry.
Policy issue: The Department of Foreign Affairs and Trade (DFAT) do not monitor or collect information on barriers to trade in fertilizer products. They have a detailed database on restrictions in agricultural product trade but not on the inputs to agriculture. DFAT should extend their monitoring and scope of trade negotiations to include the major inputs into agricultural production.
70
Chapter 9: Carbon Pollution Reduction Scheme
9.1 CPRS background
The fertilizer industry could face major changes from the introduction of the CPRS without a
comprehensive international agreement to maintain its competitiveness. It will create a very
different competitive market for all industries in Australia with ramifications on firm and
industry competitiveness across the board. The impacts on the fertilizer industry and its
customers need to be understood to ensure that there is effective adaptation to the changed
competitive environment.
The CPRS has been officially deferred until 2013 and there are alternative views as to the
timetable and the policy instruments that should be used in reducing Australia’s greenhouse
gas emissions. The status of the debates on what will be the path for Australia to reduce its
emissions is still unresolved. There is no doubt however those industries that directly emit
greenhouse gases or indirectly through their usage of fossil fuel energy sources such as
natural gas will face an additional cost impost in a carbon constrained world.
The institutional policy drivers for an emissions trading scheme for Australia are in place and
despite the current political and policy differences on whether to adopt such a scheme and the
timing of its implementation, there is a very real possibility that an emissions trading system
or other carbon pricing mechanism could well be implemented in the near future. Some
industries such as the electricity generation sector are pursuing implementation of such a
scheme to reduce the risks of investment in long-lived assets.
Apart from the political and policy impetus in favour of adoption there are also market
signals flagging that there will be some type of carbon constraint adopted for 2013. For
example, the futures prices of electricity contracts are approximately double in that year
compared to 2012. This is a current market signal in a contract market with all the latest
information available to market participants including the current state of political processes.
Market based signals are generally more accurate precursors of future policy options than
71
current statements by political participants. It is therefore a proactive stance to ensure the
impacts of carbon pricing are well understood by all industries and the community generally.
These potential additional costs can be measured for the fertilizer industry on the assumption
that something like the parameters used in the Carbon Pollution Reduction Scheme will be
adopted in any future emissions reduction scheme.
It is worthwhile noting the amount of work that has gone into developing the emissions
trading model for climate change in Australia.
The timeline of preparation for introducing emissions trading into the Australian economy for
reducing greenhouse gas emissions has been:
• Australian Greenhouse Office (AGO) discussion papers (1999)
• State Task Force (2006)
• PM’s Task Group (2007)
• Dept of Climate Change (2008)
• Garnaut draft (June 2008)
• Green Paper (July 2008)
• Garnaut final report (Oct 2008)
• White Paper (Dec 2008)
• exposure legislation (Mar 2009)
• First revisions (May 2009)
• Senate re-consideration (Nov 2009).
Despite having governments of differing political persuasions throughout this time period,
they all came to the conclusion that an emissions trading scheme was preferable to imposing
a carbon tax or a regulatory means of reducing emissions trading. There is a momentum built
in to the climate change/carbon reduction debate to favour some form of emissions trading
ahead of all other methods of constraining greenhouse gas emissions.
The general principles of the scheme are that the proposed ‘cap and trade’ CPRS operates as
follows:
72
1. Significant emitters of greenhouse gases need to acquire a ‘carbon pollution permit’
for every tonne of greenhouse gas that they emit
2. The quantity of emissions produced by firms will be monitored and audited
3. At the end of each year, each liable firm would need to surrender a ‘carbon pollution
permit’ for every tonne of emissions that they produced in that year. The number of
‘carbon pollution permits’ issued by the Government in each year will be limited to
the total carbon cap for the Australian economy
4. Firms compete to purchase the number of ‘carbon pollution permits’ that they require.
Firms that value carbon permits most highly will be prepared to pay most for them,
either at auction, or on a secondary trading market. For other firms it will be cheaper
to reduce emissions than to buy ‘permits’. Certain categories of firms might receive
some ‘permits’ for free, as a transitional assistance measure. These firms could use
these or sell them.
We are following on from the original European model which has had in place an emissions
trading scheme for carbon dioxide and other greenhouse gases since 2007. The history of
emissions trading for providing a low-cost means of getting market forces for dealing with
industrial emissions goes back much further to the original emissions trading scheme in the
US for acid rain emissions. That scheme was highly successful in delivering significant
emissions cuts in gases such as sulphur dioxide at much lower cost than was originally
thought. That model ended up being the template for market mechanisms for reducing
emissions by industries and countries in the greenhouse debate. It was a US Government
initiative that was adopted under then President Clinton in the climate change negotiations
which led to the Kyoto protocol. History has shown that the US did not sign on to its own
proposal with their domestic politics ensuring non-ratification by the US Government. There
was a "sense of the Senate" 95 to nil vote against ratification of the Kyoto Protocol. The U.S.
Senate is responsible for ratifying all international treaties to allow them to be enforced in the
US. The US Government did not try and have the Kyoto Protocol implemented.
The Kyoto Protocol was adopted in 1996 and Australia was one of what are called Annex
One countries that would be bound to reduce their emissions or achieve lower rates of
73
emissions than were forecast under the Business As Usual case. Australia negotiated an
increase in its allowable emissions of 8 percent from 1990 levels under the agreement.
As shown there has been a very large amount of work undertaken by governments of
different political persuasions and their bureaucracies at federal and state level developing the
model for the CPRS. This indicates a momentum built into governments for the introduction
of emissions trading ahead of other alternative measures such as regulatory action or direct
carbon and other emissions taxation.
Though the CPRS scheme has been deferred and there are alternatives being floated such as
the carbon tax proposed by Prof Garnaut, there is a strong institutional bias for an emissions
trading scheme.
The CPRS remains in limbo at this stage but the government has promised to try and have it
implemented by 2013. If implemented in its proposed form the Australian fertilizer
manufacturing industry will be subject to new costs that competing imports will generally not
face. These costs will mainly be associated with price increases for fossil fuel based energy
use. Non-combustion uses of fuel, such as using natural gas as a chemical feedstock, will not
attract an impost under the CPRS.
The major specific components of the scheme are:
• a 5 percent reduction in our emissions from 2000 levels by 2020. As no international
agreement was reached in Copenhagen, the option of increasing targets of 15 or 25
percent reductions has been shelved for the time being
• for the first year of the scheme which was meant to start in 2011 -- 12 but has been
postponed to 2013 by the federal government, emissions prices were to be fixed at
$10 per tonne. Fixed-price emissions permits of $42 per tonne were to be made
available for the next four years putting a cap on the potential price rises
• Approximately 1100 entities whose emissions exceed 25,000 tonnes per year were to
be subject to direct permit liabilities the scheme
• Special arrangements were to be put in place for the emission intensive trade exposed
industries. If emissions exceed 2000 tonnes of CO2 equivalent per million dollars of
revenue or 6000 tonnes of CO2 equivalent per million dollars of value added then
those companies would be able to receive free permits equal to 90 percent of their
74
requirements and an additional 5 percent from the so-called Global Recession Buffer
which was brought in after the international financial sector problems in the Global
Financial Crisis came to light (bringing the exemption to 94.5 per cent)
• If emissions exceeded 1000 tonnes of carbon dioxide equivalent per million dollars of
revenue or their emissions were between 3000 and 5999 tonnes of carbon dioxide
equivalent per million dollars of value added then those activities would receive free
permits equal to 60 percent of their assessed requirements plus an additional 10
percent from the Global Recession Buffer (bringing the emission exemption to 66 per
cent)
• The allocation of free permits was to decline at the rate of 1.3 percent per year
• one-way link to international markets. We could import emissions permits from
overseas schemes such as the Clean Development Mechanism or Joint
Implementation which were available to Kyoto Protocol signatories.
The Global Recession Buffer was not to be removed after five years unless there was an
international agreement on climate change which Australia was a party to and five years
notice was to be given of any modifications to the allocation of free permits to the emission
intensive trade exposed industries.
The one-way link allowing imports but not exports of permits was a means of ensuring that
Australian emissions permit prices would not rise to the levels prevailing in Europe under
their Emissions Trading Scheme but would allow Australia to import cheaper offsets from
other countries and therefore reducing the need to reduce Australian emissions if there were
cheaper alternatives overseas.
To provide an indication of the magnitude of the effects of the proposed scheme if a permit
for 1 tonne of carbon dioxide or its equivalent costs $20, the Scheme will have a direct cost
of $8.4 billion to liable parties (not counting free permit allocations). There will also be
indirect costs to all Australians as the carbon cost is passed through in the supply chain. A
$20 permit price is anticipated to raise inflation by 1 percent, increase electricity prices by 16
percent, gas by 9 percent and fuel prices by 5.6c per litre (although for the first 3 years the
government has pledged to reduce fuel tax by a similar amount).
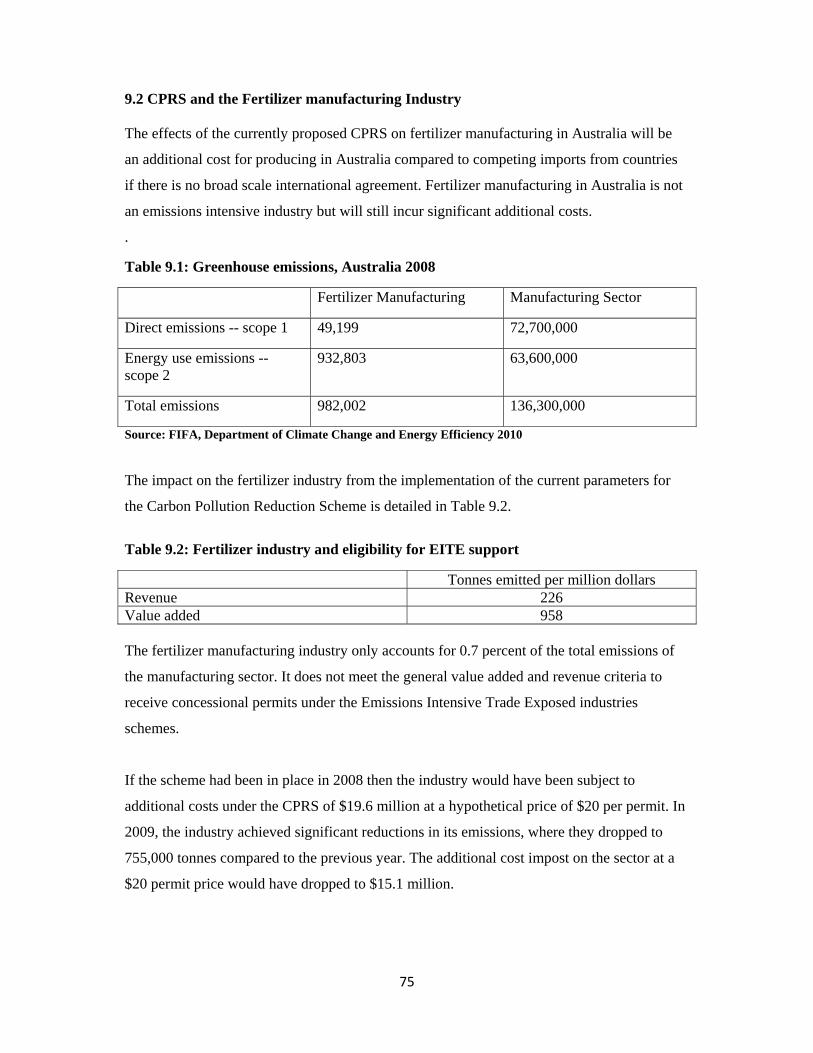
75
9.2 CPRS and the Fertilizer manufacturing Industry The effects of the currently proposed CPRS on fertilizer manufacturing in Australia will be
an additional cost for producing in Australia compared to competing imports from countries
if there is no broad scale international agreement. Fertilizer manufacturing in Australia is not
an emissions intensive industry but will still incur significant additional costs.
.
Table 9.1: Greenhouse emissions, Australia 2008
Fertilizer Manufacturing Manufacturing Sector
Direct emissions -- scope 1 49,199 72,700,000
Energy use emissions -- scope 2
932,803 63,600,000
Total emissions 982,002 136,300,000
Source: FIFA, Department of Climate Change and Energy Efficiency 2010
The impact on the fertilizer industry from the implementation of the current parameters for
the Carbon Pollution Reduction Scheme is detailed in Table 9.2.
Table 9.2: Fertilizer industry and eligibility for EITE support
Tonnes emitted per million dollars Revenue 226 Value added 958 The fertilizer manufacturing industry only accounts for 0.7 percent of the total emissions of
the manufacturing sector. It does not meet the general value added and revenue criteria to
receive concessional permits under the Emissions Intensive Trade Exposed industries
schemes.
If the scheme had been in place in 2008 then the industry would have been subject to
additional costs under the CPRS of $19.6 million at a hypothetical price of $20 per permit. In
2009, the industry achieved significant reductions in its emissions, where they dropped to
755,000 tonnes compared to the previous year. The additional cost impost on the sector at a
$20 permit price would have dropped to $15.1 million.

76
As an indication of the scale of this additional cost for the fertilizer manufacturing industry, it
is equivalent to nearly an additional 2 percent on the value added of the industry or 6 percent
on the wages and salaries bill of the industry.
9.3 The CPRS and the Agricultural Sector
The major impact for the fertilizer industry may not be its own direct impact of higher costs
and inability to compete with imports, if they are not under the same carbon price constraint,
but on demand for their products from the agricultural sector.
Putting Australia's emissions in perspective in 2006, Australia’s net greenhouse gas
emissions using the Kyoto accounting provisions were 576.0 million tonnes of CO2-
equivalent (Mt CO2-e), with the bulk of Australia’s emissions coming from stationary energy
(primarily electricity generation), transport and agriculture, as can be seen from Figure 9.1,
below.
Figure 9.1: Emissions Profile - Australia: 2008(mt)
Source: Department of Climate Change and Energy Efficiency, 2010
0
50
100
150
200
250
300
350
Stationary energy
Transport Fugitive emissions
Industrial Processes
Agriculture Waste Land use change
77
Agriculture was to be initially exempt from coverage in the scheme but would be considered
for inclusion five years after the commencement of the scheme. The agriculture sector
produces most of Australia’s methane and nitrous oxide emissions. Agriculture produced an
estimated 88.1 Mt CO2-e emissions or 14.8 percent of net national emissions in 2007.
In the latest inventory nitrous oxides from the use of nitrogen fertilizers on Australian soils
are estimated to account for 17 percent of agricultural emissions and an additional 1.8 percent
is attributed to manure management, part of which could be attributed to the higher
production of livestock from enhanced fertilizer use.
There is a dispute as to the accuracy of the measurement of these emissions as the Australian
government has used IPCC parameters based upon European studies of their agricultural
emissions for determining the emissions from Australian soils. These European parameters
are being questioned as not being reliable or accurate for Australian soils and climatic
conditions. If the European case is overturned emissions from agriculture and Australia will
be assessed at lower levels. This however will not change emissions targets to be met by
other industries such as the fertilizer manufacturing industry.
Another area of contention is determining the global warming potential or cumulative
radiative forcing of nitrous oxide relative to carbon dioxide over a 100-year time horizon.
This potential has varied in recent times from one molecule of nitrous oxide being equal to
296, then 298 and now 310 or 312 times that of a molecule of carbon dioxide. The Australian
government in its latest report has used 310 times as the forcing factor. The science and
therefore the impact of nitrogenous fertilizers is still being determined.
The total nitrous oxide emissions from agriculture are approximately equivalent to the
emissions from one large coal-fired base load power station.

78
Table 9.3: Nitrous oxide emissions and the agricultural sector (mt)
N2O emissions Percentage of agricultural emissions
Manure management 1.6 1.8
Agricultural soils 15 17.0
Savanna burning 3.5 4.0
Agricultural residues burning 0.1 0.1
Total N2O emissions 20.2 22.9
Total agricultural sector emissions
88.1 100.0
Source: Department of Climate Change and Energy Efficiency, 2010
There have been many exercises trying to determine the impact of climate change on
Australian and world agricultural production. As an example ABARE modelling (Gunasekera
2007) indicated:
• that future climate change and associated declines in agricultural productivity and
global economic activity may affect global production of key commodities: e.g.
global wheat, beef, dairy and sugar production could decline by 2–6 per cent by 2030
and by 5–11 per cent by 2050, relative to what would otherwise have been the case
(the ‘reference case’)
• Australian production of these commodities could decline by an estimated 9–10 per
cent by 2030 and 13–19 per cent by 2050, relative to the reference case
• These changes would also have significant implications for international agricultural
trade. For example, Australian agricultural exports of key commodities are projected
to decline by 11–63 per cent by 2030 and by 15–79 per cent by 2050, relative to the
reference case.
There is a great deal of uncertainty about the nitrous oxide emissions from the use of
fertilizers in Australian agriculture. A review article on this subject by CSIRO stated:
“Estimates of N2O emissions from various agricultural systems vary widely. For example, in flooded rice in the Riverina Plains, N2O emissions ranged from

79
0.02% to 1.4% of fertiliser N applied, whereas in irrigated sugarcane crops, 15.4% of fertiliser was lost over a 4-day period. Nitrous oxide emissions from fertilised dairy pasture soils in Victoria range from 6 to 11 kg N2O-N/ha, whereas in arable cereal cropping, N2O emissions range from <0.01% to 9.9% of N fertiliser applications. Nitrous oxide emissions from soil nitrite and nitrates resulting from residual fertiliser and legumes are rarely studied but probably exceed those from fertilisers, due to frequent wetting and drying cycles over a longer period and larger area. In ley cropping systems, significant N2O losses could occur, from the accumulation of mainly nitrate-N, following mineralisation of organic N from legume-based pastures. Extensive grazed pastures and rangelands contribute annually about 0.2 kg N/ha as N2O (93 kg/ha per year CO2-equivalent). Tropical savannas probably contribute an order of magnitude more, including that from frequent fires. Unfertilised forestry systems may emit less but the fertilised plantations emit more N2O than the extensive grazed pastures. However, currently there are limited data to quantify N2O losses in systems under ley cropping, tropical savannas, and forestry in Australia. Overall, there is a need to examine the emission factors used in estimating national N2O emissions; for example, 1.25% of fertiliser or animal-excreted N appearing as N2O.” (Dalal 2003)
The basic conclusion from this article is that we do not know with any degree of certainty
what the emissions of nitrous oxide are from agricultural soils due to fertilizer usage.
Before agriculture can be included in an emissions trading scheme, the science on the
emissions arising from the use of nitrogenous fertilizers in all the different agronomic and
crop conditions in Australia will have to be much further developed. The imposition of a
blanket set of rules could have adverse impacts on agricultural efficiency without achieving
the lowest cost of emission reductions.
Policy issue: Indirect Greenhouse Gas Emissions Due to Fertilizers
Because of the great deal of uncertainty and the relative importance of nitrous dioxide emissions from agriculture in Australia's emissions profile, there is a need to have a much more robust and soundly based set of parameters for determining greenhouse emissions from fertilizer use.
Though there have not been any direct regulatory measures on the usage of chemical
fertilizers for greenhouse purposes, there are precursor measures that could be utilised to
enforce such measures being adopted in other countries. For example in Germany, Table 9.4
provides an example of the records that have to be kept by farmers under their legislation.
The administrative arrangements and the information databases are already being put in place
in that country and these could be quite easily utilised for other purposes such as regulated
methods for reducing nitrous oxide emissions in agriculture.
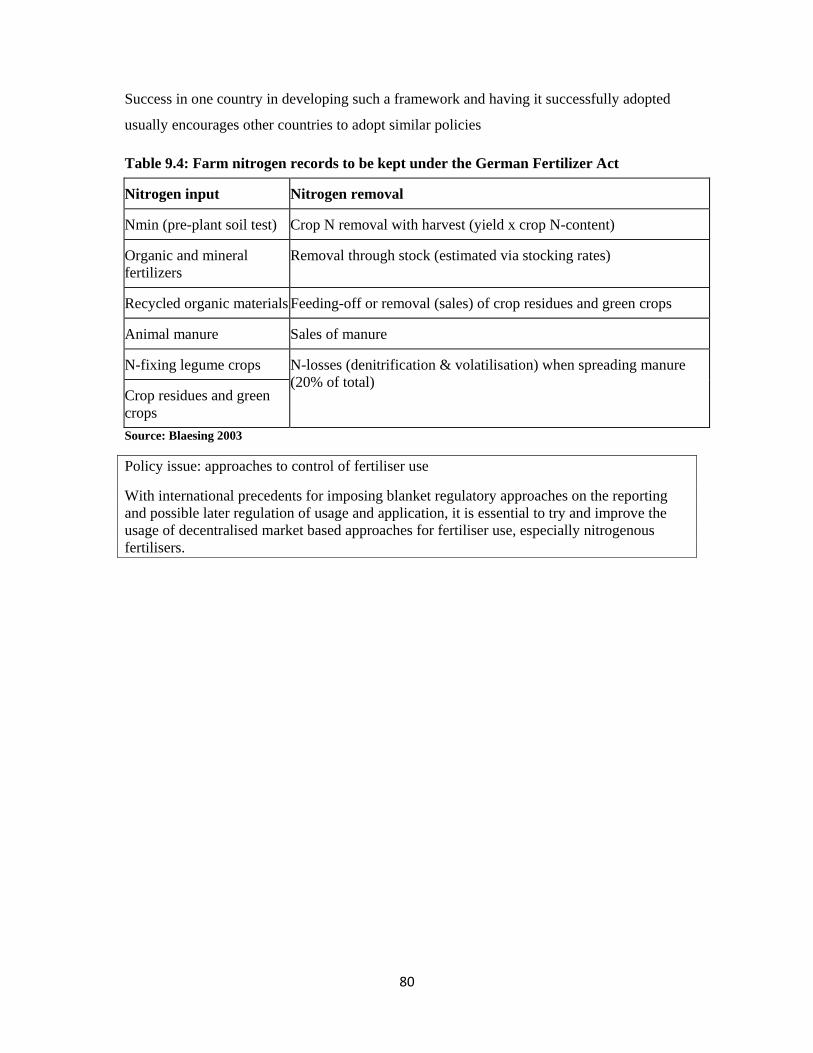
80
Success in one country in developing such a framework and having it successfully adopted
usually encourages other countries to adopt similar policies
Table 9.4: Farm nitrogen records to be kept under the German Fertilizer Act
Nitrogen input Nitrogen removal
Nmin (pre-plant soil test) Crop N removal with harvest (yield x crop N-content)
Organic and mineral fertilizers
Removal through stock (estimated via stocking rates)
Recycled organic materials Feeding-off or removal (sales) of crop residues and green crops
Animal manure Sales of manure
N-fixing legume crops N-losses (denitrification & volatilisation) when spreading manure (20% of total)
Crop residues and green crops Source: Blaesing 2003
Policy issue: approaches to control of fertiliser use
With international precedents for imposing blanket regulatory approaches on the reporting and possible later regulation of usage and application, it is essential to try and improve the usage of decentralised market based approaches for fertiliser use, especially nitrogenous fertilisers.

81
82
References
ABARE, Australian Commodity Statistics, various issues
ABARE, Australian Commodities, various issues
ABS, 2002, Freight Movements, 9220.0
ABS, 2008, Mining Operations 2006-07, 8415.0
ABS, 2009, Land Management and Farming in Australia, 2007-08, 4627.0
ABS, 2010a, Experimental Estimates for the Manufacturing Industry Australia 2006–07 and 2007–08, 8159.0
ABS, 2010b, Agricultural Commodities, Australia, 2008-09, 7121.0
ABS, Manufacturing Industry, 8221.0, various issues
Productivity Commission Inquiry into Rural Research and Development Corporations, 2010, Across Agriculture Submission
Blaesing D, 2003, Controlling nitrogen losses - can we learn from the European experience?
Brown B, 2010, Australian Agricultural Sector Productivity and Natural Resource Management, Paper delivered to the National Sustaining Rural Communities Conference
Bureau of Rural Resources and CSIRO Division of Plant Industry, 1992, Australia's renewable resources, sustainability and global change
Cordell D, 2010, The Story of Phosphorus Sustainability implications of global phosphorus scarcity for food security, UTS
CSIRO Plant Industry, 2010, Time Ticking On the Need to Use Phosphorus More Efficiently
Dalal R., E Weston, W. Strong, K. Lehane, J. Cooper, G. Wildermuth, A. King and C. Holmes, 2004.Sustaining productivity of a Vertosol at Warra, Queensland, with fertilizers, no tillage or legumes. Yield, nitrogen and disease break benefits from lucerne in a two year lucerne wheat rotation. AJAE, 2004,44,607-616 Department of Climate Change and Energy Efficiency, 2010, Australian National Greenhouse Accounts National Inventory 2008
FAO, 2006, World agriculture: towards 2030/2050 Interim report
FAO, 2009a, Country responses to the food security crisis
FAO, 2009b, The Resource Outlook to 2050: by how much do land water and crop yields need to increase by 2050?
83
FAO, 2009c, High Level Expert Forum - How to Feed the World in 2050
GRDC, 2003, The potential of fluid fertilizers for Broadacre cropping in Australia
GRDC, 2007, Comparison of Winter Crop Rotations
GRDC, 2002, Comparison of Winter Crop Rotations Western Farming Systems (WFS)
Gunasekera D, Kim Y, Tulloh C and Ford M (2007). ‘Climate Change: impacts on Australian agriculture’,in Australian Commodities, vol. 14, no. 4, December quarter, pp. 657–76
Kaiser B, K. Gridley, E Brady, T Phillips and S. Tyerman,2005, The Role of Molybdenum in Agricultural Plant Production, Australia Annals of Botany 96: 745–754, 2005
Kemanian, A. C. Stockle, and D. Huggins, 2007, Estimating Grain and Straw Nitrogen Concentration in Grain Crops Based on Aboveground Nitrogen Concentration and Harvest Index. Published in Agron. J. 99:158–165 (2007).
Kyboblite Research Station, South Australian Department of Agriculture (cited in Smith)
Mullen J, G.Scobie and J. Crean, 2008, Trends in Research, Productivity Growth and Competitiveness in Agriculture in New Zealand and Australia
Nossal K and Y Sheng, Productivity growth: Trends, drivers and opportunities for broadacre and dairy industries, Australian commodities • vol 17 no 1 • March quarter 2010
NSW Industry and Investment, 2010, The Contribution of Primary Industries to the New South Wales Economy NSW DPI, 2005, Fertilizers for Pastures
NSW DPI, 2005, productive pastures
NSW DPI, 2006, Beef stocking rates and farm size - Hunter Region
Robinson G. and A. Lazenby, 1976, effect of superphosphate, white clover and stocking rate on the productivity of native pastures, Northern Tablelands, New South Wales, CSIRO
The Royal Society, 2009, reaping the benefits: science and the sustainable intensification of global agriculture
South Australia DPIR, The Historic Role of South Australia in Micronutrient Research, 2009
Smith, D. F., 2000, Natural Gain in the Grazing Lands of the Southern Australia, University of New South Wales Press
Tasmanian DPIW, 2006, Managing Native Pastures
Thorburn P, J. Biggs, K. Bristow, H. Horan and N. Huth, 2003, Benefits of application of
nitrogen and water to trickle irrigated sugarcane
Thorburn R, 2004, Review of Nitrogen Fertilizer Research in the Australian Sugar Industry, SRDC
Thorburn, P., T. Webster, J. Biggs, I Biggs, 2009, Nitrogen fertilizer management of sugarcane crops for meeting global environmental challenges

84
USDA, 2003 21st Century Agriculture: A Critical Role for Science and Technology
U.S. Geological Survey, 2007, Mineral Commodity Summaries
Victoria DPI 2005, Phosphorus for sheep and beef pastures
Victoria DPI, 2007, Farm Nutrient Loss Index-An index for assessing the risk of nitrogen and phosphorus loss for the Australian grazing industries

85
86
Appendix 6.1: Australian and International Production, Consumption, Exports and Imports of the Major Fertilizer Products -- 2008
The database used in this Appendix is from the International Fertilizer Industry Association
and provides information on the top 10 countries in every category of production,
consumption, exports and imports for all the major fertilizer products.
Where Australia does not rank in the top 10 it has been included as an additional item
including the specific statistics from the International Fertilizer Association and its ranking in
that category.
The member countries of the European Union (EU) have been included in the aggregate
figure for that trade bloc and disaggregated information is not provided on those specific
countries.
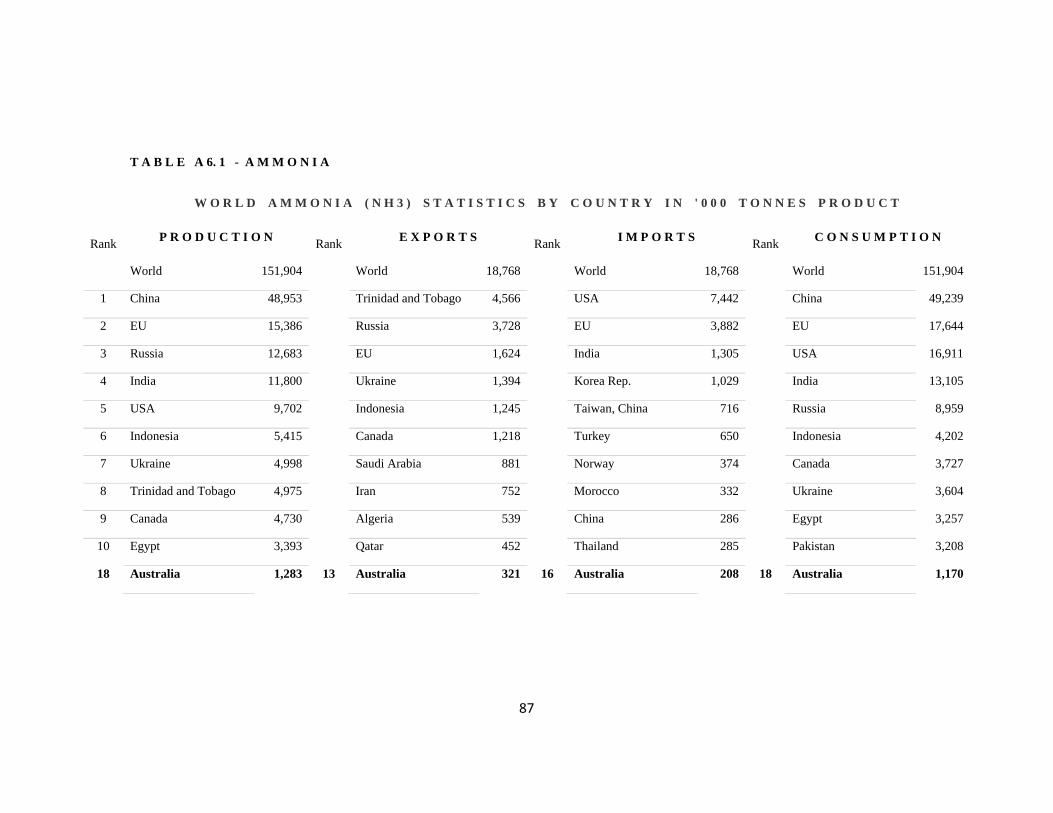
87
T A B L E A 6. 1 - A M M O N I A
W O R L D A M M O N I A ( N H 3 ) S T A T I S T I C S B Y C O U N T R Y I N ' 0 0 0 T O N N E S P R O D U C T
P R O D U C T I O N E X P O R T S I M P O R T S C O N S U M P T I O N Rank Rank Rank Rank
World 151,904 World 18,768 World 18,768 World 151,904
1 China 48,953 Trinidad and Tobago 4,566 USA 7,442 China 49,239
2 EU 15,386 Russia 3,728 EU 3,882 EU 17,644
3 Russia 12,683 EU 1,624 India 1,305 USA 16,911
4 India 11,800 Ukraine 1,394 Korea Rep. 1,029 India 13,105
5 USA 9,702 Indonesia 1,245 Taiwan, China 716 Russia 8,959
6 Indonesia 5,415 Canada 1,218 Turkey 650 Indonesia 4,202
7 Ukraine 4,998 Saudi Arabia 881 Norway 374 Canada 3,727
8 Trinidad and Tobago 4,975 Iran 752 Morocco 332 Ukraine 3,604
9 Canada 4,730 Algeria 539 China 286 Egypt 3,257
10 Egypt 3,393 Qatar 452 Thailand 285 Pakistan 3,208
18 Australia 1,283 13 Australia 321 16 Australia 208 18 Australia 1,170
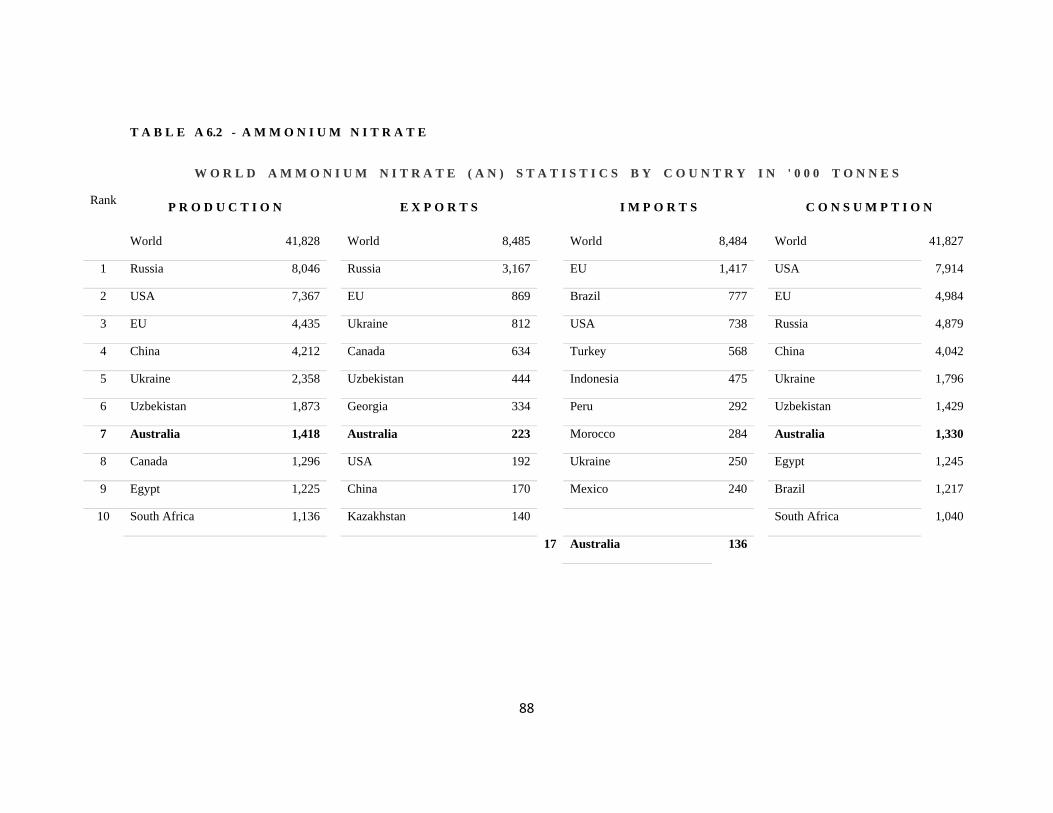
88
T A B L E A 6.2 - A M M O N I U M N I T R A T E
W O R L D A M M O N I U M N I T R A T E ( A N ) S T A T I S T I C S B Y C O U N T R Y I N ' 0 0 0 T O N N E S
Rank P R O D U C T I O N E X P O R T S I M P O R T S C O N S U M P T I O N
World 41,828 World 8,485 World 8,484 World 41,827
1 Russia 8,046 Russia 3,167 EU 1,417 USA 7,914
2 USA 7,367 EU 869 Brazil 777 EU 4,984
3 EU 4,435 Ukraine 812 USA 738 Russia 4,879
4 China 4,212 Canada 634 Turkey 568 China 4,042
5 Ukraine 2,358 Uzbekistan 444 Indonesia 475 Ukraine 1,796
6 Uzbekistan 1,873 Georgia 334 Peru 292 Uzbekistan 1,429
7 Australia 1,418 Australia 223 Morocco 284 Australia 1,330
8 Canada 1,296 USA 192 Ukraine 250 Egypt 1,245
9 Egypt 1,225 China 170 Mexico 240 Brazil 1,217
10 South Africa 1,136 Kazakhstan 140 South Africa 1,040
17 Australia 136

89
T A B L E A 6.3 - A M M O N I U M S U L P H A T E
W O R L D A M M O N I U M S U L P H A T E ( A S ) S T A T I S T I C S B Y C O U N T R Y I N ' 0 0 0 T O N N E S
Rank P R O D U C T I O N E X P O R T S I M P O R T S C O N S U M P T I O N
World 19,027 World 9,140 World 9,144 World 19,031
1 EU 4,595 EU 3,409 EU 2,420 EU 3,606
2 USA 2,529 Russia 1,201 Brazil 1,451 USA 1,899
3 China 2,381 USA 1,022 Malaysia 912 China 1,706
4 Russia 1,457 Japan 730 Vietnam 667 Brazil 1,669
5 Japan 1,412 China 675 Turkey 513 Indonesia 1,180
6 Mexico 942 Korea Rep. 613 Indonesia 488 Mexico 1,121
7 Canada 904 Canada 443 Philippines 406 Malaysia 912
8 Korea Rep. 710 Ukraine 386 USA 392 Japan 693
9 Indonesia 692 Taiwan, China 267 Mexico 198 Vietnam 667
10 Taiwan, China 530 Belarus 156 Thailand 193 Turkey 616
12 Australia 431 14 Australia 30 20 Australia 59 14 Australia 460
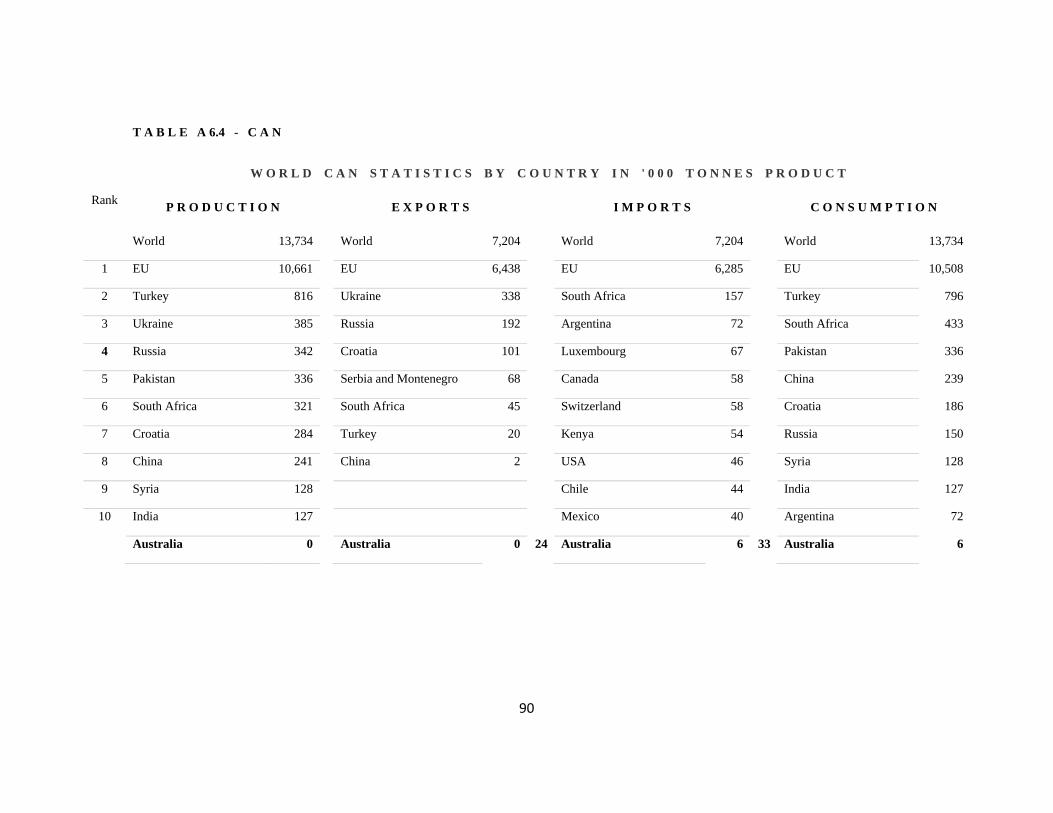
90
T A B L E A 6.4 - C A N
W O R L D C A N S T A T I S T I C S B Y C O U N T R Y I N ' 0 0 0 T O N N E S P R O D U C T
Rank P R O D U C T I O N E X P O R T S I M P O R T S C O N S U M P T I O N
World 13,734 World 7,204 World 7,204 World 13,734
1 EU 10,661 EU 6,438 EU 6,285 EU 10,508
2 Turkey 816 Ukraine 338 South Africa 157 Turkey 796
3 Ukraine 385 Russia 192 Argentina 72 South Africa 433
4 Russia 342 Croatia 101 Luxembourg 67 Pakistan 336
5 Pakistan 336 Serbia and Montenegro 68 Canada 58 China 239
6 South Africa 321 South Africa 45 Switzerland 58 Croatia 186
7 Croatia 284 Turkey 20 Kenya 54 Russia 150
8 China 241 China 2 USA 46 Syria 128
9 Syria 128 Chile 44 India 127
10 India 127 Mexico 40 Argentina 72
Australia 0 Australia 0 24 Australia 6 33 Australia 6
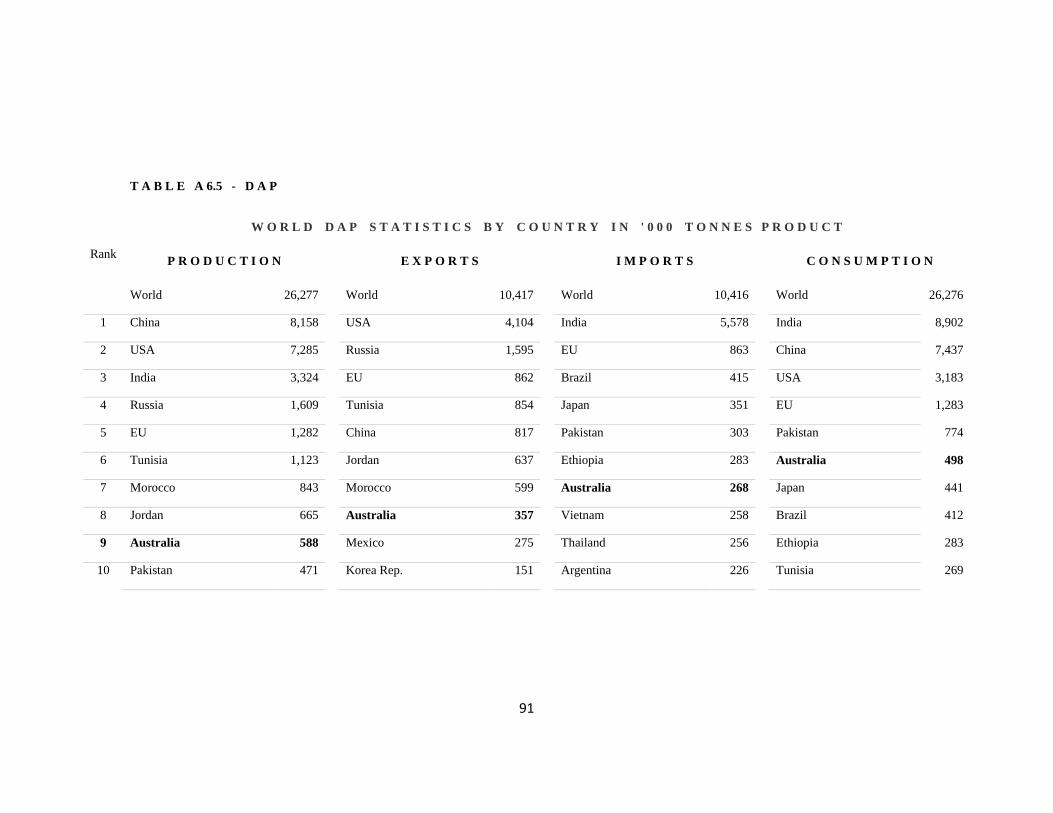
91
T A B L E A 6.5 - D A P
W O R L D D A P S T A T I S T I C S B Y C O U N T R Y I N ' 0 0 0 T O N N E S P R O D U C T
Rank P R O D U C T I O N E X P O R T S I M P O R T S C O N S U M P T I O N
World 26,277 World 10,417 World 10,416 World 26,276
1 China 8,158 USA 4,104 India 5,578 India 8,902
2 USA 7,285 Russia 1,595 EU 863 China 7,437
3 India 3,324 EU 862 Brazil 415 USA 3,183
4 Russia 1,609 Tunisia 854 Japan 351 EU 1,283
5 EU 1,282 China 817 Pakistan 303 Pakistan 774
6 Tunisia 1,123 Jordan 637 Ethiopia 283 Australia 498
7 Morocco 843 Morocco 599 Australia 268 Japan 441
8 Jordan 665 Australia 357 Vietnam 258 Brazil 412
9 Australia 588 Mexico 275 Thailand 256 Ethiopia 283
10 Pakistan 471 Korea Rep. 151 Argentina 226 Tunisia 269

92
T A B L E A 6.6 - M A P
W O R L D M A P S T A T I S T I C S B Y C O U N T R Y I N ' 0 0 0 T O N N E S P R O D U C T
Rank P R O D U C T I O N E X P O R T S I M P O R T S C O N S U M P T I O N
World 16,752 World 4,061 World 4,061 World 16,752
1 China 7,096 USA 1,327 Brazil 1,029 China 6,197
2 USA 4,160 Russia 1,235 Canada 423 USA 2,946
3 Russia 1,952 China 899 Australia 400 Brazil 2,196
4 Brazil 1,167 Morocco 348 EU 394 Canada 930
5 Canada 517 EU 70 Argentina 267 Russia 717
6 Morocco 444 Ukraine 68 India 266 Australia 657
7 South Africa 318 Uzbekistan 34 Japan 134 EU 591
8 EU 267 Kazakhstan 33 Belarus 121 South Africa 362
9 Australia 257 Mexico 23 USA 113 Argentina 267
10 Ukraine 130 Israel 13 Thailand 103 India 266
13 Australia 0
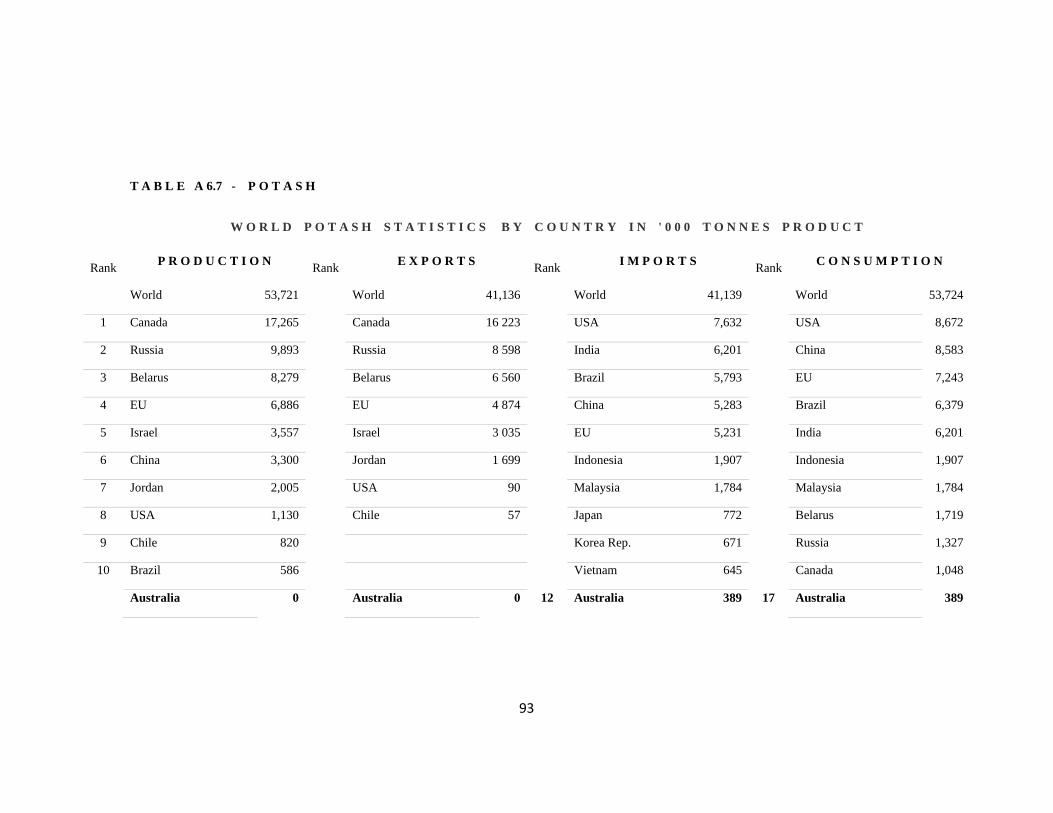
93
T A B L E A 6.7 - P O T A S H
W O R L D P O T A S H S T A T I S T I C S B Y C O U N T R Y I N ' 0 0 0 T O N N E S P R O D U C T
P R O D U C T I O N E X P O R T S I M P O R T S C O N S U M P T I O N Rank Rank Rank Rank
World 53,721 World 41,136 World 41,139 World 53,724
1 Canada 17,265 Canada 16 223 USA 7,632 USA 8,672
2 Russia 9,893 Russia 8 598 India 6,201 China 8,583
3 Belarus 8,279 Belarus 6 560 Brazil 5,793 EU 7,243
4 EU 6,886 EU 4 874 China 5,283 Brazil 6,379
5 Israel 3,557 Israel 3 035 EU 5,231 India 6,201
6 China 3,300 Jordan 1 699 Indonesia 1,907 Indonesia 1,907
7 Jordan 2,005 USA 90 Malaysia 1,784 Malaysia 1,784
8 USA 1,130 Chile 57 Japan 772 Belarus 1,719
9 Chile 820 Korea Rep. 671 Russia 1,327
10 Brazil 586 Vietnam 645 Canada 1,048
Australia 0 Australia 0 12 Australia 389 17 Australia 389
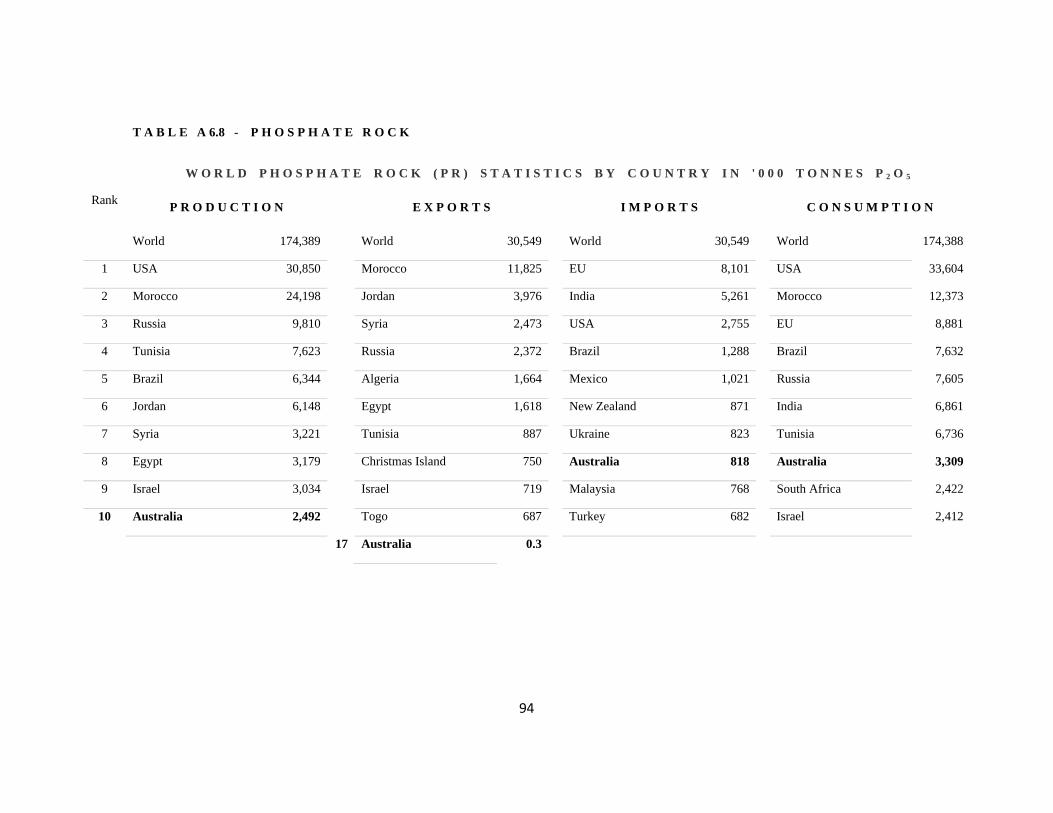
94
T A B L E A 6.8 - P H O S P H A T E R O C K
W O R L D P H O S P H A T E R O C K ( P R ) S T A T I S T I C S B Y C O U N T R Y I N ' 0 0 0 T O N N E S P 2 O 5
Rank P R O D U C T I O N E X P O R T S I M P O R T S C O N S U M P T I O N
World 174,389 World 30,549 World 30,549 World 174,388
1 USA 30,850 Morocco 11,825 EU 8,101 USA 33,604
2 Morocco 24,198 Jordan 3,976 India 5,261 Morocco 12,373
3 Russia 9,810 Syria 2,473 USA 2,755 EU 8,881
4 Tunisia 7,623 Russia 2,372 Brazil 1,288 Brazil 7,632
5 Brazil 6,344 Algeria 1,664 Mexico 1,021 Russia 7,605
6 Jordan 6,148 Egypt 1,618 New Zealand 871 India 6,861
7 Syria 3,221 Tunisia 887 Ukraine 823 Tunisia 6,736
8 Egypt 3,179 Christmas Island 750 Australia 818 Australia 3,309
9 Israel 3,034 Israel 719 Malaysia 768 South Africa 2,422
10 Australia 2,492 Togo 687 Turkey 682 Israel 2,412
17 Australia 0.3
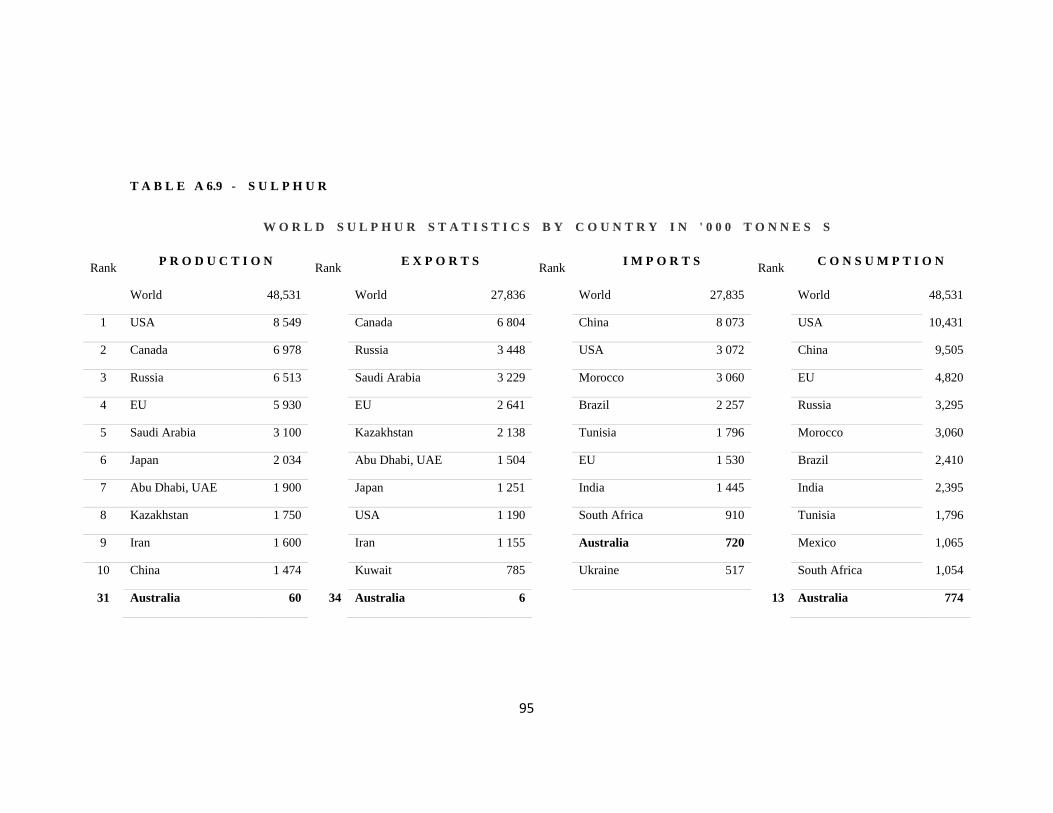
95
T A B L E A 6.9 - S U L P H U R
W O R L D S U L P H U R S T A T I S T I C S B Y C O U N T R Y I N ' 0 0 0 T O N N E S S
P R O D U C T I O N E X P O R T S I M P O R T S C O N S U M P T I O N Rank Rank Rank Rank
World 48,531 World 27,836 World 27,835 World 48,531
1 USA 8 549 Canada 6 804 China 8 073 USA 10,431
2 Canada 6 978 Russia 3 448 USA 3 072 China 9,505
3 Russia 6 513 Saudi Arabia 3 229 Morocco 3 060 EU 4,820
4 EU 5 930 EU 2 641 Brazil 2 257 Russia 3,295
5 Saudi Arabia 3 100 Kazakhstan 2 138 Tunisia 1 796 Morocco 3,060
6 Japan 2 034 Abu Dhabi, UAE 1 504 EU 1 530 Brazil 2,410
7 Abu Dhabi, UAE 1 900 Japan 1 251 India 1 445 India 2,395
8 Kazakhstan 1 750 USA 1 190 South Africa 910 Tunisia 1,796
9 Iran 1 600 Iran 1 155 Australia 720 Mexico 1,065
10 China 1 474 Kuwait 785 Ukraine 517 South Africa 1,054
31 Australia 60 34 Australia 6 13 Australia 774
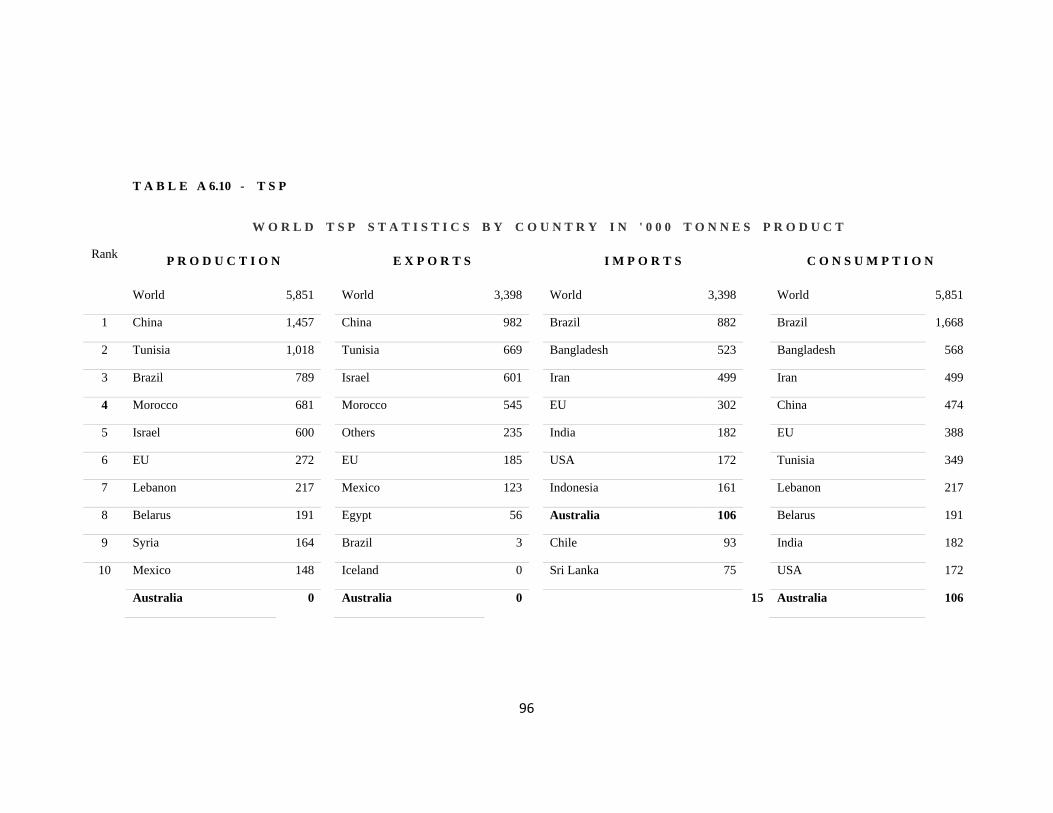
96
T A B L E A 6.10 - T S P
W O R L D T S P S T A T I S T I C S B Y C O U N T R Y I N ' 0 0 0 T O N N E S P R O D U C T
Rank P R O D U C T I O N E X P O R T S I M P O R T S C O N S U M P T I O N
World 5,851 World 3,398 World 3,398 World 5,851
1 China 1,457 China 982 Brazil 882 Brazil 1,668
2 Tunisia 1,018 Tunisia 669 Bangladesh 523 Bangladesh 568
3 Brazil 789 Israel 601 Iran 499 Iran 499
4 Morocco 681 Morocco 545 EU 302 China 474
5 Israel 600 Others 235 India 182 EU 388
6 EU 272 EU 185 USA 172 Tunisia 349
7 Lebanon 217 Mexico 123 Indonesia 161 Lebanon 217
8 Belarus 191 Egypt 56 Australia 106 Belarus 191
9 Syria 164 Brazil 3 Chile 93 India 182
10 Mexico 148 Iceland 0 Sri Lanka 75 USA 172
Australia 0 Australia 0 15 Australia 106
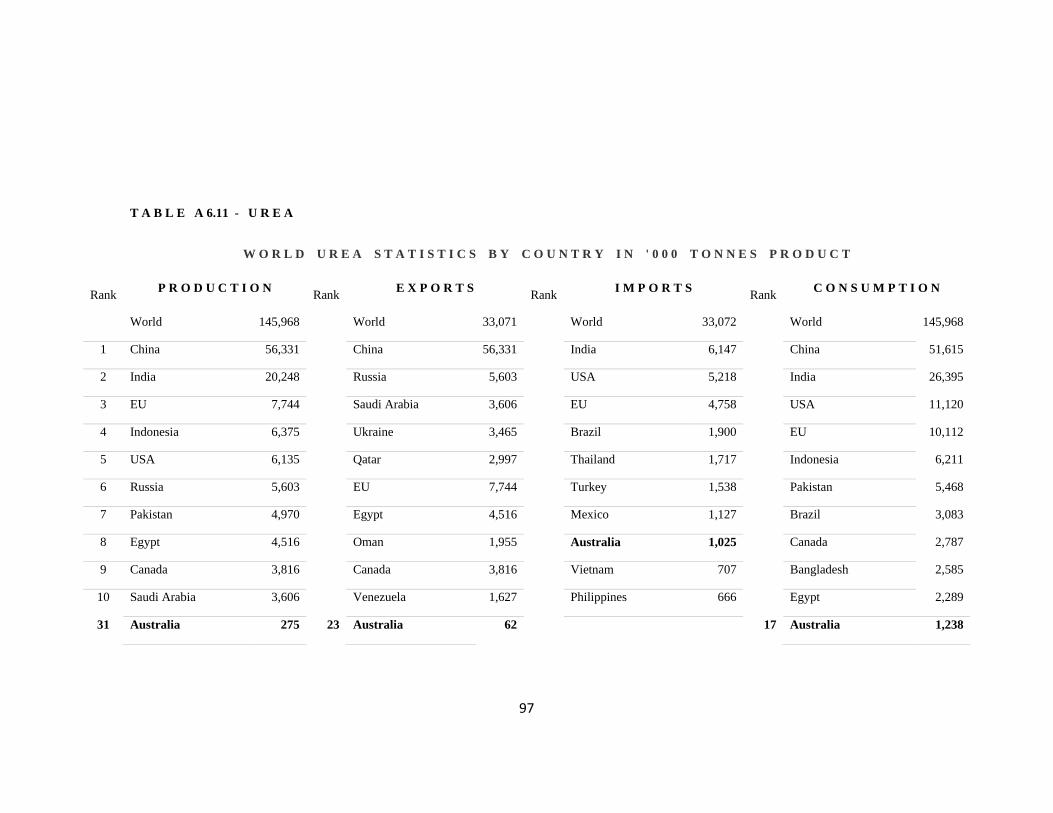
97
T A B L E A 6.11 - U R E A
W O R L D U R E A S T A T I S T I C S B Y C O U N T R Y I N ' 0 0 0 T O N N E S P R O D U C T
P R O D U C T I O N E X P O R T S I M P O R T S C O N S U M P T I O N Rank Rank Rank Rank
World 145,968 World 33,071 World 33,072 World 145,968
1 China 56,331 China 56,331 India 6,147 China 51,615
2 India 20,248 Russia 5,603 USA 5,218 India 26,395
3 EU 7,744 Saudi Arabia 3,606 EU 4,758 USA 11,120
4 Indonesia 6,375 Ukraine 3,465 Brazil 1,900 EU 10,112
5 USA 6,135 Qatar 2,997 Thailand 1,717 Indonesia 6,211
6 Russia 5,603 EU 7,744 Turkey 1,538 Pakistan 5,468
7 Pakistan 4,970 Egypt 4,516 Mexico 1,127 Brazil 3,083
8 Egypt 4,516 Oman 1,955 Australia 1,025 Canada 2,787
9 Canada 3,816 Canada 3,816 Vietnam 707 Bangladesh 2,585
10 Saudi Arabia 3,606 Venezuela 1,627 Philippines 666 Egypt 2,289
31 Australia 275 23 Australia 62 17 Australia 1,238