australian hawksbill turtle population dynamics project
TRANSCRIPT

Australian Hawksbill Turtle Population Dynamics Project
Colin J. Limpus and Jeffrey D. Miller

Cover photograph: Hawksbills caught on Wistari Reef. Australian Hawksbill Turtle Population Dynamics Project. ISBN 978-0-9803613-4-6 (Print) ISBN 978-0-9803613-5-3 (Online) Authors: Colin J. Limpus1* and Jeffery D. Miller1
Editor: Leisa Fien Peer Reviewers: Dr Anne Meylan2 and Dr Kirstin Dobbs3 1 Queenland Environmental Protection Agency 2 Florida Fish and Wildlife Conservation Commission 3 Great Barrier Reef Marine Park Authority *Corresponding Author Phone: 61 7 3227 7718 Fax: 61 7 3247 5966 Email: [email protected] The Australian Hawksbill Turtle Population Dynamics Project was funded by the Japan Bekko Association. The views and opinions expressed in this report are those of the authors and do not necessarily reflect those of the Japan Bekko Association, the President of the Japan Bekko Association, the Queensland State Government, the Minister for Sustainability, Climate Change and Innovation, or the Exceutive Director, Queensland Parks and Wildife. Information contained in this publication is provided as general advice only. For application to specific circumstances, seek professional advice. The Queensland Environmental Protection Agency has taken all reasonable steps to ensure the information contained in this publication is accurate at the time of publication. Readers should ensure that they make appropriate enquiries to determine whether new information is available on the particular subject matter. © The State of Queensland. Environmental Protection Agency 2007. In addition, Copyright of this report is vested jointly with the then Executive Director, Queensland Parks and Wildife and the President, Japan Bekko Association. Copyright protects this publication. Except for purposes permitted by the Copyright Act, storage, transmission or reproduction of all or any part by any means is prohibited without the prior written permission of the Environmental Protection Agency. April 2008 This report was received for review in May 2000 and finalised for publication in April 2008. Produced by the Environmental Protection Agency. Visit us online at www.epa.qld.gov.au

i
Contents LIST OF TABLES .................................................................................................................................. IV
LIST OF FIGURES.................................................................................................................................VI
EXECUTIVE SUMMARY......................................................................................................................... 1
RESULTS................................................................................................................................................ 1 Breeding distribution ......................................................................................................................... 1 Nesting beach studies....................................................................................................................... 1 Breeding migration............................................................................................................................ 2 Recruitment from the pelagic to the benthic feeding life history phase ............................................ 2 Eretmochelys imbricata foraging populations in eastern Australia ................................................... 2 Growth studies of immature Eretmochelys imbricata ....................................................................... 2
CONCLUSIONS........................................................................................................................................ 3
CHAPTER 1 – INTRODUCTION ............................................................................................................ 5
REFERENCES ......................................................................................................................................... 6
CHAPTER 2 - ACKNOWLEDGMENTS.................................................................................................. 9
CHAPTER 3 - METHODS..................................................................................................................... 11
TAGGING.............................................................................................................................................. 11 TURTLE MEASUREMENTS....................................................................................................................... 11
Curved carapace measurements:................................................................................................... 11 Straight carapace measurements: .................................................................................................. 12 Head measurements:...................................................................................................................... 12 Weights ........................................................................................................................................... 12
LAPAROSCOPY AND GONAD INTERPRETATION......................................................................................... 12 Turtles whose gonads cannot be examined. .................................................................................. 13 Turtles whose gonads are examined.............................................................................................. 13
NESTING TURTLES, EGGS AND HATCHLING PRODUCTION ......................................................................... 14 Eggs: ............................................................................................................................................... 14
NESTING BEACH PARAMETERS............................................................................................................... 15 Nesting habitat: ............................................................................................................................... 15
TURTLE RODEO .................................................................................................................................... 16 NESTING BEACH CENSUS ...................................................................................................................... 16 POPULATION GENETICS......................................................................................................................... 17 STATISTICAL ANALYSIS.......................................................................................................................... 17 TURTLE DATABASE................................................................................................................................ 17 OTHER METHODS.................................................................................................................................. 17 REFERENCES ....................................................................................................................................... 17
CHAPTER 4 - DISTRIBUTION AND ABUNDANCE OF MARINE TURTLE NESTING IN NORTHERN AND EASTERN AUSTRALIA............................................................................................................... 19
INTRODUCTION ..................................................................................................................................... 19 METHODS ............................................................................................................................................ 19
Species identification from tracks: .................................................................................................. 20 Aerial survey ................................................................................................................................... 20 1997 WET SEASON aerial survey of northern Great Barrier Reef and Torres Strait E. imbricata nesting area: ................................................................................................................................... 21 1997 aerial survey of north-eastern Arnhem Land E. imbricata nesting area: ............................... 21 1999 DRY SEASON aerial survey of eastern Cape York Peninsula from Princess Charlotte Bay to Escape River, western Torres Strait and the Gulf of Carpentaria coast from Cape York to the Northern Territory border: ............................................................................................................... 21 1998 aerial survey of central Queensland N. depressus nesting area: .......................................... 22 On-ground surveys of nesting beaches .......................................................................................... 22
RESULTS.............................................................................................................................................. 23 Northern Great Barrier Reef, Torres Strait and eastern Gulf of Carpentaria:................................. 23

ii
Duration of nesting season: ............................................................................................................ 24 North-eastern Arnhem Land: .......................................................................................................... 25 Caretta caretta ................................................................................................................................ 26 Chelonia mydas .............................................................................................................................. 26 Natator depressus........................................................................................................................... 27 Lepidochelys olivacea ..................................................................................................................... 27 Dermochelys coriacea .................................................................................................................... 27
DISCUSSION ......................................................................................................................................... 27 ACKNOWLEDGMENTS ............................................................................................................................ 28 REFERENCES ....................................................................................................................................... 29
CHAPTER 5 - NESTING BIOLOGY OF ERETMOCHELYS IMBRICATA IN THE NORTHERN GREAT BARRIER REEF.................................................................................................................................... 41
INTRODUCTION ..................................................................................................................................... 41 STRUCTURE OF REPORT ....................................................................................................................... 41 STUDY SITES ........................................................................................................................................ 42
Principal study site .......................................................................................................................... 42 Additional study sites ...................................................................................................................... 42
METHODS ............................................................................................................................................ 42 RESULTS.............................................................................................................................................. 43
Study period.................................................................................................................................... 43 Species composition ....................................................................................................................... 43 Tagging census............................................................................................................................... 43 Standard census ............................................................................................................................. 44 Change of colony ............................................................................................................................ 45 Adult female mortality ..................................................................................................................... 45 Measurements ................................................................................................................................ 46 Recruitment to the breeding population.......................................................................................... 46 Renesting Interval ........................................................................................................................... 47 Spatial nesting distribution .............................................................................................................. 47 Nesting habitat ................................................................................................................................ 48 Nest depth....................................................................................................................................... 48 Sand temperatures ......................................................................................................................... 48 Number and size of eggs ................................................................................................................ 48 Egg diameter and egg weight ......................................................................................................... 49 Number of clutches ......................................................................................................................... 49 Incubation to emergence period ..................................................................................................... 49 Clutch disturbance .......................................................................................................................... 49 Hatching and emergence success.................................................................................................. 50 Size of hatchlings............................................................................................................................ 50 Post-emergence hatchling survivorship.......................................................................................... 50
DISCUSSION ......................................................................................................................................... 51 REFERENCES ....................................................................................................................................... 55 APPENDICES ........................................................................................................................................ 83
CHAPTER 6 - BREEDING MIGRATION .............................................................................................. 85
INTRODUCTION ..................................................................................................................................... 85 METHODS ............................................................................................................................................ 85 RESULTS.............................................................................................................................................. 85
Non residency adjacent to nesting beaches ................................................................................... 86 DISCUSSION ......................................................................................................................................... 86 REFERENCES ....................................................................................................................................... 87
CHAPTER 7 - RECRUITMENT OF ERETMOCHELYS IMBRICATA FROM THE PELAGIC TO THE BENTHIC-FEEDING LIFE HISTORY PHASE. ..................................................................................... 95
INTRODUCTION ..................................................................................................................................... 95 METHODS ............................................................................................................................................ 95 RESULTS.............................................................................................................................................. 95
Offshore post-hatchlings E. imbricata within pelagic environments: .............................................. 95 Immature E.imbricata within coastal habitats ................................................................................. 96
iii
DISCUSSION ......................................................................................................................................... 97 REFERENCES ....................................................................................................................................... 98
CHAPTER 8 - ERETMOCHELYS IMBRICATA FORAGING POPULATIONS IN EASTERN AUSTRALIA........................................................................................................................................ 107
INTRODUCTION ................................................................................................................................... 107 METHODS .......................................................................................................................................... 107 RESULTS............................................................................................................................................ 108
Captured sample........................................................................................................................... 108 Size and maturity of foraging turtles ............................................................................................. 109 Sex ratio ........................................................................................................................................ 109 Foraging site fidelity and developmental migration....................................................................... 110 Size at maturity ............................................................................................................................. 111 Basking ......................................................................................................................................... 112 Moreton Bay, a warm temperate foraging area ............................................................................ 113
REFERENCES ..................................................................................................................................... 114
CHAPTER 9 - GROWTH STUDIES OF IMMATURE ERETMOCHELYS IMBRICATA..................... 125
INTRODUCTION ................................................................................................................................... 125 METHODS .......................................................................................................................................... 125
Statistical methods........................................................................................................................ 125 RESULTS............................................................................................................................................ 126 DISCUSSION ....................................................................................................................................... 126 REFERENCES ..................................................................................................................................... 127
iv
List of Tables Table 4.1. Database coding used to summarise the estimated size of the annual nesting population for
each species of marine turtles for each beach surveyed. .............................................................. 32 Table 5.1. Annual study periods spent monitoring hawksbill turtle nesting activity at Milman Island,
northern Great Barrier Reef. ........................................................................................................... 58 Table 5.2. Observations on hawksbill turtle nesting activity on cays of the northern Great Barrier Reef
at various times during the year...................................................................................................... 58 Table 5.3. Number of primary hawksbill, green and flatback turtles nesting at Milman Island during the
annual study periods....................................................................................................................... 60 Table 5.4. Summary of tagging related data from nesting E. imbricata tagged at Milman Island and
subsequent remigration recaptures at Milman Island..................................................................... 61 Table 5.5. Remigration patterns found among hawksbill turtles tagged since the 1990/91 nesting
season and nesting during the 1998/99 season (A) and during the 1999/00 season (B). N = Turtle nested in that season...................................................................................................................... 62
Table 5.6. Inter-season change of colony (ISCHCOL) and within-season change of colony (WSCHCOL) recaptures of hawksbill turtles that have nested at Milman Island. .......................... 63
Table 5.7. Curved carapace length (cm) of adult female Eretmochelys imbricata nesting at Milman Island............................................................................................................................................... 64
Table 5.8. Curved carapace length (cm) of adult Eretmochelys imbricata nesting at Milman Island grouped by tagging status............................................................................................................... 64
Table 5.9. Proportion of hawksbill turtles recruiting to the breeding population compared with the proportion of remigrating turtles. ..................................................................................................... 65
Table 5.10. Mean curved carapace length (cm) for hawksbill turtles determined to be breeding for the first, second and third times in their lives........................................................................................ 66
Table 5.11. Weight (kg) of adult Eretmochelys imbricata nesting at Milman Island determined after oviposition. ...................................................................................................................................... 66
Table 5.12. Renesting interval of E. imbricata nesting at Milman Island during the study period. ....... 66 Table 5.13. Distribution of E. imbricata nests by vegetation cover and dune location on Milman Island.
........................................................................................................................................................ 67 Table 5.14. Depth of nest to top of eggs (A) and to the bottom of the chamber (B) of hawksbill turtle
nests laid at Milman Island during the study period........................................................................ 67 Table 5.15. Comparison between the depth of nest to top of eggs (A) and to the bottom of the
chamber (B) for hawksbill turtle nests laid at Milman Island during the study period the first five years of the study and the last five years. ...................................................................................... 68
Table 5.16. Sand temperatures (oC) of unshaded and shaded artificial nest sites (A) and among eggs in natural nests (B) on Milman Island between 4th December 1996 and 16th February 1997. ....... 69
Table 5.17. Number of eggs in clutches laid by hawksbill turtles nesting at Milman Island. ................ 70 Table 5.18. Diameter of hawksbill turtle eggs laid at Milman Island..................................................... 70 Table 5.19. Comparison of egg weight (g) between the 1990–1994 and the 1995–1999 study years at
Milman Island. ................................................................................................................................. 71 Table 5.20. Mean minimum number of clutches laid by hawksbill turtles nesting at Milman Island
during the breeding seasons of 1995–1999. .................................................................................. 71 Table 5.21. Duration of incubation of clutches laid by hawksbill turtles nesting at Milman Island........ 71 Table 5.22. The hatching success (A) and emergence success (B) of hatchling hawksbill turtles
incubated at Milman Island. ............................................................................................................ 72 Table 5.23. Hatching success (A) and emergence success (B) of clutches laid at Milman Island
compared between the first five-year and the second five-year periods. ....................................... 72 Table 5.24. Mean straight carapace length (cm) of hatchling hawksbill turtles. ................................... 73 Table 5.25. Morphometric data collected from nesting Eretmochelys imbricata in Queensland,
Australia. ......................................................................................................................................... 73 Table 6.1. Capture data for migrating Eretmochelys imbricata from QPWS studies and other published
records within the Coral Sea region................................................................................................ 89 Table 7.1. Pelagic post-hatchling Eretmochelys imbricata used for comparison within the present
study................................................................................................................................................ 99 Table 7.2. Size of immature Eretmochelys imbricata, which had recently recruited from the pelagic
environment to residency in inshore habitats in eastern Australia. ................................................ 99 Table 7.3. Juvenile Eretmochelys imbricata that had recently recruited to feeding residency on south
Queensland reefs during 1995 to 2000. ....................................................................................... 100

v
Table 8.1. Summary of Eretmochelys imbricata captured in foraging and courtship areas throughout Queensland................................................................................................................................... 116
Table 8.2. Summary of tagged Eretmochelys imbricata captured during past studies in 1974–1989 (Limpus 1992), incidental captures during 1989–1994 and during the present study 1994–1999 that was funded by JBA. ............................................................................................................... 117
Table 8.3. Results of logistic regression modelling of adult ratio by size class for each sex of Eretmochelys imbricata resident on coral reefs of the Great Barrier Reef. .................................. 119
Table 8.4. Estimates of the size of adult Eretmochelys imbricata in their first breeding cycle and of the size at which 50% of the size class is adult (AS50). ...................................................................... 119
Table 9.1. Analysis of deviance table for quasi-likelihood model of growth. bs( ) indicates a cubic B-spline was used............................................................................................................................. 128
Table 9.2. Analysis of deviance table for quasi-likelihood model of growth with female and male growth patterns indexed by size separately.................................................................................. 128
Table 9.3. Estimated time for Eretmochelys imbricata to grow from residency recruitment at a southern Great Barrier Reef foraging area .................................................................................................. 129
vi
List of Figures Figure 1.1. Tortoiseshell (Bekko) exports from the south-western Pacific Ocean region. ..................... 8 Figure 4.1. Distribution of hawksbill turtle, Eretmochelys imbricata, nesting in northern and eastern
Australia. Red denotes recorded E. imbricata nesting sites. .......................................................... 33 Figure 4.2. Distribution of loggerhead turtle, Caretta caretta, nesting in northern and eastern Australia.
Red denotes recorded C. caretta nesting sites............................................................................... 34 Figure 4.3. Distribution of green turtle, Chelonia mydas, nesting in northern and eastern Australia.
Red denotes recorded C. mydas nesting sites. .............................................................................. 35 Figure 4.4. Distribution of flatback turtle, Natator depressus, nesting in northern and eastern Australia.
Red denotes recorded N. depressus nesting sites. ........................................................................ 36 Figure 4.5. Distribution of olive ridley turtle, Lepidochelys olivacea, nesting in northern and eastern
Australia. Red denotes recorded .................................................................................................... 37 L. olivacea nesting sites. ....................................................................................................................... 37 Figure 4.6. Distribution of leatherback turtle, Dermochelys coriacea, nesting in northern and eastern
Australia. Red denotes recorded .................................................................................................... 38 D. coriacea nesting sites. ...................................................................................................................... 38 Figure 4.7. Summary of reported tortoiseshell (bekko) exports from Australia during the late 19th
Century and early 20th Century. ...................................................................................................... 39 Figure 5.1 Map showing the location of Milman Island and adjacent islands on the inner shelf of the
northern Great Barrier Reef, North Queensland............................................................................. 74 Figure 5.2a. The cumulative index of arrivals and departures of hawksbill turtles during the 1998/99
nesting season at Milman Island..................................................................................................... 75 Figure 5.2b. The cumulative index of arrivals and departures of hawksbill turtles during the 1999/00
nesting season at Milman Island..................................................................................................... 75 Figure 5.3. Number of hawksbill turtles nesting and the number of clutches laid at Milman Island
during the standard annual census period (15th January–15th February)....................................... 76 Figure 5.4 Cumulative proportion of recaptures by yearly cohort of hawksbill turtles tagged at Milman
Island............................................................................................................................................... 76 Figure 5.5a. Percentage primary tagged and percentage of new recruit hawksbill turtles nesting at
Milman Island 1990–1999............................................................................................................... 77 Figure 5.5b. Renesting interval for the 1998/99 and the 1999/00 nesting seasons............................. 77 Figure 5.6a. Nesting distribution by sector at Milman Island during the 1998/99 nesting season. ...... 78 Figure 5.6b. Nesting distribution by sector at Milman Island during the 1999/00 nesting season. ...... 79 Figures 5.7a–e. Temperatures from three different depths in artificial nests (a–d) and from among the
egg mass (e) near the centre of the clutch of hawksbill turtle eggs laid at Milman Island during the 1996/97 nesting season.................................................................................................................. 82
Figure 6.1. Migration by adult female and male hawksbill turtles, Eretmochelys imbricata, in the Coral Sea Region of the south western Pacific Ocean. ........................................................................... 92
Figure 6.2. Detachable harpoon head removed from the carapace of adult female Eretmochelys imbricata (T77910) nesting at Milman Island, 25th December 1999. .............................................. 93
Figure 7.1. Post-hatchling Eretmochelys imbricata (Q18957) captured in a surface plankton net in the Coral Sea (Table 7.1).................................................................................................................... 101
Figure 7.2. Immature female Eretmochelys imbricata (K3301) recently recruited from living in the pelagic environment, captured while feeding on Heron Island Reef, 12 August 1997. ................ 103
Figure 7.3. Immature Eretmochelys imbricata that have been resident on Heron Island Reef for different periods of time. ............................................................................................................... 104
Figure 7.4. Size of known age young Eretmochelys imbricata from eastern Australia. ..................... 105 Figure 7.5. Immature male Eretmochelys imbricata (T84763) recently recruited from living in the
pelagic environment, that was beach-washed and subsequently died, Sandy Straits in south Queensland, 4th October 1995...................................................................................................... 106
Recorded in feeding areas throughout eastern Australia.................................................................... 119 Figure 8.1. Eretmochelys imbricata resident on reefs within the Great Barrier Reef, eastern Australia.
...................................................................................................................................................... 121 Figure 8.2. Proportion of adult Eretmochelys imbricata present within the sample of captured turtles of
each sex by one degree latitudinal blocks along the east coast of Queensland. ......................... 122 Figure 8.3. Proportion of female Eretmochelys imbricata present within the sample of captured adult
and immature turtles by one degree latitudinal blocks along the east coast of Queensland. ...... 122

vii
Figure 8.4. Frequency distribution of maximum time interval between captures for Eretmochelys imbricata resident on coral reefs in the vicinity of Heron Island, southern Great Barrier Reef..... 123
Figure 8.5. Frequency distribution by sex and carapace length of large immature and adult Eretmochelys imbricata from northern Great Barrier Reef foraging areas. .................................. 124
Figure 9.1. Mean annual growth rates of immature Eretmochelys imbricata that were resident foraging turtles on coral reefs in the southern Great Barrier Reef. ............................................................. 130
Figure 9.2. Plots show mean-adjusted contribution of the B-spline of each covariate to the overall fit for each sex................................................................................................................................... 130

viii
1
Executive Summary
Results Breeding distribution • Nesting distribution maps are provided for each of the six species of marine turtles that
nest in Queensland and eastern Arnhem Land. • Eretmochelys imbricata nesting was recorded at 117 sites. • Areas with large nesting populations occur in central and eastern Torres Strait and the
northern GBR in Queensland and the English Company Islands of north-eastern Arnhem Land and Groote Eylandt area of eastern Arnhem Land in the Northern Territory.
• For each site with high density nesting there was a series of lower density nesting sites in the vicinity.
• A preliminary estimate of the size of the E. imbricata nesting population in north-eastern Australia is :
~2500 females annually for eastern Arnhem Land and ~4000 females annually in Queensland.
• Nesting occurs all year round. • In Queensland the peak nesting period is during December to February. Nesting beach studies • Milman Island was maintained as the representative long-term census study site for E.
imbricata within the north-eastern Australian stock. • 2027 nesting females were tagged during the 10 years of the total study. • Based on the 10 years of census data, the E. imbricata nesting population is in decline,
decreasing at 3% per year. • ~50% of a season’s nesting population will return within 6 yr to breed in a later season. • Mean remigration interval = 5.0 yr, females do not breed in consecutive seasons, and • 2 yr remigration intervals are rare. • While most nesting females display a high fidelity to a particular nesting beach, a
significant but small proportion of the nesting population will interchange between islands within and between breeding seasons, moving at least up to 36 km between sites.
• Mortality of nesting females while ashore for egg laying on islands of the northern GBR is trivial.
• On average a nesting female has a CCL = 81.5 cm; weighs 50.2 kg after laying a clutch; re-nests at 14.3 d intervals and lays at least 2.54 clutches in a season.
• Eggs are 3.51 cm in diameter; weigh 26.7 g at laying; have an incubation to emergence period of 59.7 d; hatching success = 86.7%; hatchling emergence success = 84.5%.
• Nests are usually (97.3%) laid above impact of tides, on the slope or above and in shaded environments. Nests are 18 cm deep to the top of the eggs and 39.7 cm deep to the bottom of the nest.
• Sand temperatures are more stable at increasing depth; are lower in shaded environments; decrease with cloudy and wet periods and increase during sunny warm periods.
• Hatchlings have an SCL = 3.95 cm and weigh 13.8 g. • Females in their first breeding season were identified by gonad examination and had a
CCL = 80.2 cm. • Remigrant turtles (CCL = 81.6 cm) were not significantly larger than first-time breeders. • The proportion of first-time breeders in the population (“adult recruitment rate”) has
increased over the 10 yr study period from <10% to >20%. The following parameters have yet to be quantified: • Pivotal temperature;
2
• Hatchling survivorship during dispersal from the beach to open ocean. Breeding migration • The E. imbricata that feed and breed within northern Queensland constitute a resource
shared at least by Australia, Indonesia, Papua New Guinea, Solomon Islands and Vanuatu.
• Breeding adult E. imbricata are as migratory as other species of marine turtles, travelling from 98 km to 2420 km between foraging areas and breeding sites.
• Adult E. imbricata do not normally live in the immediate vicinity of the area where they breed.
• Adult E. imbricata living in one area do not all migrate to breed at the same rookery. • Adult E. imbricata that breed at the same rookery do not all migrate to the same foraging
area. • The migration recapture data indicate that many of the E. imbricata that migrate from
Australia into neighbouring countries are harvested. Recruitment from the pelagic to the benthic feeding life history phase • Small immature E. imbricata arrive from open-ocean pelagic habitats and recruit to
residency in benthic reefal foraging areas at a mean CCL = 36.3 cm and an age of 5–7 yr.
Eretmochelys imbricata foraging populations in eastern Australia • 1097 captures of 877 E. imbricata occurred within foraging and courtship areas. • CCL size classes ranged 32–95 cm • Eretmochelys imbricata populations were structured differently in each major feeding
area with a high representation of large immatures and adults in samples from the far northern GBR (11o –14o S) and a low proportion of adults in areas to the south.
• Sex ratio was strongly biased toward females with male:female ratio between 1:2 and 1:3.
• The female bias occurred in all areas and for all age classes except in the vicinity of the main nesting beaches where the adult sex ratio was reversed to approximately 2 males to 1 female.
• Eretmochelys imbricata that live in the GBR show high fidelity to local foraging areas for extended periods of time.
• No tag recoveries have occurred in support of the south to north developmental migration hypothesis that proposed that juvenile turtles recruiting into the southern GBR migrate northward as they approach maturity.
• To quantify size at first breeding, a statistical approach analyzing the proportion of adults in each 1 cm size class was used to define the size at which 50% of the E. imbricata are adult (= AS50) for each sex: AS50 for females = 83.9 cm; AS50 for males = 80.6 cm.
Growth studies of immature Eretmochelys imbricata • 196 growth increments from 137 immature E. imbricata from the southern GBR were
analysed. • Growth of immature turtles is non-monotonic and sex specific, with females growing
faster. • Growth is generally slow with CCL growth rate < 2 cm/yr and growth rate peaking at
about CCL = 60 cm. • Estimated age to first breeding was 31–36 years of age for females and 38 years of age
for males.

3
Conclusions The northern Great Barrier Reef, Torres Strait and eastern Arnhem Land support one of the most significant E. imbricata nesting populations in the world. The Great Barrier Reef with its great herds of foraging E. imbricata is a major foraging area for the species within the south-western Pacific Ocean. A 3% rate of decline in the nesting population in parallel with > 20% proportion of first time breeding females in the population are clear warning signals that the north Queensland E. imbricata nesting population has a significant conservation management problem. The most obvious large source of mortality that can be identified to this stock is the continuing substantial harvest of E. imbricata for food and tortoiseshell in the broader Coral Sea region.

4

5
CHAPTER 1 – Introduction
Cheloniid turtles are characterised by a complicated life history: their eggs are laid on warm beaches; hatchling sex is determined temperature dependent sex determination during embryonic development; lack of parental care; hatchlings are imprinted to the natal area; hatchlings disperse to feed on plankton in the pelagic environments followed by inshore recruitment to feed on benthic organisms; immature turtles have slow growth and delayed maturation; adults migrate to breed in their respective natal area; they lay multiple clutches in a breeding season but dot normally breed annually; adults display high fidelity to both their respective breeding and the feeding areas and have an extended adult life (Hirth. 1997). Biological understanding of the hawksbill turtle, Eretmochelys imbricata, has, until recently, been less advanced than the knowledge concerning some of the other marine turtle species (Witzell, 1983. See also the special 1999 issue of Chelonian Conservation and Biology 3(2) on the species). In the context of sustainable management strategies, many of these aspects have been inadequately quantified for this species (Chaloupka and Musick 1997). Until the late 1980s, little emphasis was placed on research and management of E. imbricata in Queensland, beyond ensuring the species was protected (by Order in Council 8th July 1968 under the Queensland Fisheries Act), declaring most of the significant nesting sites within the Great Barrier Reef as National Parks (including Milman Island), and conducting some introductory research and monitoring (Limpus 1980, Limpus et al. 1983). By 1989, it was apparent that large numbers of E. imbricata were being harvested in neighbouring countries including Indonesia, Papua New Guinea, Solomon Islands and Fiji to supply meat and/or tortoiseshell (also known as Bekko) for use locally or for export (Groombridge and Luxmoore 1989, Limpus 1997). Most of the export of bekko from countries such as Solomon Islands and Fiji, which were not signatories to C.I.T.E.S., was directed to Japan at that time (Fig. 1.1). Wide spread but unquantified legal consumption of E. imbricata eggs by Torres Strait Islanders from the nesting beaches on central and western Torres Strait is on going (Limpus and Parmenter, 1986; Johannes and MacFarlane, 1991). Because of the apparent increasing harvest of regional E. imbricata populations and the presumed sharing of this species as a common resource by the countries of the south-western Pacific region, concern was held for the sustainability of E. imbricata populations within the Great Barrier Reef and elsewhere in Queensland. In response to this concern, long-term research and monitoring of a major nesting population was begun in the 1990-1991 breeding season at Milman Island. Kirstin Dobbs (nee Loop) led the field studies at Milman Island for five seasons as part of her Fulbright Scholarship and PhD studies (Loop et al. 1995, Miller et al. 1998, Dobbs et al. 1999). At the same time, a pilot survey of E. imbricata nesting in the northern Great Barrier Reef was initiated (Miller et al. 1995) and the identification of genetically discrete stocks commenced in collaboration with Prof. C. Moritz, University of Queensland (Broderick et al. 1994). Analysis of incidentally gathered E. imbricata data from turtles that inhabited foraging areas in the southern Great Barrier Reef (Limpus 1992) also commenced. The results of this early work formed the basis upon which the present five-year study was planned and initiated through consultation between one of the authors (CJL) and representatives of the Japan Bekko Association (JBA). The intent of the study was to quantify a comprehensive spectrum of parameters for wild E. imbricata populations that can guide planning for sustained management of E. imbricata stocks in the South-western Pacific region. The study was not designed to quantify E. imbricata egg and turtle utilisation within this same region.
6
The generous support, provided by JBA, enabled us to implement the study of an E. imbricata population across a wide part of its life history (adult breeding, incubation and hatchling production, migration, and foraging) and for a significant time frame of five years. The success of the study was greatly enhanced because it built on the pre-existing introductory studies. As a consequence, the results of this study will be broadly applicable to population modelling with a view to sustainable management of E. imbricata stocks within the Australasian region and to a lesser extent at a global level. A pleasing aspect of the study is that it has enabled us to demonstrate that it is possible to succeed in a timely manner with well planned E. imbricata studies that are focused to quantifying key demographic parameters. It has succeeded even though we have been working with a wild species, which traditionally has been regarded as difficult to study in these ways. This publication reports on the JBA funded studies undertaken with the E. imbricata populations foraging and nesting within Eastern Australia and the Gulf of Carpentaria. The project has been a major step forward in cooperation between the bekko industry and conservation management for sustainable utilisation. The immediate results of these studies represent a significant contribution by JBA in collaboration with Queensland Parks and Wildlife towards a more comprehensive understanding of the functioning of E. imbricata populations. The challenge now will be to integrate the results into practical regional management for the species.
References Chaloupka, M. Y. and Musick, J. A. (1997). Age, growth and population dynamics. In ‘The Biology of Sea turtles.’ (Eds. Lutz, P. L. and Musick, J. A.) pp. 233–276. (CRC Press: Boca Raton.) Broderick, D., Moritz, C., Miller, J. D., Guinea, M., Prince, R. I. T. and Limpus, C. J. (1994). Genetics studies of the hawksbill turtle Eretmochelys imbricata: evidence for multiple stocks in Australian waters. Pacific Conservation Biology 1(2), 123–131. Dobbs, K.L., Miller, J.D., Limpus, C. J. and Landry, A.M. (1999). Hawksbill turtle, Eretmochelys imbricata, nesting at Milman Island, northern Great Barrier Reef, Australia. Chelonian Conservation and Biology 3, 344–361. Groombridge, B. and Luxmoore, R. (1989). ‘The green turtle and hawksbill turtle (Reptilia: Cheloniidae): world status, exploitation and trade.’ (Convention on the Illegal Trade in Endangered Species: Luasanne, Switzerland.) Hirth, H. F. (1997). Synopsis of the biological data on the green turtle Chelonia mydas (Linnaeus 1758). US Department of the Interior Fish and Wildlife Service Biological Report 97(1), 1–120. Johannes, R. E. and MacFarlane, J. W. (1991). Sea Turtles. In ‘Traditional Fishing in the Torres Strait Islands.’ Pp. 53-72. (CSIRO: Australia)
Limpus, C. J. (1980). Observations on the hawksbill turtle (Eretmochelys imbricata) nesting along the Great Barrier Reef. Herpetologica 36, 265–271. Limpus, C. J. (1992). The hawksbill turtle, Eretmochelys imbricata, in Queensland: population structure within a southern Great Barrier Reef feeding ground. Wildlife Research 19, 489–506. Limpus, C. J. (1997). Marine turtle populations of South-east Asia and the Western Pacific region. pp. 37–73. In: ‘Proceedings of the workshop on Marine Turtle Research and Management in Indonesia’. (Y. R. Noor, I.R. Lubis, R. Ounsted, S. Troeng and A. Abdullah, eds.) Wetlands International/PHPA Environment Australia, Bogor, Indonesia.
7
Limpus, C. J., Miller, J. D., Baker, V., and McLachlan, E. (1983). The hawksbill turtle, Eretmochelys imbricata (L.), in North-eastern Australia: the Campbell Island rookery. Australian Wildlife Research 10, 185–197. Limpus, C. J. and Parmenter, C. J. (1986). The sea turtle resources of the Torres Strait Region. In ‘Torres Strait Fisheries Seminar, Port Moresby 11 - 14 February 1985’. (Eds. Haines, A. K., Williams, G. C., and Coates, D.) Pp. 95-105. (Australian Government Printing Services: Canberra.) Loop, K. A., Miller, J. D., and Limpus, C. J. (1995). Nesting by the hawksbill turtle (Eretmochelys imbricata) on Milman Island, Northern Great Barrier Reef, Australia. Wildlife Research 22, 241–252. Miller, J. D., Daly, T., Card, M. and Ludecke, J. (1995). Hawksbill turtle nesting in the Northern Great Barrier Reef and Torres Strait. Queensland Department of Environment and Greenpeace report. Miller. J. D., Dobbs, K. A., Limpus, C. J., Mattocks, N. and Landry, A. M. (1998). Long distance migration by the hawksbill turtle, Eretmochelys imbricata, from north-eastern Australia. Wildlife Research 25, 89–95. Witzell, W. N. (1983). Synopsis of the biological data on the hawksbill turtle Eretmochelys imbricata (Linnaeus, 1766). FAO Fisheries Symposium 137, 1–78.

8
1969 1971 1973 1975 1977 1979 1981 1983 1985 1987 1989 1991
YEAR
0
1
2
3
4
5TO
RTO
ISES
HEL
L (to
nne)
Solomon IslandsFiji
Figure 1.1. Tortoiseshell (Bekko) exports from the south-western Pacific Ocean region. Data obtained from Japanese trade statistics. 1 tonne of tortoiseshell = ~ 1,000 large hawksbill turtles (based on data reported in Groombridge and Luxmoore, 1989).
9
CHAPTER 2 - Acknowledgments This five-year study of the population dynamics of northern and eastern Australian Eretmochelys imbricata has been made possible by a grant from the Japan Bekko Association to the Queensland Parks and Wildlife Service (QPWS). QPWS was the Queensland Government wildlife conservation agency at that time. The research was conducted as part of the Queensland Turtle Conservation Project, a research project of QPWS. Considerable assistance was received from the shipping company, SEASWIFT Pty. Ltd., which transported the study team to and from Milman Island and provided regular supply of provisions and fresh water to the team. P&O Australian Resorts donated transport of the study team; the turtle catch boats and other equipment to Heron Island from Gladstone. QPWS staff employed on the project included: Southern study team:
Dr Colin Limpus Duncan Limpus, Technical Officer
Northern study team: Dr Jeffrey Miller Ian Bell, Technical Officer employed from the grant. Peter Beloff
Daen Auden, Les Bauer, Leisa Fien, Matt Forrest, Alan Goldizen, Nancy Fitz-Simmons, Karl French, Mark Hamann, Tim Jessop, Neil Mattocks, Dr John Parmenter, Connie Parmenter, Tony Parmenter, Andrea Phillott, Rick Van Veen and numerous other volunteer assistants participated in the study. Numerous QPWS staff provided assistance in many ways during the preparation for and while the team was engaged in field studies. Samantha Low Choy assisted with some aspects of the statistical analysis. This assistance is gratefully acknowledged.

10

11
CHAPTER 3 - Methods Within this JBA funded study of the population dynamics of the hawksbill turtle, Eretmochelys imbricata, in Australia, the standard methodology used in previous Queensland Turtle Conservation Project (QTC) studies of Eretmochelys imbricata in Australia were followed. See Limpus (1985, 1992a); Limpus et al. (1983); Loop et al. (1995) and Miller (1985) for additional information. Tagging The turtles were tagged with self-locking standard titanium turtle tags (Stockbrands Company, Pty. Ltd., Perth, Western Australia.). The reverse side of the tags was inscribed: “RETURN WILDLIFE BOX 155 BRISBANE 4002 QLD AUSTRALIA.” The tags were applied in the axillary tagging position of the front flipper (Limpus 1992b). The axillary tagging position is through or immediately adjacent to the enlarged scale closest to the body on the posterior edge of the left and right front flippers. If the animal already carried tags, the condition of the tags was assessed and an objective decision made as to whether to add another tag(s) to the turtle. Each turtle was released with a minimum of two securely attached titanium tags, one in each front flipper. In addition, commencing in October 1995, E. imbricata captured in the Capricorn Reefs and Moreton Bay feeding areas were also tagged with a PIT tag injected under the anterior margin of the point of the carapace above the shoulder. After injection of the PIT tag, the injection hole was sutured closed using a soluble suture to prevent the tag being lost before healing of the injection site had begun. This additional tag is being used to increase long-term recognition of individual turtles in the low probability event of both titanium tags being lost. Turtle measurements Curved carapace measurements: Curved carapace measurements were taken using a flexible fibreglass tape measure (± 0.1 cm) laid over the curve of the carapace. The calibration of fibreglass tape measures was checked regularly against steel measures. Use of a tape measure was discontinued when length changes exceeded ± 0.2 cm within 100.0 cm. Any large barnacles on the carapace likely to interfere with a measurement were removed. • Curved carapace length (CCL) was measured along the midline from the junction of the
skin and carapace above the neck to the most posterior edge of the supracaudal scute. • Curved carapace width (CCW) was measured perpendicularly to the midline axis of the
carapace between the outer extremities of the marginal scales. This measurement was repeated at several positions to obtain the greatest value. For turtles whose carapace was reflexed upwards near the marginal scales, this measurement was made with the tape measure stretched tightly between the outer extremities of the marginal scales, i.e. it was not always in contact with the surface of the carapace for the full width.
No carapace measurement was taken of some turtles because: • It was a nesting turtle returning to the sea that could not be stopped, • It had damage to the rear of the carapace, or • It had burrowing barnacles (Tubicinella cheloniae), which had caused extensive deformity of
the carapace preventing an accurate measurement.
12
Straight carapace measurements: • Straight carapace length (SCL) and straight carapace width (SCW) were taken between
the same points as the corresponding curved measurements (CCL and CCW) using either a large pair of wooden callipers or large steel vernier callipers. The width between the tips of the wooden callipers was measured with a steel tape measure (± 0.1 cm).
• Carr's straight carapace length (CSCL): Measured as the straight-line length from the most anterior to the most posterior projections of the carapace (Carr and Ogren 1960). This is not a midline measurement.
Head measurements: Head measurements were taken using stainless steel vernier slide callipers (± 0.01 cm). With large turtles it was necessary to support the turtle vertically (balanced on the posterior of its carapace) and deflect the head ventrally to enable head measurements to be taken. • Head length (HL): From the anterior tip of the maxillary sheath (upper beak) to the posterior
margin of the supraoccipital process, keeping the arm of the callipers parallel to the dorsal surface of the skull.
• Head width (HW): Maximum width across the skull measured at the quadrate bones. Plastron length: (PL) was measured using a flexible tape measure (± 0.5 cm) along the midline from the anterior junction of the skin and plastron scutes to the posterior margin of the cartilagenous/bony plate. Tail measurements: were taken to the tip of the straightened tail using a steel tape measure (± 0.5 cm). • Tail length from plastron (TLP): Measured from midline posterior of the
cartilagenous/bony projection of the plastron. • Tail length from carapace (TLC): Measured from the most posterior edge of the
supracaudal scute. A negative sign for this measurement indicates a distance short of the carapace margin.
• Tail length from vent (TLV): Measured from the anterior margin of the vent. • Tail Length from plastron to vent (LPV): Calculated as the difference between tail length to plastron and tail length to vent. Hatchling straight-line measurements: were taken similarly to those for the larger turtles but were measured with vernier callipers (± 0.1 cm). Weights • Nesting females and turtles from feeding areas were weighed by turning them on their
backs and lifting via a spring balance attached by four ropes, each noosed to the base of a flipper or by a continuous 4 m long, figure ‘8’ strap. The turtles were weighed on either 10 (± 0.2) kg or 100 (± 0.5) kg spring scales. Nesting females were weighed after they had completed oviposition and before they had returned to the sea. The first recorded weight for each nesting turtle each season was used as the measurement for comparison between seasons.
• Hatchlings were weighed with a spring balance (± 0.5 g). Laparoscopy and gonad interpretation Because most immature male turtles cannot be distinguished from females using external sexual characteristics, turtles were sexed by visual examination of the gonad and associated ducts using a laparoscope (Limpus 1992a; Limpus et al. 1994a,b). The standard laparoscope used was a 5 mm-diameter scope inserted through a 7 mm- diameter cannula. The cannula was inserted through the inguinal area anterior to and lateral to the right hind flipper. To facilitate the insertion of the cannula, a 1 cm incision was made in the skin with a scalpel.

13
Passage of the cannula through the underlying muscle and connective tissue and penetration of the peritoneum was facilitated with the trochor supplied with the cannula. On removal of the cannula, the skin incision was closed with a water-soluble suture. To minimise infection, the instruments were maintained in a 70% ethanol bath in preparation for and following each surgical examination and were scrubbed and boiled on a regular basis. Gonad biopsies were taken during some laparoscopic examinations using punch biopsy forceps passed through a 5 mm cannula inserted adjacent to the cannula for the telescope. Gonad samples were fixed in 10% formalin and routinely wax embedded, cut to 8µ sections and dyed with haematoxylin and eosin or periodic acid - Schiff (PAS) technique. Within this study, a turtle is defined as mature (adult) if it’s gonads and associated ducts were fully developed; it does not imply that the turtle has already bred, only that it is structurally capable of reproducing. The following key was applied for assessing the sex and maturity status of E. imbricata (modified from Limpus 1992a): Turtles whose gonads cannot be examined. • Female: Nesting turtles are obviously adult females.
• Short-tailed (TLC < 7 cm) turtles in courtship groups are probably adult females. • Male: Any turtle with TLC > 7 cm is accepted as male.
• If TLC < approximately 13.0 cm, it is an immature male; • if TLC > approximately 13 cm, it is an adult. • Long-tailed turtles in courtship groups are accepted as adult males.
• Unsexed: Any other turtle. • Maturity: Any turtle with an undifferentiated tail and with CCL less than the minimum
breeding size for E. imbricata is accepted as immature. • The minimum breeding size recorded for E. imbricata in eastern Australia is CCL ~ 65
cm (Loop et al. 1995). • The maturity status of short-tailed, unsexed turtles with CCL > 65 cm must be scored as
'undetermined'. Turtles whose gonads are examined. Females: • mature: ovary with expanded stroma. Oviduct pink, very convoluted and strap-like, and at
least 1.5 cm wide adjacent to the ovary. Yellow, vascularised, vitellogenic follicles (0.3–2.6 cm diameter) may be present. There may also be present, corpora lutea, corpora albicantia (= scars from healed corpora lutea) or atretic follicles in the ovary or eggs in the oviduct.
• immature pubescent: Oviduct partly convoluted, and oval in cross-section and 0.3–1.5 cm wide adjacent to the ovary. Stroma may be expanding. No corpora albicantia, corpora lutea, developing follicles or atretic follicles present.
• immature: Ovary with non-expanded stroma. Oviduct white, straight or slightly convoluted, cylindrical to oval in cross-section and < 1.5 cm wide opposite the ovary. No vitellogenic follicles, corpora lutea, corpora albicantia or atretic follicles will be present in the ovary. Tail length indistinguishable from that of adults.
Because a corpus albicantium is a healed corpus luteum and a corpus luteum is formed by the release (ovulation) of a mature follicle from the ovary, the presence of corpora albicantia indicates that a female has bred in a past nesting season. Similarly the absence of corpora albicantia on the ovaries of a nesting female indicates that she has not bred in a past breeding season, i.e. she is in her first breeding season. Therefore the absence of corpora albicantia in

14
the ovaries of females at the nesting beach can be used to identify those females that are new recruits to the nesting population. Males: • mature: testis cylindrical, epididymis distinctly enlarged and pendulous. • immature pubescent: non-pendulous epididymis bulging from the body wall into the body
cavity (= ridged epididymis) and testis approximately elliptical in cross-section. These turtles should also be characterised by TLC = 5–13 cm, claws elongating and recurving, penis distinguishable from clitoris.
• immature prepubescent: testis flat or cylindrical, epididymis not bulging from the body wall.
When a turtle had gonads that could not clearly be identified as either male or female, the turtle was defined as an intersex animal for the purposes of the present study. Nesting turtles, eggs and hatchling production Remigration interval: measured in whole years as the interval between breeding seasons. Renesting interval: calculated as the time interval in days beginning when a turtle laid a clutch of eggs and ending when she emerged again on the island to crawl into the nesting habitat (sensu Limpus 1985). It is assumed that if all conditions had been right, the turtle would have laid during that nesting crawl. If a turtle emerged but did not lay eggs, a disturbance factor was identified (e.g. beach-rock cliff, lightning, tree roots, damaged hind flippers). Clutches laid per female per breeding season: calculated after adding clutches to females for whom a missed emergence was recorded. Clutches were added to the count if the turtle was encountered at intervals greater than 22 days, implying that the turtle laid another clutch but was not encountered on the beach (Loop et al. 1995). Eggs: Clutch count: Number of yolked shelled eggs in a normal undisturbed nesting. • A turtle disturbed while laying may cease laying and return to the sea only to return later the
same night or on a subsequent night to lay the remainder of the eggs she is carrying in her oviducts. The sum of these two partial clutches is counted as the clutch count for the laid-disturbed nesting sequence.
• Yolkless eggs are not included in the clutch count. • Multiyolked egg: An egg with more than one yolk, each with its respective embryonic
structure within the one enclosing shell, e.g. a double yolked egg contains 2 yolks. Each is counted as a single egg irrespective of the number of yolks that each egg contains.
• Yolkless egg: Shelled lump of albumen sometimes surrounding fragments of yolk, which are not enclosed by a vitelline membrane (Miller 1985). No embryonic structure or nucleus fertilised or otherwise, is associated with the yolkless egg.
Egg measurements: In selected clutches, 10 eggs per clutch were cleaned of sand, measured, and weighed within 1 hour of oviposition. The average egg diameter and weight were obtained by averaging the values obtained for individual eggs within each clutch. • Egg diameter: minimum and maximum diameters were taken on each egg with stainless
steel vernier callipers (± 0.1 cm). The average of the minimum and maximum diameters was used as the diameter of the egg (Limpus 1985).
• Egg weight: eggs were weighed in a plastic bag with a Pesola spring balance (± 0.5 g).
15
Incubation: Incubation success for each clutch was assessed by excavating the nest following hatchling emergence and counting the eggs and egg shells under the following categories: • Shells (= hatched eggs) - count of empty egg shells which are at least 1/2 or greater
intact, left in nest chamber; • Live-in-nest hatchling - live hatchling remaining among the empty shells in the nest, or a
hatchling trapped in grass roots or other obstruction in the neck of the egg chamber; • Dead-in-nest hatchling - dead hatchling (out of its egg shell) found within the nest; • Undeveloped egg - unhatched egg with no obvious embryo [embryonic stage < 12 (Miller
1985)]; • Unhatched egg - unhatched egg with obvious embryo [embryonic stage > 11 (Miller
1985)]; • Predated egg - empty nearly complete eggshell opened by crabs, varanid lizards, foxes,
or other predator. Emerged hatchlings = shells - (live-in-nest + dead-in-nest). Hatching success was calculated as the number of hatchlings that hatched from the egg shell divided by the total number of yolked eggs laid in the clutch. This value included live and dead hatchlings found emerged from the egg shell but still in the egg chamber. = shell / (shell + undeveloped eggs + unhatched eggs + predated eggs) Emergence success was calculated as the number of hatchlings that successfully emerged from the egg chamber divided by the total number of yolked eggs laid in the clutch. This value did not include live and dead hatchlings found in the egg chamber when it was excavated. = [shells – (Live-in-nest + Dead-in-nest)] / [shell + undeveloped eggs + unhatched eggs + predated eggs] Incubation period (days): calculated from the date the eggs were laid to the date of hatchling emergence onto the beach surface. This parameter includes the period that it takes for the hatchling to dig from the eggs to the beach surface. Incubation period could only be calculated for clutches whose locations were marked as they were laid. The duration of incubation for marked clutches was averaged to determine the mean for the island during the study period. Nest depth: Nest depths were measured from the beach surface using a flexible tape measure (± 1 cm). • Nest depth, top: to the top egg in the chamber. • Nest depth, bottom: measured to the bottom of the egg chamber once the eggs had been
removed for counting. Nesting beach parameters Beach sectors: The beach at Milman Island was subdivided into numbered sectors around the perimeter of the island. Numbered posts placed at 50 m intervals defined each sector. The sector number was recorded whenever a nesting turtle was encountered.
Nest site fidelity was calculated as the distance between sectors for turtles nesting more than once.
Nesting habitat: • The environment above egg chamber was categorised as being bare sand, grass or
shrub/tree.

16
• Location of the egg chamber was classified as being below high water (if it was below the level of the spring high-tide line), below the slope of the dune, or on top of/behind the top of the dune.
Sand temperatures were recorded by placing a NATA certified thermometer into the side of the egg chamber at the bottom depth once all the eggs had been removed. Turtle rodeo Eretmochelys imbricata were captured as they were encountered during systematic searches of the various habitats available. Turtles were captured by day using the turtle rodeo and beach jump capture methods (see Limpus 1992a for more details). In addition to the daytime capturing, night time turtle rodeo captures were attempted over the reef flat adjacent to Heron Island with the aid of a 12V flood-light mounted beneath the catch boat. The beach jump capture method was used only adjacent to the islands and was attempted at high tide along the beach by night and on the reef flat at low tide by day. Following their capture, most turtles were landed on a nearby island or boat for weighing, measuring and laparoscopic examination. They were released from the island or boat usually within 5 hr of being brought ashore. The remainder was released where captured, usually within 10 min of the capture, after having been measured and tagged. Feeding site fidelity studies: Between May 1974 and April 1991 numerous Eretmochelys imbricata were captured and released at the same reef where they were captured within the Capricorn-Bunker Group of the southern GBR. A search for previously tagged turtles continued during this study to provide data that addresses: • The hypothesis of developmental migration of these turtles as they grow and • The extent to which individual turtles are maintaining a site fidelity to their individual feeding
areas. Artificial enhancement of the density of turtles in feeding areas: Between November 1975 and March 1987, some turtles captured on adjacent reefs were taken to Heron Island and released onto Heron Island Reef to test if Eretmochelys imbricata numbers can be locally increased through a relocation and release program. Specific searches were made for these turtles during this study. Nesting beach census Past research with Caretta caretta and Chelonia mydas nesting populations in the southern GBR, has indicated that the results of counts of nesting females at a rookery at a standard period during the peak of the nesting season is a good index of the size of the annual nesting population (Limpus 1985; unpublished QTC data). The census period is best if it encompasses at least one renesting interval. The one-month period, 15th January to 14th February, has been surveyed by tagging census at Milman Island for nine of the ten years that the study has been in progress. This period, which is approximately two renesting intervals long and occurs within the peak period of nesting, has therefore been chosen as the standard census period for this population. The standard census will be the count of tagged nesting turtles recorded during this census period. Because the number of clutches laid is also a function of the number of turtles nesting at a rookery, a second census count of the number of clutches laid during the standard census period will be used also.

17
Population genetics Tissue samples were routinely collected from Eretmochelys imbricata captured in feeding areas for genetic analysis to determine the stocks from which the turtles originate. These samples have been stored at the University of Queensland genetics laboratory. These samples are currently being analysed as part of a broader Indo-Pacific E. imbricata population genetics study and will be reported elsewhere. Statistical analysis Unless stated otherwise, results were analysed following Zar (1984). Mean ± standard deviation is reported for various parameters. Unless otherwise stated, the statistical significant level was set at P < 0.05. Turtle database Data gathered from each turtle and for each capture are summarised into the QPWS Turtle Research database, which is managed by CJL. This database is structured on “dbf” files that are compatible with dBase, DBXL, Foxpro and Access database management systems and Arcview GIS software. Data are collated to the files using customised data entry programs that currently run within DBXL. All original data sheets are retained as back-up copies of the data. In addition, once the files have been validated for correct entry of the data, backup copies of all data files are appended to the master files, which are maintained on several computers. A dictionary of defined codes used in the summarising of data on the computer files is maintained for the project. Other methods Other specific methods are described in relevant chapters, e.g., aerial survey methods in Chapter 4. References Carr, A., and Ogren, L. (1960). The ecology and migration of sea turtles. 4, the green turtles in the Caribbean Sea. Bulletin of the American Museum of Natural History 121, 1–48. Limpus, C. J. (1985). A study of the loggerhead sea turtle, Caretta caretta, in eastern Australia. Unpublished PhD thesis, Zoology Department, University of Queensland. Limpus, C. J. (1992a). The hawksbill turtle, Eretmochelys imbricata, in Queensland: population structure within a southern Great Barrier Reef feeding ground. Wildlife Research 19, 489–506. Limpus, C. J. (1992b). Estimation of tag loss in marine turtle research. Wildlife Research 19, 457–469. Limpus, C. J., Couper, P. J. and Read, M. A. (1994a). The green turtle Chelonia mydas, in Queensland: population structure in a warm temperate feeding area. Memoirs of the Queensland Museum 35, 139–154. Limpus, C. J., Couper, P. J. and Read, M. A. (1994b). The loggerhead turtle Caretta caretta, in Queensland: population structure in a warm temperate feeding area. Memoirs of the Queensland Museum 37, 195–204. Limpus, C. J., Miller, J. D., Baker, V. and McLachlan, E. (1983). The hawksbill turtle, Eretmochelys imbricata (L.), in north-eastern Australia: the Campbell Island rookery. Australian Wildlife Research 10, 185–197. Loop, K. A., Miller, J. D. and Limpus, C. J. (1995). Nesting by the hawksbill turtle (Eretmochelys imbricata) on Milman Island, Great Barrier Reef, Australia. Wildlife Research 22, 241–252. Miller, J. D. (1985). Embryology of marine turtles. In “Biology of the Reptilia.” Vol. 14. (Gans, C., Billet, F. and Maderson, P.) eds. pp. 269–328. (John Wiley and Sons: New York).

18
Zar, J. H. (1984). Biostatistical Analysis. (Prentice-Hall: Englewood Cliffs, New Jersey.)

19
CHAPTER 4 - Distribution and abundance of marine turtle nesting in northern and eastern Australia Colin J. LimpusA, Jeffrey D. MillerA and Raymond ChattoB A Environmental Protection Agency. B Wildlife Commission of the Northern Territory.
Introduction Six species of marine turtles come ashore for egg laying in northern and eastern Australia, including large numbers of hawksbill turtles, Eretmochelys imbricata. Recent genetics studies have suggested that the two substantial E. imbricata breeding populations of north Queensland and north-eastern Arnhem Land are part of the same metapopulation (Broderick et al. 1994). Although there had been past surveys of marine turtle breeding in parts of north-eastern Australia (Chatto 1998; Cogger and Lindner 1969; Kowarsky 1978; Limpus 1980; Limpus et al. 1983a,b; Miller and Limpus 1991; Miller et al. 1995), the breeding of this E. imbricata population had not been adequately surveyed to describe spatial or temporal distribution. In response to this, aerial surveys of the nesting distribution of E. imbricata in northern and eastern Australia were undertaken. Two surveys were planned initially, each to occur at the mid breeding season for the species in north Queensland (in February - wet season) and north-eastern Arnhem Land (in Spring - dry season), respectively. However, for green turtles, Chelonia mydas, and flatback turtles, Natator depressus, there are major differences in the timing of breeding seasons for each species between those that breed in the Great Barrier Reef and eastern Torres Strait (summer - wet season breeding) and those that breed in the Gulf of Carpentaria and western Torres Strait (winter - dry season breeding) (C. mydas: Limpus 1978; Limpus et al. 1994; Garnett et al. 1985. N. depressus: Limpus 1971; Limpus et al. 1983b, 1989, 1993). Therefore, when a substantial mid-summer Eretmochelys imbricata nesting population was identified in western Torres Strait during the present study, an additional winter survey of turtle nesting was undertaken within the eastern Gulf of Carpentaria and western Torres Strait to better define the breeding distribution of this species. Methods A survey of the distribution and abundance of E. imbricata nesting was conducted throughout northern and eastern Australia encompassing the known nesting range of the genetically identified stock that breeds in north Queensland and the north-eastern Northern Territory (= north-east Australian [NEA] stock, Broderick et al. 1994). Data were obtained from two sources: aerial surveys and on ground surveys of nesting beaches. For the purposes of mapping the beaches, the coastline was subdivided into discrete lengths of sandy beach delimited by prominent features such as rivers, creeks, headlands and rock outcrops. Each beach was identified by the latitude and longitude at its commencement, when travelling in a clockwise direction around the Australian coastline or around an island. For small islands with only a single beach, the latitude and longitude is taken from the mid-point of the island. Latitudes and longitudes were read from the respective marine charts or from hand held global positioning system (GPS) units.

20
Species identification from tracks: When turtles were not sighted, tracks from nesting turtles were identified to species using the following key:
1a. breast-stroking gait (rear flipper marks on either side of the central skid mark of the plastron are adjacent)…………………………………..……...…..go to 2
1b. alternating gait (hind flipper marks on either side of the central skid mark of the plastron are not adjacent)…..………………………..….…………... go to 4
2a. narrow (<10cm wide) or no front flipper marks outside of the hind flipper marks…………………………………………………….……Natator depressus
2b. wide (>10cm wide) and obvious front flipper marks outside of the hind flipper marks……………………………………………………………….………..go to 3
3a. medium width track (<130cm wide) from outer edges of front flipper marks…………………………………………………………….Chelonia mydas
3b. very wide track (>150cm wide) from outer edges of front flipper marks………………………………………………….….Dermochelys coriacea
4a. in eastern Australia, south of 16oS latitude…..………………..Caretta caretta In the absence of any records of Eretmochelys imbricata or Lepidochelys olivacea attempting to nest in the south and central Queensland in the past 30yr, all alternating gait tracks in the southern part of the survey area are presumed to have been from C. caretta.
4b. in eastern and northern Australia, north of 16oS latitude………………………. ……………….…….……Eretmochelys imbricata or Lepidochelys olivacea In the absence of any records of Caretta caretta attempting to nest in north Queensland or Arnhem Land, Northern Territory in the past 40yr (except for an unsuccessful nesting attempt recorded at Lizard Island in 1973 [Limpus, 1985]), all alternating gait tracks in the northern part of the survey area are presumed to have been from either E. imbricata or L. olivacea.
Separation of species using track characteristics is difficult for these latter two species. Lepidochelys olivacea makes a wider plastron skid mark down the centre of the track compared to a comparable sized E. imbricata. The latter also has a greater tendency to nest under vegetation than the former. Identification of the individual species by nesting beaches has been based on sightings of the nesting turtles, hatchlings, embryos, and clutches in conjunction with the track characteristics. Aerial survey High-winged aircraft were selected for the surveys so as to maximise vision of the beaches from the aircraft. Australian Air Safety Standards required that twin engine aircraft were used for these surveys that encompassed offshore areas. Flight dates were chosen to meet the following conditions: • To occur within the period of highest nesting density for the species of greatest interest
within the survey area, • To coincide with an approximately midnight high tide on the night before the flight so as
to provide the maximum beach width when the flight commenced early in the morning. It also provided approximately 6hr of flying before that day’s high tide would wash out the tracks from the night before.
In addition, by flying early in the morning, the tracks were more visible than later in the day after the sun had dried the surface sand and the increasing onshore winds had blurred the tracks. CJL was the observer on all flights. Turtle tracks from the night preceding the flight were counted for each species on each beach. A “track” up and a “track” down the beach were counted as a single track (= 1 turtle beaching) for these census studies. For those parts of the Australian coast surveyed, at the times the surveys were conducted, the daytime high tide was higher than the nighttime high tide. Therefore counting the turtle tracks that crossed the beach below the previous day’s high tide mark provided a count of the number of turtle beachings for the previous night. Counts of older tracks, which terminated at the previous day’s high tide mark and counts of old body pits provided additional qualitative information on the level of nesting for the beach.

21
During aerial surveys, no attempt was made to determine the nesting success for the individual beachings because much of the turtle nesting habitat was within the vegetated zones of many of the islands. 1997 WET SEASON aerial survey of northern Great Barrier Reef and Torres Strait E. imbricata nesting area: This aerial survey was conducted during 8–11 February 1997 in a Hinterland Aviation Shrike Aero Commander 500S (VH-TFW), piloted by Michael Jess, flying out of Cairns. The survey covered ~ 590 km of mainland coast of eastern Cape York Peninsula from southern Princess Charlotte Bay to the Escape River, 145 islands and sandbanks of Torres Strait and 37 islands and sandbanks of the northern Great Barrier Reef. During the observations the aircraft flew at a height of ~ 60 m and an air speed of 200–270 km/hr. The dates of the flights were selected to coincide with the early February peak density of E. imbricata nesting activity in the northern Great Barrier Reef. There has been no record of loggerhead turtles (C. caretta) nesting in north-eastern Australia north of Lizard Island (Limpus, 1985). Nesting by olive ridley turtles (L. olivacea) is rare in the Torres Strait region, being restricted to a single recorded nesting at Crab Island (Limpus et al.1983b). Given the rarity of L. olivacea on these nesting beaches and the difficulty in discriminating between L. olivacea and E. imbricata tracks from aircraft, all narrow tracks with alternating flipper prints recorded during this aerial survey have been scored as E. imbricata. Error in species identification resulting from this assumption is expected to be trivial. A tagging census team was present on Milman, Crocodile and Sinclair Islands for the night before the aerial survey of those islands to ground truth species identification and track counts. Additional ground survey data from this area have been reported previously (Limpus 1980; Limpus et al. 1983a,b, 1993, 1989; Limpus et al. 2001). 1997 aerial survey of north-eastern Arnhem Land E. imbricata nesting area: An aerial survey was flown on 8–10 October 1997 in a Cessna 206 (VH-LGN) piloted by Barry Need flying out of Gove. The dates were chosen to coincide with the suspected dense winter-spring nesting season for E. imbricata in north-eastern Arnhem Land. 262 sites were examined in the area between Elcho Island (northwest of Gove) and Sandy Islet (south of Groote Eylandt) spanning a straight line distance of approximately 417 km of the eastern Arnhem Land coast. During observations, the aircraft flew approximately at a height of 65 m and airspeed of 150 km/hr. 1999 DRY SEASON aerial survey of eastern Cape York Peninsula from Princess Charlotte Bay to Escape River, western Torres Strait and the Gulf of Carpentaria coast from Cape York to the Northern Territory border: This aerial survey was conducted during 6–9 July 1999 in a Hinterland Aviation Shrike Aero Commander 500S (VH-TFW), piloted by Michael Jess, flying out of Cairns. The survey encompassed three sections: ~ 400 km of mainland coast of eastern Cape York Peninsula from Point Stuart (14o04.29’ S, 143o41.64’ E) to Escape River (10o57.84’ S, 142o43.15’ E); the islands of western Torres Strait south from Deliverance Island (09o32’ S, 141o31’ E) to Crab Island (10o59’ S, 142o06’ E); and ~ 1200 km of mainland coast of the Gulf of Carpentaria from Cape York (10.8899o S, 142.3388o E) to the Northern Territory border (16o33’ S, 138o00’ E). The dates of the flights were selected to coincide with the mid-year peak density of N. depressus nesting and to occur during a known period of dry season E. imbricata nesting activity in the western Torres Strait and western Cape York Peninsula. The flights were conducted between 0800 hr and 1200 hr, flying at 150–220 km/hr and at ~ 60 m elevation while over beaches. The weather during the flight was fine with scattered clouds and moderate winds.

22
1998 aerial survey of central Queensland N. depressus nesting area: For completeness of description of all recent aerial survey studies of turtle nesting in Queensland, the results of an additional aerial survey in central Queensland are also included. An aerial survey was flown on 7th December 1998 in a Cessna 227G (VH-SBV) piloted by Dave Davies flying out of Gladstone. Observations of the beaches began at Baffle Creek (24.55o S, 152.06o E) tracking north along the mainland and immediately adjacent islands to Corio Bay (22.93o S, 150.76o E) before tracking to the south-east to investigate each of the Keppel Islands. All islands close to the coast, except the large sand islands, were circumnavigated. For the large sand islands, only the ocean beaches were examined. The flight was conducted between 0650 hr and 1200 hr, flying at 150–220 km/hr and at 24–61 m elevation while over beaches. The weather during the flight was fine with scattered clouds and a light onshore wind. The coral cays of the Capricorn Group, which lay further off-shore within the southern Great Barrier Reef were not included in this aerial survey. This flight occurred within the two-week period of highest density of nesting for the eastern Australian Natator depressus stock, i.e. within the last week of November to the first week of December. A tagging census team was present on Curtis and Facing Islands for the night before the aerial survey to ground truth species identification and track counts. Additional ground survey data from this area have been reported previously (Limpus 1971,1985; Limpus et al. 1981). On-ground surveys of nesting beaches In addition to the aerial surveys, nightly counts of nesting turtles and/or their tracks were made during tagging census studies at a series of rookeries in Queensland as follows: • During each nesting season, Woongarra Coast beaches (since 1968, including Mon
Repos), Heron Island (since 1974), Wild Duck Island (since 1981. Dr C. J. Parmenter studies), Milman Island (since 1990), Fraser Island (since 1994) and Curtis Island (since 1994) were each surveyed nightly for several months encompassing approximately the entire nesting season.
• In the southern Great Barrier Reef region for a variable number of summers since 1977, islands of the Capricorn-Bunker Groups (Erskine Is., West Hoskyn Is., Lady Musgrave Is., Masthead Is., Northwest Is., Tryon Is., Wilson Is., Wreck Is.), Fraser Island, and mainland beaches (Wreck Rock beaches, Rules Beach) were surveyed for 2–5 weeks from mid December into January. This survey period encompasses the peak of the C. caretta and C. mydas nesting season for eastern Australia.
• During most nesting seasons since 1976, Raine Island was surveyed for about 10 days or more in early December. During many summers, each of No. 7 Sandbank, No. 8 Sandbank and Moulter Cay were visited for a single night of tagging census when the study was travelling to or from Raine Island.
• Crab Island was surveyed during the Gulf of Carpentaria peak of nesting season for N. depressus in July 1991 (2 wk) and July 1999 (3 wk).
• Facing Island was surveyed for 10 nights within the peak of the east coast N. depressus nesting season in late November–early December 1999.
• When logistically convenient during census studies at Milman Island, tagging census studies of irregular duration were conducted on adjacent islands (Sinclair Is., Crocodile Is., Douglas Is.).
• Swain Reefs cays (6 islands: Price, Frigate, Byland, Thomas, Bacchi and Gannet Cays), Moore Park and Lady Elliott Island were surveyed for 1–5 nights during mid December to late January in some seasons.
• Brief visits to census the turtle nesting population have been made opportunistically to many nesting beaches in Queensland since 1968 by the authors or members of the QTC team (Limpus 1980,1985; Miller and Limpus 1991; Miller et al. 1995).
• Many other Queensland and Coral Sea beaches have been surveyed for turtle nesting for varying periods and durations during numerous nesting seasons by University

23
researchers, Australian Government staff and community conservation groups: Peak Island; Coral Sea cays (6 islands); mainland beaches near Mackay and Townsville.
• Additional nesting data were obtained at numerous other beaches via incidental observations of nesting turtles by QTC volunteers and staff and from members of the public.
The relevant turtle census and distributional data from these aerial surveys and on-ground census studies have been summarised within the QPWS Turtle Database. This is a GIS compatible, relational database that quantitatively summarizes temporal and spatial nesting data for each marine turtle species in Australia at their respective individual nesting beaches. TURTDATA is annually updated with new data gathered by QTC teams conducting annual census and nesting survey studies at a large series of rookeries throughout eastern and northern Australia. Data from previously published and unpublished reports also are being validated and, where relevant, added to TURTDATA. The geographical locations within this database have been displayed using ArcView GIS software (Anon 1996).
The estimated sizes of the nesting populations were coded on an approximate logarithmic scale (Table 4.1). For each rookery, an order of magnitude estimate was made of the number of turtles expected to be encountered if a nightly tagging census was conducted for an entire nesting season. An estimate was made for each species at each beach. Except for those beaches with rigorous tagging census studies, estimation of the size of the annual nesting populations has been subjective. Based on the senior author’s 30 years of experience in tagging nesting turtles, the counts of new and old tracks were used to estimate the number of nesting female turtles that could be tagged on each site if a total tagging census had been conducted for an entire nesting season. The estimates were made with several assumptions: • That each population had been sampled at the high-density period of the nesting season
(Limpus 1985, Limpus et al. 2001). • That the nesting success for each area is in the “average” range of about 60–80%. If it is
excessively low, i.e. most turtles failing to lay eggs on a nesting crawl, then the size of the annual nesting population will be over estimated. The reverse would apply if there were exceptionally high nesting success.
Two types of rigorous census counts were made: • For those rookeries with a total season tagging census, a total annual nesting population
estimate was derived from the tagging results. • For those rookeries for which a tagging census was conducted through the period of
peak nesting density for the species, the mean nightly track count was calculated as an index of the size of the total annual nesting population.
Results While the present study reports on a stock-wide survey of the nesting distribution of E. imbricata in northern and eastern Australia, a general summary of nesting distribution is provided also for the other five species of marine turtles that breed within the same region. Eretmochelys imbricata The nesting distribution is summarised in Figure 4.1. Within northern and eastern Australia there are two widely separated clusters of E. imbricata nesting beaches: Northern Great Barrier Reef, Torres Strait and eastern Gulf of Carpentaria: Summer census, February 1997: Nesting was recorded on 73 sites, being wide spread with centres of abundance within central and south-western Torres Strait (55 islands) and the inner shelf cays of the northern Great Barrier Reef (17 islands). The concentrated nesting occurred on several islands within each of these areas with numerous surrounding islands supporting low-density nesting. Nesting on the islands along the extreme eastern margin of
24
the northern Great Barrier Reef was rare. Only a single nesting crawl was recorded for E. imbricata on the entire surveyed 590 km of mainland coast of eastern Cape York Peninsula. The nesting aggregations were recorded as follows: • estimated > 500 nesting females per year: 3 islands in central and western Torres Strait
Long Island, Hawksbury Island, Dayman Island • estimated 100–500 nesting females per year: ~ 13 islands (Milman Island, Boydong
Island, Zuizin Island, Mimi Island, Bourke Island, Aukane Island, Layoak Island, Bet Island, Saddle Island, Dadalai Island, Albany Island, Mt Adolphus Island and one unnamed island.)
• estimated 10–100 nesting females per year: ~ 28 islands • estimated 1–10 nesting females per year: ~ 27 islands Only one E. imbricata nesting has been recorded in the last 70 yr in the GBR to the south of Princess Charlotte Bay: an emerging clutch of hatchlings on Rocky Island (14o14’ S, 144o21’ E) in January 1997. No E. imbricata have been recorded nesting on the islands of the Coral Sea Platform. Dry season census, July 1999: Eretmochelys imbricata nesting was recorded on 13 of the islands in western Torres Strait. These same islands also were recorded with E. imbricata nesting during the February 1997 census. Overall nesting activity in July 1999 was less than that in February 1997 for this area of western Torres Strait. Low density E. imbricata nesting was recorded along two segments of the mainland coast of the extreme north coast of western Cape York Peninsula to as far south as the Jackson River (11.6658o S). There are no reports of E. imbricata nesting throughout the remainder of the Queensland Gulf of Carpentaria coast extending to the Northern Territory Border or from the Wellesley Islands. No nesting was recorded along the eastern Cape York Peninsula between Princess Charlotte Bay and the Escape River. The winter nesting aggregations were recorded as follows (estimates based on winter census data only): • estimated > 100 nesting females per year: Hawksbury Island, Dayman Island • estimated 10–100 nesting females per year: Crab Island, Dadalai Islet, Gaibait Island,
Ului Island, Zarat Island and north of Cotterell River on the mainland. • estimated 1–10 nesting females per year: Kalbai Kalbai Island, Matu Island, Prince of
Wales Island, Possession Island, Red Wallis Island, Tukupai Island; mainland coast south of Roonga Point adjacent to Possession Island and north of Jackson River on mainland.
Duration of nesting season: No attempt has been made to conduct a nesting census for an entire year at any E. imbricata rookery in Queensland. The largest nesting concentration of E. imbricata in Queensland occurs on Long Island in central Torres Strait with an estimated 500–1000 nesting females annually. Track counts obtained in the February 1997 survey were of similar order of magnitude to those obtained during an aerial survey of Long Island in December 1978 (Miller and Limpus 1991). Bustard (in Pritchard 1979) reported high density E. imbricata nesting at Long Island during the early 1970s with 76 females nesting in one 24 hr period and 210 nesting in a 9 night period in July. These observations indicate that appreciable levels of nesting can be expected across a major part of the year at this core breeding area for the stock.
25
At Milman Island and nearby islands of the northern GBR, hundreds of nesting E. imbricata have been tagged each summer, with nightly records of nesting females during late November to early April (Chapter 5). When annual tagging studies commenced in late November–early December there also were hatchlings emerging from clutches presumably laid some two months earlier in September–October. Sporadic nesting has also been recorded in July and August at Milman and adjacent islands with a few nesting females arriving each week, but not nightly, at each island. Again in south-western Torres Strait and north-eastern Gulf of Carpentaria, nesting E. imbricata have been recorded at all visits to these islands in January, February, May, July, October, and December. High-density nesting was recorded during February and July at both the focal areas (Dayman and Hawksbury Islands) at this western extremity of the north Queensland breeding population. An extended nesting season approximating to year round nesting characterises these E. imbricata rookeries that encompass the entire distribution within this northern Great Barrier Reef –Torres Strait region. The highest density of nesting occurs during December–February while variable but lower levels of nesting occur at mid-year. Results of tagging studies at multiple rookeries in close proximity show that the counts of turtles made at the individual beaches, when pooled, include a number of individuals that are counted multiple times. This is because a significant proportion of the nesting population interchanges between nesting beaches within a nesting season (Chapter 5). Therefore the total annual E. imbricata nesting population for Queensland is less than what is obtained by summing the estimates for each of the individual islands. The total nesting population for Queensland is expected to approximate to some 4000 females annually when the census counts are adjusted for the proportion of the population that interchanges between nesting beaches within a breeding season. North-eastern Arnhem Land: Dry season census, October 1997: Some 40 nesting sites were recorded for E. imbricata. Additional low-density nesting beaches probably also occur that have been pooled with L. olivacea nesting for those sites where positive distinction between these species could not be made for all tracks observed. It is assumed that approximately all higher density nesting sites (hundreds of nesting females annually) for E. imbricata within the sampled area will have been detected in this survey. It is expected that additional low-density nesting sites will be identified with more intense surveys. The 12 sites identified with an estimate of more than 100 nesting female E. imbricata annually were clustered into four focal areas of abundant nesting: • Outer islands of the English Company Islands area: Truant Island and Bromby Island. • North-eastern Groote Eylandt area: North East Island, Hawk Island, Lane island, extreme
north-eastern Groote Eylandt. This area appears to be the most significant area for E. imbricata nesting in the Northern Territory.
• North-western Groote Eylandt area: Hawknest Island, Bustard Island, and the small island south west of Bustard Island.
• South-eastern Groote Eylandt area: Two small islands of Cape Beatrice and the southeast coast of Groote Eylandt.
For each site with high-density nesting there was a series of lower density nesting sites in the vicinity. Based on these survey results, a preliminary estimate of the size of the annual E. imbricata nesting population for eastern Arnhem Land is > 2500 females annually. The species composition and abundance of tracks recorded during the on-ground surveys agreed well with the results of the aerial survey. None of the sites examined on the ground showed evidence of excessively high or excessively low nesting success. Therefore, the
26
aerial survey results provide a good measure of the distribution by species and an acceptable first approximation of abundance of marine turtle nesting in eastern Arnhem Land. Caretta caretta The loggerhead turtles, C. caretta, that nest in eastern Australia constitute a single genetic stock (Bowen et al. 1994; FitzSimmons et al. 1996) and nest mostly in the southern Great Barrier Reef (Wreck Island, Tryon Island and Erskine Island) and adjacent mainland beaches (Woongarra Coast and Wreck Rock Beaches) (Figure 4.2). There is a series of low-density rookeries from Mackay to northern New South Wales that are scattered to the north and south of the major nesting concentrations respectively. This nesting population has undergone a substantial decline in breeding numbers in the past 20 yr and the current annual nesting population is some 300–500 females. Currently the largest concentration of nesting (about 200 females annually) occurs at Mon Repos on the Woongarra Coast. No C. caretta nesting has been recorded across northern Australia. Chelonia mydas There are three clusters of high density nesting for green turtles, C. mydas, in Queensland and eastern Northern Territory: southern GBR–Coral Sea cays; northern GBR–Torres Strait; and Gulf of Carpentaria (Figure 4.3). Norman et al. (1994) determined that the green turtle nesting populations of the northern GBR and Torres Strait constitute a single discrete stock that is genetically separate from the stocks that breed in the southern GBR and Gulf of Carpentaria (GoC). Also that there is 100% genetic isolation between the green turtles that breed in the GBR and those that breed in the GoC. The genetic affinities of the C. mydas that breed in eastern Arnhem Land have yet to be determined. Nesting densities of C. mydas at these rookeries fluctuate over three orders of magnitude between breeding seasons and in approximate unison in response to El Niño Southern Oscillation (ENSO) climate change (Limpus and Nicholls 2000). Raine Island in the northern GBR supports the largest nesting concentration of C. mydas in the world. In high density nesting seasons in excess of 10 000 females may be ashore simultaneously for nesting within a single night on this 1.8 km circumference coral island (Limpus et al. 1993). No total tagging census across an entire season has been conducted for this rookery or at the adjacent smaller island, Moulter Cay, which supports a similar density of nesting. On average, tens of thousands of green turtles are estimated to breed annually on these two islands. In addition, several thousand additional green turtles nest annually on the other islands of the northern GBR and Torres Strait combined, including Bramble Cay, Murray Islands, Milman Is. and No. 7 and No. 8 Sandbanks. For the southern GBR stock, nesting is concentrated within the southern GBR with an annual nesting population of approximately 8000 females per year and the Coral Sea cays with an annual nesting population of 500–1000 females per year. The highest density nesting occurs on Northwest Island, Wreck Island and Hoskyn Island with 1000–5000 females nesting annually on each in average nesting seasons. Lower density nesting occurs on most islands and beaches in the vicinity. In the south-eastern GoC, high density nesting with 1000–5000 females nesting annually occurs on each of Bountiful Island, Pisonia Island and Rocky Island. Lower numbers nest on the adjacent islands of the Wellesley Group. In the western GoC, a preliminary estimate of the size of the annual C. mydas nesting population for eastern Arnhem Land is thousands of females annually. A more precise estimate will require a quantified survey to be conducted at the peak of the nesting season.

27
The principal nesting sites include: mainland beaches from Binanangoi Point (Port Bradshaw) south to Cape Shield, especially between Binanangoi Point and Wanyanmera Point; northern beaches of Woodah Island; eastern Groote Eylandt area, especially North East Island and south-eastern Groote Eylandt (south from Ilyungmadja Pt.; south from Ungwanba Point; Marangala Bay); and Sandy Islet. For each site with high-density nesting, except for Sandy Islet, there was a series of lower-density nesting sites in the vicinity. The significant C. mydas nesting population of the Sir Edward Pellew Islands has yet to be quantified. Natator depressus The Australian endemic flatback turtle, N. depressus, has a discrete nesting population in eastern Australia that is well separated from the almost continuous nesting distribution of the species across northern Australia (Figure 4.4). This eastern Australian breeding population constitutes a separate stock relative to those that nest elsewhere in Australia (FitzSimmons et al. 1996; Limpus et al. 1993). The eastern Australian nesting population concentrates at 3 major rookeries (Wild Duck Is., Peak Is., Curtis-Facing Is.) and at numerous lower-density rookeries in the southern and central Great Barrier Reef region. High-density nesting occurs across the islands of western Torres Strait and adjacent north-eastern Gulf of Carpentaria and southwards along western Cape York Peninsula. Within this north-eastern Gulf of Carpentaria area, Crab Island supports the largest nesting population for the species. Small nesting populations are scattered throughout the southern GoC. A large population nests across numerous islands and mainland beaches in eastern Arnhem Land, especially on Groote Eylandt and Sandy Islet. Lepidochelys olivacea Within Australia, the olive ridley turtle, L. olivacea, has its focus for nesting in northern Arnhem Land where two concentrations occur, one in the McCluer Group of islands in western Arnhem Land and the other in the Wessel Islands of eastern Arnhem Land (Figure 4.5). There is dispersed nesting at low density within the GoC and no breeding by this species has been recorded in eastern Australia. The northern Australian nesting population appears to be a separate stock for the species on the global scale (Bowen et al. 1998). The nesting distribution of this species is one of the most poorly understood in Australia. The total nesting population appears to be of the order of 1000 females per year but this needs validation. The best breeding sites appear to support only tens to low hundreds of nesting females per year. There has been no indication that L. olivacea forms massed synchronised breeding assemblages (arribadas) in Australia. Dermochelys coriacea There is currently no regular nesting by the leatherback turtle, D. coriacea, in eastern and northern Australia. Low density nesting (0–3 females per year) has been recorded on the mainland coast of south Queensland between Miriamvale and Bundaberg (Figure 4.6). Recorded nestings outside of this area are very rare. Isolated but multiple nesting attempts have been recorded in northern Arnhem Land with a maximum of three records in any one year. Discussion Management units that comprise an interbreeding assemblage (= stock) of marine turtles are not contained within a single nesting beach or small island. No large concentration of breeding turtles occurred in isolation. Rather each management unit encompasses a small number of principal beaches with elevated numbers of nesting turtles surrounded by a large series of nesting beaches that are dispersed within hundreds of kilometres radius around the principal breeding area. This applies for each of the identified stocks surveyed in this study:

28
E. imbricata NEA stock; C. caretta eastern Australian stock; C. mydas southern GBR stock, northern GBR stock, and GoC stock; N. depressus eastern Australian stock and northern Australian stock; L. olivacea northern Australian stock. There are a limited number of Australian rookeries for which there are historic data extending back more than a century. In almost all instances, the same species of turtles are still nesting at these sites today as was first recorded at the respective sites. Fossil remains of a nesting female C. mydas with a radiocarbon age from > 1000 yr B.P. have been recorded at Raine Island (Limpus 1987). The first European, Don Diego de Prado, to “discover” Australia recorded [E. imbricata] turtles captured by the local people and masks made from these turtles in central Torres Strait in 1606 (Stevens and Barwick 1930). In 1802 Flinders (1814) discovered the large C. mydas nesting population on Bountiful and Pisonia Islands in the Wellesley Group, GoC. A “turtle island” was identified within the E. imbricata and L. olivacea nesting area of the Wessel Islands of north-east Arnhem Land by Macassan trepang and tortoiseshell fishermen in February 1803 (Flinders 1814). Jukes (1847) recorded the large C. mydas and smaller C. caretta nesting populations of the Capricorn Group islands of the southern GBR and the very large C. mydas nesting population of Raine Island and Bramble Cay in the northern GBR in 1843. The current areas with dense E. imbricata nesting in north-east Arnhem Land and Torres Strait - northern GBR supported large harvests of tortoiseshell (= bekko) during the 19th Century (MacKnight 1976; Allen and Corris 1977). However, the size of past nesting populations was not quantified for any of these rookeries. At Booby Island in western Torres Strait, King (1827) recorded E. imbricata nesting in July 1819 and August 1820 (total nesting population size not recorded). When surveyed for turtle nesting in 1975, Booby Island had no beaches. Turtle nesting at Booby Island is now extinct. Except for Booby Island, long term changes in nesting population size can not be determined for any E. imbricata nesting site in northern Australia. However, collectively, the total E. imbricata nesting population of northern and eastern Australia had to have been very large to be able to produce even the amount of tortoiseshell harvest recorded in the incomplete Australian Customs exports statistics from prior to World War I (Figure 4.7). The current nesting population is probably less than it was a century ago. It is considered unlikely that the current nesting population could support a comparable level and duration of harvest. The large nesting aggregations of E. imbricata on small islands of northern and eastern Australia are typical of cheloniid turtles and highlight the misconception held by some authors that E. imbricata does not form dense nesting aggregations (Pritchard 1979; Witzell 1983). Even though the current E. imbricata population of northern and eastern Australia is large, consisting of possibly upwards of 7000 nesting females annually, it is not an undisturbed population because of the extensive harvest within the last century. In spite of this past harvest, the NEA E. imbricata stock supports one of the largest remaining breeding populations for the species globally (Groombridge and Luxmore 1989; Meylan 1999). Mrosovsky (2000), in making gross extrapolations with regard to the size of this population, has failed to take into account the significant proportion of individuals that moves between nesting beaches within and between breeding seasons. As a result, he has unnecessarily exaggerated the size of this large nesting population in northern and eastern Australia. Acknowledgments Queensland Parks and Wildlife Service and Japan Bekko Association jointly funded the north Queensland and Arnhem Land aerial surveys. The Gladstone Port Authority provided funding for the December 1998 aerial survey and on-ground studies at Curtis and Facing Islands. The pilots, Michael Jess, Barry Need, Dave Davies, performed well in meeting the demands placed on them to ensure the success of the surveys. Dr John Parmenter, Duncan Limpus, Ian Bell, and numerous volunteers assisted in the on-ground surveys at these and the other turtle rookeries examined. This assistance is greatly appreciated.
29
References Allen, J. and Corris, P. (eds.) (1977). “The Journal of John Sweatman.” (University of Queensland Press: Brisbane.) Anon. (1996). ArcView GIS: The Geographical Information System for Everyone. (Environmental Systems Research Institute, Inc.: Redlands.) Bowen, B. W., Clark, A. M., Abreau-Grobois, F. A., Chaves, A., Reichart, H. A. and Ferl, R. J. (1998). Global phylogeography of the ridley sea turtles (Lepidochelys spp.) inferred from mitochondrial DNA sequence data. Genetica 101, 179–189. Bowen, B. W., Kamezaki, N., Limpus, C. J., Hughes, G. H., Meylan, A. B. and Avise, J. C. (1994). Global phylogeography of the loggerhead turtle (Caretta caretta) as indicated by mitochondrial DNA haplotypes. Evolution 48(6), 1820–1828. Broderick, D., Moritz, C., Miller, J. D., Guinea, M., Prince, R. I. T. and Limpus, C. J. (1994). Genetics studies of the hawksbill turtle Eretmochelys imbricata: evidence for multiple stocks in Australian waters. Pacific Conservation Biology 1(2), 123–131. Chatto, R. (1998). Preliminary overview of the locations of marine turtle nesting in the Northern Territory. In ‘Marine Turtle Conservation and Management in Northern Australia.’ (Eds. R. Kennett, A. Webb, G. Duff, M. Guinea and G. Hill) pp.33–40. (Northern Territory University: Darwin.) Cogger, H. G. and Lindner, D. A. (1969). Marine turtles of northern Australia. Australian Zoologist. 15, 150–159. Limpus, C, J., Carter, D. and Hamann, M. (2001). The green turtle, Chelonia mydas, in Queensland: the Bramble Cay rookery in the 1979–1980 breeding season. Chelonian Conservation and Biology 4, 34–46. FitzSimmons, N. N., Moritz, C., Limpus, C. J., Miller, J. D., Parmenter, C. J. and Prince, R. (1996). Comparative genetic structure of green, loggerhead and flatback populations in Australia based on variable mtDNA and nDNA regions. National Oceanographic and Atmospheric Administration Technical Memorandum, National Marine Fisheries Service, Southeast Fisheries Science Center 396, 25–32. Flinders, M. (1814). ‘A Voyage to Terra Australis.’ (G. and W. Nicol: Pall-Mall.) Garnett, S. T., Crowley, G. M. and Goudberg, N. (1985). Observations of non-nesting emergence by green turtles in the Gulf of Carpentaria. Copeia 1985, pp. 262–264. Gow, G. F. (1981). Herpetofauna of Groote Eylandt, Northern Territory. Australian Journal of Herpetology 1(2), 150–159. Groombridge, B. and Luxmoore, R. (1989). The green turtle and hawksbill (Reptilia: Cheloniidae): world status, exploitation and trade. (Secretariat of the Convention on International Trade in Endangered Species of Wild Fauna and Flora; Cambridge.) Jukes, J. B. (1847). ‘Narrative of the Surveying Voyage of the H.M.S. Fly.’ (T. & L. Boone: London.) King, P. P. (1827). ‘Narrative of the Survey of the intertropical and western coasts of Australia performed between the years 1818 and 1822.’ (John Murray: London.) Kowarsky, J. (1978). Observations on the green turtle (Chelonia mydas) in north-eastern Australia during the 1975–1976 nesting season. Biological Conservation 13, 51–62. Limpus, C. J. (1971). The flatback turtle, Chelonia depressa Garman in southeast Queensland, Australia. Herpetologica 27:431–436.
30
Limpus, C. J. (1978). The green turtle, Chelonia mydas (L) in eastern Australia. JCUNQ Research Monograph 1, 5–22. Limpus, C. J. (1980). Observations on the hawksbill turtle, Eretmochelys imbricata, nesting along the Great Barrier Reef. Herpetologica 36, 265–271. Limpus, C. J. (1985). The Biology of the Loggerhead Turtle in eastern Australia. Unpublished PhD thesis, Zoology Department, University of Queensland. Limpus, C. J. (1987). A fossil turtle on Raine Island, Great Barrier Reef. Search 18, 254–256. Limpus, C. J., Couper, P. J. and Couper, K. L. D. (1993). Crab Island revisited: reassessment of the world’s largest flatback turtle rookery after twelve years. Memoirs Queensland Museum 33, 277–289. Limpus, C. J., Miller, J. D., Baker, V. and McLachlan, E. (1983a). The hawksbill turtle, Eretmochelys imbricata, in north-eastern Australia: the Campbell Island rookery. Australian Wildlife Research 10,185–197. Limpus, C. J., Miller, J. D. and Parmenter, C. J. (1993). The northern Great Barrier Reef green turtle Chelonia mydas breeding population. In: Smyth, A. K., Zevering, K. H. and Zevering, C. E. (Eds.) Raine Island and Environs Great Barrier Reef. Brisbane: Raine Island Corporation. Limpus, C. J., Miller, J. D. and Preece, N. (1994). The basking turtles of Bountiful Island: Kay’s turtles revisited. National Oceanographic and Atmospheric Administration Technical Memorandum National Marine Fisheries Service Southeast Fisheries Science Center 351, 76–77. Limpus, C. and Nicholls, N. (2000). ENSO regulation of Indo-Pacific green turtle populations. In: Applications of Seasonal Climate Forecasting in Agricultural and Natural Ecosystems. (Hammer, G., Nicholls, N., and Mitchell, C. Eds.) pp. 399–408. (Kluwer Academic Publishers: Dordrecht.) Limpus, C. J., Parmenter, C. J., Baker, V and Fleay, A. (1983b). The Crab Island sea turtle rookery in north-eastern Gulf of Carpentaria. Australian Wildlife Research 10, 173–184. Limpus, C. J., Parmenter, C. J., Parker, R. and Ford, N. (1981). The flatback turtle, Chelonia depressa, in Queensland: the Peak Island rookery. Herpetofauna 13(1), 14–18. Limpus, C. J., Zeller, D., Kwan, D. and MacFarlane, W. (1989). The sea turtle rookeries of north-western Torres Strait. Australian Wildlife Research 16, 517–525. MacKnight, C. C. (1976). ‘The Voyage to Marege: Macassan trepangers in northern Australia.’ (Melbourne University Press: Melbourne.) Meylan, A. B. (1999). Status of the hawksbill turtle (Eretmochelys imbricata) in the Caribbean region. Chelonian Conservation and Biology 3(2), 177–184. Miller, J. D. and Limpus, C. J. (1991). Torres Strait marine turtle resources. In ‘Sustainable Development for Traditional Inhabitants of the Torres Strait Region.’ pp.213–226. (Great Barrier Reef Marine Park Authority: Townsville.) Miller, J. D., Daly, T., Card, M. and Ludeke, J. (1995). ‘Status of hawksbill turtles and other fauna and flora on the northern Great Barrier Reef and Torres Strait islands 1991.’ (Queensland Department of Environment: Brisbane.) Mrosovsky, N. (2000). Sustainable use of hawksbill turtles: contemporary issues in conservation. Issues in Wildlife Management 1, 1–107. Norman, J. A., Moritz, C., and Limpus, C. J. (1994). Mitochondrial DNA control region polymorphisms: genetic markers for ecological studies in marine turtles. Molecular Ecology 3: 363–373. Pritchard, P. C. H. (1979). ‘Encyclopedia of Turtles.’ (TFH Publications; Neptune.)

31
Stevens, H. N. and Barwick, G. F. (Eds.) (1930). ‘New light on the Discovery of Australia.’ (Henry Stevens, Son and Stiles: London.) Witzell, W. N. (1983). Synopsis of biological data on the hawksbill turtle Eretmochelys imbricata (Linnaeus, 1766). FAO Fisheries Synopsis 137, 1–78.

32
Table 4.1. Database coding used to summarise the estimated size of the annual nesting population for each species of marine turtles for each beach surveyed.
Code Size of the annual nesting population
0 Nil or sporadic nesting 1 1–10 nesting females 2 10–100 nesting females 3 100–500 nesting females 4 500–1000 nesting females 5 1000–5000 nesting females 6 5000–10000 nesting females 7 10000–100000 nesting females 8 > 100000 nesting females
–1 species present but not quantified–9 no data available
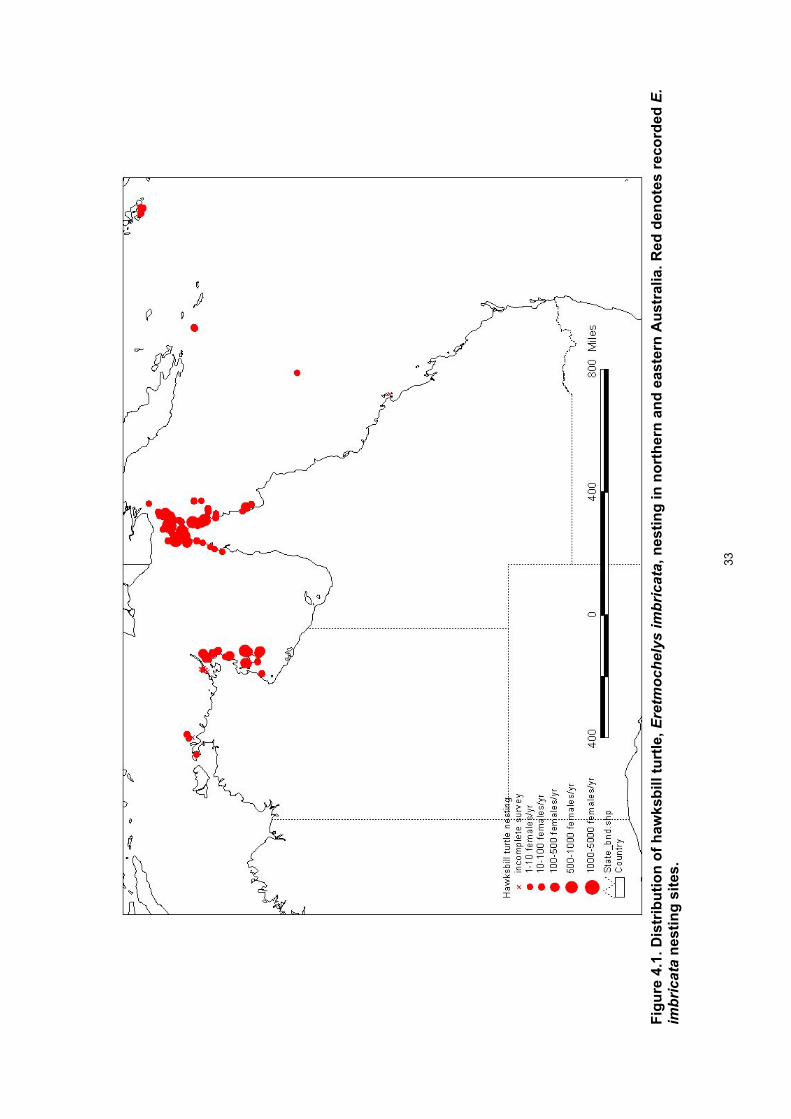
33
Fi
gure
4.1
. Dis
trib
utio
n of
haw
ksbi
ll tu
rtle
, Ere
tmoc
hely
s im
bric
ata,
nes
ting
in n
orth
ern
and
east
ern
Aus
tral
ia. R
ed d
enot
es re
cord
ed E
. im
bric
ata
nest
ing
site
s.

34
Fi
gure
4.2
. Dis
trib
utio
n of
logg
erhe
ad tu
rtle
, Car
etta
car
etta
, nes
ting
in n
orth
ern
and
east
ern
Aus
tral
ia. R
ed d
enot
es re
cord
ed C
. car
etta
ne
stin
g si
tes.
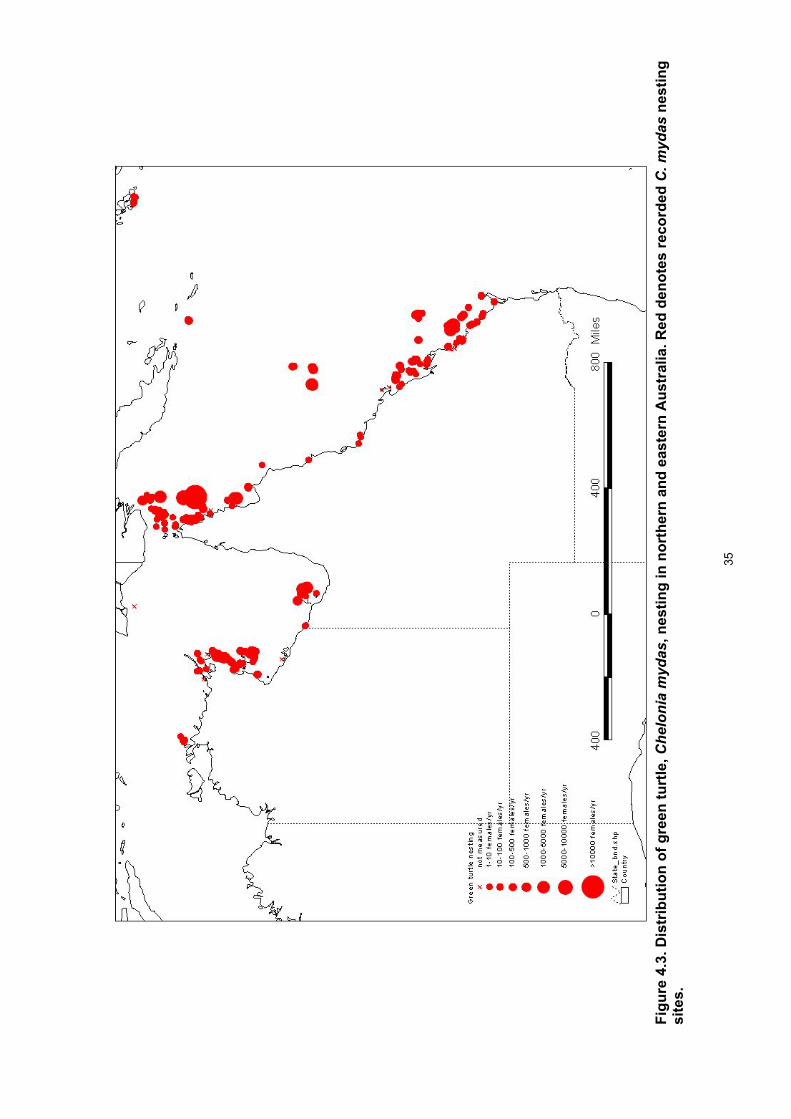
35
Fi
gure
4.3
. Dis
trib
utio
n of
gre
en tu
rtle
, Che
loni
a m
ydas
, nes
ting
in n
orth
ern
and
east
ern
Aus
tral
ia. R
ed d
enot
es re
cord
ed C
. myd
as n
estin
g si
tes.

36
Fi
gure
4.4
. Dis
trib
utio
n of
flat
back
turt
le, N
atat
or d
epre
ssus
, nes
ting
in n
orth
ern
and
east
ern
Aus
tral
ia. R
ed d
enot
es re
cord
ed N
. dep
ress
us
nest
ing
site
s.

37
Fi
gure
4.5
. Dis
trib
utio
n of
oliv
e rid
ley
turt
le, L
epid
oche
lys
oliv
acea
, nes
ting
in n
orth
ern
and
east
ern
Aus
tral
ia. R
ed d
enot
es re
cord
ed
L. o
livac
ea n
estin
g si
tes.

38
Fi
gure
4.6
. Dis
trib
utio
n of
leat
herb
ack
turt
le, D
erm
oche
lys
coria
cea,
nes
ting
in n
orth
ern
and
east
ern
Aus
tral
ia. R
ed d
enot
es re
cord
ed
D. c
oria
cea
nest
ing
site
s.
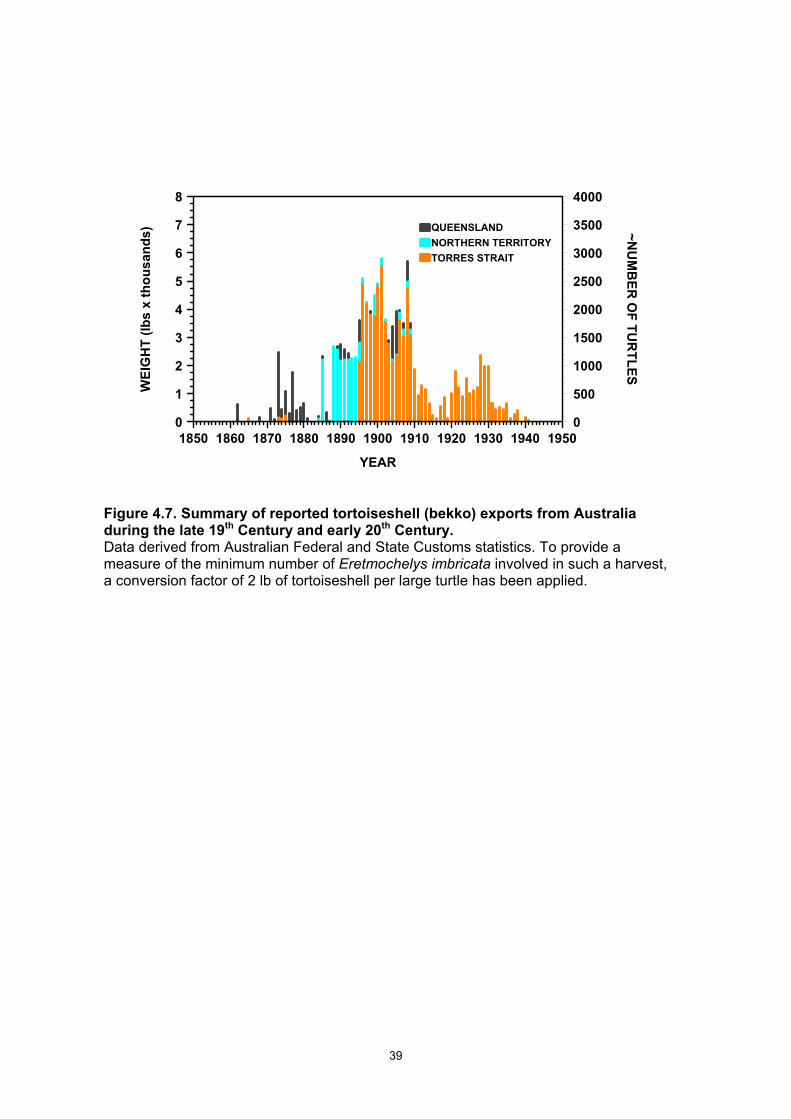
39
1850 1860 1870 1880 1890 1900 1910 1920 1930 1940 1950
YEAR
0
1
2
3
4
5
6
7
8
WEI
GH
T (lb
s x
thou
sand
s)
0
500
1000
1500
2000
2500
3000
3500
4000
~NU
MB
ER O
F TUR
TLES
TORRES STRAITNORTHERN TERRITORYQUEENSLAND
Figure 4.7. Summary of reported tortoiseshell (bekko) exports from Australia during the late 19th Century and early 20th Century. Data derived from Australian Federal and State Customs statistics. To provide a measure of the minimum number of Eretmochelys imbricata involved in such a harvest, a conversion factor of 2 lb of tortoiseshell per large turtle has been applied.

40

41
CHAPTER 5 - Nesting biology of Eretmochelys imbricata in the northern Great Barrier Reef Jeffrey D. Miller, Colin J. Limpus and Ian P. Bell Introduction Nesting by the hawksbill turtle, Eretmochelys imbricata, is globally widespread but the numbers of nesting females at many of the known nesting locations are declining as a result of ongoing mortality (i.e. degradation of nesting sites, exploitation of eggs, killing of adults for shell) (Groombridge and Luxmoore 1989, also see papers in CCB, 1999). In recent times the continuing substantial harvest of hawksbill turtles in the countries neighbouring the Coral Sea (Milliken and Tokunaga 1987, Limpus 1997, Mrosovsky 1999) has put pressure on the regional population, including nesting females. The general loss to the world population and the continuing impact of harvest on the regional population continue without sufficient biological data on which to base sustainable management and conservation decisions. This information is essential for conservation management of the species in Australia and elsewhere, particularly in the context of regional population declines (Groombridge and Luxmoore 1989, Miller 1994). The general reproductive biology of sea turtles is known (Miller 1997) but specific details concerning hawksbill turtles (and other species) are still required (Loop et al. 1995). Previous detailed studies (Loop et al. 1995, Limpus et al. 1983a) have laid a foundation, but long-term studies are essential to provide some critical data necessary for understanding conservation management of hawksbill turtles. In order to identify the required information a review of the status and knowledge of the species in the south-western Pacific Ocean (Miller 1994) and a population genetics study (Broderick et al. 1994) were conducted to assess the biological status of the species in the region. Further, research in the northern Great Barrier Reef (GBR) and Torres Strait established that nesting in northern Queensland occurred at a regionally and internationally important level (Limpus 1980, Limpus et al. 1983a, Miller et al. 1995). Hawksbill turtles nest in low density on numerous islands and sand cays in the Great Barrier Reef and Torres Strait areas of eastern Australia (Limpus 1980, Miller and Limpus 1991, Miller et al. 1995). Based on surveys of nesting density, Milman Island was identified as hosting one of the most concentrated nesting populations in the region (Chapter 4). In January 1991, saturation tagging census of the nesting turtles at Milman Island began (Loop et al. 1995, Dobbs et al. 1999). These studies included the collection of morphometric as well as demographic data. The work has continued annually from 1995 through April 2000 with the support of the Japanese Bekko Association. Structure of Report This is the final report on studies of the nesting biology of hawksbill turtles as required by the contract with the Japanese Bekko Association (JBA). The project proposal and previous annual reports provide further background details and define the context of the study (Limpus and Miller 1996, 1997, 1998, 1999). Data presented are those collected from December 1995 through April 2000, with the main nesting survey occurring on Milman Island. Where appropriate, data collected prior to 1995 are included to extend the robustness of the interpretation and to better describe the characteristics of the population of hawksbill turtle nesting at Milman Island. This report also contains data from the 1998/99 and 1999/00 nesting seasons not reported to JBA previously. The results have been recalculated based on the complete data set.
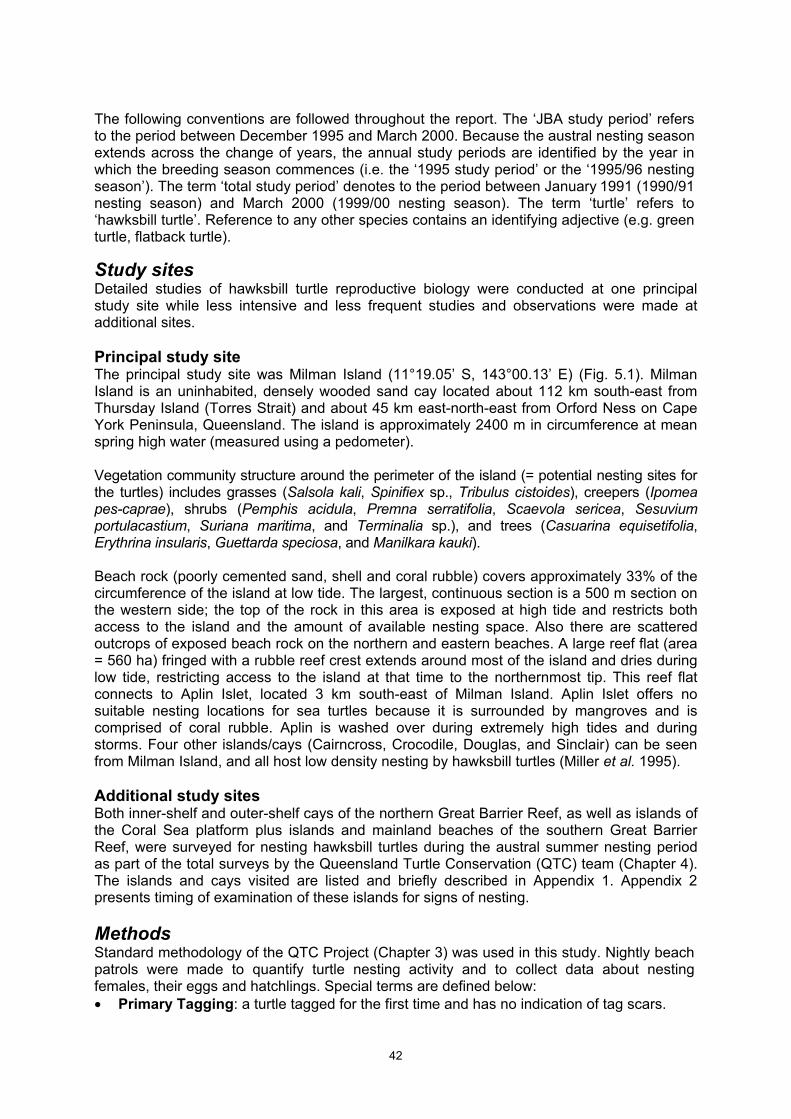
42
The following conventions are followed throughout the report. The ‘JBA study period’ refers to the period between December 1995 and March 2000. Because the austral nesting season extends across the change of years, the annual study periods are identified by the year in which the breeding season commences (i.e. the ‘1995 study period’ or the ‘1995/96 nesting season’). The term ‘total study period’ denotes to the period between January 1991 (1990/91 nesting season) and March 2000 (1999/00 nesting season). The term ‘turtle’ refers to ‘hawksbill turtle’. Reference to any other species contains an identifying adjective (e.g. green turtle, flatback turtle).
Study sites Detailed studies of hawksbill turtle reproductive biology were conducted at one principal study site while less intensive and less frequent studies and observations were made at additional sites. Principal study site The principal study site was Milman Island (11°19.05’ S, 143°00.13’ E) (Fig. 5.1). Milman Island is an uninhabited, densely wooded sand cay located about 112 km south-east from Thursday Island (Torres Strait) and about 45 km east-north-east from Orford Ness on Cape York Peninsula, Queensland. The island is approximately 2400 m in circumference at mean spring high water (measured using a pedometer). Vegetation community structure around the perimeter of the island (= potential nesting sites for the turtles) includes grasses (Salsola kali, Spinifiex sp., Tribulus cistoides), creepers (Ipomea pes-caprae), shrubs (Pemphis acidula, Premna serratifolia, Scaevola sericea, Sesuvium portulacastium, Suriana maritima, and Terminalia sp.), and trees (Casuarina equisetifolia, Erythrina insularis, Guettarda speciosa, and Manilkara kauki). Beach rock (poorly cemented sand, shell and coral rubble) covers approximately 33% of the circumference of the island at low tide. The largest, continuous section is a 500 m section on the western side; the top of the rock in this area is exposed at high tide and restricts both access to the island and the amount of available nesting space. Also there are scattered outcrops of exposed beach rock on the northern and eastern beaches. A large reef flat (area = 560 ha) fringed with a rubble reef crest extends around most of the island and dries during low tide, restricting access to the island at that time to the northernmost tip. This reef flat connects to Aplin Islet, located 3 km south-east of Milman Island. Aplin Islet offers no suitable nesting locations for sea turtles because it is surrounded by mangroves and is comprised of coral rubble. Aplin is washed over during extremely high tides and during storms. Four other islands/cays (Cairncross, Crocodile, Douglas, and Sinclair) can be seen from Milman Island, and all host low density nesting by hawksbill turtles (Miller et al. 1995). Additional study sites Both inner-shelf and outer-shelf cays of the northern Great Barrier Reef, as well as islands of the Coral Sea platform plus islands and mainland beaches of the southern Great Barrier Reef, were surveyed for nesting hawksbill turtles during the austral summer nesting period as part of the total surveys by the Queensland Turtle Conservation (QTC) team (Chapter 4). The islands and cays visited are listed and briefly described in Appendix 1. Appendix 2 presents timing of examination of these islands for signs of nesting. Methods Standard methodology of the QTC Project (Chapter 3) was used in this study. Nightly beach patrols were made to quantify turtle nesting activity and to collect data about nesting females, their eggs and hatchlings. Special terms are defined below: • Primary Tagging: a turtle tagged for the first time and has no indication of tag scars.
43
• Interseason Retag (ISR RTA): a turtle that has healed scars from a lost tag that was applied in a previous season or study.
• Interseason Change of Colony (ISCHCOL): a turtle that was originally tagged at one site and was recorded in a subsequent season or year at different site.
• Within season Change of Colony (WSCHCOL): a turtle that was originally tagged at one nesting site and was recorded with the same primary activity at another site in the same season.
Observations of E. imbricata nesting at other islands were made opportunistically during transit to other study sites and as part of detailed assessment of nesting on islands in the vicinity of Milman Island. In addition, during turtle rodeo mark-recapture studies in the austral winter (see Chapter 8), adjacent islands on the reefs were surveyed for signs of nesting. Temperature data-loggers were placed at nine locations around Milman Island beginning in early December 1997 (see results for starting dates). At four locations (two unshaded and two shaded environments), three data-loggers were placed at depths of 15 cm, 35 cm, and 55 cm in artificial nests. Five additional data-loggers were placed into the middle of clutches as the turtles laid eggs. All natural nests were located in shaded environments. Results Unless otherwise stated, results presented below refer to data collected from hawksbill turtles nesting at Milman Island. Study period The study team surveyed turtle nesting activity at Milman Island for a minimum period of 15 days and a maximum of 117 days during the austral summers between January 1991 and March 2000 (Table 5.1). When the study team arrived on Milman Island each study season, E. imbricata had already commenced nesting and the number of nesting turtles was increasing nightly (see also Dobbs et al.1999). The interchange of nesting turtles among the islands in the vicinity of Milman Island was addressed during the 1996/97 and 1997/98 nesting seasons for short periods of time (Table 5.2 A). While several days of assessment work were being conducted at some sites (Table 5.2 B), other sites were visited for only one night to obtain information on the nesting effort or, if visited during the day, to count tracks (Table 5.2 B, C). Eretmochelys imbricata nests year-round in northern Great Barrier Reef and Torres Strait (Limpus 1980). Individual turtles arrive non-synchronously at the nesting beach and each remains in the vicinity while she produces and lays several clutches of eggs before she returns to her foraging area. At Milman Island the timing of the peak of the nesting cycle coincides with the austral summer period while very few turtles (1–3 per week) nest in the cooler, winter period. Species composition Three species of sea turtles were recorded nesting at Milman Island: hawksbill turtles, green turtles (Chelonia mydas) and flatback turtles (Natator depressus). Hawksbill turtles consistently make up the majority of nesting turtles. The numbers of nesting green turtles fluctuated by a factor of ten across the years while the number of nesting flatback turtles was consistently low (Table 5.3). Tagging census 2027 hawksbill turtles were recorded nesting at Milman Island during the total study period (Table 5.4). Within this group 840 hawksbill turtles were new to the study (primary taggings)

44
during the JBA funded period and 1187 had been tagged previously, usually during a previous nesting season at Milman Island. As would be expected, there is a steady reduction in the number of new hawksbill turtles being tagged during the study period (Table 5.4) as increasing numbers of previously tagged turtles returned for additional breeding seasons. At no time was more than 50% of all of the turtles at Milman Island available for census (Fig. 5.2 A, B). In each of the two years illustrated below (data from previous years was presented in the annual reports), the greatest number of turtles available on Milman Island occurred during late January and early February. Standard census During each year of the study (except 1991/92) the period of peak nesting, between January 15th and February 15th, was monitored to determine the number of nesting turtles and the number of clutches laid (Fig. 5.3). The trends in these data are described by the equations: Number of nesting turtles = 268.7 – 8.523 * BSN
R2 = 0.238; F 1,7 = 2.1864; 0.1 < P < 0.2 Number of clutches = 402.52 – 15.632 * BSN
R2 = 0.3814; F 1,7 = 4.3176; 0.05 < P < 0.1 Note: The BSN (breeding season number) begins with 1 representing the 1990/91 season.
Based on these regressions, the number of clutches laid at Milman Island has declined at a rate of approximately 4% per year since the 1990/91 nesting season. Similarly, the number of nesting turtles has declined at the rate of approximately 3% per year. This is of particular importance because Milman Island supports the largest hawksbill nesting population on the Great Barrier Reef. The estimated interval for remigration of 50% of a breeding season’s cohort to return in a later breeding season is approximately 6 years (Fig. 5.4). The rate of recovery of new remigrants from any one-year cohort reduces beyond this interval. This means that a tagging program must run for at least 6 years before the vast majority of potential remigrants originally tagged during the first year will have returned to nest. The minimum period for a tagging program to operate so that it contains several cohorts that have passed the estimated 50% return period would be about 10 years. The recorded remigration interval may continue to increase (albeit slowly) as the duration of the study increases beyond 10 years. The mean remigration interval has been calculated for the three breeding season’s cohorts that have been followed for at least 6 years beyond their initial year of tagging (Table 5.4). There were significant differences among the mean remigration intervals for these year cohorts (ANOVA: F2, 432 = 12.57). The mean remigration interval for these first three breeding season’s cohorts = 5.00 yr (SD = 1.535, range = 2–9, n = 435). During the nine years for potential recapture of remigrants within the study, no E. imbricata was recorded nesting with a 1 year remigration interval and 2 year remigration intervals were rare (usually < 2% of the recaptures for the year cohort. Table 5.4). Not all hawksbill turtles maintained a constant remigration interval when they returned to nest at Milman Island in subsequent nesting seasons (Table 5.5 A, B). Comparison between the remigration patterns of turtles in the 1998/99 and 1999/00 nesting seasons clearly demonstrates that long-term studies of more than 5 years are necessary to elucidate even general patterns. If the total study had operated for only 5 nesting seasons the pattern of return would have been quite different. There would have been no remigration interval recorded that was greater than 4 seasons and this would reduce the calculated remigration
45
interval to less than four years. Dobbs et al. (1999) reported a remigration interval of 3.4 years based on the first five years of this total study. This highlights the inadequacy of using short-term study periods for assessing a long-term parameter such as remigration interval. Change of colony Hawksbill turtles were recorded changing nesting sites between nesting seasons (ISCHCOL Table 5.4, Table 5.6 A). During the monitoring of the islands adjacent to Milman island in the 1996/97 nesting season, nine E. imbricata originally tagged at Milman Island in previous nesting seasons were recorded nesting at the other three islands but not at Milman Island in the 1996/97 season). During the 1997/98 monitored period another three turtles shifted to nest at different islands after being originally tagged nesting at Milman in a previous season. In the 1999/00 season, two hawksbill turtles were recorded nesting at Milman after having been tagged while nesting on one of the adjacent islands. Hawksbill turtles also changed nesting sites within a nesting season (WSCHCOL Table 5.4, Table 5.6 B). Seven turtles were recorded nesting at Sinclair, Crocodile and Douglas Islands that had previously nested at Milman Island earlier in the 1996/97 season. Similarly, in the 1997/98 nesting season, eleven within-season change of colony E. imbricata were recorded nesting at the other islands (Sinclair, Douglas, Crocodile) that had been originally tagged at Milman Island earlier in the 1997/98 nesting season (WSCHCOL) (Table 5.6 B). Two turtles changed colonies between seasons and then changed again within the second breeding season (T72555, T77964; Table 5.6 A, B). The greatest distance movement between breeding sites was recorded for T53036 that shifted from nesting at Boydong Island in 1990/91 to nesting at Milman Island in 1999/00, a distance of approximately 36 km. The majority of turtles can be expected to return to the same island for successive breeding seasons (Table 5.4, Figure 5.4). However, given that only a small proportion of the total number of nesting sites in the vicinity of Milman Island was monitored for nesting (and then only for a brief portion of a nesting season), these data indicate that there is also a significant proportion of the nesting population that changes nesting beaches between and within nesting seasons. Taken together, these data support the concept that some “missed” turtles may have shifted to an adjacent island for one or more nesting attempts before returning to Milman Island. Adult female mortality No nesting E. imbricata died on the beach or in the vegetation at Milman Island during the study period. During this time 3239 turtles of three species were encountered, many for multiple sightings. Some skeletal material was found on a few of the other islands monitored during the study. A hawksbill turtle skeleton was found on Boydong Island in the 1996/97 season; the turtle was considered to have died the previous nesting season. Scattered bones of an adult hawksbill were found on Bushy Islet in the 1997/98 season and a skeleton was also found on Douglas Island; the material from both was considered to be several years old. The positions of each dead turtle were such that they appeared to have died during a nesting attempt. Two of the three were entangled in vegetation. Given the number of hawksbill turtles nesting at Milman Island (2027 laying multiple clutches) and the lack of mortality, it appears that natural mortality of adults during nesting is very low. Dobbs et al. (1999) estimated adult mortality to be 0.35% (n = 4) from the 1183 turtles encountered during the 1990–1994 nesting seasons at Milman Island. Given that no nesting turtles died during the 1995–1999 seasons, the annual adult female mortality from natural causes is less than 0.2%. In particular, there has been no evidence of the killing of these turtles for taking tortoiseshell over the past decade at any of the rooeries examined in this study.

46
Measurements The mean curved carapace length (mCCL) of E. imbricata nesting on Milman Island during the JBA study period was 81.51 cm (SD = 3.61, range = 69.4–95.0, n = 1500. Table 5.7). There was no significant difference among the years in the mCCL of nesting turtles (ANOVA: F4, 1495 = 2.243, NS). The morphometric data on CCL collected at Milman Island during the 10 year period (Table 5.7) were not significantly different among the seasons (ANOVA: F9, 2671 = 1.5401, NS). The pooled data (mean = 81.55 cm, SD = 3.65, n = 2681, range = 63.5–95.0) will be used to define the curved carapace length of the population of hawksbill turtles nesting at Milman Island. The mCCL of remigrant E. imbricata nesting on Milman Island during the JBA study period was 81.58 cm (SD = 3.55, range = 69.4–95.0, n = 662. Table 5.8 A). There was no significant difference (ANOVA: F4, 659 = 1.4146, NS) among the years in the mCCL of remigrant nesting turtles. The mean curved carapace length of primary tagged E. imbricata nesting on Milman Island during the JBA study period was 81.20 cm (SD = 3.55, range = 70.3–92.4, n = 866. Table 5.8 B). There was no significant difference among the years (ANOVA: F4, 861 = 1.1115, NS) in the mCCL of primary tagged nesting turtles. Remigrant turtles (Table 5.8 A) and primary tagged turtles (Table 5.8 B) were not significantly different within their respective groups among all years (ANOVA remigrant turtles: F7, 736 = 1.1069, NS; primary turtles: F9, 2008 = 1.3165, NS). These two groups were not significantly different from each other (ANOVA: F1, 2760 = 0.5947, NS). For remigrant and primary tagged turtles, the mean values are less than 1 cm different and the standard deviations overlap, indicating that the turtles could not be separated into these groups on the basis of measurements alone. The presence of tags or tag scars or the use of gonad examination was required to identify turtles that had nested in a previous season. Recruitment to the breeding population Females breeding for their first season were identified by gonad examination using laparoscopy. 2027 nesting hawksbill turtles were available on the nesting beach during the total study. From these, 214 (10.6%) were examined via laparoscopy to determine their reproductive status. Of this sample of 214 female hawksbill turtles, 59 (27.6%) were found to be breeding for their first season. Of these, 13 (22%) were recaptured during a subsequent breeding season and were found to be nesting for the second time. Of these 13, 2 (15.4%) were recaptured during a subsequent breeding season and were found to be nesting for the third time. The proportion of hawksbill turtles recruiting to the breeding population annually ranged from approximately 8.3% to 27.3% of the total turtles examined (Table 5.9). When a nesting population is subjected to a total tagging census for an extended period, the proportion of untagged turtles in the population should decrease and approach a minimum level. This minimum level should equate to the proportion of first time breeding turtles entering the population (recruits to breeding population) plus those turtles, which are changing nesting beaches across the years (interseason change of colony). At Milman Island the 10 years of tagging census data (Table 5.4, Fig. 5.5) show the proportion of first time tagged turtles approaching a ‘steady level’ at about 40% of the annual nesting population. This value contains the proportion of unrecognisable (= untagged) remigrants which have changed islands for nesting (Table 5.4) and those that have nested at Milman Island outside of our census periods (Both these latter groups have been incompletely quantified in the present study.). Therefore the proportion of primary taggings in the population, as it has been measured in the present study, provides an inflated measure of the actual value of recruitment of adults to the breeding population. The difference between the proportion of primary taggings and the proportion of first time breeding turtles in the recent annual nesting
47
populations (Fig. 5.4) indicates that there may be some 10–20 percent of the annual nesting population that is interchanging among the islands for breeding. The mean curved carapace length of E. imbricata determined to be breeding for their first, second and third breeding seasons for their lives are summarised in Table 5.10. Because of the similarity of the mean values and the over lapping standard deviations, turtles could not be placed into breeding status groups based on measurements. Breeding status could only be established by examination of the gonads. The mean weight of E. imbricata nesting on Milman Island during the study period was 49.6 kg (SD = 5.83, range = 36–68, n = 171). There was no significant difference among the years (ANOVA: F3, 167 = 0.7515, NS) in the weight of nesting hawksbill turtles (Table 5.11). When compared to data presented by Dobbs et al. (1999) there was no significant difference in the weight of nesting hawksbill turtles between the two study periods (Table 5.11 B). The pooled mean is used to define the weight after laying of hawksbill turtles nesting at Milman Island. Renesting Interval The renesting intervals for hawksbill turtles nesting in the 1998/99 and 1999/00 seasons provide examples of the structure of the data (Fig 5.5). Regardless of the year, most renesting interval data cluster between 11 and 18 days. Values greater than 22 days are presumed to result from turtles that were missed (not recorded) during a nesting attempt. The smaller group with greater than 40 days interval supports this interpretation because this period represents two missed intervals. During a missed nesting attempt the turtle may have visited Milman Island or it may have shifted to an adjacent island for one or more nesting attempts (see change of colony, above). Because the minimum interval was 10 days, values of 22 days or more may contain one nesting attempt during which the turtle was missed, therefore the long renesting intervals (i.e. intervals greater than 20 days) were removed from the samples for calculating the renesting interval. The mean renesting interval of E. imbricata nesting at Milman Island during the study period was 14.3 days (Table 5.12). There was a significant difference in renesting interval among the years (ANOVA: F4, 1903 = 7.41, p < 0.001). There was also a significant difference between the sample groups (Table 5.12 B). There is currently no obvious reason to account for these differences in renesting interval across the years, except perhaps for the impact of annual variation in water temperature. The mean value from the pooled data (14.3 ± 2 days) provides an estimation of the renesting interval for the species in the region. Spatial nesting distribution on Milman Island Throughout the study period E. imbricata attempted to nest in every sector around Milman Island (Fig. 5.6 A, B). However, nesting was not evenly distributed around the island. Consistently, the heaviest density nesting occurred along the south-western (sector numbers 46–4) and eastern ends (sector numbers 11–23) of the island. The north-western end of the island (sector numbers 28–37), which is accessible to the turtles during all tide heights, had a similar density of turtles nesting along the beach, with a greater nesting density occurring towards the eastern end. A moderate number of turtles attempted to nest along the western beach rock section (sectors 38–46) of Milman Island, while only a few attempts to nest were made between sectors 37–41. The nesting patterns for the 1998/99 and the 1999/00 seasons illustrate the consistency of the patterns as well as the inter-annual variation that occurs (Fig 5.6 A, B).

48
Nesting habitat The majority of clutches (97.3%) were laid on the slope of the dune or above; only 85 clutches (2.7%) were laid below the high water mark where they would be flooded by the tide (Table 5.13). Among the clutches laid on the dune above the reach of the tides, 68.8% were laid under trees and or shrubs, 16.9% were laid in grass covered areas and 14.3% were deposited in bare sand. Nest depth There was a significant difference (ANOVA: F4, 409 = 15.861, Sig) in the depth to the upper most eggs in clutches laid by hawksbill turtles among the years of the study (breeding seasons 1995–1999, Table 5.14 A). There was also a significant difference (ANOVA: F4, 412 = 20.192, Sig) in the depth to the bottom of the chamber among the years of the study (breeding seasons 1995–1999. (Table 5.14 B). There was not a significant difference in the depth to the top of the eggs among the pooled breeding seasons of 1990–1994 and 1995–1999 (Table 5.15 A). The pooled mean depth to the top of the eggs (18.0 cm, SD = 8.99) was accepted as the average nest depth to the top of the eggs. There was not a significant difference in the depth to the bottom of the chamber among the pooled breeding seasons of 1990–1994 and 1995–1999 (Table 5.15 B). The pooled mean depth to the bottom of the chamber (39.7 cm, SD = 7.27) was accepted as describing the nest depth to the bottom of the chamber. In summary, hawksbill turtles construct nests that are relatively shallow compared with most other species breeding in Queensland (C. caretta: Limpus, 1985. C. mydas: Limpus et al. 2003. D. coriacea: Limpus and McLachlan, 1994. N. depressus: Limpus et al. 1983.) Sand temperatures Sand temperatures at nest depth were measured during the 1996/97 nesting season. The temperatures ranged between 27 oC and 34 oC during late December 1996 to mid-February 1997 (Table 5.16). Five generalisations emerge from the data: (1) Shaded sand temperatures were lower than those in unshaded sand. (2) The probes placed in shallower sand exhibited the greatest fluctuations whereas the deepest ones responded more slowly and with less fluctuation. (3) The deeper the probe was placed into the sand, the lower the temperature of the surrounding sand. (4) A cycle of cool and warm periods, with changes of 5–6 oC, occurred over 6 days during warm summer periods. (5) Temperature decreases of 5–6 oC occurred over 4–5 days during wet, cloudy periods at all depths (Fig. 5.7a–e). Shaded sand had a mitigating effect on the fluctuation in sand temperature at all depths. Although the same general pattern occurred as with the probes in the sun, those in shade required longer to respond than their counterparts in unshaded nests. The deepest probe in the shade fluctuated about 2.0–2.5 oC during the period. Number and size of eggs The mean number of eggs per clutch laid by hawksbill turtles nesting at Milman Island was 121.2 eggs (SD = 20.28, range = 21–201, n = 556 clutches). There was no significant difference among the years (ANOVA: F4, 551 = 0.8669, NS) (Table 5.17 A). There was no significant difference among the mean number of eggs laid in clutches by E. imbricata nesting at Milman Island in the pooled samples from the breeding seasons of 1990–1994 and 1995–1999 (Table 5.17 B). The pooled value (121.6 eggs per clutch) provides a measure of the mean number of eggs per clutch laid by the hawksbill turtle population nesting at Milman Island.

49
Yolkless and multiyolked eggs occurred at a low frequency in the clutches examined at Milman Island. For example, in the 1995/96 nesting season an average of 0.13 yolkless eggs per clutch occurred among the normal eggs in 187 clutches examined (range = 0–3/clutch; 24 yolkless eggs found in 16 clutches). One yolkless egg was found in one of the two clutches examined during the winter study period. An average of 0.05 multiyolked eggs occurred among the eggs in 190 clutches examined (range = 0–2/clutch; 10 multiyolkled eggs found in 7 clutches) during the 1995/96. In the 1996/97 nesting season an average of 0.15 yolkless eggs per clutch occurred in 127 clutches examined (range = 0–3 yolkless eggs/clutch) with a total of 19 yolkless eggs found in 13 clutches. No multiyolkled eggs were found in these 127 clutches. Egg diameter and egg weight The mean diameter of hawksbill turtle eggs (10 eggs per clutch, 206 clutches. Table 5.18 A) laid during the first three seasons of the JBA study seasons was not significantly different (ANOVA: F2, 203 = 2.842, NS). There was no significant difference between the samples obtained during the JBA study period and the study prior to it (Table 5.18 B). The mean egg diameter for this rookery is 3.51 cm (SD = 0.167, range = 2.27–3.92, n = 5520). The weights of hawksbill turtle eggs (10 eggs per clutch, 69 clutches) laid during the first two seasons of the JBA study seasons were not significantly different (ANOVA: F1, 66 = 2.842, NS). There was no significant difference between the samples obtained during the JBA study period and the study prior to it. The pooled values describe the egg weight of hawksbill turtles at Milman Island: the mean egg weight = 26.69 g (SD = 2.092. Table 5.19). Number of clutches The mean number of clutches laid per turtle per breeding season by E. imbricata nesting at Milman Island during the JBA study period (breeding seasons 1995–1999) was 2.54 (SD = 1.44, range = 1–7, n = 1525). There was a significant difference among the years (ANOVA: F4, 1520 = 32.43, Sig. Table 5.20). There was a significant difference among the mean number of clutches laid by E. imbricata nesting at Milman Island in the pooled samples from the breeding seasons of 1990–1994 and 1995–1999 (ANOVA,). However, the pooled mean number of clutches laid (2.40 clutches, SD = 1.37, range =1–9, n = 2731) is accepted as indicative of the population. Incubation to emergence period The mean period of incubation of clutches from laying to emergence of hatchlings for hawksbill turtles nesting at Milman Island was 59.67 days (SD = 7.573, range = 49–90, n = 56 clutches. Table 5.21 A). There was a significant difference among the years (ANOVA: F3,
52 = 5.0843). There was no significant difference between the mean duration of incubation of clutches based on the pooled samples from the breeding seasons of 1990–1994 and 1995–1999 (Table 5.21 B). The pooled values (58.9 days, SD = 6.262) describe the mean duration of incubation of hawksbill turtle clutches incubating at Milman Island. Clutch disturbance Clutch disturbance by a turtle digging into an existing clutch was low during the study (< 2%). For example, in the 1996/97 season, 41 eggs were dug from 4 hawksbill turtle clutches by other nesting turtles (approximately 10 eggs destroyed per clutch). A further 147 eggs were disturbed from 13 unidentified nests in the same period. If all of these were assumed to be hawksbill turtle eggs, the total would represent 0.3% of the season’s egg production. In 1997/98, 71 eggs from 6 clutches laid by hawksbill turtles were disturbed by other nesting
50
sea turtles (approximately 11.8 eggs destroyed per clutch; average clutch size = 121 eggs). This equates to 1.2% of the 489 clutches being disturbed and 0.12% of the total season’s egg production. In the 1998/99 nesting season, no clutches were found to be disturbed by other nesting turtles. In these nesting seasons, 254, 247 and 34 green turtles nested, respectively. Given that the number of green turtles nesting at Milman Island fluctuates by an order of magnitude among the years studied, and thereby potentially adding several hundred more nesting attempts on the same areas of the island in some seasons, the level of clutch disturbance for all clutches seems to be related to the total number of turtles attempting to nest. Hatching and emergence success The remains of the clutches were exhumed following hatchling emergence and assessed according to 6 categories (Limpus et al, 1983). Throughout the years of the study the percentage of hatchlings emerging from nests remained high, typically greater than 80%. The percentage of live-in-nest and dead-in-nest hatchlings did not exceed 3.5%; unhatched and undeveloped eggs represented a maximum of about 12%. Depredated eggs accounted for less than 5% of the number of eggs in clutches. The mean hatching success from clutches laid during the study period was 88.9% (SD = 11.4, range = 36.4–100, n = 255 clutches. Table 5.22 A). There was no significant difference among the years (ANOVA: F4, 250 = 2.262, NS). The mean emergence success from clutches laid during the study period was 87.14% (SD = 13.82, range = 6.8–100, n = 255 clutches. Table 5.22 B). There was no significant difference among the years (ANOVA: F4, 250 = 2.7697, NS). Although there was a significant difference between mean hatching success of clutches based on the pooled samples from the breeding seasons of 1990–1994 and 1995–1999 (Table 5.23), the pooled value of 86.67% (SD = 14.818) is accepted as describing the mean hatching success of hawksbill turtle clutches at Milman Island. Similarly, there was a significant difference between mean emergence success of clutches based on the pooled samples from the breeding seasons of 1990–1994 and 1995–1999 (Table 5.24). The pooled value of 84.5% (SD = 17.9) is accepted as describing the mean emergence success of hawksbill turtle clutches at Milman Island. Size of hatchlings The mean straight carapace length of hatchling hawksbill turtles measured at Milman Island was 3.95 cm (Table 5.24). While there was a significant difference among the years, the pooled sample was accepted as describing the hatchlings at the island. Hatchling weight was not assessed during the JBA study period. The values recorded during 1991–1995 (Dobbs et al. 1999). Mean = 13.80 g, SD = 1.50, range = 8.0–17.5, n = 339) are accepted as describing hawksbill turtle hatchling weight at Milman Island. Post-emergence hatchling survivorship Predation of hatchlings as they made their way across the beach and reef flat to the open sea was recorded opportunistically. Birds (silver gulls, crested terns) were observed to take hatchlings from the beach and the surface of the water. The individual birds usually only took one hatchling but their calls attracted other birds which sometimes increased the predation on individual clutches. Occasionally these birds took hatchlings swimming over the reef flat. Hatchling predation by birds appears to be less frequent by night which is when most hatchlings cross the beach. In all nesting seasons, reef sharks were seen taking hatchlings in the shallow water near shore. Sharks would pass through the group of swimming hatchlings several times, taking one or more hatchlings each time. Usually several hatchlings would swim the complete distance to deep water and apparently escape the near-shore predation.

51
For example, on one occasion following the release of the hatchlings at the shoreline, a blacktip reef shark (Carcharhinus melanopterus) was sighted 10 m offshore in 1 m of water. Of the 10 hatchlings released, 8 were eaten on the surface, a maximum of 10 m from the shoreline. The shark was approximately 1.2 m in length and the feeding took a maximum of 2 minutes to complete. The shark was not observed to take the remaining two hatchlings, and retreated to deeper water. While these observations indicate a potentially high level of hatchling predation in the shallow waters of the reef, no data are available on the variation in hatchling mortality that could occur between high and low tide levels and between day and night emergence times. Discussion The Milman Island E. imbricata rookery has now been monitored for 10 consecutive summer breeding seasons. Based on the previous work, an optimal study period was identified to extend from mid-December through early March and a total of 458 days were spent over five years (range = 72–117) monitoring hawksbill turtle nesting at Milman Island during the present study (Table 5.1). With the exception of the 1991/92 season, the standard census period between January 15th and February 15th was monitored every season since the 1990/91 season. Of the three species of marine turtles (hawksbill, green, flatback) nesting at Milman Island, hawksbill turtles predominated (60.8% of turtles recorded at the island). The ratio between the number of hawksbill turtles and the number of green turtles varied widely among years (2.45:1 in 1995, 1.32:1 in 1996, 1.10:1 in 1997, 9.18:1 in 1998, 0.83:1 in 1999) primarily as a result of differences in the number of nesting green turtles which fluctuates in co-ordination with the El Niño Southern Ocellation (Limpus and Nicholls 1988). Flatback turtles contributed little to the nesting at the island. Although E. imbricata nesting occurs year-round at Milman Island and on islands in the vicinity, a distinct seasonality exists. The peak nesting occurs during the last half of January and the first half of February when 10 or more turtles can be expected to nest each night at Milman Island. In contrast, during the winter months of July and August only one or two turtles can be expected to nest per week. This pattern is similar to that which occurs elsewhere in the breeding range of hawksbill turtles (Witzell 1983). Individual turtles have a nesting season up to three months duration (laying as many as six clutches at two-weekly intervals). Initiation of nesting by individual turtles is staggered throughout the year with more turtles utilising the warm summer period. The general pattern of turtles nesting on the high tide before midnight, described by Dobbs et al. (1999) for Milman Island, was consistent with current observations. Also as noted by Dobbs et al. (1999), the tidal cycle and hence the depth of water over the reef flat influenced the distribution of nesting around the island. The only sectors of Milman Island where hawksbill turtles did not nest on a regular basis were sectors 37–40, along the beach rocks, which was difficult to access at all tides. All other sectors were used regularly for nesting, although not uniformly. Where access to the island was possible at lower tides, turtles tended to nest in larger numbers. Nesting beach temperature is a major factor impacting hatchling production. The mean daytime air temperature during the nesting period tends to be around 36 oC with cooling pulses of several days duration associated with monsoon rain (Loop et al. 1995). Cooling lengthens the incubation period (Miller 1985). Temperatures at nest depth typically are less variable than air temperatures (Fig. 5.7). The mean incubation period recorded at Milman Island was 59.7 days. However, temperature does not regulate just the incubation period. The embryos will die if temperatures at nest depth are above the thermal maximum of about 34 oC for an extended period (Miller 1985). Those that do survive after being subjected to higher temperatures are often malformed. Sand temperatures also determine the sex of the hatchling. Incubation of eggs at temperatures below the pivotal temperature for the

52
population yields hatchlings that are predominantly male and conversely incubation of eggs at temperatures above the pivotal temperature produces predominantly females (Georges et al. 1994). Within this general context an understanding of the fluctuations of temperature that occur during incubation at several depths and in different habitats is important in interpreting the hatchling productivity of rookeries. Nesting by E. imbricata occurs on many of the islands of the northern Great Barrier Reef but mostly at low density (Chapter 4). One of the exceptions with high-density nesting is Milman Island (Miller et al. 1995), our principal study site. Sinclair Island hosts the next largest aggregation of nesting E. imbricata in the vicinity of Milman Island. Sinclair Island is a sand cay with exposed nesting habitat, which is vegetated by grass and only a few shrubs. It represents a different nesting environment and may produce a different hatchling sex ratio than Milman Island which is wooded and where most nesting areas experience at least some shading during incubation. At Milman Island, nesting turtles occupied the different habitats around the island to different extents but most clutches were laid under trees and shrubs on the dune, which is the most extensive habitat available for nesting (Loop et al. 1995, Dobbs et al. 1999). At Sinclair Island and nearby Crocodile Island where there are virtually no trees or shrubs in the nesting area, most turtles nested in sand or grass. Reports from around the world do not indicate a clear preference for nesting under trees. In areas such as the Arabian Gulf (Miller 1989) the turtles have no choice but to nest in the open. In other places such as Torres Strait (Bustard 1972), the Seychelles (Diamond 1976) and the West Indies (Horrocks and Scott 1991) hawksbill turtles nested under trees and shrubs but there was little opportunity to nest in the open. The regional mosaic of nesting habitat on different beaches with open and shaded habitat provides an environment with a range of nest temperatures producing potentially variable sex ratios from these sites. Each of these nesting sites makes a contribution to the overall sex ratio of the regional population. The depth of the nest in the context of the habitat surrounding it also influences the sex ratio of the hatchlings. The amount of insolation impacting on the surface of the sand determines the temperature to which the developing embryos are exposed. Nest depth is a highly variable reproductive parameter; by pooling data collected over several years and ignoring differences between years a picture emerges that hawksbill turtles generally lay their eggs into relatively shallow nests. The shallowness of the nest is linked to the smallness of the turtle because the depth of the nest chamber is related to the length of the hind legs and flippers (Miller 1997). Based on temperatures recorded at several depths on several nesting beaches, shallow nests should be warmer than deeper nests and should undergo greater fluctuation in temperature than deeper nests. However, the effect of the shading by overhanging trees and shrubs is to reduce the impact of insolation while allowing the cooling effect of rain to pass through to the substrate. Shading also increases the time interval required for the nest environment to return to the original temperature. The full definition of the impact of these factors and the determination of the impact on the sex ratio among the hatchlings require further experimental research. When the pivotal temperature has been determined for this population, the use of beach temperatures to predict the hatchling sex ratio (albeit not perfectly) will facilitate an understanding of the contribution of the beach incubation system to the population dynamics. Adult female E. imbricata display considerable fidelity to individual nesting islands within and between breeding seasons (Table 5.4; Fig. 5.4). However, even with only limited tagging census on adjacent islands to Milman Island, appreciable numbers of E. imbricata were recorded changing islands within and between breeding seasons (Table 5.6). Nesting females were recorded moving between islands up to 36 km apart. In contrast to long distance tag recoveries from feeding sites within the GBR to breeding in neighbouring countries (Chapter 6), no E. imbricata tagged while breeding in the GBR has been recaptured breeding in another region. The movement of turtles among the islands in the vicinity of Milman Island, within and between nesting seasons, indicates that site fidelity by these turtles is to a region, not just to a specific island. This has important management implications; no single island can be considered to contain all members of a nesting population. In conservation planning, a regional approach should be used when describing a
53
population of nesting turtles and protecting critical nesting habitat. In an ideal situation, turtles at groups of adjacent nesting beaches/islands should be managed as a single breeding unit. Mortality of adult female hawksbill turtles while they were ashore for nesting was trivial throughout the study period. Only a few examples of dead hawksbill turtles were found within the forests backing the dunes when all the nesting sites are considered. This low mortality may result from the usual behaviour of the hawksbill turtles to nest near the margin of the vegetation, rather than further back into the forest. Such nesting behaviour would reduce the possibility that the turtle would become entangled in stems/trunks/roots while locating a nest site or when leaving it. The morphometric data collected from E. imbricata nesting at Milman Island were very similar to those collected from E. imbricata nesting elsewhere in Queensland (Limpus 1980, Limpus et al. 1983a; Table 5.25). These data are also very similar to values for hawksbill turtles in the general South Pacific region (Witzell 1983). In terms of mCCL and weight, the yearly cohorts of turtles are indistinguishable across the seasons. The number of eggs per clutch varied greatly among the seasons but is well within the variation among values reported for E. imbricata nesting in the South Pacific region and elsewhere in the world (see Witzell 1983). Remigrant turtles are indistinguishable in size from primary tagged turtles. Unless the turtles have a prior tagging history or have their gonads examined, the breeding status of nesting turtles cannot be assessed on the nesting beach. Although, turtles that are breeding for the first time tend to be slightly smaller in mCCL than experienced breeders, the standard deviation ranges of the two groups overlap completely, with some experienced nesting turtles being either bigger or smaller than first time breeders. Size (CCL) is not a reliable indicator of recruitment status. With the assumption that some of the long interval renesting records actually contain a missed nesting (possibly on a different island), the renesting interval is 14.1 days. This is consistent with values derived from other populations (see Witzell 1983). The calculation of renesting interval may provide different values for different areas if averaged without adjusting for missed nesting attempts or the turtle’s use of multiple nesting sites. Witzell (1983, Tables 6, 7, 8) provides a synopsis of the worldwide data on the number and size of eggs produced by hawksbill turtles. The hawksbill turtles utilising Milman Island lay clutches that contain about the same number of eggs (approximately 121) as found elsewhere in the south-western Pacific Ocean region. Their eggs are about the same in diameter and weight as eggs produced by the species elsewhere. Because the eggs reflect the conditions in the foraging areas and the turtles come from many foraging areas, change in the number or size of eggs is difficult to detect given the high variability of these parameters. The number of clutches laid by a turtle in a nesting season is also variable, ranging from 1 to 6. Some of the variation stems from some turtles being missed during subsequent nesting attempts, (which reduces the mean number of clutches laid and increases the perceived interval between clutches). The hawksbill turtles nesting at Milman Island appear to be averaging about 2.5 clutches/season. This is a minimal value given that some turtles nested across both the arrival and departure of study teams to and from Milman Island respectively. Clutch disturbance resulting from other turtles nesting in close proximity to an established clutch was very low but varied over the years. Clutch disturbance and associated egg mortality was higher when more turtles attempted to nest. The total number of hawksbill turtles has been declining (albeit slightly) and the numbers of green turtles fluctuates by an order of magnitude over the seasons. This means that in years when higher numbers of
54
green turtles are attempting to nest concurrently with hawksbill turtles, more eggs will be killed by being dug from the nest (Limpus et al. 1979). The mean hatching success and mean emergence success showed considerable variation among the nesting seasons (Table 5.22). Because the yearly standard deviations of these two variables overlap extensively, the biological importance of the changes cannot be interpreted. Certainly, the values obtained at Milman Island are consistent with those reported from elsewhere (see Witzell 1983). In comparison with mean emergence success values reported elsewhere (58.3% in Costa Rica, Bjorndal et al. 1985; 82% in Antigua, Hoyle and Richardson 1993; 85% in Barbados, Horrocks and Scott 1991), the nesting habitat of Milman Island is a very good incubation system in the absence of storm erosion. Although data on the size of hatchlings were not collected in large sample sizes during the JBA funded period, the data collected prior to the1995 nesting season were accepted as describing the size of hatchlings produced by the population. Hatchling size is variable (SCL = 3.26–4.17 cm) and related to the size of the eggs and the hydric environment during incubation; any difference among the data sets is not, at present, considered to be biologically significant. The same situation exists with data for hatchling weight (weight = 8–17 g). These values are consistent with values reported from elsewhere (Witzell 1983). Unquantified observations on post-emergence hatchling survivorship may be separated into two parts: on shore and near shore. There appears to be little predation of hatchlings as they cross the beach. Silver gulls and larger terns do take hatchlings but usually only one per bird before flying away. Even though their calls attract other birds to the area, it appears that most hatchlings cross the beach successfully. In the water the hatchlings stay near the surface where gulls and terns take a few. Reef sharks also take a toll on the hatchlings. The number of hatchlings eaten by a shark (or other predatory fish) depends on its size and recent feeding activity and possibly on tidal and weather conditions. How many hatchlings survive the gauntlet of predators to reach the deep water off the reef remains unquantified. Remigration interval, including its year to year variability, is a critical parameter required for successful modelling of population dynamics of these non-annual breeding species. The remigration interval for north Queensland E. imbricata is longer (mean = 5.0 yr, range = 2–9 yr) than previously reported for the species worldwide, resembling the long remigration interval of C. mydas in eastern Australia (Limpus et al. 1992). It is not clear why the remigration interval of this particular population is so large given the short remigration intervals measured elsewhere. Studies in the Indian Ocean region report a 2 to 4 year remigration interval (Ross 1981, Brooke and Garnett 1983) and a mean of 2–3 yr from Seychelles (Mortimer and Bresson, 1999). In the Pacific a mean of 1.84 yr was reported from Sabah (Pilcher and Ali, 1999). In the Caribbean remigration intervals of between 1 and 6 years have been reported (Carr and Stancyk 1975, Pritchard and Trebbau 1984, Hillis 1994, Garduno-Andrade 1999), with a mean = 2.54 yr from Antigua (Richardson et al. 1999). The duration of the study; tag retention relative to the length of the remigration interval and the extent to which turtles interchange between adjacent rookeries all have an impact on the calculated remigration interval. The differences in remigration intervals reported between different studies and between seasons at a nesting site indicate that long-term data are critical when analysing remigration data. Among animals with long generation times and non-annual breeding, like marine turtles, it is difficult to reliably identify population stability or otherwise from census of only a small portion of their life history. For the north Queensland E. imbricata, addressing two independent perspectives simultaneously has strengthened nesting population analysis of this question: census of the nesting female population and assessment of the proportion of first time breeders into the nesting population. To provide an index of the size of the annual nesting population in north Queensland, a standard period for determining the number of turtles

55
attempting to nest and the number of clutches laid was established during the peak of the nesting season at Milman Island. Analysis of these annual census data across the 10 breeding seasons at Milman Island (Fig. 5.3) indicates that this E. imbricata nesting population is probably decreasing. At the same time, the proportion of females nesting in their first breeding season has increased from the low value of about 0.1 that is expected for a stable population to a value now exceeding 0.2 (Fig. 5.5). In a declining population, this is indicative of a population subjected to excessive mortality of adult turtles. These two pieces of data together give a very strong warning signal that the eastern Australian E. imbricata stock is declining. Over the past decade, this population decline has been measured at 3% of the annual nesting population per year. Concern regarding the impact on the regional population of the massive level of harvest of E. imbricata for meat and bekko that was occurring in neighbouring countries such as Indonesia, the Solomon Islands and Fiji was the basis for initiating the north Queensland E. imbricata studies in 1990. Given the present results indicating a declining nesting population and active harvest in neighbouring countries which share this migratory species (Chapter 6), strong concerns must continue to be held for the conservation outlook for this significant stock of marine turtles. Because these turtles have foraging ranges that extend beyond Australian Territory, reversal of the negative population trends will require a long-term multinational approach to reduce the anthropogenic sources of mortality back to within sustainable levels for the species. References Australian Littoral Society Inc. (1990). Great Barrier Reef Island Resource Inventory - Far Northern Section. ALS, Brisbane. Bjorndal, K. A., Carr, A., Meylan, A. B., and Mortimer, J. A. (1985). Reproductive biology of the hawksbill Eretmochelys imbricata at Tortuguero, Costa Rica, with notes on the ecology of the species in the Caribbean. Biological Conservation 34, 353-68. Broderick, D., Moritz, C., Miller, J.D., Guinea, M., Prince, R. and Limpus, C. J. (1994). Genetic studies of the hawksbill turtle, Eretmochelys imbricata: evidence for multiple stocks in Australian waters. Pacific Conservation Biology 1, 121–131. Brooke, M. and Garnett, M. (1983). Survival and reproductive performance of hawksbill turtles, Eretmochelys imbricata L. on Cousin Island, Seychelles. Biological Conservation 25:161–170. Bustard, H. R. (1972). ‘Australian Sea Turtles. Their natural history and conservation’. Sydney: Collins, 220p. Carr, A.F. and Stancyk, S. (1975). Observations on the ecology and survival outlook of the hawksbill turtle. Biological Conservation 8:161–172. CCB (Chelonian Conservation and Biology) (1999). Special Focus Issue: the Hawksbill turtle, Eretmochelys imbricata. Chelonian Conservation and Biology 3, 171–384. Diamond, A.W. (1976). Breeding biology and conservation of hawksbill turtles, Eretmochelys imbricata L., on Cousin Island, Seychelles. Biological Conservation 9, 199–215. Dobbs, K.L., Miller, J.D., Limpus, C. J. and Landry, A.M. (1999). Hawksbill turtle, Eretmochelys imbricata, nesting at Milman Island, northern Great Barrier Reef, Australia. Chelonian Conservation and Biology 3, 344–361. Garduno-Andrade, M. (1999). Nesting of the hawksbill turtle, Eretmochelys imbricata, in Rio Lagartos, Yucatan, Mexico, 1990–1997. Chelonian Conservation and Biology 3, 281–285.
56
Georges, A., Limpus, C. J. and StoutjeSDijk, R. (1994). Hatchling sex in the marine turtle Caretta caretta is determined by proportion of development at a temperature, not daily duration of exposure. Journal of Experimental Zoology 270, 432–444. Groombridge, B., and Luxmoore, R (1989). ‘The green turtle and hawksbill turtle (Reptilia: Cheloniidae): world status, exploitation and trade.’ (Convention on the Illegal Trade in Endangered Species: Luasanne, Switzerland.) Hillis, Z. (1994). The hawksbill turtles of Buck Island Reef National Monument: a shared resource of the Caribbean. In ‘Proc. 14th Annual Symp. Sea Turtle Biol. Conservation’. (Bjorndal, K., Bolten, A., Johnson, D. and Eliazar, P., Compilers) NOAA Tech. Memor. NMFS-SEFSC-351, pp 59–61. Horrocks, J.A. and Scott, N.M. (1991). Nest site location and nest success in the hawksbill turtle, Eretmochelys imbricata in Barbados, West Indies. Mar. Ecol. Prog. Ser. 69:1–8. Hoyle, M. and Richardson, J. I. (1993). The Jumby Bay hawksbill project. Survivorship, mortality, recruitment and reproductive biology and behaviour of adult female hawksbill sea turtles (Eretmochelys imbricata) nesting at Pasture Bay, Long Island, Antigua, W.I. Unpublished technical report. (Georgia Sea Turtle Cooperative, Institute of Ecology, University of Georgia: Athens, Georgia, USA.) Limpus, C. J. (1980). Observations on the hawksbill turtle (Eretmochelys imbricata) nesting along the Great Barrier Reef. Herpetologica 36, 265–271. Limpus, C. J. (1985). A study of the loggerhead turtle, Caretta caretta, in eastern Australia. (PhD thesis, Zoology Department, University of Queensland: Brisbane.)
Limpus, C. J., Baker, V. and Miller, J. D. (1979). Movement induced mortality of loggerhead eggs. Herpetologica 35(4), 335–338. Limpus, C. J. and Miller, J. D. (1996). ‘Project Report for Year 1 for the Australian Hawksbill Turtle Population Dynamics Project’. Unpublished Report to Queensland Department of Environment. Limpus, C. J. and Miller, J. D. (1997). ‘Project Report for Year 2 for the Australian Hawksbill Turtle Population Dynamics Project’. Unpublished Report to Queensland Department of Environment. Limpus, C. J. and Miller, J. D. (1998). ‘Project Report for Year 3 for the Australian Hawksbill Turtle Population Dynamics Project’. Unpublished Report to Queensland Department of Environment. Limpus, C. J. and Miller, J. D. (1999). ‘Project Report for Year 4 for the Australian Hawksbill Turtle Population Dynamics Project’. Unpublished Report to Queensland Parks and Wildlife Service. Limpus, C. J., Miller, J. D., Parmenter, C. J., and Limpus, D. J. (2003). The green turtle, Chelonia mydas , population of Raine Island and the northern Great Barrier Reef: 1843-2001. Memoirs Queensland Museum 49, 349-440.
Limpus, C. J., and Nicholls, N. (1988). The southern oscillation regulates the annual numbers of green turtles (Chelonia mydas) breeding around northern Australia. Australian Wildlife Research 15, 157–161. Limpus, C. J. and McLachlan, N. (1994). The conservation status of the leatherback turtle, Dermochelys coriacea, in Australia. In Proceedings of the Marine Turtle Conservation Workshop, Seaworld Nara Resort, Gold Coast, 14-17 November 1990. (Compiler James, R.) Pp. 69-72.
Limpus, C. J., Miller, J. D., Baker, V. and McLachlan, E. (1983a). The hawksbill turtle, Eretmochelys imbricata (L.), in North-eastern Australia: the Campbell Island rookery. Australian Wildlife Research 10, 185–197. Limpus, C. J., Miller, J. D., Parmenter, C. J., Reimer, D., McLachlan, N. and Webb, R. (1992). Migration of green (Chelonia mydas) and loggerhead (Caretta caretta) turtles to and from eastern Australian rookeries. Wildlife Research 19, 347–358.

57
Limpus, C. J., Parmenter, C. J., Baker, V. and Fleay, A. (1983c). The Crab Island sea turtle rookery in north-eastern Gulf of Carpentaria. Australian Wildlife Research 10: 173–184. Limpus, C. J., Reed, P. C. and Miller, J. D. (1983b). Islands and turtles: the influence of choice of nesting beach on sex ratio. In ‘Proceedings of the Inaugural Great Barrier Reef Conference’. (Eds J. T. Baker, R. M. Carter, P. W. Sammarco, and K. P. Stark). pp 317–402 (James Cook University Press: Townsville.) Loop, K. A., Miller, J. D. and Limpus, C. J. (1995). Nesting by the hawksbill turtle (Eretmochelys imbricata) on Milman Island, Northern Great Barrier Reef, Australia. Wildlife Research 22, 241–252. Miller, J. D. (1985). Embryology of marine turtles. In ‘Biology of the Reptilia, Volume 14’ (Ed. C. Gans, F. Billett, and P. F. A. Maderson) pp.269–328 (Wiley Interscience: New York.). Miller, J.D. (1989). ‘An assessment of the conservation status of marine turtles in the Kingdom of Saudi Arabia’. Vol. 1. Technical Report- Marine Turtles. Jeddah, Saudi Arabia MEPA Report No. 9, 209p. Miller, J. D. (1994). The hawksbill turtle, Eretmochelys imbricata: a perspective on the species. In ‘Proceedings of the Australian Marine Turtle Conservation Workshop’. (Compiler, R. James.) pp 25–38 (Australian Nature Conservation Agency: Canberra). Miller, J. D. (1997). Reproduction in sea turtles. In ‘The Biology of Sea Turtles’ (Eds. P. Lutz and J. Musick) pp 51–80. (CRC Press: Boca Raton). Miller, J. D. and Limpus, C. J. (1991). Torres Strait Marine Turtle Resources. pp 213–226. In “Sustainable Development for Traditional Inhabitants of the Torres Strait Region”. (D. Lawrence and T. Cansfield-Smith, eds.) Great Barrier Reef Marine Park Authority, Workshop Series 16. Miller, J. D., Daly, T., Card, M. and Ludecke, J. (1995). Hawksbill turtles nesting in the Northern Great Barrier Reef and Torres Strait. Queensland Department of Environment, and Greenpeace report. Milliken, T. and Tokunaga, H. (1987). ‘The Japanese Sea Turtle Trade’. [Traffic (Japan): Tokyo.] Mortimer, J. A. and Bresson, R. (1999). Temporal distribution and periodicity in hawksbill turtles (Eretmochelys imbricata) nesting at Cousin Island, Republic of Seychelles, 1971–1997. Chelonian Conservation and Biology 3(2), 318–325. Mrosovsky, N. (1999). ‘Sustainable use of hawksbill turtles: Contemporary Issues in Conservation.’ Key Centre for Tropical Wildlife Management. Issues in Wildlife management #1. Northern Territory University, Darwin NT, Australia. Pilcher, N. J. and Ali, L. (1999). Reproductive biology of the hawksbill turtle, Eretmochelys imbricata, in Sabah, Malaysia. Chelonian Conservation and Biology 3(2), 330–336. Pritchard, P.C. and Trebbau, P. (1984). ‘The turtles of Venezuela.’ Soc. Study Amph. Rept. Contrib. Herpetol. No 2, 403p. Richardson, J. I., Bell, R. and Richardson, T. (1999). Population ecology and demographic implications drawn from an 11-year study of nesting hawksbill turtles, Eretmochelys imbricata, at Jumby Bay, Long Island, Antigua, West Indies. Chelonian Conservation Biology 3(2), 244–250. Ross, J.P. (1981). Hawksbill turtle Eretmochelys imbricata in the Sultanate of Oman. Biol. Conserv. 19, 99–106 Witzell, W. N. (1983). Synopsis of biological data on the hawksbill turtle, Eretmochelys imbricata. FAO Fisheries Synopsis.
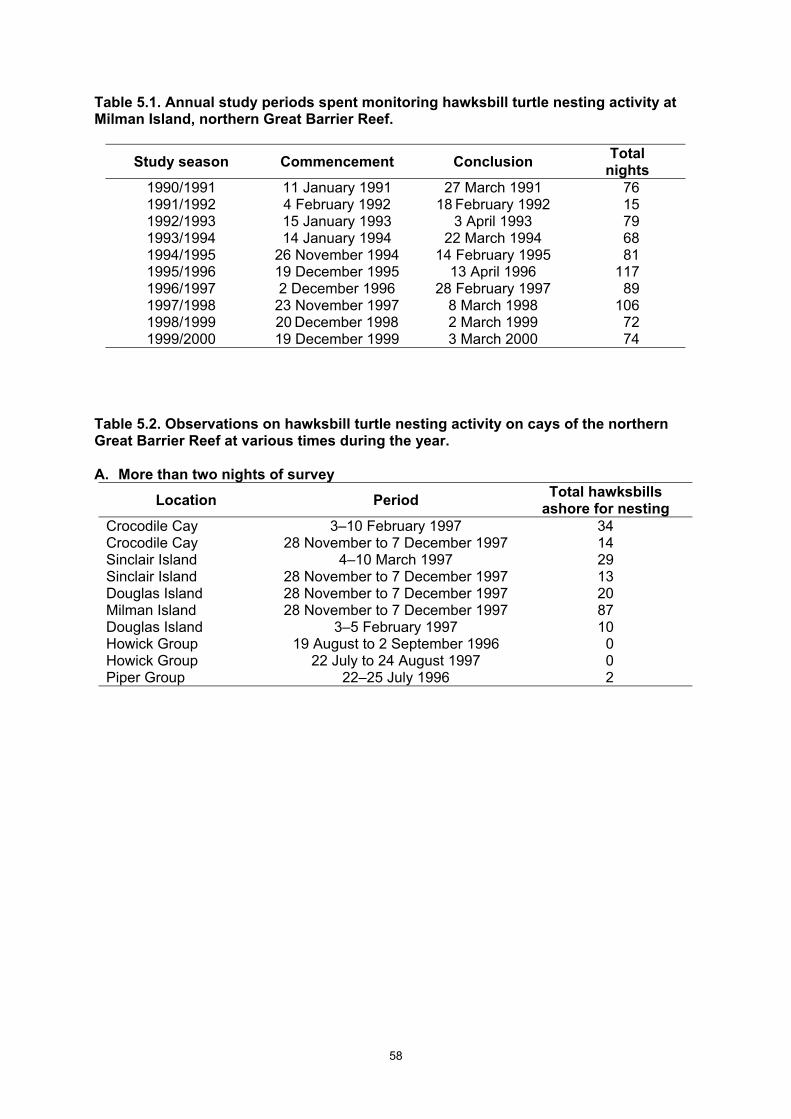
58
Table 5.1. Annual study periods spent monitoring hawksbill turtle nesting activity at Milman Island, northern Great Barrier Reef.
Study season Commencement Conclusion Total nights
1990/1991 11 January 1991 27 March 1991 76 1991/1992 4 February 1992 18 February 1992 15 1992/1993 15 January 1993 3 April 1993 79 1993/1994 14 January 1994 22 March 1994 68 1994/1995 26 November 1994 14 February 1995 81 1995/1996 19 December 1995 13 April 1996 117 1996/1997 2 December 1996 28 February 1997 89 1997/1998 23 November 1997 8 March 1998 106 1998/1999 20 December 1998 2 March 1999 72 1999/2000 19 December 1999 3 March 2000 74
Table 5.2. Observations on hawksbill turtle nesting activity on cays of the northern Great Barrier Reef at various times during the year. A. More than two nights of survey
Location Period Total hawksbills ashore for nesting
Crocodile Cay 3–10 February 1997 34 Crocodile Cay 28 November to 7 December 1997 14 Sinclair Island 4–10 March 1997 29 Sinclair Island 28 November to 7 December 1997 13 Douglas Island 28 November to 7 December 1997 20 Milman Island 28 November to 7 December 1997 87 Douglas Island 3–5 February 1997 10 Howick Group 19 August to 2 September 1996 0 Howick Group 22 July to 24 August 1997 0 Piper Group 22–25 July 1996 2

59
Table 5.2. continued. B. One or two nights of survey (November – December 1997) For each island: top # = nesting attempts; bottom # = clutches laid. *Arr = Track count on arrival: top # = new tracks; bottom # = old tracks. Location DATE (November – December, 1997)
Arr* 28 29 30 1 2 3 4 5 6 7
Milman Is. – 6 3
6 4
4 2
4 3
7 2
7 1
15 3
11 3
13 2
14 0
Crocodile Cay – 4 0
3 0
5 0
4 1
2 1
2 1
2 0
3 0
2 0
1 0
Sinclair Is. – 2 0
2 0
2 0
2 0
4 0
1 0
3 1
2 0
8 0
5 0
Douglas Is. – 3 0
2 2
3 2
2 1
4 1
2 1
1 0
3 3
1 0
Cholmondeley Islet
0 22 2
0
Boydong Is. 4 69 4
4
Little Boydong Is. 0 17
Wallace Islet 0 12
Jardine Islet 0 21
1 0 1
0
Cairncross Islet 0 15
1 0 1
1 1 0
Hannibal Islet 0 17 1
0
Halfway Islet 0 2
Bushy Islet 0 0
C. Incidental observations of hawksbill turtle nesting during summer and winter periods in the northern Great Barrier Reef. ‘–‘ denotes that no count made at Milman Island.
Location Date Number Observed Milman Is. count on same date
Summer Douglas Is. 2 March 1996 0 15 Crocodile Cay 1 Sinclair Is. 3 March 1996 10 18 Cairncross Is. 0 Winter Sinclair Is. 25 August 1996 0 1 Sinclair Is. 19 August 1996 0 1 Prince of Wales 5 July 1997 10 – Woody Wallace 5 July 1997 22 – Boydong Is. 10 July 1997 0 – Home Islands Group 26 July 1996 5 – Home Islands Group 12 July 1997 3 –
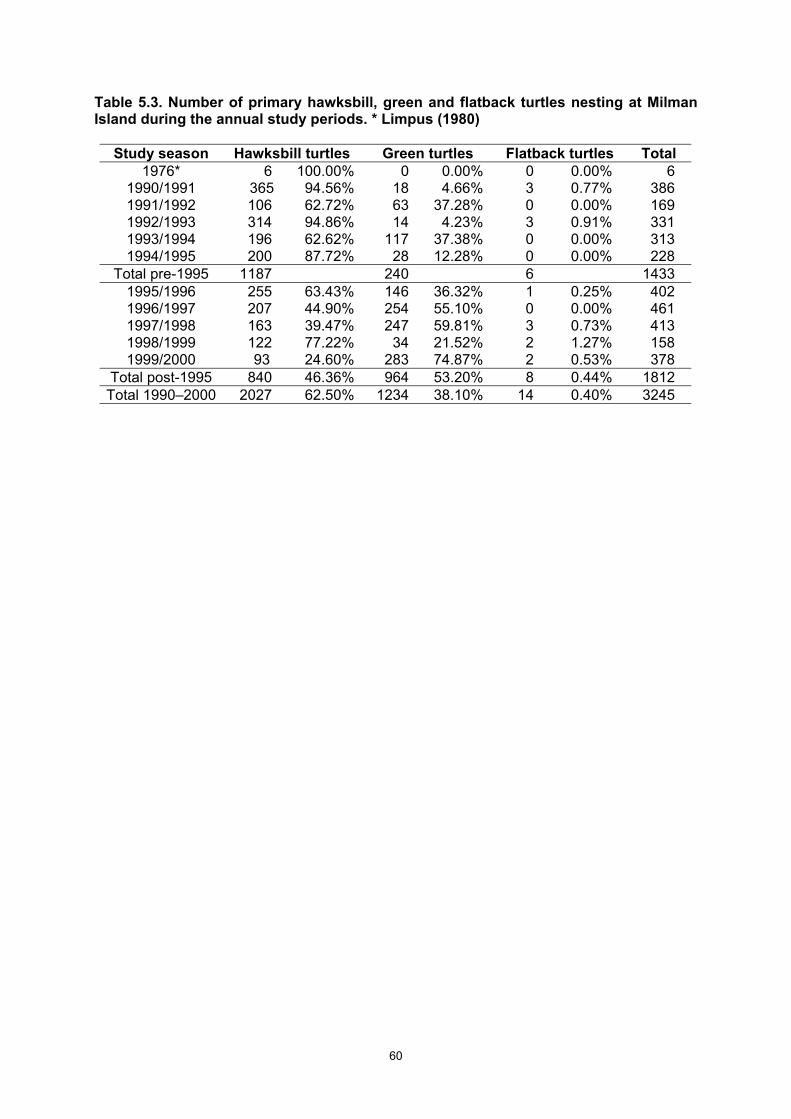
60
Table 5.3. Number of primary hawksbill, green and flatback turtles nesting at Milman Island during the annual study periods. * Limpus (1980)
Study season Hawksbill turtles Green turtles Flatback turtles Total 1976* 6 100.00% 0 0.00% 0 0.00% 6
1990/1991 365 94.56% 18 4.66% 3 0.77% 386 1991/1992 106 62.72% 63 37.28% 0 0.00% 169 1992/1993 314 94.86% 14 4.23% 3 0.91% 331 1993/1994 196 62.62% 117 37.38% 0 0.00% 313 1994/1995 200 87.72% 28 12.28% 0 0.00% 228
Total pre-1995 1187 240 6 1433 1995/1996 255 63.43% 146 36.32% 1 0.25% 402 1996/1997 207 44.90% 254 55.10% 0 0.00% 461 1997/1998 163 39.47% 247 59.81% 3 0.73% 413 1998/1999 122 77.22% 34 21.52% 2 1.27% 158 1999/2000 93 24.60% 283 74.87% 2 0.53% 378
Total post-1995 840 46.36% 964 53.20% 8 0.44% 1812 Total 1990–2000 2027 62.50% 1234 38.10% 14 0.40% 3245
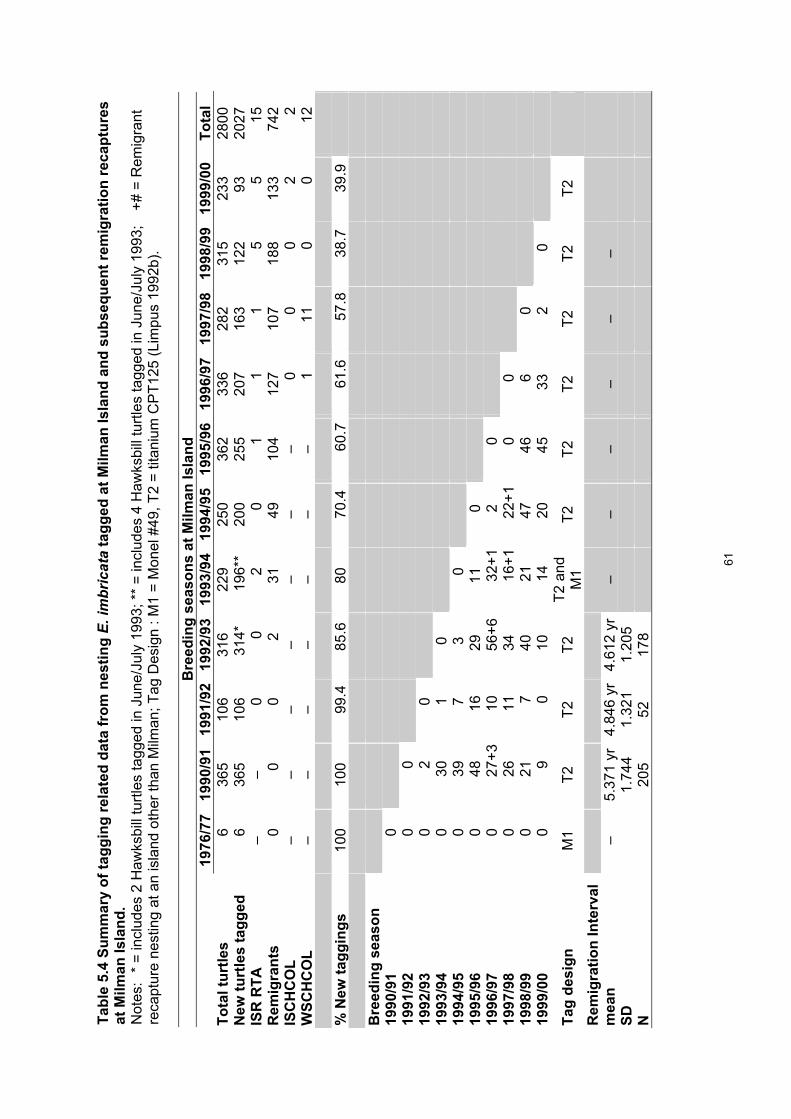
61
Tabl
e 5.
4 Su
mm
ary
of ta
ggin
g re
late
d da
ta fr
om n
estin
g E.
imbr
icat
a ta
gged
at M
ilman
Isla
nd a
nd s
ubse
quen
t rem
igra
tion
reca
ptur
es
at M
ilman
Isla
nd.
Not
es:
* =
incl
udes
2 H
awks
bill
turtl
es ta
gged
in J
une/
July
199
3; *
* =
incl
udes
4 H
awks
bill
turtl
es ta
gged
in J
une/
July
199
3;
+# =
Rem
igra
nt
reca
ptur
e ne
stin
g at
an
isla
nd o
ther
than
Milm
an; T
ag D
esig
n : M
1 =
Mon
el #
49, T
2 =
titan
ium
CP
T125
(Lim
pus
1992
b).
B
reed
ing
seas
ons
at M
ilman
Isla
nd
19
76/7
7 19
90/9
119
91/9
219
92/9
319
93/9
419
94/9
5 19
95/9
619
96/9
719
97/9
819
98/9
919
99/0
0To
tal
Tota
l tur
tles
6
36
5 10
6 31
6 22
9 25
0 36
2 33
6 28
2 31
5 23
3 28
00
New
turt
les
tagg
ed
6
36
5 10
6 3
14*
19
6**
200
255
207
163
122
93
2027
IS
R R
TA
– –
0
0
2
0
1
1
1
5
5
1
5 R
emig
rant
s
0
0
0
2
3
1 4
9 10
4 12
7 10
7 18
8 13
3 7
42
ISC
HC
OL
– –
– –
– –
–
0
0
0
2
2
WSC
HC
OL
– –
– –
– –
–
1
11
0
0
1
2
% N
ew ta
ggin
gs
100
100
9
9.4
8
5.6
80
7
0.4
60.7
6
1.6
57.8
3
8.7
3
9.9
Bre
edin
g se
ason
19
90/9
1
0
19
91/9
2
0
0
19
92/9
3
0
2
0
19
93/9
4
0
30
1
0
1994
/95
0
39
7
3
0
19
95/9
6
0
48
16
29
11
0
1996
/97
0
2
7+3
10
56+
6
3
2+1
2
0
1997
/98
0
26
11
3
4
1
6+1
22+1
0
0
1998
/99
0
21
7
4
0
21
47
46
6
0
1999
/00
0
9
0
1
0
14
20
45
33
2
0
Tag
desi
gn
M1
T2
T2
T2
T2 a
nd
M1
T2
T2
T2
T2
T2
T2
Rem
igra
tion
Inte
rval
m
ean
– 5.
371
yr4.
846
yr4.
612
yr–
– –
– –
–
SD
1.74
4 1.
321
1.20
5
N
205
52
178
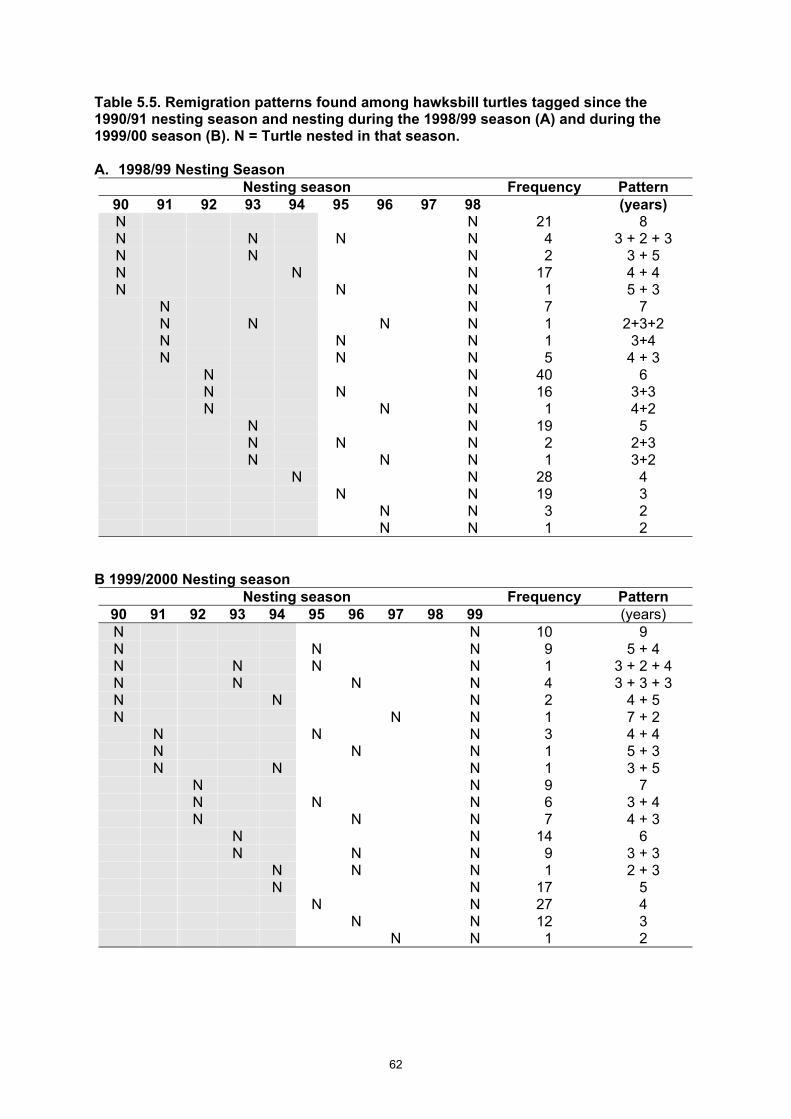
62
Table 5.5. Remigration patterns found among hawksbill turtles tagged since the 1990/91 nesting season and nesting during the 1998/99 season (A) and during the 1999/00 season (B). N = Turtle nested in that season. A. 1998/99 Nesting Season
Nesting season Frequency Pattern 90 91 92 93 94 95 96 97 98 (years) N N 21 8 N N N N 4 3 + 2 + 3 N N N 2 3 + 5 N N N 17 4 + 4 N N N 1 5 + 3 N N 7 7 N N N N 1 2+3+2 N N N 1 3+4 N N N 5 4 + 3 N N 40 6 N N N 16 3+3 N N N 1 4+2 N N 19 5 N N N 2 2+3 N N N 1 3+2 N N 28 4 N N 19 3 N N 3 2 N N 1 2
B 1999/2000 Nesting season
Nesting season Frequency Pattern 90 91 92 93 94 95 96 97 98 99 (years) N N 10 9 N N N 9 5 + 4 N N N N 1 3 + 2 + 4 N N N N 4 3 + 3 + 3 N N N 2 4 + 5 N N N 1 7 + 2 N N N 3 4 + 4 N N N 1 5 + 3 N N N 1 3 + 5 N N 9 7 N N N 6 3 + 4 N N N 7 4 + 3 N N 14 6 N N N 9 3 + 3 N N N 1 2 + 3 N N 17 5 N N 27 4 N N 12 3 N N 1 2

63
Table 5.6. Inter-season change of colony (ISCHCOL) and within-season change of colony (WSCHCOL) recaptures of hawksbill turtles that have nested at Milman Island. A. ISCHCOL CC = Crocodile Cay, DO = Douglas Is., MM = Milman Is., SN = Sinclair Is.
Tag Primary tagging ISCHCOL SEASON Locality Date Locality Date
I 21810 MM 25/01/1994 SN 06/02/1997 1996/97 K 5716 SN 08/02/1997 MM 05/01/2000 1999/00 T 48239 MM 01/02/1994 DO 29/11/1997 1997/98 T 53036 BD 13/02/1991 MM 30/01/2000 1999/00 T 55457 MM 25/01/1991 DO 04/02/1997 1996/97 T 55530 MM 22/01/1991 SN 08/02/1997 1996/97 T 55704 MM 24/02/1991 SN 08/02/1997 1996/97 T 72359 MM 22/01/1993 DO 05/02/1997 1996/97 T 72373 MM 24/01/1993 DO 05/02/1997 1996/97 T 72555 MM 03/03/1993 SN 04/02/1997 1996/97 T 72602 MM 06/02/1993 CC 09/02/1997 1996/97 T 72648 MM 17/02/1993 DO 04/02/1997 1996/97 T 72676 MM 18/02/1993 CC 06/07/1997 1997/98 T 77964 MM 04/12/1994 DO 30/11/1997 1997/98
B. WSCHCOL NOTE:* See also Table 5.6A. CC = Crocodile Cay, DO = Douglas Is., MM = Milman Is., SN = Sinclair Is.
Tag Primary tagging ISCHCOL SEASON Locality Date Locality Date
K 4686 MM 11/12/1996 SN 08/02/1997 1996/97 K 4765 MM 12/12/1996 SN 05/02/1997 1996/97 K 5004 MM 01/01/1997 SN 06/02/1997 1996/97 K 15306 SN 01/12/1997 MM 04/12/1997 1997/98 K 15321 SN 04/12/1997 MM 20/12/1997 1997/98 K 15325 SN 05/12/1997 MM 09/12/1997 1997/98 K 15327 SN 06/12/1997 MM 08/12/1997 1997/98 K 15329 SN 07/12/1997 MM 10/12/1997 1997/98 K 15404 CC 29/11/1997 MM 05/12/1997 1997/98 K 15405 CC 30/11/1997 MM 05/12/1997 1997/98 K 15412 CC 07/12/1997 MM 24/12/1997 1997/98 K 15414 CC 01/12/1997 MM 07/12/1997 1997/98 K 15503 CY 01/12/1997 MM 26/12/1997 1997/98 T 55328 MM 09/01/1997 SN 08/02/1997 1996/97 T 55660 MM 25/12/1997 CC 03/02/1997 1996/97 T 65057 MM 16/01/1997 DO 04/02/1997 1996/97 T 72109 MM 20/01/1997 CC 09/02/1997 1996/97 *T 72555 SN 04/02/1997 MM 18/02/1997 1996/97 *T 77964 DO 30/11/1997 MM 20/12/1997 1997/98

64
Table 5.7. Curved carapace length (cm) of adult female Eretmochelys imbricata nesting at Milman Island.
Study season
Mean SD Sample size
Min. Max.
1990/1991 81.76 3.59 360 63.5 91.9 1991/1992 81.63 3.97 103 66.9 90.0 1992/1993 81.38 3.83 312 67.6 91.8 1993/1994 81.92 3.74 221 69.4 91.6 1994/1995 81.31 3.57 185 71.7 91.6 1995/1996 81.30 3.62 350 70.3 91.3 1996/1997 81.20 3.66 398 70.4 92.4 1997/1998 81.83 3.24 207 73.2 94.0 1998/1999 81.86 3.60 312 69.4 92.0 1999/2000 81.62 3.73 233 73.9 95.0 All years 81.55 3.65 2681 63.5 95.0
Table 5.8. Curved carapace length (cm) of adult Eretmochelys imbricata nesting at Milman Island grouped by tagging status. A. Remigrants
Study season Mean SD Sample size Min. Max.
1990/1991 – – – – – 1991/1992 – – – – – 1992/1993 81.65 1.25 2 80.4 82.9 1993/1994 82.37 3.29 30 75.3 89.5 1994/1995 81.03 2.53 50 74.8 85.7 Pre-1995 81.53 2.86 82 74.8 89.5
1995/1996 81.70 3.79 101 74.0 90.0 1996/1997 81.40 3.60 128 73.4 92.3 1997/1998 81.00 3.09 111 74.1 88.1 1998/1999 81.90 3.73 188 69.4 92.0 1999/2000 81.70 3.82 134 74.6 95.0 Post-1995 81.58 3.63 662 69.4 95.0 All years 81.57 3.55 744 69.4 95.0

65
Table 5.8. continued. B. Primary taggings
Study season Mean SD Sample size Min. Max.
1990/1991 81.76 3.59 360 63.5 91.9 1991/1992 81.63 3.97 103 66.9 90.0 1992/1993 81.38 3.84 310 67.6 91.8 1993/1994 81.82 3.82 189 69.4 91.6 1994/1995 81.29 3.56 190 71.7 91.6 Pre-1995 81.57 3.72 1152 63.5 91.9
1995/1996 81.20 3.60 268 70.3 91.3 1996/1997 80.90 3.68 207 70.4 92.4 1997/1998 81.50 3.39 165 72.8 91.3 1998/1999 81.70 3.38 127 73.5 90.6 1999/2000 81.40 3.64 99 73.9 89.5 Post-1995 81.20 3.55 866 70.3 92.4 All years 81.45 3.65 2018 63.5 92.4
Table 5.9. Proportion of hawksbill turtles recruiting to the breeding population compared with the proportion of remigrating turtles.
Study season Number examined
First time breeding
Have bred in past
Estimated recruitment to first breeding
1990/1991 – – – – 1991/1992 48 4 44 8.3% 1992/1993 32 5 27 15.6% 1993/1994 37 4 33 10.8% 1994/1995 99 10 89 10.1% 1995/1996 116 18 98 15.5% 1996/1997 60 14 46 23.3% 1997/1998 27 9 18 13.0% 1998/1999 – – – 1999/2000 22 6 16 27.3%
Total 441 70 371 15.8%

66
Table 5.10. Mean curved carapace length (cm) for hawksbill turtles determined to be breeding for the first, second and third times in their lives.
Breeding status Code Mean SD Sample size Min. Max.
First season A1 80.2 3.104 59 74.0 88.2 Second season A2 79.5 3.875 13 89.1 89.1 Third season A3 80.7 0.050 2 80.7 80.8
Table 5.11. Weight (kg) of adult Eretmochelys imbricata nesting at Milman Island determined after oviposition. A. Weight after laying (kg)
Study season Mean SD Sample size Min. Max.
1995/1996 50.1 6.43 84 40.0 68.0 1996/1997 48.7 5.24 59 36.0 60.0 1997/1998 50.4 5.87 8 44.0 62.5 1998/1999 – – – – – 1999/2000 50.0 4.63 20 37.0 59.0
B. Comparison between pre-1995 and JBA funded periods
Study seasons Mean SD Sample size Min. Max. 1990–1994 (Dobbs et al. 1999) 50.4 6.450 582 32 72 1995–2000 (present study) 49.6 5.833 171 36 68 ANOVA F1, 751 = 2.0684, NS Pooled 50.2 6.319 753 32 72
Table 5.12. Renesting interval of E. imbricata nesting at Milman Island during the study period. A. Renesting interval of E. imbricata nesting at Milman Island
Study season Mean SD Sample size Min. Max.
1995/1996 14.1 1.60 514 8 19 1996/1997 14.4 1.75 437 11 21 1997/1998 14.2 1.94 372 11 22 1998/1999 14.4 1.62 387 10 21 1999/2000 13.7 1.69 198 11 21
B. Renesting Interval (days): Pre- and Post-1995 Groups
Study seasons Mean SD Sample size Min. Max. 1990–1994 (Dobbs et al.1999) 14.70 2.00 1329 10 25 1995–2000 (present study) 14.00 1.99 1908 8 22 ANOVA F1, 3235 = 97.100, Sig Pooled 14.28 2.02 3237 8 25
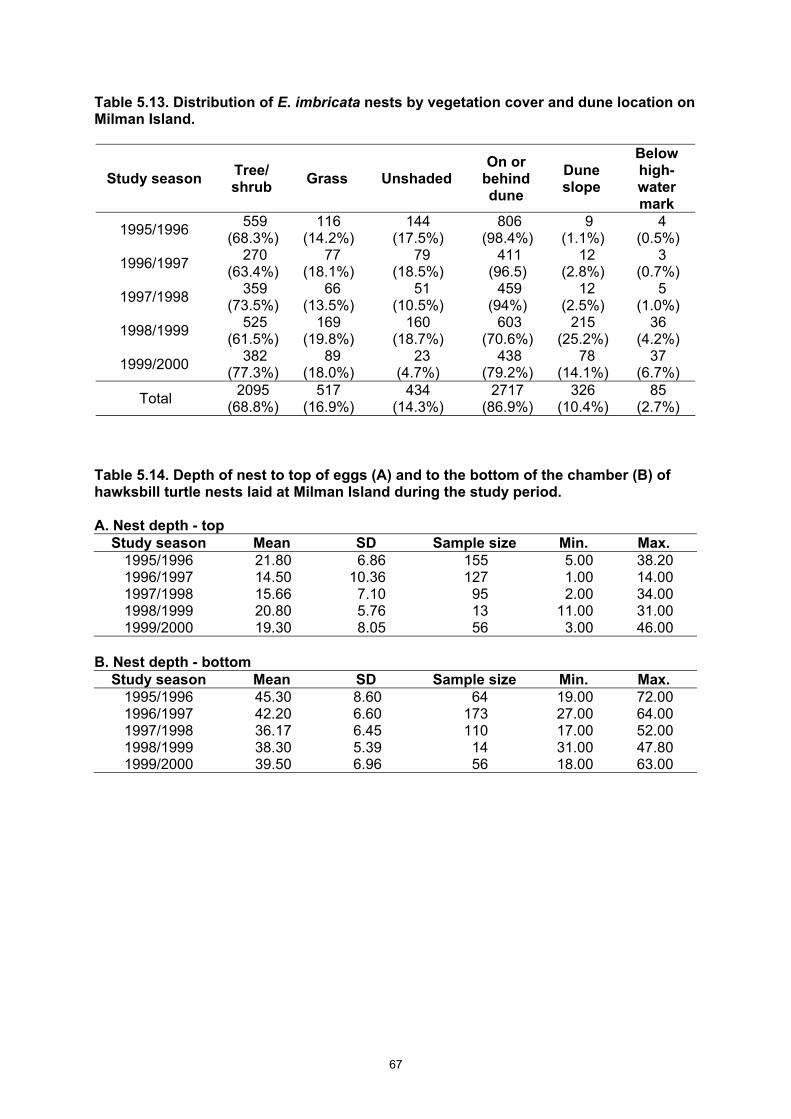
67
Table 5.13. Distribution of E. imbricata nests by vegetation cover and dune location on Milman Island.
Study season Tree/ shrub Grass Unshaded
On or behind dune
Dune slope
Below high- water mark
1995/1996 559 (68.3%)
116 (14.2%)
144 (17.5%)
806 (98.4%)
9 (1.1%)
4 (0.5%)
1996/1997 270 (63.4%)
77 (18.1%)
79 (18.5%)
411 (96.5)
12 (2.8%)
3 (0.7%)
1997/1998 359 (73.5%)
66 (13.5%)
51 (10.5%)
459 (94%)
12 (2.5%)
5 (1.0%)
1998/1999 525 (61.5%)
169 (19.8%)
160 (18.7%)
603 (70.6%)
215 (25.2%)
36 (4.2%)
1999/2000 382 (77.3%)
89 (18.0%)
23 (4.7%)
438 (79.2%)
78 (14.1%)
37 (6.7%)
Total 2095 (68.8%)
517 (16.9%)
434 (14.3%)
2717 (86.9%)
326 (10.4%)
85 (2.7%)
Table 5.14. Depth of nest to top of eggs (A) and to the bottom of the chamber (B) of hawksbill turtle nests laid at Milman Island during the study period. A. Nest depth - top
Study season Mean SD Sample size Min. Max. 1995/1996 21.80 6.86 155 5.00 38.20 1996/1997 14.50 10.36 127 1.00 14.00 1997/1998 15.66 7.10 95 2.00 34.00 1998/1999 20.80 5.76 13 11.00 31.00 1999/2000 19.30 8.05 56 3.00 46.00
B. Nest depth - bottom
Study season Mean SD Sample size Min. Max. 1995/1996 45.30 8.60 64 19.00 72.00 1996/1997 42.20 6.60 173 27.00 64.00 1997/1998 36.17 6.45 110 17.00 52.00 1998/1999 38.30 5.39 14 31.00 47.80 1999/2000 39.50 6.96 56 18.00 63.00

68
Table 5.15. Comparison between the depth of nest to top of eggs (A) and to the bottom of the chamber (B) for hawksbill turtle nests laid at Milman Island during the study period the first five years of the study and the last five years. A. Nest depth, top (cm)
Study seasons Mean SD Sample size Min. Max. 1990–1994 (Dobbs et al. 1999) 17.80 8.75 1244 1 53 1995–2000 (present study) 18.32 8.58 441 1 46 ANOVA F1, 1690 = 0.0000, NS) Pooled 18.00 8.99 1690 1 53 B. Nest depth, bottom (cm)
Study seasons Mean SD Sample size Min. Max. 1990–1994 (Dobbs et al.1999) 39.19 7.21 1249 19 91 1995–2000 (present study) 40.47 7.67 417 17 72 ANOVA F1, 1664 = 5.926, NS Pooled 39.69 7.27 1666 17 91
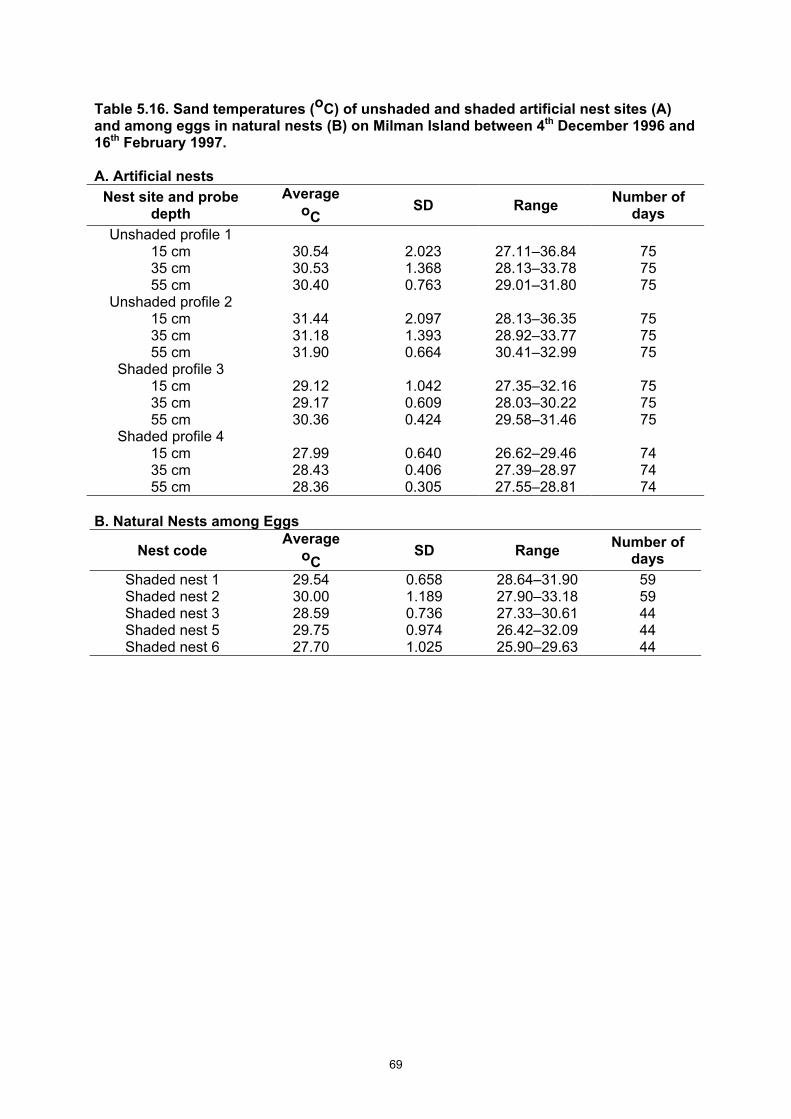
69
Table 5.16. Sand temperatures (oC) of unshaded and shaded artificial nest sites (A) and among eggs in natural nests (B) on Milman Island between 4th December 1996 and 16th February 1997. A. Artificial nests
Nest site and probe depth
Average oC
SD Range Number of days
Unshaded profile 1 15 cm 35 cm 55 cm
30.54 30.53 30.40
2.023 1.368 0.763
27.11–36.84 28.13–33.78 29.01–31.80
75 75 75
Unshaded profile 2 15 cm 35 cm 55 cm
31.44 31.18 31.90
2.097 1.393 0.664
28.13–36.35 28.92–33.77 30.41–32.99
75 75 75
Shaded profile 3 15 cm 35 cm 55 cm
29.12 29.17 30.36
1.042 0.609 0.424
27.35–32.16 28.03–30.22 29.58–31.46
75 75 75
Shaded profile 4 15 cm 35 cm 55 cm
27.99 28.43 28.36
0.640 0.406 0.305
26.62–29.46 27.39–28.97 27.55–28.81
74 74 74
B. Natural Nests among Eggs
Nest code Average
oC SD Range Number of
days Shaded nest 1 29.54 0.658 28.64–31.90 59 Shaded nest 2 30.00 1.189 27.90–33.18 59 Shaded nest 3 28.59 0.736 27.33–30.61 44 Shaded nest 5 29.75 0.974 26.42–32.09 44 Shaded nest 6 27.70 1.025 25.90–29.63 44

70
Table 5.17. Number of eggs in clutches laid by hawksbill turtles nesting at Milman Island. A. Number of eggs laid per clutch during the JBA study period
Study season Mean SD Sample size Min. Max.
1995/1996 121.60 1.76 187 44.00 189.00 1996/1997 118.50 2.23 124 21.00 201.00 1997/1998 121.30 1.69 152 62.00 182.00 1998/1999 122.50 2.80 38 84.00 161.00 1999/2000 124.00 2.58 55 75.00 177.00
B. Comparison between the 1990–1994 and the 1995–1999 study years
Study seasons Mean SD Sample size Min. Max. 1990–1994 (Dobbs et al.1999) 122 23.80 1296 18.00 215.00 1995–2000 (present study) 121.2 22.49 556 21.00 201.00 ANOVA F1, 1850 = 0.7094, NS Pooled 121.69 23.40 1852 18 215
Table 5.18. Diameter of hawksbill turtle eggs laid at Milman Island. A. Egg diameter (cm) measured during the JBA study period
Study seasons Mean SD Sample size 10 eggs/clutch Min. Max.
1995/1996 3.50 0.18 1260 2.87 3.92 1996/1997 3.57 0.08 300 3.35 3.71 1997/1998 3.55 0.22 450 2.27 3.79
B. Comparison of egg diameter (cm) between the 1990–1994 and the 1995–1999 study years
Study seasons Mean SD Sample size 10 eggs/clutch Min. Max.
1990–1994 (Dobbs et al.1999) 3.51 0.160 3460 2.83 3.81 1995–2000 (present study) 3.52 0.178 2060 2.27 3.92 ANOVA F1, 550 = 0.4633, NS Pooled 3.51 0.167 5520 2.27 3.92

71
Table 5.19. Comparison of egg weight (g) between the 1990–1994 and the 1995–1999 study years at Milman Island.
Study seasons Mean SD Sample size Min. Max. 1990–1994 (Dobbs et al.1999) 26.80 2.15 280 20.4 31.8 1995–2000 (present study) 26.25 1.79 69 21.6 29.7 ANOVA F1, 347 = 3.854, NS Pooled 26.69 2.09 349 20.4 31.8
Table 5.20. Mean minimum number of clutches laid by hawksbill turtles nesting at Milman Island during the breeding seasons of 1995–1999.
Study season Mean SD Sample size Min. Max. 1995/1996 2.93 1.53 359 1.00 7.00 1996/1997 2.55 1.56 402 1.00 6.00 1997/1998 1.61 0.81 214 1.00 4.00 1998/1999 2.70 1.31 315 1.00 6.00 1999/2000 2.50 1.33 235 1.00 6.00
Table 5.21. Duration of incubation of clutches laid by hawksbill turtles nesting at Milman Island. A. Duration of incubation during the JBA study period
Study season Mean SD Sample size Min. Max. 1995/1996 66.80 12.70 10 53.00 90.00 1996/1997 – – – – – 1997/1998 59.40 5.46 25 52.00 77.00 1998/1999 55.40 4.98 5 49.00 63.00 1999/2000 57.00 3.14 16 51.00 65.00
B. Comparison of the duration of incubation between sampling periods.
Study season Mean SD Sample size Min. Max. 1990–1994 (Dobbs et al.1999) 58.6 5.40 113 47 71 1995–2000 (present study) 59.7 7.72 56 49 90 ANOVA F1, 167 = 1.1562, NS Pooled 58.9 6.26 169 47 90

72
Table 5.22. The hatching success (A) and emergence success (B) of hatchling hawksbill turtles incubated at Milman Island. A. Hatching success
Study season Mean SD Sample
size Min. Max.
1995/1996 91.00 9.46 103 53.30 100.00 1996/1997 84.30 14.00 24 48.20 100.00 1997/1998 88.30 10.01 43 56.50 100.00 1998/1999 88.80 13.51 45 36.40 100.00 1999/2000 86.80 12.41 40 47.80 100.00
B. Emergence Success
Study season Mean SD Sample
size Min. Max.
1995/1996 90.20 10.04 103 51.40 99.10 1996/1997 81.50 18.77 24 20.60 98.00 1997/1998 85.60 12.35 43 49.60 100.00 1998/1999 86.70 18.12 45 6.80 100.00 1999/2000 84.80 13.58 40 46.70 100.00
Table 5.23. Hatching success (A) and emergence success (B) of clutches laid at Milman Island compared between the first five-year and the second five-year periods. A. Hatching success
Study season Mean SD Sample size Min. Max. 1990–1994 (Dobbs et al.1999) 82.40 20.30 226 0 100.00 1995–2000 (present study) 88.30 11.74 275 36.40 100.00 ANOVA F1, 461 = 12.632, Sig Pooled 86.70 14.82 483 3.90 100.00
B. Emergence Success
Study season Mean SD Sample size Min. Max. 1990–1994 (Dobbs et al.1999) 79.20 24.20 226 0 100.00 1995–2000 (present study) 86.30 14.12 275 6.80 100.00 ANOVA F1, 460 = 12.8855, Sig Pooled 84.50 17.91 482 1.70 100.00
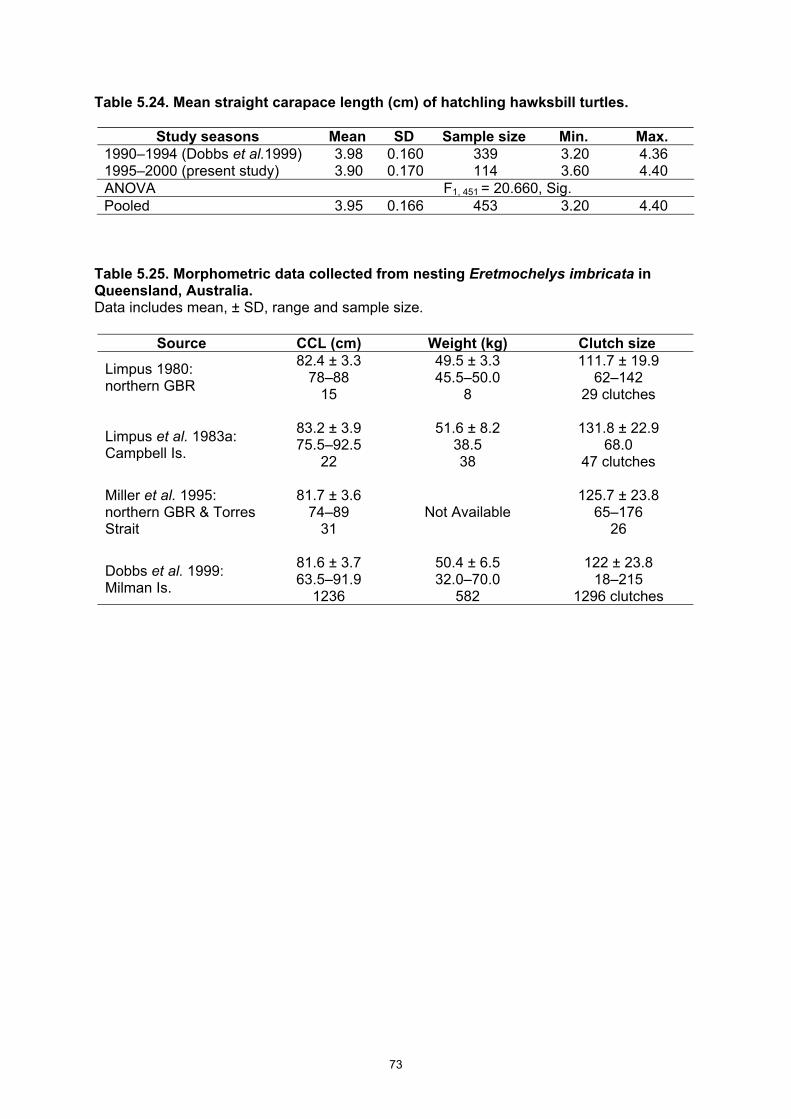
73
Table 5.24. Mean straight carapace length (cm) of hatchling hawksbill turtles.
Study seasons Mean SD Sample size Min. Max. 1990–1994 (Dobbs et al.1999) 3.98 0.160 339 3.20 4.36 1995–2000 (present study) 3.90 0.170 114 3.60 4.40 ANOVA F1, 451 = 20.660, Sig. Pooled 3.95 0.166 453 3.20 4.40
Table 5.25. Morphometric data collected from nesting Eretmochelys imbricata in Queensland, Australia. Data includes mean, ± SD, range and sample size.
Source CCL (cm) Weight (kg) Clutch size
Limpus 1980: northern GBR
82.4 ± 3.3 78–88
15
49.5 ± 3.3 45.5–50.0
8
111.7 ± 19.9 62–142
29 clutches
Limpus et al. 1983a: Campbell Is.
83.2 ± 3.9 75.5–92.5
22
51.6 ± 8.2 38.5 38
131.8 ± 22.9 68.0
47 clutches Miller et al. 1995: northern GBR & Torres Strait
81.7 ± 3.6 74–89
31 Not Available
125.7 ± 23.8 65–176
26
Dobbs et al. 1999: Milman Is.
81.6 ± 3.7 63.5–91.9
1236
50.4 ± 6.5 32.0–70.0
582
122 ± 23.8 18–215
1296 clutches
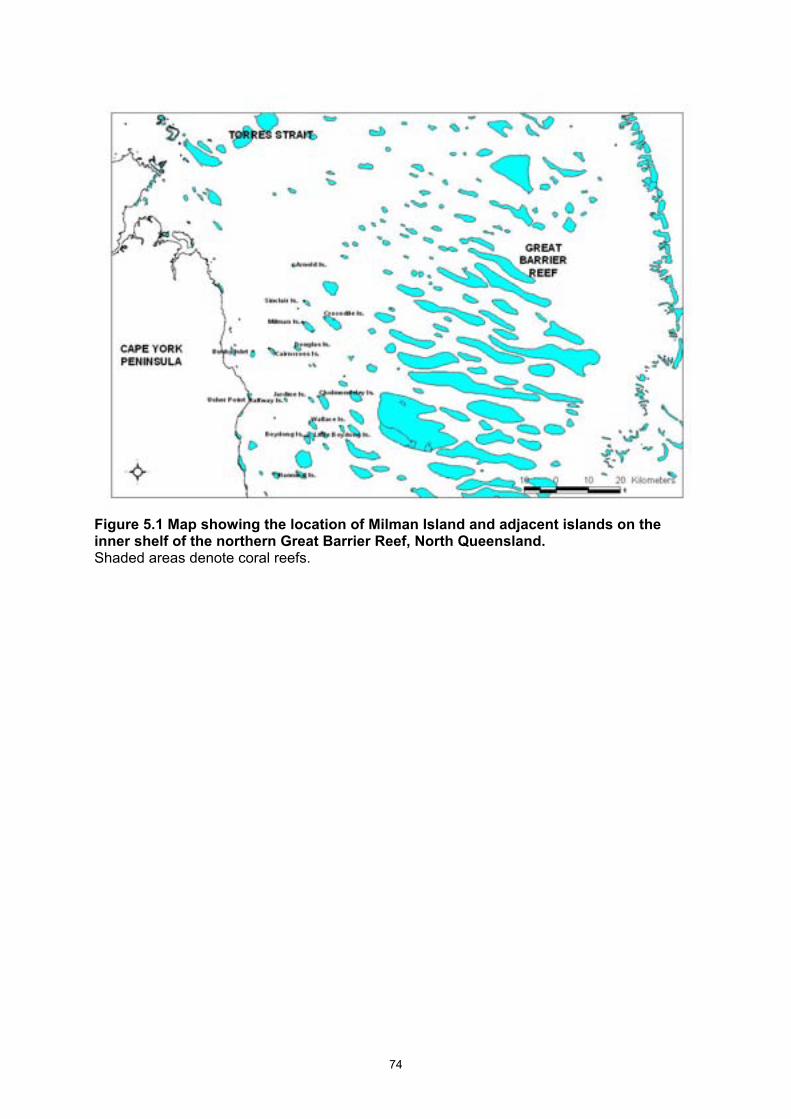
74
Figure 5.1 Map showing the location of Milman Island and adjacent islands on the inner shelf of the northern Great Barrier Reef, North Queensland. Shaded areas denote coral reefs.

75
20 D
ec
30 D
ec9 J
an
29 Ja
n8 F
eb
18 Feb
28 Feb
10 M
ar
DATE (1998-1999)
0
100
200
300
400
500
CU
MU
LATI
VE N
UM
BER
(Tur
tles)
0
100
200
300
400
500A
VAILA
BLE TU
RTLES
ArrivalsDeparturesAvailable Turtles
Figure 5.2a. The cumulative index of arrivals and departures of hawksbill turtles during the 1998/99 nesting season at Milman Island. Arrival = first sighting of turtle for season, Departure = last sighting of turtle for season.
19 D
ec
29 D
ec8 J
an
18 Ja
n
28 Ja
n7 F
eb
17 Feb
27 Feb
DATE (1999-2000)
0
50
100
150
200
250
CU
MU
LATI
VE N
UM
BER
(Tur
tles)
0
50
100
150
200
250
AVA
ILAB
LE TUR
TLES
ArrivalsDeparturesAvailable Turtles
Figure 5.2b. The cumulative index of arrivals and departures of hawksbill turtles during the 1999/00 nesting season at Milman Island. Arrival = first sighting of turtle for season, Departure = last sighting of turtle for season.

76
STANDARD 1 MONTH CENSUS 15th JANUARY - 15th FEBRUARY
1990
1991
1992
1993
1994
1995
1996
1997
1998
1999
BREEDING SEASON
050
100150200250300350400450500
NES
TIN
G F
EMA
LES
0
100
200
300
400
500C
LUTC
HES
NESTING FEMALESCLUTCHES LAIDTRENDTREND
Figure 5.3. Number of hawksbill turtles nesting and the number of clutches laid at Milman Island during the standard annual census period (15th January–15th February).
0 1 2 3 4 5 6 7 8 9 10
REMIGRATION INTERVAL (Years)
0
0.1
0.2
0.3
0.4
0.5
0.6
CU
MU
LATI
VE P
RO
POR
TIO
N R
ECA
PTU
RES
1991/921992/931993/941994/951995/961996/971997/981998/99
Figure 5.4 Cumulative proportion of recaptures by yearly cohort of hawksbill turtles tagged at Milman Island
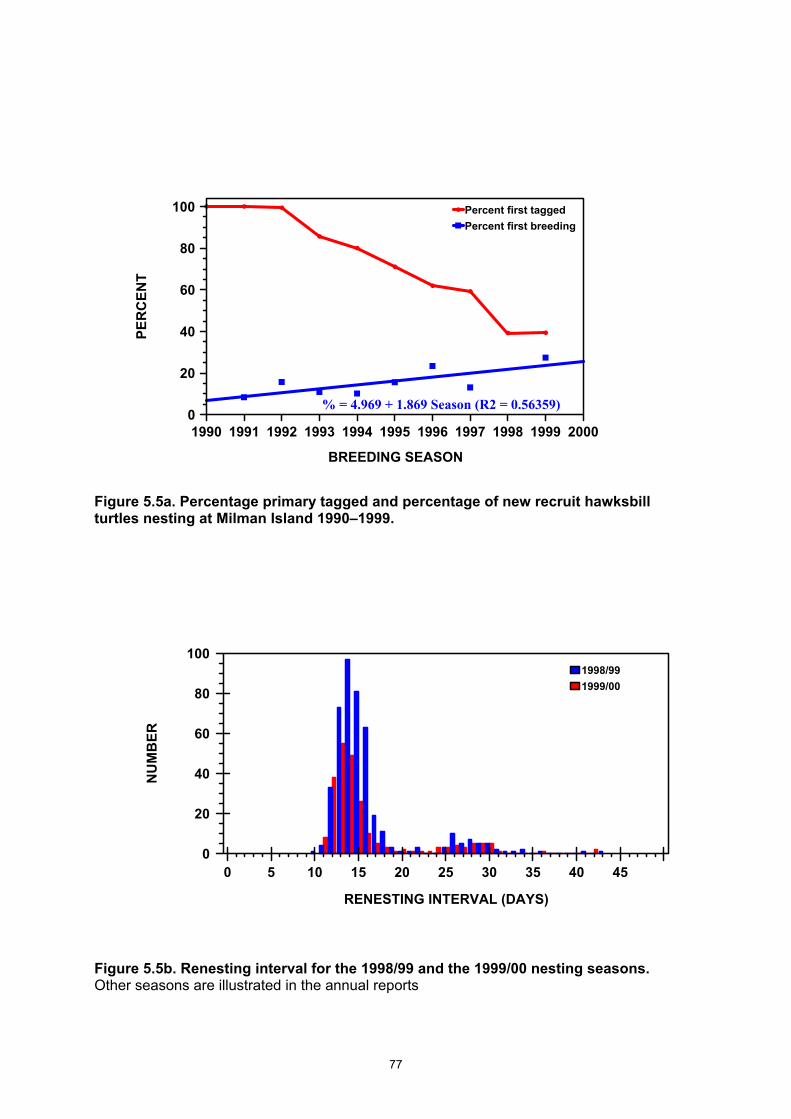
77
1990 1991 1992 1993 1994 1995 1996 1997 1998 1999 2000
BREEDING SEASON
0
20
40
60
80
100
PER
CEN
T
Percent first taggedPercent first breeding
% = 4.969 + 1.869 Season (R2 = 0.56359)
Figure 5.5a. Percentage primary tagged and percentage of new recruit hawksbill turtles nesting at Milman Island 1990–1999.
0 5 10 15 20 25 30 35 40 45
RENESTING INTERVAL (DAYS)
0
20
40
60
80
100
NU
MB
ER
1998/991999/00
Figure 5.5b. Renesting interval for the 1998/99 and the 1999/00 nesting seasons. Other seasons are illustrated in the annual reports

78
Figure 5.6a. Nesting distribution by sector at Milman Island during the 1998/99 nesting season.

79
Figure 5.6b. Nesting distribution by sector at Milman Island during the 1999/00 nesting season.

80
5.7a. Unshaded artificial nest
4 Dec
9 Dec
14 Dec
19 Dec
24 Dec
29 Dec
3 Jan
8 Jan
13 Jan
18 Jan
23 Jan
28 Jan
2 Feb
7 Feb
12 Feb
Date
2728293031323334353637
Temperature (°C)
15 cm 35 cm 55 cm
5.7b. Unshaded artificial nest.
4 Dec
9 Dec
14 Dec
19 Dec
24 Dec
29 Dec
3 Jan
8 Jan
13 Jan
18 Jan
23 Jan
28 Jan
2 Feb
7 Feb
12 Feb
Date
2728293031323334353637
Temperature (°C)
15 cm 35 cm 55 cm

81
Figure 5.7 continued… 5.7c. Shaded artificial nest.
4 Dec
9 Dec
14 Dec
19 Dec
24 Dec
29 Dec
3 Jan
8 Jan
13 Jan
18 Jan
23 Jan
28 Jan
2 Feb
7 Feb
12 Feb
Date
27
28
29
30
31
32
33Temperature (°C)
15 cm 35 cm 55 cm
5.7d. Shaded artificial nest.
4 Dec
9 Dec
14 Dec
19 Dec
24 Dec
29 Dec
3 Jan
8 Jan
13 Jan
18 Jan
23 Jan
28 Jan
2 Feb
7 Feb
12 Feb
Date
26
27
28
29
30Temperature (°C)
15 cm 35 cm 55 cm

82
5.7e. Temperatures from among eggs near the centre of the clutch.
20 Dec
25 Dec
30 Dec
4 Jan
9 Jan
14 Jan
19 Jan
24 Jan
29 Jan
3 Feb
8 Feb
13 Feb
Date
25262728293031323334
Temperature (°C)
Nest 1 Nest 2 Nest 3 Nest 5 Nest 6
Figures 5.7a–e. Temperatures from three different depths in artificial nests (a–d) and from among the egg mass (e) near the centre of the clutch of hawksbill turtle eggs laid at Milman Island during the 1996/97 nesting season.
83
Appendices Appendix 1. Brief descriptions of islands and cays at which observations were made concerning hawksbill turtle nesting activity. Additional descriptions for these islands are available in the Australian Litoral Society (1990) and Miller et al. (1995).
Island Location Brief description Boydong Island 11° 29.5’S, 143° 1.5’E Forested sand cay Bushy Island 11° 43.5’S, 142° 59.0’E Low wooded island Cairncross Island 11° 14.5’S, 142° 55.1’E Densely wooded sand cay Cairncross Cay 11° 14.4’S, 142° 55.1’E Vegetated sand cay Cholmondeley 11° 22.6’S, 143° 3.1’E Sandy island covered with
stunted vegetation Crocodile Cay 11° 10.1’S, 143° 5.9’E Vegetated (grass) sand cay Douglas Island 11° 14.4’S, 142° 59.4’E Vegetated sand cay Halfway Islet 11° 22.9’S, 142° 57.9’E Bush covered with a clump of
trees to nine meters high in the centre
Hannibal Islet 11° 35.6’S, 142° 55.9’E A low-wooded island Jardine Islet 11° 22.8’S, 143° 1.7’E A sandy islet with grass cover and
scattered shrubs Little Boydong Island 11° 29.0’S, 143° 1.8’E Sparsely wooded island with
predominant grassland lying on the north edge of the reef.
Nob Island 11° 57.0’S, 143° 16.0’E Continental island in the Home Islands Group
Perry Island 11° 58.5’S, 143° 15.5’E Continental island in the Home Islands Group
Prince of Wales Island 10° 44.0’S, 142° 16.0’E Continental island locally known as Muralug. The island lies outside of the Great Barrier Reef Marine Park, on the northern tip of Cape York Peninsula in Torres Strait.
Rocky Island 14°14’S, 144°21’E Continental island located south of Lizard Island.
Sinclair Island 11° 6.6’S, 143° 1.1’E Vegetated (grass) sand cay Wallace Islet 11° 27.0’S, 143° 1.8’E Sand cay sparsely vegetated with
bushes Woody Wallis Island 10° 53’S, 142° 2’E Wooded and grass covered
continental island The island lies outside of the Great Barrier Reef Marine Park, off the western tip of Cape York Peninsula south of Torres Strait.
Home Island Group 11°59’S, 143°26’E 4 continental islands located at Cape Grenville (Clerke, Gore, Nob, Perry)
Piper Island Group 12°14.6’S, 143°13.7’E Mangrove or wooded sand cays (Baird, Beesley, Farmer, Fisher Islets)
Howick Island Group 14°30’S, 145°00’E Group of sparsely wooded sand cays
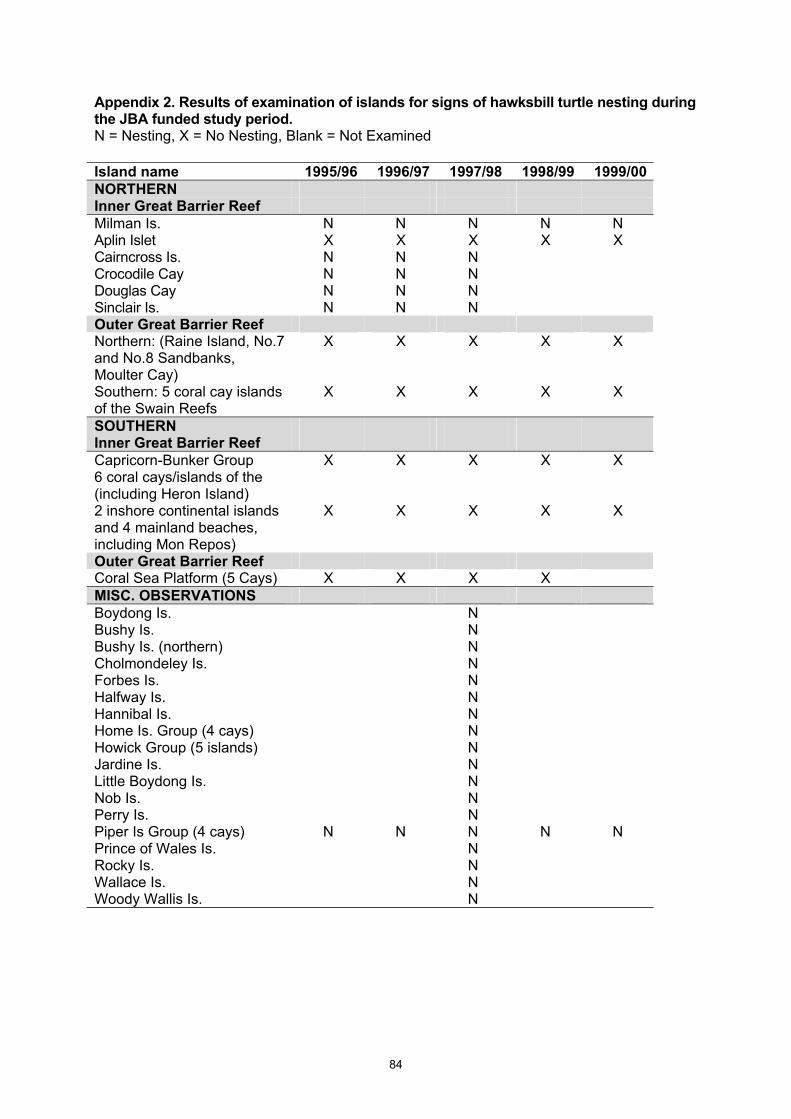
84
Appendix 2. Results of examination of islands for signs of hawksbill turtle nesting during the JBA funded study period. N = Nesting, X = No Nesting, Blank = Not Examined Island name 1995/96 1996/97 1997/98 1998/99 1999/00 NORTHERN Inner Great Barrier Reef Milman Is. N N N N N Aplin Islet X X X X X Cairncross Is. N N N Crocodile Cay N N N Douglas Cay N N N Sinclair Is. N N N Outer Great Barrier Reef Northern: (Raine Island, No.7 and No.8 Sandbanks, Moulter Cay)
X X X X X
Southern: 5 coral cay islands of the Swain Reefs
X X X X X
SOUTHERN Inner Great Barrier Reef Capricorn-Bunker Group 6 coral cays/islands of the (including Heron Island)
X X X X X
2 inshore continental islands and 4 mainland beaches, including Mon Repos)
X X X X X
Outer Great Barrier Reef Coral Sea Platform (5 Cays) X X X X MISC. OBSERVATIONS Boydong Is. N Bushy Is. N Bushy Is. (northern) N Cholmondeley Is. N Forbes Is. N Halfway Is. N Hannibal Is. N Home Is. Group (4 cays) N Howick Group (5 islands) N Jardine Is. N Little Boydong Is. N Nob Is. N Perry Is. N Piper Is Group (4 cays) N N N N N Prince of Wales Is. N Rocky Is. N Wallace Is. N Woody Wallis Is. N

85
CHAPTER 6 - Breeding migration Colin J. Limpus and Jeffrey D. Miller Introduction When Eretmochelys imbricata research commenced in the Great Barrier Reef in the 1970s, it was believed that this species was essentially a non-migratory species of marine turtle (Bustard 1979). By the early 1980s the limited accumulating tag recovery data were influencing some reviewers to consider the possibility that some adult E. imbricata were migratory between foraging and breeding sites (Meylan 1982; Witzell 1983; Marquez 1990). Within the past decade there has been extensive mark-recapture tagging research of E. imbricata at both forage areas and nesting beaches within the Great Barrier Reef of Queensland, Australia. These studies have provided the opportunity to document the movements of breeding E. imbricata between forage areas and their nesting beaches. Some migration data for adult E. imbricata of the western Pacific Ocean from studies prior to the commencement of the present JBA funded studies have been published (Vaughan and Spring 1980; Parmenter 1983; Miller et al. 1998). Modest numbers of migration recaptures have continued to accumulate from this study and they are reinforcing the results obtained from similar studies globally (Meylan 1999). There are sufficient data now available to draw some general principles with regard to the breeding migration of adult E. imbricata. Methods Tagging and measurement methods follow the methods described in Chapter 3. Eretmochelys imbricata study sites within the Great Barrier Reef region (GBR) have been chosen for their convenience for census and mark-recapture studies of foraging and nesting turtles (Dobbs et al. 1999; Limpus 1992; present JBA funded studies). Within Australia, migration tag recoveries have been obtained as part of the mark-recapture studies during systematic sampling of large numbers of turtles at many sites in the GBR. For international recaptures, we have relied on the chance recovery of tagged turtles by coastal people in neighbouring countries and their subsequent return of the tags and/or data to the address on the tags. Results There are now 15 E. imbricata with recorded migration between known feeding and breeding sites or vice versa within the Coral Sea region of the south-western Pacific Ocean (Table 6.1; Figure 6.1). There are 6 migration records from prior studies (Miller et al. 1998; Parmenter 1983; Vaughan and Spring 1980) and 9 records reported within the current JBA funded study. • Eretmochelys imbricata that forage at sites within the Great Barrier Reef of Queensland
have now been recorded migrating to nesting sites in Vanuatu, Solomon Islands, Papua New Guinea and sites elsewhere in the Great Barrier Reef.
• Eretmochelys imbricata that lay eggs on islands within the northern Great Barrier Reef have now been recorded migrating to foraging sites in Indonesia, Papua New Guinea and elsewhere in the northern Great Barrier Reef.
• These migration recaptures span time intervals between nesting and feeding recaptures of 0.5–9.0 yr.
• The individual minimum migration displacements from feeding to nesting have a range of 98–2420 km.
86
Of the 6 adult female and 1 adult male E. imbricata tagged while feeding on coral reefs of the northern Great Barrier Reef and which migrated to breed in neighbouring countries: • All (100%) were reported captured for killing by indigenous hunters (6 killed, 1 purchased
from the local hunters before the turtle was killed). • Four (60%) of the six adult females were on their first breeding migration when they were
killed. The breeding age of the remaining two was not recorded. The capture of a nesting female E. imbricata (T77910) at Milman Island on 25th December 1999, with a detachable harpoon head embedded in its carapace (Fig. 6.2), is further evidence of the hunting pressure some of these turtles are exposed to when they depart the protected nesting areas within the Great Barrier Reef World Heritage Area and return to their respective foraging areas. This turtle did not have the harpoon head embedded in its carapace when she was previously recorded nesting at Milman Island during the 1994–1995 and 1996–1997 breeding seasons. Harpoon heads of this design are used widely in Torres Strait and southern Papua New Guinea and possibly further afield. One adult female (T55332. Table 6.1) which was originally tagged while nesting at Milman Island and which migrated to Coombe Reef in the northern Great Barrier Reef has been recaptured twice on Coombe Reef with a 2 yr recapture interval in the same feeding area. Non residency adjacent to nesting beaches At least 2027 adult female E. imbricata have been tagged while nesting at the major breeding area of Milman and adjacent islands since 1990. None of these females, originally tagged while nesting on the islands, has been recaptured as feeding resident turtles on the reefs adjacent to the nesting beaches outside of the breeding season during which they were recorded nesting. However, 28 adult female E. imbricata, that have not been recorded nesting at Milman Island, have been captured during the systematic searches of the reefs surrounding Milman and the adjacent islands in the last five years. These latter turtles were identified to be foraging on these reefs and included adult females that were non-breeding or in preparation for breeding (vitellogenic) within their respective years of capture. The mark-recapture studies on Milman Island and the adjacent reefs have demonstrated that the E. imbricata that forage over Milman Island Reef are a different cohort to the E. imbricata that visit the island for nesting. Discussion This new recapture data of migrating E. imbricata within the south-western Pacific Ocean region provides data that are consistent with the general principles of migration identified by Miller et al. (1998) for the species globally. Meylan (1999) has summarised known migratory data for 19 adult female E. imbricata within the Caribbean region. These two sets of migration data from the Coral Sea and Caribbean Sea have produced very similar types of results from which the following principles can be drawn with respect to E. imbricata migration: • Adult E. imbricata are as migratory between foraging and nesting areas as the other
species of marine turtles (See Meylan 1982 and Limpus et al. 1983, 1992 for summaries of migration data for other species).
• Adult E. imbricata do not usually breed at the rookeries close to their respective foraging sites.
• Adult E. imbricata may migrate more than 2000 km from a forage area to a distant rookery.
• Adult E. imbricata living in one area do not all migrate to breed at the same rookery. • Adult E. imbricata that breed at the same rookery do not all migrate to the same foraging
area.

87
The multiple tag recoveries of T55332 at the same reefal feeding area provide our first record of foraging area fidelity by a post-breeding migration female E. imbricata. This type of fidelity is not unexpected for E. imbricata, given the long-term foraging area fidelity recorded for adult females of other species of cheloniid turtles (Limpus et al. 1992). Given the small sample size, caution must be exercised in using the mortality rates associated with the international tag recoveries of the present study. However, the mortality rate associated with these tag recoveries is consistent with the high mortality among first time breeding females recorded by Broderick (1998) at the Arnavon Islands of central Solomon Islands and the extensive regional mortality elsewhere in the south-west Pacific area (Limpus, 1997). Similarly an undetermined proportion of the adult females that migrate to breed within the protected habitat of the Great Barrier Reef Marine Park and associated island National Parks such as Milman Island are at risk of being hunted in their respective foraging areas in neighbouring countries. Because of these observations, concern must be expressed for the long-term sustainability of current regional levels of E. imbricata harvest in the south-western Pacific Ocean region. Excessive harvest of nesting adult E. imbricata within the island nations of the south-west Pacific region has the potential to threaten the stability of foraging populations even in large protected areas like the Great Barrier Reef World Heritage Area. References Broderick, D. (1998). Subsistence hunting of marine turtles in the Solomon Islands. In ‘Proceedings of the 17th Symposium on Sea Turtle Biology and Conservation’ (Compilers Epperly, S. P. and Braun, J.). pp. 15–18. NOAA Technical Memorandum NMFS-SEFSC-415. Bustard, H. R. (1979). Population dynamics of sea turtles. In ‘Turtles: Perspectives and Research.’ (Eds. Harless, M. and Morlock, H.) pp. 523–540. (Wiley: New York.) Dobbs, K.L., Miller, J.D., Limpus, C. J. and Landry, A.M. (1999). Hawksbill turtle, Eretmochelys imbricata, nesting at Milman Island, northern Great Barrier Reef, Australia. Chelonian Conservation and Biology 3, 344–361. Limpus, C. J. (1997). Marine turtle populations of Southeast Asia and the Western Pacific Region: distribution and status. In ‘Proceedings of the Workshop on Marine Turtle Research and Management in Indonesia.’ (Eds. Noor, Y. R., Lubis, I. R., Ousted, R., Troeng, S. and Abdullah, A.) pp.37–73. (Wetlands International/PHPA/Environment Australia: Bogor.) Limpus, C. J., Miller, J. D., Parmenter, C. J., Reimer, D., McLachlan, N. and Webb, R. (1992). Migration of green (Chelonia mydas) and loggerhead (Caretta caretta) turtles to and from eastern Australian rookeries. Australian Wildlife Research 19, 347–358. Limpus, C. J., Parmenter, C. J., Baker, V. and Fleay, A. (1983). The flatback turtle Chelonia depressa in Queensland: post-nesting migration and feeding ground distribution. Australian Wildlife Research 10, 557–561. Marquez, R. (1990). FAO Species Catalogue. Vol. 11. Sea Turtles of the World. FAO Fisheries Synopsis 125, 1–81. Meylan, A. (1982). Sea turtle migration - evidence from tag returns. In ‘Biology and Conservation of Sea Turtles.’ (Ed. K. A. Bjorndal) pp. 91–100. (Smithsonian Institution Press: Washington D.C.) Meylan, A. (1999). Status of the hawksbill turtle in the Caribbean region. Chelonian Conservation Biology 3, 177–184. Miller. J. D., Dobbs, K. A., Limpus, C. J., Mattocks, N. and Landry, A. M. (1998). Long distance migration by the hawksbill turtle, Eretmochelys imbricata, from north-eastern Australia. Wildlife Research 25, 89–95.

88
Parmenter, C. J. (1983). Reproductive migration in the hawksbill turtle (Eretmochelys imbricata). Copeia 1983, 271–273. Vaughan, P. W. and Spring, C. S. (1980). Long distance hawksbill recovery. Marine Turtle Newsletter 16, 6. Witzell, W. N. (1983). Synopsis of the biological data on the hawksbill turtle Eretmochelys imbricata (Linnaeus, 1766). FAO Fisheries Symposium 137, 11–78.

89
Tabl
e 6.
1. C
aptu
re d
ata
for m
igra
ting
Eret
moc
hely
s im
bric
ata
from
QPW
S st
udie
s an
d ot
her p
ublis
hed
reco
rds
with
in th
e C
oral
Sea
re
gion
.
Orig
inal
tagg
ing
data
M
igra
tion
reca
ptur
e da
ta
Tag
num
ber
Dat
e Lo
catio
n A
ctiv
ity
Size
D
ate
Loca
tion
Act
ivity
M
atur
ity a
nd
size
Fa
te o
f tur
tleM
inim
um
dist
ance
Min
imum
tim
e FE
MA
LE
(V
augh
an &
S
prin
g,
1980
)
5thD
ec
1976
A
rnav
on Is
land
s S
olom
on Is
land
s 7.
417o S,
15
8.00
0o E
Nes
ting
Adu
lt 20
th
Feb
1979
Fish
erm
an’s
Isla
nd,
Por
t Mor
esby
, P
apua
New
Gui
nea
9.48
3o S, 1
47.1
17o E
? Fe
edin
g on
reef
A
dult
Kille
d; e
aten
14
00 k
m
807d
A24
36
(Par
men
ter,
1983
)
31st
Mar
19
79
Sak
eman
Ree
f, To
rres
Stra
it 9.
5500
o S,
143.
5167
o E
Feed
ing
Adu
lt C
CL
= 83
.5 c
m16
th
Feb
1980
Arn
avon
Isla
nd,
Sol
omon
Isla
nds
7.41
67o S,
15
8.00
0o E
Nes
ting
Adu
lt –
1657
km
32
2 d
T385
13
1st O
ct
1988
G
reen
Isla
nd
Ree
f, no
rther
n G
BR
16
.750
o S,
145.
983o E
Feed
ing
Imm
atur
e C
CL
= 80
.5 c
m24
th
Sep
19
97
Off
coas
t of R
abau
l, P
NG
04
o 20’S
, 152
o 15’E
? Bre
edin
g A
dult
in 1
st
bree
ding
se
ason
Cap
ture
for
sale
, pu
rcha
sed
$100
&
rele
ased
1533
km
32
80 d
T437
62
9thA
ug
1989
G
reen
Isla
nd
Ree
f, no
rther
n G
BR
16
.750
o S,
145.
983o E
Feed
ing
Imm
atur
e,
pube
scen
t C
CL
= 85
.5 c
m
Apr
19
97
at s
ea n
ear
Wag
hena
, Cho
iseu
l P
rove
nce,
Sol
omon
Is
land
s 7.
413o S,
15
7.95
85o E
With
ov
iduc
al
eggs
Adu
lt in
1st
bree
ding
se
ason
Kill
ed; e
aten
16
58 k
m
2792
d
T473
61
8thA
ug
1989
G
reen
Isla
nd
Ree
f, no
rther
n G
BR
16
.750
o S,
145.
983o E
Feed
ing
Imm
atur
e C
CL
= 80
.5 c
m5th
Aug
1996
Ill
i Villa
ge, W
ide
Bay
, New
Brit
ain,
P
NG
5.
250o S
, 152
.083
o E
Layi
ng
eggs
A
dult
in 1
st
bree
ding
se
ason
Kill
ed; e
aten
15
34 k
m
2554
d

90
Tabl
e 6.
1 co
ntin
ued.
Orig
inal
tagg
ing
data
M
igra
tion
reca
ptur
e da
ta
Tag
num
ber
Dat
e Lo
catio
n A
ctiv
ity
Size
D
ate
Loca
tion
Act
ivity
M
atur
ity a
nd
size
Fa
te o
f tur
tleM
inim
um
dist
ance
Min
imum
tim
e FE
MA
LE
T4
9314
22
nd
Jun
1990
Cla
ck R
eef,
north
ern
GBR
14
.067
o S,
144.
250o E
Feed
ing
Adu
lt, n
on-
bree
ding
C
CL
= 91
.0 c
m
15th
Jan
1997
Loh
Is.,
Torre
s G
roup
, V
anua
tu
13.3
33o S,
16
6.58
3o E
Layi
ng
eggs
A
dult
Kill
ed; e
aten
24
20 k
m
2399
d
T553
32
12th
Jan
1991
Milm
an Is
land
, no
rther
n G
BR
11.1
70o S,
14
3.01
0o E
Nes
ting
Adu
lt 25
th
Jul
1997
Coo
mbe
Ree
f, no
rther
n G
BR
14.4
30o S,
14
4.95
2o E
Feed
ing
on re
ef
Adu
lt C
CL
= 94
.2 c
mR
elea
sed
420
km
2386
d
11
th
Aug
19
99
Coo
mbe
Ree
f, no
rther
n G
BR
14.4
30o S,
14
4.95
2o E
Feed
ing
on re
ef
Adu
lt C
CL
= 94
.2 c
mR
elea
sed
74
8 d
T553
72
18th
Feb
1991
Milm
an Is
land
, no
rther
n G
BR
11.1
70o S,
14
3.01
0o E
Nes
ting
Adu
lt C
CL
= 83
.2 c
m10
th
Aug
19
99
How
ick
Gro
up,
north
ern
GBR
14
.400
o S,
144.
933o E
Feed
ing
on re
ef
Adu
lt C
CL
= 82
.6 c
m
Rel
ease
d 41
9 km
17
3 d
T559
10
15th
Mar
19
91
Milm
an Is
land
, no
rther
n G
BR
11.1
70o S,
14
3.01
0o E
Nes
ting
Adu
lt C
CL
= 80
.5 c
m22
nd
Jul
1997
Hed
ge R
eef,
north
ern
GBR
13
.967
o S,
143.
945o E
Feed
ing
on re
ef
Adu
lt C
CL
= 80
.7 c
mR
elea
sed
329
km
2321
d
T560
89
3rdJu
ly
1991
C
lack
Ree
f, no
rther
n G
BR
14.0
67o S,
14
4.25
0o E
Feed
ing
Adu
lt C
CL
= 87
.3 c
m
14th
Jan
1992
Sol
omon
Isla
nds
10.5
00o S,
16
6.00
0o E
Nes
ting
Adu
lt K
illed
23
45 k
m
195
d
T726
73
2ndA
pr
1993
M
ilman
Isla
nd,
north
ern
GBR
11
.170
o S,
143.
010o E
Nes
ting
Adu
lt C
CL
= 77
.0 c
m24
th
Nov
19
94
Mer
auke
, Iria
n Ja
ya, I
ndon
esia
8.
513o S
, 140
.380
o E
Was
hed
asho
re
rece
ntly
de
ad
Adu
lt D
ead
420
km
601
d
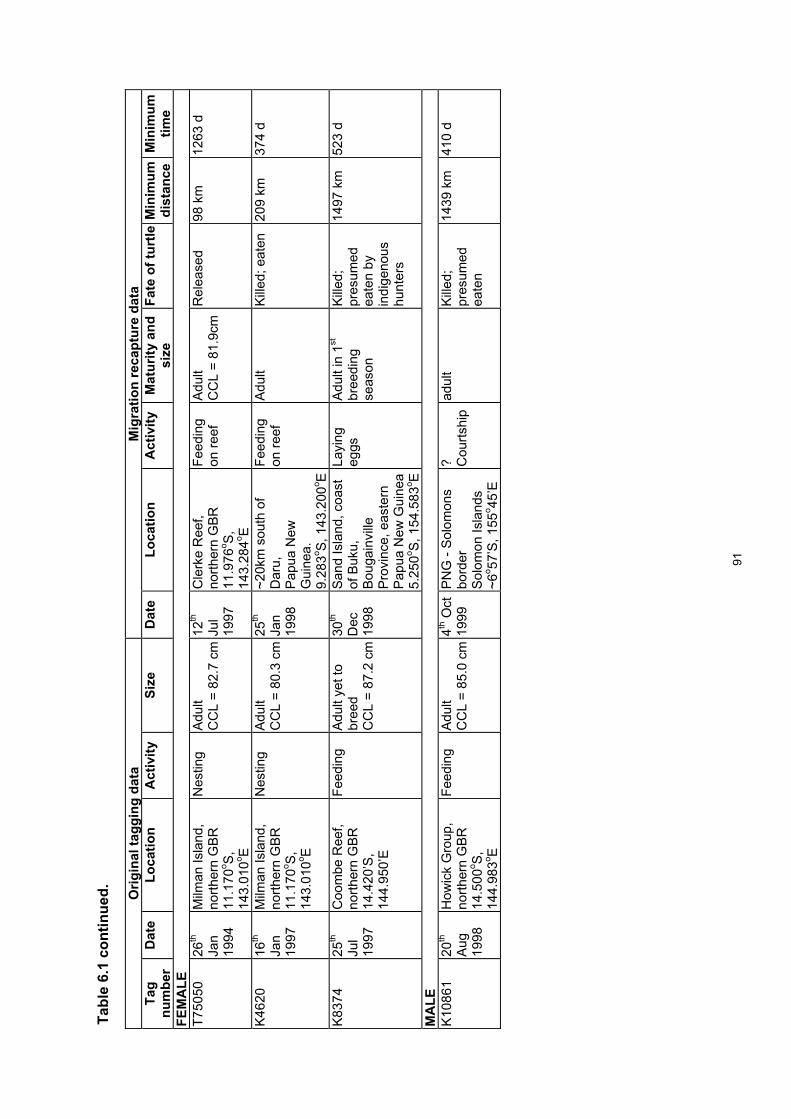
91
Tabl
e 6.
1 co
ntin
ued.
Orig
inal
tagg
ing
data
M
igra
tion
reca
ptur
e da
ta
Tag
num
ber
Dat
e Lo
catio
n A
ctiv
ity
Size
D
ate
Loca
tion
Act
ivity
M
atur
ity a
nd
size
Fa
te o
f tur
tleM
inim
um
dist
ance
Min
imum
tim
e FE
MA
LE
T7
5050
26
th
Jan
1994
Milm
an Is
land
, no
rther
n G
BR
11.1
70o S,
14
3.01
0o E
Nes
ting
Adu
lt C
CL
= 82
.7 c
m12
th
Jul
1997
Cle
rke
Ree
f, no
rther
n G
BR
11.9
76o S,
14
3.28
4o E
Feed
ing
on re
ef
Adu
lt C
CL
= 81
.9cm
Rel
ease
d 98
km
12
63 d
K46
20
16th
Jan
1997
Milm
an Is
land
, no
rther
n G
BR
11.1
70o S,
14
3.01
0o E
Nes
ting
Adu
lt C
CL
= 80
.3 c
m
25th
Jan
1998
~20k
m s
outh
of
Dar
u,
Pap
ua N
ew
Gui
nea.
9.
283o S
, 143
.200
o E
Feed
ing
on re
ef
Adu
lt K
illed;
eat
en
209
km
374
d
K83
74
25th
Jul
1997
Coo
mbe
Ree
f, no
rther
n G
BR
14.4
20’S
, 14
4.95
0’E
Feed
ing
Adu
lt ye
t to
bree
d C
CL
= 87
.2 c
m
30th
Dec
19
98
San
d Is
land
, coa
st
of B
uku,
B
ouga
invi
lle
Pro
vinc
e, e
aste
rn
Pap
ua N
ew G
uine
a 5.
250o S
, 154
.583
o E
Layi
ng
eggs
A
dult
in 1
st
bree
ding
se
ason
Kille
d;
pres
umed
ea
ten
by
indi
geno
us
hunt
ers
1497
km
52
3 d
MA
LE
K
1086
1 20
th
Aug
19
98
How
ick
Gro
up,
north
ern
GBR
14
.500
o S,
144.
983o E
Feed
ing
Adu
lt C
CL
= 85
.0 c
m4th
Oct
19
99
PN
G -
Sol
omon
s bo
rder
S
olom
on Is
land
s ~6
o 57’S
, 155
o 45’E
? Cou
rtshi
pad
ult
Kille
d;
pres
umed
ea
ten
1439
km
41
0 d

92
ÑÑÑÑÑÑ
Ñ
Ñ
Ñ
Ñ
Ñ
Ñ
Ñ
ÑÑ
PNG
QU
EEN
SLAN
D
SOLO
MO
N IS
LAN
DS
VAN
UAT
U
IND
ON
ESIA
300
030
060
0Ki
lom
eter
s
coas
tline
coas
tline
ÑAu
stra
lian
rook
erie
sFe
edin
g fr
om A
ustra
lian
rook
erie
sÑ
Inte
rnat
iona
l roo
kerie
sFe
edin
g fr
om in
tern
atio
nal r
ooke
ries
ÑM
ALE
: int
erna
tiona
l cap
ture
Figu
re 6
.1. M
igra
tion
by a
dult
fem
ale
and
mal
e ha
wks
bill
turt
les,
Ere
tmoc
hely
s im
bric
ata,
in th
e C
oral
Sea
Reg
ion
of th
e so
uth
wes
tern
Pac
ific
Oce
an.
Thes
e da
ta in
clud
e th
e ne
w re
capt
ures
repo
rted
in th
e pr
esen
t stu
dy a
nd th
ose
prev
ious
ly re
porte
d (M
iller
et a
l. 19
98,
Lim
pus
and
Mill
er 1
998.
See
Tab
le 6
.1 fo
r det
ails
.). T
he li
nes
are
not i
nten
ded
to d
escr
ibe
prec
ise
mig
ratio
n ro
utes
but
link
the
feed
ing
site
s to
th
e as
soci
ated
resp
ectiv
e br
eedi
ng s
ites.

93
Figure 6.2. Detachable harpoon head removed from the carapace of adult female Eretmochelys imbricata (T77910) nesting at Milman Island, 25th December 1999. This harpoon head would have been fitted into the end of a large spear (= “wop”) for throwing from the bow of a boat/canoe and would have had a light rope running back to the fisherman. This particular harpoon head has been made from three 10 cm lengths of 3 mm diameter steel, probably cut from motorcycle spokes. Harpoon heads of this design are used widely in Torres Strait and southern Papua New Guinea and possibly further afield.

94

95
CHAPTER 7 - Recruitment of Eretmochelys imbricata from the pelagic to the benthic-feeding life history phase. Colin J. Limpus and Duncan J. Limpus Introduction A common feature of cheloniid turtle life history is the dispersal of hatchlings from the nesting beach to residency in pelagic environments where they feed primarily on zoo-plankton near the ocean surface (Bjorndal 1997). This is followed at some undetermined period by the movement of these young turtles (post-hatchlings) out of the pelagic environment to take up residency in coastal inshore waters where they feed primarily on benthic invertebrates and plants (Bjorndal 1997). In eastern Australia, young Eretmochelys imbricata recruit to take up residence on coral reefs at some size greater than curved carapace length (CCL) = 30 cm (Limpus 1992a). This change in life history phase for these immature turtles has been poorly documented for the hawksbill turtle, E. imbricata (Musick and Limpus 1997). However, a well defined age and/or size at which this life history change occurs is a significant value required for describing the population dynamics of species (Chaloupka and Musick 1997). This study examines the recognition of young E. imbricata when they make this change in life history phase as they change from foraging in pelagic waters to foraging on coastal benthic communities. Immature E. imbricata taking up residency in coastal waters of eastern Australia are described. Methods Long term mark-recapture studies have been conducted with the marine turtles resident on the coral reefs adjacent to Heron Island (23o26’S, 151o55’E) since 1974 (Limpus 1992a, Chaloupka and Limpus 1997). See Chapter 3 for a detailed description of the methods used in this study. In general for the present study, the turtles were captured by the turtle rodeo method (Limpus 1978); standard titanium tags were applied in the front flipper axial tagging position (Limpus 1992b); measured for midline curved carapace length (± 0.1 cm); and gonads examined to determine sex and maturity using laparoscopy (Limpus 1992a). For young E. imbricata still retaining complete sets of growth layers with their defining growth lines (Tucker and Limpus 1995) on carapace or plastron scutes, counts of annual growth layers were used to determine their age. To highlight growth lines on scutes for photography, growth lines were marked with a graphite pencil. Results New recruits to residency in the coastal inshore waters have been identified by comparison of small untagged turtles captured in these inshore waters with (i) post-hatchlings E. imbricata captured in offshore pelagic habitats and (ii) tagged turtles with a known residency in inshore waters based on recaptures of tagged individuals. Offshore post-hatchlings E. imbricata within pelagic environments: Records of pelagic post-hatchlings E. imbricata in Australian waters are scarce (Limpus et al. 1994). In recent years, however, large numbers of post-hatchling E. imbricata are being washed ashore tangled in lost or discarded fishing nets (Leitch 1997) but these turtles have not been comprehensively described. Two of the Hembree specimens (Limpus et al. 1994) and an additional specimen collected from the Coral sea have been examined for the following description of post-hatchlings within the pelagic environment (Table 7.1, Figure 7.1).
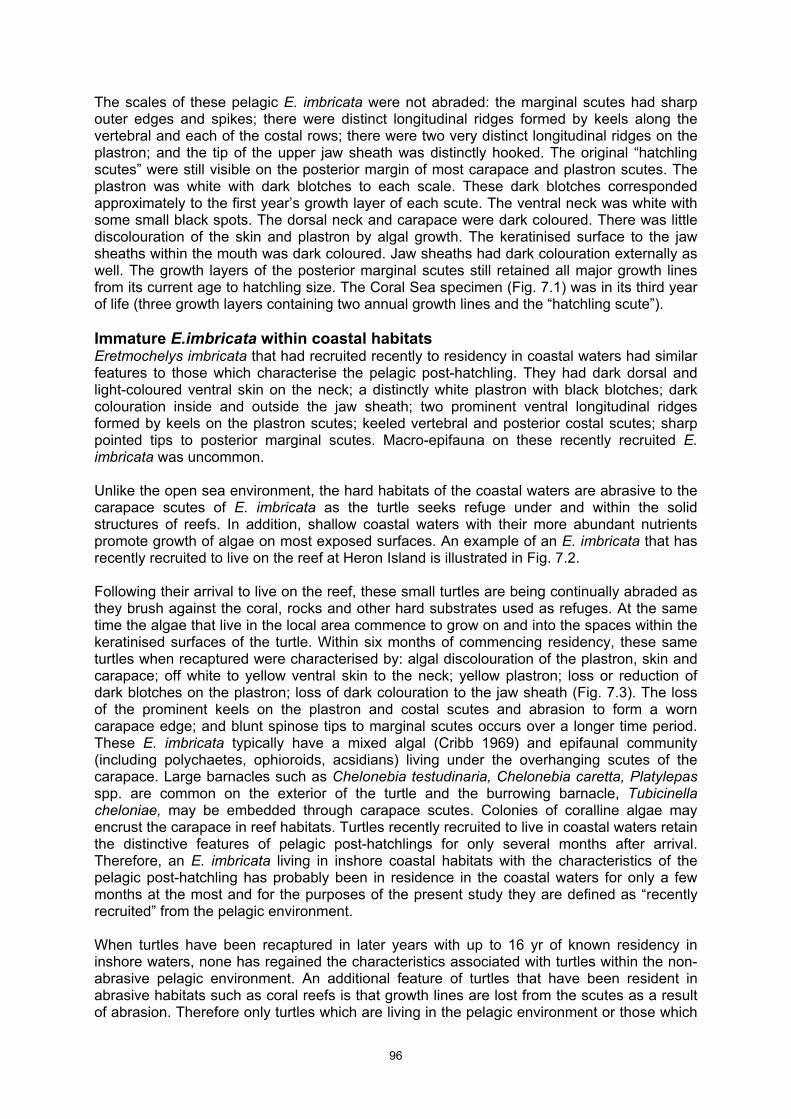
96
The scales of these pelagic E. imbricata were not abraded: the marginal scutes had sharp outer edges and spikes; there were distinct longitudinal ridges formed by keels along the vertebral and each of the costal rows; there were two very distinct longitudinal ridges on the plastron; and the tip of the upper jaw sheath was distinctly hooked. The original “hatchling scutes” were still visible on the posterior margin of most carapace and plastron scutes. The plastron was white with dark blotches to each scale. These dark blotches corresponded approximately to the first year’s growth layer of each scute. The ventral neck was white with some small black spots. The dorsal neck and carapace were dark coloured. There was little discolouration of the skin and plastron by algal growth. The keratinised surface to the jaw sheaths within the mouth was dark coloured. Jaw sheaths had dark colouration externally as well. The growth layers of the posterior marginal scutes still retained all major growth lines from its current age to hatchling size. The Coral Sea specimen (Fig. 7.1) was in its third year of life (three growth layers containing two annual growth lines and the “hatchling scute”). Immature E.imbricata within coastal habitats Eretmochelys imbricata that had recruited recently to residency in coastal waters had similar features to those which characterise the pelagic post-hatchling. They had dark dorsal and light-coloured ventral skin on the neck; a distinctly white plastron with black blotches; dark colouration inside and outside the jaw sheath; two prominent ventral longitudinal ridges formed by keels on the plastron scutes; keeled vertebral and posterior costal scutes; sharp pointed tips to posterior marginal scutes. Macro-epifauna on these recently recruited E. imbricata was uncommon. Unlike the open sea environment, the hard habitats of the coastal waters are abrasive to the carapace scutes of E. imbricata as the turtle seeks refuge under and within the solid structures of reefs. In addition, shallow coastal waters with their more abundant nutrients promote growth of algae on most exposed surfaces. An example of an E. imbricata that has recently recruited to live on the reef at Heron Island is illustrated in Fig. 7.2. Following their arrival to live on the reef, these small turtles are being continually abraded as they brush against the coral, rocks and other hard substrates used as refuges. At the same time the algae that live in the local area commence to grow on and into the spaces within the keratinised surfaces of the turtle. Within six months of commencing residency, these same turtles when recaptured were characterised by: algal discolouration of the plastron, skin and carapace; off white to yellow ventral skin to the neck; yellow plastron; loss or reduction of dark blotches on the plastron; loss of dark colouration to the jaw sheath (Fig. 7.3). The loss of the prominent keels on the plastron and costal scutes and abrasion to form a worn carapace edge; and blunt spinose tips to marginal scutes occurs over a longer time period. These E. imbricata typically have a mixed algal (Cribb 1969) and epifaunal community (including polychaetes, ophioroids, acsidians) living under the overhanging scutes of the carapace. Large barnacles such as Chelonebia testudinaria, Chelonebia caretta, Platylepas spp. are common on the exterior of the turtle and the burrowing barnacle, Tubicinella cheloniae, may be embedded through carapace scutes. Colonies of coralline algae may encrust the carapace in reef habitats. Turtles recently recruited to live in coastal waters retain the distinctive features of pelagic post-hatchlings for only several months after arrival. Therefore, an E. imbricata living in inshore coastal habitats with the characteristics of the pelagic post-hatchling has probably been in residence in the coastal waters for only a few months at the most and for the purposes of the present study they are defined as “recently recruited” from the pelagic environment. When turtles have been recaptured in later years with up to 16 yr of known residency in inshore waters, none has regained the characteristics associated with turtles within the non-abrasive pelagic environment. An additional feature of turtles that have been resident in abrasive habitats such as coral reefs is that growth lines are lost from the scutes as a result of abrasion. Therefore only turtles which are living in the pelagic environment or those which

97
have recently recruited to live in inshore waters will still retain a full set of growth lines that should correspond to their age. The average size of these E. imbricata which have recently recruited from the pelagic environment is CCL = 36.3 cm (Table 7.2). There is not a single size at which these turtles recruit to inshore residency but rather a spread of sizes encompassing approximately 10 cm in carapace length. For completeness of the small data set available on newly recruited turtles to coastal feeding areas, all records in which a reliable count of growth layers could be made are summarised in Table 7.3 and Fig. 7.4. For most of these new recruits, consistent counts of growth layers were obtained from many different scutes but were easiest to count on the post vertebral scute and the plastron scutes. The growth layers of two turtles for which age has been measured are illustrated in Figs. 7.1 and 7.2. These same turtles have been identified by tag number in Fig. 7.4. The two slowest growing turtles in the sample (Fig. 7.4) were unhealthy turtles that stranded and subsequently died: T84763 had a curved spine and associated abnormal carapacial scute pattern (Fig. 7.5); Z3092 was underweight and died of disease. It appears that healthy E. imbricata recruit from the pelagic environment to commence residency on south Queensland Reefs at about 5–7 years of age. The turtles with health problems recruited at a similar size but at a slightly greater age (up to 11 yr old). Discussion On the basis of the above observations, the following features are proposed for identifying immature E. imbricata that have recently recruited from a pelagic life history phase to residency in coastal waters: • neck skin dark dorsally and light-coloured ventrally; • distinctly white plastron with black blotches; • dark colouration of the inside surface of the keratinised jaw sheathes; • two prominent ventral longitudinal ridges formed by keels on the plastron scutes; • keeled vertebral and posterior costal scutes forming three longitudinal ridges on the
carapace; • sharp pointed tips to posterior marginal scutes. The thick keratinised scutes of E. imbricata retain the annual growth lines to a greater degree than any other species of marine turtle. In the absence of abrasion, a count of these growth layers and associated growth lines on any one scute have the potential for providing an estimate of the age of the turtle (Tucker and Limpus 1995). Thus, reliable age estimates from the counts of annual growth layers potentially should be obtainable from E. imbricata from: • the pelagic phase of their lifecycle and • turtles which have newly recruited from the pelagic phase to take up residence in the
benthic-feeding life history phase before the outer growth layers of the carapace scutes are abraded from the surface.
The authors consider it inappropriate to apply the method to estimating age in turtles that have been long term residents on coral reefs and other hard substrate habitats and for which an undetermined number of growth layers may have been abraded from the scutes. Thus, young E. imbricata which have recently recruited to the inshore habitats provide a unique opportunity for estimating the age at which this significant change in ecology and behaviour occurs in their life history. In the southern GBR region of eastern Australia young E. imbricata commence life in reef habitats of the continental shelf at a mean size of CCL = 36.3 cm and an age of about 5–7 yr.
98
It is expected that there will be variation in the size at which young E. imbricata leave the pelagic environment and take up residency in coastal waters depending on the genetic stock(s) and/or the ocean basin (Bjorndal 1997). References Bjorndal, K. A. (1997). Foraging ecology and nutrition of sea turtles. In ‘The Biology of Sea turtles.’ (Eds. Lutz, P. L. and Musick, J. A.) pp.199–231. (CRC Press: Boca Raton.) Chaloupka, M. and Limpus, C. J. (1997). Robust statistical modelling of hawksbill sea turtle growth rates (southern Great Barrier Reef). Marine Ecology Progress Series 146, 1–8. Chaloupka, M. Y. and Musick, J. A. (1997). Age, growth and population dynamics. In ‘The Biology of Sea turtles.’ (Eds. Lutz, P. L. and Musick, J. A.) pp.233–276. (CRC Press: Boca Raton.) Cribb, A. B. (1969). Algae on a hawksbill turtle. Queensland Naturalist 19, 4–6. Dobbs, K. L., Miller, J. D., Limpus, C. J. and Landry, A. M. (1999). Hawksbill turtle, Eretmochelys imbricata, nesting at Milman Island, northern Great Barrier Reef, Australia. Chelonian Conservation and Biology 3, 344–361. Leitch, K. (1997). Entanglement of marine turtles in netting: northeast Arnhem Land, Northern Territory, Australia. Unpublished report from Dihimurru Land Management Aboriginal Corporation to Environment Australia. Limpus, C. J., Walker, T. A. and West, J. (1994). Post-hatchling sea turtle specimens and records from the Australian region. In “Proceedings of the Australian Marine Turtle Conservation Workshop.” (Compiler James, R.) pp. 95–100. (Australian Nature Conservation Agency: Canberra.) Limpus, C. J. (1978). The Reef. In ‘Exploration North.’ (Ed. Lavery, H. J.) pp. 187–222. (Richmond Hill Press: Melbourne.) Limpus, C. J. (1992a). The hawksbill turtle, Eretmochelys imbricata, in Queensland: population structure within a southern Great Barrier Reef feeding ground. Wildlife Research 19, 489–506. Limpus, C. J. (1992b). Estimation of tag loss in marine turtle research. Wildlife Research 19, 457–469. Musick, J. A. and Limpus, C. J. (1997). Habitat utilisation and migration in juvenile sea turtles. In “The Biology of Sea turtles.” (Eds. Lutz, P. L. and Musick, J. A.) pp.137–163. (CRC Press: Boca Raton.) Tucker, A. D. and Limpus, C. J. (1995). Annuli on carapacial scutes of hawksbill turtles (Eretmochelys imbricata) at Heron Island Reef. National Oceanic and Atmospheric Administration Technical Memorandum National Marine Fisheries Service Southeast Fisheries Science Center 361, 249–250.

99
Table 7.1. Pelagic post-hatchling Eretmochelys imbricata used for comparison within the present study.
Specimen Number
Sex Curved carapace
length
Date and latitude, longitude
Gut content
Northern Territory Museum specimens collected by D. Hembree (Limpus et al. 1994) off Wessel Islands in Arafura Sea: caught in Taiwanese near-surface (< 15 m depth) gill net fishery in water ~ 53 m deep. R13313 male 21.7 cm 13th Feb 1986
11o06’S, 137o36’E
Hydrozoan: Velella sp., > 5 individuals Goose-neck barnacle: Lepas sp., several Cephalopod: squid, portions of 2 individuals Sargassum sp., 2 floats
R13314 female 21.4 cm 7th Feb 1986 10o25’S, 136o59’E
Goose-neck barnacle: Lepas sp.: several Fish: Monocanthidae, 1
CSIRO Southern Surveyor specimen from Coral Sea east of Osprey Reef: caught in surface plankton tow (midoc net) in 150–200 m deep oceanic water (Figure 7.1). See text for more details. Q18957
female 23.3 cm May 1995 13oS, 147oE (approximate)
Brachyuran crab: 1 Goose-neck barnacle: Lepas sp., 1 Algae: Sargassum sp., floats & blades Mass of unidentified eggs.
Table 7.2. Size of immature Eretmochelys imbricata, which had recently recruited from the pelagic environment to residency in inshore habitats in eastern Australia.
Curved carapace length (cm) Mean SD Range N
Mackay 35.5 1.550 33.9–37.0 2 Capricornia Reefs 36.1 2.507 32.2–39.7 17 Hervey Bay and Sunshine Coast
37.0 3.397 33.6–41.8 4
New South Wales 40.0 – 40 1 Combined 36.3 2.715 32.2–41.8 24
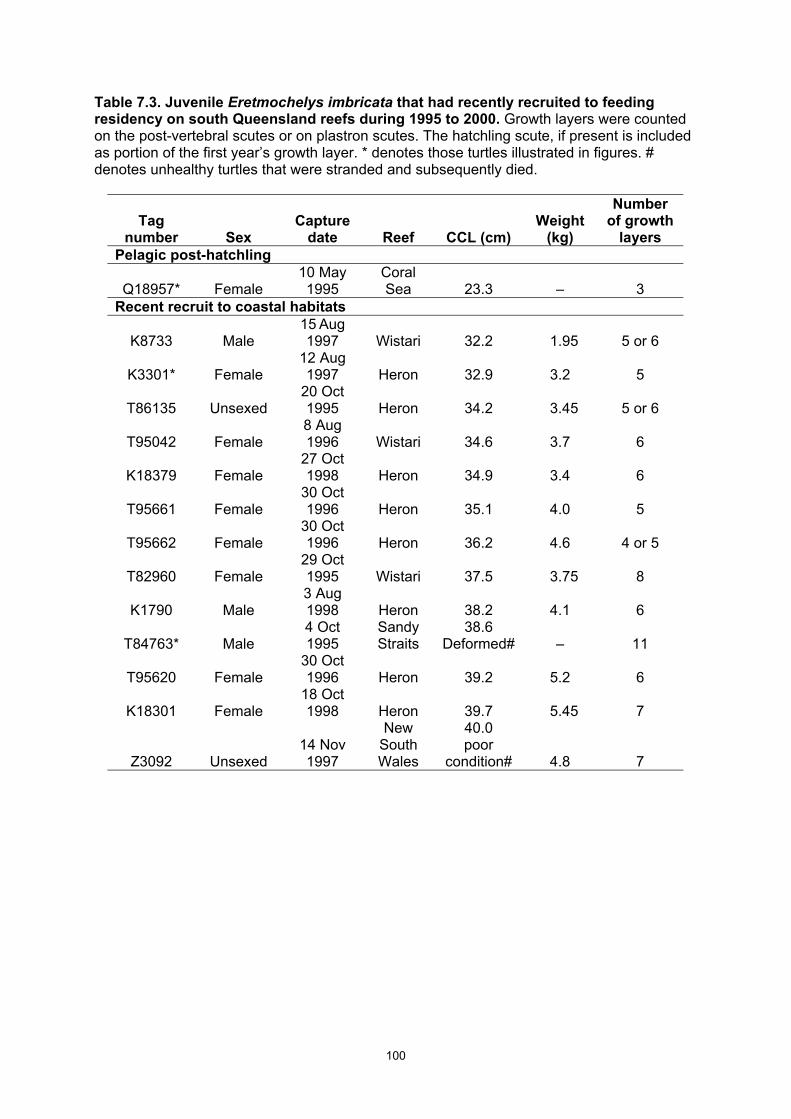
100
Table 7.3. Juvenile Eretmochelys imbricata that had recently recruited to feeding residency on south Queensland reefs during 1995 to 2000. Growth layers were counted on the post-vertebral scutes or on plastron scutes. The hatchling scute, if present is included as portion of the first year’s growth layer. * denotes those turtles illustrated in figures. # denotes unhealthy turtles that were stranded and subsequently died.
Tag number Sex
Capture date Reef CCL (cm)
Weight (kg)
Number of growth
layers Pelagic post-hatchling
Q18957* Female 10 May 1995
Coral Sea 23.3 – 3
Recent recruit to coastal habitats
K8733 Male 15 Aug 1997 Wistari 32.2 1.95 5 or 6
K3301* Female 12 Aug 1997 Heron 32.9 3.2 5
T86135 Unsexed 20 Oct 1995 Heron 34.2 3.45 5 or 6
T95042 Female 8 Aug 1996 Wistari 34.6 3.7 6
K18379 Female 27 Oct 1998 Heron 34.9 3.4 6
T95661 Female 30 Oct 1996 Heron 35.1 4.0 5
T95662 Female 30 Oct 1996 Heron 36.2 4.6 4 or 5
T82960 Female 29 Oct 1995 Wistari 37.5 3.75 8
K1790 Male 3 Aug 1998 Heron 38.2 4.1 6
T84763* Male 4 Oct 1995
Sandy Straits
38.6 Deformed# – 11
T95620 Female 30 Oct 1996 Heron 39.2 5.2 6
K18301 Female 18 Oct 1998 Heron 39.7 5.45 7
Z3092 Unsexed 14 Nov 1997
New South Wales
40.0 poor
condition# 4.8 7

101
7.1a. Dorsal view.
7.1b. Ventral view. Figure 7.1. Post-hatchling Eretmochelys imbricata (Q18957) captured in a surface plankton net in the Coral Sea (Table 7.1).

102
7.2a. Dorsal view. Note keeled vertebral and posterior costal scutes; spinose posterior marginal scutes. Abrasion of the turtle by the reef habitat has commenced as indicated by the scratches on the carapace scutes.
7.2b. Ventral view. Note white plastron, ventral neck and flippers with minimal encrusting algal growth; two longitudinal keels on plastron scutes.

103
Figure 7.2 continued…
7.2c. Left posterior marginal scute showing four (4) growth lines: 3 marked with pencil, fourth and most recent growth line marked by a drill mark. The 5th vertebral scute has been broken back to expose the growing edge of the posterior vertebral scute. A drill mark (at arrow) has also been placed in 5th vertebral scute at a position corresponding to the anterior margin of the underlying post vertebral scute. Figure 7.2. Immature female Eretmochelys imbricata (K3301) recently recruited from living in the pelagic environment, captured while feeding on Heron Island Reef, 12 August 1997. CCL = 32.9 cm; in her fifth year of life (4 growth lines on scutes).

104
• Bottom right: recently recruited; not yet acquired algal discolouration of scutes;
distinct longitudinal keels along plastron. • Bottom left: recruited to reef residency several months previously; in early stages
of being encrusted with algae. This turtle recently has acquired a young barnacle, Chelonibia testudinaria, which is growing on its plastron.
• Top centre: resident on Heron Island Reef for greater than a year; thickly encrusted with algae, longitudinal ridges along plastron are not strongly keeled.
Figure 7.3. Immature Eretmochelys imbricata that have been resident on Heron Island Reef for different periods of time.

105
0 1 2 3 4 5 6 7 8 9 10 11 12
AGE BASED ON GROWTH LAYER COUNT (yr)
0
5
10
15
20
25
30
35
40
45
CU
RVE
D C
AR
APA
CE
LEN
GTH
(cm
)
estimate +/- 0.5yrcounthatchling deformeddiseased
pelagic post-hatchling
recent inshore recruits
Q18957
T84763
Figure 7.4. Size of known age young Eretmochelys imbricata from eastern Australia. Data are summarised in Table 7.3. Hatchling size after Dobbs et al. (1999). Turtles with health problems are identified. Tag numbers identify turtles illustrated in Figs. 7.1, 7.2, 7.5. See text for additional explanation.

106
7.5a. Dorsal view. Note keeled vertebral scutes. This turtle has curvature of the spine and an abnormal left costal count (n = 5)
7.5b. Ventral view of portion of plastron showing growth layers and growth lines counted on several scutes Figure 7.5. Immature male Eretmochelys imbricata (T84763) recently recruited from living in the pelagic environment, that was beach-washed and subsequently died, Sandy Straits in south Queensland, 4th October 1995. CCL = 38.6 cm; in his eleventh year of life (10 growth lines on a scute).

107
CHAPTER 8 - Eretmochelys imbricata foraging populations in eastern Australia Colin J. Limpus, Jeffrey D. Miller, Ian P. Bell and Duncan J. Limpus Introduction At the commencement of the present study it was known that eastern Australian foraging areas for Eretmochelys imbricata extended from Torres Strait (9oS. Limpus and Parmenter, 1986) in the north to at least Moreton Bay (27oS. Limpus et al. 1994) in the south. In contrast to the green, Chelonia mydas, and loggerhead, Caretta caretta, turtles (Limpus et al. 1992; 1994a,b; Limpus and Chaloupka, 1997; Limpus and Reed, 1985), there is limited detailed knowledge of the population dynamics and ecology of E. imbricata within this extensive foraging area of eastern Australia (Chaloupka and Limpus, 1997; Limpus, 1992; Miller et al. 1998; Robins, 1995; Witzell, 1983). The present study was planned to encompass this 18o of latitude spread of latitude and to focus on mark-recapture studies designed to quantify key demographic parameters for the species in eastern Australia. Methods Unless otherwise stated, the methods used during the foraging population studies are the standard methods of the Queensland Turtle Conservation Project as summarised in Chapter 3. Several strategies have been employed in conducting this study of E. imbricata within the extensive foraging habitats throughout eastern Australia. Three principal sampling areas were selected for repetitive visitation for mark-recapture study: • Capricorn Reefs in the southern Great Barrier Reef (GBR) off Gladstone in south
Queensland. The intention being to concentrate capture effort on Heron Island Reef (23o26'S, 151o55'E) and adjacent reefs, including Wistari Reef and Wreck Island Reef, so that data from the current study could build on and expand a past study of E. imbricata on these same reefs that was concluded in 1989 (Limpus 1992).
• Reefs in the vicinity of Princess Charlotte Bay in north Queensland including Clack Reef (14.06oS, 144.25oE) and the Howick Group (14.41oS, 144.95oE) where an E. imbricata mark-recapture project was commenced in 1998.
• Reefs in the vicinity of Milman Island (11.18oS, 143.03oE), a principal breeding area. Milman Island has been a focal area for long term mark-recapture study of nesting E. imbricata (Dobbs et al. 1999).
In conjunction with the above sites, a north to south survey was conducted from Torres Strait to Moreton Bay to sample E. imbricata foraging at a large series of foraging sites. The main emphasis for this component was directed within the known nesting range of the species between Princess Charlotte Bay (14oS) and Torres Strait (10oS). To augment the data from throughout the area, records of stranded animals are included to represent the occurrence of E. imbricata in close proximity to the stranding sites. These data were obtained from StrandNet (the Marine Wildlife Stranding and Mortality Database of the Queensland Parks and Wildlife Service). Adult females in their first breeding cycle were identified by gonad examination. In addition, an alternative approach to identifying the size for commencement of breeding was investigated. This used a statistical approach to analyse the proportion of adults in each 1 cm
108
size class to define the size class at which 50% of the sample was adult (= AS50) as follows. A logistic model, with a Binomial error distribution and a link function selected from logit, probit and Gompertz (complementary log-log) was used to investigate the CCL size interval at which 50% of the turtles were adults for each sex. In a binomial model, each trial corresponds to the group of turtles sampled within each CCL; the number of trials is the sample size or the number of both adult and immature turtles sampled; and the proportion of successes is the proportion of adults for each trial. The advantage of the logistic model is that the proportions are of central interest and the distribution function can be modelled directly using a smooth curve, such as the logistic. For the logistic model, the response probability is the proportion of adults sampled in a particular CCL size class in that sub-population. Zero and one probabilities were changed to 0.01 and 0.99 respectively so that inference could proceed. The logistic regression equation links the response p transformed according to link function g, to the linear predictor involving the explanatory variables:
εβµ +×++= sizesexpg )( where variables here are indexed by CCL size class and sub-population (defined by sex). The fit of generalised linear models was assessed via a number of diagnostic summary statistics and plots. Different combinations of error distribution, link function, form of the linear predictor, and explanatory variables were evaluated. Models performing better relative to rivals exhibited a large change in deviance compared to the null model, and had significant t-statistics corresponding to each coefficient in the model. Model assumptions also were assessed. Heterogeneity of variance was evidenced by an absence of patterns in the residual vs fitted value plot. Linearity of the predictor was likewise supported by an absence of patterns in the observed vs fitted value plot. Examination of partial residuals for each explanatory variable indicates whether the form of the explanatory variable in the linear predictor is correct. Using the logistic distribution, specific percentiles of the size distribution were estimated, together with confidence intervals (Venables and Ripley, 1999). This follows well established methodology for estimating dose effect where AS50 = adult size 50th percentile. Results During the present study, E. imbricata have been observed living across a diverse range of habitat conditions that extend from the very clear waters at the detached reefs adjacent to the eastern margin of the GBR, such as Raine Island, to reefs in inshore turbid waters near the mainland, such as in Shoalwater Bay. They inhabit tropical coral reefs from Torres Strait (9oS) in the north to rocky reefs in temperate waters as far south as the Solitary Islands (30oS) in northern New South Wales. While they have been most frequently encountered living on hard structured habitats such as coral and rocky reefs, they also occur at low density in open seagrass pastures. Captured sample A total of 1097 captures of 877 E. imbricata occurred within foraging and courtship areas during the present study. These included: • A total of 643 captures of 574 E. imbricata on the coral reefs of the northern GBR (north
from Cairns to Torres Strait. Table 8.1). • A total of 423 captures of 275 E. imbricata on the coral reefs in the vicinity of Heron
Island in the southern GBR. These included 73 recaptured turtles that had been previously tagged prior to the commencement of this recent study and a further 202 turtles that were tagged for the first time (Table 8.2A). Also within the total set of captures there were 154 between-year recaptures and an additional 67 within-the-same-year recaptures. When pooled with the tagged E. imbricata from the same study area from prior to the last five years of study, a total of 430 E. imbricata has been tagged from the Capricornia Reefs in the vicinity of Heron Island (Table 8.1).

109
• A total of 30 captures of 27 tagged E. imbricata within inshore bays of south and cental Queensland (Table 8.2B). These captures included 1 recaptured turtle that had been previously tagged prior to the commencement of this recent study and a further 26 turtles tagged for the first time. Two of the turtles were recaptured in later years at the same respective sites.
• Additional minor numbers of turtles captured at other sites are summarised in Table 8.1. When E. imbricata captured during the last five years of study are pooled with E. imbricata tagged in foraging areas throughout eastern Queensland by the authors prior to the commencement of the present study, there are data from a total of 1043 separate E. imbricata available for analysis (Table 8.1). Size and maturity of foraging turtles The three large regional samples of foraging E. imbricata from the Milman Island area (latitude 11oS block), Princess Charlotte Bay area (latitude 14oS block) and the Heron Island area (latitude 23oS block) are summarised to describe the size distribution by sex and geographical location (Figure 8.1). Multiple reefs have been sampled across multiple years within each latitude block using similar capture techniques. In the northern GBR: • in the 11o latitudinal block (Fig. 8.1a), the size of captured turtles ranged from small
immatures with CCL = 33.5 cm to adults with CCL = 90.0 cm. Large immature and adult turtles dominated the sampled population. While the immature turtles were predominantly female, the adult turtles were strongly biased to male.
• in the 14o latitudinal block (Fig. 8.1b), the size of captured turtles ranged from small immatures with CCL = 36.7 cm to adults with CCL = 94.6 cm. Large immature and adult turtles dominated the sampled population. Within this area both the adult and immature turtles were strongly biased to female.
In the southern GBR: • in the 23o latitudinal block (Fig. 8.1c), the size of captured turtles ranged from small
immatures with CCL = 32.2 cm to adults with CCL = 91.8 cm. The population was strongly dominated by immature turtles with comparable representation across the complete range of immature size classes upwards from recently recruited immature turtles. This result is very similar to the results of previous studies in the same area (Limpus 1992).
Each of these areas supports an E. imbricata population that is structured differently. When the total capture set for the entire eastern Queensland coast is examined, there was a consistent high representation of adult turtles in the samples obtained from the far northern GBR (11o–14o blocks) and a low proportion of adults within the sampled populations along the remainder of the coast to the south (Figure 8.2). This trend applies to both sexes. Sex ratio For the total sample of E. imbricata (n = 927) whose gonads were examined to determine their sex, 257 (27.8%) were males and 665 (71.7%) were females while 5 (0.5%) had gonads that could not clearly be identified as either male or female (= intersex). The total sample was strongly biased to female with a male:female ratio of between 1:2 and 1:3. A similar strong bias to females was present among all maturity classes of the total population sample:
Adult 70.8% female (n = 298) Pubescent immature 73.8% female (n = 168) Large prepubescent immature (CCL > 60 cm) 74.3% female (n = 214) Small prepubescent immature (CCL < 60 cm) 72.6% female (n = 277)

110
When sex ratio was examined along the north-south latitudinal spread of areas sampled, the sex ratio of both adult and immature turtles was strongly biased to female at most areas where large numbers of turtles were sampled (Fig. 8.3). The exception among the large sample sizes was the latitude 11o block where the adult sex ratio was approximately reversed to 32.3% female, i.e. approximately 1 female to 2 males. This atypical sex ratio of the adult E. imbricata in the latitude 11o block is not consistent with the growth of immature turtles to occupy the same habitat as adults, given the female bias among immature turtles within the same area. This block is also an area, which supports a large nesting population for the species, including the Milman Island population. It is hypothesised that the male bias in this area could occur if male E. imbricata, as they approach adult status or during their early breeding migrations, aggregated within the vicinity of the nesting beaches or if females, as they approached maturity, were to disperse from feeding in the vicinity of the nesting beaches. Either scenario would represent a special case of developmental migration. No tag recoveries have been obtained in support of this hypothesis. Foraging site fidelity and developmental migration Limpus (1992) postulated that developmental migration of E. imbricata, moving northwards through the Great Barrier Reef as they grow, might account for the high proportion of immature turtles being captured in the southern GBR and the high proportion of adult-sized turtles captured in Torres Strait. Now, approximately a decade later and with many more turtles tagged and many sites sampled throughout the GBR, this concept is re-examined. Within the large sample of turtles examined for each sex there was a similar trend from a higher proportion of adult turtles in the northern GBR towards a higher proportion of immature turtles in southern Queensland. The results of 1974–1989 studies in the southern GBR (Limpus, 1992) and in Torres Strait (Limpus and Parmenter, 1986) are consistent with the results of the present 1994–1999 study. The long-term consistency in the results suggests that either E. imbricata of different sizes forage in different habitats that are not being adequately sampled between the north and south of the state or else developmental migration must be occurring. Countering the developmental migration hypothesis are several sets of data. Of the 1043 E. imbricata tagged in foraging areas of eastern Queensland in the past 20 years, 166 had been tagged prior to the commencement of the current project. In the last five years 877 were recorded during the 1994–1999 period within a total of 1097 captures. The results of this mark-recapture project do not show any indication that larger turtles move northwards through the GBR. Except for six individuals, all turtles were recaptured at the same reef on which they were originally tagged. All of these remaining six were turtles originally captured on Wistari Reef and all six were recaptured once only on the next adjacent reef, Heron Island Reef (Table 8.2). Given that all E. imbricata captured on Wistari Reef were transported to Heron Island within Heron Island Reef for data recording and gonad examination (< 1.5 km between these two reefs) and then released on Heron Island Reef, these six may represent turtles that had yet to return to their home reef. One of these six has been subsequently recaptured back at Wistari Reef since its capture on Heron Reef. There have been 40 other recaptures on Wistari Reef of the 94 turtles from Wistari Reef that were released on Heron Island Reef. In addition to these turtles from Wistari Reef, two of the 10 E. imbricata relocated ~ 12 km from Wreck Island Reef to Heron Island Reef prior to 1989 (Limpus, 1992) have now been recaptured - both back at Wreck Island Reef. The multiple recaptures of 150 of these turtles which were recorded within the same reef (n = 144) or on the adjacent reef (n = 6) are indicating that individual turtles each occupy a localised area for an extended period of time (Fig. 8.4). Twenty-three (15%) of these mostly small immature turtles have a recorded association with a localised foraging area for more
111
than 10 years. Our longest record of residency at the same reef is 14.80 yr for T1528, an immature male (CCL = 59.2 cm to 83.7 cm) which was captured along a 400 m length of reef-front on Wistari Reef. T82740 (male, CCL = 43.7 cm to 52.0 cm) holds the record for the greatest number of captures: 19 captures within a 1 km length of reef edge adjacent to the harbour at Heron Island during a 3.84 yr period during 16th December 1994 to 20th October 1998. As individuals, the E. imbricata that live in the GBR are showing considerable foraging site fidelity for extended periods of time. However, this is not consistent with the results of other aspects of the eastern Australian E. imbricata population function that are being indicated in the present study, namely: • the north-south differential within each sex of the proportion of adult E. imbricata within
the population and • the atypical strong bias towards male adult E. imbricata within the latitude 11o block,
while in the same area the immature turtles remain strongly biased to female. In the absence of tag recoveries, the concept of developmental migration of larger turtles towards the northern GBR as they grow older or the movement of adults to aggregate towards or disperse from breeding areas, remains an unproven hypothesis. If developmental migration is not occurring, we must consider the possibility of a north-south change in habitat usage by E. imbricata within the GBR, which may account for the latitudinal differences in maturity and the atypical adult sex ratio near the nesting beaches. This warrants further investigation. Size at maturity The size distribution of large immature and adult E. imbricata is summarised in Fig.8.5. For both males and females there was no knife-edge cut-off between immature and adult size. Size alone is not an accurate predictor of the maturity of the turtle. Logistic models were successful in modelling the variability and facilitated computation of adult ratio percentiles by size distribution. The best-fitting logistic models had a logit link function, only marginally different in performance compared to a Gompertz or probit link function. The logit transformation of probability p is defined as:
⎟⎟⎠
⎞⎜⎜⎝
⎛−
==)1(
log)(log)(pppitpg
The estimated logistic regression equations (Table 8.3) for adult turtles are: Logit(adult ratio) = –70.96 + 0.83 (if male) + 11.29 * log(base 2) CCL + Binomial error (samplesize, adult ratio) Estimates for the mean µ, sex effect (for males) and effect of CCL size β on the scale of the linear predictor are summarised in Table 8.3, along with estimated AS50 vlaues. An idea of the impact of model terms on the scale of the response can be obtained by using the inverse logit transformation
x
x
eexit+
=−
1)(log 1
For instance, the intercept for adult turtles has a point estimate of 0.21, and the sex effect has a point estimate of 0.88, on the probability scale. Results are more accurately reported and compared on the scale of the linear predictor. Diagnostics for the model showed an improvement in the observed vs fitted value plot, and the reduction of partial residuals. There is some striation in the residuals vs fitted value plot, but this could be an artifact of the small sample sizes. There is some departure from normality in the upper tail (the 6 highest values).
112
Comparison with the residual vs fitted value plot shows that these large residuals arose from zero counts for a particular size range. On average, adult females were larger than adult males. This is also supported by the size of adults recorded on breeding condition (Table 8.4). The mean CCL of adult females in foraging areas that were identified by gonad examination to be in their first breeding cycle was 82.7 cm (Table 8.4). This is comparable to the size of adult females identified as first time breeders on the nesting beach at Milman Island (Table 8.4; Chapter 5). The statistical approach of estimating the AS50 for females has provided a value of similar order of magnitude to the sizes of first time breeding females derived from direct gonad examination (Table 8.4). Thus AS50 can provide an operational size for defining commencement of maturity for the female population for use in growth analysis and other population demographic analysis. Unfortunately with males, adults in their first breeding season are not so easily identified by gonad examination. Therefore a comparison of results for first time breeding males from direct observation of gonads and the statistical estimation of AS50 is not available. However, the AS50 value is very similar to the size of recorded breeding adult males of mixed ages (Table 8.4). In the absence of data derived from following the growth of a large series of turtles from immaturity to adulthood to record their size at first breeding, the statistical approach to analyze the proportion of adults in each 1 cm size class to define the size at which 50% of the E. imbricata are adult (AS50) for each sex, provides a useful alternative. For E. imbricata foraging in the GBR, AS50 for females = 83.9 cm; AS50 for males = 80.6 cm. Basking Basking green turtles, C. mydas, are regularly observed on the reef flats at low tide or on the beaches of the islands of the southern Great Barrier Reef region, especially in those areas infrequently visited by people. Loggerhead turtles, C. caretta, are occasionally observed “basking” in the same areas. During 1996, two E. imbricata were recorded “basking” on shore in the same habitat as used by basking C. mydas on reefs near Heron Island. • T95017: Wistari Reef, 7th August, 0954 hr at low tide; adult female, not in vitellogenesis,
CCL = 91.8 cm, healthy and very vigorous; resting completely out of water on exposed coral and < 1 m from deep water in a similar manner to that of the numerous immature and adult C. mydas basking along this reef flat on the same low tide.
• untagged: Sykes Reef, 13th October, mid afternoon at low tide; immature size (confirmed from photograph by QPWS ranger staff); resting on exposed sandbank. Chelonia mydas were recorded basking on this reef on other occasions.
During a search of QTC database records, only one additional record of a “basking” E. imbricata was identified. • T87381: Wreck Island Reef, 18th December 1995, ~ midday at low tide; unsexed adult-
sized, CCL = 77.9 cm; resting on the reef flat. Chelonia mydas are regularly observed basking on this reef and island.
These turtles appeared to be asleep when approached and gave no signs of being distressed by being out of water and dried in the sun. There were no signs that any of them had been attempting to crawl across the coral or return to the water after being “stranded”. All were healthy in appearance and vigorous and quite capable of crawling into adjacent water after they were woken on capture. Eretmochelys imbricata floating, apparently asleep, at the water’s surface with their carapace exposed and their heads below the water are regularly encountered when the seas are very

113
calm. This surface basking is observed much more commonly than the terrestrial basking. Surface basking is especially common with small immature turtles in shallow water habitats such as reef flats and shallow lagoonal waters. The above are the first records from Australia of terrestrial basking by E. imbricata. They were observed engaged in this basking activity in situations where human contact is rare and occurred at sites at which C. mydas are regularly seen basking. Moreton Bay, a warm temperate foraging area During 1995, it was established that there was a population of E. imbricata that was accessible for study and feeding on the coral reefs on the northern side of Peel Island (27o30’S, 153o21’E) in Moreton Bay adjacent to Brisbane. Although this E. imbricata population did not appear to be large, it was recognised that in Moreton Bay there was an opportunity to examine the population structure and growth for E. imbricata feeding in a warm temperate region. Therefore, Moreton Bay was included as a study site for continued sampling of E. imbricata within the JBA funded study. In early 1996, E. imbricata were regularly encountered on Peel Island Reef up until April with 1–3 E. imbricata per day being observed. During the first week of May there was extensive flooding of the five rivers that drain into Moreton Bay and a dense mud plume covered the coral reefs at Peel Island for several days and salinity levels were depressed in the bay for some weeks. In the months that followed the flooding (May, June, July, early August) E. imbricata could not be located on this reef. There was also a marked reduction in the number of C. mydas observed on Peel Island Reef during the same period. Eretmochelys imbricata was again observed on the reef at a frequency of 1–3 per day during the 3 visits to the reef in late August and September 1996. By September 1996, C. mydas was again being regularly seen on this reef. Eretmochelys imbricata has continued to be locally scarce on Peel Island Reef in central Moreton Bay throughout 1997, 1998 and 1999 with no E. imbricata being recorded on most visits. This scarcity of E. imbricata has been a feature of the Peel Island Reef since the May 1996 flood. Chelonia mydas also have been less abundant in the same area since that flood. As a result of the reduction of turtles on Peel Island Reef following the May 1996 flooding, few E. imbricata have been captured there since: • T94625: 8th September 1996, male, prepubescent, CCL = 70.3 cm. Recaptured 1.71 yr
later; CCL growth increment = 0.7 cm; growth rate = 0.41 cm/yr. Captured on Peel Island Reef on both occasions
• T67465: 23rd February 1997, female, pubescent, CCL = 81.9 cm; a recapture after 3.42 yr since first capture on 5th September 1993; CCL growth increment = 0.2 cm, growth rate = 0.06 cm/yr. Captured on Peel Island Reef on both occasions.
• T65365: 19th April 1997, female pubescent, CCL = 63.5 cm; ingested fishing line coming from mouth, poor condition; assessed as terminally sick and killed for veterinary assessment. She was dying from a twisted and compacted intestine resulting from fishing line ingestion.
• T29666: 24th May 1998, male, adult; CCL = 80.3 cm; not in spermatogenesis. Eretmochelys imbricata continued to be captured at low frequency while they were feeding within the extensive seagrass pastures of the Moreton Banks in eastern Moreton Bay during 1997 and 1998. They were not feeding in close proximity to rocky reef or coral reef habitat although there were some mollusc reefs (= commercial oyster leases) adjacent to the capture sites. • K7253: female, prepubescent, CCL = 37.1 cm • K7453: female, prepubescent, CCL = 50.4 cm; with tumours resembling green turtle
fibropapilloma disease.

114
• K12502: female, prepubescent, CCL = 40.9 cm Scuba divers that dived on the deeper rocky reefs on the outside of Moreton Bay to the east of North Stradbroke Island regularly reported sightings of E. imbricata throughout 1996 and 1997, including the winter months. These turtles ranged in size from small immatures up to large adults. One E. imbricata was brought in by a diver from these ocean reefs for confirmation of species identification (T92317: female, prepubescent, CCL = 40.7 cm). Eretmochelys imbricata were being recorded on these rocky reefs outside of Moreton Bay at the same time that there were reduced numbers of E. imbricata feeding on the Peel Island Reef within Moreton Bay. Eretmochelys imbricata have been captured throughout the year including during all winter months in Moreton Bay (27oS latitude). In addition, the few recaptures indicate a local long-term residency. The same is expected for the numerous E. imbricata that live on the rocky reefs of northern New South Wales to as far south as the Solitary Islands (30oS). Winter water temperatures in Moreton Bay fall as low as 15 oC (Read et al. 1996). This year-round resident E. imbricata population must be living near the southern climatic extreme for a feeding distribution in eastern Australia. Therefore, it was not surprising that a major flood at the onset of winter into Moreton Bay should affect the local feeding distribution of a turtle population. The events associated with the May 1996 flooding continue to provide an opportunity to observe the impact of the run-off from a major flood on a turtle feeding population. Associated with the flooding, there appears to have been a rapid and total decline in availability of E. imbricata on Peel Island Reef in the months that followed. Since September 1996 until early 2000, up to approximately 4 yr after this flooding event, E. imbricata have been present but scarce on the northern reefs of Peel Island. The two recaptured turtles had growth rates towards the lower end of the range for their size. While much of the evidence is circumstantial, these above observations suggest that: • the 1996 flood run-off into Moreton Bay adversely affected the local E. imbricata
population, causing it to move away from the feeding area at Peel Island; • it took months for the population to return; • the negative impact of the flood is still evident 4 years later with continued reduced E.
imbricata foraging numbers and apparent slow growth. References Chaloupka, M. and Limpus, C. J. (1997). Robust statistical modelling of hawksbill sea turtle growth rates (southern Great Barrier Reef). Marine Ecology Progress Series 146, 1–8. Dobbs, K. A., Miller, J. D., Limpus, C. J. and Landry, A. M. Jr. (1999). Hawksbill turtle, Eretmochelys imbricata, nesting at Milman Island, Northern Great Barrier Reef, Australia. Chelonian Conservation and Biology 3(2), 344–362. Limpus, C. J. (1992). The hawksbill turtle, Eretmochelys imbricata, in Queensland: population structure within a southern Great Barrier Reef feeding ground. Wildlife Research 19, 489–506. Limpus, C. J. and Chaloupka, M. (1997). Nonparametric regression modelling of green sea turtle growth rates (southern Great Barrier Reef). Marine Ecology Progress Series 149, 23–34. Limpus, C. J. and Parmenter, C. J. (1986). The sea turtle resources of the Torres Strait Region. In ‘Torres Strait Fisheries Seminar, Port Moresby 11–14 February 1985’. (Eds. Haines, K. A., Williams, G. C. and Coates, D.) pp. 95–105. (Australian Government Printing Services: Canberra.) Limpus, C. J. and Reed, P. C. (1985). The green turtle, Chelonia mydas, in Queensland: population structure in a coral reef feeding area. In: G. Grigg, R. Shine, and H. Ehmann (Eds.). Biology of Australian Frogs and Reptiles. Surrey Beatty and Sons, Sydney. pp. 47–52.

115
Limpus, C. J., Miller, J. D., Parmenter, C. J., Reimer, D., McLachlan, N. and Webb, R. (1992). Migration of green (Chelonia mydas) and loggerhead (Caretta caretta) turtles to and from eastern Australian rookeries. Australian Wildlife Research 19, 347–358. Limpus, C. J., Couper, P. and Read, M. A. (1994a). The green turtle, Chelonia mydas, in Queensland: population structure in a warm temperate feeding area. Memoirs of the Queensland Museum 35(1), 139–154. Limpus, C. J., Couper, P. J. and Read, M. A. (1994b). The loggerhead turtle, Caretta caretta, in Queensland: population structure in a warm temperate feeding area. Memoirs of the Queensland Museum 37(1), 195–204. Miller. J. D., Dobbs, K. A., Limpus, C. J., Mattocks, N. and Landry, A. M. (1998). Long distance migration by the hawksbill turtle, Eretmochelys imbricata, from north-eastern Australia. Wildlife Research 25, 89–95. Read, M. A., Grigg, G. C. and Limpus, C. J. (1996). Body temperature and winter feeding in immature green turtles, Chelonia mydas, in Moreton Bay, south-eastern Queensland. Journal of Herpetology 30(2), 262–265. Robins, J. B. (1995). Estimated catch and mortality of sea turtles from the east-coast otter trawl fishery of Queensland, Australia. Biological Conservation 74, 157–167. Venables, W. N. and Ripley, B. D. (1999). Modern Applied Statistics with S-PLUS, 3rd edition. (Springer: New York.) Witzell, W. N. (1983). Synopsis of the biological data on the hawksbill turtle Eretmochelys imbricata (Linnaeus, 1766). FAO Fisheries Symposium 137:1–78.
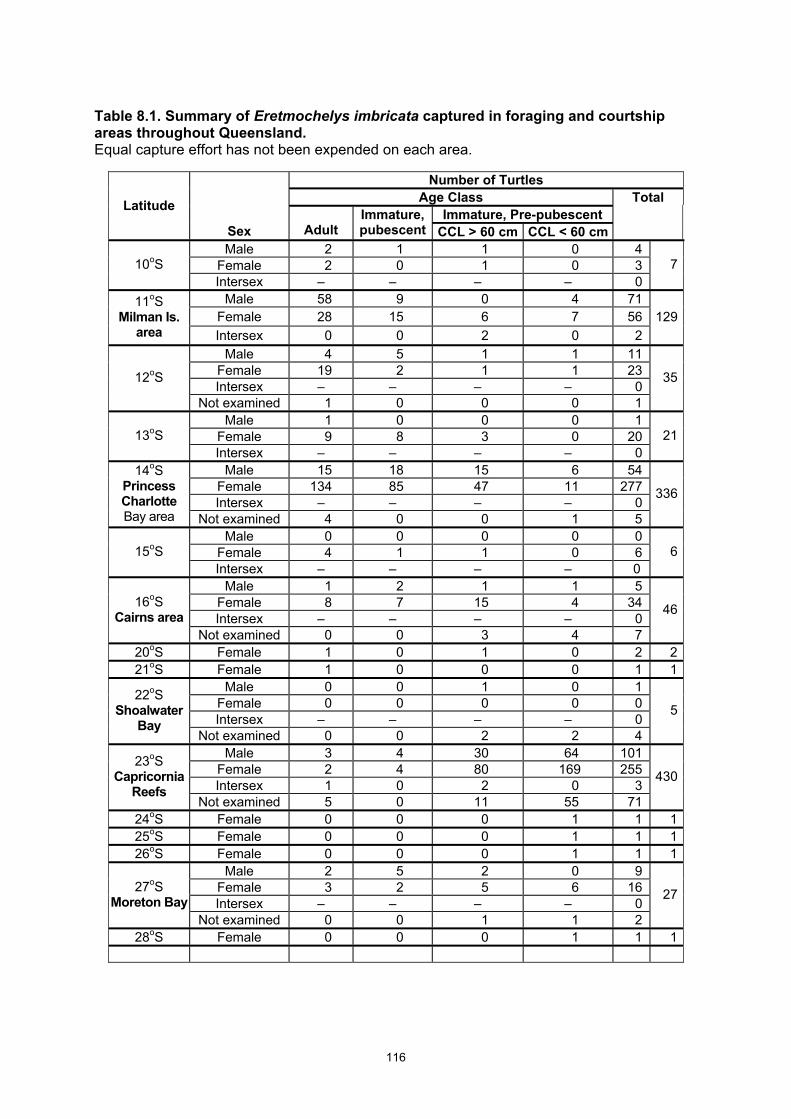
116
Table 8.1. Summary of Eretmochelys imbricata captured in foraging and courtship areas throughout Queensland. Equal capture effort has not been expended on each area.
Number of Turtles Age Class Total
Immature, Pre-pubescent Latitude
Sex Adult Immature,pubescent CCL > 60 cm CCL < 60 cm
Male 2 1 1 0 4 Female 2 0 1 0 3 10oS Intersex – – – – 0
7
Male 58 9 0 4 71 Female 28 15 6 7 56
11oS Milman Is.
area Intersex 0 0 2 0 2 129
Male 4 5 1 1 11 Female 19 2 1 1 23 Intersex – – – – 0
12oS
Not examined 1 0 0 0 1
35
Male 1 0 0 0 1 Female 9 8 3 0 20 13oS Intersex – – – – 0
21
Male 15 18 15 6 54 Female 134 85 47 11 277 Intersex – – – – 0
14oS Princess Charlotte Bay area Not examined 4 0 0 1 5
336
Male 0 0 0 0 0 Female 4 1 1 0 6 15oS Intersex – – – – 0
6
Male 1 2 1 1 5 Female 8 7 15 4 34 Intersex – – – – 0
16oS Cairns area
Not examined 0 0 3 4 7
46
20oS Female 1 0 1 0 2 221oS Female 1 0 0 0 1 1
Male 0 0 1 0 1 Female 0 0 0 0 0 Intersex – – – – 0
22oS Shoalwater
Bay Not examined 0 0 2 2 4
5
Male 3 4 30 64 101 Female 2 4 80 169 255 Intersex 1 0 2 0 3
23oS Capricornia
Reefs Not examined 5 0 11 55 71
430
24oS Female 0 0 0 1 1 125oS Female 0 0 0 1 1 126oS Female 0 0 0 1 1 1
Male 2 5 2 0 9 Female 3 2 5 6 16 Intersex – – – – 0
27oS Moreton Bay
Not examined 0 0 1 1 2
27
28oS Female 0 0 0 1 1 1

11
7
Tabl
e 8.
2. S
umm
ary
of ta
gged
Ere
tmoc
hely
s im
bric
ata
capt
ured
dur
ing
past
stu
dies
in 1
974–
1989
(Lim
pus
1992
), in
cide
ntal
cap
ture
s du
ring
1989
–199
4 an
d du
ring
the
pres
ent s
tudy
199
4–19
99 th
at w
as fu
nded
by
JBA
.
Equ
al c
aptu
re e
ffort
has
not b
een
expe
nded
on
each
reef
. Val
ues
in p
aren
thes
is d
urin
g th
e pe
riod
of th
e JB
A s
tudy
indi
cate
reca
ptur
es w
ithin
th
e sa
me
year
. Num
bers
in s
hade
d ce
lls o
f the
tabl
e in
dica
te tu
rtles
cap
ture
d at
one
reef
bei
ng re
capt
ured
at t
he s
ame
reef
. Num
bers
in
unsh
aded
cel
ls in
dica
te tu
rtles
cap
ture
d at
one
reef
and
reca
ptur
ed a
t a d
iffer
ent r
eef.
8.2a
Cor
al re
efs
in th
e so
uthe
rn G
reat
Bar
rier R
eef i
n th
e vi
cini
ty o
f Her
on Is
land
and
the
Swai
n R
eefs
.
JBA
FU
ND
ED S
TUD
Y 19
94–1
999
Ann
ual c
atch
of n
ew tu
rtle
s N
ew
turt
les
TOTA
LR
eef w
here
reca
ptur
ed b
y ye
ars
95+9
6+97
+98+
99
(with
in y
ear r
ecap
ture
) TO
TAL
REC
APT
UR
ES
Ree
f of
orig
inal
ca
ptur
e
Prio
r to
1994
To
tal t
urtle
s ta
gged
+
(rec
aptu
res)
1994
–95
1996
199
719
9819
9919
94–9
9
Rec
aptu
red
turt
les
from
prio
r to
199
4 H
eron
W
ista
ri W
reck
W
ilson
N
orth
wes
t H
eron
16
6+ (1
09)
17
32
28
16
14
107
36
16+1
8+28
+22+
23
(–23
+18+
3+2)
10
7 (4
6)
Wis
tari
24 +
(1)
4 18
31
6
0 59
35
0+
0+1+
1+0
1+1+
16+9
+2
31
(0+1
+3+0
+0)
(0+0
+9+2
+0)
(1
5)
Wre
ck
21 +
(1)
2 10
8
6 7
33
2 16
0+0+
5+7+
4 (0
+1+4
+1+0
)
(6
)
Wils
on
1 1
0 0
– –
1 0
0+
0+0+
– +
–
0
Nor
thw
est
3 –
– 2
0 0
2 0
– +
– +0
+0+0
0
Mas
thea
d 1
0 –
– –
– 0
0
0 E
rski
ne
2 0
– –
– –
0 0
0
One
Tre
e 2
– –
– –
– 0
0
0 La
dy
Mus
grav
e 8
– –
– –
– 0
0
0
Sw
ain
Ree
fs
0 –
– –
1 0*
1
–
0
TOTA
L 22
8 +
(111
)24
60
69
29
21
20
3 73
10
9 (5
0)
29 (1
1)
16 (6
) 0
0 15
4 (6
7)

11
8
Tabl
e 8.
2 co
ntin
ued…
8.
2B B
ays
adja
cent
to th
e m
ainl
and
of c
entr
al a
nd s
outh
ern
Que
ensl
and.
JBA
FU
ND
ED S
TUD
Y 19
94–1
999
Ann
ual c
atch
of n
ew tu
rtle
s N
ew tu
rtle
s TO
TAL
Rec
aptu
res
95+9
6+97
+98+
99
TOTA
L R
ECA
PTU
RES
Ree
f of o
rigin
al c
aptu
re P
rior t
o 19
94To
tal t
urtle
s ta
gged
+
(rec
aptu
res)
19
94–9
519
9619
9719
9819
9919
94–9
9
Rec
aptu
red
turt
les
from
pr
ior t
o 19
94M
oret
on B
ay
M
oret
on B
ay
7 +
(1)
6 9
3 2
0 20
1
0+0+
1+1+
0 2
Her
vey
Bay
& S
andy
S
traits
0
1 0
0 0
1 2
–
0 0
Reh
abili
tate
d tu
rtles
, so
uth
Qld
1
1 0
2 0
0 3
0
0+0+
0+1+
0 1
Sho
alw
ater
Bay
4
1 0
0 –
– 1
0
0 0
TOTA
L 12
+ (1
) 8
9 3
2 1
26
1 3
3
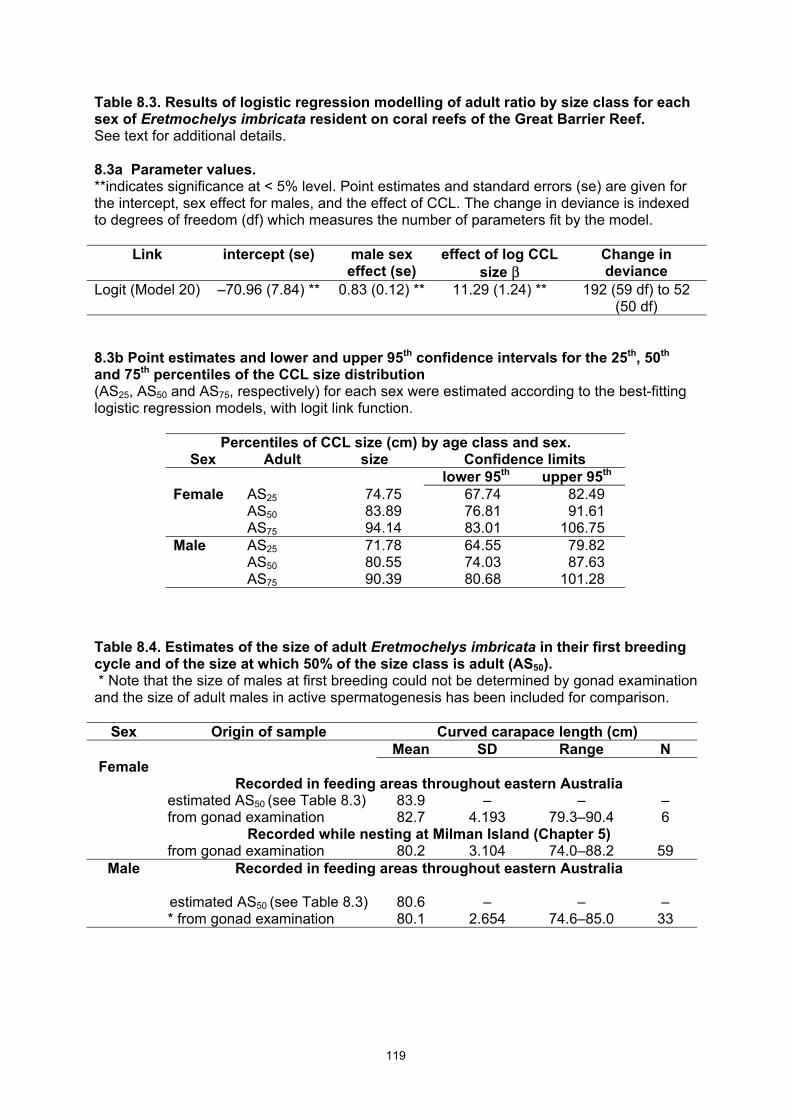
119
Table 8.3. Results of logistic regression modelling of adult ratio by size class for each sex of Eretmochelys imbricata resident on coral reefs of the Great Barrier Reef. See text for additional details. 8.3a Parameter values. **indicates significance at < 5% level. Point estimates and standard errors (se) are given for the intercept, sex effect for males, and the effect of CCL. The change in deviance is indexed to degrees of freedom (df) which measures the number of parameters fit by the model.
Link intercept (se) male sex effect (se)
effect of log CCL size β
Change in deviance
Logit (Model 20) –70.96 (7.84) ** 0.83 (0.12) ** 11.29 (1.24) ** 192 (59 df) to 52 (50 df)
8.3b Point estimates and lower and upper 95th confidence intervals for the 25th, 50th and 75th percentiles of the CCL size distribution (AS25, AS50 and AS75, respectively) for each sex were estimated according to the best-fitting logistic regression models, with logit link function.
Percentiles of CCL size (cm) by age class and sex. Sex Adult size Confidence limits
lower 95th upper 95th Female AS25 74.75 67.74 82.49 AS50 83.89 76.81 91.61 AS75 94.14 83.01 106.75 Male AS25 71.78 64.55 79.82 AS50 80.55 74.03 87.63 AS75 90.39 80.68 101.28
Table 8.4. Estimates of the size of adult Eretmochelys imbricata in their first breeding cycle and of the size at which 50% of the size class is adult (AS50). * Note that the size of males at first breeding could not be determined by gonad examination and the size of adult males in active spermatogenesis has been included for comparison.
Sex Origin of sample Curved carapace length (cm) Mean SD Range N
Female Recorded in feeding areas throughout eastern Australia estimated AS50 (see Table 8.3) 83.9 – – – from gonad examination 82.7 4.193 79.3–90.4 6 Recorded while nesting at Milman Island (Chapter 5) from gonad examination 80.2 3.104 74.0–88.2 59
Male
Recorded in feeding areas throughout eastern Australia
estimated AS50 (see Table 8.3) 80.6 – – – * from gonad examination 80.1 2.654 74.6–85.0 33
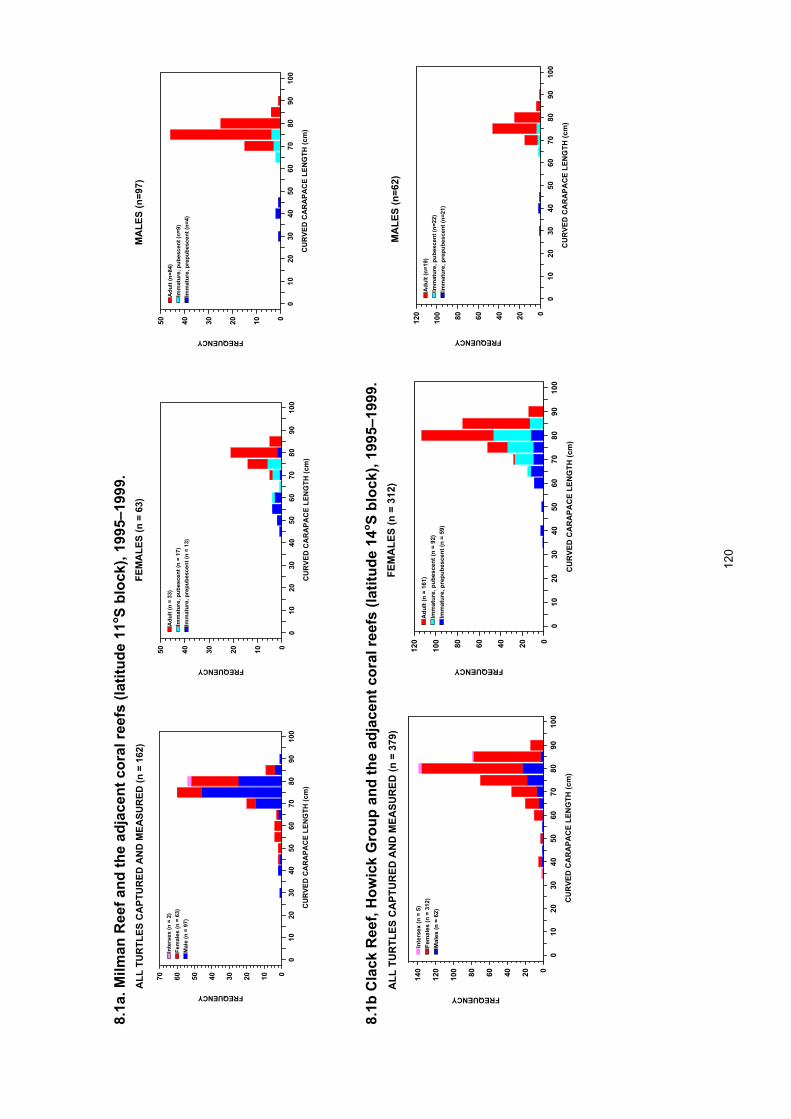
12
0
8.1a
. Milm
an R
eef a
nd th
e ad
jace
nt c
oral
reef
s (la
titud
e 11
o S bl
ock)
, 199
5–19
99.
ALL
TU
RTL
ES C
APT
UR
ED A
ND
MEA
SUR
ED (n
= 1
62)
0
10
20
30
40
50
60
70
80
90
100
CU
RVE
D C
AR
APA
CE
LEN
GTH
(cm
)
010203040506070
FREQUENCY
Mal
e (n
= 9
7)Fe
mal
es (n
= 6
3)In
ters
ex (n
= 2
)
FEM
ALE
S (n
= 6
3)
0
10
20
30
40
50
60
70
80
90
100
CU
RVE
D C
AR
APA
CE
LEN
GTH
(cm
)
01020304050
FREQUENCY
Imm
atur
e, p
repu
besc
ent (
n =
13)
Imm
atur
e, p
ubes
cent
(n =
17)
Adu
lt (n
= 3
3)
MA
LES
(n=9
7)
0
10
20
30
40
50
60
70
80
90
100
CU
RVE
D C
AR
APA
CE
LEN
GTH
(cm
)
01020304050
FREQUENCY
Imm
atur
e, p
repu
besc
ent (
n=4)
Imm
atur
e, p
ubes
cent
(n=9
)A
dult
(n=8
4)
8.
1b C
lack
Ree
f, H
owic
k G
roup
and
the
adja
cent
cor
al re
efs
(latit
ude
14o S
bloc
k), 1
995–
1999
. A
LL T
UR
TLES
CA
PTU
RED
AN
D M
EASU
RED
(n =
379
)
0
10
20
30
40
50
60
70
80
90
100
CU
RVE
D C
AR
APA
CE
LEN
GTH
(cm
)
020406080100
120
140
FREQUENCY
Mal
es (n
= 6
2)Fe
mal
es (n
= 3
12)
Inte
rsex
(n =
5)
FEM
ALE
S (n
= 3
12)
0
10
20
30
40
50
60
70
80
90
100
CU
RVE
D C
AR
APA
CE
LEN
GTH
(cm
)
020406080100
120
FREQUENCYIm
mat
ure,
pre
pube
scen
t (n
= 59
)Im
mat
ure,
pub
esce
nt (n
= 9
2)A
dult
(n =
161
)
MA
LES
(n=6
2)
0
10
20
30
40
50
60
70
80
90
100
CU
RVE
D C
AR
APA
CE
LEN
GTH
(cm
)
020406080100
120
FREQUENCY
Imm
atur
e, p
repu
besc
ent (
n=21
)Im
mat
ure,
pub
esce
nt (n
=22)
Adu
lt (n
=19)

12
1
Figu
re 8
.1 c
ontin
ued…
8.
1c. C
oral
reef
s ad
jace
nt to
Her
on Is
land
(lat
itude
23o S
bloc
k), 1
994–
1999
. A
LL T
UR
TLES
CA
PTU
RED
AN
D M
EASU
RED
(n =
350
)
010
2030
4050
6070
8090
100
CU
RVE
D C
AR
APA
CE
LEN
GTH
(cm
)
01020304050
FREQUENCY
Mal
es(n
= 8
6)Fe
mal
es (n
= 2
27)
not e
xam
ined
(n =
34)
Inte
rsex
(n =
3)
FEM
ALE
S (n
= 2
27)
0
1020
3040
5060
7080
9010
0
CU
RVE
D C
AR
APA
CE
LEN
GTH
(cm
)
051015202530
FREQUENCY
imm
atur
e, p
repu
besc
ent (
n =
217)
imm
atur
e, p
ubes
cent
(n =
6)
adul
t (n
= 4)
MA
LES
(n=8
6)
010
2030
4050
6070
8090
100
CU
RVE
D C
AR
APA
CE
LEN
GTH
(cm
)
051015202530
FREQUENCY
imm
atur
e, p
repu
besc
ent (
78)
imm
atur
e, p
ubes
cent
(n=6
)ad
ult (
n=2)
Fi
gure
8.1
. Ere
tmoc
hely
s im
bric
ata
resi
dent
on
reef
s w
ithin
the
Gre
at B
arrie
r Ree
f, ea
ster
n A
ustr
alia
. E
qual
sam
plin
g ef
fort
was
not
app
lied
at e
ach
site
.

122
10 11 12 13 14 15 16 17 18 19 20 21 22 23 24 25 26 27 28
DEGREES OF LATITUDE
0
0.2
0.4
0.6
0.8
1PR
OPO
RTI
ON
OF
AD
ULT
Sfemale (adults = 221, immatures = 486)male (adults = 86, immatures = 171)
TorresStrait
GoldCoast
Figure 8.2. Proportion of adult Eretmochelys imbricata present within the sample of captured turtles of each sex by one degree latitudinal blocks along the east coast of Queensland. Data sets from Table 8.1 have been displayed for sample size by sex greater than five within a degree block.
10 11 12 13 14 15 16 17 18 19 20 21 22 23 24 25 26 27 28
DEGREES OF LATITUDE
0
0.2
0.4
0.6
0.8
1
PRO
POR
TIO
N O
F FE
MA
LES
adult (large samples)adult (small samples)immature (large samples)immature (small samples)
TorresStrait
GoldCoast
Figure 8.3. Proportion of female Eretmochelys imbricata present within the sample of captured adult and immature turtles by one degree latitudinal blocks along the east coast of Queensland. Data sets from Table 8.1 have been displayed for large sample sizes (n > 20) or small sample sizes (n > 10 and < 20) within a degree block for each maturity category.

123
less than 1 2 4 6 8 10 12 14 16
YEARS
0
5
10
15
20
25
30
35
40
FREQ
UEN
CY
n = 150
Figure 8.4. Frequency distribution of maximum time interval between captures for Eretmochelys imbricata resident on coral reefs in the vicinity of Heron Island, southern Great Barrier Reef.

124
65 70 75 80 85 90 95
CURVED CARAPACE LENGTH (cm)
0
10
20
30
40
50FR
EQU
ENC
Y
0
0.2
0.4
0.6
0.8
1PR
OPO
RTIO
N A
DU
LT
immature, prepubescent immature, pubescentadultproportion adult
8.5a. Female
65 70 75 80 85 90 95
CURVED CARAPACE LENGTH (cm)
0
5
10
15
20
25
FREQ
UEN
CY
0
0.2
0.4
0.6
0.8
1
PRO
POR
TION
AD
ULT
immature, prepubescentimmature, pubescentadultproportion adult
8.5b. Male Figure 8.5. Frequency distribution by sex and carapace length of large immature and adult Eretmochelys imbricata from northern Great Barrier Reef foraging areas. The proportion of adults is calculated for each 1 cm size class.

125
CHAPTER 9 - Growth studies of immature Eretmochelys imbricata Colin J. Limpus and Samantha Low Choy Introduction Knowledge of the age structure of a population is necessary if a reasonable understanding of its population dynamics is required. In the absence of a reliable method for aging free-ranging Eretmochelys imbricata, analysis of mark-recapture data and modelling of growth rates of a representative cross-section of a population could be used to derive acceptable growth functions from which the age structure can be calculated. Chaloupka and Musick (1997) have discussed suitable methodology and limitations for this approach to deriving an age structure for a population. At the commencement of the present study, growth data from prior studies of Chelonia mydas and E. imbricata from southern Great Barrier Reef (GBR) foraging areas were analysed to find an appropriate model for describing the growth functions of marine turtles (Limpus and Chaloupka 1997; Chaloupka and Limpus 1997). However, the small set of E. imbricata growth data available at the time limited the scope of the growth analysis for this species (Chaloupka and Limpus 1997). The present study has continued the investigation of the species at the same study site, using the same methodology and produced a more comprehensive data set for analysis at this time. Methods Growth data were recorded from E. imbricata that were foraging residents on the coral reefs adjacent to Heron Island in the southern GBR (Heron Reef, Wistari Reef and Wreck Island Reef, Chapter 8) following the methodology of Chaloupka and Limpus (1997). Growth data was collected from turtles that were tagged and recaptured during the period 1975–1999 and was limited to recapture intervals greater than 10 mth. Analysis was restricted to turtles of known sex and maturity. Because such a small number of adult E. imbricata were captured in this area during the study (Chapter 8), the growth analysis is restricted to immature turtles. Statistical methods. A GAM approach, similar to that used in Limpus and Chaloupka (1997) is used here in the first stage of modelling. This permits comparisons with earlier work on the original third of this data set (Chaloupka and Limpus 1997) where GAMs were found to be the most appropriate model. It is of interest to observe whether collection of more data changes the response-covariate relationship: the link function; the form of the linear predictor; or the error distributions. The specific GAM and glm models (McCullagh and Nelder, 1989) considered here comprise a slightly broader range of models than those used by Chaloupka and Limpus (1997). These models capitalise on the higher degrees of freedom afforded by the larger data set, and the additional functionality of software (Venables and Ripley 1999). An identity link is retained, with either a robust quasi-likelihood error function (Hastie and Tibshirani 1990) or a Gaussian error function. The Quasi-likelihood estimation method was considered since it does not require full specification of the error distribution function. This permits modelling of under- or over-dispersion with respect to standard families. For this study, a constant variance function was specified, and a dispersion parameter estimated. A range of smoothing functions was considered, including natural and B-spline cubic smoothing splines, loess and parametric polynomial functions.

126
Models were compared via examination of diagnostic plots and comparison of model performance statistics. The standard diagnostic plots (Venables and Ripley 1999) used, though not displayed, were: residual versus fitted values plots to test heterogeneity of residuals; observed versus modelled value plots to assess consistency of model fit; and quantile-quantile plots of residuals to assess the form of error distribution. Model performance statistics included comparison of null and residual deviance including R2 where appropriate, log-likelihood, Cp statistics and p-values for explanatory strength of relationship with covariates. GAMs using piece wise cubic via B-spline form of the covariate were the most effective compared to the use of other smoothers according to diagnostics and model performance statistics. Results Growth increments were available from 196 recapture intervals from 137 immature E. imbricata (54 intervals from 38 males and 142 intervals from 99 females. Figure 9.1). These turtles had a mean midline curved carapace length between captures that ranged 37 to 88 cm. The mean interval between captures was 3.19 yr for females (SD = 3.02, range = 0.8–13.9) and 2.96 yr for males (SD = 3.25, range = 0.8–12.7). Mean annual growth rates for females = 1.7184 cm/yr (SD = 0.7233, range = –0.7210–3.53) and males = 1.345 cm/yr (SD = 0.8009, range = 0–3.0). The most successful GAMs required fitting the model for growth rate (cm/yr) indexed by mean size and adjusted for year and recapture interval effects to females and males separately. An overall GAM involving interactions between sex and other covariates only modelled changes in the mean, whereas separate GAMs for each sex captured the different patterns of variation in growth for each sex. The summary statistics for the overall model showing effect on the mean are shown in Table 9.1 (Dispersion parameter for quasi-likelihood family was estimated to be 0.3452691). Note that parameter estimates were only marginally significant (at the 10% level) for any terms involving sex. This indicates that this overall model is not a useful way to describe the impact of sex on the size indexed growth curve. Modelling male and female growth patterns separately, indexed by size, gave better results (Table 9.2). Although the model for females is only 40% effective in explaining growth patterns, the model for males is 60% effective (Fig. 9.2). These plots show the mean-adjusted contribution of the B-spline of each covariate to the overall fit for each sex. The curves for mean size both appear almost quadratic attaining a maximum growth rate at approximate mean size of 63 cm for females, and 58 cm for males. Note that the effects of year and recapture interval are relatively small for females, generally staying close to zero. For males, the effect of year appears large at the end points, but this could be due to the small sample size. Similarly the effect of recapture interval appears large for longer recapture intervals, but the wide confidence interval indicates that this could be an artefact of sample size. In all cases the greater amount of data available on females contributed to tighter point wise standard errors. Parametric models for the above were also investigated. The asymmetry in the impact of mean size, year and recapture interval was not captured as well using polynomials up to order 5. However, the diagnostic plots showed only slight deviations from the assumptions. This indicates that the parametric models may be useful for summarising the difference between female and male growth rates. Discussion The initial analysis (Chaloupka and Limpus, 1997) was based on 68 mark-recapture records from 44 immature E. imbricata, compared to the total of 196 records from 137 immature turtles in the current study. As expected, the standard errors on the B-splines corresponding

127
to all covariates have decreased, largely due to the increase in sample size. Note that excessive curvature in fitted B-splines, particularly evident in year and recapture interval in the initial study, is no longer as marked when more data is included in the analysis. This “over-fitting” was an artefact of small sample sizes, often observed when fitting spline-based GAMs and polynomials. In the larger current study, there is still possible evidence of over-fitting or lack of data when estimating the end-points of the year effect, and for all recapture intervals beyond about 500 days. This indicates that more data is still required before the true effect of recapture interval may be estimated. The difficulty with estimating the year effect for early years may not be so easily dealt with, and may result in eliminating data from those early years if the study continues. These E. imbricata displayed the typical non-monotonic and sex-specific growth pattern that we have come to expect from free ranging turtles within the southern GBR (Limpus 1992; Chaloupka and Limpus 1997). The smaller resident turtles grow slowly, typically growing < 2 cm/yr. Annual growth rate increases as they approach CCL ~ 60 cm. After this size, annual growth rate slows and approaches zero as they grow towards adult size (Fig. 9.1). This growth pattern has been maintained over the 24 yr of sampling of this population. An immature E. imbricata that recruits to residency in the southern GBR at CCL = 36.3 cm at approximately 5–7 years of age (Chapter 7). The additional time required to grow from recruitment to the foraging area to commencement of breeding can be grossly approximated (Table 9.3). Based on these combined values, it is estimated that an E. imbricata growing to maturity within the southern GBR may be on average about 31–36 years of age (95% confidence limits = ~ 20 – many decades) for females and about 38 years of age (95% confidence limits = ~ 23 – many decades) for males. Additional mathematical modelling of these data are expected to improve the precision of these estimates. References Chaloupka, M. and Limpus, C. J. (1997). Robust statistical modelling of hawksbill sea turtle growth rates (southern Great Barrier Reef). Marine Ecology Progress Series 146, 1–8. Chaloupka, M. Y. and Musick, J. A. (1997). Age, growth and population dynamics. In ‘The Biology of Sea turtles.’ (Eds. Lutz, P. L. and Musick, J. A.) pp. 233–276. (CRC Press: Boca Raton.) Hastie, T. J. and Tibshirani, R. J. (1990). Generalised Additive Models. (Chapman & Hall: London.) Limpus, C. J. (1992). The hawksbill turtle, Eretmochelys imbricata, in Queensland: population structure within a southern Great Barrier Reef feeding ground. Wildlife Research 19, 489–506. Limpus, C. J. and Chaloupka, M. (1997). Nonparametric regression modelling of green sea turtle growth rates (southern Great Barrier Reef). Marine Ecology Progress Series 149, 23–34. McCullagh, P. and Nelder, J. A. (1989). Generalised Linear Models, 2nd edition. (Chapman & Hall: London.) Venables, W. N. and Ripley, B. D. (1999). Modern Applied Statistics with S-PLUS, 3rd edition. (Springer: New York.)

128
Table 9.1. Analysis of deviance table for quasi-likelihood model of growth. bs( ) indicates a cubic B-spline was used. Just under 50% of the variability can be explained using this model. The bs(*, 3) indicates that 3 smoothing parameters were sufficient for capturing the pattern in the corresponding covariate.
Terms added sequentially Df Deviance Residual (first to last) Df Deviance
Null – 195 109.7499 Sex 1 4.14953 194 105.6004 bs(mean.size, 3) 3 34.18129 191 71.4191 bs(year, 3) 3 2.60874 188 68.8104 bs(recapture.interval, 3) 3 3.43559 185 65.3748 sex:bs(mean.size, 3) 3 2.30455 182 63.0702 sex:bs(year, 3) 3 1.29206 179 61.7782 sex:bs(recapture.interval, 3) 3 1.01082 176 60.7674
Table 9.2. Analysis of deviance table for quasi-likelihood model of growth with female and male growth patterns indexed by size separately. See Table 9.1 for definition of terms.
Terms added sequentially Residual (first to last) Df Deviance Df Deviance
Female Null – 141 73.76672 bs(mean.size, 3) 3 22.18248 138 51.58424 bs(year, 3) 3 2.07936 135 49.50489 bs(recapture.interval, 3) 3 1.66558 132 47.83931 Male Null – 53 31.83369 bs(mean.size, 3) 3 13.97122 50 17.86247 bs(year, 3) 3 1.88727 47 15.97520 bs(recapture.interval, 3) 3 3.04714 44 12.92806

129
Table 9.3. Estimated time for Eretmochelys imbricata to grow from residency recruitment at a southern Great Barrier Reef foraging area (CCL = 36.3 cm. Chapter 7) to mean size at first breeding. For females two calculations are provided based on size recorded for first time breeding females at Milman Island (CCL = 80.2 cm. Chapter 5) and on AS50 (CCL = 83.9 cm. Chapter 9). For males, only the estimate based on AS50 (CCL = 80.55 cm. Chapter 9) is available.
Mean CCL growth rate (cm/yr) Estimated growth time through size class Size class
(cm) mean SD range n mean (95% confidence limits) years
FEMALE 36.3–45.0 1.503 0.580 1.980–2.161 12 5.79 (3.3–23.7)
> 45.0–55.0 1.811 0.661 0.291–3.530 34 5.52 (3.2–19.4) > 55.0–65.0 2.018 0.619 –0.492–3.268 39 4.96 (3.1–12.4) > 65.0–75.0 1.887 0.558 0.687–2.905 31 5.30 (3.6–12.6)
Alternate calculations using different estimates of the size at commencement of breeding
> 75.0–80.2 1.2097 0.662 –0.313–2.873 22 4.30 (2.1–∞) based on CCL of first time breeder
> 75.0–83.9 1.2097 0.662 –0.313–2.873 22 7.36 (3.5–∞) based on CCL of AS50 Total growth time from recruitment to 1st breeding 25.87 (15.3–∞) or 28.93 (16.7–∞)
MALE 36.3–45.0 1.247 0.308 0.790–1.711 5 6.98 (4.7–13.5)
> 45.0–55.0 1.810 0.506 1.178–2.929 10 5.53 (3.6–12.2) > 55.0–65.0 2.071 0.607 1.167–3.000 10 4.83 (3.1–11.3) > 65.0–75.0 1.420 0.671 0–2.622 15 7.04 (3.7–95)
> 75.0–80.55 0.633 0.613 0–1.997 14 8.77 (3.0–∞) based on CCL of AS50
Total growth time from recruitment to 1st breeding 33.15 (18.1–∞)

130
0 10 20 30 40 50 60 70 80 90 100
MEAN CURVED CARAPACE LENGTH (cm)
0
1
2
3
4
-1
GR
OW
TH R
ATE
(cm
/yr)
femalemale
Figure 9.1. Mean annual growth rates of immature Eretmochelys imbricata that were resident foraging turtles on coral reefs in the southern Great Barrier Reef.
mean.size
poly
(mea
n.si
ze, 3
)
40 50 60 70 80
-2.0
-1.5
-1.0
-0.5
0.0
0.5
year
poly
(yea
r, 3)
1975 1980 1985 1990 1995
0.0
0.5
1.0
1.5
recapture.interval
bs(r
ecap
ture
.inte
rval
, 3)
1000 2000 3000 4000 5000
-0.5
0.0
0.5
1.0
Females
mean.size
poly
(mea
n.si
ze, 3
)
40 50 60 70 80
-1.5
-1.0
-0.5
0.0
0.5
year
poly
(yea
r, 3)
1980 1985 1990 1995
-1.5
-0.5
0.0
0.5
1.0
recapture.interval
bs(r
ecap
ture
.inte
rval
, 3)
1000 2000 3000 4000
-0.5
0.0
0.5
1.0
Males
These models were the best performing GAMs fitting growth rates to mean size and other covariates for females (top row) and males (bottom row). Figure 9.2. Plots show mean-adjusted contribution of the B-spline of each covariate to the overall fit for each sex