australian mcs dcs capital structure · australian multinational and domestic corporations capital...
TRANSCRIPT
Australian Multinational and Domestic Corporations Capital Structure Determinants Shumi Akhtar*
___________________________________________________________________ Abstract
This study investigates the significance of the determinants of capital structure on a sample of Australian multinational corporations and Australian domestic corporations over the period 1992 to 2001. The determinants of capital structure have captured academic thought for many decades, particularly since Modigliani and Miller (1958). If optimal capital structures do exist and that these structures maximise firm value, obtaining an understanding of the determinants of capital structure is important in obtaining an understanding of the way firms maximise value. Multinational corporations control considerable assets and some multinationals control more assets than that which is controlled by some countries. Decisions about capital structure may have important implications in regards to shareholder wealth effects. Therefore, obtaining an understanding of the determinants of capital structure and the differences between domestic and multinational capital structure is of interest to academics, politicians, shareholders and financiers
The results show that the level of leverage does not differ significantly between multinational and domestic corporations. Using cross-sectional Tobit regression analysis the results show substantial variation in capital structure determinants between multinational and domestic corporations. For both types of organisations growth, profitability and size are significant determinants of leverage. For domestic corporations collateral value of assets is also a significant determinant of leverage. For multinationals, bankruptcy costs and the number of overseas subsidiaries is a significant determinant of leverage. Surprisingly, bankruptcy costs are not significant for domestic corporations. In relation to interaction effects, bankruptcy costs and profitability are significant in explaining multinational leverage relative to domestic leverage.
When industry effects are considered the significance of the original determinants remained constant however, some industries became significant. The industry effect was not consistent across domestic and multinational corporations.
In relation to time variation in leverage and the determinants of capital structure, both varied across domestic and multinationals over the sample period. ____________________________________________________________________
Key words: Capital structure; multinational; leverage JEL Classification: G32 Acknowledgements: Thanks to participants in the PhD Seminar series, particularly Tom Smith, Barry Oliver, Chris Bilson and Grant Fleming, School of Finance and Applied Statistics, ANU, for comments on earlier drafts of this paper. ____________________________________________________________________
* Contact details: Shumi Akhtar, School of Finance and Applied Statistics, Faculty of Economics and Commerce, Ph: (02) 6125 5458, Fax: (02) 6125 0087, Email: [email protected]
2
Australian Multinational and Domestic Corporations Capital Structure Determinants
Abstract This study investigates the significance of the determinants of capital structure
on a sample of Australian multinational corporations and Australian domestic corporations over the period 1992 to 2001. The determinants of capital structure have captured academic thought for many decades, particularly since Modigliani and Miller (1958). If optimal capital structures do exist and that these structures maximise firm value, obtaining an understanding of the determinants of capital structure is important in obtaining an understanding of the way firms maximise value. Multinational corporations control considerable assets and some multinationals control more assets than that which is controlled by some countries. Decisions about capital structure may have important implications in regards to shareholder wealth effects. Therefore, obtaining an understanding of the determinants of capital structure and the differences between domestic and multinational capital structure is of interest to academics, politicians, shareholders and financiers
The results show that the level of leverage does not differ significantly between multinational and domestic corporations. Using cross-sectional Tobit regression analysis the results show substantial variation in capital structure determinants between multinational and domestic corporations. For both types of organisations growth, profitability and size are significant determinants of leverage. For domestic corporations collateral value of assets is also a significant determinant of leverage. For multinationals, bankruptcy costs and the number of overseas subsidiaries is a significant determinant of leverage. Surprisingly, bankruptcy costs are not significant for domestic corporations. In relation to interaction effects, bankruptcy costs and profitability are significant in explaining multinational leverage relative to domestic leverage.
When industry effects are considered the significance of the original determinants remained constant however, some industries became significant. The industry effect was not consistent across domestic and multinational corporations.
In relation to time variation in leverage and the determinants of capital structure, both varied across domestic and multinationals over the sample period.
3
Australian Multinational and Domestic Corporations Capital Structure Determinants
1. Introduction
Despite the extensive research of over half a century, the knowledge of the
determinants of capital structure for corporations remains a controversial issue in
modern corporate finance.1 Since the seminal work by Modigliani and Miller (1958),
a plethora of research has been undertaken especially investigating the determinants
of capital structure on domestic corporations (DCs) in the US.
Optimal capital structure may have important implication on firm valuation,
capital budgeting decisions and long term corporate profits. Very little research has
been published on capital structure determinants for multinational corporations
(MCs). Some studies have been undertaken to investigate cross sectional differences
in capital structure between US based DCs and MCs during 1990’s (Lee and Kwok,
1988; Burgman, 1996; Homaifer et al., 1998; Chen et al., 1997), little research has
been published on comparisons of the determinants of capital structure for DCs and
MCs. In addition, the increased importance of ‘globalised markets’ with global
competition suggests that the determinants of MCs capital structure are becoming
increasingly important, particularly if they differ from domestic corporations.
This research draws upon existing theoretical determinants of capital structure
and empirically tests the hypotheses across a sample of multinational and domestic
corporations in Australia. Although the sample is from Australia the results have
important implications for multinational corporations based in other countries.
The paper is divided into five sections. The next section reviews previous
studies of capital structure literature, develops hypotheses and defines the variables.
1 Throughout this thesis the terms company, firm and corporation are used interchangeably.
4
The third and fourth sections provide discussion of data collection and method.
Section five discusses the results and section six summarises the key findings and
concludes the paper.
2. Capital structure determinants: hypotheses and variables
Theoretical studies based on international environmental factors predict that
MCs will have lower debt ratios than DCs (Shapiro, 1996; Lee and Kwok, 1988;
Burgman, 1996). Two major determinants of a firm's capital structure include agency
costs and bankruptcy costs. The higher these cost the lower the debt levels. The
difference in capital structures between MCs and DCs depends upon the effect of
multinationalisation on these two costs. MCs often possess monopolistic advantages
that enable them to outperform local companies in host countries (Kim and Lyn
1986), and these advantages are reflected by the value of future growth options of the
company. Therefore, MCs' agency costs of debt (according to Myers' (1977) under
investment prediction) will be higher and the debt ratios of MCs will be lower.
Additional monitoring costs, according to Jensen and Meckling (1976), are higher for
the MCs that operate in more complex political and institutional environments than
DCs (Burgman, 1996) and this is expected to lower MCs debt levels. Geographic
dispersion of MCs also increases auditing costs substantially, which are expected to
lower debt levels further.
On the other hand, MCs are thought to have diversification advantages in
reducing risk. Studies have shown that international operations result in reduced risk
for MCs (Hughes et al., 1975; Rugman, 1976; Agmon and Lessard 1977; Cheng and
Han 1993). As the degree of risk is a major determinant in the firm's financing
5
decision, international diversification may enhance debt capacity, and thereby raise
the target debt ratio for MCs.
The competition between theoretical predictions based on diversification
benefits and those based on agency and bankruptcy costs has motivated a number of
empirical investigations. Evidence regarding the direct effect of internationalisation
activities on debt structure is scarce. The few studies which compare the difference in
debt ratios between MCs and DCs, use a dichotomous classification and generally
report that MCs have a lower debt level than DCs (Michel and Shaked 1986; Fatemi,
1988; Homaifer et al., 1998 and Doukas and Pantzalis, 2003). Whether this is the
case for multinational corporations domiciled in Australia is an empirical question
that leads to the first hypothesis (stated in null form):2
H0 : There is no significant difference between DCs and MCs leverage.
The dependent variable, leverage (LTD) is defined as the ratio of the book value of
long term debt to book value of long term debt and market value of equity (Burgman,
1996; Chkir and Jean-Clause, 2001). 3,4
( ) ( )
Long Term DebtLTDLong Term Debt Market Value of Equity
=+
2 All hypotheses are stated in the null form. 3 Market value of debt would be preferable since it is a more accurate measure of debt. However, Bowman (1980) reported a large cross-sectional correlation between the market and the book value of the debt. 4 Equity is defined as market value of equity (Number of common shares outstanding multiplied by the year end closing price). Book value of debt is defined as the debt written in the financial report. Many studies have used value of debt in measuring leverage (see Friend and Lang (1988); Titman and Wessels (1988)). Bowman argues that even if the market value of debt is a more accurate measure of leverage, the use of book value of debt is not expected to distort leverage ratio.
6
Following the first hypothesis there are eleven hypotheses relating to capital structure
determinants. Two further hypotheses relating to industry effects and time variation
on capital structure are also considered. These are discussed below.
Agency costs of debt
Firms with higher agency costs of debt are expected to have lower debt levels
(Jensen and Meckling, 1976; Fama, 1980 and Titman, 1984). Agency costs of debt
include monitoring and control costs and this can be proxied by a range of variables
including free cash flow (Jensen, 1986). A positive association between free cash
flow and debt levels has been found by Agarwal and Jayaraman (1994), Jaggi and Gul
(1999) and Filbeck and Gorman (2000). Agency costs can also be proxied by growth
levels. Titman and Wessels (1988), Chung (1993), Barcklay et al. (1995) and Rajan
and Zingales (1995) all find a negative relationship between growth and debt levels.
In relation to DCs and MCs agency cost of MCs is expected to be higher than
DCs. As the operations of MCs are geographically dispersed, the difficulties in
gathering and processing information make monitoring (auditing costs, language
differences, varying legal and accounting systems) more costly and time consuming
than the cost of monitoring DCs. Hence, it is expected that the inherent agency
problems will be higher for MCs relative to DCs. Therefore, the agency cost
hypothesis is as follows:
H0: There is no significant relationship between agency costs and leverage for: • DCs • MCs
7
Three variables are used to capture different agency related issues. The first is as
suggested by Titman and Wessels (1988) as cash and marketable securities over three
years average of total assets:
3 Cash and Marketable SecuritiesAgency Costs
Years Average of Total Assets=
The second variable is free cash flow (Jensen, 1986). The measure of free cash flow
used is that as defined by Lehn and Poulsen (1989) standardised by 10,000:5
FCFLP = EBIT + DEP + AMO - TAX - DIV - INT10,000
where:
EBIT = earnings before interest and tax and abnormal return DEP = depreciation expense AMO = amortization reported separately TAX = total tax paid DIV = total dividends paid on ordinary and preference shares INT = net interest expense
The final variable related to agency cost is growth. The firm’s growth is calculated as
the annual percentage change in total assets for last three years Jensen et al. (1992)
and Mehran (1992). The growth in assets is a direct measure of current investment
and, if investment is persistent, it is also a proxy for expected investment (Fama and
French, 1998).
( )1
t tt
t t
Total Assets Total AssetsTotal AssetsGROWTHTotal Assets Assets
−−∆= =
Bankruptcy costs
Firms with higher bankruptcy costs are expected to have lower debt levels (Kraus and
Litzenberger, 1973).
5 The 10,000 standardisation was done to ensure consistency across the other variables.
8
In relation to the differences in bankruptcy costs between MCs and DCs, Reeb
(1998) and Armstrong and Riddick (1998) argue that MCs are expected to have lower
bankruptcy costs than DCs. MCs have ability to diversify across less than perfectly
correlated national economies and this should result in less volatility of earnings. This
should lower the probability of bankruptcy and hence lower expected bankruptcy
costs for MCs relative to DCs. However, MCs have operations in multiple legal
jurisdictions and that creditors in different countries have differential information and
remedies. Burgman (1996) argues that these jurisdictional and informational
differences increase the costs associated with bankruptcy. Therefore, it is not clear if
MCs are expected to have higher or lower costs of bankruptcy relative to DCs.
However, generally firms with higher expected bankruptcy costs are expected to have
lower leverage. This leads to the following hypothesis:
H0 : There is no significant relationship between bankruptcy cost and leverage for:
• DCs • MCs
To proxy bankruptcy costs, several researchers, including Lee and Kwok
(1988), Chaplinsky (1984), and Bradley et al. (1984) use the standard deviation of the
first difference in earnings before interest and taxes (EBIT) scaled by the mean value
of the firm's total assets. However, due to potential contemporaneous correlation of
total assets with other variables, the numerator is scaled by interest expense.6
( )
Standard Deviation of First Difference in EBITBankruptcy Costs BCInterest Expenses
=
6 The standard deviation is estimated from four years of EBIT.
9
Non Debt Tax Shield
Taxation and its relationship to capital structure is explicitly linked to the
applicable tax regime. Under the Australian imputation tax regime the tax
deductibility of interest is not expected to induce a preference for debt as it does under
a classical tax regime (Bishop et al., 2004). De Angelo and Masulis (1980) formalised
a framework whereby tax deductions that are not associated with debt (NDTS) act as
substitutes for interest deductions. These non-debt tax shields compete with interest
as a tax deduction. However, these non-debt tax shields are only going to compete for
interest in a classical tax environment. Therefore, for Australian organisations facing
an imputations tax system, interest will not provide the same tax benefit as under a
classical tax system.
In relation to MCs, they should be better equipped to arbitrage institutional
restrictions than DCs for the purpose of reducing their tax liabilities, particularly for
MCs that have subsidiaries in countries with a classical tax system. However, whether
NDTS are a determinant of leverage for MCs is unknown. The above arguments lead
to the following hypothesis:
H0 : There is no significant relationship between non debt tax shield and
leverage for:
• DCs • MCs
Following Bradley et al., (1984), Titman and Wessels (1988) and Barton et al.,
(1989), depreciation charges are used to indicate non-debt tax shields scaled with total
assets:
( ) Total Annual Depreciation ExpenseNon Debt Tax Shields NDTSTotal Assets
=
10
Profitability
Myer’s (1984) pecking order theory of capital structure shows that if a firm is
profitable then it is more likely that financing would be from internal sources rather
than external sources. The argument is based on costly external sources of capital.
More profitable firms are expected to have higher internal finances and hence, will
tend to hold less debt, since it is easier and more cost effective to finance internally.
Thus, this would suggest that there is a negative relationship between profitability and
debt.
In relation to MCs and DCs, MCs have better opportunities than DCs to earn
more profit mainly due to having access to more than one source of profit and better
chances to have favourable business conditions in particular countries (Kogut, 1985
and Barlett and Ghoshal, 1989). Consequently, this would suggest that MCs are more
profitable than DCs. This results in the following hypothesis:
H0: There is no significant relationship between profitability and leverage for:
• DCs • MCs
The variable chosen to measure profitability is the average net income to total
sales for the previous three years (Doukas and Pantzalis, 2003):
Profitability(PROF) = 3
3
t
s t
Net IncomeTotal Sales= −
∑
Size
Larger firms often have greater public exposure relative to smaller firms. This places
greater demands on larger firms to provide more information for customers, suppliers,
analysts and government bodies (Cooke, 1991). Provision of information is also
11
made easier because these larger firms possess the necessary resources to furnish
stakeholders with the relevant information and hence producing extra data at a
competitive cost than smaller firms (Cooke, 1991). In the presence of asymmetric
information between smaller and larger firms, larger firms will be able to issue debt at
more favourable rates relative to smaller firms. In additions, larger firms may be able
to reduce the transaction costs associated with debt issuance. The reason being is that
the transaction costs will be comparatively higher for smaller firms than for their
larger peers (Smith, 1977). Here the argument is that firm size can be viewed as a
proxy for information asymmetries between the firm and the market. So, a larger
firm’s corporate information is more easily available to public than a smaller firm
therefore cost of debt will be lower due to information asymmetries. Therefore a
positive relationship is expected between firm size and leverage. Many studies have
found firm size as a determinant of leverage including Scott and Martin (1975), Ferri
and Jones, 1979 and more recently Agrawal and Nagarajan (1990).
In relation to MCs and DC, it is expected that MCs are larger in size than DCs.
This leads to the following hypothesis:
H0 : There is no significant relationship between size and leverage for:
• DCs • MCs
The natural logarithm of total assets are considered as a proxy for size:
SIZE = ( )Ln Total Assets
Collateral Value of Assets
The tangibility of assets, or collateral value of assets held by a firm is a determinant of
leverage (Rajan and Zingalis, 1995). Firms with highly tangible assets or assets with
high collateral value can often borrow on relatively more favourable terms than firms
12
with high intangible assets or assets without collateral value. Firms with highly
intangible assets have relatively lower borrowing costs since the assets offer better
security for the debtholders (Graham, 2000). This would suggest that there is a
positive relationship between leverages and collateral value of assets.
In relation to MCs and DCs, it is uncertain whether the level of collateral
assets is higher or lower for MCs relative to DCs. This leads to the following
hypothesis:
H0 : There is no significant relationship between collateral value of
assets and leverage for:
• DCs • MCs
The ratio of fixed assets to total assets is used as a measure of collateral value
of assets (Chittenden et al., 1996 and Friend and Lang, 1988):
( ) = Fixed AssetsCollateral Value of Assets CVATotal Assets
Additional multinational corporate capital structure determinants
Diversification
It is often argued that the international diversification of earnings should
enable MCs to sustain a higher level of debt than DCs, without increasing their
default risk (Eiteman et al., 1998 and Shapiro, 1996). However, while it is believed
that there are several gains to be made by venturing into overseas markets, it can be
argued that continued foreign expansion has increasing risks. Erunza et al. (1999)
finds that the incremental gains from international diversification beyond home-made
diversification portfolios have diminished over time in a way consistent with changes
13
in investment barriers. For example, continued expansion has to contend with the
increasingly difficult prospect of managing a multicultural, multi-location workforce,
serving distinctly different customer markets, and navigating through a maze of
formidable constraints imposed by the number of locations where operations are
established. This will drive MCs to reduce leverage. This leads to the following
hypothesis:
H0: There is no significant relationship between the level of MCs
diversification and leverage.
Diversification is measured as the number of subsidiaries operating in
overseas countries (Tallman and Li, 1996 and Doukas and Pantzalis, 2003):
Diversification (DIVER) = number of overseas subsidiaries
Foreign Exchange Risk
The more sensitive a firm’s cash flow and earning are to foreign exchange rate
fluctuations, the lower the expected level of debt. This is essentially due to the
increases in expected costs of bankruptcy. Choi (1989) analysed the relationship
between foreign exchange risk and corporate financing decisions and reported that
foreign exchange risk affects significantly a firm’s financing decisions for
international investments. Therefore, it can be hypothesised that foreign exchange risk
is likely to affect MCs leverage. This leads to the following hypothesis:
H0 : There is no significant relationship between foreign exchange risk and
MCs leverage.
14
Exchange rate movements affect both the cash flows of a firm’s operations
and discount rate employed to value these cash flows (Bartov et al., 1996).7 Foreign
production and sales are two important determinants of exchange rate exposure for
any MC because exchange rate fluctuations directly impact the revenues and
production costs of the firm through these two channels. This study measures foreign
exchange risk exposure as per Wright et al. (2002):
( ) Total Foreign Subsidiaries SalesForeign Exchange Risk FXTotal Sales
=
Political Risk
Political risk (PR) is the chance that political events will have an adverse
effect on the operations and economic well being of the firm. The type of political
risk could be country specific or firm/industry specific and could include
expropriation of assets, trade controls, institutional ineffectiveness, threat of war,
social unrest, disorderly transfers of power, political violence, international disputes,
regime changes and regulatory restrictions (Jodice, 1985). Essentially, political risks
are the risks that wealth will be transferred from the stakeholders of the firm to
external parties, such as host governments. MCs that face higher political risk are
expected to have less leverage due to greater probability of wealth loss. This leads to
the following hypothesis:
H0 : There is no significant relationship between political risk and MCs
leverage.
7 Bartov et al. (1996) shows that there is an increase in the variability of equity returns following the period of increased exchange-rate variability. The results suggest that the increase in exchange-rate fluctuations is an indication of an increase in the riskiness of the MCs cash flows.
15
Political risk is measured as follows. Let C be the sample of companies and R
the set of different countries that companies in the sample operate from. Let Ic,r be
the revenue of company c coming from a particular country, r. The sum of revenues
for company c, from different countries is the sum of Ic,i. Pc,r is the proportion of
revenue from a particular country relative to the total revenue of company c.
Notationally this is as follows:
∑∈
=
Riic
rcrc I
IP
,
,,
For each country in which a company operates a political risk rating is
obtained from Handbook of Country and Political Risk Analysis (Llewellyn, 2001).
This is denoted as lambda (λi). The political risk rating is then multiplied by the
proportion of revenue from that particular country relative to the total revenue of the
company. This provides a measure of political risk faced by the MC. Notationally
this is as follows:
,
,,
( )=i c i
i Rc i c i
i R c ii R
IPolitical Risk PR P
I∈
∈∈
λγ = λ =
∑∑ ∑
The maximum value of the political risk rating variable is 100. This indicates a
low risk. A minimum value of zero indicates the riskiest political risk rating.
Other factors influencing capital structure determinants
Industry
Myers (1984) suggests that since asset risk, asset type, and requirements for
external funds vary by industry, debt ratios are also expected to vary from industry to
industry (Harris and Raviv, 1991 and Michaelas et al., 1999). It is known that some
16
industries are characterised by high leverage (for instance, capital-intensive
manufacturing firms, utilities) while others are known to have low leverage (for
instance, hi-tech companies, mining companies). However, there is considerable
disagreement concerning the strength of the industry effect on capital structures. The
influence of industry on leverage should be independent of multinationality or
domesticity of the firm. However, whether MCs and DCs are influenced in their
capital structure by the type of industry they operate is an empirical question. This
leads to the following hypothesis:
H20 : There is no significant industry effect on leverage for:
• DCs • MCs
To control for industry specific effects on firms’ capital structure choice, a
zero-one dummy is employed. To be consistent in industry effect on capital structure
across DCs and MCs, the Dow Jones Global Indexes (DJGI) - industry classification
is used to separate ten industry groups. DJGI classification contains ten main type of
industries. This is a sufficient classification without creating insufficient sample sizes
that accompany finer categorisations. The industry categories are:8
BSC= Basic materials; CYC= Consumer cyclical; NCY=Consumer non-
cyclical; ENE=Energy; HCR=Healthcare; IDU=Industrial; TEC=
Information technology; TLS= Telecommunications and UTI=Utilities.
Time variation
Capital structure does not stay constant over time (Bevan and Danbolt, 2002).
However, it is uncertain if Australian MCs or DCs have time variant leverage levels.
Therefore, to test the time variation of leverage the following hypothesis is proposed:
8 Financial industry is excluded.
17
H0: Leverage does not vary over time for:
• DCs • MCs
To measure time variation zero-one dummy variables identify individual years.
3. Data
All firms listed on the Australian Stock Exchange for each year from 1992 to
2001 were initially selected.
[Insert Table 1 about here]
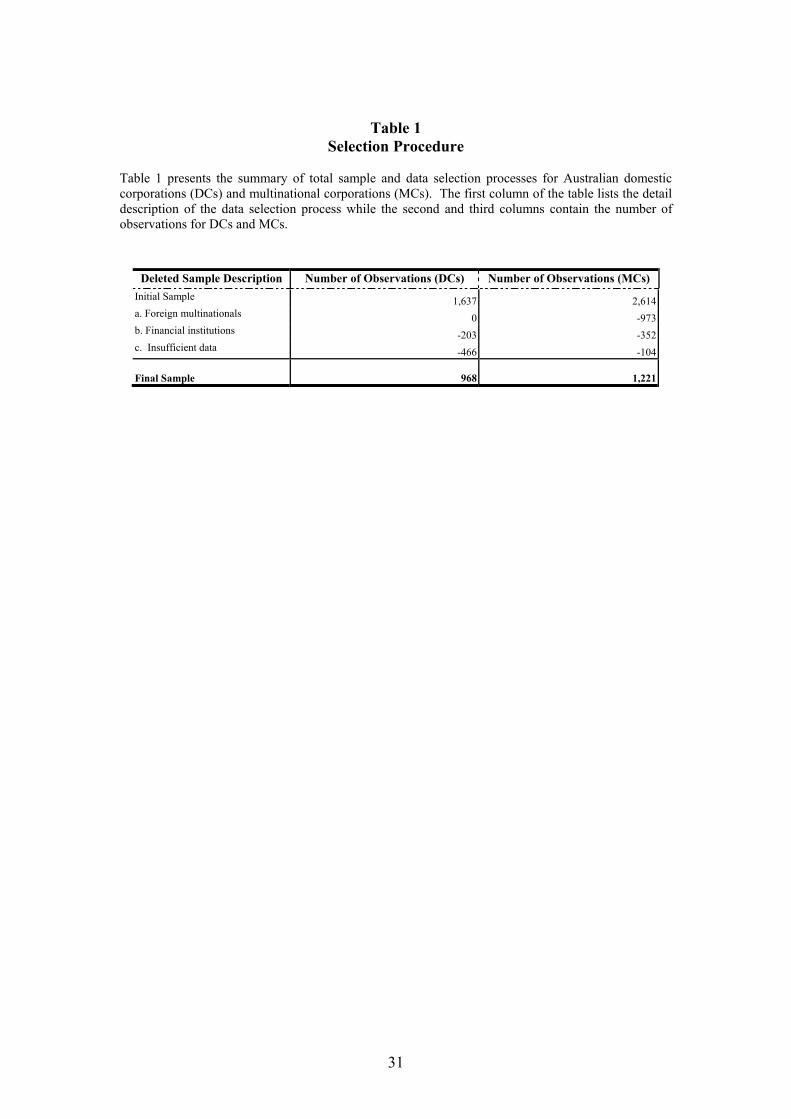
Table 1 outlines the process of sample selection. Initially 4,251 firms were
identified across the sample period (1,637+2,614). For each firm the Osiris database
was used to obtain annual balance sheet and income statement data. For each year, if
a firm reported business activity from other than Australian sources (that is, a non-
Australian geographical segment) it was coded as a multinational corporation (MC)
otherwise it was coded as a domestic corporation (DC). There were 1,637 DCs and
2,614 MCs selected across the 10 years. For each year this represents approximately
163 domestic corporations (1,637/10 years) and 261 multinational corporations
(2,614/10 years).
If business activity was reported in the balance sheet and income statement in
a foreign currency then it was classified as a foreign multinational and excluded. This
resulted in approximately 100 (973/10 years) corporations being excluded on average
each year as being foreign multinationals. Foreign multinationals were excluded
because capital structure determinants for foreign multinationals may be different than
those of Australian domiciled multinationals.
Firms in the financial industry have capital structures that are determined by
levels of deposits and financial regulation. Determinants of capital structure for these
18
firms are considerably different from other firms and as a result are also excluded.
There were approximately 20 DCs and 35 MCs excluded on this criterion.
Firms were also excluded if the Osiris database failed to provide sufficient
information for estimating the necessary variables. For example, a minimum of three
years of data is necessary for estimating some variables. This resulted in
approximately 66 DCs and 10 MCs being excluded. The final sample resulted in
selection of 968 DCs (approximately 97 domestic firms) and 1,221 MCs
(approximately 122 Australian multinational firms).
[Insert Table 2 about here]
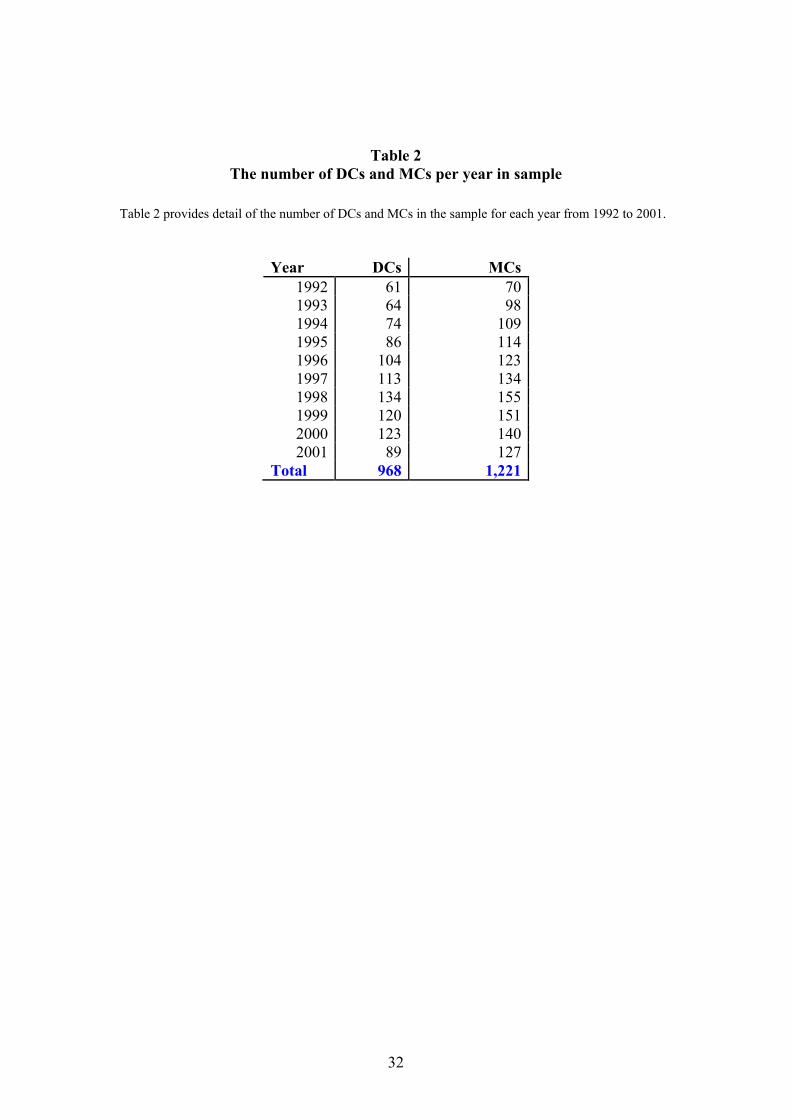
Table 2 presents the number of DCs and MCs in each year for the samples.
Table 2 shows that there has been a general increase in DCs per year in the sample up
to 1998.9 This is also the case for MCs up to 1998 when the number of MCs in the
sample began to fall. It is unclear why the number of Australian DCs and MCs has
fallen since 1998. Overall, in the sample there are more MCs than DCs in any year.
[Insert Table 3 about here]
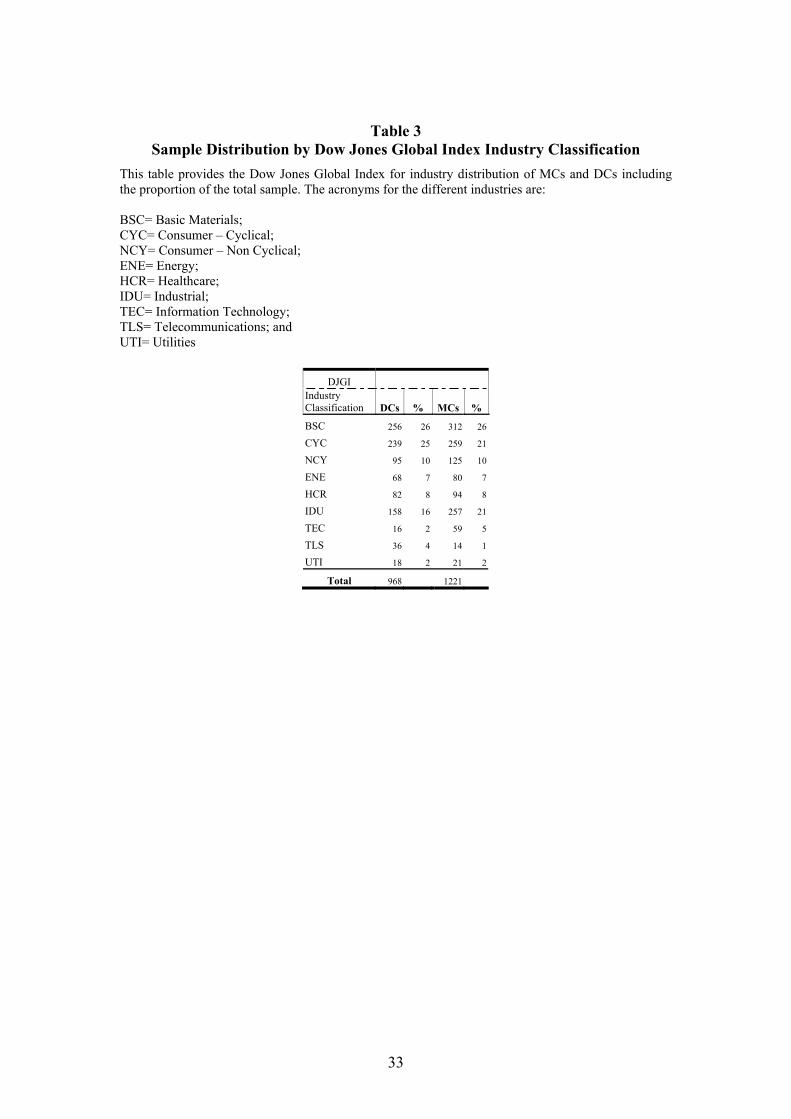
Table 3 reports the sample distribution of each industry classification for MCs and
DCs. Table 3 shows an almost equal distribution of sample selection across industries
between DCs and MCs. For example, the proportion of DCs that are in basic material
(BSC) and consumer cyclical (CYC) industries make up just over 50% of the DC
sample. The proportion of MCs in these two industries makes up approximately 47%
of MC sample.
9 The decrease in DCs in 2001 was due to the Osiris database not being updated at time of data collection.
19
[Insert Table 4 about here]
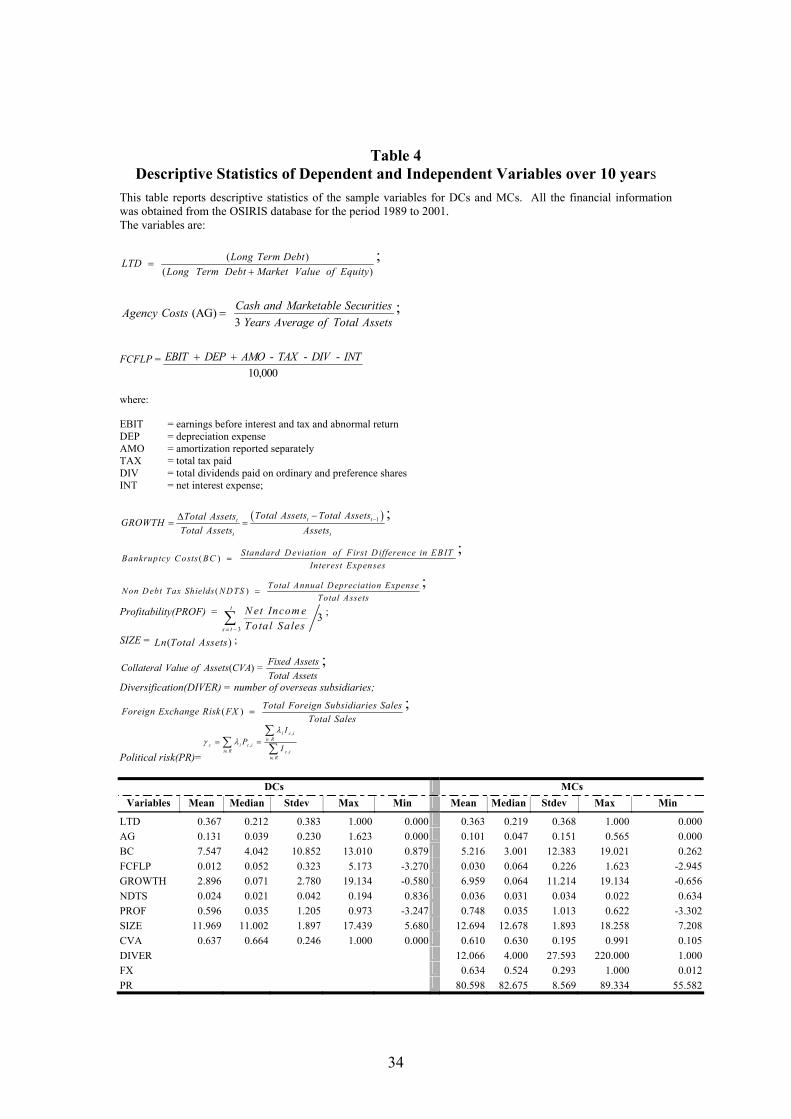
Table 4 contains descriptive statistics of the variables in the sample. It shows
that on average the leverage (LTD) is relatively similar between DCs and MCs (0.367
vs. 0.363). Also, on average, MCs agency costs-level of cash (AG), bankruptcy costs
(BC), collateral value of assets (CVA) are comparatively smaller than DCs (0.101 vs.
0.131; 5.216 vs. 7.547 and 0.610 vs. 0.637). Australian DCs also holds relatively
larger free cash flows (FCFLP) than MCs (5.173 vs. 1.623). Further, Australian MCs
have higher growth (GROWTH) opportunities and are more profitable (PROF) and
are also larger in size than Australian DCs counter parts (6.959 vs. 2.896; 0.748 vs.
0.596 and 12.694 vs. 11.969). The degree of international involvement of Australian
MCs ranges from one overseas subsidiary to 220 overseas subsidiaries. While a
foreign exchange ratio (FX) of 1 indicates the extremity of exposure, the mean of
0.634 indicates that Australian MCs have 63.4% of total sales from overseas sources.
The average ratings of political risk (PR) faced by an Australian MCs is 80. This
indicates that Australian MCs are facing relatively lower political risk, given 100 is
the lowest and 0 is the highest.
20
4. Method
A Tobit regression model is used to analyse the variables and explain capital
structure determinants. A Tobit model is appropriate due to the truncated leverage
variable (Rajan and Zingales, 1995). This paper adopts three different models to
investigate the DCs and MCs capital structure determinants. Model 1 is applicable to
Australian DCs:
LEVERAGE1 = α+β1AG+β2FCFLP+β3GROWTH+β4BC+β5NDTS+β6PROF+β7CVA…
+ β8 SIZE+εi
where:
Variables are as defined previously.
Model 2 is applicable to Australian MCs:
LEVERAGE2 =α+β1AG+β2FCFLP+β3GROWTH+β4BC+β5NDTS+β6PROF+β7CVA…
…+β8 SIZE++β9DIVER+β10FX+β11PR +εi
where:
Variables are as defined previously.
Model 3 is applicable to the combined sample of DCs and MCs:
LEVERAGE3 = α+β1AG+β2FCFLP+β3GROWTH+β4BC+β5NDTS+β6PROF+β7CVA…
…+β8SIZE+β9DIVER+β10FX+β11PR+δ12(D*AG)+ δ13(D*FCFLP)...
…+δ14(D*GROWTH)+ δ15(D*BC)+ δ16(D*NDTS)+ δ17(D*PROF)…
…+δ18(D*CVA)+ δ19(D*SIZE)+εi
where
D = a dummy variable equal to unity if the firm is a MC and zero otherwise; and
Other variables as defined previously.
The purpose of the dummy variable is to test if whether being a MC has a
different impact on leverage than being a DC for the eight common variables.
[Insert Table 5 about here]
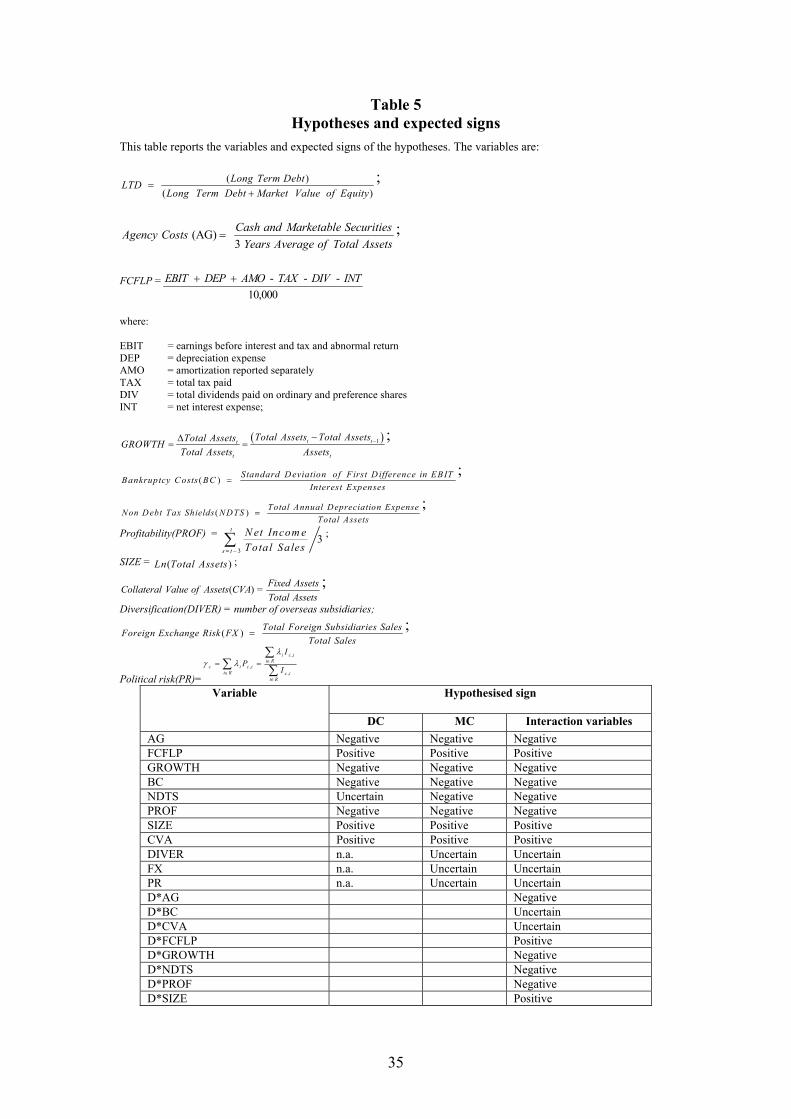
Table 5 provides a summary of the hypotheses and the expected sign for each
of the three models for each variable.
21
5. Results
A test of the difference in mean leverage for Australian DCs and MCs
provides a t-statistic of 0.258 (prob-value= 0.796). This indicates that the mean
leverage levels between Australian DCs and MCs is insignificantly different.
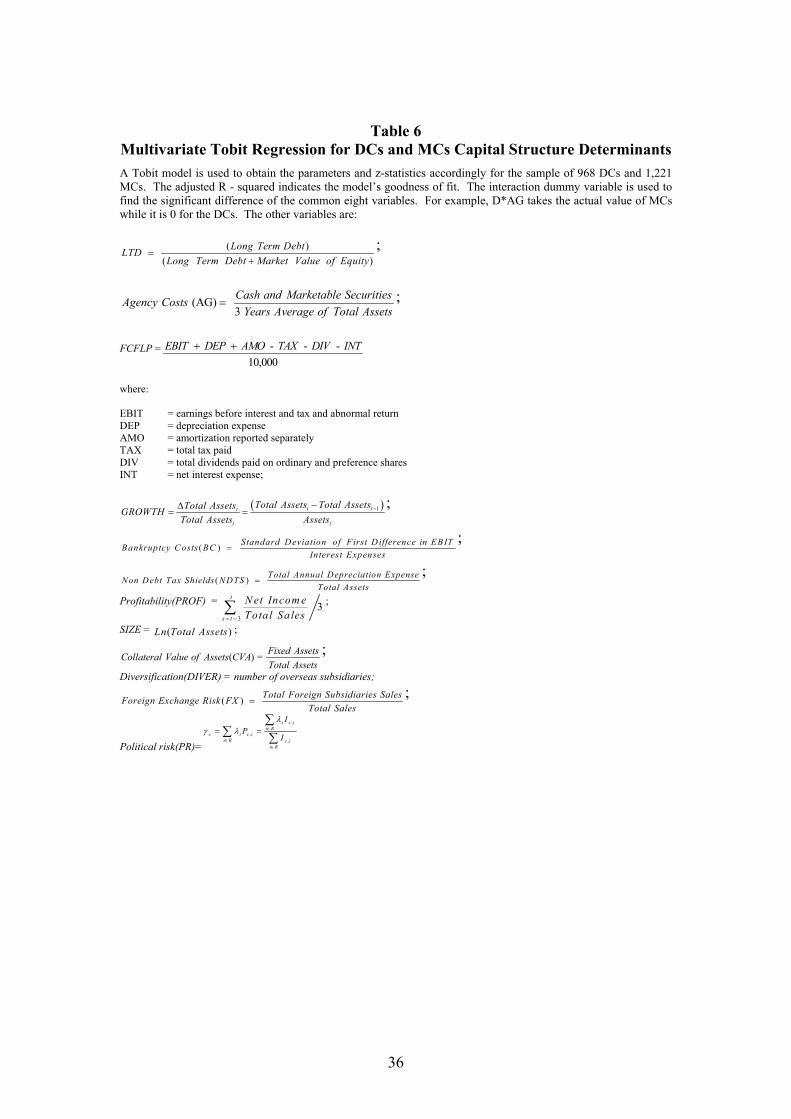
[Insert Table 6 about here]
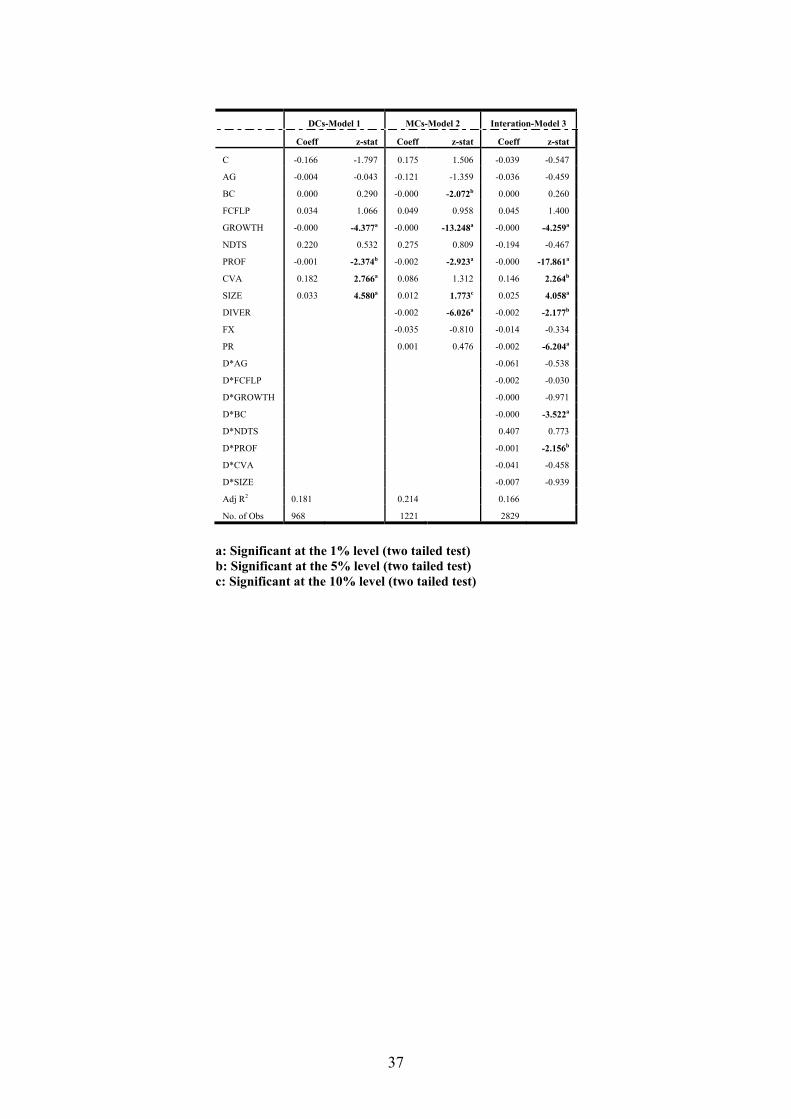
Table 6 presents the Tobit regression results for Models 1,2 and 3. The
adjusted R2 for each model is approximately 18%, 21% and 17% respectively. The
adjusted R2 in Model 2 compares to Burgman (1996) who report an adjusted R2 of
17.88% for a sample of US domiciled MCs.
Agency costs (AG) carry an expected sign for DCs (Model 1) and MCs
(Model 2). However, statistically it is not significant. The insignificant coefficient on
the interaction agency cost variable suggests that MCs agency costs relationship with
leverage is no different from DCs. This finding is inconsistent with Burgman (1996),
however the analysis is different as Burgman only conducted univariate. Burgman
finds agency costs higher and significant US MCs relative to US DCs.
The sign on the free cash flow variable (FCFLP) is positive but not significant.
This is inconsistent with Agarwal and Jayaraman (1994), Jaggi and Gul (1999) and
Filbeck and Gorman (2000) since they report a significant positive free cash flow
variable for US firms generally. However, these studies make no distinction between
DCs and MCs. The interaction variable on FCFLP is also insignificant, indicating no
difference between the effect of FCFLP and leverage between MCs and DCs.
The negative significant of growth variable (GROWTH) for both DCs (z = -
4.377) and MCs (z = -13.248) indicates that growth is inversely related to leverage.
22
This is result is supported by Titman and Wessels (1988), Chung (1993), Barcklay et
al. (1995) and Rajan and Zingalis (1995). The results for the interaction variable
show no support for MCs having significantly different growth opportunities
relationship with debt level relative to DCs.
The support of the bankruptcy cost hypothesis is found for MCs but not DCs.
This is consistent with Burgman (1996). For DCs (Model 1) the coefficient is
insignificant, for MCs (Model 2) the coefficient is negative and significant (z = -
2.072). The interaction variable is significant. That is, the higher the bankruptcy costs
the lower the leverage for MCs and there is a significant difference in the bankruptcy
costs relationship with leverage between DCs and MCs. This is consistent with
Burgman (1996) for US DCs and MCs.
The insignificant coefficient on the non-debt tax shield variable for DCs, MCs
and the interaction variable fails to allow the rejection of the hypothesis that non-debt
tax shields, such as depreciation have no significant impact on both DCs and MCs
leverage.
This result is consistent with the findings of Burgman (1996). Furthermore, no
support is found to suggest that Australian MCs have a better ability to shelter their
income from taxation.
The pecking order theory of Myers (1977) predicts that leverage will be
negatively related to profitability. The results provide strong support for this theory
with a negative and highly significant coefficient on the profitability variable (PROF)
for DCs (z = -2.374) and MCs (z = -2.923). This suggests that Australian DCs and
MCs prefer to avoid costly external financing and will rather take the opportunity to
use internal financing. Furthermore, the interaction variable is significantly negative
23
(z = -2.156) indicating that the relationship of MCs profitability with leverage is
significantly lower relative to DCs.
The significant positive coefficient on collateral value of assets variable
(CVA) for DCs (z= 2.766) supports the hypothesis of DCs with high collateral value
of assets having higher leverage. However, the results do not show similar support for
this hypothesis for MCs. Furthermore, no significant coefficient on the interaction
variable indicates that MCs do not have significantly different relationship with
collateral value of assets and leverage than DCs.
Consistent with the size argument, the size variable in the regressions of DCs
have highly significant positive coefficients for both DCs and MCs (z = 4.580 and z =
1.773). This suggests that the greater the firm size the higher the leverage. Further, it
is also found that the size relationship with leverage for Australian MCs is not
significantly different than DCs.
The diversification coefficient (DIVER) for MCs is negative and significant (z
= -6.026) suggesting that greater levels of diversification the lower the leverage. This
result is consistent with prior empirical work (Lee and Kwok, 1988; Burgman, 1996;
Homaifer et al., 1998).
The insignificant foreign exchange risk coefficient (FX) indicates that
Australian MCs are not prone to foreign exchange risk and therefore this is not a
significant factor to explain MCs leverage.
The insignificant political risk coefficient (PR) indicates that political risk for
Australian MCs also does not explain leverage.
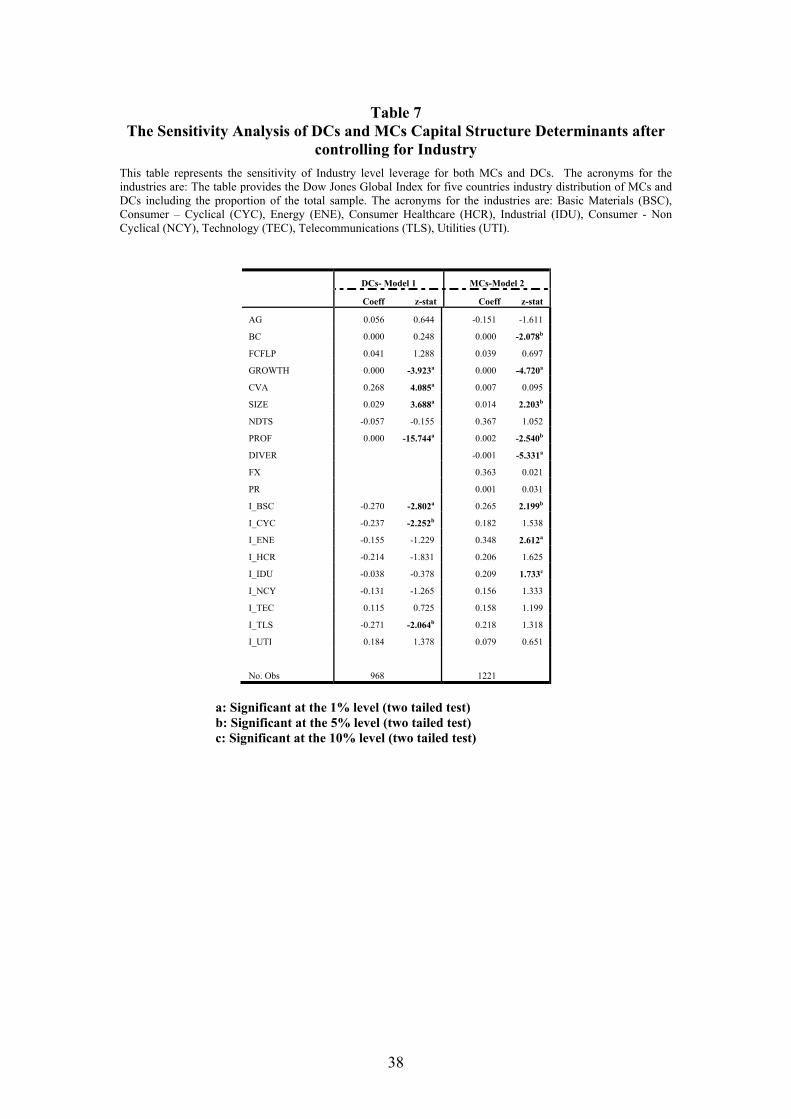
[Insert Table 7 about here]
24
Table 7 presents the sensitivity analysis of DCs and MCs capital structure
determinants after controlling for industry effects. The aim of this regression is to
identify any industry influence on capital structure. The results show that the
significance of each determinant that was found earlier (Table 6) is similar to the
significance of determinants in Table 7 for both DCs (Model 1) and MCs (Model 2).
This suggests that the initial findings are not biased by industry influence on capital
structure determinants. The significant industry coefficients for DCs (ie., I_BSC: z =
-2.802, I_CYC: z = -2.252 and I_TLS = -2.064) indicates that the Australian DCs that
belong to basic material, consumer cyclical and telecommunication industries have a
significant negative relationship with long term leverage. This means that if the DC
belongs to one of these industries they will have significant less leverage relative to
other industries.
Australian MCs that belong to basic material, energy and industrial industries
have significant positive relationships with leverage (z = 2.199; z = 2.612 and z =
1.733). This means that MCs in these industries will have relatively higher leverage
than MCs across industries. The findings of significant industry relationships with
leverage support the hypothesis that industries play a significant role on DCs and
MCs capital structure determination.
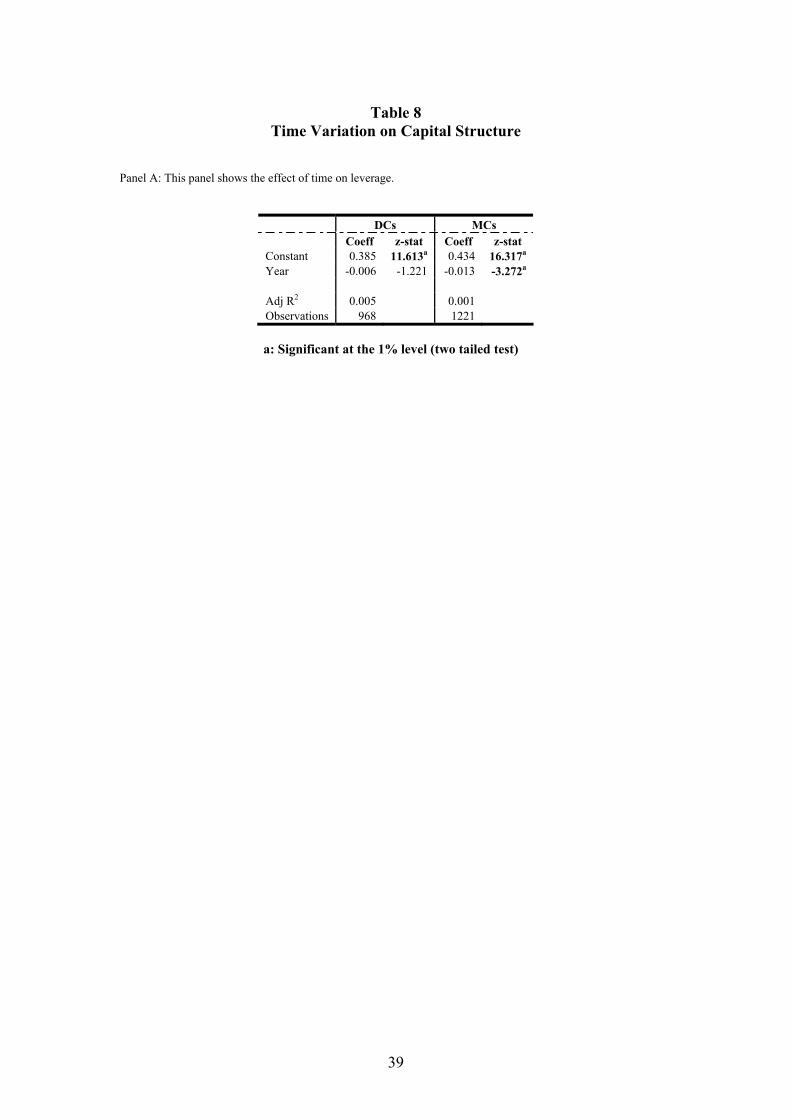
[Insert Table 8 about here]
Table 8 Panel A shows the effect of time on leverage for DCs and MCs across
10 years. Table 8 presents a univariate regression that tests the overall time effect on
leverage to investigate the hypothesis of whether time has any significant effect on
leverage. The result shows that over time DCs leverage decreases, however,
25
statistically it is not significant. On the other hand, MCs leverage is statistically
significant and negative (z = -3.272). This suggests that overall, time have negative
impact on MCs leverage, therefore, gradually MCs debt holding capacity will decline.
These findings support the time effect hypothesis for MCs but not for DCs. A further
analysis of individual year effects has also been investigated to identify whether time
effect has any significant variation in capital structure determinants, which might
cause to vary leverage over time.
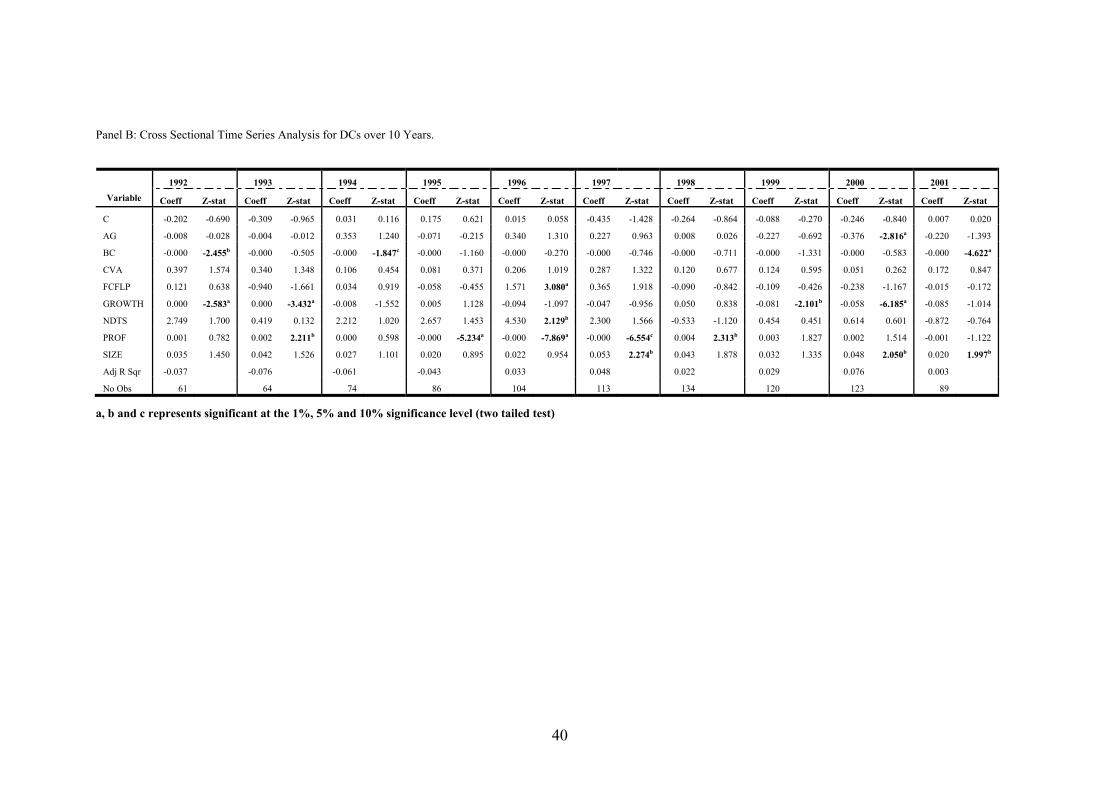
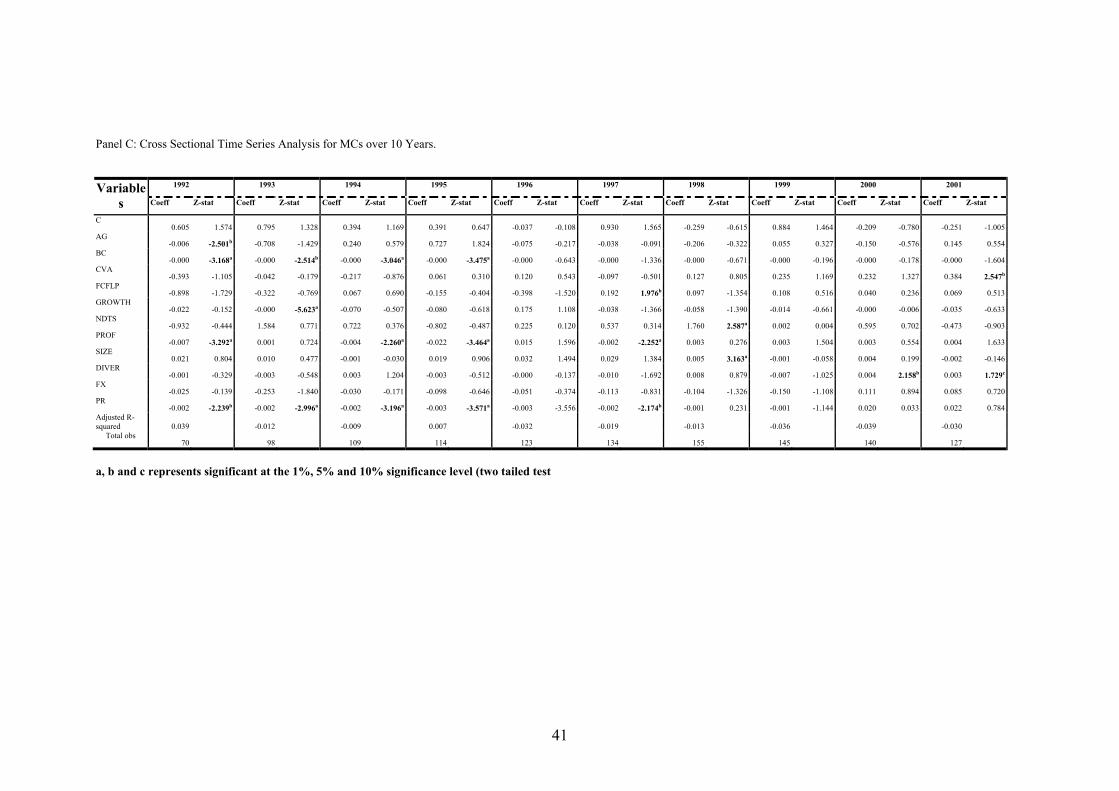
In order to investigate whether capital structure determinants are time
sensitive, individual yearly regression are conducted. This is presented in Table 8 –
Panel B (DCs) and Panel C (MCs). It shows that over time the significance of each of
the explanatory variables varies across years. For example, the bankruptcy cost (BC)
is found to be significant for DCs in 1992 and 1994 and 2001 while it remained
insignificant in the other years. Similarly, the bankruptcy costs for MCs is found to
be significant from 1992 to 1995 while the following years the impact of bankruptcy
costs to explain MCs leverage was not significant. In summary, Table 8 supports the
hypothesis that capital structure and its determinants vary over time.
6. Conclusion
This study has considered the significance of the determinants of capital
structure on a sample of Australian multinational corporations and Australian
domestic corporations over the period 1992 to 2001. The results show that the level of
leverage does not differ significantly between multinational and domestic
corporations. Using cross-sectional Tobit regression analysis the results show
considerable variation in capital structure determinants between multinational and
domestic corporations. For both types of organisations growth, profitability and size
26
are significant determinants of leverage. For domestic corporations collateral value of
assets is also a significant determinant of leverage. For multinationals bankruptcy
costs and the number of overseas subsidiaries is a significant determinant of leverage.
Surprisingly, bankruptcy costs are not significant for domestic corporations. In
relation to interaction effects, bankruptcy costs and profitability are significant in
explaining multinational leverage relative to domestic leverage.
When industry effects were considered the significance of the original
determinants remained constant however, some industries became significant. The
industry effect was not consistent across domestic and multinational corporations.
In relation to time variation in leverage and the determinants of capital
structure, both varied across domestic and multinationals over the sample period.
27
Bibliography
Agmon, T. and Lessard D., 1977, “Investor Recognition of Corporate International Diversification”, Journal of Finance, 32, pp. 1049-1055.
Agrawal, A. and Nagarajan, N.J., 1990, “Corporate Capital Structure, Agency Costs
and Ownership Control: The Case Of All-Equity Firms”, Journal of Finance, 45(4), pp. 1325-1331.
Armstrong, V. and Riddick L., 1998, “Legal and Economic Effects on Finn Value
Created by Differences in Bankruptcy Law among Countries”, Working Paper, Washington State Universit, pp. 1-35.
Barlett, C.A. and Ghoshal, S., 1989, “Managing Across Borders: The Transnationals
Solution”, Cambridge, MA, Harvard Business School Press. Barton, S.L., Hill, N.C. and Sundaram, S., 1989, “An Empirical Test of Stakeholder
Theory Predictions of Capital Structure”, Financial Management, 18(1), pp. 36-44.
Bartov, E., Bodnar, G. and Kaul, A., 1996, Exchange Rate Variability and the
Riskiness of US Multinational Firms: Evidence from the Breakdown of Bretton Woods, Journal of Financial Economics, 42, pp. 105-132.
Bevan, A.A. and Danbolt, Jo., 2002, “Capital Structure And Its Determinants in the
UK - A Decompositional Analysis”, Applied Financial Economics, 12(3), pp. 159-170.
Bishop, S., Faff, R., Oliver, B. and Twite, G., 2004, Corporate Finance, 5th ed,
Pearson Education. Australia. Bradley, M., Jarrell, G. and Kim, E.H., 1984, “On the Existence of an Optimal Capital
Structure: Theory and Evidence”, Journal of Finance, 39, pp. 857 - 878. Burgman, T.A., 1996, “An Empirical Examination of Multinational Corporate Capital
Structure”, Journal of International Business Studies, 27(3), pp. 553-557. Chen, C.J.P., Cheng, A., He, N., and Kim, J., 1997, “An Investigation of the
Relationship Between International Activities and Capital Structure”, Journal of International Business Studies, 23(3), pp. 563-577.
Chittenden, F., Hall G. and Hutchinson, P., 1996, “Small Firm Growth, Access to
Capital Markets and Financial Structure: Review of Issues and an Empirical Investigation”, Small Business Economics, 8(1), pp. 59-67.
Chkir, I.E. and Jean-Clause C., 2001, “Diversification Strategy and Capital Structure
of Multinational Corporations,” Journal of Multinational Financial Management, 11, pp. 17-37.
28
Choi, Y.Y., 1989, “Cross-Technology Trade and the Positive Sum Effect”, International Economic Journal, 3(2), pp. 57-72.
Chung, K.H., (1993), “Asset Characteristics and Corporate Debt Policy: An Empirical
Test”, Journal of Business Finance and Accounting, 20(1), pp. 83-97. Cooke, T.E., 1991, An Assessment of Voluntary Disclosure in the annual report of
Japanese Corporations”, The International Journal of Accounting, 26(3), pp. 174 – 189.
De Angelo, H. and. Masulis R.W., 1980, “Leverage and Dividend Irrelevancy under
Corporate and Personal Taxation," Journal of Finance, 35(2), pp. 453-464. Doukas, J.A. and Pantzalis, C., 2003, “Geographic Diversification and Agency Costs
of Debt of Multinational Firms”, Journal of Corporate Finance, 9, pp. 59-92. Eiteman, D.K., Stonehill, A.I. and Moffett, H. Michael, 1998, Multinational Business
Finance, 8th edition, Addison-Wesley, pp. 583-606. Erunza, V., Hogan, K. and Hung, M.W., 1999, “Can The Gains From International
Diversification Be Achieved Without Trading Abroad?”, Journal of Finance, 54(6), pp. 2075-2107.
Fama, E., 1980, “Agency Problems and Theory of the Firm”, Journal of Political
Economy, 88(2), pp. 288-307. Fama, E.F. and French, K.R., 1998, “Value versus Growth: The International
Evidence”, Journal of Finance, 53, pp. 1975 – 1999. Ferri, M.G. and Jones, W.H., 1979, “Determinant of Financial Structure: A New
Methodological Approach, Journal of Finance, 34, pp. 631-644. Filbeck, G. and Gorman, R., 2000, “If Built To Last, are They Built For Value?”,
Journal of Investing, 9(3), pp. 43-54. Friend, I. and Lang, L.H., 1988, “An Empirical Test of the Impact of Managerial Self-
Interest on Corporate Capital Structure”, Journal of Finance, 43, pp. 271- 281. Graham, J.R., 2000, “How Big Are the Tax Benefits of Debt?”, The Journal of
Finance, 55 (5), pp. 1901-1939. Harris, M. and Raviv, A., 1991, “The Theory of Capital Structure”, Journal of
Finance, 49, pp. 297-355. Homaifer, G., Zietz, J. and Benkato, O., 1998, “Determinants of Capital Structure In
Multinational and Domestic Corporations”, Economia Interazionale, 51(2), pp. 189-210.
29
Hughes, J. S., Logue, D. E., Sweeney, R. J., 1975, “Corporate International Diversification and Market Assigned Measure of Risk and Diversification”, Journal of Financial and Quantitative Analysis, 10(4), pp. 627-637.
Jaggi, B. and Gul, F.A., 1999, “An Analysis of Joint Effects of Investment
Opportunity Set, Free Cash Flows and Size on Corporate Debt Policy”, Review of Quantitative Finance and Accounting, 12(4,Jun), pp. 371-381.
Jensen, G.R., Donald P.S. and Thomas S. Z., 1992, “Simultaneous Determination of
Insider Ownership, Debt, and Dividend Policies”, Journal of Financial and Quantitative Analysis, 27(2), pp. 247-264.
Jensen, M.C., 1986, “Agency Costs of Free Cash Flow, Corporate Finance and Take-
Overs”, American Economic Review, 76, pp. 323- 339. Jensen, M.C. and Meckling, W.H., 1976, “Theory of the Firm: Managerial Behaviour,
Agency Costs and Ownership Structure”, Journal of Financial Economics, 3, pp. 305-360.
Jodice, D. 1985, Political Risk Assessment: An Annotated Biography, Greenwood
Press,Westport. Kim, W.S. and Lyn, E.O., 1986, “Excess Market Value, the Multinational
Corporation, and Tobin’s Q-Ratio”, Journal of International Business Studies, 19(2), pp. 195-217.
Kogut, B., 1985, “The Multinational Corporations in 1980’s”, MIT, Press,
Cambridge, MA. Lee, K. and Kwok C.Y., 1988, “Multinational Corporations vs. Domestic
Corporations: International Environmental Factors and Determinants of Capital Structure”, Journal of International Business Studies, 19, pp. 195-217.
Lehn, K. and Poulsen, A., 1989, “Free Cash Flow and Stockholder Gains in Going
Private Transactions”, Journal of Finance, 3, pp. 771-787. Llewellyn D. H., 2001, “The Handbook of Country and Political Risk Analysis”, 3rd
Edition, The PRS Group. Mehran, H., 1992, “Executive Incentive Plans, Corporate Control and Capital
Structure”, Journal of Financial and Quantitative Analysis, 27(4), pp. 539-560. Michaelas, N., Chittenden, F. and Poutziouris, F., 1999, “Financial Policy and Capital
Structure Choice in U.K. SMEs: Empirical Evidence from Company Panel Data, Small Business Economics, 12, pp. 113 – 130.
Michel, A. and Shaked A., 1986, “Multinational Corporations vs. Domestic
Corporations: Financial Performance and Characteristics”, Journal of International Business Studies, 16, pp. 89-106.
30
Modigliani, F. and Miller, M.H., 1958, “The Cost of Capital, Corporation Finance and the Theory of Investment”, American Economic Review, 53, pp. 261-297.
Myers, S.C., 1984, “The Capital Structure Puzzle”, Journal of Finance, 39, pp. 575-
592. Myers, S.C., 1977, “Determinants of Corporate Borrowings”, Journal of Financial
Economics, 13, pp. 187-221. Rajan, R.G., Zingales, L., 1995, “What Do We Know about Capital Structure? Some
Evidence from International Data”, Journal of Financial Economics, 51, pp. 1421-1460.
Reeb, D., 1998, “The Relative Cost of Financial Distress in the International Firm”,
Advances in International Banking and Finance, pp. 339-54. Rugman, A.M., 1976, “Discussion: Corporate International Diversification and
Market Assigned Measures of Risk and Diversification (in Capital Budgeting Decisions)”, Journal of Financial and Quantitative Analysis,10(4), pp. 651-652.
Scott, D.F., Jr. and Martin, J.D., 1975, “Industry Influence On Financial Structure”,
Financial Management, 4(1), pp. 67-73. Shapiro, A.C, 1996, “Multinational Financial Management”, 5th edition, New Jersey:
Prentice-Hall. Smith, C., 1977, “Alternative Methods for Raising Capital: Rights vs. Underwritten
Offerings”, Journal of Financial Economics, 5, pp. 273-307. Titman, S., 1984, “The Effect of Capital Structure on a Firm’s Liquidation Decision”,
Journal of Financial Economics, 13, pp.137-151. Titman, S., Wessels, R., 1988, “The Determinants of Capital Structure Choice”,
Journal of Finance, 43, pp. 1-18. Wright, F.W., Madura, J. and Wiant K.J., 2002, “The Differential Effects of Agency
Costs on Multinational Corporations”, Applied Financial Economics, 12(5, May), pp. 347-359.
31
Table 1 Selection Procedure
Table 1 presents the summary of total sample and data selection processes for Australian domestic corporations (DCs) and multinational corporations (MCs). The first column of the table lists the detail description of the data selection process while the second and third columns contain the number of observations for DCs and MCs.
Deleted Sample Description Number of Observations (DCs) Number of Observations (MCs) Initial Sample 1,637 2,614a. Foreign multinationals 0 -973b. Financial institutions -203 -352c. Insufficient data -466 -104 Final Sample 968 1,221
32
Table 2 The number of DCs and MCs per year in sample
Table 2 provides detail of the number of DCs and MCs in the sample for each year from 1992 to 2001.
Year DCs MCs1992 61 701993 64 981994 74 1091995 86 1141996 104 1231997 113 1341998 134 1551999 120 1512000 123 1402001 89 127
Total 968 1,221
33
Table 3 Sample Distribution by Dow Jones Global Index Industry Classification
This table provides the Dow Jones Global Index for industry distribution of MCs and DCs including the proportion of the total sample. The acronyms for the different industries are: BSC= Basic Materials; CYC= Consumer – Cyclical; NCY= Consumer – Non Cyclical; ENE= Energy; HCR= Healthcare; IDU= Industrial; TEC= Information Technology; TLS= Telecommunications; and UTI= Utilities
DJGI Industry Classification DCs % MCs %
BSC 256 26 312 26
CYC 239 25 259 21
NCY 95 10 125 10
ENE 68 7 80 7
HCR 82 8 94 8
IDU 158 16 257 21
TEC 16 2 59 5
TLS 36 4 14 1
UTI 18 2 21 2
Total 968 1221
34
Table 4 Descriptive Statistics of Dependent and Independent Variables over 10 years
This table reports descriptive statistics of the sample variables for DCs and MCs. All the financial information was obtained from the OSIRIS database for the period 1989 to 2001. The variables are:
( ) ( )
Long Term DebtLTDLong Term Debt Market Value of Equity
=+
;
(AG) 3 Cash and Marketable SecuritiesAgency Costs
Years Average of Total Assets= ;
FCFLP = - - - 10,000
EBIT DEP AMO TAX DIV INT+ +
where:
EBIT = earnings before interest and tax and abnormal return DEP = depreciation expense AMO = amortization reported separately TAX = total tax paid DIV = total dividends paid on ordinary and preference shares INT = net interest expense;
( )1
t tt
t t
Total Assets Total AssetsTotal AssetsGROWTHTotal Assets Assets
−−∆= =
;
( )
Standard D eviation of First D ifference in EBITBankruptcy C osts BCInterest Expenses
=;
( ) Total Annual Depreciation ExpenseNon Debt Tax Shields N DTSTotal Assets
=;
Profitability(PROF) = 3
3
t
s t
N et Incom eT ota l Sa les= −
∑ ;
SIZE = ( )Ln Total Assets ;
( ) =
Fixed AssetsCollateral Value of Assets CVATotal Assets
; Diversification(DIVER) = number of overseas subsidiaries;
( ) Total Foreign Subsidiaries SalesForeign Exchange Risk FXTotal Sales
=;
Political risk(PR)=∑∑
∑∈
∈
∈
==
Riic
Riici
Riicic I
IP
,
,
,
λλγ
DCs MCs Variables Mean Median Stdev Max Min Mean Median Stdev Max Min
LTD 0.367 0.212 0.383 1.000 0.000 0.363 0.219 0.368 1.000 0.000AG 0.131 0.039 0.230 1.623 0.000 0.101 0.047 0.151 0.565 0.000BC 7.547 4.042 10.852 13.010 0.879 5.216 3.001 12.383 19.021 0.262FCFLP 0.012 0.052 0.323 5.173 -3.270 0.030 0.064 0.226 1.623 -2.945GROWTH 2.896 0.071 2.780 19.134 -0.580 6.959 0.064 11.214 19.134 -0.656NDTS 0.024 0.021 0.042 0.194 0.836 0.036 0.031 0.034 0.022 0.634PROF 0.596 0.035 1.205 0.973 -3.247 0.748 0.035 1.013 0.622 -3.302SIZE 11.969 11.002 1.897 17.439 5.680 12.694 12.678 1.893 18.258 7.208CVA 0.637 0.664 0.246 1.000 0.000 0.610 0.630 0.195 0.991 0.105DIVER 12.066 4.000 27.593 220.000 1.000FX 0.634 0.524 0.293 1.000 0.012PR 80.598 82.675 8.569 89.334 55.582
35
Table 5 Hypotheses and expected signs
This table reports the variables and expected signs of the hypotheses. The variables are:
( ) ( )
Long Term DebtLTDLong Term Debt Market Value of Equity
=+
;
(AG) 3 Cash and Marketable SecuritiesAgency Costs
Years Average of Total Assets= ;
FCFLP = - - - 10,000
EBIT DEP AMO TAX DIV INT+ +
where:
EBIT = earnings before interest and tax and abnormal return DEP = depreciation expense AMO = amortization reported separately TAX = total tax paid DIV = total dividends paid on ordinary and preference shares INT = net interest expense;
( )1
t tt
t t
Total Assets Total AssetsTotal AssetsGROWTHTotal Assets Assets
−−∆= =
;
( )
Standard D eviation of First D ifference in EBITBankruptcy C osts BCInterest Expenses
=;
( ) Total Annual Depreciation ExpenseNon Debt Tax Shields N DTSTotal Assets
=;
Profitability(PROF) = 3
3
t
s t
N et Incom eT ota l Sa les= −
∑ ;
SIZE = ( )Ln Total Assets ;
( ) =
Fixed AssetsCollateral Value of Assets CVATotal Assets
; Diversification(DIVER) = number of overseas subsidiaries;
( ) Total Foreign Subsidiaries SalesForeign Exchange Risk FXTotal Sales
=;
Political risk(PR)=∑∑
∑∈
∈
∈
==
Riic
Riici
Riicic I
IP
,
,
,
λλγ
Hypothesised sign Variable
DC MC Interaction variables AG Negative Negative Negative FCFLP Positive Positive Positive GROWTH Negative Negative Negative BC Negative Negative Negative NDTS Uncertain Negative Negative PROF Negative Negative Negative SIZE Positive Positive Positive CVA Positive Positive Positive DIVER n.a. Uncertain Uncertain FX n.a. Uncertain Uncertain PR n.a. Uncertain Uncertain D*AG Negative D*BC Uncertain D*CVA Uncertain D*FCFLP Positive D*GROWTH Negative D*NDTS Negative D*PROF Negative D*SIZE Positive
36
Table 6 Multivariate Tobit Regression for DCs and MCs Capital Structure Determinants A Tobit model is used to obtain the parameters and z-statistics accordingly for the sample of 968 DCs and 1,221 MCs. The adjusted R - squared indicates the model’s goodness of fit. The interaction dummy variable is used to find the significant difference of the common eight variables. For example, D*AG takes the actual value of MCs while it is 0 for the DCs. The other variables are:
( ) ( )
Long Term DebtLTDLong Term Debt Market Value of Equity
=+
;
(AG) 3 Cash and Marketable SecuritiesAgency Costs
Years Average of Total Assets= ;
FCFLP = - - - 10,000
EBIT DEP AMO TAX DIV INT+ +
where:
EBIT = earnings before interest and tax and abnormal return DEP = depreciation expense AMO = amortization reported separately TAX = total tax paid DIV = total dividends paid on ordinary and preference shares INT = net interest expense;
( )1
t tt
t t
Total Assets Total AssetsTotal AssetsGROWTHTotal Assets Assets
−−∆= =
;
( )
Standard D eviation of First D ifference in EBITBankruptcy C osts BCInterest Expenses
=;
( ) Total Annual Depreciation ExpenseNon Debt Tax Shields NDTSTotal Assets
=;
Profitability(PROF) = 3
3
t
s t
N et Incom eT ota l Sa les= −
∑ ;
SIZE = ( )Ln Total Assets ;
( ) =
Fixed AssetsCollateral Value of Assets CVATotal Assets
; Diversification(DIVER) = number of overseas subsidiaries;
( ) Total Foreign Subsidiaries SalesForeign Exchange Risk FXTotal Sales
=;
Political risk(PR)=∑∑
∑∈
∈
∈
==
Riic
Riici
Riicic I
IP
,
,
,
λλγ
37
DCs-Model 1 MCs-Model 2 Interation-Model 3
Coeff z-stat Coeff z-stat Coeff z-stat
C -0.166 -1.797 0.175 1.506 -0.039 -0.547
AG -0.004 -0.043 -0.121 -1.359 -0.036 -0.459
BC 0.000 0.290 -0.000 -2.072b 0.000 0.260
FCFLP 0.034 1.066 0.049 0.958 0.045 1.400
GROWTH -0.000 -4.377a -0.000 -13.248a -0.000 -4.259a
NDTS 0.220 0.532 0.275 0.809 -0.194 -0.467
PROF -0.001 -2.374b -0.002 -2.923a -0.000 -17.861a
CVA 0.182 2.766a 0.086 1.312 0.146 2.264b
SIZE 0.033 4.580a 0.012 1.773c 0.025 4.058a
DIVER -0.002 -6.026a -0.002 -2.177b
FX -0.035 -0.810 -0.014 -0.334
PR 0.001 0.476 -0.002 -6.204a
D*AG -0.061 -0.538
D*FCFLP -0.002 -0.030
D*GROWTH -0.000 -0.971
D*BC -0.000 -3.522a
D*NDTS 0.407 0.773
D*PROF -0.001 -2.156b
D*CVA -0.041 -0.458
D*SIZE -0.007 -0.939
Adj R2 0.181 0.214 0.166
No. of Obs 968 1221 2829
a: Significant at the 1% level (two tailed test) b: Significant at the 5% level (two tailed test) c: Significant at the 10% level (two tailed test)
38
Table 7 The Sensitivity Analysis of DCs and MCs Capital Structure Determinants after
controlling for Industry This table represents the sensitivity of Industry level leverage for both MCs and DCs. The acronyms for the industries are: The table provides the Dow Jones Global Index for five countries industry distribution of MCs and DCs including the proportion of the total sample. The acronyms for the industries are: Basic Materials (BSC), Consumer – Cyclical (CYC), Energy (ENE), Consumer Healthcare (HCR), Industrial (IDU), Consumer - Non Cyclical (NCY), Technology (TEC), Telecommunications (TLS), Utilities (UTI).
DCs- Model 1 MCs-Model 2
Coeff z-stat Coeff z-stat
AG 0.056 0.644 -0.151 -1.611
BC 0.000 0.248 0.000 -2.078b
FCFLP 0.041 1.288 0.039 0.697
GROWTH 0.000 -3.923a 0.000 -4.720a
CVA 0.268 4.085a 0.007 0.095
SIZE 0.029 3.688a 0.014 2.203b
NDTS -0.057 -0.155 0.367 1.052
PROF 0.000 -15.744a 0.002 -2.540b
DIVER -0.001 -5.331a
FX 0.363 0.021
PR 0.001 0.031
I_BSC -0.270 -2.802a 0.265 2.199b
I_CYC -0.237 -2.252b 0.182 1.538
I_ENE -0.155 -1.229 0.348 2.612a
I_HCR -0.214 -1.831 0.206 1.625
I_IDU -0.038 -0.378 0.209 1.733c
I_NCY -0.131 -1.265 0.156 1.333
I_TEC 0.115 0.725 0.158 1.199
I_TLS -0.271 -2.064b 0.218 1.318
I_UTI 0.184 1.378 0.079 0.651
No. Obs 968 1221
a: Significant at the 1% level (two tailed test) b: Significant at the 5% level (two tailed test) c: Significant at the 10% level (two tailed test)
39
Table 8 Time Variation on Capital Structure
Panel A: This panel shows the effect of time on leverage.
DCs MCs Coeff z-stat Coeff z-stat Constant 0.385 11.613a 0.434 16.317a
Year -0.006 -1.221 -0.013 -3.272a
Adj R2 0.005 0.001 Observations 968 1221 a: Significant at the 1% level (two tailed test)
40
Panel B: Cross Sectional Time Series Analysis for DCs over 10 Years.
1992 1993 1994 1995 1996 1997 1998 1999 2000 2001
Variable Coeff Z-stat Coeff Z-stat Coeff Z-stat Coeff Z-stat Coeff Z-stat Coeff Z-stat Coeff Z-stat Coeff Z-stat Coeff Z-stat Coeff Z-stat
C -0.202 -0.690 -0.309 -0.965 0.031 0.116 0.175 0.621 0.015 0.058 -0.435 -1.428 -0.264 -0.864 -0.088 -0.270 -0.246 -0.840 0.007 0.020
AG -0.008 -0.028 -0.004 -0.012 0.353 1.240 -0.071 -0.215 0.340 1.310 0.227 0.963 0.008 0.026 -0.227 -0.692 -0.376 -2.816a -0.220 -1.393
BC -0.000 -2.455b -0.000 -0.505 -0.000 -1.847c -0.000 -1.160 -0.000 -0.270 -0.000 -0.746 -0.000 -0.711 -0.000 -1.331 -0.000 -0.583 -0.000 -4.622a
CVA 0.397 1.574 0.340 1.348 0.106 0.454 0.081 0.371 0.206 1.019 0.287 1.322 0.120 0.677 0.124 0.595 0.051 0.262 0.172 0.847
FCFLP 0.121 0.638 -0.940 -1.661 0.034 0.919 -0.058 -0.455 1.571 3.080a 0.365 1.918 -0.090 -0.842 -0.109 -0.426 -0.238 -1.167 -0.015 -0.172
GROWTH 0.000 -2.583a 0.000 -3.432a -0.008 -1.552 0.005 1.128 -0.094 -1.097 -0.047 -0.956 0.050 0.838 -0.081 -2.101b -0.058 -6.185a -0.085 -1.014
NDTS 2.749 1.700 0.419 0.132 2.212 1.020 2.657 1.453 4.530 2.129b 2.300 1.566 -0.533 -1.120 0.454 0.451 0.614 0.601 -0.872 -0.764
PROF 0.001 0.782 0.002 2.211b 0.000 0.598 -0.000 -5.234a -0.000 -7.869a -0.000 -6.554c 0.004 2.313b 0.003 1.827 0.002 1.514 -0.001 -1.122
SIZE 0.035 1.450 0.042 1.526 0.027 1.101 0.020 0.895 0.022 0.954 0.053 2.274b 0.043 1.878 0.032 1.335 0.048 2.050b 0.020 1.997b
Adj R Sqr -0.037 -0.076 -0.061 -0.043 0.033 0.048 0.022 0.029 0.076 0.003
No Obs 61 64 74 86 104 113 134 120 123 89 a, b and c represents significant at the 1%, 5% and 10% significance level (two tailed test)
41
Panel C: Cross Sectional Time Series Analysis for MCs over 10 Years.
1992 1993 1994 1995 1996 1997 1998 1999 2000 2001 Variables Coeff Z-stat Coeff Z-stat Coeff Z-stat Coeff Z-stat Coeff Z-stat Coeff Z-stat Coeff Z-stat Coeff Z-stat Coeff Z-stat Coeff Z-stat
C 0.605 1.574 0.795 1.328 0.394 1.169 0.391 0.647 -0.037 -0.108 0.930 1.565 -0.259 -0.615 0.884 1.464 -0.209 -0.780 -0.251 -1.005
AG -0.006 -2.501b -0.708 -1.429 0.240 0.579 0.727 1.824 -0.075 -0.217 -0.038 -0.091 -0.206 -0.322 0.055 0.327 -0.150 -0.576 0.145 0.554
BC -0.000 -3.168a -0.000 -2.514b -0.000 -3.046a -0.000 -3.475a -0.000 -0.643 -0.000 -1.336 -0.000 -0.671 -0.000 -0.196 -0.000 -0.178 -0.000 -1.604
CVA -0.393 -1.105 -0.042 -0.179 -0.217 -0.876 0.061 0.310 0.120 0.543 -0.097 -0.501 0.127 0.805 0.235 1.169 0.232 1.327 0.384 2.547b
FCFLP -0.898 -1.729 -0.322 -0.769 0.067 0.690 -0.155 -0.404 -0.398 -1.520 0.192 1.976b 0.097 -1.354 0.108 0.516 0.040 0.236 0.069 0.513
GROWTH -0.022 -0.152 -0.000 -5.623a -0.070 -0.507 -0.080 -0.618 0.175 1.108 -0.038 -1.366 -0.058 -1.390 -0.014 -0.661 -0.000 -0.006 -0.035 -0.633
NDTS -0.932 -0.444 1.584 0.771 0.722 0.376 -0.802 -0.487 0.225 0.120 0.537 0.314 1.760 2.587a 0.002 0.004 0.595 0.702 -0.473 -0.903
PROF -0.007 -3.292a 0.001 0.724 -0.004 -2.260a -0.022 -3.464a 0.015 1.596 -0.002 -2.252a 0.003 0.276 0.003 1.504 0.003 0.554 0.004 1.633
SIZE 0.021 0.804 0.010 0.477 -0.001 -0.030 0.019 0.906 0.032 1.494 0.029 1.384 0.005 3.163a -0.001 -0.058 0.004 0.199 -0.002 -0.146
DIVER -0.001 -0.329 -0.003 -0.548 0.003 1.204 -0.003 -0.512 -0.000 -0.137 -0.010 -1.692 0.008 0.879 -0.007 -1.025 0.004 2.158b 0.003 1.729c
FX -0.025 -0.139 -0.253 -1.840 -0.030 -0.171 -0.098 -0.646 -0.051 -0.374 -0.113 -0.831 -0.104 -1.326 -0.150 -1.108 0.111 0.894 0.085 0.720
PR -0.002 -2.239b -0.002 -2.996a -0.002 -3.196a -0.003 -3.571a -0.003 -3.556 -0.002 -2.174b -0.001 0.231 -0.001 -1.144 0.020 0.033 0.022 0.784
Adjusted R-squared 0.039 -0.012 -0.009 0.007 -0.032 -0.019 -0.013 -0.036 -0.039 -0.030 Total obs
70 98 109 114 123 134 155 145 140 127
a, b and c represents significant at the 1%, 5% and 10% significance level (two tailed test
