australian pharmaceutical industries limited - · pdf fileaustralian pharmaceutical industries...
TRANSCRIPT

Australian Pharmaceutical Industries Limited
for the year ended 31 August 2015
ANNUAL REPORT 2015

Australian Pharmaceutical Industries Limited Annual Report 2015
API IS ONE OF THE LEADING SERVICE PROVIDERS TO THE PHARMACY INDUSTRY IN AUSTRALIA
The Directors present their report together with the financial report of Australian Pharmaceutical Industries Limited (‘the Company’) and of the consolidated entity, being the Company and its controlled entities, for the year ended 31 August 2015 and the Auditor’s report thereon.
Contents1 Chairman’s and CEO’s Report6 Priceline Sisterhood Foundation8 Directors’ Report29 Lead Auditor’s Independence
Declaration30 Income Statement31 Statement of Comprehensive
Income32 Statement of Financial Position33 Statement of Cash Flows34 Statement of Changes in Equity35 Notes to the Financial
Statements79 Directors’ Declaration80 Independent Auditor’s Report 82 Shareholder Information85 Corporate Directory
Our VisionEnriching life as the most inspirational choice for health, beauty & well being

1. This statement should be read in conjunction with the underlying earnings reconciliation included in the Appendix 4E and full year results presentations lodged with the ASX.
We are pleased to present to shareholders the Company’s annual report for the financial year ended 31 August 2015.
During the past year the Company has continued to successfully execute its operational strategy which has improved returns for shareholders. The continued growth of the Priceline Pharmacy network, sustained performance from Pharmacy Distribution and an improved contribution from New Zealand operations were the key drivers behind the financial results.
The financial highlights for the 2015 financial year included:
– Net profit after tax of $43.1 million, up 37.6% on the underlying1 NPAT for the prior year;
– Earnings before interest and tax was $74 million, an increase of 13.7% on the 2014 underlying1 EBIT;
– Return on capital employed up to 13.5% from 11.9% in 2014;
– Cash generated from operations was up $11.9 million on the prior year to $101.8 million;
– Net debt reduced to $70.8 million, a $28.4 million reduction on the prior year; and
– Fully franked dividends paid to shareholders were up 28.6% for the year to 4.5 cents per share.
The Company’s ability to achieve these results given the challenging retail and pharmacy environment is a testament to the strategic positioning the business now has. The strategy of generating growth through the expansion of Priceline Pharmacy along with sustainable earnings and cashflow from Pharmacy Distribution remains relevant and in place for the foreseeable future.
Competition in the broader retail market has remained intense, with consumer sentiment mixed during the period. New entrants into the domestic health and beauty retail market added to the competitive nature of the operating environment. These factors heightened the need to remain relevant and closely connected with customers to remain top of mind as a shopping destination.
Regulatory reforms through the Pharmaceutical Benefits Scheme (PBS) continued the price deflation on pharmaceuticals, however during the year the Sixth Community Pharmacy Agreement (6th CPA) was signed by the Pharmacy Guild and the Australian Government.
CHAIRMAN’S & CEO’S REPORT
Peter R Robinson Chairman (left)
Stephen P Roche Managing Director and Chief Executive Officer (right)
37.6%
API Underlying1
NPAT
Annual Report 2015 Australian Pharmaceutical Industries Limited
1

2
Australian Pharmaceutical Industries Limited Annual Report 2015
CHAIRMAN’S & CEO’S REPORTCONTINUED

This provided the sector with more confidence and remuneration certainty through until 2020. As part of the 6th CPA, the Community Service Obligation payments to pharmaceutical wholesalers were also continued however there has been no increase nor indexation applied to these payments. This means that as price deflation continues through the supply chain, and volumes continue to increase, wholesalers such as API will be required to look at ongoing reductions in trading terms to manage operational margins. In addition further changes to our distribution model may be required to maintain our strategic position during the course of the 6th CPA.
Operational performancePriceline Pharmacy continued its sales momentum from 2014 recording excellent comparable store sales that were up 4.5% on the prior year, total sales up 10.4% and an increase in transactions by 7.7%. This growth was achieved without compromising profitability in stores with margins maintained in line with the prior year. Franchise partners continued to find the brand an attractive and sustainable proposition with store numbers increasing by 30 to 420 in total.
The Sister Club loyalty program grew by 900,000 members to 5.6 million, entrenched as the largest health and beauty loyalty program in Australia and one of the largest programs across all industries. Customers engaged with the brand across all forms of media with online store visitations up to 10 million page views per month and social media followers at record numbers.
The brand continued to record excellent market growth in its key categories; colour cosmetics grew at 12.6%, skincare at 21.9%, medicinal health at 23.6% and vitamins at 17.8%. These categories are the heartland for Priceline Pharmacy and a focus on new launches, exclusive products, range extensions and great value ensured customer satisfaction.
The presence of the brand was amplified through broader marketing initiatives which in 2015 included; taking the naming rights for the Priceline Pharmacy Kooyong Classic, becoming the principal sponsors for the Adelaide Thunderbirds netball team, and sponsoring the Melbourne Fashion Festival. New TV brand advertising, continued disruptive marketing tactical campaigns and promoting innovative services from pharmacists and beauty advisors kept awareness and consideration of the brand consistently high among our target audience.
13.7%
API Underlying1
EBIT
22.0%
Net Financing
Costs
Annual Report 2015 Australian Pharmaceutical Industries Limited
3

The brand was again recognised by peak industry organisations; claiming the runner up position in the Australian Retailers’ Association Retailer of the Year Award, complementing the win from 2014. This year Priceline Pharmacy was also recognised as a finalist in the Franchise Council of Australia’s Franchisor of the Year Awards.
In Pharmacy Distribution sales growth excluding the impact of the PBS reforms was 6.5%, and in line with the prior year. Gross profit was also held steady in the business through the prudent management of trading terms. There were considerable challenges when major customer groups were acquired by competitors at the commencement of the financial year. Management held many of these accounts and also acquired new business that largely offset the losses from the major groups.
The new business primarily came from independent non-branded pharmacies, which were attracted to API with the range of services offered by the Company. The Club Premium program offers a selection of retail services and it grew by more than 60 pharmacies to 750 during 2015. Combined with the Pharmacist Advice and Soul Pattinson brands and the ongoing generic pharmacy alliance with Alphapharm it provides API-aligned pharmacies with scope for choices that will best suit their local environment.
In the New Zealand operations a restructure in 2014 resulted in a markedly improved performance in 2015 with segment earnings before interest and tax up from $970,000 to $2.84 million. The results were attributable to improved cost management and increased sales from its core product range. It made an important contribution to the Australian business through the provision of private label and exclusive products and is expected to continue to do so in future years.
Group summaryAPI was able to manage its cost base efficiently with our cost of doing business marginally improved from 2014. A major contributor was the supply chain function where we continued to extract efficiencies and reduced overall costs while increasing units delivered for the second year in a row.
The Company has implemented a number of measures to improve its safety for staff and customers, and while further improvement is required we have been pleased with major changes in areas such as the distribution centres where the lost time injury frequency rate dropped by 46% this year.
CHAIRMAN’S & CEO’S REPORTCONTINUED
28.6%
Dividends
4
Australian Pharmaceutical Industries Limited Annual Report 2015

The strong operational performance has enabled the company to improve its financial position with average net debt falling by 21.2% in 2015.
Lower average net debt, lower financing costs, improved cash generation and improved earnings has led to improved returns for shareholders. Since the 2013 financial year, return on equity has grown from 4.09% to 8.62% and return on capital employed has risen from 8.34% to 13.45%.
The Company achieved these results while it implemented an enterprise-wide reporting system as part of our oneERP project. This $45 million investment will deliver approximately $7 million in savings in each financial year. Management was able to implement this project without any material disruption to business performance. We are confident that it will prove to be a successful long term initiative for API to make the Company more efficient and competitive.
This completes a substantial period of investment for the Company which has included upgrading the supply chain and distribution centres and also investing in the repositioning of Priceline Pharmacy. The business is already demonstrating that these investments are delivering benefits to shareholders and management focus will be on extracting further upside.
Corporate Social ResponsibilityThe Company’s Corporate Social Responsibility program, the Priceline Sisterhood Foundation has been able to continue the support of five key charities during the year; Alzheimer’s Australia, Australian Cervical Cancer Foundation, Look Good Feel Better, Children First Foundation, and Perinatal Anxiety and Depression Association. These charities cover some of the primary health concerns of women such as mental health and cancer.
2015 was the first full year of operation as an independent foundation and the Company was able to make the most contributions to the Priceline Sisterhood Foundation since the program commenced. At the end of August 2015 the company had raised $1.4 million, thanks to the efforts of staff, Priceline and Priceline Pharmacy stores, suppliers and consumers.
Since the end of the financial year another $600,000 has been raised as a result of the first national Priceline Sisterhood Foundation event in September 2015, taking the total funds raised since 2011 to more than $2 million.
Importantly all funds raised go directly to the charity partners to assist in developing their services to all Australians. This is an initiative that everyone associated with API can take pride in.
Board of directorsDuring the year Dr Michael Wooldridge retired from the Board and we thank him for his contribution over nearly 9 years as a Non-executive director.
Another Non-executive director Mr Ken Gunderson-Briggs was appointed Senior Independent Director and has also replaced Dr Wooldridge on the Remuneration Committee.
The Board is pleased the performance of API has continued to improve, showing strong operational execution of the strategy which is delivering sustainable results. The improved financial position at the end of 2015 will give the Board opportunities to look at options for growth, however the major focus in the short term is ensuring that shareholders see further improvement on the existing assets.
Finally, on behalf of all directors, we would like to thank all API’s staff for their contribution that has delivered the improvements for all shareholders.
Peter R Robinson Chairman
Stephen P Roche Managing Director and Chief Executive Officer
Annual Report 2015 Australian Pharmaceutical Industries Limited
5

The Priceline Sisterhood was initially formed in 2011 with its purpose being to give back to the community and,
specifically, to provide support to women and their families.
Charity partners were selected that covered a range of causes that were close to the hearts of women; coming from the results of a national survey that had more than
25,000 female respondents.
In 2014 the Priceline Sisterhood Foundation Limited was established to allow for tax deductible donations. The
foundation has an independent Board of Directors and the patron of the Foundation is Ita Buttrose. More than $2 million
has been raised since inception and all funds raised go directly to our charity partners.
The Priceline Sisterhood Foundation todayThe Foundation has a desire to help more Australian
women and their families by supporting those who are affected by conditions such as cancer and mental health.
The Foundation also wants to increase the awareness of the work the charities are undertaking which can lead
to greater understanding, better treatment and, in some cases, prevention.
In reality there is only one degree of separation for many Australians who know people affected by these conditions and the Foundation is working to support all those affected
either directly or indirectly.
More information about the Priceline Sisterhood Foundation can be found at https://www.priceline.com.au/sisterhood
6
Australian Pharmaceutical Industries Limited Annual Report 2015
MORE THAN
$2,000,000RAISED SO FAR

Who does the Foundation help?The charity partners help thousands of Australians every day. This is what the causes are about and a snapshot of who they help:
Alzheimer’s Australia provides a wide range of information, support, counselling, training and education to people with dementia, their families and carers as well as to professionals working in the dementia field. They advocate for the needs of Australians living with all types of dementia and they are committed to achieving a dementia-friendly Australia where people with dementia are respected, supported, empowered and engaged in community life .
– 342,800 Australians are living with dementia today1
– Every 6 minutes a new person is diagnosed with dementia1
The Australian Cervical Cancer Foundation has a mission to minimise the incidence and burden of cervical cancer and related women’s health issues: to assist women, their families, and communities by developing and implementing practical and appropriate programs, and by partnering with like-minded governments, organisations, and individuals to achieve health outcomes which reduce marginalisation and contribute to developing stronger communities. They provide life-saving HPV cervical cancer vaccine for women in developing countries, and promote awareness and prevention of cervical cancer.
– Cervical cancer is the 5th most common cancer in Australian women aged 15-442
– Around the world 300,000 women die every year from cervical cancer2
Children First Foundation has a mission to transform the lives of children by giving hope, exceptional care and pathways to a brighter future. Their work ensures that both Australian and overseas children have access to medical care and treatment which are otherwise inaccessible for them.
– Transforming the lives of children who suffer conditions that can’t be treated in their country of birth with life changing or life-saving treatments and rehabilitation3
– Supporting Australian chronically ill or disabled children whose families can’t meet the gap payments that are required for equipment or services that are only partially funded3
PANDA (Perinatal Anxiety and Depression Association) is committed to a community where perinatal depression and anxiety are recognised and the impact on women, men and their families are minimised through acknowledgement, support and education. PANDA provides telephone counselling support services, raises awareness and develops and shares its knowledge with consumers and other health organisations.
– Up to 1 in 10 women in Australia experience antenatal depression with the same number estimated to experience anxiety4
– Up to 1 in 20 men in Australia experience antenatal depression4
Look Good Feel Better is a free community service program dedicated to helping Australians living with cancer cope with the appearance-related side effects caused by cancer treatment. Women, men and teens participate in a practical workshop which covers skincare, make-up and head-wear demonstrations leaving them empowered to face their cancer treatment with confidence. By addressing hair loss and changes to the skin with the use of skin care, makeup, hats, turbans and wigs, they help to restore patients’ appearance and self-image.
– More than 118,000 people have participated in workshops run by volunteers dedicated to teaching cancer patients how to manage the appearance-related side effects of any form of cancer5
– Annually more than 8,500 women participate in approximately 1,000 workshops held to assist their appearance and associated emotional wellbeing5
Our charity partners are:
1. Source: https://fightdementia.org.au2. Source: https://accf.org.au3. Source: http://childrenfirstfoundation.org.au4. Source: http://lgfb.org.au5. Source: http://www.panda.org.au
Further information on the charity partners and the services they provide is available from:
– Alzheimer’s Australia https://fightdementia.org.au
– Australian Cervical Cancer Foundation https://accf.org.au
– Children First Foundation http://childrenfirstfoundation.org.au
– Look Good Feel Better Foundation http://lgfb.org.au
– Perinatal Anxiety and Depression Australia http://www.panda.org.au
7
Annual Report 2015 Australian Pharmaceutical Industries Limited

8
Australian Pharmaceutical Industries Limited Annual Report 2015
DIRECTORS’ REPORT
DIRECTORSThe Directors of the Company at any time during or since the end of the financial year are:
Mr Peter R Robinson, BCom, FAICDChairman.Non-executive director.Director since 5 May 2000.Appointed Chairman 8 July 2003.
Mr Robinson has held both executive and non-executive directorships for over 30 years. Mr Robinson also during this time has had extensive general management and chief executive officer experience in the pharmaceutical industry.
Other current listed company directorships:
– Clover Corporation Limited – TPI Enterprises Ltd (listed ASX 10 August 2015)
Former listed company directorships in the past three years:
– Washington H Soul Pattinson and Company Limited (appointed 1984, resigned 31 March 2015)
– New Hope Corporation Limited (appointed August 1997, resigned 31 March 2015)
– Exco Resources Limited (appointed November 2012, company de-listed January 2013)
Mr Robert D Millner, FAICDNon-executive director.Director since 5 May 2000.Appointed member of the Remuneration Committee on 2 October 2007.Appointed member of the Nomination Committee on 15 August 2012.
Mr Millner has had extensive management and public company experience across a number of industries.
Other current listed company directorships:
– Brickworks Limited – BKI Investment Company Limited – Milton Corporation Limited – New Hope Corporation Limited – TPG Telecom Ltd – Washington H Soul Pattinson and Company Limited
Former listed company directorships in the past three years:
– Exco Resources Limited (appointed November 2012, company de-listed January 2013)
From left to right:Peter R RobinsonRobert D MillnerE Carol HolleyStephen P RocheLee AusburnGerard J MastersKenneth W Gunderson-Briggs

Annual Report 2015 Australian Pharmaceutical Industries Limited
9
Ms E Carol Holley, BA, FCA, FAICDIndependent non-executive director.Director since 19 December 2006.Appointed Chair of the Audit and Risk Committee on 19 December 2006.
Ms Holley is a non-executive director of Defence Housing Australia and Chair of its subsidiary Defence Housing Australia Investment Management Limited.
Ms Holley is also chair of the Audit and Risk Committees of Land and Housing Corporation, Service NSW, The Parliament of NSW and National Health Funding Body and a member of the committees of the NSW Police Force and NSW Mental Health Commission.
Mr Stephen P Roche, BBus, FAICDExecutive director.Managing Director and Chief Executive Officer since 14 August 2006.
Mr Roche joined API in March 2005. Previously he was Group General Manager, Health Services for Mayne Group Limited with responsibility for pharmacy distribution, pathology and other business units. Previous roles included Chief Operating Officer, Healthcare Services for FH Faulding & Co and a number of management roles at CSR.
Ms Lee Ausburn, MPharm, BPharm, DipHospPharm, GAICDIndependent non-executive director.Director since 7 October 2008.Appointed member of the Audit and Risk Committee on 7 October 2008.
Appointed member of the Nomination Committee on 15 August 2012 and appointed Chair on 8 April 2015.
Ms Ausburn is a pharmacist with experience in retail and hospital pharmacy and in academia. She had a long career in the pharmaceutical industry with Merck Sharp and Dohme (Australia) Pty Ltd and was previously Vice President, Asia, for Merck and Co Inc with responsibility for the company’s operations across Asia.
Ms Ausburn is also President, Pharmacy Faculty Foundation, University of Sydney and is a former board member of the Clinical Excellence Commission and Agency for Clinical Innovation, NSW Health.
Other current listed company directorships:
– NIB Holdings Limited – Somnomed Limited
Mr Gerard J MastersIndependent non-executive director.Director since 7 September 2010.Appointed member of the Nomination Committee on 15 August 2012.Appointed member and Chair of the Remuneration Committee on 30 January 2014.
Mr Masters has had extensive experience in retailing. Until his resignation in early 2006, he spent more than 33 years with the Coles Myer Group. This included a 10 year period as Managing Director of Bi Lo, Coles and then the total Supermarkets Group which was Coles Myer’s largest and most profitable business. His most recent role, until his resignation in 2009, was as the Managing Director and CEO of The Reject Shop Limited.
Mr Kenneth W Gunderson-Briggs, BBus, FCA, MAICDSenior Independent non-executive director.Director since 6 May 2014.Appointed member of the Audit and Risk Committee on 6 May 2014.Appointed member of the Remuneration Committee on 8 April 2015.Appointed Senior Independent Director on 2 September 2015.
Mr Gunderson-Briggs is a chartered accountant, registered company auditor and public company director, with broad experience in the finance and retail franchise sectors.
Mr Gunderson-Briggs has been Chairman of Glenaeon Rudolf Steiner School Limited since 2013, having been a director on the Board since 2009.
Other current listed company directorships:
– Harvey Norman Holdings Limited
The Hon Dr Michael R Wooldridge, BSc, MBBS, MBA, LLDIndependent non-executive director.Director since 1 February 2006. Resigned 31 December 2014.Appointed member of the Remuneration Committee on 2 October 2007. Resigned 31 December 2014.Appointed Lead Independent Director on 2 December 2008. Resigned 31 December 2014.Appointed Chair of the Nomination Committee on 15 August 2012. Resigned 31 December 2014.
Former listed company directorships in the past three years:
– Vision Eye Institute Ltd (resigned 30 January 2015)
COMPANY SECRETARYMr Peter Sanguinetti has been Company Secretary and General Counsel since November 2007. Mr Sanguinetti BJuris, LLB, MAICD has extensive experience and was previously Company Secretary and General Counsel of Kodak (Australasia) Pty Ltd for 9 years, responsible for legal and company secretarial activities for the Kodak group across Asia. Mr Sanguinetti was also a non-executive director of HPAL Limited from January 2005 to November 2007. On 2 June 2009, Ms Genevieve Ryan was appointed an Alternate Company Secretary. Ms Ryan BSc (Hons), LLB (Hons) is a qualified lawyer and supports the Company Secretary.

10
Australian Pharmaceutical Industries Limited Annual Report 2015
DIRECTORS’ MEETINGSThe number of Directors’ meetings (including meetings of committees of Directors) and number of meetings attended by each of the Directors of the Company during the period were:
Board Audit and Risk Remuneration Nomination
Director**Number
attendedNumber
Held*Number
attendedNumber
held*Number
attendedNumber
held*Number
attendedNumber
held*
Mr P R Robinson*** 13 14 – – – – – –
Mr R D Millner 13 14 – – 2 2 1 1
Dr M R Wooldridge+ 4 4 – – 1 1 1 1
Ms E C Holley 13 14 5 5 – – – –
Mr S P Roche*** 14 14 – – – – – –
Ms L Ausburn 12 14 5 5 – – – 1
Mr G J Masters 14 14 – – 2 2 1 1
Mr K W Gunderson-Briggs 14 14 5 5 1 1 – –
* Number of meetings held during the time the director held office or was a member of the committee during the period.** All Directors who are not members of Committees are invited to attend Committee Meetings.*** Mr Robinson and Mr Roche attended all Committee meetings by invitation. + Dr Wooldridge retired as a Director and from all Committee positions on 31 December 2014.
OPERATING AND FINANCIAL REVIEWAs required by Section 299A(1) of the Corporations Act, and in accordance with ASIC Regulatory Guide 247 Effective Disclosure in an Operating and Financial Review (RG247) issued in March 2013, the Board is required to include in the Directors’ Report an Operating and Financial Review (OFR) which includes information that shareholders would reasonably require to make an informed assessment of the consolidated entity’s operations, financial position and business strategies, and prospects for future years. The OFR complements and supports the financial report.
Financial PerformanceFor the year ended 31 August 2015 the Company reported a net profit after tax of $43.1 million following strong contributions from its Retail and Pharmacy Segments along with productivity gains across the Supply Chain network. The Company’s reported revenue increased to $3.5 billion with a backdrop of underlying Pharmacy sales growth, along with strong Priceline like for like growth of 4.5% and a store network increase of 30 stores.
The Retail segment recorded sales growth of 16.0% to $872.1 million. The Retail business reported segment gross profit of $218 million being an increase of 10.6% on the previous year. The Sister Club program continued to grow with over 5.6 million members.
The Pharmacy distribution segment reported sales of $2.4 billion being in line with the previous year, notwithstanding the impact of PBS price reforms. The underlying sales adjusting for PBS reforms throughout the year was an increase of 6.5%.
The Company’s New Zealand business reported an increase in earnings to $2.8 million, an increase from $1.0 million in the prior year. This result is attributable to the increase in contract and export sales combined with improved margins across several product categories.
The Company’s associate investment (CH2 Holdings Pty Ltd) reported an operating loss of $0.4m for the year.
Capital expenditure for the year was $30.6 million with the significant part of this investment being the final implementation of the SAP ERP system.
The Company’s operating cash flow improved 24.7% to $80.1 million on the back of stronger working capital management and lower financing costs across the year.
Financial PositionThe Company’s net debt reduced to $70.8 million which reflects a $28.4 million reduction on the prior year. The Company is currently operating comfortably within the Group’s facility limits and associated banking covenants.
In line with the strong operational performance the Company has declared a fully franked final dividend of 2.5 cents per share, bringing the full year dividend to 4.5 cents per share fully franked, an increase of 28.6% on the prior year dividend of 3.5 cents.
DIRECTORS’ REPORTcontinued

Annual Report 2015 Australian Pharmaceutical Industries Limited
11
Business Strategies and Prospects for Future Financial YearsDuring the year the Board undertook a review of its short and long term strategies. This review was performed to ensure that its strategies remained relevant and adaptable to the dynamic regulatory and economic environment that the Company operates in, and which may affect the future financial performance and position of the Company.
The strategic issues that the company needs to address in order to achieve its vision are, by their very nature, long term issues and remain unchanged.
The strategic review analysed a range of internal and external environmental elements which validated the range of identifiable strategic goals and supporting initiatives across all business units and functions. The overall business strategies relevant to the Company’s future financial position and performance include:
– Leveraging our health and beauty competitive advantage
– Market insights driving the customer preferred retail proposition
– Providing a compelling business model for partners – An integrated business driving superior value – Optimised capital investment – A safer place to work every day – Excellence in leadership, learning and recognition
These strategic goals and supporting initiatives are all focused on the Company achieving its vision of ‘Enriching life as the most inspirational choice for health, beauty and wellbeing’
By applying the strategic goals to the Company’s business plans, there will be a continued emphasis on capitalising on the Company’s strengths in the health and beauty retail market and to optimise its strong national community pharmacy wholesale distribution business. This means the Company intends to;
– Continue to promote the Priceline Pharmacy Franchise proposition and grow the store network. Priceline Pharmacy is seen as a compelling proposition for pharmacists who wish to offset the impact of PBS reform, leverage business, pharmacy and retail expertise, and drive further growth from integrated dispensary and retail programs;
– Transition from Company owned Priceline stores to Franchise owned Priceline Pharmacies;
– Build loyalty and increase engagement of the Priceline Sister Club loyalty program, and generally promote increased customer engagement including through the Priceline website and social media channels;
– Grow the Club Premium independent pharmacy buying group program;
– Expand the Company’s Health and Beauty Retail Brand portfolio and offers, supported by an integrated marketing communication strategy;
– Ensure the benefits, delivery and process improvements arising from the OneERP Project implementation;
– Optimise the value of our business portfolio through investment, divestment and acquisition;
– Build on the Company’s merchandising strategy by sourcing pharmaceutical and health and beauty products that focus on superior delivery performance, exclusive product offerings and private brand products, and ranging products that are relevant to everyday needs and deliver value for money enhanced health outcomes;
– Maintain earnings margins within Pharmacy Distribution during a period of ongoing government PBS reforms in the Pharmacy sector;
– Embed our values and behaviours by continuing to develop Personal, Team, Business and Community Leadership capability;
– Continue to invest in supply chain and information technology platforms to drive efficient and cost effective operating cost structures;
– Drive safety leadership throughout the business.
The Company expects to sustain improvements in earnings performance through the implementation of its core strategies and supporting initiatives. This outlook is subject to no material change in consumer or customer demand, a stable economic climate and no unforseen adjustments to either the regulatory environment or the Pharmaceutical Benefits Scheme.
Specific details about the Company’s business strategies and prospects that could give rise to likely material detriment to the Company, for example, information that is commercially sensitive, confidential or could give a third party a commercial advantage has not been included in this Annual Report. Other than the information set out in this document, information about other likely developments in the Company’s operations in future financial years has not been included.

12
Australian Pharmaceutical Industries Limited Annual Report 2015
MATERIAL BUSINESS RISKSThe Company continues to be influenced by a number of general economic and business conditions including levels of consumer spending, interest and exchange rates and government regulatory policies. The Company has a distinctive positioning in the Community Pharmacy wholesaling sector in Australia as well as being well positioned in the mass market Health and Beauty retail sector.
Despite its strengths in these sectors the Company faces challenges including:
– Ongoing government reforms to the PBS in the Pharmacy sector; and
– Macro-economic factors contributing to volatile retail sales and increasing cost pressures in key areas such as labour.
As part of the Company’s risk management process, the risk profile of the Company is reviewed by Management with the assistance of the Risk and Internal Audit team at least annually. The results of this review are provided to the Audit and Risk Committee for its consideration and recommendation to the API Board.
The Company’s risk management process is integrated with its strategic planning process and involves identifying the risk universe and documenting those factors that contribute to the inherent risk environment. Inherent risk is determined by combining likelihood and consequences assessments determined in the absence of any controls within the business.
The effectiveness of current controls in place to manage the identified risks is then assessed to determine residual risk. Where residual risk is deemed to be greater than the business risk appetite, risk treatment plans are developed and specific personnel assigned responsibility for the management of those risks. The status of risk treatment plans is monitored and reported to the Audit and Risk Committee at regular intervals.
The most recent update was in July 2015 against a backdrop of continued PBS reforms, challenging Retail trading conditions and the Company’s decision to update its Information Technology platforms as it transitioned to a one enterprise approach.
The following is a summary of the contemporary risks facing the Company as assessed by the recent update of the Company’s risk profile:
– Structural reforms within the Australian Community Pharmacy sector.
This relates to the risk of continued Government PBS reforms. The Company monitors the changes to PBS medicines and responds with a combination of reduced discounts to Pharmacy customers and operational
adjustments. The Company also closely monitors costs associated with the Community Service Obligation (CSO).
– Execution of Retail Pharmacy strategy with associated growth of Priceline Pharmacy stores.
There is a risk that the expansion of the Company’s Priceline Pharmacy franchise network is unsuccessful or the expected growth in the next five years is slower than expected. Existing key business processes and responses to mitigate this risk include dedicated Retail Pharmacy Business Development teams, the inclusion of landlords, banks and industry accountants in pharmacist familiarisation and recruitment forums. Tracking measures to monitor growth rates are reported to the Managing Director and the Board on a monthly basis.
– One Enterprise Restructure and Information systems upgrade.
In 2011 the Company undertook a restructure of its Australian business and has transitioned from a multiple Business Unit structure to One Enterprise functional structure. This transition included an upgrade of the Company’s enterprise management information platforms in the latter part of the 2015 financial year.
As this successful initiative progresses through stabilisation and the expected benefits accrue, the next challenge the Company faces is to further optimise these platforms and realise even greater potential. To mitigate the risk of not meeting timelines or expectations, project governance measures, including a Management Steering Committee and Business Optimisation Team, have been established to guide this optimisation process.
– Financial Risk and Long Term Customer Loans.The Company’s activities expose it to a number of financial risks including customer payment defaults, financial guarantees to banks supporting certain Pharmacy customers being called, and general retail trading conditions. The Company adopts a financial risk management program which seeks to minimise potential adverse impacts on the financial performance of the Company. The Company has undrawn funding lines throughout the year to manage any unforeseen financial risks.
REMUNERATION REPORT – AUDITEDThe API Board is committed to transparent disclosure of its remuneration strategy and this report details the processes used in remuneration decisions and their outcomes for Key Management Personnel (KMP) for the 2015 financial year. This report is prepared in accordance with Section 300A of the Corporations Act 2001 (as amended) for the Company and its subsidiaries.
DIRECTORS’ REPORTcontinued

Annual Report 2015 Australian Pharmaceutical Industries Limited
13
In the previous financial year, the Board engaged Guerdon Associates as its independent external remuneration consultant to undertake a review of Executive Remuneration and Executive Incentive Plans (excluding the Managing Director and Chief Executive Officer). Given the relatively recent outcome of this review, the Board did not consider it was necessary to re-engage Guerdon Associates to perform a similar remuneration review in the 2015 financial year. The Board is committed to seeking independent review of the Company’s remuneration structure as required from time to time to ensure its remuneration practices remain consistent with peer market practices. For this purpose, it is intended that Guerdon Associates will provide advice to the Board as required.
With respect to Executive STIP and LTIP Incentive Plans, a review was conducted during the 2015 financial year to ensure those Plans continued to meet market practices. As a consequence of this review, the Board approved changes to the respective plans as summarised below:
1. Short Term Incentive Plan (STIP) for the 2014/2015 award and thereafter – The number of performance rights issued will no
longer be increased by 10% as compensation for forgone dividends. Instead, a cash payment will be made at the time of vesting of the performance rights based on the Company’s actual dividend paid during the 12 month vesting period.
2. Long Term Incentive Plan (LTIP) for the 2015/2016 award and thereafter – The number of performance right entitlements
will no longer be increased by 10% as compensation for forgone dividends, and no other compensation will be payable for forgone dividends.
More details regarding the changes to STIP and LTIP arrangements can be found in Section 2 of the Remuneration Report.
Key Management Personnel Key Management Personnel (KMP) have the authority and responsibility for planning, directing and controlling the activities of the consolidated entity, and comprise:
1. Non-executive Directors;2. Managing Director and Chief Executive Officer;3. Chief Financial Officer; and 4. Group General Manager Business Development and
Operations.
Following a review during the 2015 financial year, it is not considered other Executives of the Company are within the scope of KMP having regard to the definition in AASB 124 and the definitions of “chief executive function” and “chief financial officer function” as set out in Section 295A (4) and (6) Corporations Act 2001.
Non-executive director KMP Peter Robinson Chairman
Lee Ausburn Director
Carol Holley Director
Gerard Masters Director
Robert Millner Director
Michael Wooldridge Director (ceased 31 December 2014)
Kenneth Gunderson-Briggs Director
Executive KMP Stephen Roche Managing Director and Chief
Executive Officer
Graeme Fallet Chief Financial Officer (separated 19 December 2014)
Peter Mendo Chief Financial Officer (appointed interim Chief Financial Officer 21 January 2015, appointed Chief Financial Officer 1 September 2015)
Richard Vincent Group General Manager Business Development and Operations
This report has been audited by the Company’s Auditor, KPMG as required by Section 308(3C) of the Corporations Act 2001.
The Remuneration Committee is governed by its Charter (available on www.api.net.au) which was developed in line with ASX Corporate Governance Principles and Recommendations. The Charter specifies the purpose, authority, membership and activities of the Remuneration Committee, and the Charter is annually reviewed by the Committee to ensure it remains consistent with regulatory requirements.
Membership of the Committee consists of Non-executive directors. During 2014-2015 members of the Committee were Mr Gerard Masters (Chairman), Dr Michael Wooldridge and Mr Robert Millner. Dr Wooldridge retired from the Committee and the Board on December 31, 2014, and Mr Kenneth Gunderson-Briggs was appointed to the committee on April 8, 2015.
14
Australian Pharmaceutical Industries Limited Annual Report 2015
The Remuneration Report is in sections as follows:
Section 1 Non-executive Director KMP RemunerationA Policy & Principles
B Remuneration Details (excluding the Chief Executive Officer)
Section 2 Executive KMP Remuneration A Policy & Principles
B Remuneration Structure
C Short Term Incentive Plan (STIP)
D Long Term Incentive Plan (LTIP)
E Summary of KMP Employment Contracts
F KMP Remuneration Details
Section 3 Other matters A Comments on Remuneration Report at the
Company’s most recent AGM
B Appointment of Remuneration Consultant
SECTION 1 NON-EXECUTIVE DIRECTOR KMP REMUNERATION
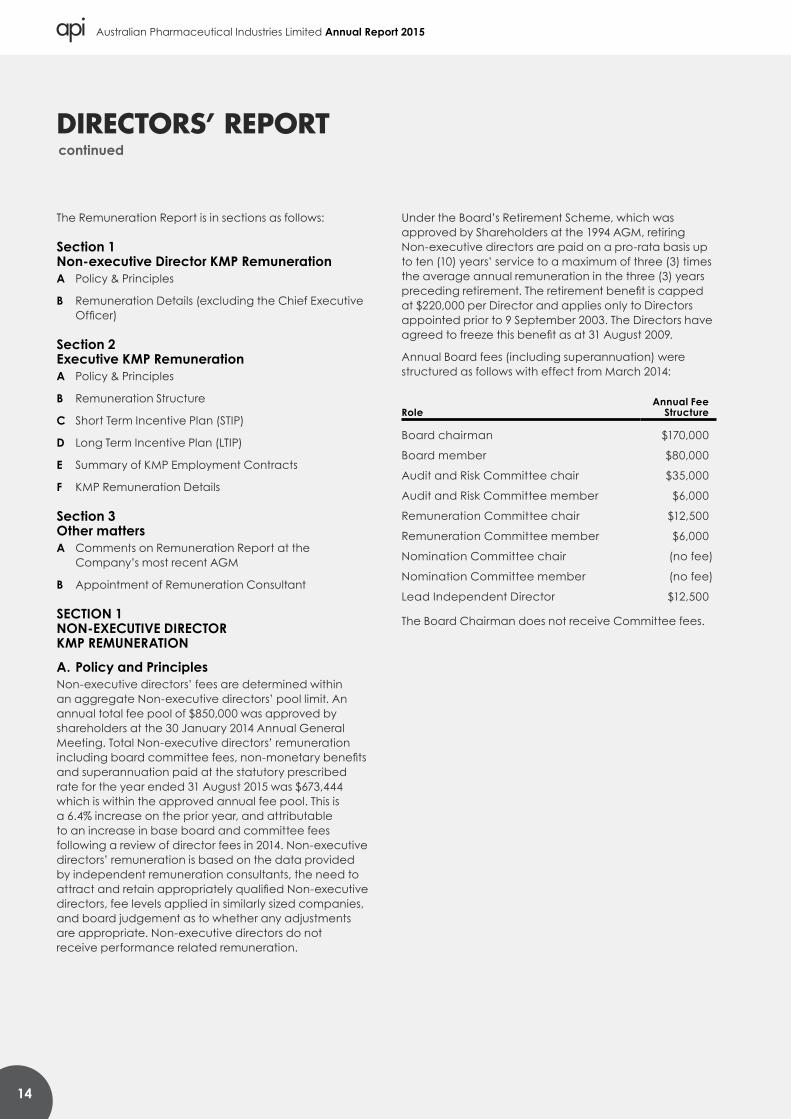
A. Policy and PrinciplesNon-executive directors’ fees are determined within an aggregate Non-executive directors’ pool limit. An annual total fee pool of $850,000 was approved by shareholders at the 30 January 2014 Annual General Meeting. Total Non-executive directors’ remuneration including board committee fees, non-monetary benefits and superannuation paid at the statutory prescribed rate for the year ended 31 August 2015 was $673,444 which is within the approved annual fee pool. This is a 6.4% increase on the prior year, and attributable to an increase in base board and committee fees following a review of director fees in 2014. Non-executive directors’ remuneration is based on the data provided by independent remuneration consultants, the need to attract and retain appropriately qualified Non-executive directors, fee levels applied in similarly sized companies, and board judgement as to whether any adjustments are appropriate. Non-executive directors do not receive performance related remuneration.
Under the Board’s Retirement Scheme, which was approved by Shareholders at the 1994 AGM, retiring Non-executive directors are paid on a pro-rata basis up to ten (10) years’ service to a maximum of three (3) times the average annual remuneration in the three (3) years preceding retirement. The retirement benefit is capped at $220,000 per Director and applies only to Directors appointed prior to 9 September 2003. The Directors have agreed to freeze this benefit as at 31 August 2009.
Annual Board fees (including superannuation) were structured as follows with effect from March 2014:
RoleAnnual Fee
Structure
Board chairman $170,000
Board member $80,000
Audit and Risk Committee chair $35,000
Audit and Risk Committee member $6,000
Remuneration Committee chair $12,500
Remuneration Committee member $6,000
Nomination Committee chair (no fee)
Nomination Committee member (no fee)
Lead Independent Director $12,500
The Board Chairman does not receive Committee fees.
DIRECTORS’ REPORTcontinued

Annual Report 2015 Australian Pharmaceutical Industries Limited
15
B. RemunerationofDirectors(ExcludingtheChiefExecutiveOfficer)
Short Term
Post
-em
ploy
men
t su
pera
nnua
tion
cont
ribut
ions
Oth
er lo
ng te
rm
Term
inat
ion
paym
ents
Equi
ty V
alue
of r
ight
s gr
ante
d un
der S
TIP
Equi
ty V
alue
of r
ight
s gr
ante
d un
der L
TIP
Tota
l
Prop
ortio
n of
rem
uner
atio
n pe
rform
ance
rela
ted
Valu
e of
righ
ts a
s pr
opor
tion
ofre
mun
eration(%
)
Sala
ry &
Fee
s
Cas
h - S
hort-
term
ince
ntiv
es
Non
-mon
etar
y be
nefit
s
Tota
l
DIRECTORS $ $ $ $ $ $ $ $ $ $ % %
Non-executiveMr P R Robinson31 August 2015 155,606 – 1,261 156,867 14,783 – – – – 171,650 – –
31 August 2014 147,653 – 2,467 150,120 13,723 – – – – 163,843 – –
Mr R D Millner31 August 2015 79,539 – – 79,539 7,478 – – – – 87,017 – –
31 August 2014 67,960 – – 67,960 6,319 – – – – 74,279 – –
DrMRWooldridge(resigned31December2014)31 August 2015 30,053 – – 30,053 2,855 – – – – 32,908 – –
31 August 2014 79,180 – – 79,180 7,362 – – – – 86,542 – –
Ms E C Holley31 August 2015 105,263 – – 105,263 10,000 – – – – 115,263 – –
31 August 2014 92,232 – – 92,232 8,575 – – – – 100,807 – –
Ms L Ausburn31 August 2015 78,719 – – 78,719 7,478 – – – – 86,197 – –
31 August 2014 67,960 – – 67,960 6,319 – – – – 74,279 – –
Mr G Masters31 August 2015 84,668 – – 84,668 8,043 – – – – 92,711 – –
31 August 2014 67,163 – 1,234 68,397 6,254 – – – – 74,651 – –
MrKGunderson-Briggs(appointed6May2014)31 August 2015 80,089 – – 80,089 7,608 – – – – 87,697 – –
31 August 2014 25,345 – – 25,345 2,377 – – – – 27,722 – –
Retirement benefits for Non-executive Directors are included on an accrual basis. The benefits are paid on a pro rata basis up to 10 years’ service to a maximum of three times the average annual remuneration in the three years preceding retirement. The retirement benefit is capped at $220,000 and does not apply to Directors first appointed after 9 September 2003. On 31 August 2009 the Directors agreed to freeze this benefit.
Post employment superannuation contributions are inclusive of the super guarantee increase effective 1 July 2014. The Annual Board fees disclosed on the previous page have not yet been adjusted to reflect this statutory change.

16
Australian Pharmaceutical Industries Limited Annual Report 2015
SECTION 2 EXECUTIVE REMUNERATION INCLUDING THE MANAGING DIRECTOR
A. Policy and PrinciplesAPI’s remuneration strategy is to:
– Offer a remuneration structure that will attract, focus, retain and reward highly capable people;
– Ensure that remuneration decisions are based on a fair and transparent job evaluation process that is linked to comparative market data and the experience of the individual in the position;
– Have a clear and transparent link between performance and remuneration;
– Encourage and integrate risk management within the reward framework; and
– Build employee engagement and align management and shareholder interests through the ownership of Company shares.
Executive remuneration is set with regard to the size and nature of the position with reference to market median benchmarks and the performance of the individual.
Remuneration will incorporate at risk elements to:
– Link Executive reward with the achievement of API’s business objectives and financial performance; and
– Ensure total remuneration is competitive by market standards.
The Remuneration Committee has the role of reviewing and making recommendations to the Board on Executive remuneration at API. The Remuneration Committee may seek independent advice on the appropriateness of remuneration levels given trends in comparable companies. The Remuneration Committee is authorised to seek advice if and when required.
B. Remuneration StructureThe Executive Remuneration Framework as it applies to the Managing Director and Senior Executives comprises:
– Fixed remuneration; and – Performance linked remuneration in the form of a Short
Term Incentive Plan (STIP) and a Long Term Incentive Plan (LTIP).
Fixed RemunerationFixed remuneration is a guaranteed salary level inclusive of any Fringe Benefits Tax (FBT), charges related to employee benefits including motor vehicles and employer contributions to superannuation funds.
Fixed remuneration levels are reviewed annually. Fixed remuneration levels are set in reference to each position’s accountability and the median level for similar jobs in the market. Any adjustment needs to also consider individual segment results and overall performance of the consolidated entity. In addition, external consultants provide analysis and advice to ensure that Executive remuneration is appropriate given market practice.
Performance Linked RemunerationPerformance linked remuneration includes both short term and long term incentives and is designed to reward KMP’s for meeting or exceeding their financial and non-financial objectives. The short term incentive is provided in the form of a cash payment and deferred rights to acquire shares while the long term incentive is provided as deferred rights to acquire shares (“Performance Rights”).
The Group has a policy that prohibits those that are granted share-based payments as part of their remuneration from entering into other arrangements that limit their exposure to losses that would result from share price decreases. Entering into such arrangements has been prohibited by law since 1 July 2011.
C.ShortTermIncentivePlan(STIP)The STIP is an annual at risk incentive plan for Executives and other designated senior employees who are considered to be in business critical roles.
Prior to the start of the Company’s financial year the Remuneration Committee recommends for Board approval the size of the STIP pool which is the maximum amount payable under the STIP. The size of the pool is determined as a percentage of target EBIT for the year. Prior to any payment under the STIP, Company performance must pass an acceptable minimum gateway requirement of Group Net Profit After Tax before associates (NPAT).
At the start of each year the Remuneration Committee sets a ‘scorecard’ of performance conditions for the STIP as follows:
– NPAT; and – Other financial and non-financial measures tailored for
each business segment.
Other performance measures vary by business segment, however each scorecard includes a measure related to Earnings Before Interest and Tax (EBIT), Return on Net Assets (RONA), Return on Capital Employed (ROCE) and, in relation to Supply Chain, overall cost measurement. Multiple measures of performance help diversify risk.
DIRECTORS’ REPORTcontinued

Annual Report 2015 Australian Pharmaceutical Industries Limited
17
Each year, the Board establishes NPAT performance hurdles of which base, target and maximum STIP entitlements will be payable. The current practice is that base equates to budget less 10%, the target equates to budget and the maximum equates to 110% of budget.
After the conclusion of the financial year, the Board assesses performance against Group and Segment Scorecards with 80% of the total maximum percentage based on key financial objectives and 20% based on individual objectives. Prior to any consideration of a STIP payment, the Company must meet a base NPAT performance, usually set as 90% of the target NPAT. The Board has discretion for a STIP payment where achievement is between base and target NPAT levels.
The precise number of performance rights granted will be determined by dividing the value of the deferred component of the STIP award by the volume weighted average closing price of API shares on the ASX in the 10 day period after announcement of full year results.
Offers made for the 2014/2015 STIP award and the 2015/2016 STIP award and thereafter will no longer include an increase in the number of rights granted on account of compensation for forgone dividends during the vesting period. Instead a cash payment will be made based on the Company’s actual dividends paid during the 12 month vesting period. The reason for the change is to ensure the deferred STIP reflects the actual value received by shareholders rather than an estimate.
The deferred component of the STIP award is designed to manage risk by ensuring that decisions taken in the previous 12 months have resulted in sustainable Company benefit. The API Board has the discretion to clawback any unvested rights or unvested cash due to excessive risk taking, material misstatement of financial statements or fraudulent or gross misconduct.
For members of the Executive Leadership Team with STIP performance scorecard measures established after 1 September 2015 and any resulting award, the 50% 12 month deferred component of any STIP award will continue to be paid in performance rights. In addition, participants will be eligible to receive at the time of vesting a cash payment based on the Company’s actual dividend paid during the 12 month vesting period.
On vesting and exercise of a performance right, an employee will be provided with a fully paid ordinary share in API. No amount will be payable for the API shares upon vesting and exercise of the performance right.
More broadly, the Board retains absolute discretion over all awards made under the incentive award plans at API, including the STIP.
Managing Director and Chief Executive OfficerAt base, Mr Roche’s STIP equates to 32.5% of fixed remuneration, at target it equates to 65% of fixed remuneration and if NPAT is at a level that is 110% of budget, the STIP provides for a maximum payment of 100% of fixed remuneration.
Mr Roche’s STIP scorecard is varied by the Board from year to year and is drawn from financial measures such as NPAT (before associates), ROE and ROCE. Non-financial measures may include retail sales growth, Priceline Pharmacy network growth, pharmacy distribution market share and set improvement targets relating to workplace safety.
Other Executive KMPAt base, Executive KMP STIP equates to 10% of fixed remuneration, at target it equates to 20% of fixed remuneration and if NPAT is at a level that is 110% of budget, the STIP provides for a maximum of 40% of fixed remuneration. The Remuneration Committee determines the financial measures for Executive KMP STIP which includes divisional EBIT, ROCE and in the case of Supply Chain, operating costs.
During the 2014-15 financial year, the NPAT result exceeded the NPAT gateway and the Board approved the following Short Term Incentive payments.
In making the Short Term award to the Executive KMP the Board had regard to the following factors:
– Company performance – Meeting the performance criteria set out in the STIP
offer.

18
Australian Pharmaceutical Industries Limited Annual Report 2015
Maximum STIP Opportunity
as a % of Fixed Remuneration
Awarded STIP as a % of Fixed Remuneration
STIP Cash Entitlement
STIP Deferred Equity1
EXECUTIVES % % $ $
Mr S P Roche – Managing Director and CEO31 August 2015 100.0% 100.0% 490,543 490,543*
31 August 2014 100.0% – – –
Mr R Vincent – Group General Manager, Business Development & Operations31 August 2015 40.0% 40.0% 117,452 117,452
31 August 2014 40.0% 20.0% 56,884 56,884
MrGFallet–ChiefFinancialOfficer(separated19December2014)31 August 2015 – – – –
31 August 2014 40.0% 20.0% 47,160 47,160
MrPMendo–ChiefFinancialOfficer(appointed21January2015)^31 August 2015 – – – –
1. 50% of the deferred equity has been recognised in remuneration for the year in accordance with AASB 2 Share Based Payments.* On vesting and exercise of STIP performance rights, the Managing Director will be provided with fully paid ordinary shares purchased on-market.^ Appointed Interim Chief Financial Officer on 21 January 2015. Appointed Chief Financial Officer on 1 September 2015.
D. LongTermIncentivePlan(LTIP)The Remuneration Committee has responsibility for API’s Long Term Incentive Plan (LTIP). The Plan was established during the year ended 30 April 2006. The Remuneration Committee is responsible for awards to be granted under the Plan as well as overseeing administration of the Plan. Part of the administration is the determination of the performance conditions associated with each grant. The LTIP involves the granting of rights to acquire API shares.
Rights are granted to the Managing Director and Chief Executive Officer (which are subject to approval at the following AGM) and to certain executives as soon as practicable after the full year results are announced. This ensures that the allocation of rights reflects the market’s best informed assessment of Company value and share price. The number of Rights granted is derived by calculating a value representing the relevant percentage of a participant’s Fixed Remuneration, and dividing that value by the unit value per Right. This unit value is determined by calculating the 10 day Volume Weighted Average Closing Price of API shares immediately after announcement of full year results.
For LTIP performance scorecard measures established after 1 September 2015, performance rights no longer include additional rights to shares that would otherwise accrue from dividend reinvestment during the three (3) year vesting period. Executives do not receive dividends on unvested shares.
If performance conditions are satisfied, the Rights vest and convert to API shares on a one-for-one basis. If performance conditions are not met, the Rights lapse. Under the LTIP, shares can be purchased on market on behalf of the participant or new shares issued by the Company. If any vesting is satisfied through the achievement of performance criteria, a participant will be provided with shares in API. Performance conditions will be tested only once and any Performance Rights that do not meet the performance conditions will lapse and will not be re-tested. The Company has a policy whereby directors and employees are prohibited from dealing in financial products issued or created over or in respect of securities (e.g. hedges or derivatives) which have the effect of reducing or eliminating the risk associated with any equity incentives that may be offered from time to time.
If the holder of an LTIP entitlement ceases to be employed before the end of the Performance Period for reasons other than redundancy, death, disability or illness, then the Performance Rights will automatically lapse, subject to Board discretion. If the holder of an LTIP entitlement ceases to be employed, before the Performance Period and the date of employment ceasing is on or after the first anniversary date of the Commencement Date, due to redundancy, death, disability or illness, then the number of Performance Rights will be reduced pro-rata to reflect the length of time during the Performance Period the employee was employed.
DIRECTORS’ REPORTcontinued

Annual Report 2015 Australian Pharmaceutical Industries Limited
19
More broadly, the Board retains absolute discretion over all awards made under the incentive award plans at API, including the LTIP. The LTIP is in the form of a grant of ‘rights to shares’ for exceptional performance over a three year period.
For grants made prior to 31 August 2014, the performance condition is based on the actual Return on Equity (ROE) achieved by the consolidated entity during the three (3) year period commencing at the beginning of the performance period when compared to the target ROE set by the Board for the same period (Target ROE). In both cases, ROE is expressed as a percentage created by dividing the net profit after tax for the relevant financial period by total shareholder equity for the relevant financial year. The target ROE is derived from the Corporate Plan for the three (3) years commencing at the beginning of the performance period.
Grants made after 1 September 2014 will include a target measure of 3 year earnings per share (EPS) compound annual growth (CAGR), in addition to the existing ROE measure. Each of the two measures (EPS and ROE) will contribute equally to a LTIP award. If ROE is achieved and EPS is not achieved, or vice versa, then the total available award would be halved. This means 50% of the award is dependent on the ROE metric, and 50% of the award is dependent on the EPS metric. EPS is derived from the Corporate Plan for the three years commencing at the beginning of the performance period. The EPS performance condition compares the actual EPS growth achieved by the API group during a 3 year performance period, against the target amount of EPS growth set by the Board for the same period. The EPS is the basic earnings per share disclosed in the Income Statement of the Financial Statements of API for each financial year during the performance period. The initial benchmark EPS that serves as the basis for calculating EPS growth, and the target EPS may be varied by the Board in its absolute discretion.
Managing Director and Chief Executive OfficerThe LTIP provides for Performance Rights equivalent in value to 60% of Fixed Remuneration.
Senior ExecutivesThe LTIP provides for Performance Rights equivalent in value to 25% of Fixed Remuneration.
2012 GrantDuring the 2014-15 financial year the Performance Rights relating to the 2012 grant lapsed as the hurdles set for this grant were not achieved.
2013 GrantAt 10 December 2013, performance rights (the 2013 grant) were granted with a performance period commencing on 1 September 2013 and ending 31 August 2016. Performance rights granted to the Managing Director and Chief Executive Officer were approved by shareholders at the 2014 Annual General Meeting. The performance condition, being API’s return on equity (ROE) for the exercise of performance rights will be assessed at the Remuneration Committee meeting after 31 August 2016, being the end of the performance period.
The ROE performance condition has the effect that:
– if a cumulative ROE of 21.35% is achieved for the three year period ending 31 August 2016, then 50% of the Rights will vest;
– if a cumulative ROE of 25.62% is achieved for the three year period ending 31 August 2016, then 100% of the Rights will vest; and
– if the cumulative ROE is between these two levels, then the number of rights that vest will be calculated on a straight line proportional basis.
2014 GrantAt 16 December 2014, performance rights (the 2014 grant) were granted with a performance period commencing on 1 September 2014 and ending 31 August 2017. Performance rights granted to the Managing Director and Chief Executive Officer were approved by shareholders at the 2015 Annual General Meeting. The performance condition, being API’s return on equity (ROE) and earnings per share (EPS) for the exercise of performance rights will be assessed at the Remuneration Committee meeting after 31 August 2017, being the end of the performance period.
The ROE performance condition has the effect that:
– if a cumulative ROE of 21.38% is achieved for the three year period ending 31 August 2017, then 20% of the Rights subject to the ROE Performance Condition will vest;
– if a cumulative ROE of 34.74% is achieved for the three year period ending 31 August 2017, then 100% of the Rights subject to the ROE Performance Condition will vest; and
– if the cumulative ROE is between these two levels, then the number of rights that vest will be calculated on a straight line proportional basis.

20
Australian Pharmaceutical Industries Limited Annual Report 2015
The EPS Compound Annual Growth Rate (CAGR) performance condition has the effect that:
– if CAGR of 7.5% is achieved for the three year period ending 31 August 2017, then 20% of the Rights subject to the CAGR Performance Condition will vest;
– if a CAGR of 10.0% is achieved for the three year period ending 31 August 2017, then 100% of the Rights subject to the CAGR Performance Condition will vest; and
– if the CAGR is between these two levels, then the number of rights that vest will be calculated on a straight line proportional basis.
E. Employment ContractsThe Company has entered into service contracts with Executive KMP. These contracts outline the components of remuneration paid to them but do not prescribe how remuneration levels are modified from year to year. Remuneration levels are reviewed each year to take into account any change in the scope of the role performed, and any other changes required to meet the principles of the Company’s remuneration policy outlined earlier.
Mr Stephen Roche, the Company’s Managing Director and Chief Executive Officer, has a contract of employment with the Company dated 27 September 2006. The contract continues until the employment is terminated in accordance with the contract. The contract states the following in respect of cessation of his employment:
– Mr Roche may resign from the Company by giving three months written notice;
– The Company may summarily terminate Mr Roche’s employment in specified circumstances with immediate effect and no termination benefits will apply other than accrued entitlements; and
– The Company may terminate Mr Roche’s employment by the giving of twelve months written notice and may make a termination payment in lieu of notice of up to twelve months fixed remuneration.
Mr Roche is subject to a twelve month non-compete restriction after cessation of his employment.
Mr Roche’s service contract has no fixed term.
The employment conditions and remuneration of the KMP are formalised in individual contracts of employment. No fixed terms are specified within these employment contracts and the following termination provisions apply:
KMP Term of Contract Notice Period by Company Notice Period by Employee
Graeme Fallet (separated 19 December 2014)
No fixed duration 6 months 6 months
Peter Mendo^ (appointed 21 January 2015)
No fixed duration 6 months 6 months
Richard Vincent No fixed duration 12 months 3 months
^ Appointed Interim Chief Financial Officer on 21 January 2015 on a fixed rate and fixed term contract that did not include participation in the 2014/15 STIP or 2014 LTIP. Appointed Chief Financial Officer on 1 September 2015. The notice period for the first twelve months of employment is 3 months and 6 months thereafter.
The Company may terminate an employment contract without cause by providing written notice, or making a payment in lieu of the notice period. Each employment contract provides for termination of employment without notice in circumstances sufficient to warrant summary termination. Each employment contract provides for a non-compete restriction of up to twelve (12) months after cessation of employment.
DIRECTORS’ REPORTcontinued

Annual Report 2015 Australian Pharmaceutical Industries Limited
21
F. Remuneration of Executives Including the CEODetails of the nature and amount of each major element of remuneration of each of the Key Management Personnel of the consolidated entity (including the Chief Executive Officer) are:
Short Term
Post
-em
ploy
men
t sup
eran
nuat
ion
cont
ribut
ions
Oth
er lo
ng te
rm (ii
)
Term
inat
ion
paym
ents
Equi
ty V
alue
of r
ight
s gr
ante
d un
der
STIP
Equi
ty V
alue
of r
ight
s gr
ante
d un
der
LTIP
(i)
Tota
l
Prop
ortio
n of
rem
uner
atio
n pe
rform
ance
rela
ted
Valu
e of
righ
ts a
s pr
opor
tion
of
remun
eration(%
)
Sala
ry &
Fee
s
Cas
h-Sh
ort-
term
ince
ntiv
es
Non
-mon
etar
y be
nefit
s
Tota
l
EXECUTIVES $ $ $ $ $ $ $ $ $ $ % %
Mr S P Roche – Managing Director and CEO31 August 2015 954,899 490,453 9,889 1,455,241 18,871 28,611 – 245,227 157,811 1,905,761 46.9 21.1
31 August 2014 910,723 – 15,834 926,557 17,943 22,996 – – 107,494 1,074,990 10.0 10.0
Mr R Vincent – Group General Manager, Business Development & Operations31 August 2015 566,382 117,452 2,535 686,369 18,871 15,037 – 87,168 37,736 845,181 28.7 14.8
31 August 2014 547,855 56,884 2,615 607,354 17,943 13,796 – 28,442 41,216 708,751 17.9 9.8
MrGFallet–ChiefFinancialOfficer(separated19December2014)31 August 2015 140,017 – – 140,017 6,261 – 340,209 (23,580) (112,444) 350,463 (38.8) (38.8)
31 August 2014 451,447 47,160 1,234 499,841 17,943 – – 23,580 34,097 575,461 18.2 10.0
MrPMendo–ChiefFinancialOfficer(appointed21January2015)31 August 2015 363,750 – 1,140 364,890 – – – – – 364,890 – –
(i) The value of performance rights is calculated at grant date using the Black-Scholes Option Pricing model. The value is allocated to each reporting period evenly over the performance period.
(ii) Other long term benefits are the amounts charged against profits for the year for accrued Long Service Leave entitlements.

22
Australian Pharmaceutical Industries Limited Annual Report 2015
SpecificBonusandEquityRemunerationAnalysis–AuditedAnalysis of Performance Rights over Equity Instruments granted as compensationDetails of the vesting profile of performance rights awarded as remuneration to each key management person are detailed below.
Executive Director
Performance Rights granted
Included in Remuneration
% vested in the
period
% forfeited
in the period*^
Financial period in which grant
vestsNumber ValuePerformance
period commences
Mr S P RocheLTIP 957,774 354,375 1 September 2012 (236,250) 0% 100% 31 August 2015
777,088 357,460 1 September 2013 119,153 0% 0% 31 August 2016
993,644 824,725 1 September 2014 274,908 0% 0% 31 August 2017
STIP Deferred Equity^ 490,453 1 September 2014 245,227 0% 0% 31 August 2017
Executive OfficersMr R VincentLTIP 364,562 134,888 1 September 2012 (89,926) 0% 100% 31 August 2015
295,888 136,108 1 September 2013 45,369 0% 0% 31 August 2016
297,444 246,879 1 September 2014 82,293 0% 0% 31 August 2017
STIP Deferred Equity 81,263 56,884 1 September 2013 28,442 0% 0% 31 August 2016
STIP Deferred Equity^ 117,452 1 September 2014 58,726 0% 0% 31 August 2017
Mr G FalletLTIP 303,364 112,245 1 September 2012 (74,830) 0% 100% 31 August 2015
245,309 112,842 1 September 2013 (37,614) 0% 100% 31 August 2016
STIP Deferred Equity 67,371 47,160 1 September 2013 (23,580) 0% 100% 31 August 2016
* The % forfeited in the year represents the reduction from the maximum number of performance rights available to vest due to the performance criteria not being achieved.
^ The precise number of performance rights awarded will be determined by dividing the value of the deferred component of the STIP award by the volume weighted average closing price of API shares on the ASX in the 10 day period after announcement of full year results.
DIRECTORS’ REPORTcontinued

Annual Report 2015 Australian Pharmaceutical Industries Limited
23
– The LTIP performance rights granted on 22 February 2013 (2012 grant) lapsed on 31 August 2015 without vesting.
– LTIP performance rights were granted on 10 December 2013 with a performance period commencing on 1 September 2013 and ending 31 August 2016 (the 2013 grant). The performance condition for the exercise of performance rights will be assessed shortly after 31 October 2016. The fair value of the performance rights is dependent upon the ROE performance condition for the entire grant and is $0.46 per share.
– LTIP performance rights were granted on 16 December 2014 with a performance period commencing on 1 September 2014 and ending 31 August 2017 (the 2014 grant). The performance conditions for the exercise of performance rights will be assessed shortly after 31 October 2017. The fair value of the performance rights is dependent upon the ROE and EPS performance conditions for the entire grant and is $0.95 per share.
– Performance rights relating to the STIP program commencing on 1 September 2013 and ending 31 August 2015 were granted on 7 October 2014. The performance rights have been valued at $0.77 per share reflecting the volume weighted average closing price of API shares on the ASX in the 10-day period after announcement of full year results. Performance rights will only vest if the Executive remains employed with the Company at the exercise date subject to forfeiture conditions.
– Performance rights relating to the STIP program commencing on 1 September 2014 and ending 31 August 2016 were granted on 7 October 2015. The precise number of performance rights awarded will be determined by dividing the value of the deferred component of the STIP award by the volume weighted average closing price of API shares on the ASX in the 10 day period after announcement of full year results. Performance rights will only vest if the Executive remains employed with the Company at the exercise date subject to forfeiture conditions.
– The performance rights were provided at no cost to the recipient.
Performance Rights Over equity instrumentsThe movement during the reporting period in the number of performance rights over ordinary shares in Australian Pharmaceutical Industries Limited held directly or beneficially, by each key management person, including their related parties, is as follows:
Held at 1 Sept 14
Granted as Compensation* Exercised
Otherchanges**
Held at 31 Aug 15
Vestedduring
the year
Vested andexercisableat 31 Aug 15
DirectorsMr S P Roche 1,734,862 993,644*** – (957,774) 1,770,732 – –
ExecutivesMr R Vincent 749,839 297,444 – (372,688) 674,595 – –
Mr G Fallet 622,782 – – (622,782) – – –
Held at 1 Sept 13
Granted as Compensation* Exercised
Otherchanges**
Held at 31 Aug 14
Vestedduring
the year
Vested andexercisableat 31 Aug 14
DirectorsMr S P Roche 1,768,935 777,088 – (811,161) 1,734,862 – –
ExecutivesMr R Vincent 671,539 385,277 – (306,977) 749,839 – –
Mr G Fallet 559,178 319,418 – (255,814) 622,782 – –
* Total KMP grants of 1,291,088 of rights over new issue shares were equal to 0.3% of common shares outstanding** Other changes represent performance rights that expired or were forfeited during the year as well as adjustments to deferred STIP performance rights
attributable to the difference between the estimated price and final exercise price as determined by the volume weighted average price in the 10 day period after announcement of the full year results.
No options held by key management personnel are vested but not exercisable at 31 August 2014 or 2015.*** Performance rights with respect to the Company’s Long Term Incentive Plan was approved by shareholders at the 2014 Annual General Meeting held
on 29 January 2015.
24
Australian Pharmaceutical Industries Limited Annual Report 2015
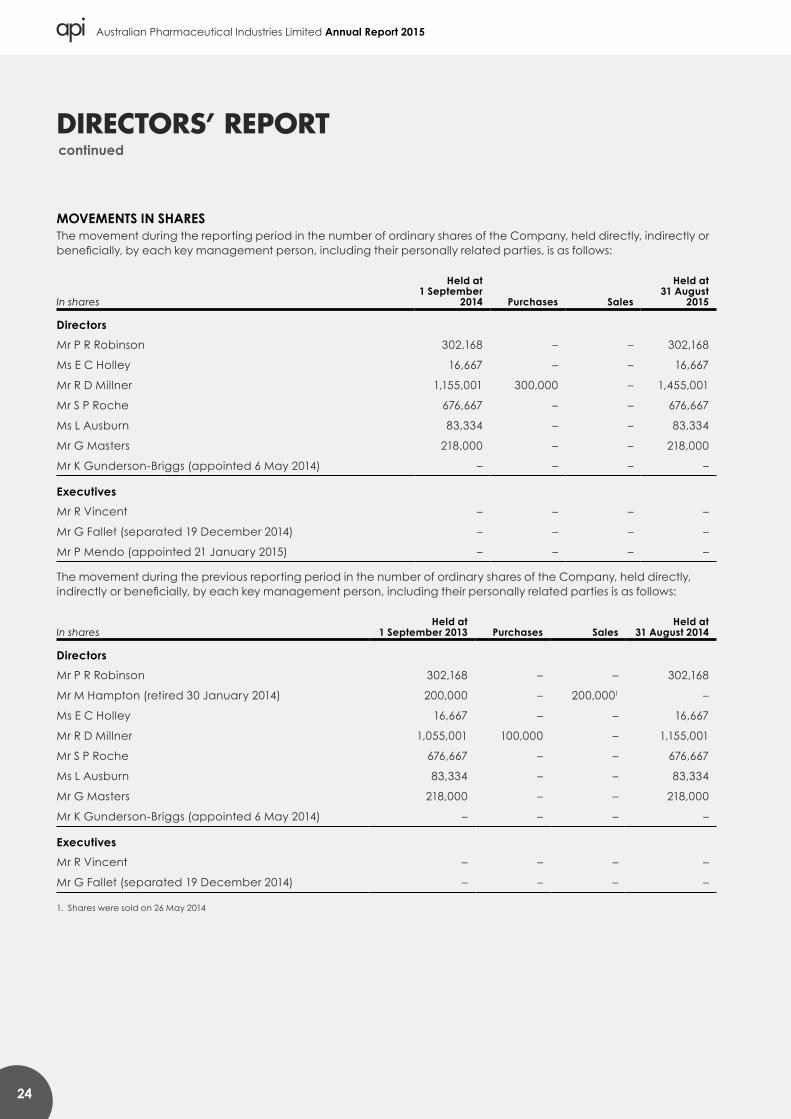
MOVEMENTS IN SHARESThe movement during the reporting period in the number of ordinary shares of the Company, held directly, indirectly or beneficially, by each key management person, including their personally related parties, is as follows:
In shares
Held at 1 September
2014 Purchases Sales
Held at 31 August
2015
DirectorsMr P R Robinson 302,168 – – 302,168
Ms E C Holley 16,667 – – 16,667
Mr R D Millner 1,155,001 300,000 – 1,455,001
Mr S P Roche 676,667 – – 676,667
Ms L Ausburn 83,334 – – 83,334
Mr G Masters 218,000 – – 218,000
Mr K Gunderson-Briggs (appointed 6 May 2014) – – – –
ExecutivesMr R Vincent – – – –
Mr G Fallet (separated 19 December 2014) – – – –
Mr P Mendo (appointed 21 January 2015) – – – –
The movement during the previous reporting period in the number of ordinary shares of the Company, held directly, indirectly or beneficially, by each key management person, including their personally related parties is as follows:
In sharesHeld at
1 September 2013 Purchases SalesHeld at
31 August 2014
DirectorsMr P R Robinson 302,168 – – 302,168
Mr M Hampton (retired 30 January 2014) 200,000 – 200,0001 –
Ms E C Holley 16,667 – – 16,667
Mr R D Millner 1,055,001 100,000 – 1,155,001
Mr S P Roche 676,667 – – 676,667
Ms L Ausburn 83,334 – – 83,334
Mr G Masters 218,000 – – 218,000
Mr K Gunderson-Briggs (appointed 6 May 2014) – – – –
ExecutivesMr R Vincent – – – –
Mr G Fallet (separated 19 December 2014) – – – –
1. Shares were sold on 26 May 2014
DIRECTORS’ REPORTcontinued

Annual Report 2015 Australian Pharmaceutical Industries Limited
25
Consequences of Performance on Shareholders’ Wealth – AuditedIn considering the consolidated entity’s performance and the benefits for shareholder wealth, the Remuneration Committee has regard to a range of indicators in respect of senior executive remuneration and linked these to the previously described short and long term incentives.
The following table presents these indicators over 5 periods, spanning 31 August 2011 to 31 August 2015, showing the impact of the Company’s performance on shareholder wealth, taking into account dividend payments, share price changes and returns of capital during the financial years:
31 August 2015
31 August 2014
31 August 2013
31 August 2012
31 August 2011*
Net profit/(loss) after tax ($ thousand) 43,126 (90,771) 24,292 30,283 (23,310)
Dividends paid – cents per share (franked) 4.50 3.50 3.25 3.00 2.50
Share price at 1.62 0.59 0.49 0.38 0.23
* Dividend paid 15 December 2011(unfranked)
SECTION 3 OTHER MATTERS REQUIRED BY SECTION 300A CORPORATIONS ACT 2001
A. Comments on Remuneration Report at the Company’s Most Recent AGM
The Company’s previous AGM was held on 29 January 2015. At this meeting:
– no comments were made on the Remuneration Report that was considered at this AGM;
– when the resolution that the Remuneration Report be adopted, at least 75% of the votes cast were in favour of adoption of that report; and
– performance rights issued to the Chief Executive Officer and Managing Director were approved.
B. Engagement of Remuneration Consultant The Remuneration Committee did not require a remuneration recommendation by an external remuneration adviser be undertaken during 2014-15 as it undertook a similar review in the prior year. While Guerdon Associates remained as the Committee’s independent external remuneration adviser, Guerdon Associates did not provide a remuneration recommendation as defined under the Corporations Act.
All advice provided by Guerdon Associates was provided only to Non-executive director members of the Committee. Contact with management was permitted to collect and verify data. Otherwise contact was only with Non-executive directors. All advice in relation to remuneration matters included a statement from Guerdon Associates that the advice was free from the undue influence of key management personnel to whom it may have related. Guerdon Associates only provided services to the Board. It did not receive fees from, or provide services to, management, ensuring there were no conflicts of interest. As a result, the Board is satisfied that the advice received was free from the undue influence of key management personnel to whom it related.
The Remuneration Report concludes at this point.
26
Australian Pharmaceutical Industries Limited Annual Report 2015
ENVIRONMENTAL REGULATIONThe consolidated entity’s operations are subject to environmental regulation under Commonwealth, State and New Zealand government legislation in relation to its manufacture of pharmaceutical products, retail stores and pharmaceutical distribution facilities.
Pharmaceutical and toiletries product manufacture – manufacturing plants operate under licence requirements relating to waste disposal, water and air pollution.
Wholesale distribution – distribution facilities operate under licence requirements relating to waste disposal, water and air pollution.
The Board believes that the consolidated entity has adequate systems in place for the management of its environmental requirements and is not aware of any significant breach of these environmental requirements as they apply to the consolidated entity.
CORPORATE SOCIAL RESPONSIBILITYThe Company has continued its involvement with the Priceline Sisterhood and has supported the establishment of The Priceline Sisterhood Foundation as a public ancillary fund registered with the Australian Charities and Not-for Profits Commission and registered with the ATO as a deductible gift recipient. The Sisterhood Foundation Board has a majority of independent directors who are responsible for deciding the strategic direction of the Foundation as well as determining appropriate policies dealing with fund raising and distribution of funds to chosen diverse charities.
SIGNIFICANT CHANGES IN THE STATE OF AFFAIRSThere were no significant changes in the nature of the activities of the consolidated entity during the period.
DIVIDENDSA dividend was paid during the year ended 31 August 2015 in respect of the year ended 31 August 2014. The dividend was at the rate of 2.0 cents per share, fully franked. The dividend totalled $9.762 million and was paid on 12 December 2014.
An interim dividend of 2.0 cents per share amounting to $9.762 million, fully franked in respect of half year ended 28 February 2015 was paid out of current year profits on 5 June 2015.
On 22 October 2015, a final dividend of 2.5 cents per share, fully franked, to be paid on 4 December 2015 out of the Profits Reserve amounting to $12.203 million was declared.
EVENTS SUBSEQUENT TO REPORTING DATEOn 22 October 2015, a final dividend of 2.5 cents per share, fully franked, to be paid out of the Profits Reserve on 4 December 2015, amounting to $12.203 million was declared.
Other than above, there has not arisen in the interval between the end of the financial period and the date of this report any item, transaction or event of a material and unusual nature likely, in the opinion of the Directors of the Company, to affect significantly the operations of the consolidated entity, the results of those operations or the state of affairs of the consolidated entity in future years.
LIKELY DEVELOPMENTSThe consolidated entity will continue to pursue its policy of improving the profitability and market share of each of its major operating businesses during the next financial year.
Further information regarding the business strategies of the consolidated entity and the expected results of those operations in future financial years have not been included in this report as disclosure of this information would likely result in unreasonable prejudice to the consolidated entity.
DIRECTORS’ REPORTcontinued

Annual Report 2015 Australian Pharmaceutical Industries Limited
27
DIRECTORS’ INTERESTSThe relevant direct and indirect and beneficial interest of each director, in the share capital of the Company, as notified by the Directors to the Australian Securities Exchange in accordance with section 205G(1) of the Corporations Act 2001 at the date of this report, is as follows:
Ordinary Shares
Performance Rights over
Ordinary Shares
Mr P R Robinson 302,168 –
Ms E C Holley 16,667 –
Mr R D Millner 1,455,001 –
Mr S P Roche 676,667 1,770,732
Dr M R Wooldridge (retired 31 December 2014) – –
Ms L Ausburn 83,334 –
Mr G J Masters 218,000 –
Mr K Gunderson-Briggs – –
PERFORMANCE RIGHTS GRANTED TO DIRECTORS AND OFFICERS OF THE COMPANYDetails of the performance rights granted to Directors and officers of the Company are set out in the Remuneration Report.
INSURANCE AND INDEMNIFICATION OF DIRECTORS AND OFFICERSDuring the year the Company paid a premium in respect of a contract insuring its Directors and officers against all liabilities to another person (other than the Company or a related body corporate) that may arise from their position, except where the liability arises out of conduct involving a lack of good faith. The contract covers any past, present or future director, secretary, executive officer or employee of the Company and its controlled entities. Further details have not been disclosed due to confidentiality provisions of the contract of insurance. The Directors are each parties to a Director’s Access and Insurance Deed. This Deed includes an indemnity by the Company (subject to and to the fullest extent permitted by applicable law) summarised as follows:
a. for any liability incurred by the Director as an officer of the Company;
b. for legal costs incurred by the Director in defending proceedings for a liability incurred as an officer of the Company, or in seeking relief from that liability under applicable law; and
c. for any liability for legal costs incurred by the Director in connection with legal proceedings of a Government or Regulatory authority which is brought against the Director because of their present or former capacity as on officer of the Company.
NON-AUDIT SERVICESDuring the year KPMG, the Company’s auditor, has performed certain other services in addition to their statutory duties.
The Board has considered the non-audit services provided during the period by the auditor and in accordance with written advice provided by resolution of the Audit and Risk Committee, is satisfied that the provision of those non-audit services during the period by the auditor is compatible with, and did not compromise, the auditor independence requirements of the Corporations Act 2001 for the following reasons:
– All non-audit services were subject to the corporate governance procedures adopted by the Company and have been reviewed by the Audit and Risk Committee to ensure they do not impact the integrity and objectivity of the auditor; and
– The non-audit services provided do not undermine the general principles relating to auditor independence as set out in APES 110 Code of Ethics for Professional Accountants, as they did not involve reviewing or auditing the auditor’s own work, acting in a management or decision making capacity for the Company, acting as an advocate for the Company, or jointly sharing risks and rewards.

28
Australian Pharmaceutical Industries Limited Annual Report 2015
Details of the amounts paid to the auditor of the Company, KPMG, and its related practices for audit and non-audit services provided during the period are set out in Note 29 to the financial statements.
LEAD AUDITOR’S INDEPENDENCE DECLARATIONThe Lead Auditor’s Independence Declaration is set out on page 29 and forms part of the Directors’ report for the financial year ended 31 August 2015.
ROUNDING OFF OF AMOUNTSThe Company is of a kind referred to in ASIC Class Order 98/100 dated 10 July 1998 and in accordance with that Class Order, amounts in the financial report and the Directors’ report have been rounded off to the nearest thousand dollars, unless otherwise stated.
Dated at Sydney, 21 October 2015
Signed in accordance with a resolution of the Directors:
Peter R Robinson Director
DIRECTORS’ REPORTcontinued
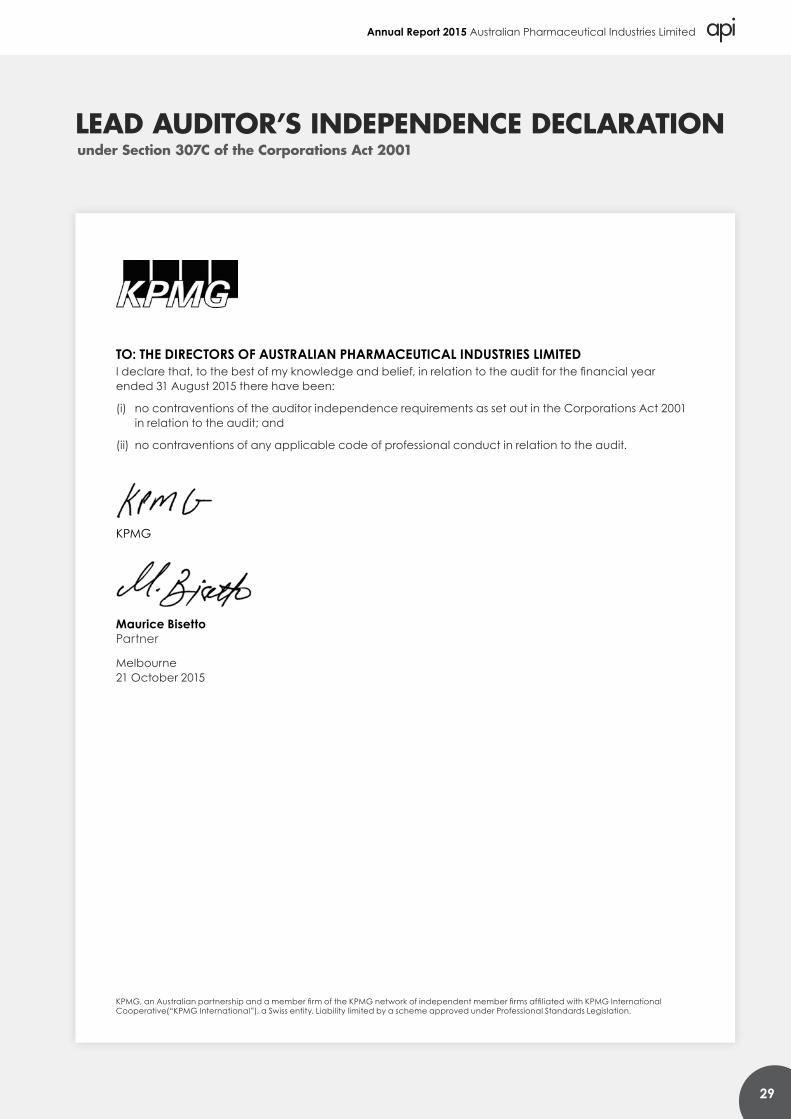
Annual Report 2015 Australian Pharmaceutical Industries Limited
29
TO: THE DIRECTORS OF AUSTRALIAN PHARMACEUTICAL INDUSTRIES LIMITED I declare that, to the best of my knowledge and belief, in relation to the audit for the financial year ended 31 August 2015 there have been:
(i) no contraventions of the auditor independence requirements as set out in the Corporations Act 2001 in relation to the audit; and
(ii) no contraventions of any applicable code of professional conduct in relation to the audit.
KPMG
Maurice Bisetto Partner
Melbourne 21 October 2015
LEAD AUDITOR’S INDEPENDENCE DECLARATIONunder Section 307C of the Corporations Act 2001
KPMG, an Australian partnership and a member firm of the KPMG network of independent member firms affiliated with KPMG International Cooperative(“KPMG International”), a Swiss entity. Liability limited by a scheme approved under Professional Standards Legislation.

30
Australian Pharmaceutical Industries Limited Annual Report 2015
INCOME STATEMENTfor the year ended 31 August 2015
In thousands of AUD Note
Consolidated
Year ended 31 August
2015
Year ended 31 August
2014
Revenue 4 3,457,400 3,345,946
Cost of sales (3,003,613) (2,914,142)
Gross profit 453,787 431,804Other income and expense 4 5,416 6,638
Warehousing and distribution expenses (128,083) (129,594)
Marketing and sales expenses (170,258) (168,656)
Administration and general expenses (86,836) (75,060)
Significant items
Non-current receivables impairment – (52,000)
Intangible assets impairment 16 – (59,000)
Result from operating activities 74,026 (45,868)Financial income 924 944
Financial expenses (15,064) (19,024)
Net financing costs 6 (14,140) (18,080)Share of loss of associates (net of income tax) 13 (431) (21,096)
Profit/(loss)beforetax 59,455 (85,044)Income tax expense 7 (16,329) (5,727)
Profit/(loss)fortheperiod 43,126 (90,771)Attributable to: Equity holders of the Company 43,126 (90,771)
Profit/(loss)fortheperiod 43,126 (90,771)
Earningspershareforprofit/(loss)attributabletotheordinaryshareholdersoftheCompany(cents):Basic - profit/(loss) per share 8 8.8 (18.6)
Diluted - profit/(loss) per share 8 8.7 (18.6)
Notes to the Income Statement are annexed.

Annual Report 2015 Australian Pharmaceutical Industries Limited
31
STATEMENT OF COMPREHENSIVE INCOMEfor the year ended 31 August 2015
In thousands of AUD
Consolidated
Year ended 31 August
2015
Year ended 31 August
2014
Profit/(loss)afterincometaxfortheperiod 43,126 (90,771)Items that will not be reclassified subsequently to the income statementRemeasurements of defined benefit liability, net of tax 41 40
Items that may be reclassified subsequently to the income statementExchange fluctuations on translation of foreign operations, net of tax 75 1,892
Effective portion of changes in fair value of cash flow hedges, net of tax (555) 734
Othercomprehensive(expense)/incomefortheperiod,netofincometax (480) 2,626Totalcomprehensiveincome/(expense)fortheperiodattributabletoequityholdersoftheparent company 42,687 (88,105)
Notes to the Statement of Comprehensive Income are annexed.

32
Australian Pharmaceutical Industries Limited Annual Report 2015
STATEMENT OF FINANCIAL POSITIONfor the year ended 31 August 2015
In thousands of AUD Note
Consolidated
As at 31 August
2015
As at 31 August
2014
AssetsCash and cash equivalents 27 28,047 23,526
Trade and other receivables 9 592,330 565,808
Inventories 10 364,206 342,482
Income tax receivable 12 2,426 –
Other investments 13 6,798 –
Total current assets 993,807 931,816Trade and other receivables 9 30,380 32,035
Other investments 13 – 7,229
Deferred tax assets 14 22,722 33,934
Property, plant and equipment 15 101,946 116,820
Intangible assets 16 193,693 167,232
Total non-current assets 348,741 357,250Total assets 1,342,548 1,289,066
LiabilitiesTrade and other payables 17 665,933 614,614
Loans and borrowings 18 58,254 20,966
Employee benefits 19 23,288 19,485
Provisions 20 30,245 31,261
Income tax payable 12 – 502
Total current liabilities 777,720 686,828Trade and other payables 17 8,616 8,108
Loans and borrowings 18 40,613 101,828
Employee benefits 19 5,215 5,629
Provisions 20 4,982 5,936
Total non-current liabilities 59,426 121,501Total liabilities 837,146 808,329Net assets 505,402 480,737
EquityShare capital 21 566,461 566,461
Reserves 43,605 18,940
Accumulated losses (104,664) (104,664)
Total equity 505,402 480,737
Notes to the Statement of Financial Position are annexed.

Annual Report 2015 Australian Pharmaceutical Industries Limited
33
STATEMENT OF CASH FLOWSfor the year ended 31 August 2015
In thousands of AUD Note
Consolidated
Year ended 31 August
2015
Year ended 31 August
2014
Cash receipts from customers 3,778,874 3,771,907
Cash payments to suppliers and employees (3,677,051) (3,681,977)
Cash generated from operations 101,823 89,930Interest received 924 944
Financing costs paid (15,102) (18,757)
Income taxes paid (7,589) (7,929)
Net cash from operating activities 27 80,056 64,188 Cash flows from investing activitiesProceeds from sale of stores, property, plant and equipment 691 1,628
Acquisition of property, plant and equipment (8,034) (10,863)
Deferred consideration received 15 1,820
Proceeds from employee loan 69 –
Payment for intangibles (22,600) (19,263)
Net cash used in investing activities (29,859) (26,678) Cash flows from financing activitiesRepayment of securitised receivables (17,591) (19,763)
Repayment of borrowings (7,155) (486)
Payment of finance lease liabilities (1,466) (600)
Dividends paid (19,525) (15,864)
Net cash used in financing activities (45,737) (36,713)
Net increase in cash and cash equivalents 4,460 797
Cash and cash equivalents at the beginning of the period 23,526 22,576
Effect of exchange rate fluctuations on cash held 61 153
Cash and cash equivalents at the end of the period 27 28,047 23,526
Notes to the Statement of Cash Flows are annexed.

34
Australian Pharmaceutical Industries Limited Annual Report 2015
STATEMENT OF CHANGES IN EQUITYfor the year ended 31 August 2015
In thousands of AUDShare
CapitalRetained
LossesProfits*
ReserveTranslation
ReserveHedgingReserve
EquityReserve
TotalEquity
Balance at 1 September 2014 566,461 (104,664) 17,177 (450) (38) 2,251 480,737
Total comprehensive income for the period Profit after tax – – 43,126 – – – 43,126
Total other comprehensive income/(expense) – – 41 75 (555) – (439)
Total comprehensive income/(expense) for the period – – 43,167 75 (555) – 42,687
Transactions with owners, recorded directly in equityContributions by and distributions to ownersDividends to equity holders – – (19,525) – – – (19,525)
Share based payment transactions – – – – – 1,503 1,503
Total contributions by and distributions to owners – – (19,525) – – 1,503 (18,022)
Balance at 31 August 2015 566,461 (104,664) 40,819 (375) (593) 3,754 505,402
In thousands of AUDShare
CapitalRetained
LossesProfits*
ReserveTranslation
ReserveHedgingReserve
EquityReserve
TotalEquity
Balance at 1 September 2013 566,461 (13,933) 33,041 (2,342) (772) 1,232 583,687
Total comprehensive income for the period Loss after tax – (90,771) – – – – (90,771)
Total other comprehensive income – 40 – 1,892 734 – 2,666
Total comprehensive (expense)/ income for the period – (90,731) – 1,892 734 – (88,105)
Transactions with owners, recorded directly in equityContributions by and distributions to ownersDividends to equity holders – – (15,864) – – – (15,864)
Share based payment transactions – – – – – 1,019 1,019
Total contributions by and distributions to owners – – (15,864) – – 1,019 (14,845)
Balance at 31 August 2014 566,461 (104,664) 17,177 (450) (38) 2,251 480,737
Notes to the Statement of Changes in Equity are annexed.
*Profitsreserve
The profits reserve represents current year profits transferred to a reserve to preserve the characteristic as a profit and not appropriate them against prior year accumulated losses. Such profits should be available to enable payment of franked dividends in the future should the directors declare by resolution.

Annual Report 2015 Australian Pharmaceutical Industries Limited
35
NOTES TO THE FINANCIAL STATEMENTSfor the year ended 31 August 2015
1. BASIS OF PREPARATION
a. Reporting EntityAustralian Pharmaceutical Industries Limited (the ‘Company’) is a company domiciled in Australia whose shares are publicly traded on the Australian Stock Exchange. The summarised information from the Company’s financial statements is included in Note 11.
The consolidated financial report of the Company included herein comprises the Company and its subsidiaries (together referred to as the ‘consolidated entity’ or the ‘Group’) and the consolidated entity’s interest in associates. The financial report was authorised for issue by the Directors on 22 October 2015.
b. Statement of ComplianceThe financial report is a general purpose financial report which has been prepared in accordance with Australian Accounting Standards (‘AAS’) adopted by the Australian Accounting Standards Board (‘AASB’) – including Australian Interpretations and the Corporations Act 2001.
Compliance with IFRSThe financial report of the consolidated entity also complies with International Financial Reporting Standards (IFRS) and interpretations adopted by the International Accounting Standards Board.
c. Basis of MeasurementThe financial report is presented in Australian dollars, which is the Company’s and consolidated entity’s functional currency.
The financial report is prepared on the historical cost basis except for derivative financial instruments and share based payments which are stated at their fair value.
The consolidated entity is of a kind referred to in ASIC Class Order 98/100 dated 10 July 1998 and in accordance with that Class Order, amounts in the financial report and Directors’ Report have been rounded off to the nearest thousand dollars, unless otherwise stated.
d. Accounting Estimates and JudgementsThe preparation of a financial report in conformity with Australian Accounting Standards requires management to make judgements, estimates and assumptions that affect the application of policies and reported amounts of assets and liabilities, income and expenses. Actual results may differ from these estimates. The estimates and underlying assumptions are reviewed on an ongoing basis. Revisions to accounting estimates are recognised in the period in which the estimate is revised and in future periods.
In particular, information about significant areas of estimation, uncertainty and critical judgements in applying accounting policies that have the most significant effect on the amount recognised in the financial statements, include:
Carrying value of goodwill and brand namesThe consolidated entity assesses the ability of goodwill and brand names to generate sufficient future economic benefits to recover its carrying amount. These calculations are based on Board approved budgets and the Board approved strategic plan. These calculations involve estimates and assumptions around income, expenses, working capital movements, capital expenditure and cash flows and to the best of management’s knowledge, the carrying amounts are appropriately supported. Refer Note 16.
Carrying value of receivables and loans to Pharmacy customersThe consolidated entity assesses whether trade receivables and pharmacy loans are appropriately provided for at each reporting date. These calculations involve estimates and assumptions around specific customers and to the best of management’s knowledge, impairment of receivables and pharmacy loans have been correctly and fairly recorded as at 31 August 2015. Refer Note 22.
Carrying value of inventoryThe consolidated entity assesses whether inventory is recorded at the lower of cost and Net Realisable Value and ensures all obsolete or slow moving stock is appropriately provided for at each reporting date. These calculations involve estimates and assumptions around specific inventories and to the best of management’s knowledge, inventories have been correctly and fairly recorded as at 31 August 2015.
Estimation of useful lives of assetsThe estimation of the useful lives of assets has been based on historical and industry experience and lease terms (for leased equipment). Adjustments to useful life are made when considered necessary.

36
Australian Pharmaceutical Industries Limited Annual Report 2015
NOTES TO THE FINANCIAL STATEMENTScontinued
1. BASIS OF PREPARATION (continued)Lease make good provisionThe consolidated entity assesses its provision for rehabilitation (“make good provisions”) under its lease agreements on distribution centres and support offices at each reporting date. Estimates and assumptions are made in determining the provision as there are numerous factors that will affect the ultimate liability payable. These factors include estimates of the extent and costs of rehabilitation activities, cost increases and changes in discount rates. Those uncertainties may result in future actual expenditure differing from the amounts currently provided. The provision at balance date represents the best estimate of the present value of the future make good costs required.
Share based payments The Company measures the cost of equity settled securities allocated to employees by reference to the fair value of the equity instruments at the date at which they are granted.
For the Executive long term incentive plans, the fair value of the performance share rights is determined using the Black Scholes pricing model.
e. Going Concern Basis of AccountingThe Directors have prepared the financial report on a going concern basis having considered the continuity of business operations, realisation of assets and settlement of liabilities in the ordinary course of business.
f. New Accounting Standards and InterpretationsThe Group has adopted the following new standards and amendments to standards, including any consequential amendments to other standards, with a date of initial application of 1 January 2013.
AASB 2013-3 Amendments to AASB 136 – Recoverable Amount Disclosures for Non-Financial Assets (applicable to annual reporting periods beginning on or after 1 January 2014)
The amendments remove the requirement to disclose recoverable amount when a cash generating unit (CGU) contains goodwill or indefinite lived intangible assets but there has been no impairment to require disclosure of the recoverable amount of an asset or CGU when an impairment loss has been recognised or reversed and to require detailed disclosure of how the fair value less costs of disposal has been measured when an impairment loss has been recognised or reversed. The amendments did not have any significant impact to the Group’s financial statements.
Standards issued but not yet adoptedA number of new standards and amendments to standards are effective for annual periods beginning after 1 January 2014; however the Group has not applied the following new or amended standards in preparing these consolidated financial statements.
IFRS 9 Financial InstrumentsIFRS 9 includes revised guidance on the classification and measurement of financial instruments, including a new expected credit loss model for calculating impairment on financial assets, and the new general hedge accounting requirements. It also carried forward the guidance on recognition and derecognition of financial instruments from IAS 39.
IFRS 9 is effective for annual reporting periods beginning on or after 1 January 2018 with early adoption permitted.
The Group is assessing the potential impact on its consolidated financial statements resulting from the application of IFRS 9.
IFRS 15 Revenue from Contracts with Customers IFRS 15 establishes a comprehensive framework for determining whether, how much and when revenue is recognised. It replaces existing revenue recognition guidance, including IAS 18 Revenue, IAS 11 Construction Contracts and IFRIC 13 Customer Loyalty Programmes.
IFRS 15 is effective for annual reporting periods beginning on or after 1 January 2017, with early adoption permitted.
The Group is assessing the potential impact on its consolidated financial statements resulting from the application of IFRS 15.
The following new or amended standards are not expected to have a significant impact on the Group’s consolidated financial statements:
– IFRS 14 Regulatory Deferral Accounts; – Accounting for Acquisitions of Interests in Joint
Operations (Amendments to IFRS 11); – Clarification of Acceptable Methods of Depreciation
and Amortisation (Amendments to IAS 16 and IAS 38); – Defined Benefit Plans: Employee Contributions
(Amendments to IAS 19); Annual Improvements to IFRSs 2010-2012 Cycle; and
– Annual Improvements to IFRSs 2011-2013 Cycle.The accounting policies set out below have been applied consistently to all periods presented in these consolidated financial statements by all entities in the consolidated entity unless otherwise stated.

Annual Report 2015 Australian Pharmaceutical Industries Limited
37
2. SIGNIFICANT ACCOUNTING POLICIES
a. Basis of Consolidationi. SubsidiariesSubsidiaries are all entities over which the Group has control. Control exists when the Company has the power, directly or indirectly, to govern the financial and operating policies of an entity so as to obtain benefits from its activities. In assessing control, potential voting rights that presently are exercisable or convertible are taken into account. The subsidiaries are fully consolidated from the date that control commences until the date that control ceases.
Investments in subsidiaries are carried at their cost, less any impairment, in the Company’s financial statements.
ii. Transactions Eliminated on ConsolidationIntra-group balances, income and expenses and unrealised gains arising from intra-group transactions, are eliminated in preparing the consolidated financial statements.
Unrealised losses are also eliminated, but only to the extent that there is no evidence of impairment.
Accounting policies of the Company and all subsidiaries in the Group are consistent.
iii. AssociatesAssociates are those entities for which the consolidated entity has significant influence, but not control, over the financial and operating policies. The consolidated financial statements include the consolidated entity’s share of the total recognised gains and losses of associates on an equity accounted basis, from the date that significant influence commences until the date that significant influence ceases. When the consolidated entity’s share of losses exceeds its interest in an associate, the consolidated entity’s carrying amount is reduced to nil and recognition of further losses is discontinued except to the extent that the consolidated entity has an obligation or has made payments on behalf of an associate.
Unrealised gains arising from transactions with associates and jointly controlled entities are eliminated to the extent of the consolidated entity’s interest in the entity with adjustments made to the “Investment in associates” and “Share of associate’s net profit” accounts.
Gains and losses are recognised as the contributed assets are consumed or sold by the associates and jointly controlled entities or, if not consumed or sold by the associate or jointly controlled entity, when the consolidated entity’s interest in such entities is disposed of.
In the Company’s financial statements, investments in associates are carried at cost.
b. Foreign Currencyi. Foreign Currency TransactionsTransactions in foreign currencies are initially translated into Australian currency at the exchange rate ruling at the date of the transaction. Monetary assets and liabilities denominated in foreign currencies at the balance sheet date are translated into Australian currency at the exchange rate ruling at that date. Foreign exchange gains and losses arising on translation are recognised in the income statement in other income and expense. Non-monetary assets and liabilities that are measured in terms of historical cost in a foreign currency are translated using the exchange rate at the date of the transaction. Non-monetary assets and liabilities denominated in foreign currencies that are stated at fair value are translated to Australian dollars at foreign exchange rates ruling at the dates the fair value was determined.
ii. Foreign OperationsThe assets and liabilities of foreign controlled subsidiaries, including goodwill and fair value adjustments arising on consolidation, are translated to Australian currency at foreign exchange rates current at the balance sheet date, while revenues and expenses are translated at rates approximating to the foreign exchange rates ruling at the dates of the transactions.
Foreign exchange differences arising on translation are recognised in other comprehensive income, and taken to the foreign currency translation reserve in equity.
c. Financial Instrumentsi. Non-derivative Financial InstrumentsNon-derivative financial instruments comprise investments in equity and debt securities, trade and other receivables, cash and cash equivalents, loans and borrowings, and trade and other payables.
Financial instruments subject to material deferred settlement terms are recognised at their present value discounted using an interest rate that reflects the credit risk applicable to the counterparty equivalent to the extent of any underlying security. The unwinding of discounting is recognised in net finance costs.
ReceivablesThe majority of trade debtors are settled within 40-120 days of the invoice date and are carried at amounts due less provision for impairment. They are presented as current assets unless collection is not expected for more than 12 months after the reporting date.

38
Australian Pharmaceutical Industries Limited Annual Report 2015
2. SIGNIFICANT ACCOUNTING POLICIES (continued)When receivables are considered to be impaired, the carrying amount of the asset is reduced through the use of a provision for impairment account and the amount of the loss is recognised in profit or loss.
When a trade receivable is uncollectible, it is written off against the provision for impairment account for trade receivables. Subsequent recoveries of amounts previously written off are credited in profit or loss.
Trade payablesLiabilities are recognised for amounts to be paid in the future for goods or services provided prior to the end of the reporting period. Trade accounts payable are normally settled within 30-60 days of the invoice date.
Interest bearing liabilitiesInterest bearing liabilities are classified as current liabilities unless there is an unconditional right to defer settlement of the liability for at least 12 months after balance date.
Interest-bearing loans and borrowings are recognised initially at fair value less attributable transaction costs.
Cash and cash equivalents These comprise of cash balances and call deposits. Bank overdrafts that are repayable on demand and form an integral part of the consolidated entity’s cash management are included as a component of cash and cash equivalents for the purpose of the statement of cash flows.
ii. Derivative Financial InstrumentsThe consolidated entity sometimes holds derivative financial instruments to hedge its interest rate and foreign currency risk exposures.
Derivatives are recognised initially at fair value; attributable transaction costs are recognised in profit or loss when incurred. Subsequently derivatives are measured at fair value, and changes therein are accounted for as described below.
Cash Flow HedgesChanges in the fair value of the derivative hedging instrument designated as a cash flow hedge are recognised directly in other comprehensive income to the extent that the hedge is effective. To the extent that the hedge is ineffective, changes in fair value are recognised in profit or loss.
If the hedging instrument no longer meets the criteria for hedge accounting, expires or is sold, terminated or exercised, then hedge accounting is discontinued prospectively. The cumulative gain or loss previously recognised in other comprehensive income remains there until the forecast transaction occurs. When the hedged item is a non-financial asset, the amount recognised in equity is transferred to the carrying amount of the asset when it is recognised. In other cases the amount recognised in other comprehensive income is transferred to profit or loss in the same period that the hedged item affects profit or loss.
iii. Ordinary SharesIssued and paid up capital is recognised at the fair value of the consideration received by the Company. Incremental costs directly attributable to the issue of new shares are recognised as a reduction from equity, net of any related tax benefit.
DividendsDividends are recognised as a liability when an obligation to pay a dividend arises, following declaration of the dividend by the Company’s Board of Directors.
iv. Financial GuaranteesFinancial guarantee contracts are recognised as a financial liability when it becomes probable that guarantees would be called upon in the foreseeable future, for the maximum potential obligation that the consolidated entity has an obligation to meet. The liability is not discounted.
v. Securitised ReceivablesSecuritised receivables are recognised on the balance sheet to reflect the fact that the consolidated entity assumes risks and rewards of the receivables collection performance.
d. Property, Plant and Equipmenti. Recognition and MeasurementItems of property, plant and equipment are stated at cost less accumulated depreciation and impairment losses. Purchased software that is integral to the functionality of the equipment is capitalised as part of that equipment.
Subsequent expenditure is added to the carrying value of the asset when it is probable that future economic benefits, in excess of the original assessed standard of performance of the existing asset will flow to the operation. All other subsequent expenditure is expensed in the period in which it is incurred.
NOTES TO THE FINANCIAL STATEMENTScontinued

Annual Report 2015 Australian Pharmaceutical Industries Limited
39
ii. Disposal and De-recognition of Property, Plant and Equipment
An item of property, plant and equipment is derecognised upon disposal or when no future economic benefits are expected to arise from the continued use of the asset. Any gain or loss arising on de-recognition of the asset is included in the income statement in the period the item is derecognised.
iii. DepreciationProperty, plant and equipment, other than freehold land, are depreciated or amortised on a straight-line basis at various rates dependent upon the estimated average useful life for that asset. The estimated useful lives of each class of asset are as follows:
– buildings 40 years – plant and equipment 3-15 years – fixtures and fittings 3-20 years
The residual value, the useful life and the depreciation method applied to an asset are reassessed at least annually.
e. Intangible Assets and GoodwillIntangibles are carried at cost less accumulated amortisation and impairment losses where applicable. Intangible assets acquired separately are capitalised at cost or if arising from a business combination at fair value as at the date of acquisition.
i. Goodwill
Business Combinations prior to 1 May 2004Goodwill is included on the basis of its deemed cost, which represents the amount recorded under previous GAAP.
Business Combinations since 1 May 2004All business combinations are accounted for by applying the purchase method. Goodwill represents the excess of the cost of the acquisition over the fair value of the net identifiable assets acquired. Acquisition-related costs are recognised in the income statement as incurred.
Goodwill is stated at cost less any accumulated impairment losses. An impairment loss recognised for goodwill is not reversed in subsequent periods.
In respect of associates, the carrying amount of goodwill is included in the carrying amount of the investment in the associate. Negative goodwill arising on an acquisition is recognised directly in profit or loss.
ii. Brand NamesBrand names acquired are included in the financial statements at cost less accumulated impairment losses.
Brand names are not amortised as the Directors believe the useful lives of these assets are considered indefinite at this point of time. The consolidated entity’s brand names have an unlimited legal life and based on industry experience it is rare for leading brand names to disappear or become commercially or technically obsolete. If an event occurs which results in an impairment of the value of a brand name then the difference between recoverable amount and carrying value is charged against profit and loss in the year in which the event occurred.
Independent valuations of brand names are obtained during the year of acquisition. Expenditure incurred in developing, maintaining and enhancing brand names is charged against profit and loss in the year in which it is incurred.
iii. Research and DevelopmentExpenditure on research activities, undertaken with the prospect of gaining new technical knowledge and understanding, is recognised in the income statement as an expense as incurred.
Expenditure on development activities, whereby research findings are applied to a plan or design for the production of new or substantially improved products and processes, is capitalised if the product or process is technically and commercially feasible and the consolidated entity has sufficient resources to complete development. The expenditure capitalised includes the cost of materials, direct labour and appropriate proportion of overheads. Other development expenditure is recognised in profit and loss as an expense as incurred. Capitalised development expenditure is stated at cost less accumulated amortisation and impairment losses.
Capitalised development costs are initially recorded at cost and amortised on a straight line basis over the estimated useful lives but not greater than a period of 4 years.
iv. SoftwareCapitalised software costs are initially recorded at cost and amortised on a straight line basis over the estimated useful lives but not greater than a period of 7 years.
v. Subsequent ExpenditureSubsequent expenditure is capitalised only when it increases the future economic benefits embodied in the specific asset to which it relates. All other expenditure is expensed as incurred.
40
Australian Pharmaceutical Industries Limited Annual Report 2015
2. SIGNIFICANT ACCOUNTING POLICIES (continued)
f. InventoriesInventories are stated at the lower of cost and net realisable value. Net realisable value is the estimated selling price in the ordinary course of business, less the estimated costs of completion and selling expenses.
The cost of inventories is generally determined on a weighted average basis and includes expenditure incurred in acquiring the inventories and bringing them to their existing location and condition net of any rebates or trade discounts received or receivable. In the case of manufactured inventories and work in progress, cost includes an appropriate share of overheads based on normal operating capacity.
g. ImpairmentFinancial AssetsA financial asset is considered to be impaired if objective evidence indicates that one or more events have had a negative effect on the estimated future cash flows of that asset.
Objective evidence that financial assets are impaired can include default or delinquency by a debtor, restructuring of an amount due to the consolidated entity on terms that the consolidated entity would not consider otherwise, indications that a debtor or issuer will enter bankruptcy.
An impairment loss in respect of a financial asset measured at amortised cost is calculated as the difference between its carrying amount, and the present value of the estimated future cash flows discounted at the original effective interest rate, including cash flows from the realisation of security held, if applicable.
Individually significant financial assets are tested for impairment on an individual basis. The remaining financial assets are assessed collectively in groups that share similar credit risk characteristics.
In determining the appropriate provision for impairment of pharmacy receivables, consideration is given to financial guarantees provided to individual debtors and debtor groups which are recorded as current liabilities where it is considered probable that the guarantees will be called. In assessing collective impairment the consolidated entity uses historical trends of the probability of default, timing of recoveries and the amount of loss incurred, adjusted for management’s judgement as to whether current economic and credit conditions are such that the actual losses are likely to be greater or less than suggested by historical trends.
All impairment losses are recognised in profit or loss.
Non-Financial AssetsThe carrying amounts of the consolidated entity’s tangible assets, other than inventories (refer Note 2 (f)) and deferred tax assets (refer Note 2 (m)), are reviewed at each reporting date to determine whether there is any indication of impairment. If any such indication exists, the asset’s recoverable amount is estimated (refer below).
An impairment loss is recognised whenever the carrying amount of an asset or its cash-generating unit exceeds its recoverable amount. Impairment losses are recognised in the income statement. Impairment losses recognised in respect of cash-generating units are allocated first to reduce the carrying amount of goodwill allocated to the cash generating unit and then to reduce the carrying amount of the other assets in the unit (group of units) on a pro rata basis.
Calculation of Recoverable AmountThe recoverable amount of an asset or cash-generating unit is the greater of its value in use and its fair value less costs to sell. In assessing value in use, the estimated future cash flows are discounted to their present value using a pre-tax discount rate that reflects current market assessments of the time value of money and the risks specific to the asset.
For goodwill and intangible assets that have indefinite lives or that are not yet available for use, recoverable amount is estimated annually and whenever there is an impairment indicator.
Reversals of ImpairmentAn impairment loss in respect of goodwill is not reversed.
In respect of other assets, an impairment loss is reversed if there has been a change in the estimates used to determine the recoverable amount.
An impairment loss is reversed only to the extent that the asset’s carrying amount does not exceed the carrying amount that would have been determined, net of depreciation or amortisation, if no impairment loss had been recognised.
h. LeasesLeases in terms of which the consolidated entity assumes substantially all the risks and rewards of ownership are classified as finance leases. Other leases are classified operating leases. Assets, subject to finance leases, are capitalised. The initial amount of the lease asset is the lower of fair value and the present value of the minimum lease payments. The corresponding liability represents the future rental obligations net of finance charges. The leased assets are amortised on a straight-line basis over the life of the relevant lease.
NOTES TO THE FINANCIAL STATEMENTScontinued

Annual Report 2015 Australian Pharmaceutical Industries Limited
41
Lease liabilities are reduced by repayments of principal. The interest components of lease payments are charged against profit or loss.
Operating leases are not capitalised. Operating lease payments are charged to profit or loss as incurred on a straight-line basis. Lease incentives received are recognised as an integral part of the total lease expense and spread over the lease term.
i. EmployeeBenefitsi. Wages, Salaries, Annual Leave and Non-
monetary BenefitsLiabilities for employee benefits for wages, salaries, annual leave and sick leave that are expected to be settled within 12 months of the reporting date represent present obligations resulting from employees’ services provided to reporting date, are calculated at undiscounted amounts based on remuneration wage and salary rates that the consolidated entity expects to pay as at reporting date including related on-costs, such as workers compensation insurance and payroll tax. Benefits expected to be settled after 12 months from the reporting date are measured at the present value of the estimated future cash outflows to be made in respect of services provided by employees up to the reporting date. Non-accumulating non-monetary benefits, such as cars and free or subsidised goods and services, are expensed based on the net marginal cost to the consolidated entity as the benefits are taken by the employees.
ii. Long Service LeaveThe provision for long service leave represents the present value of the estimated future cash outflows to be made by the consolidated entity resulting from employees services provided up to the reporting date. The provision is calculated using expected future increases in wage and salary rates including related on-costs and expected settlement dates, and is discounted using Corporate Bonds rates at the reporting date which most closely match the terms of maturity of the related liabilities. The unwinding of the discount is treated as long service leave expenses.
iii. Defined Contribution PlansObligations for contributions to defined contribution superannuation funds are recognised as an expense in profit and loss as incurred.
iv. Defined Benefit PlansThe consolidated entity’s net obligation in respect of defined benefit pension plans is calculated by estimating the amount of future benefit that employees have earned in return for their service in the current and prior periods; that benefit is discounted to determine its present value, and the fair value of any plan assets is deducted.
The discount rate is the yield at the balance sheet date on Corporate Bonds that have maturity dates approximating the terms of the consolidated entity’s obligations. The calculation is performed by a qualified actuary using the projected unit credit method.
When the benefits of a plan are improved, the portion of the increased benefit relating to past service by employees is recognised as an expense in the income statement on a straight-line basis over the average period until the benefits become vested. To the extent that the benefits vest immediately, the expense is recognised immediately in the profit and loss.
Remeasurements of the net defined benefit liability, which comprise actuarial gains and losses, and the return on plan assets (excluding interest), are recognised immediately in other comprehensive income. The Group determines the net interest expense (income) on the net defined benefit liability (asset) for the period by applying the discount rate used to measure the defined benefit obligation at the beginning of the annual reporting period to the then-net defined benefit liability (asset), taking into account any changes in the net defined benefit liability (asset) during the period as a result of contributions and benefit payments. Net interest expense and other expenses related to defined benefit plans are recognised in profit or loss.
Past service cost is the increase in the present value of the defined benefit obligation for employee services in prior periods, resulting in the current period from the introduction of, or changes to, post-employment benefits or other long-term employee benefits. Past service costs may either be positive (where benefits are introduced or improved) or negative (where existing benefits are reduced).
v. Share-based Payment TransactionsShare Performance Rights granted to employees are recorded at fair value and recognised as an expense with a corresponding increase in equity. At the end of each reporting period, the Group revises its estimate of the number of equity instruments expected to vest. The impact of the revision of the original estimates, if any, is recognised in profit or loss such that the cumulative expense reflects the revised estimate, with a corresponding adjustment to the options/performance rights reserve. The fair value is initially measured at grant date and spread over the period during which the employees become unconditionally entitled to payment. The fair value of the Share Performance Rights is measured based on the Black-Scholes Option Pricing model for the ROE performance hurdle, taking into account the terms and conditions upon which the instruments were granted.

42
Australian Pharmaceutical Industries Limited Annual Report 2015
2. SIGNIFICANT ACCOUNTING POLICIES (continued)
j. ProvisionsA provision is recognised when the consolidated entity has a present legal or constructive obligation and can be reliably measured as a result of a past event, and it is probable that an outflow of economic benefits will be required to settle the obligation, the timing or amount of which is uncertain. Provisions are determined by discounting the expected future cash flows at a pre-tax rate that reflects current market assessments of the time value of money and, where appropriate, the risks specific to the liability.
i. Onerous LeasesA provision for onerous leases is recognised when the expected benefits to be derived by the consolidated entity from a lease contract are lower than the unavoidable cost of meeting its obligations under the lease contract. The provision is measured at the present value of the lower of the expected cost of terminating the lease contract and the expected net cost of continuing with the lease contract.
ii. Dismantling and Make GoodThe provision is the best estimate of the present value of the expenditure required to complete dismantling and make good obligations in relation to properties held under operating leases at the reporting date. Future dismantling and make good costs are reviewed annually and any changes are reflected in the present value of the Make Good provision at the end of the reporting period.
The amount of the provision for future dismantling is capitalised and is depreciated over the useful life. Make Good costs are provided for over the lease term as the make good obligation arises. The unwinding of the effect of discounting on the provision is recognised as a finance cost.
iii. Provision for Sister ClubThe provision for Sister Club points which are convertible quarterly by customers in the form of gift vouchers is based upon the expected cost to the consolidated entity on redemption of Sister Club vouchers. A redemption rate is applied based on historical experience and is updated quarterly.
k. Revenuei. Sale of GoodsRevenue from the sale of goods is recognised in the income statement when the significant risks and rewards of ownership have been transferred to the buyer, usually when goods are delivered to manufacturing and wholesale customers or the point of sale for retail customers.
No revenue is recognised if there are significant uncertainties regarding recovery of the consideration due, the costs incurred or to be incurred cannot be measured reliably, there is a risk of return of goods, or there is continuing management involvement with the goods. Revenue is recognised net of returns, allowances, trade discounts and volume rebates.
ii. Community Service Obligation (“CSO”)A Community Service Obligation is an arrangement whereby the government provides a pool of funding which is available to qualifying wholesalers to provide services that would not otherwise be provided by that organisation in the pursuit of its other objectives. In the Group’s case this requirement is around minimum delivery obligations Australia wide. The Government provides income to the Group to compensate for the higher expenditure incurred to meet these minimum delivery obligations.
Revenue from CSO is recognised when the consolidated entity has complied with the conditions attached to the obligation and has reasonable assurance that the income will be received.
iii. Other Revenue
Membership and brand fees The Priceline, Soul Pattinson and Pharmacist Advice banner stores pay fees to the Group. These fees entitle the stores to access certain Group’s discounts (specifically applicable to banner members) and other benefits including participation in Group catalogue advertising. This revenue is recognised over the period of the year which matches the period over which the services are rendered.
Franchise service charges This category primarily covers fees billed by the Group to franchisees for various operational services including store development, lease negotiation, human resource & information technology assistance. This revenue is recognised once the delivery service has been performed.
NOTES TO THE FINANCIAL STATEMENTScontinued

Annual Report 2015 Australian Pharmaceutical Industries Limited
43
Marketing services and promotional incomeThis category relates to income received from suppliers relating to promotional services rendered. This revenue is recognised once the service obligations have been performed.
Loyalty Card (Sister Club formerly known as Clubcard)A provision for loyalty card deferred revenue is recognised as a reduction in sales revenue when the underlying products or services are sold. The deferred revenue is based on historical loyalty card data and a weighting of all possible outcomes against their associated probabilities. Revenue is then earned when loyalty card awards are redeemed.
iv. Interest on Overdue AccountsInterest revenue is recognised on financial assets on an accrual basis when it is considered probable of being recovered. Interest fee revenue includes interest earned on loans to customers and late fee charges on overdue debtors.
l. Net Financing CostsFinance costs are recognised as expenses in the period in which they are incurred, unless directly attributable to the acquisition of, or production of, a qualifying asset which are capitalised as part of the cost of that asset using the weighted average cost of borrowings. Finance costs include:
– interest on bank overdrafts, short-term and long-term borrowings;
– interest payable on debtors’ securitisation programs; – finance lease charges; and – amortisation of ancillary costs incurred in connection
with the arrangement of borrowings. Interest income is recognised in the income statement as it accrues, using the effective interest method. Dividend income is recognised in the income statement on the date the entity’s right to receive payments is established.
m. Income TaxIncome tax on the profit or loss for the year comprises current and deferred tax. Income tax is recognised in the income statement except to the extent that it relates to items recognised directly in equity, in which case it is recognised in equity.
Current tax is the expected tax payable on the taxable income for the year, using tax rates enacted or substantively enacted at the balance sheet date, and any adjustment to tax payable in respect of previous years.
Deferred tax is recognised using the balance sheet liability method, providing for temporary differences between the carrying amounts of assets and liabilities for financial reporting purposes and the amounts used for taxation purposes. The following temporary differences are not provided for: initial recognition of goodwill, the initial recognition of assets or liabilities that arises in a transaction that is not a business combination and affects neither accounting nor taxable profit at the time of the transaction, and differences relating to investments in subsidiaries to the extent that they will probably not reverse in the foreseeable future. The amount of deferred tax provided is based on the expected manner of realisation or settlement of the carrying amount of assets and liabilities, using tax rates enacted or substantively enacted at the balance sheet date.
A deferred tax asset is recognised only to the extent that it is probable that future taxable profits will be available against which the asset can be utilised. The carrying amount of deferred income tax assets is reviewed at each reporting period and reduced to the extent that it is no longer probable that the sufficient taxable profit will be available to allow all or part of the deferred tax assets to be utilised.
Additional income taxes that arise from the distribution of dividends are recognised at the same time as the liability to pay the related dividend.
n. Assets held for SaleNon-current assets, or disposal groups comprising assets and liabilities, are classified as held-for-sale if it is highly probable that they will be recovered primarily through sale rather than through continuing use.
Such assets, or disposal groups, are generally measured at the lower of their carrying amount and fair value less costs to sell. Any impairment loss on a disposal group is allocated first to goodwill, and then to the remaining assets and liabilities on a pro rata basis, except that no loss is allocated to inventories, financial assets, deferred tax assets, employee benefit assets, investment property or biological assets, which continue to be measured in accordance with the Group’s other accounting policies. Impairment losses on initial classification as held-for-sale or held-for-distribution and subsequent gains and losses on remeasurement are recognised in profit or loss.
Once classified as held-for-sale, intangible assets and property, plant and equipment are no longer amortised or depreciated, and any equity-accounted investee is no longer equity accounted.

44
Australian Pharmaceutical Industries Limited Annual Report 2015
2. SIGNIFICANT ACCOUNTING POLICIES (continued)
o. Operating SegmentAn operating segment is a component of the consolidated entity that engages in business activities from which it may earn revenues and incur expenses, including revenues and expenses that relate to the transactions with any of the consolidated entity’s other components. All operating segments’ operating results are regularly reviewed by the consolidated entity’s Chief Executive Officer (CEO) to make decisions about resources to be allocated to the segment and assess its performance and for which discrete financial information is available.
Segment results that are reported to the CEO include items directly attributable to a segment to the gross profit level.
3. OPERATING SEGMENTSAASB 8 Operating Segments requires a management approach under which segment information is presented on the same basis as that used for internal reporting provided to the Chief Operating Decision Maker (CODM) of the Group. The CODM has been identified as the Chief Executive Officer (CEO).
For internal reporting and risk management purposes, the consolidated entity is divided into three reportable segments as described below. The reportable segments offer different products and services, and are managed separately because they require different marketing strategies. For each of the reportable segments, the CEO reviews internal management reports on at least a monthly basis. The following summary describes the operations in each of the consolidated entity’s reportable segments:
Pharmacy DistributionAustralia – Distribution of pharmaceutical and medical products to pharmacies, provider of retail services to pharmacy customers.
RetailingAustralia – The purchase and sale of various health, beauty and lifestyle products within the retail industry in Australia.
Manufacturing New Zealand – Manufacturer and owner of rights of pharmaceutical medicines and consumer toiletries.
Monthly management reports provided to the CEO report business units at a gross margin level only, with functional costs not allocated by business unit.
Grossprofitconsistsofthefollowing:Pharmacy DistributionGross profit from sales inclusive of Community Service Obligation income, banner membership fees and other Pharmacy services.
RetailingGross profit from sales inclusive of franchise fees, Sister Club income and net advertising recoveries.
NOTES TO THE FINANCIAL STATEMENTScontinued

Annual Report 2015 Australian Pharmaceutical Industries Limited
45
3. OPERATING SEGMENTS (continued)
In thousands of AUD
Pharmacy Distribution Australia
Retailing Australia
Manufacturing New Zealand Eliminations Consolidated
Aug 15 Aug 14 Aug 15 Aug 14 Aug 15 Aug 14 Aug 15 Aug 14 Aug 15 Aug 14
RevenueExternal revenue 2,391,326 2,400,587 872,052 751,653 42,354 36,093 – – 3,305,732 3,188,333
External services 84,541 87,419 67,127 70,194 – – – – 151,668 157,613
Inter-segment revenue* – – – – 5,975 9,503 (5,975) (9,503) – –
Total segment revenue 2,475,867 2,488,006 939,179 821,847 48,329 45,596 (5,975) (9,503) 3,457,400 3,345,946
Reportable segment gross profit 212,784 214,473 218,306 197,276 22,697 20,055 – – 453,787 431,804
Reportable segment profit – – – – 2,838 971 – – – –
* All inter- segment sales are on an arm’s length basis.
ReconciliationofReportableSegmentProfit
In thousands of AUD
Year ended 31 August
2015
Year ended 31 August
2014
Total profit for reportable segments 453,787 431,804
Unallocated amountsOther income and expense 5,416 6,638
Warehousing and distribution expenses (128,083) (129,594)
Marketing and sales expenses (170,258) (168,656)
Administration and general expenses (86,836) (75,060)
Significant items
Non-current receivables impairment – (52,000)
Intangible assets impairment – (59,000)
Results from operating activities 74,026 (45,868)Net financing costs (14,140) (18,080)
Share of loss of equity accounted investments (431) (21,096)
Consolidatedprofit/(loss)beforetax 59,455 (85,044)

46
Australian Pharmaceutical Industries Limited Annual Report 2015
4. REVENUE, OTHER INCOME AND EXPENSE
In thousands of AUD
Year ended 31 August
2015
Year ended 31 August
2014
RevenueSales revenue 3,305,732 3,188,333
Service revenue 151,668 157,613
3,457,400 3,345,946Other income and expenseGain on disposal of stores, property, plant and equipment 346 1,093
Interest fee income 4,959 5,441
Net foreign exchange gain 111 104
5,416 6,638
5. PERSONNEL EXPENSES
In thousands of AUD
Year ended 31 August
2015
Year ended 31 August
2014
Wages and salaries 171,606 158,884
Other associated personnel expenses 17,790 15,511
Contributions to defined contribution superannuation funds 12,745 11,787
Expenses related to defined benefit superannuation funds 62 61
Equity settled share based payment transactions 1,503 1,019
203,706 187,262
6. FINANCE INCOME AND COSTS
RecognisedinProfitandLoss
In thousands of AUD
Year ended 31 August
2015
Year ended 31 August
2014
Interest income on bank deposits 924 922
Other interest income – 22
Finance income 924 944
Interest expense (6,954) (9,882)
Borrowing costs (3,156) (4,555)
API Rewards (4,697) (4,444)
Finance charges – leased assets (257) (143)
Finance costs (15,064) (19,024)Net finance costs (14,140) (18,080)
Interest fee income on overdue debts is presented in other income in Note 4 rather than in net finance costs.
NOTES TO THE FINANCIAL STATEMENTScontinued

Annual Report 2015 Australian Pharmaceutical Industries Limited
47
7. INCOME TAX EXPENSENumerical reconciliation between tax expense and pre-tax net profit
In thousands of AUD
Year ended 31 August
2015
Year ended 31 August
2014
Profit/(loss) before tax 59,455 (85,044)
Income tax using the domestic corporation tax rate of 30% (2014: 30%) 17,837 (25,513)
Increase in income tax expense due to:
Non-deductible expenses
– Impairment loss on investment in associate – 6,000
– Impairment losses on goodwill and brand name – 17,700
– Impairment losses on long term debts 223 5,928
– Share of associate’s net losses 129 329
– Share based payment transactions 775 337
– Entertainment and other sundry items 209 316
– Dismantling costs 177 137
Other
– Effect of tax rate in foreign jurisdictions – 6
– Foreign withholding tax – 25
– Write off of deferred tax asset relating to certain debts – 631
Decrease in income tax expense due to:
Write off of deferred tax liability relating to brand names – (148)
Effect of tax rate in foreign jurisdictions (33) –
Research and development benefit (1,191) –
18,126 5,748
Adjustment for prior years
Research and development benefit (1,455) –
Other (342) (21)
Incometaxexpenseonpre-taxnetprofit/(loss) 16,329 5,727

48
Australian Pharmaceutical Industries Limited Annual Report 2015
NOTES TO THE FINANCIAL STATEMENTScontinued
7. INCOME TAX EXPENSE (continued)
Recognised in the Income Statement
In thousands of AUD
Year ended 31 August
2015
Year ended 31 August
2014
Current tax expenseCurrent year 5,049 25
Adjustments for prior years (149) 266
4,900 291
Deferred tax expenseCurrent year-origination and reversal of temporary differences 13,077 9,028
Benefit of tax losses recognised – (3,936)
Write down of deferred tax asset – 631
Adjustment for prior years (1,648) (287)
11,429 5,436
Total income tax expense in income statement 16,329 5,727
Deferred Tax Recognised in Equity
In thousands of AUD
Year ended 31 August
2015
Year ended 31 August
2014
Relating toDerivatives (238) 315
Defined benefit superannuation fund 17 14
Unrealised foreign exchange gains 11 39
(210) 368
8. EARNINGS PER SHARE
In thousands of AUD
Year ended 31 August
2015
Year ended 31 August
2014
Profit/(loss) attributable to ordinary shareholders 43,126 (90,771)In thousands of sharesBasic weighted average number of ordinary shares for the period 488,116 488,116
Effect of potential ordinary shares on issue 7,177 –
Diluted weighted average number of ordinary shares for the period 495,293 488,116In centsBasic earnings per share 8.8 (18.6)
In centsDiluted earnings per share 8.7 (18.6)
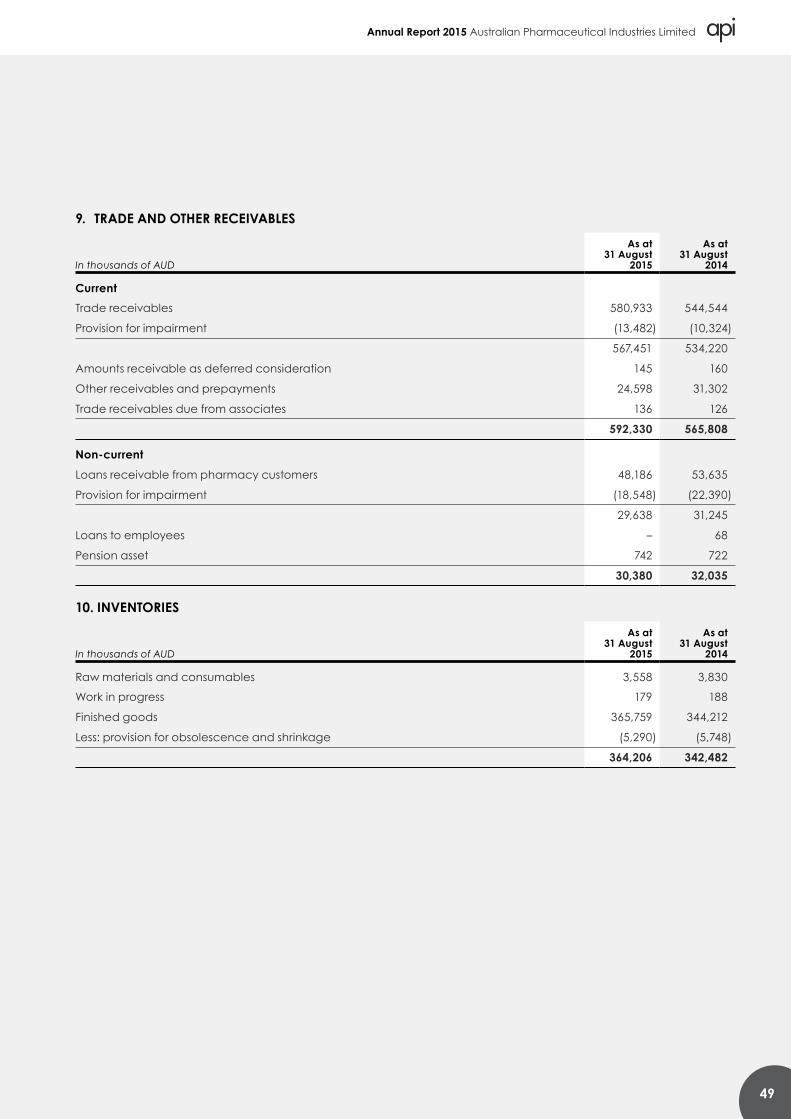
Annual Report 2015 Australian Pharmaceutical Industries Limited
49
9. TRADE AND OTHER RECEIVABLES
In thousands of AUD
As at 31 August
2015
As at 31 August
2014
CurrentTrade receivables 580,933 544,544
Provision for impairment (13,482) (10,324)
567,451 534,220
Amounts receivable as deferred consideration 145 160
Other receivables and prepayments 24,598 31,302
Trade receivables due from associates 136 126
592,330 565,808
Non-currentLoans receivable from pharmacy customers 48,186 53,635
Provision for impairment (18,548) (22,390)
29,638 31,245
Loans to employees – 68
Pension asset 742 722
30,380 32,035
10. INVENTORIES
In thousands of AUD
As at 31 August
2015
As at 31 August
2014
Raw materials and consumables 3,558 3,830
Work in progress 179 188
Finished goods 365,759 344,212
Less: provision for obsolescence and shrinkage (5,290) (5,748)
364,206 342,482

50
Australian Pharmaceutical Industries Limited Annual Report 2015
NOTES TO THE FINANCIAL STATEMENTScontinued
11. SUMMARISED PARENT ENTITY FINANCIALS
In thousands of AUD
As at 31 August
2015
As at 31 August
2014
Current assets 438,341 348,345
Total assets 935,304 834,612
Current liabilities 462,769 336,467
Total liabilities 510,765 442,649
Net assets 424,539 391,963
Equity
Share capital 566,461 566,461
Reserves 3,161 2,214
Retained earnings (190,383) (190,383)
Profits reserve 45,300 13,671
Total equity 424,539 391,963Profit/(loss) after tax 51,113 (140,159)
Other comprehensive income 41 1,799
Total comprehensive income/(deficit) 51,154 (138,360)Capital commitments of the parent entity at year end 1,713 20,923
Details of any guarantees and contingencies of the parent entity are included in Note 24.
12. CURRENT TAX ASSETS AND LIABILITIESThe current tax asset for the consolidated entity of $2,426,000 (31 August 2014: $502,000 current tax liability) represents the amount of income taxes recoverable (last year – payable) in respect of current and prior financial periods. In accordance with the Australian tax consolidation legislation, the Company as the head entity of the Australian tax consolidated group has assumed the current tax asset/liability initially recognised by the members in the Australian consolidated tax group.

Annual Report 2015 Australian Pharmaceutical Industries Limited
51
13. OTHER INVESTMENTS
Investments in AssociatesThe consolidated entity has had the following investments in associates:
Ownership
Venture Principal Activities Country Reporting Date 30 June 2015 31 August 2014
CH2 Holdings Pty Ltd Hospital supplies distribution Australia 30 June 45.5% 45.5 %
Results of Associates
In thousands of AUD
Year ended 31 August
2015
Share of associate’s net assets equity accounted (including goodwill) at 1 September 2014 7,229
Share of associate’s net loss accounted for using the equity method (431)
Shareofassociate’snetassetsequityaccounted(includinggoodwill)at30June2015 6,798
AssetsClassifiedasHeldforSaleAt 30 June 2015 the investment in the above associate met the classification as an asset held for sale and from this date has been presented as such.
Immediately prior to classification as held for sale, the asset was tested for impairment in accordance with the Group’s accounting policies. The classification as an asset held for sale did not result in an impairment loss or gain. Thereafter the asset has been measured at the lower of carrying amount and fair value less costs to sell.
The Group has commenced the sale process and expects the disposal to be completed within the next 12 months.
14. DEFERRED TAX ASSETS AND LIABILITIES
Recognised Deferred Tax Assets and LiabilitiesDeferred tax assets and liabilities are attributable to the following:
Consolidated Assets Liabilities Net
In thousands of AUD31 August
201531 August
201431 August
201531 August
201431 August
201531 August
2014
Property, plant and equipment – 1,280 (7,544) (947) (7,544) 333
Unrealised foreign exchange losses – – (20) (12) (20) (12)
Employee benefits 8,069 7,371 (17) – 8,052 7,371
Provisions 17,061 18,232 – – 17,061 18,232
Derivatives 254 16 – – 254 16
Other items 4,919 4,058 – – 4,919 4,058
Tax loss carried forward – 3,936 – – – 3,936
Taxassets/(liabilities) 30,303 34,893 (7,581) (959) 22,722 33,934
Change in Deferred Tax Asset
In thousands of AUD31 August
201531 August
2014
Balance at 1 September 33,934 39,738
Recognised in income statement (11,429) (5,436)
Employee benefits transferred from store acquisitions 7 –
Recognised directly in equity 210 (368)
Balance as at 31 August 22,722 33,934

52
Australian Pharmaceutical Industries Limited Annual Report 2015
NOTES TO THE FINANCIAL STATEMENTScontinued
15. PROPERTY, PLANT AND EQUIPMENT
In thousands of AUDLand and Buildings
Plant and Equipment
Leased Plant and
Equipment
Capital Works in Progress Total
Year ended 31 August 2014Opening net book value 5,598 112,748 546 3,009 121,901
Additions – 510 – 14,827 15,337
Disposals – (1,255) – – (1,255)
Depreciation charge for the period (267) (17,143) (565) – (17,975)
Impairment loss – (1,189) – – (1,189)
Reclassification of assets – 9,661 3,633 (13,294) –
Transfer of assets to intangibles – – – (317) (317)
Effect of movement in foreign exchange 141 170 – 7 318
Closing net book amount 5,472 103,502 3,614 4,232 116,820Comprised of:Cost 10,138 232,859 5,414 4,232 252,643
Accumulated depreciation (4,666) (129,357) (1,800) – (135,823)
In thousands of AUDLand and Buildings
Plant and Equipment
Leased Plant and
Equipment
Capital Works in Progress Total
Year ended 31 August 2015Opening net book value* 5,472 103,502 3,614 4,232 116,820
Additions – 2,443 – 7,876 10,319
Disposals – (952) (37) – (989)
Depreciation charge for the period (269) (13,613) (1,055) – (14,937)
Reclassification of assets – 6,829 2,279 (9,108) –
Transfer of assets to intangibles^ – (9,342) – – (9,342)
Effect of movement in foreign exchange 36 39 – – 75
Closing net book amount 5,239 88,906 4,801 3,000 101,946Comprised of:Cost 10,201 205,963 7,627 3,000 226,791
Accumulated depreciation (4,962) (117,057) (2,826) – (124,845)
^ Following the implementation of OneERP and a review of asset classifications, certain assets were re-classified from property, plant and equipment to intangibles.
* The prior period has been adjusted to reclassify amounts between asset classes to more appropriately reflect their nature in accordance with AASB 116.
Financing costs are expensed in the income statement except where the costs relate to the financing of projects under construction, where the costs are capitalised up to the date of commissioning.

Annual Report 2015 Australian Pharmaceutical Industries Limited
53
16. INTANGIBLE ASSETS
In thousands of AUD Goodwill Brand Names SoftwareDevelopment
Costs
CapitalWorks in Progress Total
Year ended 31 August 2014Opening net book value 100,827 99,000 271 201 5,991 206,290
Transfer from property, plant and equipment – – 262 55 – 317
Other acquisitions* – – – – 18,946 18,946
Disposals – – – – – –
Amortisation for the period – – (224) (46) – (270)
Impairment loss (56,360) (2,640) – – – (59,000)
Effect of movements in foreign exchange 940 – – 9 – 949
Closing net book amount 45,407 96,360 309 219 24,937 167,232
Comprised of:Cost 101,767 99,000 19,318 808 24,937 245,830
Accumulated amortisation (56,360) (2,640) (19,009) (589) – (78,598)
Year ended 31 August 2015Opening net book value 45,407 96,360 309 219 24,937 167,232
Transfer from property, plant and equipment^ – – 9,342 – – 9,342
Other acquisitions* 339 – 36 – 22,564 22,939
Reclassification – – 47,409 92 (47,501) –
Disposals – – (610) – – (610)
Amortisation for the period – – (5,382) (62) – (5,444)
Effect of movements in foreign exchange 233 – – 1 – 234
Closing net book amount 45,979 96,360 51,104 250 – 193,693
Comprised of:Cost 102,339 99,000 96,808 905 – 299,052
Accumulated amortisation (56,360) (2,640) (45,704) (655) – (105,359)
^ Following the implementation of OneERP and a review of asset classifications, certain assets were re-classified from property, plant and equipment to intangibles.
* Includes the capitalisation of interest of $2,759,281 (31 August 2014: $1,153,000) within Capital Works in Progress

54
Australian Pharmaceutical Industries Limited Annual Report 2015
NOTES TO THE FINANCIAL STATEMENTScontinued
16. INTANGIBLE ASSETS (continued)
Other AcquisitionsDuring the year, the consolidated entity acquired 1 retail store (31 August 2014: 2 retail stores). Goodwill was recognised as a result of the acquisitions as follows:
In thousands of AUD31 August
201531 August
2014
Total consideration transferred 843 1,197
Fair value of net assets acquired:
– Inventories 418 797
– Property, plant and equipment 108 414
– Employee entitlements (22) (14)
Goodwill recognised 339 –
If new information obtained within one year from the acquisition date about facts and circumstances that existed at the acquisition date identifies adjustments to the above amounts then the acquisition accounting will be revised.
Amortisation and Impairment ChargeThe amortisation charge was recognised within administration and general expenses in the income statement.
ImpairmenttestsforCashGeneratingUnits(CGU)ContainingGoodwillandBrandNamesThe following cash generating units have significant carrying amounts of goodwill and brand names:
Goodwill
In thousands of AUD31 August
201531 August
2014
Australian pharmaceutical distribution 29,418 29,418
Australian retailing 339 –
New Zealand manufacturing 16,222 15,989
45,979 45,407
AssumptionsThe assumptions used for determining the recoverable amount of each asset and CGU are based on past experience and expectations for the future. Cashflow projections have been based on Board approved budgets and the Board approved five year strategic plan. These forecasts use management estimates to determine income, expenses, working capital movements, capital expenditure and cashflows for each CGU.
The projected cashflows for each CGU are discounted using an appropriate discount rate and terminal growth rate applicable to each CGU. Management apportions a reasonable allocation of its corporate overhead and supply chain distribution costs to the Retailing and Pharmacy Distribution CGU based on a reasonable allocation methodology. The Retailing and Pharmacy Distribution CGU’s are sensitive to the allocation of supply chain distribution costs.
For all cash generating units containing goodwill, the value in use (VIU) approach was adopted for assessing the recoverable value of non-financial assets. VIU is calculated using a discounted cash flow model covering a 5 year period with an appropriate terminal growth rate at the end of that period, for the business segment. The model utilises cash flow forecasts and extrapolations based on budgets that have been reviewed by management and the Board. VIU was determined by discounting the future cash flows generated for the continuing use of the CGU and based on the following assumptions:

Annual Report 2015 Australian Pharmaceutical Industries Limited
55
16. INTANGIBLE ASSETS (continued)
Retail CGUDuring the year, the Company reviewed the carrying value of the Retail CGU. The recoverable amount for the CGU continues to exceed the carrying value.
Discount Rate The discount rate of 15.2% represents the pre-tax discount rate applied to the cash flow projections, based on a market-determined, risk adjusted post-tax discount of 11.0%.
Terminal Growth rate The terminal growth rate of 2.0% represents the growth rate applied to extrapolate cash flows beyond the five year forecast period. The growth rate is based on management expectations of the CGU’s long term performance after considering current conditions and available external market data.
New Store Rollout New store rollout estimates are derived from management’s analysis of the likely net annual increase in stores in the five year forecast period, based on recent past history, applications from prospective franchisees currently under consideration and the potential pool of new franchisees, after adjusting for the risks associated with execution of the strategic plan and the potential for loss of existing franchisees. The cash flow contribution from new stores is based on management’s estimates of net contribution from individual stores, including working capital, marketing and supply chain costs.
Sales Growth Comparable stores sales growth is based on management estimates of 3% in FY16–20.
Pharmacy CGUDuring the year, the Company reviewed the carrying value of the Pharmacy CGU. The recoverable amount for the CGU continues to exceed the carrying value.
A decrease in underlying sales growth to 2.0% in each year of the Board approved budget and strategic plan would result in a value in use that approaches but is not less than the carrying amount.
Discount Rate The discount rate of 13.9% represents the pre-tax discount rate applied to the cash flow projections, based on a market-determined, risk adjusted post-tax discount of 10.0%.
Terminal Growth rate The terminal growth rate of 2.5% represents the growth rate applied to extrapolate cash flows beyond the five year forecast period. The growth rate is based on management’s expectations of the CGU’s long term performance.
New Business Growth New business growth is based on board-approved budgets for 2016, with a conservative growth assumption for 2017 and beyond.
NZ Consumer Products CGUDuring the year, the Company reviewed the carrying value of the NZ Consumer Products CGU. The recoverable amount for the CGU continues to exceed the carrying value.
Material adverse movement in any of the key assumptions may result in an impairment of goodwill.
Discount Rate The discount rate of 14.4% represents the pre-tax discount rate applied to the cash flow projections, based on a market-determined, risk adjusted post-tax discount of 11.0%.
Terminal Growth rate The terminal growth rate of 2.5% represents the growth rate applied to extrapolate cash flows beyond the five year forecast period. The growth rate is based on expectations of the CGU’s long term performance.
New Business Growth New business growth is based on board-approved budgets for 2016, with growth assumptions for 2017 and beyond based on management’s expectation of contract renewals and new contract manufacturing contracts achieved

56
Australian Pharmaceutical Industries Limited Annual Report 2015
NOTES TO THE FINANCIAL STATEMENTScontinued
16. INTANGIBLE ASSETS (continued)
Brand Names
In thousands of AUD
As at 31 August
2015
As at 31 August
2014
Australian pharmaceutical distribution
– Soul Pattinson brand name 37,500 37,500
Australian retailing
– Priceline brand name 58,860 58,860
96,360 96,360
The Soul Pattinson (SP) brand has been included as part of the Australian Pharmacy Distribution CGU as predominant economic benefits of the SP brand have been realised in Pharmacy Distribution business. Additionally, the cash flows derived from the SP brand cannot be separated from the cash flows derived from the wholesale distribution business and banner group operations.
17. TRADE AND OTHER PAYABLES
In thousands of AUD
As at 31 August
2015
As at 31 August
2014
CurrentTrade payables 609,422 566,659
Accrued expenses and other payables 56,511 47,955
665,933 614,614
Non-currentOther payables 8,616 8,108

Annual Report 2015 Australian Pharmaceutical Industries Limited
57
18. LOANS AND BORROWINGSThis note provides information about the contractual terms of the consolidated entity’s interest-bearing loans and borrowings.
In thousands of AUD
As at 31 August
2015
As at 31 August
2014
Current liabilitiesCustomer deposits 7 7
Insurance premium funding 1,592 2,820
Finance lease liabilities 1,233 1,139
Securitisation of trade receivables 50,000 17,000
Cash advance facility - secured 5,422 –
58,254 20,966
Non-current liabilitiesFinance lease liabilities 3,229 2,504
Securitisation of trade receivables 37,384 87,975
Cash advance facilities - secured – 11,349
40,613 101,828
Financing FacilitiesBank overdraft - secured 5,711 5,691
Standby letters of credit 500 500
Cash advance facilities - secured 76,422 76,382
Securitisation of trade receivables 320,000 320,000
402,633 402,573
Facilities utilised at reporting date1
Bank overdraft – secured – –
Standby letters of credit – –
Cash advance facilities – secured 5,422 11,349
Securitisation of trade receivables 87,384 104,975
92,806 116,324
Facilities not utilised at reporting date2
Bank overdraft – secured 5,711 5,691
Standby letters of credit 500 500
Cash advance facilities – secured 71,000 65,033
Securitisation of trade receivables 232,616 215,025
309,827 286,249
1. Average used facilities during the year was $180,167,314 (2014:$ 213,825,372).2. Average unused facilities during the year was $224,209,928 (2014:$ 245,721,094).

58
Australian Pharmaceutical Industries Limited Annual Report 2015
NOTES TO THE FINANCIAL STATEMENTScontinued
18. LOANS AND BORROWINGS (continued)
Bank OverdraftThe Company is a guarantor to a bank facility agreement which provides a total overdraft facility of $5,711,007 (31 August 2014: $5,690,848) to entities in the Australian Pharmaceutical Industries Limited Group. The facility is subject to set off arrangements between companies within the consolidated entity. Interest on bank overdrafts is charged at prevailing market rates. The bank overdraft is repayable on demand and subject to annual review.
Standby Letter of CreditThe standby letter of credit facility is available to be drawn down over the next year and is subject to annual review.
Finance Lease FacilityThe consolidated entity’s lease liabilities are secured by the leased assets. In the event of default, the assets revert to the lessor.
Cash AdvancesThe consolidated cash advance facilities total $76,422,160. The borrowings are secured by way of fixed and floating charge over the assets of the consolidated entity. Interest is based on the bank-bill reference rate plus a margin charged by the lender.
SecuritisationRefer Note 22.
Finance Lease LiabilitiesFinance lease liabilities of the consolidated entity are payable as follows:
In thousands of AUD
Minimum Lease
Payments 31 August
2015
Interest 31 August
2015
Principal 31 August
2015
Minimum Lease
Payments 31 August
2014
Interest 31 August
2014
Principal 31 August
2014
Less than one year 1,493 260 1,233 1,344 205 1,139
Between one and five years 3,539 310 3,229 2,747 243 2,504
5,032 570 4,462 4,091 448 3,643
The consolidated entity leases plant and equipment under finance leases expiring within five years. At the end of the lease term the consolidated entity has the option to purchase the leased equipment at a price considered to be a bargain purchase option.
Under the terms of the lease agreements no contingent rents are payable.

Annual Report 2015 Australian Pharmaceutical Industries Limited
59
19. EMPLOYEE BENEFITS
Current
In thousands of AUD
As at 31 August
2015
As at 31 August
2014
Short-term incentive payments 5,247 2,802
Liability for long service leave 6,963 5,958
Liability for annual leave 11,078 10,725
23,288 19,485
Non-currentLiability for long service leave 5,215 5,629
Changes in Accounting Estimates-Discount RatesThe consolidated entity has changed its estimate of the discount rates used to calculate the present value of employee benefits in accordance with AASB 119: Employee Benefits (AASB 119). AASB 119 requires employee benefits liabilities to be discounted to their present value using a discount rate determined by reference to market yields at the end of the reporting period on high quality corporate bonds instead of government bonds. As per the report released in April 2015 by Milliman, the actuarial firm commissioned by Group of 100, it was concluded that it is generally accepted practice that bonds rated AA and above are considered high quality and therefore there is now sufficient evidence to support a conclusion that the high quality corporate bond market in Australia is deep. From this date, as required by AASB 119, the consolidated entity has changed the rate it uses to discount its Employee Benefits liabilities from Commonwealth Government Bonds rates to the Corporate Bond rate.
The net favourable impact of the change in discount rates on Employee Benefits liabilities was not considered material for the year ended 31 August 2015.
(a) Defined Benefit PlanThe consolidated entity makes contributions to a defined benefit superannuation fund that provides defined benefit amounts for employees upon retirement.
In thousands of AUD31 August
201531 August
2014
Fair value of fund assets – funded 1,435 1,577
Present value of funded obligations (693) (855)
Present value of net fund assets 742 722
Movementsinthenetassetfordefinedbenefitobligationsrecognisedinthebalancesheet
In thousands of AUD 31 August
201531 August
2014
Net defined benefit asset at beginning of the period 722 676
Contributions received 24 50
Gains allocated to Other Comprehensive Income 58 57
Expense recognised in the income statement (62) (61)
Net defined benefit asset at end of the period 742 722

60
Australian Pharmaceutical Industries Limited Annual Report 2015
19. EMPLOYEE BENEFITS (continued)(b) Defined Contribution Superannuation FundsIn addition to the contributions to the defined benefit plan outlined above, the consolidated entity makes contributions to various defined contribution superannuation funds. The amount recognised as expense was $12,745,000 for the year ended 31 August 2015 (31 August 2014: $11,787,000).
(c) Share Based Payments
Share performance rightsThe consolidated entity granted equity settled performance rights that entitle key management personnel and senior employees to receive shares in the Company if defined performance conditions are achieved.
The performance rights granted on 22 February 2013 (2012 grant) did not vest and lapsed on 31 August 2015.
On 10 December 2013, performance rights (the 2013 grant) were granted with a performance period commencing 1 September 2013 and ending 31 August 2016. The performance condition, being API’s return on equity (‘ROE’) for the exercise of performance rights will be assessed at the Remuneration Committee meeting following the 31 August 2016 year end.
On 16 December 2014, performance rights (the 2014 grant) were granted with a performance period commencing 1 September 2014 and ending 31 August 2017. The performance conditions, being API’s return on equity (‘ROE’) and earnings per share (‘EPS’) for the exercise of performance rights will be assessed at the Remuneration Committee meeting following the 31 August 2017 year end.
Performance conditions will be tested once only, and any performance rights that do not meet the performance conditions will lapse and will not be re-tested.
The terms and conditions of the grants at 31 August 2015 are as follows. All performance rights are settled by physical delivery of shares:
Grant date/employee entitledNumber of
instruments Vesting conditionsContractual life of
Performance Rights
Performance rights to key management personnel and senior employees – Performance period to Aug 2016
2,994,743 Three years of service.
Cumulative ROE with a minimum of 21.35% permitting exercise of 50% of the rights and 25.62% achievement to exercise 100% of the rights and proportionate between these two levels.
3 years
Performance rights to key management personnel and senior employees – Performance period to Aug 2017
3,201,454 Three years of service.
Cumulative ROE with a minimum of 21.38% permitting exercise of 20% of the rights subject to the ROE Performance Condition and 34.74% achievement to exercise 100% of the rights subject to the ROE Performance Condition and proportionate between these two levels.
Compound Annual Growth Rate (CAGR) in EPS with a minimum of 7.5% permitting exercise of 20% of the rights subject to the EPS Performance Condition and 10.0% achievement to exercise 100% of the rights subject to the EPS Performance Condition and proportionate between these two levels.
3 years
6,196,197
NOTES TO THE FINANCIAL STATEMENTScontinued

Annual Report 2015 Australian Pharmaceutical Industries Limited
61
19. EMPLOYEE BENEFITS (continued)The number of performance rights outstanding in the period is as follows:
In thousands of performance rights
Number of performance
rights 31 August
2015
Number of performance
rights 31 August
2014
Outstanding at the beginning of the period 7,621 6,817
Forfeited/Lapsed during the period (4,626) (2,628)
Exercised during the period – –
Granted during the period 3,201 3,432
Outstanding at the end of the period 6,196 7,621Exercisable at the end of the period – –
Fair value of performance rights and assumptionsKey Management Personnel
and Senior Managers31 August 2015
Performance period commences and performance conditions1 Sept 2013
ROE1 Sept 2014
EPS/ROE
Grant date 10 Dec 13 16 Dec 14
Fair value at measurement date $0.46 $0.83
Share price $0.55 $0.95
Exercise price – –
Expected volatility (expressed as weighted average) 40% 40%
Performance Rights life (expressed as weighted average life) 3yrs 3yrs
Expected dividends 6.0% 5.0%
Risk-free interest rate (based on national government bonds) 3.09% 2.25%
The expected volatility is based on the historic volatility (calculated based on the weighted average expected life of the share performance rights), adjusted for any expected changes to future volatility due to publicly available information.
Share performance rights are granted under a service condition and, for grants to key management personnel and, senior executives market and non-market performance conditions apply. Non-market performance conditions are not taken into account in the grant date fair value measurement of the services received.
Executive Short Term Incentive Option PlanThe short term incentive plan (STIP) for executives of the Group is designed to drive key performance measures aligned to strategy and financial objectives. For STIP performance scorecard measures established after 1 September 2012, 50% of any resulting STIP payment is converted from cash to rights to acquire API shares and is deferred for 12 months to encourage employee retention. It is also designed to manage risk by ensuring that decisions taken in the previous 12 months have resulted in sustainable Company benefit. Further details of the STIP are set out in the Remuneration Report.

62
Australian Pharmaceutical Industries Limited Annual Report 2015
19. EMPLOYEE BENEFITS (continued)Set out below is a summary of the performance rights granted under the STIP:
Grant Date Expiry DateValue at
Grant Date
Balance at start of the
year
Granted during the
year
Exercised during the
year
Forfeited during the
year
Balance at end of the
year
Vested at end of the
year
20147 Oct 14 30 Oct 15 $0.771 – 1,048,404 – (67,371) 981,033 –
1 Performance rights are valued on a volume weighted average closing price of API shares on the ASX in the 10-day period after announcement of full year results. The vesting period for these performance rights commenced on 1 September 2013.
The grant of performance rights in relation to the 2015 STIP program was approved by the Board on 7 October 2015. The rights are subject to a 12 month deferral period and vest upon the announcement of the 2016 financial results (subject to Board approval). The approved value of the grant is $1,800,000 and the number of performance rights will be determined by dividing the value of the deferred component of the STIP award by the volume weighted average closing price of API shares on the ASX in the 10-day period after announcement of full year results for 2015. The vesting period for these performance rights commenced on 1 September 2014.
Employee ExpensesTotal expenses arising from share-based payment transactions attributable to employees recognised during the period as part of total share-based payment expenses were as follows:
In thousands of AUD31 August
201531 August
2014
Performance rights granted in 2011 – equity settled – (421)*
Performance rights granted in 2012 – equity settled (1,033)* 516
Performance rights granted in 2013 – equity settled 392 526
Performance rights granted in 2014 – equity settled 886 –
Deferred component 2014 – STIP program 358 398
Deferred component 2015 – STIP program 900 –
Total expense recognised as employee costs 1,503 1,019
* Reflects the reversal of expenses previously recognised for performance rights forfeited in the prior period.
NOTES TO THE FINANCIAL STATEMENTScontinued

Annual Report 2015 Australian Pharmaceutical Industries Limited
63
20. PROVISIONS
In thousands of AUD
Directors’ retirement
schemeProvision for dismantling
Provision for financial guarantees
Provision for onerous
leases
Provision for Loyalty Programs Total
Balance at 1 September 2014 351 5,079 24,739 1,804 5,224 37,197Provisions made during the year – 88 – – 23,230 23,318
Provisions used during the year – (66) – (874) (23,012) (23,952)
Provision reversed during the year – – (1,451) – – (1,451)
Unwind of discount – 115 – – – 115
Balance at 31 August 2015 351 5,216 23,288 930 5,442 35,227
Current – 653 23,288 862 5,442 30,245
Non-current 351 4,563 – 68 – 4,982
351 5,216 23,288 930 5,442 35,227
Directors’ Retirement SchemeRetirement benefits for non-executive Directors are included on an accrual basis. They are paid on a pro-rata basis up to 10 years service to a maximum of three times the average annual remuneration in the three years preceding retirement. The retirement benefit is capped at $220,000 per director and applies only to Directors appointed prior to 9 September 2003. On 31 August 2009 the Directors agreed to freeze this benefit.
DismantlingThe consolidated entity provides for the estimated costs to cover its obligations to lessors to restore premises to the condition that existed when leases of real property were entered into.
Financial GuaranteesGuarantees are issued to pharmacists on the basis of being fully recoverable from the pharmacist. Guarantees are typically recovered in line with pharmacy refinancing timetables. Guarantees are provided for when it is assessed that it is probable that guarantees will be called in the foreseeable future. During the financial year the reversal of the provision was transferred to the provision for doubtful debts.
Onerous LeasesIn 2006 the Group entered into non-cancellable property leases as part of a wider pharmacy lease arrangement. The facilities have been sublet for the remaining lease term, however as the rental income is lower than the rental expense, the obligation for the discounted future payments, net of expected rental income, has been provided for against earnings.
Loyalty ProgramsConsists of the provision for Sister Club points in the Retail Division which are convertible quarterly by customers in the form of gift vouchers. The provision is based upon the expected cost to the consolidated entity on redemption of Sister Club vouchers. A redemption rate is applied based on historical experience and is updated quarterly.

64
Australian Pharmaceutical Industries Limited Annual Report 2015
NOTES TO THE FINANCIAL STATEMENTScontinued
21. CAPITAL AND RESERVES
Share Capital
Ordinary Shares
In thousands of shares31 August
201531 August
2014
Shares on issue at the beginning of the period – fully paid 488,116 488,116
Shares on issue at the end of the period – fully paid 488,116 488,116
Ordinary shares The Company does not have authorised capital or par value in respect of its issued shares. All issued shares are fully paid. Holders of ordinary shares are entitled to receive dividends as declared from time to time and are entitled to one vote per share at shareholders meetings. In the event of a winding up of the Company, ordinary shareholders rank after all other creditors and are fully entitled to any proceeds of liquidation.
Translation reserveThe translation reserve comprises all foreign exchange differences arising from the translation of the financial statements of foreign operations where their functional currency is different to the presentation currency of the reporting entity, as well as from the translation of liabilities that hedge the Company’s net investment in a foreign subsidiary.
Equity reserveThe equity reserve relates to share-based payment transactions measured at fair value.
Hedging reserveThe hedging reserve comprises the effective portion of the cumulative net change in the fair value of cash flow hedging instruments relating to hedged transactions that have not yet occurred.
DividendsDuring the year the company recognised the following dividends:
$9.762 million was paid on 12 December 2014 out of profits earned in the year ended 31 August 2014. It was at the rate of 2.0 cents per share, fully franked.
An interim dividend (paid out of current year profits) in respect of the half year ended 28 February 2015 amounting to $9.762 million paid on 5 June 2015. It was at the rate of 2.0 cents per share, fully franked.
On 22 October 2015 a final dividend of 2.5 cents per share (payable out of the Profits Reserve), fully franked to be paid on 11 December 2015, amounting to $12.2 million was declared.
Dividend Franking Account
The Company
In thousands of AUD31 August
201531 August
2014
30 per cent franking credits available to shareholders of the
Company for subsequent financial years 37,656 43,440
The above available amounts are based on the balance of the dividend franking account at year-end adjusted for:
a. Franking credits that will arise from the payment of the current tax liabilities;b. Franking debits that will arise from the payment of dividends recognised as a liability at the year end;c. Franking credits that will arise from the receipt of dividends recognised as receivables by the tax consolidated group at
the year end; d. Franking credits that the entity may be prevented from distributing in subsequent years; ande. Franking debits that will arise from receipt of the current income tax receivable.
The ability to utilise the franking credits is dependent upon there being sufficient available profits to declare dividends. The future reduction in the dividend franking account of dividends proposed after the balance sheet date but not recognised as a liability at year end is $5,229,813 (31 August 2014: $4,183,856).

Annual Report 2015 Australian Pharmaceutical Industries Limited
65
22. FINANCIAL INSTRUMENTS
Financial Risk ManagementOverviewThe consolidated entity has exposure to the following risks from its use of financial instruments:
– Credit risk – Liquidity risk – Market risk
The Board of Directors has overall responsibility for the establishment and oversight of the consolidated entity’s risk management framework. The Board has established an Audit and Risk Committee, which is responsible for developing and monitoring the consolidated entity’s risk management policies. The Committee reports regularly to the Board of Directors on its activities.
The consolidated entity’s risk management policies are established to identify and analyse the risks faced by the consolidated entity, to set appropriate risk limits and controls, and to monitor risks and adherence to limits. Risk management policies and systems are reviewed regularly to reflect changes in market conditions and the consolidated entity’s activities.
The Audit and Risk Committee oversees how management monitors compliance with the risk management policies and procedures and reviews the adequacy of the risk management framework in relation to the risks. The Audit and Risk Committee is assisted in its oversight by Internal Audit. Internal Audit undertakes both regular and ad hoc reviews of risk management controls and procedures, the results of which are reported to the Audit and Risk Committee.
Credit riskCredit risk is the risk of financial loss to the consolidated entity if a customer or counterparty to a financial instrument fails to meet its contractual obligations, and arises principally from the consolidated entity’s receivables from customers and financial guarantees.
Trade and other receivablesThe consolidated entity’s exposure to credit risk is mainly influenced by the individual characteristics of each customer.
The consolidated entity has established a credit policy under which new customers are analysed individually for credit worthiness including using external ratings, where available. Purchase limits are established for each customer, which represents the maximum open amount available and limits are reviewed on a needs-basis. Customers that fail to meet the benchmark credit worthiness may transact with the consolidated entity only on a prepayment basis.
In monitoring customer credit risk, customers are grouped by state and reviewed monthly. “High risk” customers are placed on “credit hold”, with orders manually released as appropriate.
Goods sold under some customer arrangements are subject to retention of title clauses, so that in the event of non-payment the consolidated entity may have a secured claim.
The consolidated entity establishes an allowance for impairment that represents its estimate of incurred losses in respect of trade and other receivables and investments. The main component of this allowance is a specific loss component that relates to individually significant exposures (after consideration of any collateral held).
GuaranteesFinancial guarantees are initially recognised at fair value. The fair value is amortised as an expense through the income statement over the life of the guarantee. Subsequent to initial measurement, the guarantee is measured at the higher of the amortised balance of the guarantee or the value of the guarantee determined in accordance with AASB 137 Provisions, Contingent Liabilities and Contingent Assets.
Liquidity riskLiquidity risk is the risk that the consolidated entity will not be able to meet its financial obligations as they fall due. The consolidated entity’s approach to managing liquidity is to ensure, as far as possible, that it will always have sufficient liquidity to meet its liabilities when due, under both normal and stressed conditions.
The Company and consolidated entity have varying borrowing levels based on seasonal requirements of the business. Any obligations can be met by the unused facilities.
Market riskMarket risk is the risk that changes in market prices, such as foreign exchange rates and interest rates, will affect the consolidated entity’s income or the value of its holdings of financial instruments. The objective of market risk management is to manage and monitor market risk exposures within acceptable parameters, whilst optimising the return on risk.
Currency riskThe consolidated entity had no material exposure to foreign currency risk on sales and purchases that are denominated in a currency other than the respective functional currencies of the consolidated entity companies.

66
Australian Pharmaceutical Industries Limited Annual Report 2015
22. FINANCIAL INSTRUMENTS (continued)Interest rate riskThe consolidated entity is exposed to interest rate risk as a consequence of its financing facilities. The consolidated entity adopts a policy that up to 80% of its exposure to the changes in interest rates on its long term variable rate borrowings relating to the securitised trade receivables may be hedged on a fixed rate basis. At 31 August 2015, the consolidated entity had entered into interest rate swaps with a notional contract amount of $100,000,000, with maturity between October 2016 and December 2017 and fixed rates ranging from 2.65% to 2.75%.
The consolidated entity classifies interest rate swaps as cash flow hedges. The notional contracted interest cash flows are consistent with highly probable forecast interest cash flows to December 2017 based on the forecast used facilities for the securitised trade receivables.
Capital ManagementThe Board’s policy is to maintain a strong capital base so as to maintain investor, creditor and market confidence and to sustain future development of the business.
The Board seeks to maintain a balance between the higher returns that might be possible with higher levels of borrowings and the advantages and security afforded by a sound capital position.
There were no changes in the consolidated entity’s approach to capital management during the period.
SecuritisationThe consolidated entity has access to funds as a result of the securitisation of current trade receivables provided the receivables meet certain criteria. There are two separate programs which have limits of $275,000,000 and $45,000,000 (31 August 2014: $275,000,000 and $70,000,000). As part of these programs, the program provider charges a monthly variable interest rate plus margin based on the drawn down portion of this program. As at 31 August 2015 the weighted average rate was 4.03% (31 August 2014: 4.69%). Settlement of the funds is monthly and daily respectively. These programs expire in May 2018.
The funds able to be drawn down under either securitisation facility are limited by the existence of qualifying trade receivables at the time of drawdown which may be less than the unutilised amount otherwise available under the facility (set out in Note 18). The trade receivables are collaterised in full against amounts drawn down.
NOTES TO THE FINANCIAL STATEMENTScontinued
The facility imposes rights and obligations on API with respect to the quality and maintenance of the receivables, collection of receivables, settlement and reporting to the financier. API has complied with its obligations under the facility throughout the financial year.
The amount that has been determined as non-current is the lowest expected balance of the facility in the 12 month period post balance date based on board approved budgets.
At 31 August 2015, $75,000,000 and $12,384,305 respectively were drawn down on these programs by the consolidated entity (31 August 2014: $90,000,000 and $14,975,061). The trade receivables and loans and borrowings relating to these transactions are recognised on the statement of financial position.
Credit Risk
Exposure to credit riskThe consolidated entity’s exposure to credit risk as at the reporting date was in relation to the carrying amounts of current and non-current trade receivables (Note 9), other receivables (Note 9), cash deposits and the amount disclosed in respect of financial guarantees provided to pharmacy customers (Note 20).
Concentrations of credit riskConcentrations of credit risk arise from customers that have similar characteristics and are affected in a similar manner where there are changes in economic, regulatory or other conditions. In this regard, the economic entity has a significant concentration of credit risk associated with the pharmacy and retail industries in Australia.
Trade ReceivablesDetails of the ageing of Trade Receivables and the impairment losses recorded at the reporting date are set out below:
In thousands of AUD31 August
201531 August
2014
Not past due 519,082 482,843
Past due 0-30 days 26,599 26,832
Past due 31+ days 35,252 34,869
Sub-total 580,933 544,544
Impairment (13,482) (10,324)
567,451 534,220

Annual Report 2015 Australian Pharmaceutical Industries Limited
67
22. FINANCIAL INSTRUMENTS (continued)The movement in the provision for impairment losses in respect of Trade Receivables was as follows:
In thousands of AUD31 August
201531 August
2014
Balance at start of year 10,324 50,519
Amounts provided during the year 9,414 15,099
Amounts transferred from provision for financial guarantees 1,451 530
Amounts written off during the year (7,707) (55,824)
Balance at end of year 13,482 10,324
Loans receivable from Pharmacy customersHistorically, the consolidated entity has provided financial assistance to certain pharmacy customers in the form of long term loans.
The consolidated entity seeks to obtain collateral wherever long term funding arrangements are agreed to. This collateral may include personal guarantees and formal charges over pharmacy assets. The security held by the consolidated entity over pharmacy assets is generally in the form of a second-ranking charge after the security held by the pharmacist’s financiers.
As the due date for repayment approaches, management makes a determination of the most advantageous mechanism to realise the value of the loans and receivables, which may involve:
– Settlement of the loans and receivables in full (which normally requires refinancing by the pharmacy customer with an external financier);
– Re-negotiating the terms and conditions of the loans, including the interest rate and repayment date; and/or
– Enforcing the company’s security rights through liquidation of assets held as collateral.
The loan agreements, which included an annual interest rate of up to 10%, originally called for the full repayment of the majority of the loans by October 2013. In October 2013 a heads of agreement was signed extending the loans for a further five years however since that date the parties have been unable to reach agreement on the final form of the loan documentation.
The customers are in the process of renewing their banking arrangements.
Due to the ongoing negotiations relating to documentation of the form and conditions of the loans and the requirement for the relevant customers to renew their bank finance facilities, the carrying value of the loans have been determined on the basis that they are now due and payable immediately in estimating the present value of cash flow to be received. The Directors have assumed the realisation of assets is on an orderly basis.
In determining the provision for impairment for both Trade receivables and Loans receivable from Pharmacy customers, the Directors have taken into account the value of collateral held, financial guarantees provided to individual debtors and debtor groups which are recorded as current liabilities where it is considered probable that the guarantees will be called, the risks associated with general trading conditions and the specific circumstances of individual pharmacy debtors. Where appropriate, independent valuation experts have provided relevant store trading multiples to support the valuation of assets held as collateral for long term and past-due debts. Priority ranking security held by financial institutions and estimated disposal costs are deducted from the estimated collateral value.
The aggregate exposure to pharmacy loans is:
Non-current loans receivable
In thousands of AUD31 August
201531 August
2014
Loans receivable 48,186 53,635
Provision for Impairment (18,548) (22,390)
29,638 31,245
The determination of the impairment provisions is based on a number of best-estimate assumptions and is subject to inherent uncertainties based on information available at balance date. These uncertainties include general economic and trading conditions, the valuation of assets held as security (and the priority rights of other financiers over those assets), the potential impact on asset values of enforcing the company’s security rights through liquidation of the assets, disposal costs, the regulatory environment, the ability of pharmacy customers to obtain external finance, estimates of the timing of repayment or enforcement of security rights and other factors impacting the pharmacy industry. The impact of these uncertainties could reduce or increase the potential recoverable value of these assets.

68
Australian Pharmaceutical Industries Limited Annual Report 2015
22. FINANCIAL INSTRUMENTS (continued)The movement in the provision for impairment losses in respect of non-current loans receivable was as follows:
In thousands of AUD31 August
201531 August
2014
Balance at start of year 22,390 24,784
Amounts provided during the year – 22,390
Amounts written off during the year (3,842) (24,784)
Balance at end of year 18,548 22,390
Liquidity RiskThe following are the contractual maturities of financial liabilities, including interest payments and excluding the impact of netting arrangements.
In thousands of AUDCarrying Amount
Contract Cash Flows
1 year or less
1-2 years
2-5 years
More than 5 years
31 August 2015Non-derivative financial liabilitiesFinance lease liabilities 4,462 5,032 1,493 1,542 1,997 –
Customer deposits 7 7 7 – – –
Insurance premium funding 1,592 1,592 1,592 – – –
Trade and other payables 674,549 674,549 665,933 1,105 3,267 4,244
Cash Advance facility 5,422 5,422 5,422 – – –
686,032 686,602 674,447 2,647 5,264 4,244
31 August 2014Non-derivative financial liabilitiesFinance lease liabilities 3,643 4,091 1,344 1,046 1,701 –
Customer deposits 7 7 7 – – –
Insurance premium funding 2,820 2,820 2,820 – – –
Trade and other payables 622,722 622,722 614,614 928 2,648 4,532
Cash Advance facility 11,349 11,349 – 11,349 – –
640,541 640,989 618,785 13,323 4,349 4,532
NOTES TO THE FINANCIAL STATEMENTScontinued

Annual Report 2015 Australian Pharmaceutical Industries Limited
69
22. FINANCIAL INSTRUMENTS (continued)Cash Flow HedgesThe only financial assets or financial liabilities carried at fair value are derivative financial instruments designated as cash flow hedges. The Company considers the derivatives to be Level 2 financial instruments because, unlike Level 1 financial instruments, their measurement is derived from inputs other than quoted prices that are observable for the assets or liabilities, either directly (as prices) or indirectly (derived from prices). There have been no transfers between levels 1, 2 and 3 for recurring fair value measurements during the year. The derivative
fair values have been obtained from third party valuations derived from forward interest rates at the balance sheet date.
The fair value of the derivatives designated as cash flow hedges at 31 August 2015 was a net liability of $846,344 (31 August 2014: liability of $53,948).
The following table indicates the periods in which the cash flows and profit and loss impact associated with derivatives that were designated as cash flow hedges existing as at balance date are expected to occur:
In thousands of AUD 31 August 2015
Consolidated and the Company Carrying
AmountExpected
Cash Flows6 months or
less6-12
months 1-2 years 2-5 yearsMore than
5 years
Interest Rate Swap-Liability (1,195) (1,195) – – (776) (419) –
Foreign Exchange Forward-Asset 349 349 349 – – – –
In thousands of AUD 31 August 2014
Consolidated and the CompanyCarrying Amount
Expected Cash Flows
6 months or less
6-12 months 1-2 years 2-5 years
More than 5 years
Foreign Exchange Forward-Liability (54) (54) (54) – – – –

70
Australian Pharmaceutical Industries Limited Annual Report 2015
22. FINANCIAL INSTRUMENTS (continued)Interest Rate Risk
Effective Interest Rates and Repricing AnalysisIn respect of income-earning financial assets and interest-bearing financial liabilities, the following table indicates their effective interest rates at the balance sheet date and the periods in which they reprice.
Consolidated 31 August 2015 31 August 2014
In thousands of AUD Note
Effective interest
rate Total1 year or less
1-2 years
2-5 years
More than
5 years
Effective interest
rate Total1 year or less
1-2 years
2-5 years
More than
5 years
Cash and cash equivalents 27 1.67% 28,047 28,047 – – – 1.88% 23,526 23,526 – – –
Restricted cash (Aspire cash reserve) 9 2.10% 4,335 4,335 – – – 2.60% 4,118 4,118 – – –
Loans receivable from pharmacy customers 9 Nil** 46,792 – – 46,792 – Nil** 53,635 – – 53,635 –
Loans receivable from pharmacy customers* 9 12.0% 1,394 992 402 – – – – – – – –
Securitised trade receivables 18 4.03% (87,384) – – (87,384) – 4.69% (104,975) – – (104,975) –
Finance lease liabilities* 18 5.11% (4,462) (1,244) (1,357) (1,861) – 3.78% (3,643) (1,139) (915) (1,589) –
Bank overdrafts and cash advance facility 18 6.22% (5,422) (5,422) – – – 6.20% (11,349) – (11,349) – –
Insurance premium funding* 18 1.55% (1,592) (1,592) – – – 1.89% (2,820) (2,820) – – –
Employee Loans 9 – – – – – – 5.95% 68 68 – – –
(18,292) 25,116 (955) (42,453) – (41,440) 23,753 (12,264) (52,929) –
* Fixed rate income earning financial assets and interest bearing financial liabilities. Remaining balances are variable rates. ** The effective interest rate on loans receivable from pharmacy customers was nil during the year as agreement on the form and conditions of the loans
was not complete.
NOTES TO THE FINANCIAL STATEMENTScontinued

Annual Report 2015 Australian Pharmaceutical Industries Limited
71
22. FINANCIAL INSTRUMENTS (continued)Fair value sensitivity analysis for fixed rate instrumentsThe consolidated entity does not account for any fixed rate financial assets and liabilities at fair value through profit and loss, and the consolidated entity does not designate derivatives (interest rate swaps) as hedging instruments under a fair value hedge accounting model. Therefore a change in interest rates at reporting date would not affect profit and loss unless any hedges became ineffective.
Cash flow sensitivity analysis for variable rate instrumentsA strengthening by 100 basis points in interest rates at the reporting date would have increased (or in the event of a commensurate weakening, decreased) profit or loss and equity (pre-tax) at the end of the reporting period by the amounts shown below for the consolidated entity. This analysis assumes that all other variables remain constant.
In thousands of AUD
Profit/(loss) Equity
100bp increase
100bp decrease
100bp increase
100bp decrease
31 August 2015Variable rate instruments – – – –
Interest rate swap – – 1,442 (1,442)
Cash flow sensitivity (net) – – 1,442 (1,442)
31 August 2014Variable rate instruments – – – –
Interest rate swap – – – –
Cash flow sensitivity (net) – – – –
Fair valuesThe fair values of financial assets and liabilities are not materially different from the carrying amounts shown in the balance sheet.
Estimation of Fair ValuesThe following summarises the major methods and assumptions used in estimating the fair values of financial instruments reflected in the table.
Loans and BorrowingsFair value is calculated based on discounted expected future principal and interest cash flows.
Finance Lease LiabilitiesThe fair value is estimated as the present value of future cash flows, discounted at market interest rates for homogeneous lease agreements. The estimated fair values reflect change in interest rates.
Trade and other Receivables/PayablesFor receivables/payables with a remaining life of less than one year, the notional amount is deemed to reflect the fair value. All other receivables/payables are discounted to determine the fair value.
Interest rates used for determining fair valueThe entity uses the government yield curve as of the year end, plus an adequate constant credit spread, to discount financial instruments. The interest rates used are as follows:
31 August 2015
31 August 2014
Loans and borrowings 4.0%–6.5% 4.5%–6.5%
Leases 5.0%–5.5% 3.0%–4.0%
Receivables Nil Nil

72
Australian Pharmaceutical Industries Limited Annual Report 2015
23. COMMITMENTS
Operating Leases – Leases as LesseeNon-cancellable operating lease rentals are payable as follows:
In thousands of AUD31 August
201531 August
2014
Less than one year 45,734 45,961
Between one and five years 103,070 110,715
More than five years 30,007 39,371
178,811 196,047
The consolidated entity leases property and plant under non-cancellable operating leases expiring from two to fifteen years. Leases generally provide the consolidated entity with a right of renewal at which time all terms are renegotiated.
During the year ended 31 August 2015, $62,980,803 was recognised by the consolidated entity as an expense in the profit and loss in respect of operating leases and other related occupancy costs (31 August 2014: $60,713,797).
Certain leases are subject to contingent rental clauses calculated as a percentage of revenue earned in excess of pre-determined thresholds set out in the lease agreements. The consolidated entity recognises these amounts as an expense in the period where it is anticipated these thresholds will be reached.
With certain franchise arrangements, the consolidated entity continues to hold the head lease and recharges the franchisee the appropriate rental charge. For those leases, the franchisee is invoiced in advance and offset against the rental charge from the landlord.
Capital Expenditure Commitments
In thousands of AUD31 August
201531 August
2014
Contracted but not provided for or payable: 2,003 22,609
24. CONTINGENCIES
Contingent LiabilitiesThe Directors are of the opinion that provisions are not required in respect of these matters, as it is not probable that a future sacrifice of economic benefits will be required or the amount is not capable of reliable measurement.
Consolidated The Company
In thousands of AUDYear ended
31 August 2015Year ended
31 August 2014Year ended
31 August 2015Year ended
31 August 2014
Guarantee of bank facilities to controlled entities (i) – – 8,133 8,073
(i) These guarantees all relate to the parent entity.
The parent entity has entered into a deed of cross guarantee with the effect that Australian Pharmaceuticals Industries Limited guarantees debts in respect of its subsidiaries.
Further detail of the Deed of Cross Guarantee and the nominated subsidiaries subject to the deed are disclosed in Note 26.
NOTES TO THE FINANCIAL STATEMENTScontinued

Annual Report 2015 Australian Pharmaceutical Industries Limited
73
25. CONSOLIDATED ENTITIES
Ownership interest
Note31 August
201531 August
2014
Parent EntityAustralian Pharmaceutical Industries Limited
SubsidiariesAPI Services Australia Pty Ltd 100 100
Thrift Chemist Merchandising Pty Limited (iii) – 100
Australian Pharmaceutical Industries (Queensland) Pty Limited (ii) 100 100
API Victoria Pty Limited (ii) 100 100
Soul Pattinson (Manufacturing) Pty Limited 100 100
API Financial Services Australia Pty Limited (ii) 100 100
Pharma-Pack Pty Limited 100 100
API (Canberra) Pty Limited 100 100
Canberra Pharmaceutical Supplies Trust 100 100
Stevens KMS Equities Limited (i) 100 100
API Healthcare Holdings (NZ) Limited (i) 100 100
Priceline (NZ) Pty Ltd (i) 100 100
PAF (New Zealand) Ltd (i) 100 100
The Medicine Shoppe Limited (i) 100 100
PSM Healthcare Limited (i) 100 100
Pharmaceutical Sales and Marketing Ltd (i) 100 100
Garrett Investments Limited (i) 100 100
Healthcare Manufacturing Group Limited (i) 100 100
Synapse Finance Pty Ltd (ii) 100 100
New Price Retail Finance Pty Ltd (ii) 100 100
New Price Retail Pty Ltd 100 100
New Price Retail Services Pty Ltd 100 100
You Pay Less Pty Ltd (iii) - 100
PAF (Priceline) Pty Ltd (iii) - 100
Priceline Unit Trust 100 100
Second Priceline Unit Trust 100 100
Priceline Proprietary Limited (ii) 100 100
Making Life Easy - Mobility and Independent Living Superstores Pty Ltd 100 100
MLE Unit Trust 100 100
(i) These controlled entities are incorporated in New Zealand and carry on business predominantly in New Zealand. All other controlled entities are incorporated and carry on business predominantly in Australia.(ii) These controlled entities have each entered into a Deed of Cross Guarantee with Australian Pharmaceuticals Industries Limited in respect of relief
granted from specific accounting and financial reporting requirements in accordance with ASIC Class Order 98/1418.(iii) Voluntarily deregistered on 5 September 2014.
All subsidiaries have a balance date equivalent to the parent entity.

74
Australian Pharmaceutical Industries Limited Annual Report 2015
26. DEED OF CROSS GUARANTEE Pursuant to ASIC Class Order 98/1418 (as amended) dated 13 August 1998, the wholly-owned subsidiaries listed below are relieved from the Corporations Act 2001 requirements for preparation, audit and lodgement of financial reports, and Directors reports.
It is a condition of the Class Order that the Company and each of the subsidiaries enter into a Deed of Cross Guarantee. The effect of the Deed is that the Company guarantees to each creditor payment in full of any debt in the event of winding up of any of the subsidiaries under certain provisions of the Corporations Act 2001. If a winding up occurs under other provisions of the Act, the Company will only be liable in the event that after six months any creditor has not been paid in full. The subsidiaries have also given similar guarantees in the event that the Company is wound up.
The subsidiaries subject to the Deed are:
– API Financial Services Australia Pty Ltd – API Victoria Pty Ltd – Australian Pharmaceutical Industries (Queensland) Pty Ltd – New Price Retail Finance Pty Ltd – Priceline Pty Ltd – Synapse Finance Pty Ltd
A condensed consolidated income statement and consolidated balance sheet comprising the Company and controlled entities which are party to the Deed, after eliminating all transactions between parties to the Deed of Cross Guarantee, at 31 August 2015 is set out as follows:
SummarisedStatementofComprehensiveIncome,RetainedProfitsandReserves
Closed Group
In thousands of AUD
Year ended 31 August
2015
Year ended 31 August
2014
Profit/(loss) before tax 36,188 (116,441)
Income tax (expense)/benefit (14,881) 8,027
Profit/(loss)aftertax 21,307 (108,414)Other comprehensive (expense)/income (555) 734
Totalcomprehensive(expense)/incomefortheperiod 20,752 (107,680)Accumulated losses at beginning of the year (120,516) (12,142)
Loss after tax – (108,414)
Remeasurements of Defined Benefit Liability, net of tax – 40
Accumulated losses at end of the year attributable to equity holders (120,516) (120,516)
Reserves at beginning of the year 3,720 17,831
Profits reserve 21,307 –
Dividend paid out of profits reserve (19,525) (15,864)
Other comprehensive (expense)/income (555) 734
Remeasurements of Defined Benefit Liability, net of tax 41 –
Share based payment transactions 1,503 1,019
Reserves at the end of the year attributable to equity holders 6,491 3,720
NOTES TO THE FINANCIAL STATEMENTScontinued
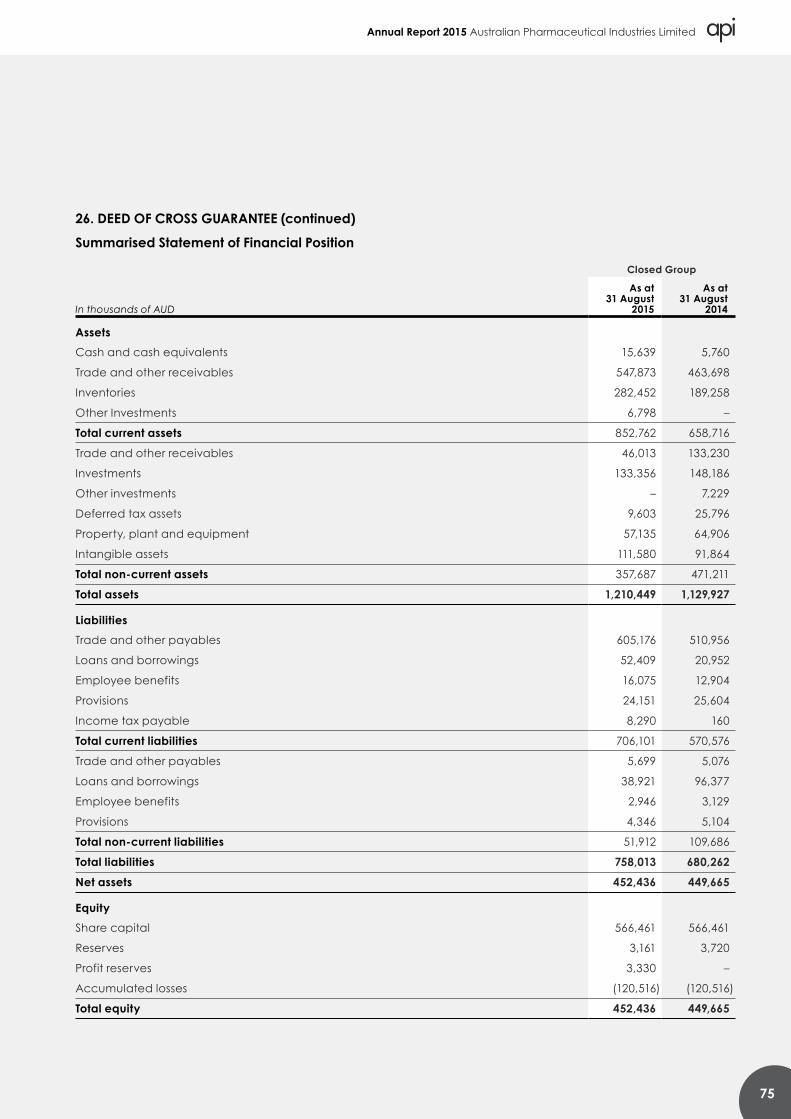
Annual Report 2015 Australian Pharmaceutical Industries Limited
75
26. DEED OF CROSS GUARANTEE (continued)
Summarised Statement of Financial Position
Closed Group
In thousands of AUD
As at 31 August
2015
As at 31 August
2014
AssetsCash and cash equivalents 15,639 5,760
Trade and other receivables 547,873 463,698
Inventories 282,452 189,258
Other Investments 6,798 –
Total current assets 852,762 658,716
Trade and other receivables 46,013 133,230
Investments 133,356 148,186
Other investments – 7,229
Deferred tax assets 9,603 25,796
Property, plant and equipment 57,135 64,906
Intangible assets 111,580 91,864
Total non-current assets 357,687 471,211
Total assets 1,210,449 1,129,927
LiabilitiesTrade and other payables 605,176 510,956
Loans and borrowings 52,409 20,952
Employee benefits 16,075 12,904
Provisions 24,151 25,604
Income tax payable 8,290 160
Total current liabilities 706,101 570,576
Trade and other payables 5,699 5,076
Loans and borrowings 38,921 96,377
Employee benefits 2,946 3,129
Provisions 4,346 5,104
Total non-current liabilities 51,912 109,686
Total liabilities 758,013 680,262Net assets 452,436 449,665
EquityShare capital 566,461 566,461
Reserves 3,161 3,720
Profit reserves 3,330 –
Accumulated losses (120,516) (120,516)
Total equity 452,436 449,665

76
Australian Pharmaceutical Industries Limited Annual Report 2015
27. RECONCILIATION OF CASH FLOWS FROM OPERATING ACTIVITIES
In thousands of AUD
Year ended 31 August
2015
Year ended 31 August
2014
Cash Flows from Operating ActivitiesProfit/(loss) for the period 43,126 (90,771)
Adjustments for:
Depreciation 14,937 17,975
Amortisation 5,444 270
Impairment (gain)/loss on property, plant and equipment (108) 1,189
Impairment loss on goodwill/brands/JV investments – 79,000
Foreign exchange gains (111) (104)
Share of loss of associates net of dividends received 431 1,096
Net loss on sale of stores, property, plant and equipment 1,046 710
Equity-settled share-based payment expenses 1,503 1,019
Net finance cost 14,140 18,080
Income tax expense 16,329 5,727
(Increase)/ Decrease in trade and other receivables (25,462) 21,005
Increase in inventories (21,724) (6,544)
Increase in trade and other payables 50,940 10,815
Increase in provisions and employee benefits 1,332 30,463
101,823 89,930Net interest paid (14,178) (17,813)
Income taxes paid (7,589) (7,929)
Net Cash from Operating Activities 80,056 64,188
In thousands of AUD
As at 31 August
2015
As at 31 August
2014
Cash at bank 28,047 23,526
Cash and cash equivalents in the statement of cash flows 28,047 23,526
NOTES TO THE FINANCIAL STATEMENTScontinued

Annual Report 2015 Australian Pharmaceutical Industries Limited
77
28. RELATED PARTIES
Key management personnel compensationThe key management personnel compensation included in ‘Personnel Expenses’ is as follows
In AUD
Year ended 31 August
2015
Year ended 31 August
2014*
Short-term employee benefits 3,261,715 2,613,363
Post employment benefits 486,105 144,179
Share based payments 391,918 234,829
4,139,738 2,992,371
* Following a review during the 2015 financial year, it is not considered certain Executives of the Company previously disclosed as KMP were within the scope of KMP having regard to the definition in AASB 124.
Individual Directors and executives compensation disclosuresInformation regarding individual Directors and executives’ compensation and some equity instruments disclosures as required by Corporations Act S300A and Corporations Regulations 2M.3.03 are provided in the Remuneration Report section of the Directors’ Report.
Apart from the details disclosed in this note, no director has entered into a material contract with the Company or the consolidated entity since the end of the previous financial year and there were no material contracts involving Directors’ interests existing at year-end.
Other Key Management Personnel transactions with the Company or its Controlled EntitiesCertain members of key management personnel are Directors of an associate entity (as discussed in Note 13) that result in them having influence over the financial or operating policies of that entity. The associate transacted with the Company or its subsidiaries in the reporting period. The terms and conditions of the transactions with that party were no more favourable than those available, or which might reasonably be expected to be available, on similar transactions to non-related entities on an arm’s length basis.
Certain Directors of the Company are also directors of companies that have entered into transactions with the Company and its controlled entities during the financial year. These transactions may include purchasing of inventories from the Company or its controlled entities. All transactions with the Directors and the companies they represent are on the same terms and conditions as those entered into by other entities, employees or customers and are trivial or domestic in nature.
No shares were granted during the period to Directors or senior executives.
Messrs R D Millner and P R Robinson (resigned 31 March 2015) are Directors of Washington H Soul Pattinson and Company Limited. Washington H Soul Pattinson and Company Limited holds 120,214,969 shares (31 August 2014: 120,214,969 shares) in the Company at year end 31 August 2015.
During the year, further performance rights were issued by the Company to key management personnel and certain senior executives. Share rights forfeited by and issued to key management personnel have been disclosed in the Remuneration Report contained within the Directors Report of this report.
Non Key Management Personnel DisclosuresAssociatesDuring the year ended 31 August 2015, associates purchased goods from the consolidated entity in the amount of $410,252 (year ended 31 August 2014: $319,264) and at 31 August 2015 associates owed the consolidated entity $136,464 (31 August 2014: $125,816). Transactions with associates are priced on an arm’s length basis.
No dividends were received from associates during the period ended 31 August 2015 nor for the period ended 31 August 2014.

78
Australian Pharmaceutical Industries Limited Annual Report 2015
29. AUDITORS’ REMUNERATION
Consolidated
In AUD
Year ended 31 August
2015
Year ended 31 August
2014
Audit servicesAuditors of the Company
KPMG Australia:
Audit and review of financial reports 605,000 622,670*
Overseas KPMG firms:
Audit and review of financial reports 38,000 37,000
643,000 659,670
Other servicesAuditors of the Company
KPMG Australia:
Other assurance services 19,775 29,021
Other advisory services 1,500 74,749
Taxation services 289,754 –
Overseas KPMG firms:
Taxation services 11,794 10,994
965,823 774,434
* The 2014 audit fees have been restated to reflect $27,270 additional fees relating to the 2014 audit that were paid in 2015.
30. SUBSEQUENT EVENTSOn 22 October 2015, a final dividend of 2.5 cents per share, fully franked to be paid out of the Profits Reserve on 4 December 2015, amounting to $12.2 million was declared.
NOTES TO THE FINANCIAL STATEMENTScontinued

Annual Report 2015 Australian Pharmaceutical Industries Limited
79
1 In the opinion of the Directors of Australian Pharmaceutical Industries Limited (‘API’):
(a) the consolidated financial statements and notes set out on pages 30 to 78, and the Remuneration Report set out on pages 12 to 25 in the Directors’ Report, are in accordance with the Corporations Act 2001, including:
(i) giving a true and fair view of the financial position of the consolidated entity as at 31 August 2015 and of its performance, for the financial period ended on that date; and
(ii) complying with Australian Accounting Standards (including Australian Accounting Interpretations) and the Corporations Regulations 2001;
(b) the consolidated financial report also complies with International Financial Accounting Standards as disclosed in Note 1(b); and
(c) there are reasonable grounds to believe that API will be able to pay its debts as and when they become due and payable.
There are reasonable grounds to believe that API and the controlled entities identified in Note 25 will be able to meet any obligations or liabilities to which they are or may become subject to by virtue of the Deed of Cross Guarantee between the Company and those controlled entities pursuant to ASIC Class Order 98/1418.
2 The Directors have been given the declarations by the chief executive officer and chief financial officer for the financial period ended 31 August 2015 pursuant to Section 295A of the Corporations Act 2001.
Dated at Sydney, 21 October 2015
Signed in accordance with a resolution of the Directors:
Peter R Robinson Director
DIRECTORS’ DECLARATION

80
Australian Pharmaceutical Industries Limited Annual Report 2015
INDEPENDENT AUDITOR’S REPORT
INDEPENDENT AUDITOR’S REPORT TO THE MEMBERS OF AUSTRALIAN PHARMACEUTICAL INDUSTRIES LIMITED
Report on the Financial ReportWe have audited the accompanying financial report of Australian Pharmaceutical Industries Limited (the Company), which comprises the consolidated statement of financial position as at 31 August 2015, and consolidated income statement and consolidated statement of comprehensive income, consolidated statement of changes in equity and consolidated statement of cash flows for the year ended on that date, Notes 1 to 30 comprising a summary of significant accounting policies and other explanatory information and the directors’ declaration of the Group comprising the Company and the entities it controlled at the year’s end or from time to time during the financial year.
Directors’ Responsibility for the Financial Report The directors of the company are responsible for the preparation of the financial report that gives a true and fair view in accordance with Australian Accounting Standards and the Corporations Act 2001 and for such internal control as the directors determine is necessary to enable the preparation of the financial report that is free from material misstatement whether due to fraud or error. In Note 1(b), the directors also state, in accordance with Australian Accounting Standard AASB 101 Presentation of Financial Statements, that the financial statements of the Group comply with International Financial Reporting Standards.
Auditor’s ResponsibilityOur responsibility is to express an opinion on the financial report based on our audit. We conducted our audit in accordance with Australian Auditing Standards. These Auditing Standards require that we comply with relevant ethical requirements relating to audit engagements and plan and perform the audit to obtain reasonable assurance whether the financial report is free from material misstatement.
An audit involves performing procedures to obtain audit evidence about the amounts and disclosures in the financial report. The procedures selected depend on the auditor’s judgement, including the assessment of the risks of material misstatement of the financial report, whether due to fraud or error. In making those risk assessments, the auditor considers internal control relevant to the entity’s preparation of the financial report that gives a true and fair view in order to design audit procedures that are appropriate in the circumstances, but not for the purpose of expressing an opinion on the effectiveness of the entity’s internal control. An audit also includes evaluating the appropriateness of accounting policies used and the reasonableness of accounting estimates made by the directors, as well as evaluating the overall presentation of the financial report.
We performed the procedures to assess whether in all material respects the financial report presents fairly, in accordance with the Corporations Act 2001 and Australian Accounting Standards, a true and fair view which is consistent with our understanding of the Group’s financial position and of its performance.
We believe that the audit evidence we have obtained is sufficient and appropriate to provide a basis for our audit opinion.
KPMG, an Australian partnership and a member firm of the KPMG network of independent member firms affiliated with KPMG International Cooperative(“KPMG International”), a Swiss entity. Liability limited by a scheme approved under Professional Standards Legislation.

Annual Report 2015 Australian Pharmaceutical Industries Limited
81
IndependenceIn conducting our audit, we have complied with the independence requirements of the Corporations Act 2001.
Auditor’s OpinionIn our opinion:
(a) the financial report of Group is in accordance with the Corporations Act 2001, including:
(i) giving a true and fair view of the Group’s financial position as at 31 August 2015 and of its performance for the year ended on that date; and
(ii) complying with Australian Accounting Standards and the Corporations Regulations 2001.
(b) the financial report also complies with International Financial Reporting Standards as disclosed in Note 1(b).
Report on the Remuneration ReportWe have audited the Remuneration Report included in pages 12 to 25 of the directors’ report for the year ended 31 August 2015. The directors of the company are responsible for the preparation and presentation of the remuneration report in accordance with Section 300A of the Corporations Act 2001. Our responsibility is to express an opinion on the remuneration report, based on our audit conducted in accordance with auditing standards.
Auditor’s OpinionIn our opinion, the remuneration report of Australian Pharmaceutical Industries Limited for the year ended 31 August 2015, complies with Section 300A of the Corporations Act 2001.
KPMG
Maurice Bisetto Partner
Melbourne 21 October 2015
KPMG, an Australian partnership and a member firm of the KPMG network of independent member firms affiliated with KPMG International Cooperative(“KPMG International”), a Swiss entity. Liability limited by a scheme approved under Professional Standards Legislation.
Trent Duvall Partner
Sydney 21 October 2015

82
Australian Pharmaceutical Industries Limited Annual Report 2015
ASX ADDITIONAL INFORMATIONAdditional information required by the Australian Stock Exchange Limited Listing Rules and not disclosed elsewhere in this report is set out below.
Shareholdings as at 21 October 2015
Substantial ShareholdersThe number of shares held by substantial shareholders and their associates are set out below:
Washington H Soul Pattinson and Company Limited 120,214,969 ordinary shares
SL Nominees Pty Ltd 58,122,597 ordinary shares
Citicorp Nominees Pty Limited 43,718,245 ordinary shares
J P Morgan Nominees Australia Limited 43,660,425 ordinary shares
HSBC Custody Nominees (Australia) limited 39,536,690 ordinary shares
Voting RightsThe voting rights attaching to the ordinary shares, as set out in clause 16.2 of the Company’s Constitution, are:
(a) on a show of hands:
(i) if a member has appointed two proxies, neither of those proxies may vote;
(ii) a member who is present and entitled to vote and is also a proxy, attorney or representative of another member has one vote; and
(iii) subject to paragraphs (a)(i) and (a)(ii), every individual present who is a member, or a proxy, attorney or representative of a member, entitled to vote has one vote;
(b) on a poll every member entitled to vote who is present in person or by proxy, attorney or representative:
(i) has one vote for every fully paid share held; and
(ii) subject to paragraph (c), in respect of each partly paid share held has a fraction of a vote equal to the proportion which the amount paid bears to the total issue price of the share; and
(c) unless:
(i) permitted under the Listing Rules; and
(ii) otherwise provided in the terms on which shares are issued,
in calculating the fraction of a vote which the holder of a partly paid share has, the Company must not count an amount:
(iii) paid in advance of a call; or
(iv) credited on a partly paid share without payment in money or money’s worth being made to the Company.
On-market Share Buy-backThere is no current on-market share buy-back.
SHAREHOLDER INFORMATION

Annual Report 2015 Australian Pharmaceutical Industries Limited
83
Distribution of Shareholders as at 21 October 2015
Category Ordinary Shares Number of Shareholders
1 – 1,000 2,007
1,001 – 5,000 3,087
5,001 – 10,000 1,267
10,001 – 100,000 1,781
100,001 and over 224
8,366
The number of shareholders holding less than a marketable parcel at 21 October 2015 was 528 (22 October 2014: 741)
Stock ExchangeThe Company is listed on the Australian Stock Exchange. The Home Exchange is Sydney.
Other InformationAustralian Pharmaceutical Industries Limited, incorporated and domiciled in Australia, is a publicly listed company limited by shares.
Twenty Largest Shareholders as at 21 October 2015 *
NameNumber of Ordinary
shares heldPercentage of
Capital held
Washington H Soul Pattinson and Company Limited 120,214,969 24.63
SL Nominees Pty Ltd 58,122,597 11.91
Citicorp Nominees Pty Limited 43,718,245 8.96
J P Morgan Nominees Australia Limited 43,660,425 8.94
HSBC Custody Nominees (Australia) Limited 39,536,690 8.10
National Nominees Limited 17,027,864 3.49
Prudential Nominees Pty Ltd 10,000,000 2.05
RBC Investor Services Aust. Nominees Pty Limited (BKCUST A/c) 7,675,866 1.57
3rd Wave Investors Limited 5,930,000 1.21
BNP Paribas Noms Pty Ltd (DRP) 5,741,298 1.18
National Exchange Pty Ltd 5,000,000 1.02
HSBC Custody Nominees (Australia) Limited (NT Commonwealth Super Corp A/c) 2,354,425 0.48
Bell Potter Nominees Limited (BB Nominees A/c) 2,152,776 0.44
Mr Frederick Benjamin Warmbrand (FB & LJ Warmbrand Super A/c) 1,600,000 0.33
Mr Raymond Francis Frew & Mrs Gillian Margaret Frew 1,588,588 0.33
Jum Pty Ltd 1,455,001 0.30
Brispot Nominees Pty Ltd (House Head Nominee No 1 A/c) 1,173,097 0.24
Mrs Elizabeth Anne Fogarty & Miss Caitlyn Anne Fogarty (Fogarty Foundation A/c) 1,000,000 0.21
HSBC Custody Nominees (Australia) Limited-GSCO ECA 902,949 0.18
Indcorp Consulting Group Pty Ltd (Superannuation Fund A/c) 788,700 0.16
369,643,490 75.73
* As shown on the register, beneficial holdings may differ.

84
Australian Pharmaceutical Industries Limited Annual Report 2015
Shareholder CommunicationsEnquiries or notifications by shareholders regarding their shareholdings or dividend should be directed to API’s share registry:
Boardroom Pty Limited Grosvenor Place Level 12 225 George Street Sydney NSW 2000
GPO Box 3993 Sydney NSW 2001
Telephone 1300 737 760 International +61 2 9290 9600 Facsimile 1300 653 459
Shareholders can also send queries to the share registry via email: [email protected]
You can access information about your API shareholding and download forms via the internet by visiting: www.boardroomlimited.com.au
DividendsIf you wish your dividends to be paid directly to a bank, building society or credit union account in Australia contact the share registry or visit the website of Boardroom at www.boardroomlimited.com.au for an application form. The payments are electronically credited on the dividend payment date and confirmed by payment advices sent through the mail to the shareholder’s registered address. All instructions received remain in force until amended or cancelled in writing.
TaxFileNumber(TFN),AustraliaBusinessNumber(ABNorexemption)You are strongly advised to lodge your TFN, ABN or exemption with the share registry. If you choose not to lodge these details, then API is obliged to deduct tax at the highest marginal rate (plus the Medicare levy) from the unfranked portion of any dividend. Certain pensioners are exempt from supplying their TFN’s. You can confirm whether you have lodged your TFN, ABN or exemption via the Boardroom website.
UncertificatedFormsofShareholdingsTwo forms of uncertificated holdings are available to API shareholders:
Issuer Sponsored Holdings:This type of holding is sponsored by API and provides shareholders with the advantages of uncertificated holdings without the need to be sponsored by any particular stockbroker.
BrokerSponsoredHoldings(‘CHESS’):Shareholders may arrange to be sponsored by a stockbroker (or certain other financial institutions) and
are required to sign a sponsorship agreement appointing the sponsor as their ‘controlling participant’ for the purposes of CHESS. This type of holding is likely to attract regular stock market traders or those shareholders who have their share portfolio managed by a stockbroker.
Shareholders communicating with the share registry should have their Security Holder Reference Number (SRN) at hand or Holder Identification Number (HIN) as it appears on the Issuer Sponsored/ CHESS statements or dividend advices. For security reason, shareholders should keep their Security Holder Reference Numbers confidential.
Annual Report Mailing ListShareholders (whether Issuer or Broker Sponsored) wishing to receive the Annual Report should advise Boardroom in writing so that their names can be added to the mailing list. Shareholders are able to update their preference via the Boardroom website. Shareholders can also elect to receive the Annual report by e-mail or by accessing the Company website.
Change of AddressShareholders who are Issuer Sponsored should notify any change of address to the share registry promptly in writing quoting their Security Holder Reference Number, previous address and new address. Application forms for Change of Address are also available for download via the Boardroom website. Broker Sponsored (CHESS) holders must advise their sponsoring broker of the change.
Share Trading and PriceAPI shares are traded on the Australian Stock Exchange Limited (‘ASX’). The stock code under which they are traded is ‘API’ and the details of trading activity are published in most daily newspapers under that abbreviation.
Off-Market Share TransfersStamp duty on transfer of listed shares was abolished on 1 July 2001.
Information on APIAPI has an internet site featuring news items, announcements, corporate information and a wide range of product and service information. API’s internet address is www.api.net.au
The Annual Report is the main source of information for shareholders. Other sources of information include:
– Interim results – Annual results – The Annual General Meeting – the Chairman and the
Managing Director address the meeting – ASX announcements
SHAREHOLDER INFORMATIONcontinued

Annual Report 2015 Australian Pharmaceutical Industries Limited
85
Financial Calendar*
Half year end 29 February 2016
Half year profit announcement 21 April 2016
Year end 31 August 2016
Full year profit announcement 20 October 2016
Annual General Meeting 25 January 2017
* Timing of events is subject to change
Requests for publications and other enquiries about API’s affairs should be communicated to:
Company SecretaryAustralian Pharmaceutical Industries Limited 250 Camberwell Road Camberwell, VIC 3124Enquiries can also be made via email by accessing www.api.net.au – “contact us”
CORPORATE DIRECTORYOfficesandOfficersCompany SecretaryMr Peter Sanguinetti B.Juris, LLB, MAICDPrincipal Registered OfficeAustralian Pharmaceutical Industries Limited 11 Grand Avenue Camellia NSW 2142Telephone: (02) 8844 2000 Facsimile: (02) 8844 2400
Location of Share RegistryBoardroom Pty Limited Grosvenor Place Level 12 225 George Street Sydney NSW 2000
GPO Box 3993 Sydney NSW 2001
Telephone 1300 737 760 International +61 2 9290 9600 Facsimile 1300 653 459 E-mail [email protected]

Australian Pharmaceutical Industries Limited
ABN 57 000 004 320
11 Grand Avenue, Camellia, NSW 2142250 Camberwell Road, Camberwell, VIC 3124
api.net.au