australia’s forests at a glance 2010 -...
TRANSCRIPT

at a glance 2010Australia’s forests
Data to 2009

© Commonwealth of Australia 2010
Passages, tables and diagrams may be reproduced with due acknowledgement.
ISSN 1837-8129
The Australian Government acting through the Bureau of Rural Sciences has exercised due care and skill in the preparation and compilation of the information and data set out in this publication. Notwithstanding, to the maximum extent permitted by law, the Bureau of Rural Sciences, its employees and advisers disclaim all liability, including expense or cost incurred by any person as a result of accessing, using or relying upon any of the information or data set out in this publication.
The main sources of data for this booklet are Australia’s State of the Forests Report 2008, Australian Forest and Wood Products Statistics, November 2009 and provisional data from the National Plantation Inventory 2010 update. The fi nal year is shown for data reported for fi nancial years. Where data earlier than 2009 are presented, they are the latest available, or are used to indicate trends. Totals in some tables may not tally exactly because of rounding.
Contact detailsBureau of Rural SciencesGPO Box 858, Canberra ACT 2601
More information on forest issues is available atwww.daff.gov.au/forestsaustralia
Cover images: (front) iStockphoto (back) Mark Parsons
1
Foreword
The Australian Government recognises Australia’s forests play a vital role in supporting our timber industries, regional jobs, tourism and recreation and biodiversity conservation.
We are committed to encouraging sustainable investment in forestry and helping our forest industries prepare for future challenges. This includes providing grants to increase the competitiveness of our forest resources and investing to address major knowledge gaps about the impact of climate change on our forest systems and industries.
We also remain determined to restrict the importation of illegally logged timber, which undermines local jobs and hurts communities in developing nations.
As Australia’s forests at a glance 2010 shows, the annual value of turnover of Australia’s forestry and forest products industries is $23 billion.
The Hon. Tony Burke MPMinister for Agriculture, Fisheries and Forestry March 2010
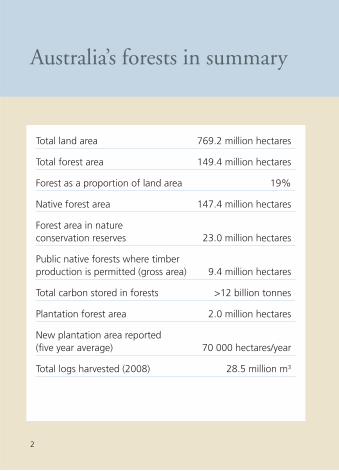
Australia’s forests in summary
Total land area 769.2 million hectares
Total forest area 149.4 million hectares
Forest as a proportion of land area 19%
Native forest area 147.4 million hectares
Forest area in nature conservation reserves 23.0 million hectares
Public native forests where timber production is permitted (gross area) 9.4 million hectares
Total carbon stored in forests >12 billion tonnes
Plantation forest area 2.0 million hectares
New plantation area reported(fi ve year average) 70 000 hectares/year
Total logs harvested (2008) 28.5 million m3
2
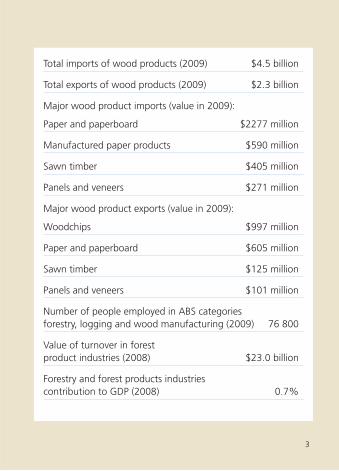
Total imports of wood products (2009) $4.5 billion
Total exports of wood products (2009) $2.3 billion
Major wood product imports (value in 2009):
Paper and paperboard $2277 million
Manufactured paper products $590 million
Sawn timber $405 million
Panels and veneers $271 million
Major wood product exports (value in 2009):
Woodchips $997 million
Paper and paperboard $605 million
Sawn timber $125 million
Panels and veneers $101 million
Number of people employed in ABS categories forestry, logging and wood manufacturing (2009) 76 800
Value of turnover in forestproduct industries (2008) $23.0 billion
Forestry and forest products industriescontribution to GDP (2008) 0.7%
3

4
Image Science and Analysis Laboratory, NASA Johnson Space Centre

Contents
Foreword 1
Australia’s forests in summary 2–3
Forest area 7
Types and class of forest 10
Native forest tenure and ownership 20
Forest in reserves 23
Plantation forests 25
Forest certifi cation and codes of practice 36
Forests, wood products and carbon 38
Fire 41
Forest industries 44
Forest products 46
State and Territory summaries 57
Information sources 94
References and further reading 96

6Department of Agriculture, Fisheries and Forestry

7
Forest area
The information about Australia’s native forests in this booklet is derived mainly from Australia’s State of the Forests Report 2008. Copies of that report can be obtained from the Bureau of Rural Sciences (see inside back cover).
Forest is defi ned as:
‘An area, incorporating all living and non-living components, that is dominated by trees having usually a single stem and a mature or potentially mature stand height exceeding 2 metres and with existing or potential crown cover of overstorey strata equal to or greater than 20%.’ This defi nition includes Australia’s diverse native forests and plantations, regardless of age, and encompasses areas of trees that are sometimes described as woodlands.
Australia has 147.4 million hectares of native forest and 2.0 million hectares of forestry plantations. Together these cover about 19% of the continent. Australia has about 4% of the world’s forests on 5% of the world’s land area.

8
Australia’s forests
Forest type
Eucalypt
Acacia
Other
9
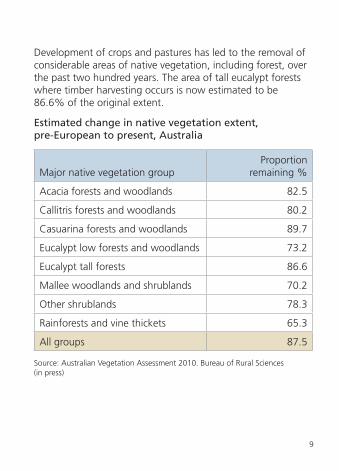
Development of crops and pastures has led to the removal of considerable areas of native vegetation, including forest, over the past two hundred years. The area of tall eucalypt forests where timber harvesting occurs is now estimated to be 86.6% of the original extent.
Estimated change in native vegetation extent, pre-European to present, Australia
Major native vegetation groupProportion
remaining %
Acacia forests and woodlands 82.5
Callitris forests and woodlands 80.2
Casuarina forests and woodlands 89.7
Eucalypt low forests and woodlands 73.2
Eucalypt tall forests 86.6
Mallee woodlands and shrublands 70.2
Other shrublands 78.3
Rainforests and vine thickets 65.3
All groups 87.5
Source: Australian Vegetation Assessment 2010. Bureau of Rural Sciences (in press)

10
Types and class of forest
Forests are categorised nationally by forest type (dominant genus) and by height and crown cover class (forest structure).
Australia’s native forest types are dominated by eucalypts (78%), followed by acacias (7%) and melaleucas (5%). In contrast, about half of Australia’s plantations are exotic conifers (predominantly Pinus radiata). The other half is mostly native hardwood species.
The distribution of forest types and class is mainly determined by climate and soil properties. Other factors, especially fi re frequency and intensity, are also important.
➜ Did you know?Australia’s native forest is 98% broadleaved; the area of native conifers is small.

11
Forest area by types (‘000 hectares)
Forest type Area
Acacia 10 365
Callitris 2597
Casuarina 2229
Eucalypt 116 449
Mangrove 980
Melaleuca 7556
Rainforest 3280
Other forest 3942
Total native forest (2008) 147 397
Hardwood plantation 991
Softwood plantation 1020
Other plantation 9
Total plantation (2009) 2020
Total forest 149 417

12
Forest crown cover
Crown cover is the area of ground covered by tree canopies. A line around the outer edge defi nes the limits of an individual canopy. All the area within that line is counted as ‘canopy’, irrespective of gaps and overlaps. The National Forest Inventory uses three broad national forest crown cover classes.
Native forest areas by crown cover class (‘000 hectares)
Woodland forest (20–50% crown cover) 99 007
Open forest (51–80% crown cover) 44 120
Closed forest (81–100% crown cover) 4 270
Total native forest 147 397
John Davidson

13
Native forest by crown cover class
Legend
Woodland
Open
Closed

14
Forest height
Forests are mapped into three national height classes based on potential mature stand height:
Native forest area by height class (‘000 hectares)
Height class Total
Low (height 2–10 metres) 35 846
Medium (height 10–30 metres) 104 024
Tall (height > 30 metres) 7329
Unknown 199
Total native forest 147 398
John Davidson

15
Australia’s forest by height class
Legend
Low
Medium
Tall

16
Native forest by crown cover and height class
➜ Did you know?
Nearly 46% of Australia’s forest is medium height woodland forest and less than 1% is tall closed forest?
Mark Parsons

17
Sour
ces:
Aus
tral
ian
Land
Info
rmat
ion
Gro
up a
nd J
A C
arna
han
1990
, Atla
s of
Aus
tral
ian
Reso
urce
s,
Vege
tatio
n, A
ustr
alia
n G
over
nmen
t Pu
blis
hing
Ser
vice
, Can
berr
a
Not
e: P
erce
ntag
es f
rom
the
NFI
.
Pro
po
rtio
n o
f A
ust
ralia
’s f
ore
st e
xten
t in
eac
h c
lass
TALL
(gre
ater
th
an 3
0m)
WO
OD
LAN
D F
ORE
STSp
arse
cro
wn
cove
r (2
0–50
%)
MED
IUM
(10–
30m
)
LOW
(2–1
0m)
Potential mature stand height (m)
3040 20 10 3040 20 10 15 10 5
OPE
N F
ORE
STD
ense
cro
wn
cove
r (5
1–80
%)
CLO
SED
FO
REST
Clo
sed
crow
n co
ver
(81–
100%
)
20.8
%2.
9%0.
6%
45.8
%23
.2%
1.7%
0.4%
4.0%
0.5%

18
Old-growth forests
Old-growth forests are ecologically mature forests where the effects of past disturbances are now negligible.
Old-growth forests were surveyed in regions where assessments were conducted for Regional Forest Agreements (RFAs) a decade or more ago. There has been no comprehensive survey of old-growth forests across the rest of Australia. Old growth forests in Western Australia were remapped in 2007.
In RFA regions:
• more than fi ve million hectares of forest, or 22%, were classifi ed as old-growth
• 73% of these known old-growth forests are in conservation reserves. Some of the remainder are available for timber production.
➜ Did you know?
79% of Tasmania’s identifi ed old-growth forests are in conservation reserves.

19
Area of old-growth forest in areas surveyed for RFAs (‘000 hectares)
Native forest in
region
Area of old-growth
identifi ed
Area of old-growth in reservesa
Proportion in reserves
%
NSWb 8989 2536 1742 69
Qldb 3230 270 196 73
Tas. 3116 1229 973 79
Vic.c 5774 673 460 68
WAd 1909 331 331 100
Total 23 018 5039 3702 73e
Note: Old-growth forest has not been assessed in the Australian Capital Territory, Northern Territory and South Australia.a Includes nature conservation reserves and formal and informal reserves on
other tenures.b Area surveyed in Queensland did not lead to establishment of a RFA. New
reserves have been established in New South Wales and Queensland since this information was prepared. The ‘area in formal and informal reserves’ is therefore an underestimate.
c The area of old-growth was reduced as a result of conversion to regrowth by fi res, predominantly in 2003.
d Original RFA old-growth mapping.e Proportion of total area for the fi ve states listed.
20
Native forest tenure and ownership
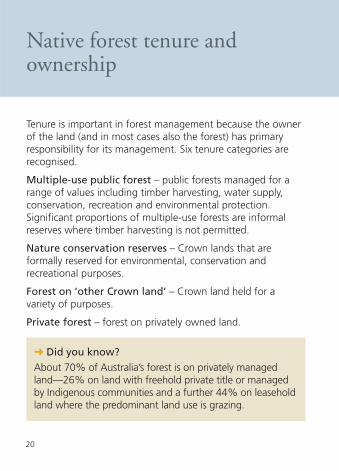
➜ Did you know?About 70% of Australia’s forest is on privately managed land—26% on land with freehold private title or managed by Indigenous communities and a further 44% on leasehold land where the predominant land use is grazing.
Tenure is important in forest management because the owner of the land (and in most cases also the forest) has primary responsibility for its management. Six tenure categories are recognised.
Multiple-use public forest – public forests managed for a range of values including timber harvesting, water supply, conservation, recreation and environmental protection. Signifi cant proportions of multiple-use forests are informal reserves where timber harvesting is not permitted.
Nature conservation reserves – Crown lands that are formally reserved for environmental, conservation and recreational purposes.
Forest on ‘other Crown land’ – Crown land held for a variety of purposes.
Private forest – forest on privately owned land.

21
Leasehold forest – forest on privately-managed leased Crown land generally used for grazing.
Unresolved tenure – forest for which ownership status has not been determined.
There are Indigenously managed native forests in each of the tenure categories described above with the exception of multiple-use forests. There is no formal tenure classifi cation system to enable native forests managed by Indigenous people to be identifi ed.
Native forest area by tenure category, 2008
TenureArea
(‘000 hectares)
Proportion of total
%
Multiple-use forest 9410 6
Nature conservation reservea 22 371 15
Other Crown land 10 862 7
Private forest (including Indigenous) 38 099 26
Leasehold forest 65 132 44
Unresolved tenure 1524 1
Total native forest 147 397 100
Note: Data in this table are supplied by the states and territories. The 23 million hectares of formal nature conservation reserve (IUCN categories I–IV) mentioned on page 23 are derived from the Collaborative Australian Protected Area Database that includes additional reserved lands found in ‘Other Crown land’ and ‘Private land’ categories.

22
Forest cover, by tenure
Legend
Leasehold
Multiple-use forest
Nature conservation reserve
Unresolved
Other Crown land
Private
23
Forest in reserves
Governments have developed regional forest agreements (RFAs) for most of the main native forest timber production areas. RFAs are 20-year plans for the conservation and sustainable management of those forests. They provide a comprehensive, adequate and representative nature conservation reserve system. The aim of the system was to reserve at least 15% of the pre-1750 distribution of each forest type, 60% of the existing distribution of each forest type if vulnerable, 60% of existing old-growth forest, 90% or more of high quality wilderness forests, and all remaining rare and endangered forest ecosystems.
In 2008, 23.0 million hectares—16% of Australia’s forests—were in dedicated formal conservation reserves (reserved in International Union for Conservation of Nature and Natural Resources reserve categories I–IV).
Additional forests are conserved within leasehold land, multiple-use forest and private land (through covenants or other management arrangements). Codes of forest practice and other regulatory mechanisms also require conservation of forest biodiversity and protection of other values, such as water quality.

24
Tim Clancy
➜ Did you know?
The proportion of Australia’s forests in nature conservation reserves recognised by the International Union for Conservation of Nature increased from 11% in 1998 to 16% in 2008.

25
Plantation forests
What is a plantation?
Plantations are intensively managed stands of trees, of native or exotic species, created by the regular placement of seedlings or seeds.
The primary purpose of plantation forestry is wood production. Plantations also contribute to a range of environmental values and services including water quality improvement, dryland salinity mitigation, biofuels, carbon sequestration and habitat for native plants and animals.
Plantation species fall into two groups:
• Softwood – mainly pine (Pinus) species.
• Hardwood – mainly eucalypts, including Eucalyptus and Corymbia species.

26
Blue gum 62%
Shining gum 19%
Blackbutt and flooded gum 4%
Other eucalypts 11%
Other hardwoods 4%
Radiata pine 75%
Southern pine 15%
Hoop pine 5%
Maritime pine 4%
Other softwoods 1%
Softwoods
Hardwoods

27
Plantation establishment began in Australia in the 1870s. About 200 000 hectares had been established by 1960 and over 90% of that was introduced pines. From the 1960s to the 1980s, the area of pine plantations increased rapidly because of investment by governments.
The total area by 1990 was a little over one million hectares. After 1990, the area of hardwood plantations began to increase rapidly because of private investment, while the rate of establishment of new pine plantations slowed. In some regions the softwood area has declined in the past few years because harvested pine areas have been replanted with hardwood species or the land has been used for other purposes.
The emphasis since 1990 has been on eucalypts established on farmland and managed to produce woodchips for paper manufacture on 10 to 15 year rotations. A small proportion is managed for sawlog production.

28
Types of plantations by climate region
Type Climate region Main species Main uses
Tropical:high rainfall
Mangium (an Acacia)
Paper products
Sub-tropical: medium rainfall
Flooded gum, Dunns white gum
Paper products
Temperate: medium to high rainfall
Blue gum, shining gum
Paper products
Tropical:high rainfall
African mahogany, teak, some native species
Sawn timber for furniture, fl ooring and other high value uses
Several regions Various eucalypts Sawn timber for building and furniture
Temperate: medium rainfall
Radiata pine Sawn timber for building, joinery, furniture, plywood, other high-value uses; posts and poles; residues used for paper, particleboard and other panels
Tropical, sub-tropical: medium rainfall
Caribbean pine, slash pine and hybrids
Temperate: low to medium rainfall
Maritime pine
Tropical, subtropical: high rainfall
Hoop pine
Har
dwoo
dSo
ftw
ood
29
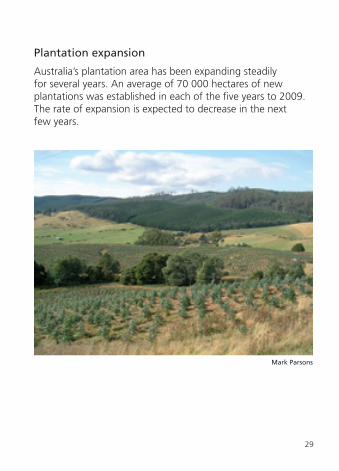
Plantation expansion
Australia’s plantation area has been expanding steadily for several years. An average of 70 000 hectares of new plantations was established in each of the fi ve years to 2009. The rate of expansion is expected to decrease in the next few years.
Mark Parsons

30
New areas of plantation by species group
0
100
120
140
160
80
60
40
20
1995
1996
1997
1998
1999
2000
2001
2002
2003
2004
2005
2006
2007
2008
2009
(’000
hec
tare
s)
Softwood
Hardwood
Total
Cumulative plantation area by species group
0
1000
1500
2000
2500
500
1950 1960 1970 1980 1990 2000 2010
(’000
hec
tare
s)
SoftwoodHardwood
Total

31
Current area of plantations
There were 2.0 million hectares of plantations in Australia in 2009. Of this total, 49% were hardwood species and 51% were softwood species. Victoria and Western Australia are the states with the largest areas of plantations.
Plantation area by species group and jurisdiction 2009
0
200
300
400
500
100
NSW NT Qld SA Tas. Vic. WA ACT
(’000
hec
tare
s)
Softwood
Hardwood

32
Plantation ownership
State governments were the major plantation owners in the early 1990s. Since then, most of the investment in new plantations has been in the private sector. The Victorian and Tasmanian governments have sold plantations to private investors. Private ownership of plantations has therefore increased from about 30% in 1990 to about 62% in 2009. The private plantations include an estimated 100 000 hectares of small scale farm forestry plantings. Public ownership is 33% and about 5% is jointly owned. Most of the expansion in private plantations has been funded by managed investment schemes.

33
Plantation land and tree ownership by planting years
40
60
80
100
20
0
1951
–60
1961
–70
1971
–80
1981
–90
1991
–00
2001
–05
%
Public land and public tree ownership
Public land and private tree ownership
Public land and joint tree ownership
Private land and private tree ownership
Private land and joint tree ownership
Superannuation funds 13%
Timber industry companies 7%
Farm foresters and other private growers 10%
Managed investment schemes 35%
Governments 35%
Plantation ownership by owner type 2009

34
Wood supply from plantations
Plantations currently produce about two-thirds of the 27 million cubic metres logs of harvested in Australia each year. The balance of the logs comes from native forests.
The potential supply of softwood plantation sawlogs and pulpwood is not expected to change signifi cantly from now to 2050.
The potential log supply from hardwood plantations will rise rapidly because the large areas established from the mid-1990s are reaching rotation age. The vast majority of those plantations are managed to produce pulpwood for papermaking. Hardwood sawlog supply from plantations is estimated to rise slowly to 2030 then stabilise at a low level or decline to 2050.
➜ Did you know?Plantations provide 75% of the sawlogs produced in Australia, yet comprise only 1.3% of the forest area.

35
Futu
re w
oo
d s
up
plie
s fr
om
pla
nta
tio
ns
0101214161820 8 6 4 2
2005–09
2010–14
2015–19
2020–24
2025–29
2030–34
2035–39
2040–44
2045–49
Soft
woo
d pu
lpw
ood
Har
dwoo
d sa
wlo
gH
ardw
ood
pulp
woo
dSo
ftw
ood
saw
log
Forecast supply (million m3)
36
Forest certifi cation and codes of practice
Forest and chain of custody certifi cation assures buyers in Australia and around the world that the forest products they obtain originate from legally harvested and sustainably managed native forests and plantations.
Several private organisations conduct forest and chain of custody certifi cation in Australia. They use standards set by either the Australian Forest Certifi cation Scheme (AFCS) or the Forest Stewardship Council (FSC) scheme.
The AFCS uses the Australian Forestry Standard, which was developed via a nation-wide process involving representatives of the Australian community, industry and government. The FSC uses a standard that complies with its international ‘Principles of Responsible Forest Management’. Both schemes issue chain-of-custody certifi cates that identify and track certifi ed wood and wood products through the supply chain.
The area of certifi ed forest and plantation in Australia has grown rapidly to about 10.4 million hectares. This includes most of the native forests managed for timber production.

37
In addition to certifi cation, multiple-use public forests and private forests are managed in accordance with codes of practice. Many forest managers use environmental management systems (EMS) that are certifi ed independently to an ISO standard. Public forest management agencies with certifi ed EMS in place include Forests NSW, Forestry SA, Queensland’s Department of Natural Resources and Water (Forest Products), Forestry Plantations Queensland, Western Australia’s Forest Products Commission, Victoria’s Department of Sustainability and Environment, and Forestry Tasmania. Several large private forestry enterprises also have EMS.
John Davidson
38
John Davidson
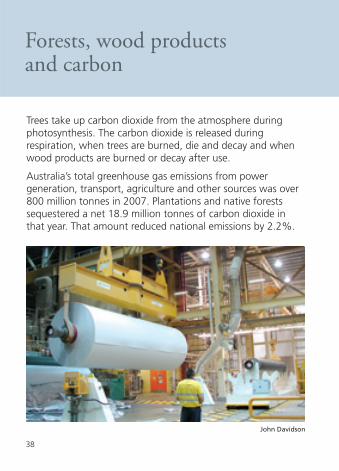
Trees take up carbon dioxide from the atmosphere during photosynthesis. The carbon dioxide is released during respiration, when trees are burned, die and decay and when wood products are burned or decay after use.
Australia’s total greenhouse gas emissions from power generation, transport, agriculture and other sources was over 800 million tonnes in 2007. Plantations and native forests sequestered a net 18.9 million tonnes of carbon dioxide in that year. That amount reduced national emissions by 2.2%.
Forests, wood products and carbon

39
Australia’s greenhouse gas emissions by sector, 2007
200
300
400
100
0
-50
Fuel
com
bust
ion
Fugi
tive
emis
sion
sfr
om f
uels
Indu
stria
l pro
cess
es
Agr
icul
ture
Was
te d
ispo
sal
Land
use
cha
nge
Plan
tatio
ns a
ndna
tive
fore
sts
Mill
ion
tonn
es C
O2
equi
vale
nt
Note: Emissions from land use change were substantially higher in 2007 than in 2006 because of wildfi res and drought that caused losses from all vegetation carbon pools.Source: National Greenhouse Gas Inventory, Department of Climate Change, 2009.
40
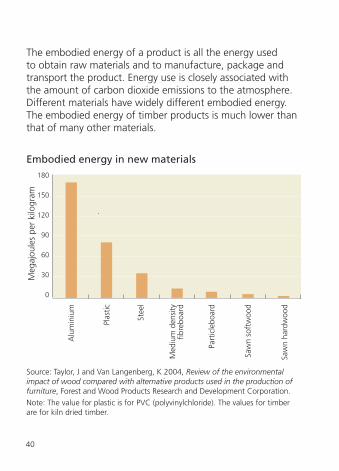
The embodied energy of a product is all the energy used to obtain raw materials and to manufacture, package and transport the product. Energy use is closely associated with the amount of carbon dioxide emissions to the atmosphere. Different materials have widely different embodied energy. The embodied energy of timber products is much lower than that of many other materials.
Embodied energy in new materials
120
150
180
90
30
60
0
Alu
min
ium
Plas
tic
Stee
l
Med
ium
den
sity
fibre
boar
d
Part
icle
boar
d
Saw
n so
ftw
ood
Saw
n ha
rdw
ood
Meg
ajou
les
per
kilo
gram
Source: Taylor, J and Van Langenberg, K 2004, Review of the environmental impact of wood compared with alternative products used in the production of furniture, Forest and Wood Products Research and Development Corporation. Note: The value for plastic is for PVC (polyvinylchloride). The values for timber are for kiln dried timber.

41
Fire
The extent and intensity of forest fi res in Australia vary with latitude and season of rainfall. In northern Australia, where conditions are generally humid, low-intensity fi res often burn across large areas. Hot, dry and windy summers in south-eastern Australia often lead to intense bushfi res that are diffi cult to control. Those fi res can cause losses of human life and can destroy assets such as trees, livestock, buildings, fences, bridges and power lines. Bushfi res in southern Australia lead to soil erosion and degrade stream water quality. The resulting natural regrowth reduces water yields for decades.
Climate change could have serious implications for the frequency and severity of bushfi res in Australia. There is some evidence that the observed warming trend has already contributed to increased drought severity through higher evaporation and water demand. Native forests in many locations may become more susceptible to fi re.

42
Large fi res in southern Australia
Year LocationArea burnt*
(‘000 hectares)
1926 Victoria 394
1939 Victoria 1400
1943–44 Victoria 1100
1952 North-east Victoria >100
1961–62 Victoria >100
1965 Eastern Victoria 378
1969 Victoria >250
1983 Central and south-west Victoria 210
1993–94 Sydney–Blue Mountains, north coast NSW
>800
1995 South-east Queensland 333
1997–98 Hunter, Blue Mountains, Shoalhaven, NSW
>500
2001–02 Greater Sydney, NSW 744
2002–03 Eastern Highlands, Victoria 1100
2002–03 Brindabella Ranges–Canberra, NSW–ACT
157
2002–03 East coast–greater Sydney, NSW 1460
2002–03 Arthur–Pieman, Tasmania 100
Continued…

43
2005 Eyre Peninsula, South Australia 145
2006–07 Eastern Highlands, Victoria 1050
2009 Central–north-east Victoria 430
* Total area burnt, including vegetation types other than forests.Sources: Bartlett, T, Leonard, M and Morgan, G 2007, ‘The mega-fi re phenomenon: some Australian perspectives’, in The 2007 Institute of Foresters of Australia and New Zealand Institute of Forestry Conference Papers, Institute of Foresters of Australia, Canberra.Dexter, BD and Hodgson, A 2005, The facts behind the fi re – a scientifi c and technical review of the circumstances surrounding the 2003 Victorian bushfi re crisis, Forest Fire Victoria, Parkdale.
Year LocationArea burnt*
(‘000 hectares)
Adam Gerrand

44
Forest industries
The forestry and wood products industries contribute signifi cantly to the economic and social well-being of rural and regional Australia. The wood products industries have an annual turnover of about $23 billion. They contribute around 0.7% to Australia’s gross domestic product and 5.8% of total manufacturing industry income.
The total number of people employed in the forestry and wood products industries has been estimated based on an industry survey to be about 120 000. The number of people employed in the Australian Bureau of Statistics industry classifi cations ‘forestry’, and ‘wood, pulp and paper manufacturing’ for 2009 was 76 800. Those industry classifi cations cover a narrower range of activities than the industry survey.

45
Estimated employment in forest-growing and wood product industry sector, 2006
Sector No. of employees
Forest growing and management 7348
Timber harvesting and haulage 8973
Sawmilling and timber processing 19 081
Timber product manufacturing 37 800
Wood panel and board production 5635
Pulp and paper manufacturing 11 024
Timber merchandising 22 134
Support service internal to industry 5445
Support service external to industry 2745
Total 120 184
Source: based on ForestWorks Ltd data

46
Forest products
Australians consume around 23 million cubic metres (in log volume equivalent terms) of wood products each year. Most of the logs from which those products are made are grown in Australia. The volume of logs harvested has increased by about 35% in the past decade while consumption of wood products has increased by 21%. The increase in logs harvested is because plantations are reaching harvest age. Production of native forest logs has declined by 10% over the decade. The decrease is mainly because of transfer of forests to nature conservation reserves.
ForestrySA

47
Logs harvested (‘000 m3)
Source of logs 1998 2003 2008
10-year change
%
Native forests
Sawlogs and veneer logs 4151 3846 3176 –24
Pulpwood and other logs 6061 6772 5974 –1
Total 10 212 10 617 9150 –10
Hardwood plantations
Sawlogs and veneer logs 7 153 186 large*
Pulpwood and other logs 199 1441 4421 large*
Total 206 1594 4607 large*
Softwood plantations
Sawlogs and veneer logs 6265 8256 9227 47
Pulpwood and other logs 4475 5354 5477 22
Total 10 741 13 609 14 704 37
Total log harvest 21 159 25 820 28 461 35
* Large increase because of low base in 1998.Source: Australian forest and wood products statistics, ABARE

48
Production and consumption of wood products
1998 2003 2008 10-year change
%
Paper products production (thousand tonnes)
Newsprint 444 412 456 3
Printing and writing 424 564 706 67
Household and sanitary 191 194 186 –3
Packaging and industrial 1483 1892 1933 30
Total 2542 3062 3281 29
Paper products consumption (thousand tonnes)
Newsprint 718 682 679 –5
Printing and writing 1146 1337 1822 59
Household and sanitary 208 206 231 11
Packaging and industrial 1394 1561 1606 15
Total 3466 3786 4338 25
Sawn timber production (thousand cubic metres)
Softwood1 2338 3356 4263 82
Hardwood2 1513 1312 1108 –27
Total 3851 4668 5371 39
Continued…
49
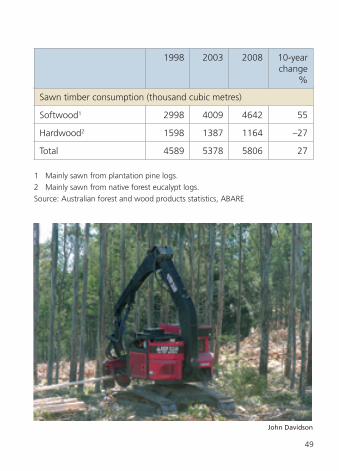
Sawn timber consumption (thousand cubic metres)
Softwood1 2998 4009 4642 55
Hardwood2 1598 1387 1164 –27
Total 4589 5378 5806 27
1 Mainly sawn from plantation pine logs.2 Mainly sawn from native forest eucalypt logs.Source: Australian forest and wood products statistics, ABARE
1998 2003 2008 10-year change
%
John Davidson
50
1999 2004 2009
10-year change
%
Veneer and panel production (thousand cubic metres)1
Veneers 3 3 116 large2
Plywood 169 146 118 –30
Particleboard 902 1048 911 1
Medium density fi breboard 495 795 632 28
Woodchip exports (bone dry tonnes)
Softwood 1033 1099 964 –7
Hardwood 2852 4165 4291 50
Total 3885 5264 5255 35
1 Laminated veneer lumber and hardboard cannot be reported because of confi dentiality restrictions.
2 The large increase is because structural veneer manufacturing commenced in Tasmania in 2008.
Source: Australian forest and wood products statistics, ABARE
➜ Did you know?For more than 50 years, Australians have consumed on average a little more than one cubic metre of log equivalent volume of wood products per person per year.

51
Wood products consumption
Most of Australia’s wood products are used in home building and other construction. From year to year consumption tends to be linked to rises and falls in building industry activity. Consumption per person fl uctuates around 1.05 cubic metres per year. Total national consumption has increased in parallel with population growth for many years.
Housing commencements and wood consumption in Australia
160
200
120
40
80
0
1.1
1.2
1.0
0.8
0.7
0.9
0.6
1994
1996
1998
2000
2002
2004
2006
2008
Hou
sing
com
men
cem
ents
(’00
0)C
onsumption
ConsumptionHousing commencements

52
The major categories of paper and paperboard are newsprint, printing and writing papers, household and sanitary papers and packaging and industrial papers. Australia’s consumption of paper and paperboard increased by about 25% in the ten years to 2009. The increase was mainly because of a 59% increase in consumption of printing and writing papers. Consumption of paper products far exceeds domestic production. The shortfall is made up by imports of about 1.8 million tonnes per year, 67% of which is printing and writing papers. Imported paper products cost nearly $2.3 billion and were 51% of total timber products imports in 2009.
Most hardwood sawn timber is used for fl ooring, decking, joinery, furniture and similar uses where particular appearances or colours are required or for engineering and architectural applications that need particular strength, hardness and durability. The consumption of sawn hardwood declined by about 27% in the ten years to 2008 to 1.2 million cubic metres. About 10% of the sawn hardwood used is imported.
Softwood sawn timber is mainly used as a structural component of house frames and other buildings. The consumption of sawn softwood increased by about 55% in the ten years to 2008 to about 4.6 million cubic metres. Australian production increased by 82% to 4.3 million cubic metres in that period.
Medium-density fi breboard and particleboard are mainly used for fl ooring and joinery (e.g. kitchen benches and cupboards) and together comprise over 80% of the timber-based panels produced in Australia. As for sawn timber, trends in
53
domestic consumption of these products follow trends in the building industry, in particular the rate of house construction. Consumption of particleboard nearly equals Australian production. About one-third of the medium density fi breboard manufactured in Australia is exported.
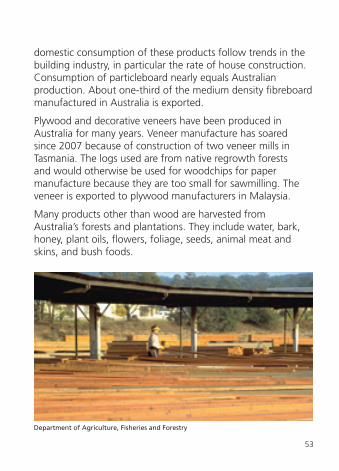
Plywood and decorative veneers have been produced in Australia for many years. Veneer manufacture has soared since 2007 because of construction of two veneer mills in Tasmania. The logs used are from native regrowth forests and would otherwise be used for woodchips for paper manufacture because they are too small for sawmilling. The veneer is exported to plywood manufacturers in Malaysia.
Many products other than wood are harvested from Australia’s forests and plantations. They include water, bark, honey, plant oils, fl owers, foliage, seeds, animal meat and skins, and bush foods.
Department of Agriculture, Fisheries and Forestry
54
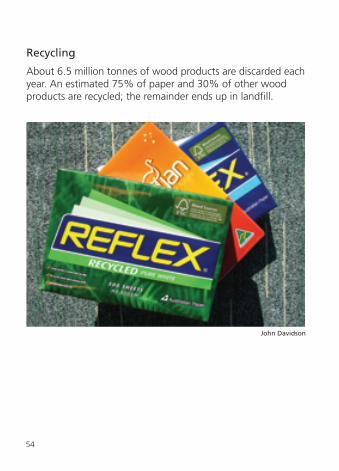
Recycling
About 6.5 million tonnes of wood products are discarded each year. An estimated 75% of paper and 30% of other wood products are recycled; the remainder ends up in landfi ll.
John Davidson
55
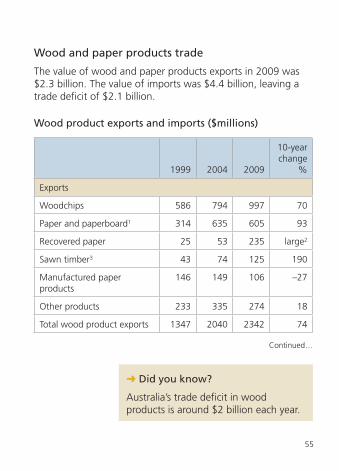
➜ Did you know?
Australia’s trade defi cit in wood products is around $2 billion each year.
Wood product exports and imports ($millions)
1999 2004 2009
10-year change
%
Exports
Woodchips 586 794 997 70
Paper and paperboard1 314 635 605 93
Recovered paper 25 53 235 large2
Sawn timber3 43 74 125 190
Manufactured paper products
146 149 106 –27
Other products 233 335 274 18
Total wood product exports 1347 2040 2342 74
Continued…
Wood and paper products trade
The value of wood and paper products exports in 2009 was $2.3 billion. The value of imports was $4.4 billion, leaving a trade defi cit of $2.1 billion.
56
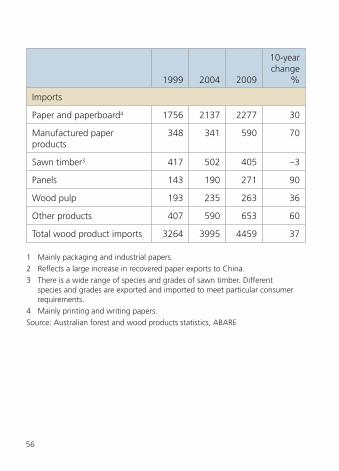
1999 2004 2009
10-year change
%
Imports
Paper and paperboard4 1756 2137 2277 30
Manufactured paper products
348 341 590 70
Sawn timber3 417 502 405 –3
Panels 143 190 271 90
Wood pulp 193 235 263 36
Other products 407 590 653 60
Total wood product imports 3264 3995 4459 37
1 Mainly packaging and industrial papers.2 Refl ects a large increase in recovered paper exports to China.3 There is a wide range of species and grades of sawn timber. Different
species and grades are exported and imported to meet particular consumer requirements.
4 Mainly printing and writing papers.Source: Australian forest and wood products statistics, ABARE

57
State and territory summaries

58
Australian Capital Territory
Area (‘000 hectares)
% Australian
Capital Territory
% of national
total
Land area 243 n.a. 0.03
Native forest 123 52 <1
Plantation forest 8 3 <1
Forest cover 131 56 <1
Australian Capital Territory forest area by tenure
Leasehold land 8
Multiple-use forest 0
Nature conservation reserve 108
Other crown land 7
Private land 0
Unresolved tenure 0
Area(’000 hectares)
Plantations – all tenures 8
6%6%5%
83%

59
Legend
Casuarina <1%
Eucalypt open 77%
Eucalypt woodland 17%
Plantation 6%
ACT forestry and wood products industries
The ACT forest industries have contracted substantially since 2003, when bushfi res destroyed two-thirds (10 500 hectares) of the territory’s softwood plantations. About 1563 people are employed in wood product manufacturing and marketing in the ACT.
Australian Capital Territory forests by type
➜ Did you know?Almost 88% of native forest in the ACT is in nature conservation reserves.

60
New South Wales
Area (‘000 hectares)
% New South
Wales
% of national
total
Land area 80 064 n.a. 10
Native forest 26 208 33 18
Plantation forest 383 <1 19
Forest cover 26 591 33 18
New South Wales forest area by tenure
Leasehold land 9891
Multiple-use forest 1980
Nature conservation reserve 5148
Other crown land 943
Private land 8076
Unresolved tenure 170
Plantations – all tenures 383
Area(’000 hectares)
37%
7%19%
4%
30%
1% 1.4%
61
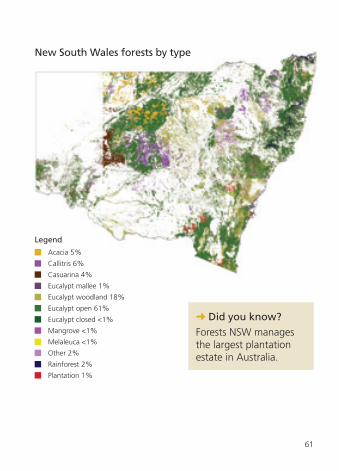
Legend
Acacia 5%
Callitris 6%
Casuarina 4%
Eucalypt mallee 1%
Eucalypt woodland 18%
Eucalypt open 61%
Eucalypt closed <1%
Mangrove <1%
Melaleuca <1%
Other 2%
Rainforest 2%
Plantation 1%
New South Wales forests by type
➜ Did you know?Forests NSW manages the largest plantation estate in Australia.

62
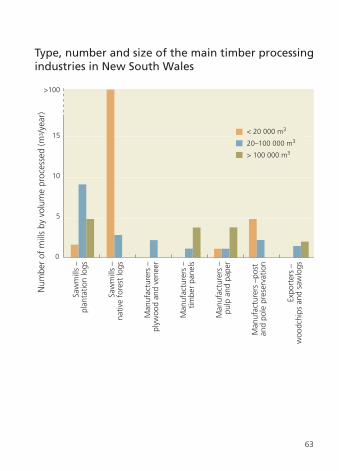
New South Wales forestry and wood products industries
Census data for 2006 show a total employment of 23 792 people in the forestry and wood products manufacturing sectors in New South Wales. When all businesses that depend on growing and using timber are included, total employment is estimated at about 38 000 people.
The forestry and wood products industries are a major part of several regional communities in New South Wales.
Mark Parsons
63
0
10
15
>100
5
Saw
mill
s –
plan
tatio
n lo
gs
Saw
mill
s –
nativ
e fo
rest
logs
Man
ufac
ture
rs –
plyw
ood
and
vene
er
Man
ufac
ture
rs –
timbe
r pa
nels
Man
ufac
ture
rs –
pulp
and
pap
er
Man
ufac
ture
rs –
post
an
d po
le p
rese
rvat
ion
Expo
rter
s –
woo
dchi
ps a
nd s
awlo
gs
Num
ber
of m
ills
by v
olum
e pr
oces
sed
(m3 /
year
)
< 20 000 m3
20–100 000 m3
> 100 000 m3
Type, number and size of the main timber processing industries in New South Wales
64
Northern Territory
Area (‘000 hectares)
% Northern Territory
% Australia
Land area 134 913 n.a. 18
Native forest 31 010 23 21
Plantation forest 32 <1 2
Forest cover 31 042 23 21
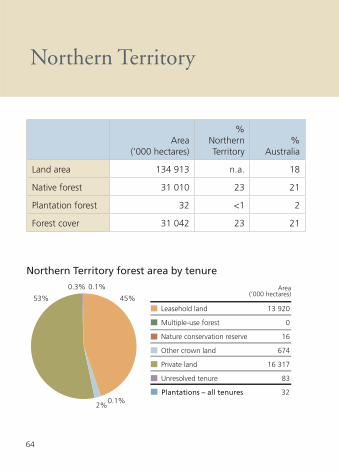
Northern Territory forest area by tenure
Leasehold land 13 920
Multiple-use forest 0
Nature conservation reserve 16
Other crown land 674
Private land 16 317
Unresolved tenure 83
Plantations – all tenures 32
Area(’000 hectares)
45%53%
0.3% 0.1%
0.1%2%

65
Northern Territory forests by type
Legend
Acacia 5%
Callitris 1%
Casuarina <1%
Eucalypt woodland 65%
Eucalypt open 20%
Eucalypt closed <1%
Mangrove 1%
Melaleuca 5%
Other 1%
Rainforest 1%
Plantation <1%

66
➜ Did you know?Kakadu National Park in the Northern Territory is the largest nature conservation reserve in Australia. At nearly 2 million hectares, it is almost a third the size of Tasmania.
Northern Territory forestry and forest products industries
The Northern Territory forest industry is largely based on hardwood plantations and the Indigenous arts and crafts industry which uses material from forests. A national survey identifi ed 339 people employed in the timber industry in the Northern Territory. This is likely to be an underestimate because in Indigenous communities the art and crafts industry can amount to more than 40% of a community’s cash income.

67
Queensland
Area (‘000 hectares)
% Queensland
% Australia
Land area 173 065 n.a. 23
Native forest 52 582 30 36
Plantation forest 256 <1 13
Forest cover 52 838 31 35
Queensland forest area by tenure
Leasehold land 34 304
Multiple-use forest 1991
Nature conservation reserve 4576
Other crown land 1598
Private land 8908
Unresolved tenure 1204
Plantations – all tenures 256
Area(’000 hectares)65%
4%
2% 0.5%17%
9%

68
Queensland forests by type
Legend
Acacia 11%
Callitris 1%
Casuarina <1%
Eucalypt mallee <1%
Eucalypt woodland 56%
Eucalypt open 13%
Eucalypt closed <1%
Mangrove 1%
Melaleuca 11%
Other 3%
Rainforest 4%
Plantation <1%
➜ Did you know?More than one third (42%) of Australia’s eucalypt woodland forests are in Queensland.

69
Queensland forestry and forest products industries
Census data for 2006 show a total employment of 14 825 people in the forestry and wood products manufacturing sectors in Queensland. When all businesses that depend on growing and using timber are included, total employment is estimated at nearly 20 000 people. Some results from a survey of individual businesses that use logs from pine plantations are summarised below. No data about the hardwood plantation and native forest-based timber industries in Queensland are available.
Mark Parsons

70
Soci
o-e
con
om
ic s
ign
ifi c
ance
of
Qu
een
slan
d’s
pin
e p
rod
uct
s in
du
stri
es
Soci
o-ec
onom
ic in
dica
tor
Saw
mill
sPa
nel
man
ufac
ture
rsO
ther
bu
sine
sses
Tota
l
Num
ber
of e
mpl
oyee
s84
777
513
117
54
Valu
e of
logs
use
d ($
mill
ion/
year
)11
539
2517
9
Wag
es p
aid
($m
illio
n/ye
ar)
2736
872
Con
trac
tor
paym
ents
($m
illio
n/ye
ar)
4323
2693
Valu
e of
sal
es ($
mill
ion/
year
)24
523
197
573
Sour
ce: M
BAC
Con
sulti
ng P
ty. L
td 2
005,
A s
ocio
-eco
nom
ic a
sses
smen
t of
the
pla
ntat
ion
proc
essi
ng s
ecto
r in
Q
ueen
slan
d, T
imbe
r Q
ueen
slan
d, B
risba
ne.

71
Type, number and size of the main timber processing industries in Queensland
0
10
15
>90
5
Saw
mill
s –
plan
tatio
n lo
gs
Saw
mill
s –
nativ
e fo
rest
logs
Man
ufac
ture
rs –
plyw
ood
and
vene
er
Man
ufac
ture
rs –
timbe
r pa
nels
Man
ufac
ture
rs –
pulp
and
pap
er
Man
ufac
ture
rs –
post
an
d po
le p
rese
rvat
ion
Expo
rter
s –
woo
dchi
ps a
nd s
awlo
gs
Num
ber
of m
ills
by v
olum
e pr
oces
sed
(m3 /
year
)
< 20 000 m3
20–100 000 m3
> 100 000 m3
72
South Australia
Area (‘000 hectares)
% South
Australia%
Australia
Land area 98 348 n.a. 13
Native forest 8855 9 6
Plantation forest 183 0.2 9
Forest cover 9038 9 6
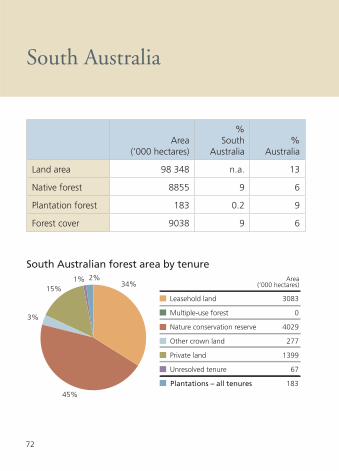
South Australian forest area by tenure
Leasehold land 3083
Multiple-use forest 0
Nature conservation reserve 4029
Other crown land 277
Private land 1399
Unresolved tenure 67
Plantations – all tenures 183
Area(’000 hectares)34%
45%
3%
15%1% 2%
73
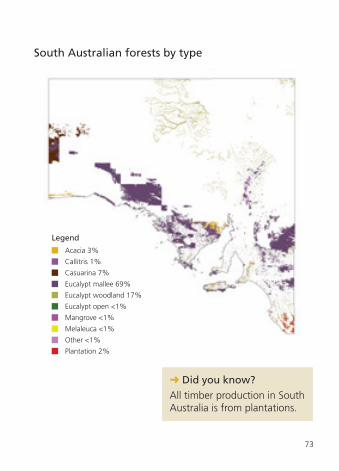
South Australian forests by type
➜ Did you know?All timber production in South Australia is from plantations.
Legend
Acacia 3%
Callitris 1%
Casuarina 7%
Eucalypt mallee 69%
Eucalypt woodland 17%
Eucalypt open <1%
Mangrove <1%
Melaleuca <1%
Other <1%
Plantation 2%

74
South Australian forestry and forest products industries
Census data for 2006 show a total employment of 7470 people in the forestry and wood products manufacturing sectors in South Australia. When all businesses that depend on growing and using timber are included, total employment is estimated at about 13 000 people.
South Australia’s forest industries are based solely on plantation timber growing and processing. Most of the plantations are located in the ‘Green Triangle’ region in the south–east of the state. Plantations in that region occupy about 14% of the region’s land area compared with about 72% used for agriculture. Data on socio-economic impacts are summarised in the following table.

75
Soci
o-e
con
om
ic s
ign
ifi c
ance
of
fore
stry
an
d w
oo
d p
rod
uct
s in
du
stri
es in
th
e G
reen
Tri
ang
le r
egio
n, S
ou
th A
ust
ralia
Soci
o-ec
onom
ic in
dica
tor
Con
trib
utio
n to
gro
ss
regi
onal
pro
duct
ion
($m
illio
n)Em
ploy
men
t(n
umbe
r of
jobs
)
Soci
o-ec
onom
ic im
pact
Dire
ct e
ffec
ts:
– Fo
rest
ry98
614
– W
ood
and
pape
r pr
oduc
ts
368
3052
Flow
-on
effe
cts
197
3416
Tota
l66
470
82
Prop
ortio
n of
tot
al p
rimar
y in
dust
ries
44%
35%
Prop
ortio
n of
tot
al r
egio
nal e
cono
my
27%
21%
Sour
ce: E
conS
earc
h Pt
y Lt
d 20
05, E
cono
mic
impa
ct o
f th
e tim
ber
indu
stry
in t
he G
reen
Tria
ngle
reg
ion,
G
reen
Tria
ngle
Reg
iona
l Pla
ntat
ion
Com
mitt
ee a
nd F
ores
tryS
A, M
t G
ambi
er.

76
Employment, south-eastern South Australia
Forestry and wood products industries
Other primary industries
Other sectors
21%
38%
41%
Land use, south-eastern South Australia*
Plantations
Agriculture
Forest and woodland
Other
14%
72%
11%3%
* For Millicent Coast catchment land area with above 600 mm average annual rainfall.

77
Type, number and size of the main timber processing industries in South Australia
0
4
6
8
2
Saw
mill
s –
plan
tatio
n lo
gs
Man
ufac
ture
rs –
lam
inat
ed v
enee
r lu
mbe
r
Man
ufac
ture
rs –
plyw
ood
and
vene
er
Man
ufac
ture
rs –
timbe
r pa
nels
Man
ufac
ture
rs –
pulp
and
pap
er
Man
ufac
ture
rs –
post
an
d po
le p
rese
rvat
ion
Num
ber
of m
ills
by v
olum
e pr
oces
sed
(m3 /
year
)
< 20 000 m3
20–100 000 m3
> 100 000 m3

78
Tasmania
Area (‘000 hectares)
% Tasmania
% Australia
Land area 6840 n.a. 1
Native forest 3116 46 2
Plantation forest 309 4 15
Forest cover 3425 50 2
Tasmanian forest area by tenure
Leasehold land 0
Multiple-use forest 1026
Nature conservation reserve 1121
Other crown land 85
Private land 885
Unresolved tenure 0
Plantations – all tenures 309
Area(’000 hectares)
30%9%
26%
2%
33%

79
Tasmanian forests by type
➜ Did you know?Forty-seven per cent of Tasmania’s native forests are in conservation reserves.
Legend
Acacia 2%
Callitris <1%
Casuarina <1%
Eucalypt woodland 47%
Eucalypt open 24%
Melaleuca 1%
Rainforest 17%
Plantation 9%

80
Tasmanian forestry and forest products industries
Tasmania’s forestry and wood products industries employed an estimated total of 6300 people in 2006. After allowing for part-time employment, the total number of full-time equivalent jobs was 5870. This represented 3.08% of Tasmania’s employed labour force in August 2006. Because most forestry and forest products industries employment is regionally-based, employment in these industries exceeded 5% of total employment in 11 of the 23 Tasmanian local government areas. The proportions employed in different industry sectors are shown below.
Employment by forestry industry sectorProportion of total
employment (%)
Forest growers 11.7
Combined forest growers and log processors 10.9
Log processors 38.7
Contractors, service providers and nurseries 38.7
Total 100.0
Employment by forest sectorProportion of total
employment (%)
Native forest 68.3
Eucalypt plantation 7.7
Pine plantation 24.0
Total 100.0
Source: J Schirmer 2008, Forestry, jobs and spending: Forest industry employment and expenditure in Tasmania, 2005–2006, Cooperative Research Centre for Forestry, Tasmania, 2008.

81
Type, number and size of the main timber processing industries in Tasmania
0
20
>50
15
10
5
Saw
mill
s –
plan
tatio
n lo
gs
Saw
mill
s –
nativ
e fo
rest
logs
Man
ufac
ture
rs –
plyw
ood
and
vene
er
Man
ufac
ture
rs –
timbe
r pa
nels
Man
ufac
ture
rs –
pulp
and
pap
er
Man
ufac
ture
rs –
post
an
d po
le p
rese
rvat
ion
Expo
rter
s –
woo
dchi
ps a
nd s
awlo
gs
Num
ber
of m
ills
by v
olum
e pr
oces
sed
(m3 /
year
)
< 20 000 m3
20–100 000 m3
> 100 000 m3

82
Victoria
Area (‘000 hectares)
% Victoria
% Australia
Land area 22 742 n.a. 3
Native forest 7 837 34 5
Plantation forest 424 2 21
Forest cover 8261 36 6
Victorian forest area by tenure
Leasehold land 35
Multiple-use forest 3163
Nature conservation reserve 3505
Other crown land 109
Private land 1025
Unresolved tenure 0
Plantations – all tenures 424
Area(’000 hectares)
0.4%5%
12%
1%
42%
38%

83
Victorian forests by type
➜ Did you know?Victoria has one of the longest running forest monitoring and research programs in the world, underway in the mountain ash (Eucalyptus regnans) forests of the Central Highlands since 1983.
Legend
Acacia <1%
Callitris <1%
Casuarina 2%
Eucalypt mallee 18%
Eucalypt woodland 13%
Eucalypt open 54%
Eucalypt closed 3%
Mangrove <1%
Melaleuca <1%
Other 4%
Rainforest <1%
Plantation 5%

84
Victorian forestry and forest products industries
Census data for 2006 show a total employment of 21 941 people in the forestry and wood products manufacturing sectors in Victoria. When all businesses that depend on growing and using timber are included, total employment is estimated at about 32 000 people.
Victoria’s forest industries are based on plantation timber growing and processing in several regions and on native forest timber growing and processing, mainly in the Central Highlands region and in Gippsland. Data on socio-economic impacts in Gippsland are summarised below.
Mark Parsons

85
Soci
o-e
con
om
ic s
ign
ifi c
ance
of
Gip
psl
and
’s w
oo
d p
rod
uct
s in
du
stri
es1
Soci
o-ec
onom
ic in
dica
tor
Har
dwoo
d sa
wm
ills
Soft
woo
d sa
wm
ills
Pulp
and
pa
per
mill
sTo
tal 2
Valu
e of
logs
use
d ($
mill
ion/
year
)55
.230
.673
.016
1.4
Wag
es p
aid
($m
illio
n/ye
ar)
41.4
15.2
92.6
151.
3
Paym
ents
to
loca
l sup
plie
rs
($m
illio
n/ye
ar)
21.1
5.0
68.0
94.5
Oth
er p
aym
ents
($m
illio
n/ye
ar)
31.7
34.4
404.
547
6.8
Tota
l val
ue o
f pr
oduc
tion
($m
illio
n/ye
ar)
149.
485
.363
8.1
884.
0
1 Th
e va
lues
sho
wn
are
for
prim
ary
proc
essi
ng. T
he a
nnua
l val
ue o
f pr
oduc
tion
of p
roce
ssin
g lo
gs a
nd c
hips
ex
port
ed f
rom
the
reg
ion
was
est
imat
ed a
t an
add
ition
al $
315
mill
ion.
2 To
tals
incl
ude
othe
r w
ood
prod
ucts
indu
strie
s.
86
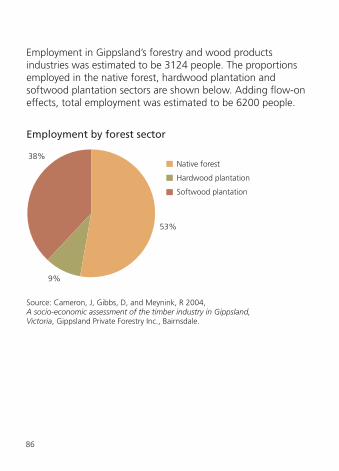
Employment in Gippsland’s forestry and wood products industries was estimated to be 3124 people. The proportions employed in the native forest, hardwood plantation and softwood plantation sectors are shown below. Adding fl ow-on effects, total employment was estimated to be 6200 people.
Employment by forest sector
Native forest
Hardwood plantation
Softwood plantation
53%
9%
38%
Source: Cameron, J, Gibbs, D, and Meynink, R 2004, A socio-economic assessment of the timber industry in Gippsland, Victoria, Gippsland Private Forestry Inc., Bairnsdale.

87
Type, number, and size of the main wood processing industries in Victoria
0
20
>30
15
10
5
Saw
mill
s –
plan
tatio
n lo
gs
Saw
mill
s –
nativ
e fo
rest
logs
Man
ufac
ture
rs –
plyw
ood
and
vene
er
Man
ufac
ture
rs –
timbe
r pa
nels
Man
ufac
ture
rs –
pulp
and
pap
er
Man
ufac
ture
rs –
pos
t an
d po
le p
rese
rvat
ion
Expo
rter
s –
woo
dchi
ps a
nd s
awlo
gs
Num
ber
of m
ills
by v
olum
e pr
oces
sed
(m3 /
year
)
< 20 000 m3
20–100 000 m3
> 100 000 m3

88
Western Australia
Area (‘000 hectares)
% WesternAustralia
% Australia
Land area 252 988 n.a. 33
Native forest 17 664 7 12
Plantation forest 425 <1 21
Forest cover 18 089 7 12
Western Australian forest area by tenure
Leasehold land 3891
Multiple-use forest 1248
Nature conservation reserve 3868
Other crown land 7169
Private land 1489
Unresolved tenure 0
Plantations – all tenures 425
Area(’000 hectares)22%
7%
21%40%
8%2%

89
Western Australian forests by type
➜ Did you know?All of Western Australia’s old-growth forests are in nature conservation reserves.
Legend
Acacia 6%
Callitris <1%
Casuarina <1%
Eucalypt mallee 7%
Eucalypt woodland 62%
Eucalypt open 13%
Eucalypt closed <1%
Mangrove 1%
Melaleuca <1%
Other 8%
Rainforest <1%
Plantation 2%

90
Western Australian forestry and forest products industries
Western Australia’s forestry and wood products industries employed an estimated total of 5570 people in 2006. After allowing for part–time employment, the total number of full–time equivalent jobs was 5090. The industries are concentrated in the Perth, Bunbury, Albany, Manjimup and Dardanup areas. The proportions employed in different industry sectors are shown in the following tables.
Department of Agriculture, Fisheries and Forestry

91
Employment by forestry industry sectorProportion of total
employment (%)
Forest growers 3.1
Combined forest growers and log processors 3.9
Log processors 62.7
Contractors, service providers and nurseries 30.3
Total 100.0
Employment by forest sectorProportion of total
employment (%)
Native forest 47–54
Eucalypt plantation 19–23
Pine plantation 24–28
Other plantation unspecifi ed 1–3
Source: Schirmer, J 2008, Forestry, jobs and spending: forest industry employment and expenditure in Western Australia, 2005–06, Cooperative Research Centre for Forestry, Hobart.

92
Forest industries as a percentage of total local government area employment
0
14
16
18
20
12
10
8
6
4
2
Nan
nup
Man
jimup
Plan
tage
net,
Den
mar
k
Brid
geto
wn-
Gre
enbu
shes
Dar
danu
p,D
onny
broo
k-Ba
lingu
p
Alb
any
Har
vey
Bunb
ury
Col
lie
%
The local government areas where the largest proportions of the workforce are directly dependent on the forestry and wood products industries are shown on the following graph. Forest industry employment is less than 3% of total employment in all other local government areas in Western Australia.
Source: Schirmer, J 2008, Forestry, jobs and spending: forest industry employment and expenditure in Western Australia, 2005–06, Cooperative Research Centre for Forestry, Hobart.

93
Type, number and size of the main timber processing industries in Western Australia
0
10
15
5
Saw
mill
s –
plan
tatio
n lo
gs
Saw
mill
s –
nativ
e fo
rest
logs
Man
ufac
ture
rs –
nate
d ve
neer
lum
ber
Man
ufac
ture
rs –
timbe
r pa
nels
anuf
actu
rers
– p
ost
nd p
ole
pres
erva
tion
Num
ber
of m
ills
by v
olum
e pr
oces
sed
(m3 /
year
)
Man
ufac
ture
rs –
Fu
el p
elle
ts
Expo
rter
s –
odch
ips
and
saw
logs
< 20 000 m3
20–100 000 m3
> 100 000 m3
>20

94
National Forest Inventory and National Plantation Inventory
Since 1990, the National Forest Inventory (NFI) has been collecting and communicating information on Australia’s forests. Its mission is to be the authoritative source of information for national and regional monitoring and reporting and to support decision-making on all of Australia’s forests.
State, territory and private forest owners and managers collect data that the NFI collates and translates into national datasets and maps, such as those used in Australia’s state of the forests reports and in this booklet. Most inventory and monitoring activities in native forests have focused on areas managed for wood production. Large gaps in forest information remain in the cases of privately managed forests and in forest areas managed for non-wood goods and environmental services.
The National Plantation Inventory (NPI) has been collecting data and reporting on Australia’s forestry plantations since 1993. Its objective is to document the contributions tree plantations make to communities, the economy, the environment and the plantation resources in each region around the country. Comprehensive map-based reports are published about every fi ve years and update reports are provided in other years.
Information sources
95
Australian forest and wood products statistics
The Australian Bureau of Agricultural and Resource Economics (ABARE) compiles and publishes quarterly forest and wood products statistics derived from a range of sources. Production data are from ABARE and the Australian Bureau of Statistics (ABS) surveys and datasets, state forest services and industry organisations. Data on imports and exports are from the Australian Bureau of Statistics.

96
ABARE 2009, Australian forest and wood products statistics, March and June quarters 2009, Australian Bureau of Agricultural and Resource Economics, Canberra.
BRS 2008, State of Australia’s forests, fact sheet series of eight titles: Type and extent, Carbon, Certifi cation, Conservation, Employment, Fire, Sustainable yield and Water. Bureau of Rural Sciences, Canberra.
BRS 2008 Australian forest profi les. Information sheet series of eight titles: Acacia, Callitris, Casuarina, Eucalypts, Mangroves, Melaleuca, Rainforest and Plantations; plus a poster: Australia’s forests. Bureau of Rural Sciences, Canberra.
Davidson J, Davey S, Singh S, Parsons M, Stokes B and Gerrand A 2008, The Changing Face of Australia’s Forests – A summary of major changes in Australia’s forests since 1992, Bureau of Rural Sciences, Canberra.
Gavran M and Parsons M, 2010, National Plantation Inventory 2010 Update, National Forest Inventory, Bureau of Rural Sciences, Canberra.
Montreal Process Implementation Group for Australia 2008, Australia’s State of the Forests Report 2008, Bureau of Rural Sciences, Canberra.
Russell-Smith J, Yates C, Whitehead P, Smith R, Craig R, Allan G, Thackway R, Frakes I, Cridland S, Meyer M and Gill A, 2007, ‘Bushfi res ‘down under’: patterns and implications of contemporary Australian landscape burning’, in International Journal of Wildland Fire vol.16, p.361–377.
References and further reading
Copies of this publication are available from
BRS Publication SalesGPO Box 858, Canberra ACT 2601Ph 1800 020 157Fax 02 6272 4747Email [email protected] www .brs.gov.au
www.daff.gov.au/forestsaustralia