australia’s mobile decade - mobilemuster · to considering how to overcome hoarding behaviours...
TRANSCRIPT
AUSTRALIA’S MOBILE DECADE
Managed by the Australian Mobile Telecommunications Association
10 YEARS OF CONSUMER INSIGHTS INTO MOBILE USE AND RECYCLING:2005-2015

Mobile phones are enabling in so many ways, and yet as one of the symbolic products of 21st century life, they also personally connect us to the challenges for people and planet which are presented by our consumption and use of technology.
This can range from the individual need for digital down-time, to the challenge of poor labour and environmental practices along the supply chain, to the need to overcome both resource scarcity and growing rates of e-waste generation.
Effective product stewardship is an essential part of transitioning ourselves as consumers, and collectively as a society, to sustainable patterns of consumption and production. As a voluntary, not-for-profit industry initiative, MobileMuster is to be commended in this regard on a decade of leadership in product stewardship.
The importance of responsible consumption and production has been recently highlighted through its inclusion as one of the seventeen United Nation’s Sustainable Development Goals. Responsible consumption and production, and indeed responsible prosperity more generally, involves not only technical and policy innovation, but also deeper insights into consumer behaviour. This spans patterns of ownership, awareness of how to recycle, to considering how to overcome hoarding behaviours which lock-up valuable resources by storing mobiles in bottom drawers instead of recycling.
Ten years of research and consumer education by AMTA presented in this report, provides a unique body of knowledge that can inform and lead the ongoing evolution of stewardship for mobile telecommunications. Customers, industry, research and government must work together to move beyond the ‘buy and throw’ mentality to foster a circular economy philosophy of take-make-recreate.
Managing mobile phones is complex and dynamic. It’s set to become an even more exciting field as the digital economy continues to enable and disrupt. This is precisely why the reflective and transparent approach in this report is so valuable for future policy, program management and sectoral innovation.
The carriers and handset manufacturers participating in MobileMuster have invested wisely in the creation of an impressive take-back and recycling program – I commend this report to you and trust it strengthens momentum in pursuing both recycle-ready product designs and business models which showcase opportunities for Australian leadership in the circular economy.
Associate Professor Damien Giurco Research Director UTS Institute for Sustainable Futures Leader, Wealth from Waste Cluster
FOREWORD
Over the past decades, mobiles and smart phones have evolved to become a ubiquitous part of modern life; helping us speak to each other, find our way, access and share images and information for both work and leisure.
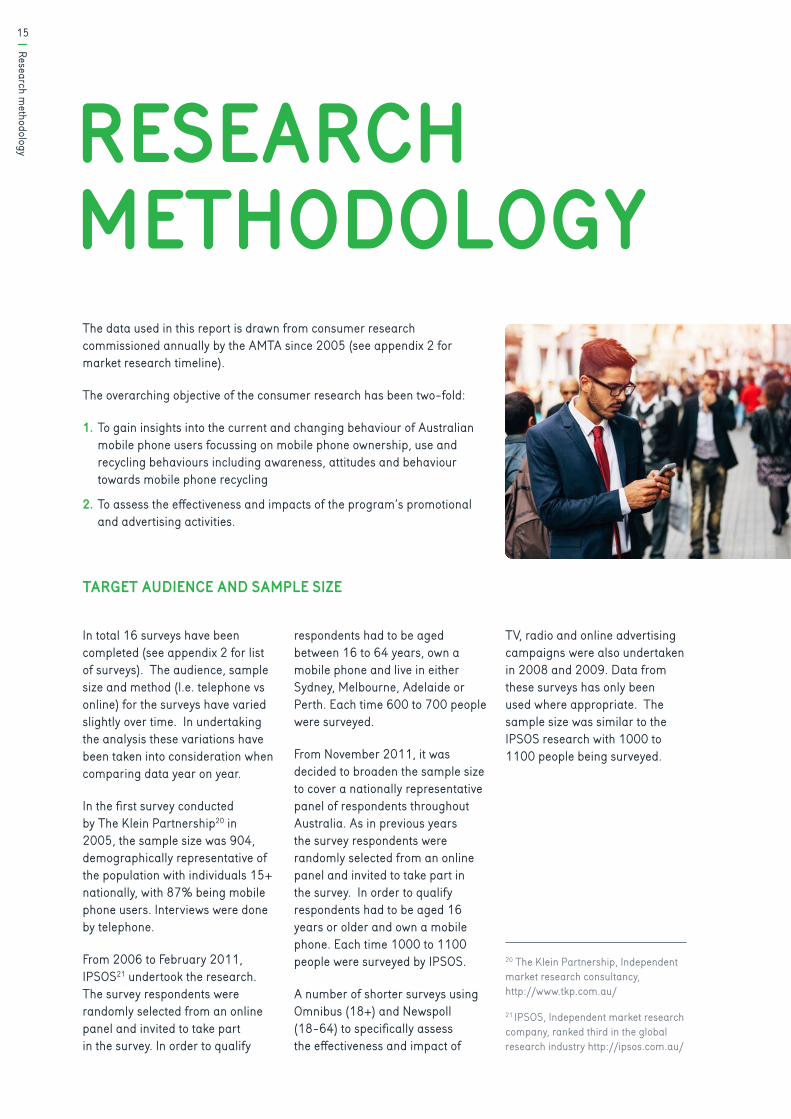
For the last 10 years the Australian Mobile Telecommunications Association (AMTA) has commissioned annual market research1 into how Australian consumers use and dispose of their mobile phones and why they do or don’t recycle. The research has provided critical intelligence in shaping, directing and monitoring the performance of the industry’s recycling program – MobileMuster.
Established voluntarily in 1998 by the AMTA and its members, the Mobile Phone Industry Recycling Program (MPIRP) now known as MobileMuster, aims to keep old mobiles out of landfill and ensure that all components including accessories are recycled to the highest environmental standards.
In the world of product stewardship MobileMuster is a unique program. Unlike many schemes across the globe it is not governed by regulation or enforced by mandatory laws. It is a voluntary initiative of manufacturers and carriers who have chosen to work together. In May 2014 MobileMuster was accredited as the first voluntary product stewardship scheme under the Federal Government’s Product Stewardship Act 2011.
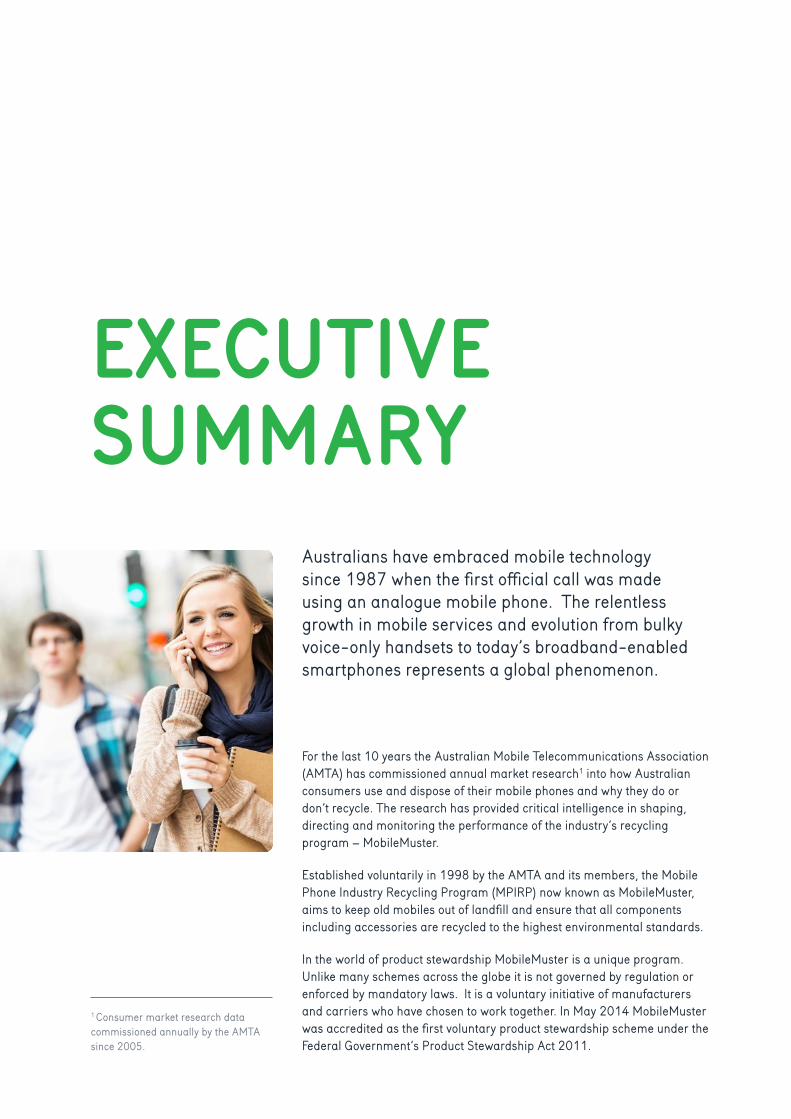
Australians have embraced mobile technology since 1987 when the first official call was made using an analogue mobile phone. The relentless growth in mobile services and evolution from bulky voice-only handsets to today’s broadband-enabled smartphones represents a global phenomenon.
EXECUTIVE SUMMARY
1 Consumer market research data commissioned annually by the AMTA since 2005.

Poor functional performance2 has been the primary reason for replacing a phone for many years. However, when there is a significant change or improvement in technology, as in the case of the smartphone, a very strong desire for the latest technology becomes the overwhelming driver for consumers. This has been the case in Australia from 2010 to 2014 with the release of the iPhone 4 in July 2010 where imports peaked at 13.3 million in 2010/11.
As the rate of technology change slows however, so do consumers reasons for replacing their phone. Seeking the latest technology is now no longer the primary reason for buying a new phone. Similarly more people are starting to keep their current phone for two or more years.
In terms of what people do with their old phones, there have been some significant shifts in behaviour over the past ten years. More people are aware of how, why and where to recycle with awareness of mobile phone recycling growing from 46% to 78% peaking at 84% in 2011. More people are recycling with collections increasing from 42 tonne per annum to 74 tonne in 2014-15, peaking at 122 tonne in 2008/09 and the annual available collection rate growing from 14.1% to 53.1% peaking at 53.2% in 2012-13.
Less people are disposing of their phones into landfill, decreasing from 9% to 2%.
Similarly, with the recent growth of online cash for phone and trade-in programs, more people are selling or trading in their phones as a way of recovering some financial return, up to 6%.
Consumer desire however, to keep old phones remains unchanged (60% even if not working). As a result the number of unused phones stored away in homes has grown from 12 million to over 22.5 million in the past decade.
This equates to nearly one phone for every person in Australia.
For many people the reason for keeping old phones has been a perceived need to keep a backup for possible future use. But with the advent of the smartphone more people are citing having personal information on a phone and data security concerns, as their reason for keeping their phone. This pattern of behaviour also reflects the vast amount of information that can now be stored on phones. This hoarding mentality is a worldwide phenomenon and typically very common. An estimated 125 million phones languish unused in the UK alone.3
This trend clearly sends an important message to manufacturers, retailers, resellers and recyclers about the growing need to help consumers manage their data safely and securely. If not effectively addressed, the issue of data security could become a significant barrier to increased levels of reuse and recycling of mobile phones into the future.
Storing of phones represents a significant loss of resources, creating an unsustainable balance between the rate of consumption and the rate of reuse and recycling, with substantially more mobiles sitting dormant in homes rather than being reused or responsibly recycled.
2 Phone deteriorating/not working
3 Green Alliance (2015) A circular economy for smart devices. Opportunities in the US, UK and India
More people are aware of how, why and where to recycle with awareness of mobile phone recycling growing from 46% to 79%
Financial incentives, awareness and access continue to be the three main drivers which encourage people to recycle, with personal financial rewards continuing to be the primary motivation. While MobileMuster has raised awareness and made recycling widespread and very accessible, altruistic incentives appear to be becoming less of a driver in recent years as a way of encouraging people to recycle their old phones.
The Starship Foundation in New Zealand recently decided collecting and reselling phones was no longer an effective fundraiser as more people are holding onto their smartphones for longer, selling them or passing them on to family and friends. This demonstrates the supply and value of phones received by the Foundation to resell and raise funds has diminished over time.4
Effective advertising and promotions has a direct impact on awareness and engagement of consumers, and if promotions are not maintained to a certain level, awareness will reduce and collection rates will drop. This is especially the case when people are purchasing a new phone, as this was the most common event or catalyst that prompted consumers to recycle. As a result it is vital that retailers and manufacturers consistently remind customers around the time of purchase as to the why, where and how they can recycle or reuse their old phones in order to maximise collection and recycling rates of unwanted or redundant phones.
Access to nearby drop-off locations (i.e. proximity), and in particular high levels of convenience is also an important factor, with most people saying they would likely recycle at the local supermarket and Australia Post stores in addition to mobile phone retailers. However, having collection points in these locations can be very challenging. Currently Australia Post only distributes MobileMuster recycling satchels.
Collecting phones at local council drop off days or with TVs and computers is least preferred. The possibility however of recycling mobile phones along with batteries, globes or other small electronics, as in the case of the City of Sydney offering integrated collection units located in libraries, does improve convenience and reflects a community-friendly approach to maximising collection opportunities.
Technological developments have had both positive and negative impacts on mobile phone recycling in Australia. They have driven rapid consumption of resources as functionality is enhanced (e.g. introduction of the smartphone) and made past technology redundant as networks are upgraded (e.g. CDMA). They have also improved resource efficiency through miniaturisation, dematerialisation and use of recycled content. Advances in product design and production methods have also reduced specific types of environmental impacts through the elimination or minimisation of hazardous substances. The avoidance of conflict minerals has also been a noteworthy achievement.
The research data also points towards several implications and opportunities for the future of mobile phone stewardship in Australia.
4 https://www.starship.org.nz/foundation/fundraising/mobile-phone-appeal/
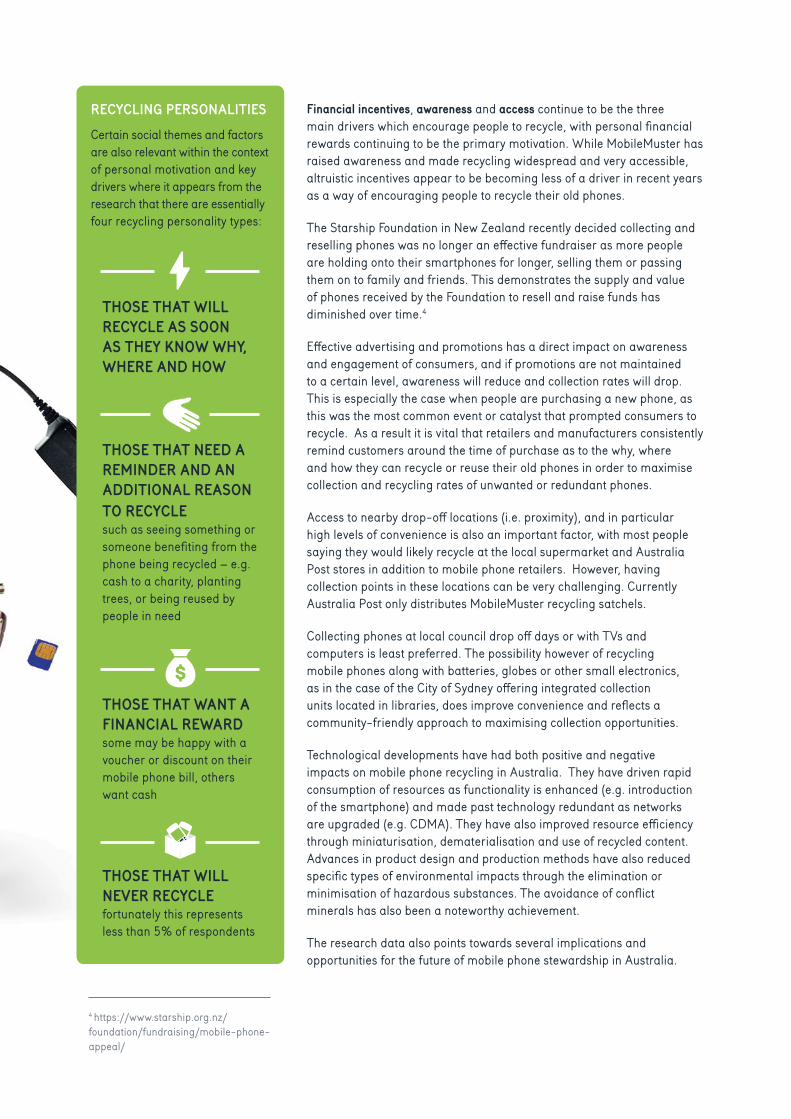
RECYCLING PERSONALITIESCertain social themes and factors are also relevant within the context of personal motivation and key drivers where it appears from the research that there are essentially four recycling personality types:
THOSE THAT WILL RECYCLE AS SOON AS THEY KNOW WHY, WHERE AND HOW
THOSE THAT NEED A REMINDER AND AN ADDITIONAL REASON TO RECYCLE such as seeing something or someone benefiting from the phone being recycled – e.g. cash to a charity, planting trees, or being reused by people in need
THOSE THAT WANT A FINANCIAL REWARD some may be happy with a voucher or discount on their mobile phone bill, others want cash
THOSE THAT WILL NEVER RECYCLE fortunately this represents less than 5% of respondents
The storage of old mobile phones is still a significant issue, representing a lost opportunity for reuse and recycling. There are compelling reasons for industry to look more closely at how it can change or adjust consumer desire to keep a phone as a back-up by:
• Improving the product’s durability and upgradability• Streamlining repair and replacement of damaged phones• Making data management and security a simple yet robust process• Offering innovative and attractive contracts that encourage the return of mobiles
(i.e. 1 in 1 out, trade-in, leasing, product-service ownership initiatives)• Explore novel ways to fund the collection and recycling of phones (e.g. a
consumer levy on the sale of each handset to fund financial incentives).
The potential for significant environmental advances across the mobile phone life cycle will start to emerge when greater focus is applied to monetising functionality and ‘service’ as opposed to just purchasing a manufactured item.
Continuing research to monitor changes in consumer mobile phone use, recycling, storage, reuse and the extent of phones available for recycling. The market research to date has been a particularly useful tool in guiding the program’s marketing activities and the development of its collection network. It has also provided deeper insights into the triggers and motivations behind Australian consumers, and why they choose to participate in recycling programs.
This will ensure that the program adapts to ever-changing use and disposal patterns as well as the need to accurately monitor the effectiveness of program activities on consumer behaviour and the associated impacts of technology and markets.
The potential for significant environmental advances across the mobile phone life cycle will start to emerge when greater focus is applied to monetising functionality and ‘service’ as opposed to just purchasing a manufactured item.
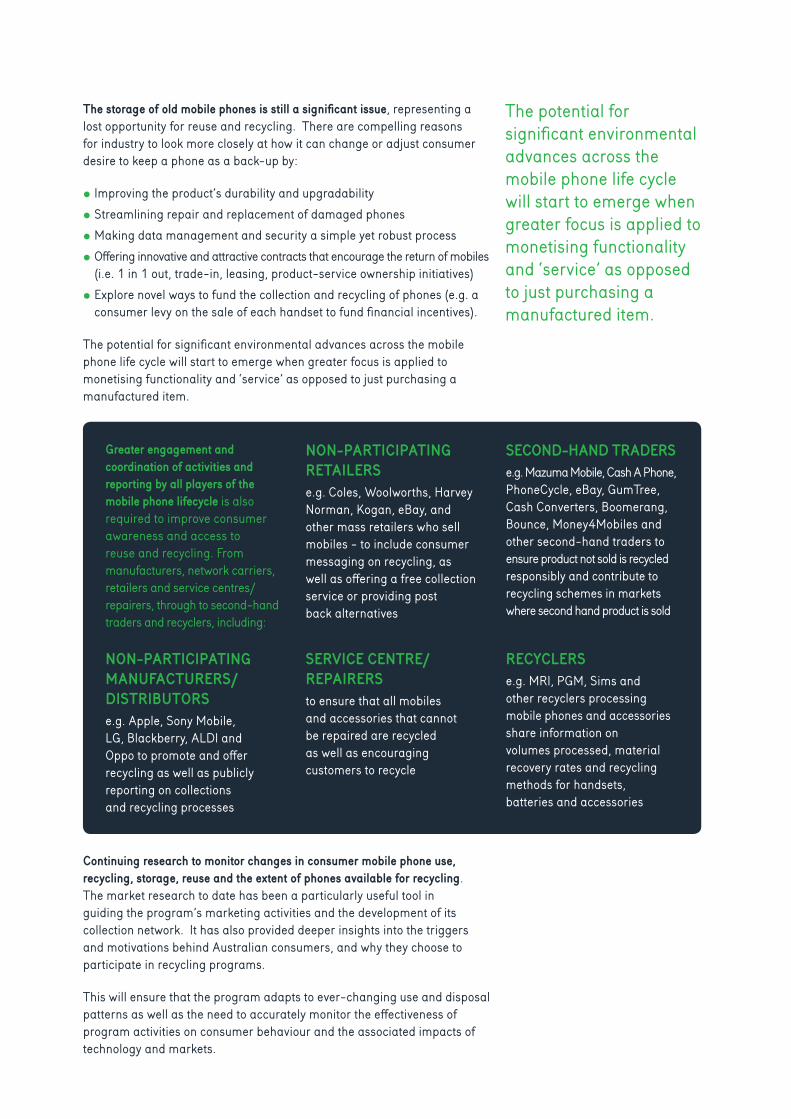
NON-PARTICIPATING MANUFACTURERS/DISTRIBUTORSe.g. Apple, Sony Mobile, LG, Blackberry, ALDI and Oppo to promote and offer recycling as well as publicly reporting on collections and recycling processes
SECOND-HAND TRADERSe.g. Mazuma Mobile, Cash A Phone, PhoneCycle, eBay, GumTree, Cash Converters, Boomerang, Bounce, Money4Mobiles and other second-hand traders to ensure product not sold is recycled responsibly and contribute to recycling schemes in markets where second hand product is sold
NON-PARTICIPATING RETAILERSe.g. Coles, Woolworths, Harvey Norman, Kogan, eBay, and other mass retailers who sell mobiles - to include consumer messaging on recycling, as well as offering a free collection service or providing post back alternatives
RECYCLERSe.g. MRI, PGM, Sims and other recyclers processing mobile phones and accessories share information on volumes processed, material recovery rates and recycling methods for handsets, batteries and accessories
SERVICE CENTRE/REPAIRERSto ensure that all mobiles and accessories that cannot be repaired are recycled as well as encouraging customers to recycle
Greater engagement and coordination of activities and reporting by all players of the mobile phone lifecycle is also required to improve consumer awareness and access to reuse and recycling. From manufacturers, network carriers, retailers and service centres/repairers, through to second-hand traders and recyclers, including:

TABLE OF CONTENTS
PagePage
INTRODUCTION 07
THE EVOLUTION OF PRODUCT STEWARDSHIP 08
AUSTRALIA’S MOBILE PHONE INDUSTRY’S RECYCLING PROGRAM - A SHORT HISTORY 09
THE MOBILE PHONE MARKET 2005 TO 2015 13 Imports and exports 13 Mobile phone subscriptions and technology 14
RESEARCH METHODOLOGY 15
MARKET RESEARCH RESULTS 16 Current phone ownership and use patterns 16What happens to old phones and why? 22
Encouraging people to recycle 33
Collections 39
DISCUSSION 42
CONCLUSION 48
REFERENCES 51
APPENDICES 52

7
Introduction
The research has provided critical intelligence in shaping and directing the industry recycling program; MobileMuster. In particular, how the program can increase consumer awareness and engagement through improved knowledge, access and incentives with the ultimate goal of increasing collections and keeping old mobiles out of landfill.
Compiling 10 years of market research into one report enables the telecommunications, waste and recycling industries, and other relevant stakeholders, to:
• Review what changes have occurred over time and how effective the program has been in driving change in consumer recycling behaviour
• Assess the impact of evolving mobile technology and markets on recycling behaviour, and
• Consider what this means for the future of mobile phone stewardship in Australia over the next 10 years.
In the world of product stewardship MobileMuster is a unique program.
Unlike many schemes across the globe it is not governed by regulation or enforced by mandatory laws. It is a voluntary initiative of manufacturers and carriers who have chosen to work together.
The program also takes a shared approach to product stewardship where manufacturers and carriers share the responsibility for the product. Many other schemes around the world see the responsibility rest primarily with the manufacturer or producer of the goods.
By publishing these results the industry hopes that the insights from the past 10 years will contribute to the ongoing development of product stewardship policy internationally.
INTRODUCTION
For the last 10 years the Australian Mobile Telecommunications Association (AMTA) has been researching how Australian consumers use and dispose of their mobile phones and why they do or don’t recycle.
8The evolution of product stewardship
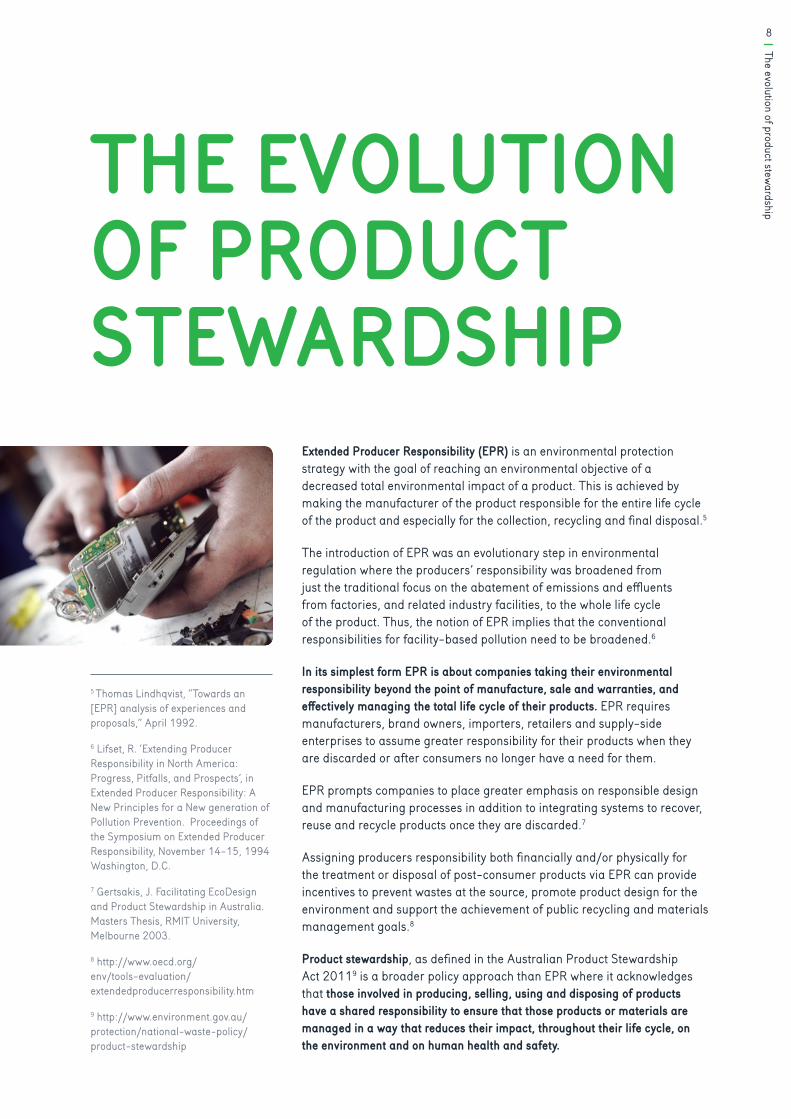
Extended Producer Responsibility (EPR) is an environmental protection strategy with the goal of reaching an environmental objective of a decreased total environmental impact of a product. This is achieved by making the manufacturer of the product responsible for the entire life cycle of the product and especially for the collection, recycling and final disposal.5
The introduction of EPR was an evolutionary step in environmental regulation where the producers’ responsibility was broadened from just the traditional focus on the abatement of emissions and effluents from factories, and related industry facilities, to the whole life cycle of the product. Thus, the notion of EPR implies that the conventional responsibilities for facility-based pollution need to be broadened.6
In its simplest form EPR is about companies taking their environmental responsibility beyond the point of manufacture, sale and warranties, and effectively managing the total life cycle of their products. EPR requires manufacturers, brand owners, importers, retailers and supply-side enterprises to assume greater responsibility for their products when they are discarded or after consumers no longer have a need for them.
EPR prompts companies to place greater emphasis on responsible design and manufacturing processes in addition to integrating systems to recover, reuse and recycle products once they are discarded.7
Assigning producers responsibility both financially and/or physically for the treatment or disposal of post-consumer products via EPR can provide incentives to prevent wastes at the source, promote product design for the environment and support the achievement of public recycling and materials management goals.8
Product stewardship, as defined in the Australian Product Stewardship Act 20119 is a broader policy approach than EPR where it acknowledges that those involved in producing, selling, using and disposing of products have a shared responsibility to ensure that those products or materials are managed in a way that reduces their impact, throughout their life cycle, on the environment and on human health and safety.
THE EVOLUTION OF PRODUCT STEWARDSHIP
5 Thomas Lindhqvist, “Towards an [EPR] analysis of experiences and proposals,” April 1992.
6 Lifset, R. ‘Extending Producer Responsibility in North America: Progress, Pitfalls, and Prospects’, in Extended Producer Responsibility: A New Principles for a New generation of Pollution Prevention. Proceedings of the Symposium on Extended Producer Responsibility, November 14-15, 1994 Washington, D.C.
7 Gertsakis, J. Facilitating EcoDesign and Product Stewardship in Australia. Masters Thesis, RMIT University, Melbourne 2003.
8 http://www.oecd.org/env/tools-evaluation/extendedproducerresponsibility.htm
9 http://www.environment.gov.au/protection/national-waste-policy/product-stewardship
9
Australia’s mobile industry’s recycling program
: A short history
AUSTRALIA’S MOBILE INDUSTRY’S RECYCLING PROGRAM: A SHORT HISTORYIn late 1998 the Australian Mobile Telecommunications Association (AMTA) voluntarily initiated its Mobile Phone Industry Recycling Program (MPIRP) in response to the need to keep potentially hazardous mobile phone nickel cadmium batteries out of landfill. Like most product stewardship schemes across the world, the need to reduce hazardous waste was a key driver for its creation.
Current members of MobileMuster:

10Australia’s m
obile industry’s recycling program: A short history
At that time most phones came with two nickel cadmium10 batteries. Mobile phone imports for 1998 were approximately 4 million and growing at an average rate of 15% per annum. There were approximately 6 million mobile subscribers and the CDMA network11 was about to be rolled out meaning this would increase further (Figure 2, page 14).
The founding members of the program were Telstra, Nokia and Motorola. The program was initially funded solely by manufacturers who each paid a levy on the number of handsets they imported into the market. In 2005 funding arrangements were reviewed and a new funding model was established with both manufacturers and network carriers contributing to the program based on their market shares.
Membership of the program has grown and changed over time as has its consumer brand from Phones4Ark in 2001 to MobileMuster since 2005. The program is currently funded by handset manufacturers Microsoft, Samsung, HTC, ZTE, Huawei, Alcatel One Touch, aftermarket battery supplier Force Technology and network carriers Telstra, Optus, Vodafone and Virgin Mobile. Each member contributes to the program by paying a levy ($0.30AUD for manufacturers and $0.12AUD for network carriers) on the number of handsets that are imported into the country by members.
10 Cadmium is a hazardous material that can be harmful to the environment and human health if not handled properly. Nickel cadmium batteries are very recyclable under controlled conditions where both the nickel and cadmium can be recovered separately in a closed system and then reused as raw materials for more batteries, stainless steel.
11 CDMA (Code-Division Multiple Access) refers to any of several protocols used in second-generation (2G) and third-generation (3G) wireless communications. As the term implies, CDMA is a form of multiplexing, which allows numerous signals to occupy a single transmission channel, optimising the use of available bandwidth. The technology is used in ultra-high-frequency (UHF) cellular telephone systems in the 800-MHz and 1.9-GHz bands. http://searchtelecom.techtarget.com/definition/CDMA.
Past members of MobileMuster include:

11
Australia’s mobile industry’s recycling program
: A short history
With the rapid uptake of mobile phones by Australians from 1998 to 2004 (imports grew from 3.9m to 7.12m and subscribers grew from 7.57m to 16.48m – see figures 1 and 2),12 community and government concern about what was happening with all the old mobile phones and their batteries was growing raising a number of questions for the industry:
Were all these old mobiles going to landfill or being stored at homes? How often were people upgrading? Were they being exported for resale into developing countries? How many were being recycled? Should a deposit be put on handsets to ensure they are recycled?
In response to these concerns AMTA in early 2005 commissioned The Klein Partnership to undertake the first widespread market research into consumer, business and stakeholder views and behaviours on mobile phone use and recycling.
It revealed that only 46% of consumers were aware that they could recycle their mobile phones, around 9% of people were throwing their mobiles into landfill and there were an estimated 12 million unused mobiles stored away in homes.
This research set the foundation and benchmark for mobile phone ownership, use and recycling in Australia and has been key to the development and success of the industry’s official recycling program.
In response to this research AMTA re-launched its recycling program as MobileMuster in December 2005 with the specific aim of improving its visibility, transparency and sustainability to increase collections, stop mobile phones going to landfill and ensure all components are recycled to the highest environmental standards.
Over the years mobile phone design, technology and infrastructure has evolved rapidly. The first mobile call in Australia was made on 23 February 1987 by the then Minister for Communications, Michael Duffy using an analogue mobile phone. Over the years we have seen handsets and networks evolve becoming more sophisticated and widespread. As the networks have changed from analogue, CDMA, GSM, 2G, 3G and now 4G, handsets have evolved in size, capability and materials (Figure 2, page 14).
12 (ABS/OECD) 1998-2004. Credit Suisse First Boston 2005, Australian Telecommunications 2005, Equity Research.
1985 1995

12Australia’s m
obile industry’s recycling program: A short history
In May 2014, MobileMuster was accredited as the first voluntary product stewardship scheme under the Federal Government’s Product Stewardship Act 2011. Federal Minister for the Environment, Greg Hunt, recognised the program’s significant achievements and the industries $36 million investment into it.
As part of this accreditation, MobileMuster’s members re-committed to increase available collection rates of mobile phones from 50% to 55% and volumes from 87 tonnes to 127 tonnes per year over the next 5 years, as well as increase consumer and industry engagement.13
MobileMuster is the first product stewardship scheme to be accredited by the Federal Government under the Product Stewardship Act and is the only government accredited mobile phone recycling scheme in Australia.
Ten years since the launch of MobileMuster brand, 78% of consumers are now aware that they can recycle their mobile phones, over 937 tonnes of mobiles and accessories have been collected and recycled, only 2% of people throw their mobiles into landfill, there are an estimated 22.5 million phones in storage and the annual collection rates of those phones available for recycling is 53.1%.
How has consumer mobile phone use and recycling behaviour changed over the past decade? What has driven these changes and how have they affected the performance of the program? By reviewing the 10 years of research data along with the program’s activities and results we hope to answer these questions, and from this, determine the future direction of mobile phone stewardship for the next decade.
13 See appendix 1 for MobileMuster Key Performance Indicators from 2014/15 to 2018/19
2003 2008

13
The mobile phone m
arket 2005 to 2015
IMPORTS AND EXPORTS
Over the past 10 years imports have grown from 9.5 million in 2005/06 to 12.2 million in 2014/15, peaking in 2010/11 at 13.35 million. Exports have almost doubled over the past 10 years from 1.1 million to 2.0 million per annum, with the biggest jump in growth taking place during 2010/11 where exports represented 18% of imports.
In 2014/15 they dropped back down to 1.48 million or 12% of imports.14
Annual member handset shipments dropped from a peak of 9.6 million in 2007/08 to 5.8 million in 2014/15 as the market shares of participating and non-participating manufacturers have changed
over time. This has reduced the program’s annual revenue15 by $1.67 million (from $4.06m in 2007/08 to $2.30m in 2014/15). In turn, investment on advertising and program promotion has dropped from 57% of total revenue to 34%, with less than $1 million per annum spent on advertising and promotion in the past three years.
THE MOBILE PHONE MARKET 2005 TO 2015
14 GfK, ABS Customs data.
15 Revenue is generated from the levy paid on each handset imported by program members, currently at $0.42/handset
16 See appendix 3.1 for raw data
1998/00
YEAR
2000/01 2001/02 2002/03 2003/04 2004/05 2005/06 2006/07 2007/08 2008/09 2009/10 2010/11 2011/12 2012/13 2013/14
2,000,000
4,000,000
6,000,000
8,000,000
10,000,000
12,000,000
14,000,000
16,000,000
MOB
ILE
PHON
E UN
ITS
MAR
KET
SHAR
E PE
RCEN
TAGE
0%
10%
20%
30%
40%
50%
60%
70%
80%
90%
100%
FIGURE 1. MOBILE PHONE SHIPMENTS, IMPORTS, EXPORTS MEMBER MARKET SHARE (BY UNITS)1998 TO 2004
MEMBER MARKET SHARE %
TOTAL IMPORTS
MEMBER SHIPMENTS
TOTAL EXPORTS
APPLE ENTERS MARKET
SONY LEAVES PROGRAM
LG LEAVES PROGRAM
FIGURE 1. MOBILE PHONE SHIPMENTS, IMPORTS, EXPORTS, MEMBER MARKET SHARE (BY UNITS) 1998-2015.16
14The m
obile phone market 2005 to 2015
17 AMTA, 2005
18 ACMA, 2012
19 ACMA, 2014
MOBILE PHONE SUBSCRIPTIONS AND TECHNOLOGY
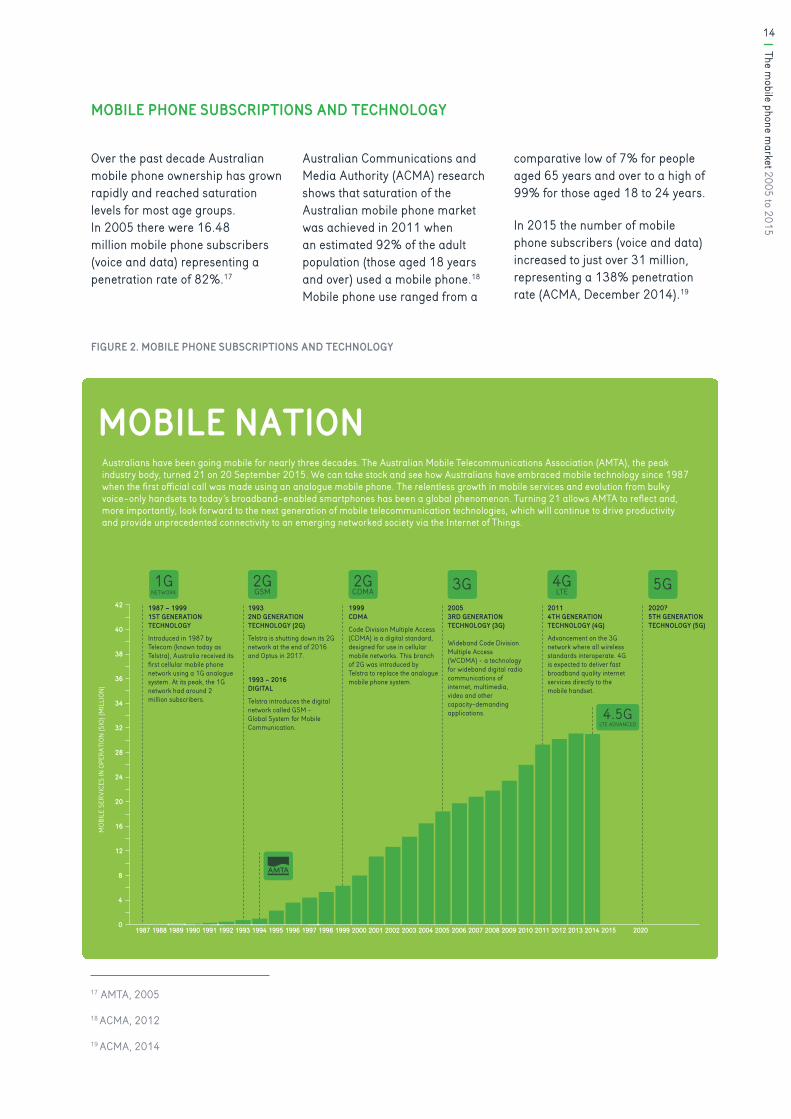
Over the past decade Australian mobile phone ownership has grown rapidly and reached saturation levels for most age groups. In 2005 there were 16.48 million mobile phone subscribers (voice and data) representing a penetration rate of 82%.17
Australian Communications and Media Authority (ACMA) research shows that saturation of the Australian mobile phone market was achieved in 2011 when an estimated 92% of the adult population (those aged 18 years and over) used a mobile phone.18 Mobile phone use ranged from a
comparative low of 7% for people aged 65 years and over to a high of 99% for those aged 18 to 24 years.
In 2015 the number of mobile phone subscribers (voice and data) increased to just over 31 million, representing a 138% penetration rate (ACMA, December 2014).19
0
4
8
12
16
20
24
28
32
1987 1988 1989 1990 1991 1992 1993 1994 1995 1996 1997 1998 1999 2000 2001 2002 2003 2004 2005 2006 2007 2008 2009 2010 2011 2012 20142013
MOB
ILE
SERV
ICES
IN O
PERA
TION
(SIO
) (M
ILLI
ON)
MOBILE NATIONAustralians have been going mobile for nearly three decades. The Australian Mobile Telecommunications Association (AMTA), the peak industry body, turned 21 on 20 September 2015. We can take stock and see how Australians have embraced mobile technology since 1987 when the first official call was made using an analogue mobile phone. The relentless growth in mobile services and evolution from bulky voice-only handsets to today’s broadband-enabled smartphones has been a global phenomenon. Turning 21 allows AMTA to reflect and, more importantly, look forward to the next generation of mobile telecommunication technologies, which will continue to drive productivity and provide unprecedented connectivity to an emerging networked society via the Internet of Things.
1987 – 1999 1ST GENERATION TECHNOLOGY
Introduced in 1987 by Telecom (known today as Telstra), Australia received its first cellular mobile phone network using a 1G analogue system. At its peak, the 1G network had around 2 million subscribers.
1993 2ND GENERATION TECHNOLOGY (2G)
Telstra is shutting down its 2G network at the end of 2016 and Optus in 2017.
1993 – 2016 DIGITAL
Telstra introduces the digital network called GSM - Global System for Mobile Communication.
1999CDMA
Code Division Multiple Access (CDMA) is a digital standard, designed for use in cellular mobile networks. This branch of 2G was introduced by Telstra to replace the analogue mobile phone system.
20053RD GENERATION TECHNOLOGY (3G)
Wideband Code Division Multiple Access (WCDMA) - a technology for wideband digital radio communications of internet, multimedia, video and other capacity-demanding applications.
2011 4TH GENERATION TECHNOLOGY (4G)
Advancement on the 3G network where all wireless standards interoperate. 4G is expected to deliver fast broadband quality internet services directly to the mobile handset.
2015 2020
2020?5TH GENERATION TECHNOLOGY (5G)
34
36
38
40
3G 5G2GGSM
2GCDMA
4GLTE
4.5GLTE ADVANCED
1GNETWORK
42
FIGURE 2. MOBILE PHONE SUBSCRIPTIONS AND TECHNOLOGY
15
Research methodology
The data used in this report is drawn from consumer research commissioned annually by the AMTA since 2005 (see appendix 2 for market research timeline).
The overarching objective of the consumer research has been two-fold:
1. To gain insights into the current and changing behaviour of Australian mobile phone users focussing on mobile phone ownership, use and recycling behaviours including awareness, attitudes and behaviour towards mobile phone recycling
2. To assess the effectiveness and impacts of the program’s promotional and advertising activities.
RESEARCH METHODOLOGY
TARGET AUDIENCE AND SAMPLE SIZE
In total 16 surveys have been completed (see appendix 2 for list of surveys). The audience, sample size and method (I.e. telephone vs online) for the surveys have varied slightly over time. In undertaking the analysis these variations have been taken into consideration when comparing data year on year.
In the first survey conducted by The Klein Partnership20 in 2005, the sample size was 904, demographically representative of the population with individuals 15+ nationally, with 87% being mobile phone users. Interviews were done by telephone.
From 2006 to February 2011, IPSOS21 undertook the research. The survey respondents were randomly selected from an online panel and invited to take part in the survey. In order to qualify
respondents had to be aged between 16 to 64 years, own a mobile phone and live in either Sydney, Melbourne, Adelaide or Perth. Each time 600 to 700 people were surveyed.
From November 2011, it was decided to broaden the sample size to cover a nationally representative panel of respondents throughout Australia. As in previous years the survey respondents were randomly selected from an online panel and invited to take part in the survey. In order to qualify respondents had to be aged 16 years or older and own a mobile phone. Each time 1000 to 1100 people were surveyed by IPSOS.
A number of shorter surveys using Omnibus (18+) and Newspoll (18-64) to specifically assess the effectiveness and impact of
TV, radio and online advertising campaigns were also undertaken in 2008 and 2009. Data from these surveys has only been used where appropriate. The sample size was similar to the IPSOS research with 1000 to 1100 people being surveyed.
20 The Klein Partnership, Independent market research consultancy, http://www.tkp.com.au/
21 IPSOS, Independent market research company, ranked third in the global research industry http://ipsos.com.au/
16M
arket research resultMARKET RESEARCH RESULTS
CURRENT PHONE OWNERSHIP AND USE PATTERNS
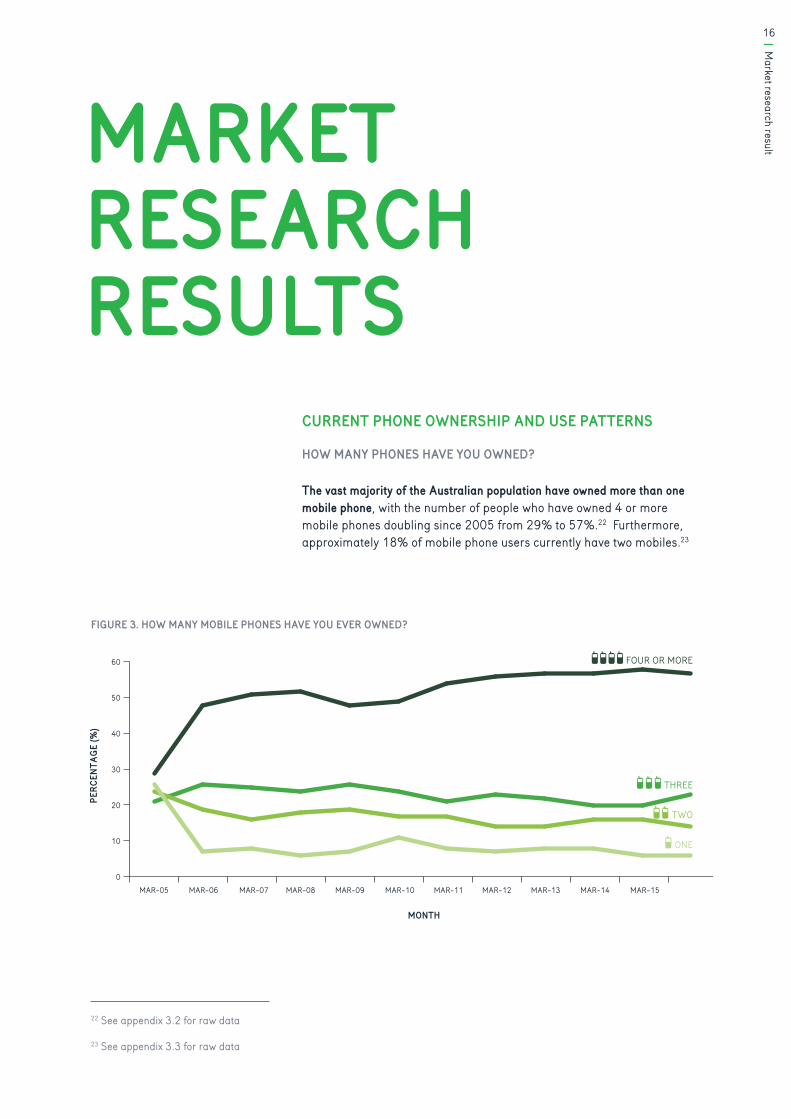
HOW MANY PHONES HAVE YOU OWNED?
The vast majority of the Australian population have owned more than one mobile phone, with the number of people who have owned 4 or more mobile phones doubling since 2005 from 29% to 57%.22 Furthermore, approximately 18% of mobile phone users currently have two mobiles.23
FIGURE 2. HOW MANY MOBILE PHONES HAVE YOU EVER OWNED?
MONTH
0
10
20
30
40
50
60
TWO
ONE
PERC
ENTA
GE (%
)
MAR-15MAR-14MAR-13MAR-12MAR-11MAR-10MAR-09MAR-08MAR-07MAR-06MAR-05
THREE
FOUR OR MORE
22 See appendix 3.2 for raw data
23 See appendix 3.3 for raw data
FIGURE 3. HOW MANY MOBILE PHONES HAVE YOU EVER OWNED?
17
Market research result
HOW LONG DO PEOPLE USE THEIR PHONE FOR – EXPECTED VERSUS ACTUAL
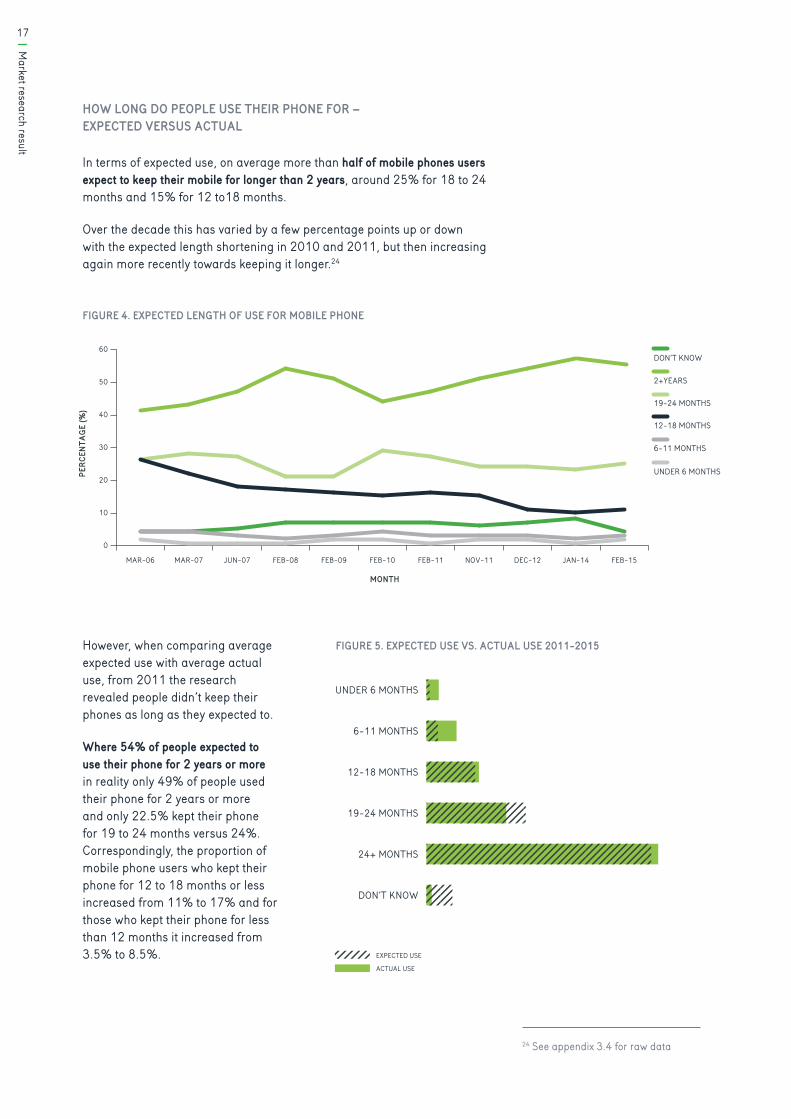
In terms of expected use, on average more than half of mobile phones users expect to keep their mobile for longer than 2 years, around 25% for 18 to 24 months and 15% for 12 to18 months.
Over the decade this has varied by a few percentage points up or down with the expected length shortening in 2010 and 2011, but then increasing again more recently towards keeping it longer.24 FIGURE 3. EXPECTED USE VS. ACTUAL USE
2011-2015
2011-15 Under 6 months
6 - 11 months
12 - 18 months
19 - 24 months
2+ years Don't know
Averge Expected 0.8% 2.8% 11.8% 24.0% 54.3% 6.3%
Average Actual 3.3% 7.3% 12.7% 19.3% 56.0% 1.3%
UNDER 6 MONTHS
6-11 MONTHS
12-18 MONTHS
19-24 MONTHS
24+ MONTHS
DON’T KNOW
FIGURE 3. EXPECTED USE VS. ACTUAL USE2011-2015
FIGURE 3. EXPECTED USE VS. ACTUAL USE2011-2015
< 6 MONTHS
6-11 MONTHS
12-18 MONTHS
19-24 MONTHS
24+ MONTHS
DON’T KNOW
FIGURE 4. EXPECTED LENGTH OF USE FOR MOBILE PHONE
0
10
20
30
40
50
60
FEB-15JAN-14DEC-12NOV-11FEB-11FEB-10FEB-09FEB-08JUN-07MAR-07MAR-06
MONTH
PERC
ENTA
GE (%
)
6-11 MONTHS
12-18 MONTHS
19-24 MONTHS
2+YEARS
DON’T KNOW
UNDER 6 MONTHS
24 See appendix 3.4 for raw data
However, when comparing average expected use with average actual use, from 2011 the research revealed people didn’t keep their phones as long as they expected to.
Where 54% of people expected to use their phone for 2 years or more in reality only 49% of people used their phone for 2 years or more and only 22.5% kept their phone for 19 to 24 months versus 24%. Correspondingly, the proportion of mobile phone users who kept their phone for 12 to 18 months or less increased from 11% to 17% and for those who kept their phone for less than 12 months it increased from 3.5% to 8.5%.
FIGURE 4. EXPECTED LENGTH OF USE FOR MOBILE PHONE
FIGURE 5. EXPECTED USE VS. ACTUAL USE 2011-2015
EXPECTED USE
ACTUAL USE
18M
arket research result
LENGHT OF OWNERSHIP - PREVIOUS HANDSET PHONE PLAN TYPE - 2015
0
10
20
30
40
50
60
70
DON’TKNOW
2 YEARSOR MORE
19 MONTHSTO 2 YEARS
12 TO 18MONTHS
6 TO 11MONTHS
UNDER 6MONTHS
PERC
ENTA
GE (%
)
BRAND
COMPANY PHONE
CONTRACT
PRE PAID
TOTAL
25 See appendix 3.5 for raw data
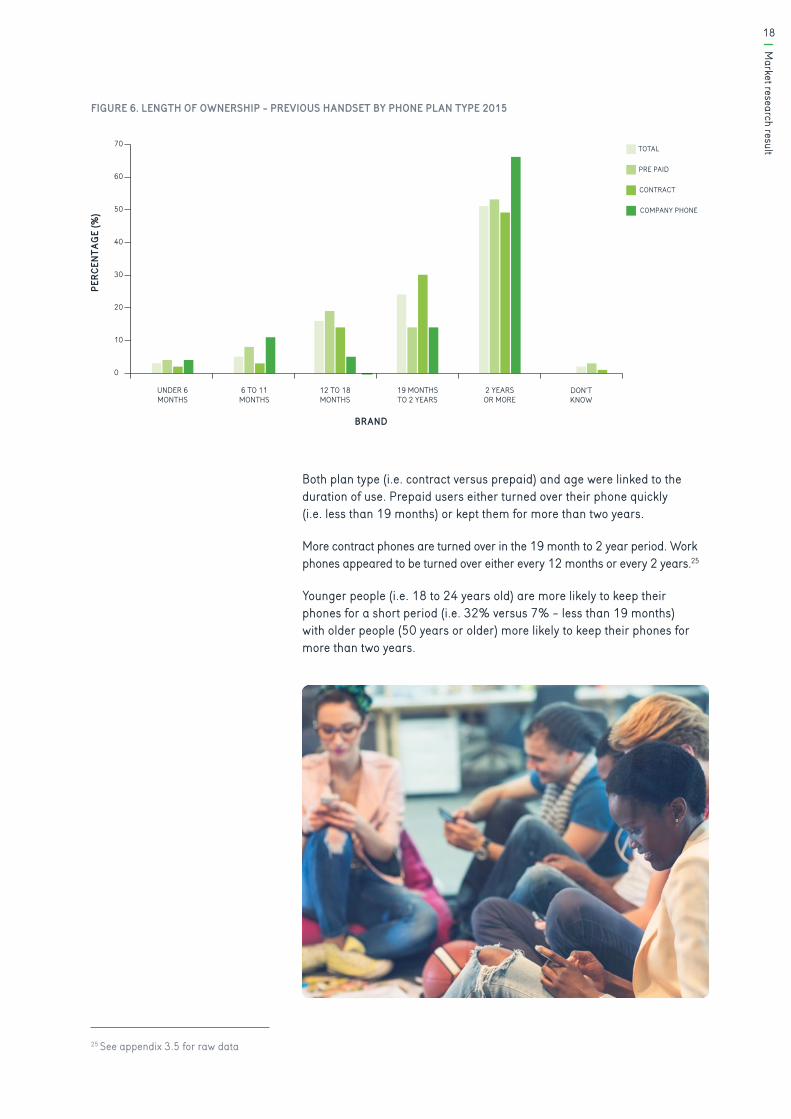
Both plan type (i.e. contract versus prepaid) and age were linked to the duration of use. Prepaid users either turned over their phone quickly (i.e. less than 19 months) or kept them for more than two years.
More contract phones are turned over in the 19 month to 2 year period. Work phones appeared to be turned over either every 12 months or every 2 years.25
Younger people (i.e. 18 to 24 years old) are more likely to keep their phones for a short period (i.e. 32% versus 7% - less than 19 months) with older people (50 years or older) more likely to keep their phones for more than two years.
FIGURE 6. LENGTH OF OWNERSHIP - PREVIOUS HANDSET BY PHONE PLAN TYPE 2015

19
Market research result
FIGURE 5. REASONS FOR OBTAINING CURRENT PHONE
0%
5%
10%
15%
20%
25%
30%
35%
OTHERNEEDED A PHONEUPGRADING FROM CDMA NETWORK
WORK RELATED/ SUPPLIED BY
EMPLOYER
GIVEN PHONE/ GIFT/ SOMEONE ELSE
BOUGHT
PHONE LOST/ STOLEN
$0 UP FRONT WITH NEW CONTRACT
NEW/ EXPIRED CONTRACT
WANTED LATEST TECHNOLOGY/
MODEL/IPHONE/SMARTPHONE
PHONE DETERIORATED/ NOT WORKING/
BROKE
FEB-15
JAN-14
DEC-12
NOV-11
FEB-11
FEB-10
FEB-09
FEB-08
JUN-07
MAR-07
MAR-06
MAR-05
FIGURE 7. REASONS FOR OBTAINING CURRENT PHONE
WHY ARE PEOPLE GETTING A NEW PHONE?
The main reasons for getting a new phone haven’t changed much over time26 with the top 3 reasons up until 2011 being phone deteriorating/not working (24% on average) or wanted latest technology/smartphones (28% on average) or existing contract expired (17% on average). Interestingly a $0 up front with new contract and phone given by friend or work are less of a reason now than previously.
From 2011 to 2014 however the percentage of people citing the desire for new technology and smartphones as a reason for replacing their old phone jumped up to over 33% on average, which reflects the uptake of smartphones by the Australian community. As expected this is now becoming less of a reason (down to 20% in 2015) as nearly 90% of Australians own a smartphone.27
With 23 million inhabitants, Australia has a much smaller population than other major mobile markets such as the United States and the United Kingdom, but it has higher rates of smart device ownership with the two major brands Apple and Samsung dominating the smartphone market.28 26 See appendix 3.6 for raw data
27 2014 Australian Mobile Phone Lifestyle Index (AMPLI). http://www.aimia.com.au/ampli2014
28 See appendix 3.7 for raw data
One of the top 3 reasons for getting a new phone is wanted latest technology/smartphones.

20M
arket research result
FIGURE 6. BRAND OF CURRENT MOBILE PHONE
0
5
10
15
20
25
30
35
ZTEBLACKBERRYMOTOROLASONYLGOTHERHTCNOKIASAMSUNGIPHONE
PERC
ENTA
GE (%
)
BRAND
FEB-15
JAN-14
DEC-12
NOV-11
FIGURE 8. BRAND OF CURRENT MOBILE PHONE
FIGURE 5. REASONS FOR OBTAINING CURRENT PHONE
0%
5%
10%
15%
20%
25%
30%
35%
OTHERNEEDED A PHONEUPGRADING FROM CDMA NETWORK
WORK RELATED/ SUPPLIED BY
EMPLOYER
GIVEN PHONE/ GIFT/ SOMEONE ELSE
BOUGHT
PHONE LOST/ STOLEN
$0 UP FRONT WITH NEW CONTRACT
NEW/ EXPIRED CONTRACT
WANTED LATEST TECHNOLOGY/
MODEL/IPHONE/SMARTPHONE
PHONE DETERIORATED/ NOT WORKING/
BROKE
FEB-15
JAN-14
DEC-12
NOV-11
FEB-11
FEB-10
FEB-09
FEB-08
JUN-07
MAR-07
MAR-06
MAR-05
21
Market research result
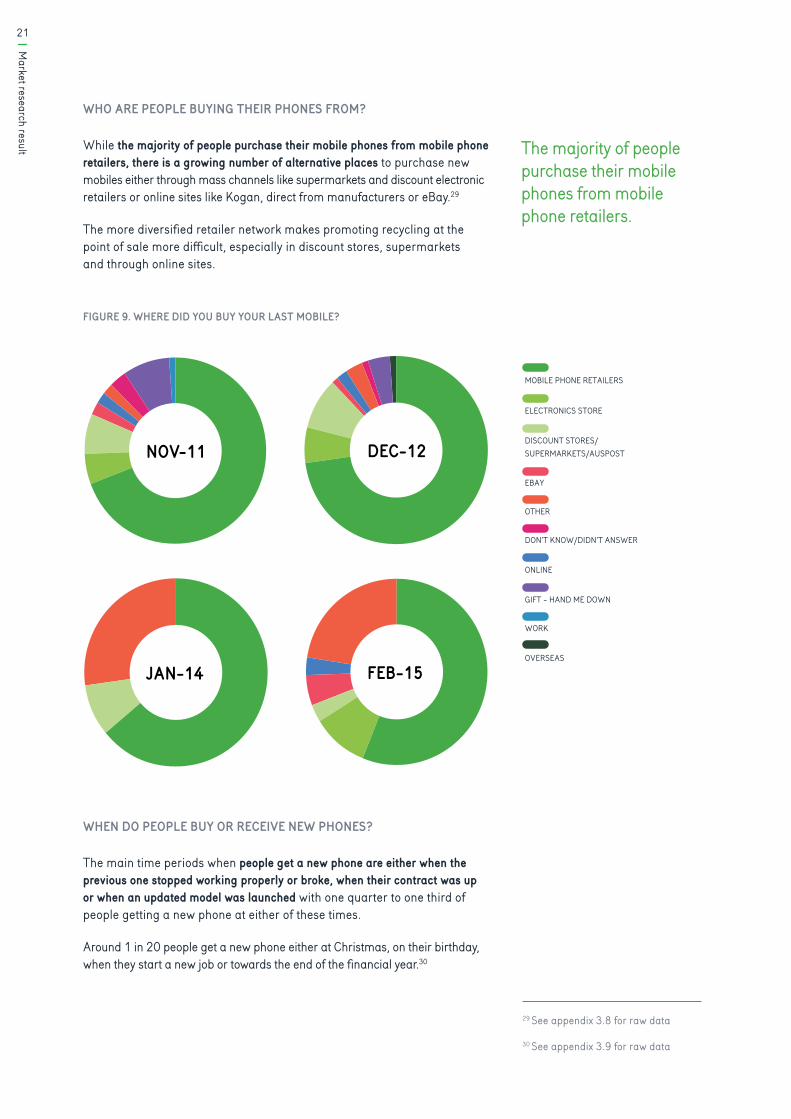
WHO ARE PEOPLE BUYING THEIR PHONES FROM?
While the majority of people purchase their mobile phones from mobile phone retailers, there is a growing number of alternative places to purchase new mobiles either through mass channels like supermarkets and discount electronic retailers or online sites like Kogan, direct from manufacturers or eBay.29
The more diversified retailer network makes promoting recycling at the point of sale more difficult, especially in discount stores, supermarkets and through online sites.
29 See appendix 3.8 for raw data
30 See appendix 3.9 for raw data
FEB-15JAN-14
DEC-12NOV-11
FIGURE 7. WHERE DID YOU BUY YOUR LAST MOBILE?
MOBILE PHONE RETAILERSELECTRONICS STORE
DISCOUNT STORES/ SUPERMARKETS/AUSPOS
EBAY ONLINEOTHER
DON’T KNOW/DIDN’T ANSWER
GIFT - HAND ME DOWN
WORKOVERSEAS
FEB-15JAN-14
DEC-12NOV-11
MOBILE PHONE RETAILERS
ELECTRONICS STORE
DISCOUNT STORES/ SUPERMARKETS/AUSPOST
EBAY
OTHER
DON’T KNOW/DIDN’T ANSWER
ONLINE
GIFT - HAND ME DOWN
WORK
OVERSEAS
FIGURE 9. WHERE DID YOU BUY YOUR LAST MOBILE?
WHEN DO PEOPLE BUY OR RECEIVE NEW PHONES?
The main time periods when people get a new phone are either when the previous one stopped working properly or broke, when their contract was up or when an updated model was launched with one quarter to one third of people getting a new phone at either of these times.
Around 1 in 20 people get a new phone either at Christmas, on their birthday, when they start a new job or towards the end of the financial year.30
The majority of people purchase their mobile phones from mobile phone retailers.

22M
arket research result
0
10
20
30
40
50
60
70
FIGURE 8. WHAT HAPPENED TO YOUR PREVIOUS MOBILE PHONE?
PERC
ENTA
GE (%
)
MONTH
FEB-15JAN-14DEC-12NOV-11FEB-11FEB-10FEB-09FEB-08JUN-07MAR-07MAR-06MAR-05
THREW IT AWAY
GAVE IT TO SOMEONE ELSE
DONATED TO CHARITY
RECYCLED IT
KEPT IT JUST IN CASE
SOLD IT/TRADED IT
LOST OR STOLEN
WHAT HAPPENS TO OLD PHONES AND WHY?
WHAT ARE AUSTRALIAN MOBILE PHONE OWNERS DOING WITH THEIR OLD MOBILES?
Over the past decade some clear trends in what people are doing with their previous phone emerged:31
• More people are keeping their phones, an increase from 46% to 61%, even if they are not working (25% of those kept don’t work)
• Less people are giving their previous phone away either to family / friend or charity, dropping from 19% to 13%
• More people are selling/trading in their previous phone, up from 4% to 6% (note the main increase in selling not trading 0% to 4%)
• More people are recycling their previous phone, up from 4% to 12%
• Less people are throwing them in the rubbish, down from 9% to 2%
• Less are being stolen, down from 8% to 2%.
31 See appendix 3.10 for raw data
FIGURE 10. WHAT HAPPENED TO YOUR PREVIOUS MOBILE PHONE?
LOST AND STOLEN
The AMTA has an agreement in place with all Australian mobile phone carriers to block all lost or stolen mobile phones by letting people check the IMEI status of a mobile phone. If a mobile phone is lost or stolen, consumers can contact their service provider immediately to suspend their service and stop unauthorised calls being made. The provider will block your SIM card and IMEI number to prevent the phone from being used on any Australian mobile network.

23
Market research result
PLANNED VERSUS ACTUAL BEHAVIOUR
While people’s intention to recycle their current phone increased over the past decade to 27% in 2015 only 12% said they recycled their previous phone this year. Correspondingly more people kept their previous phone this year, 61% compared to 26% saying they will recycle their current phone.32
32 See appendix 3.11 for raw data
33 See appendix 3.12 for raw data
FIGURE 9. WHAT ARE YOU PLANNING TO DO WITH YOUR OLD MOBILE WHEN YOU GETA NEW ONE?
0
10
20
30
40
50
FEB-15JAN-14DEC-12NOV-11FEB-11FEB-10FEB-09FEB-08JUN-07MAR-07MAR-06MAR-05
PERC
ENTA
GE (%
)
MONTH
THROW IT AWAY
GIVE IT TO SOMEONE ELSE
DONATE TO CHARITY
RECYCLE IT
KEPT IT JUST IN CASE
SELL IT
TRADE IN
DON’T KNOW
FIGURE 10. MOBILE PHONES IN STORAGE
FEB-15JAN-14DEC-12NOV-11FEB-11FEB-10FEB-09FEB-08JUN-07MAR-07MAR-06
MONTH
0
10
20
30
40
50
60
EST. NO. OF PHONES IN STORAGE
TWO OR MORE
0
5
10
15
20
25
PERC
ENTA
GE (%
)
NUM
BER
OF P
HONE
S (M
ILLI
ONS)
CLARIFICATION OF Y-AXIS?
MOBILE PHONES IN STORAGE
As a result of so many people keeping their previous phone/s the estimated amount of unused phones in storage has grown substantially over the past decade from 12 million to 22.5 million.33 From 2008 to 2011 there was a rapid growth in phones in storage but this started to slow in 2012 to the point where it dropped for the first time in 2015.
Likewise the number of people who had two or more phones in storage increased for a number of years peaking at 40% in 2011. This figure then started to reduce in 2012 to 36% in 2015.
FIGURE 11. WHAT ARE YOU PLANNING TO DO WITH YOUR OLD MOBILE WHEN YOU GET A NEW ONE?
FIGURE 12. MOBILE PHONES IN STORAGE
Unused phones in storage has grown substantially over the past decade from 12 million to 22.5 million.

24M
arket research result
The average number of phones in storage per household grew from 1.58 in 2005 to 2.45 in 2015, peaking at 2.66 in 2012.34 Likewise the average number of phones in storage per-capita grew from 0.6 in 2005 to 0.9 in 2015, peaking at 1.33 in 2014.
FIGURE 11. POPULATION AND HOUSEHOLD NUMBERS VS MOBILES IN STORAGE & IMPORTS
5
10
15
20
25
MAR-15MAR-14MAR-13MAR-12MAR-11MAR-10MAR-09MAR-08MAR-07MAR-06MAR-05
NO. OF HOUSEHOLDS IN AUS
TOTAL NO. MOBILE IMPORTS
TOTAL NO. OF PHONES IN STORAGE IN AUS
POPULATION
MONTH
NUM
BER
OF P
HONE
S (M
ILLI
ONS) POPULATION
TOTAL NO. OF PHONES IN STORAGE IN AUS
TOTAL NO. OF IMPORTS
NO. OF HOUSEHOLDS IN AUS
FIGURE 12. AVERAGE NUMBER OF PHONES PER HOUSEHOLD & PER CAPITA
MAR-10
MONTH
NUM
BER
OF P
HONE
S
MAR-15MAR-14MAR-13MAR-12MAR-11MAR-09MAR-08MAR-07MAR-06MAR-05
0.0
1.0
2.0
3.0
4.0
AVERAGE NO. OF PHONES IN STORAGE PER CAPITA
PHONES IN STORAGEPER HOUSEHOLD
FIGURE 13. POPULATION AND HOUSEHOLD NUMBERS VS MOBILES IN STORAGE & IMPORTS
FIGURE 14. AVERAGE NUMBER OF PHONES PER HOUSEHOLD & PER CAPITA
34 See appendix 3.13 for raw data
35, 36 Josh Fear, 2008, Stuff happens: Unused things cluttering up our homes, The Australia Institute, viewed 16 July 2015, http://apo.org.au/node/603.
According to a national study by Fear in 200835 on clutter, Australians say they are hanging on to the ‘stuff’ that clutters up their homes because they are too lazy or too busy to deal with it; or they feel guilty for getting rid of things that they invested in.36
25
Market research result
FIGURE 13. IF STORING/KEEPING YOUR PHONE, HOW LONG DO YOU EXPECT TO KEEP IT FOR?
0
10
20
30
40
50
PERC
ENTA
GE (%
)
MAR-15MAR-14MAR-13MAR-12MAR-11MAR-10MAR-09MAR-08MAR-07MAR-06MAR-05
MONTH
6-11 MONTHS
12-18 MONTHS
19-24 MONTHS
2+YEARS
DON’T KNOW
UNDER 6 MONTHS
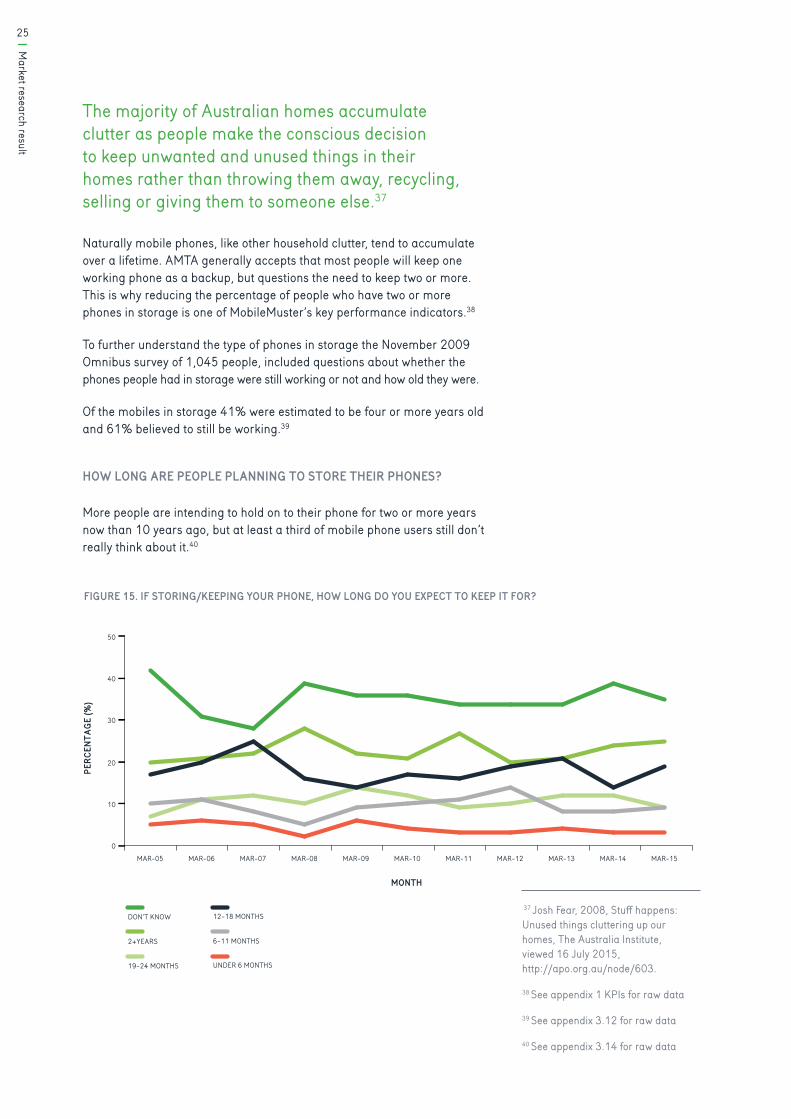
The majority of Australian homes accumulate clutter as people make the conscious decision to keep unwanted and unused things in their homes rather than throwing them away, recycling, selling or giving them to someone else.37
Naturally mobile phones, like other household clutter, tend to accumulate over a lifetime. AMTA generally accepts that most people will keep one working phone as a backup, but questions the need to keep two or more. This is why reducing the percentage of people who have two or more phones in storage is one of MobileMuster’s key performance indicators.38
To further understand the type of phones in storage the November 2009 Omnibus survey of 1,045 people, included questions about whether the phones people had in storage were still working or not and how old they were.
Of the mobiles in storage 41% were estimated to be four or more years old and 61% believed to still be working.39
HOW LONG ARE PEOPLE PLANNING TO STORE THEIR PHONES?
More people are intending to hold on to their phone for two or more years now than 10 years ago, but at least a third of mobile phone users still don’t really think about it.40
37 Josh Fear, 2008, Stuff happens: Unused things cluttering up our homes, The Australia Institute, viewed 16 July 2015, http://apo.org.au/node/603.
38 See appendix 1 KPIs for raw data
39 See appendix 3.12 for raw data
40 See appendix 3.14 for raw data
FIGURE 15. IF STORING/KEEPING YOUR PHONE, HOW LONG DO YOU EXPECT TO KEEP IT FOR?

26M
arket research result
41 See appendix 3.15 for raw data
WHY ARE PEOPLE KEEPING THEIR OLD PHONES AND NOT RECYCLING THEM?41
While initially in 2005 and 2006 the primary reason people kept their phone and didn’t recycle it was that they didn’t know they could or they weren’t sure what to do with it. The main reason since 2007 has been that people wanted it as a spare for back up. This reason has continued to be the primary reason with anywhere from 40% to 60% of people listing this as a reason for not recycling their phone over the years.
The next most common reasons given are that the phone still works, the person may need it or that it has information / numbers on it. The percentage of people who have given one of these reasons has grown over the years from less than 10% to more than 20% in 2014, dropping to 16% in 2015.
Haven’t got around to it is the next most common reason ranging from 11% to 25% over the years with no clear trend over time.
Didn’t know they could recycle it as a reason given for holding onto their old handset dropped from 13% in 2007 to 5% in 2015, but not sure what to do with it increased from 8% in 2005 to 14% in 2015. This possibly reflects that there are now more factors to consider in deciding what to do with your old phone. Reasons given by consumers included security concerns or that people may be able to sell it or repair it or use it overseas.
The main reason since 2007 has been that people wanted it as a spare for back up.

27
Market research result
Handing it on to friends or family to use was more likely to be given as a reason for not recycling in 2005 and 2006 than in more recent years, while keeping for kids to play with continues to remain a reason for some (between 2% to 6%).
Knowing where to recycle has been a reason for not recycling for about 9% of people on average over the decade, interestingly this went up to 16% in 2015. This probably reflects the gradual drop in general awareness of mobile phone recycling over the past two years from 83% in 2013 to 79% in 2015.
There is also a small percentage of people, around 2%, that consider it was an expensive phone/paid good money for it.
mobilemuster.com.au/news/quiz-what-type-of-hoarder-are-you
TAKE THE QUIZ

28M
arket research result
This is someone who is holding onto their old mobiles for sentimental reasons such as, it being their first mobile, were using it when they met their partner or perhaps receiving it as a gift from a parent
A typical technophile is someone who is often an early adopter of new technology and holds onto these phones for the enjoyment of remembering when they first got their hands on it or to have a physical reminder of how far technology has come
If you find yourself putting off de-cluttering and recycling all those unnecessary electronic items that are tucked away in cupboards and drawers, then you qualify as a ‘Maybe Later’ type
This person is typically concerned about the security of their data when it comes to disposing of their old electronics
Have you ever given your old mobile to someone close to you or to a child to play with? If so, then you are a typical gift-giver
Some people believe that one day their old mobile phone will be worth a lot of money as an antique. Like pennies, mobiles are a dime a dozen with very few of them ever becoming so rare or unique that they become a valuable collector’s item
Would it surprise you to know that one in ten Aussies are holding onto an old mobile in case they might need it in an alien invasion?
WHAT TYPE OF HOARDER ARE YOU?
The reasons people hoard their old mobiles can be grouped into seven personality types:
29
Market research result
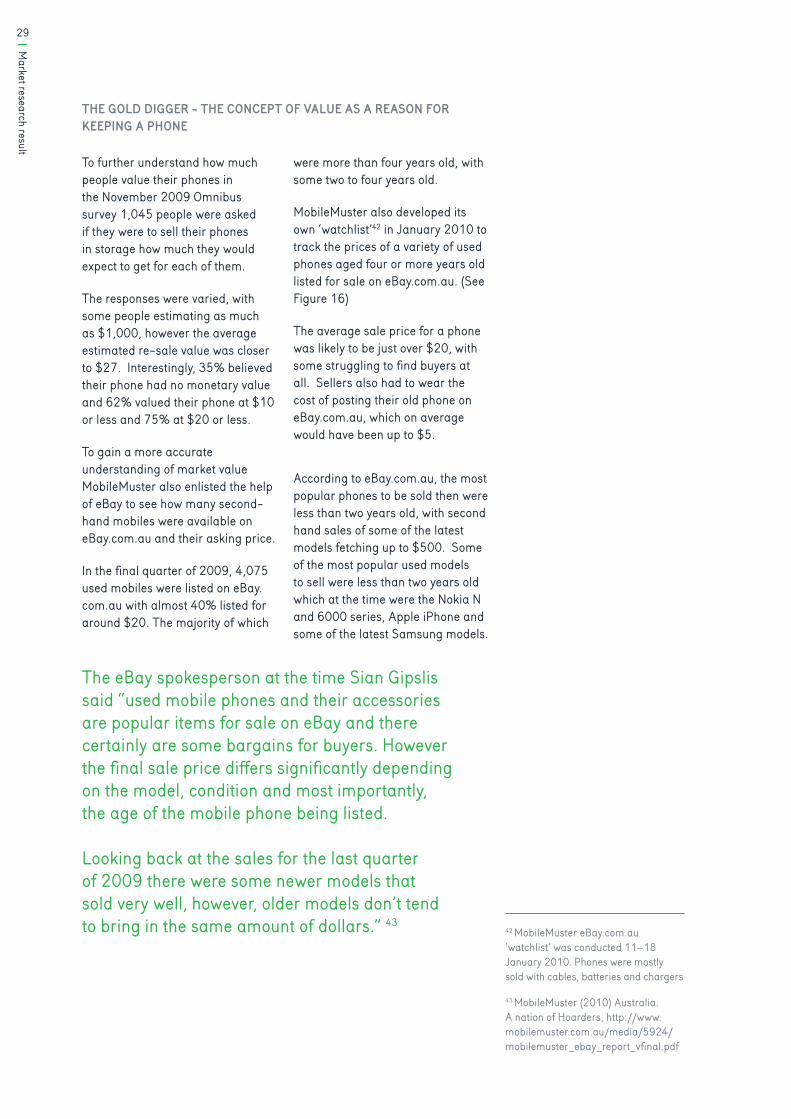
THE GOLD DIGGER - THE CONCEPT OF VALUE AS A REASON FOR KEEPING A PHONE
To further understand how much people value their phones in the November 2009 Omnibus survey 1,045 people were asked if they were to sell their phones in storage how much they would expect to get for each of them.
The responses were varied, with some people estimating as much as $1,000, however the average estimated re-sale value was closer to $27. Interestingly, 35% believed their phone had no monetary value and 62% valued their phone at $10 or less and 75% at $20 or less.
To gain a more accurate understanding of market value MobileMuster also enlisted the help of eBay to see how many second-hand mobiles were available on eBay.com.au and their asking price.
In the final quarter of 2009, 4,075 used mobiles were listed on eBay.com.au with almost 40% listed for around $20. The majority of which
were more than four years old, with some two to four years old.
MobileMuster also developed its own ‘watchlist’42 in January 2010 to track the prices of a variety of used phones aged four or more years old listed for sale on eBay.com.au. (See Figure 16)
The average sale price for a phone was likely to be just over $20, with some struggling to find buyers at all. Sellers also had to wear the cost of posting their old phone on eBay.com.au, which on average would have been up to $5.
According to eBay.com.au, the most popular phones to be sold then were less than two years old, with second hand sales of some of the latest models fetching up to $500. Some of the most popular used models to sell were less than two years old which at the time were the Nokia N and 6000 series, Apple iPhone and some of the latest Samsung models.
The eBay spokesperson at the time Sian Gipslis said “used mobile phones and their accessories are popular items for sale on eBay and there certainly are some bargains for buyers. However the final sale price differs significantly depending on the model, condition and most importantly, the age of the mobile phone being listed.
Looking back at the sales for the last quarter of 2009 there were some newer models that sold very well, however, older models don’t tend to bring in the same amount of dollars.” 43
42 MobileMuster eBay.com.au ‘watchlist’ was conducted 11–18 January 2010. Phones were mostly sold with cables, batteries and chargers
43 MobileMuster (2010) Australia. A nation of Hoarders, http://www.mobilemuster.com.au/media/5924/mobilemuster_ebay_report_vfinal.pdf

30M
arket research result
FIGURE 16. MOBILEMUSTER EBAY.COM.AU WATCH LIST 2010 - RESALE VALUE OF PHONES
4+
4+ 4+
4+ 4+ YEARS OLD
YEARS OLD
YEARS OLD
YEARS OLD
YEARS OLD
NOKIA 5110
LOWEST: Did not sellHIGHEST: $36.50AVG SALE PRICE: $20.82
NOKIA 3120
LOWEST: $26.00HIGHEST: $32.00AVG SALE PRICE: $28.67
NOKIA 6610
LOWEST: $5.00HIGHEST: $43.00AVG SALE PRICE: $22.36
NOKIA 1110
LOWEST: $14.50HIGHEST: $28.95AVG SALE PRICE: $22.61
NOKIA 3315
LOWEST: Did not sellHIGHEST: $51.00AVG SALE PRICE: $29.50
31
Market research result
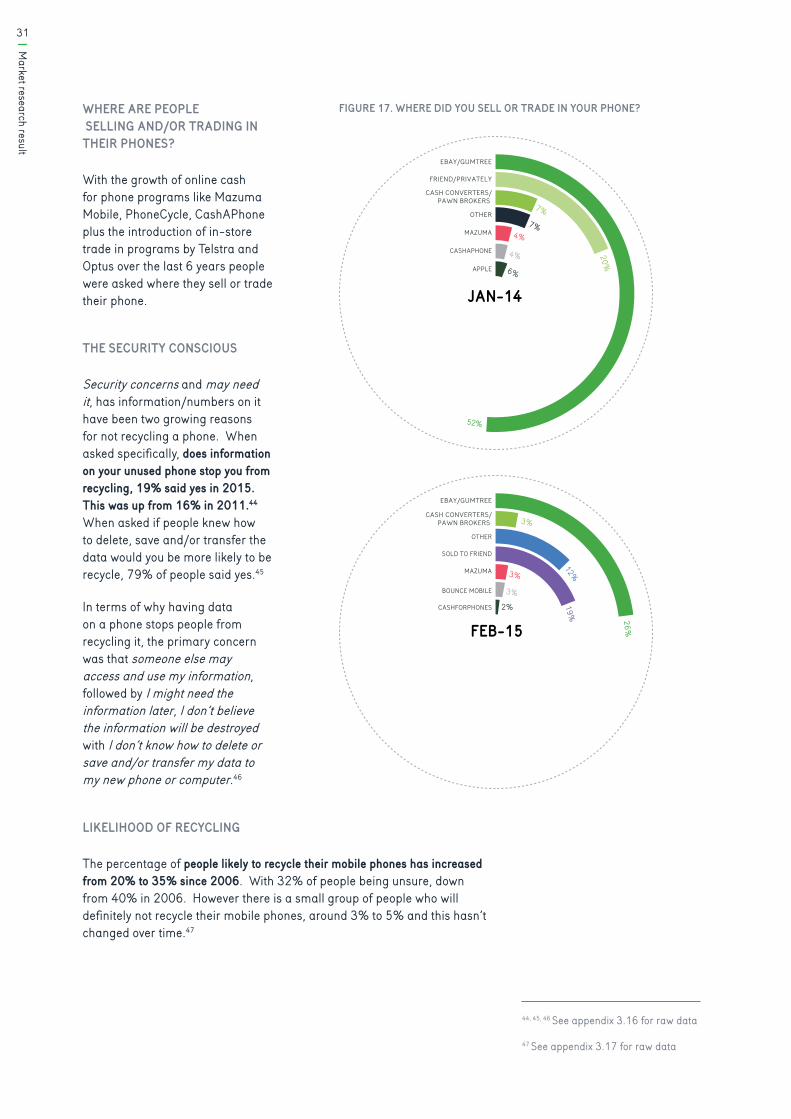
WHERE ARE PEOPLE SELLING AND/OR TRADING IN THEIR PHONES?
With the growth of online cash for phone programs like Mazuma Mobile, PhoneCycle, CashAPhone plus the introduction of in-store trade in programs by Telstra and Optus over the last 6 years people were asked where they sell or trade their phone.
THE SECURITY CONSCIOUS
Security concerns and may need it, has information/numbers on it have been two growing reasons for not recycling a phone. When asked specifically, does information on your unused phone stop you from recycling, 19% said yes in 2015. This was up from 16% in 2011.44 When asked if people knew how to delete, save and/or transfer the data would you be more likely to be recycle, 79% of people said yes.45
In terms of why having data on a phone stops people from recycling it, the primary concern was that someone else may access and use my information, followed by I might need the information later, I don’t believe the information will be destroyed with I don’t know how to delete or save and/or transfer my data to my new phone or computer.46
FRIEND/PRIVATELY
EBAY/GUMTREE
EBAY/GUMTREE
CASH CONVERTERS/PAWN BROKERS
CASH CONVERTERS/PAWN BROKERS
OTHER
SOLD TO FRIEND
MAZUMA
OTHER
BOUNCE MOBILE
CASHFORPHONES
JAN-14
FEB-15
52%
20%
7%
7%4%
4%
6%
MAZUMA
CASHAPHONE
APPLE
26%
12%19%
3%
3%
3%
2%
44, 45, 46 See appendix 3.16 for raw data
47 See appendix 3.17 for raw data
LIKELIHOOD OF RECYCLING
The percentage of people likely to recycle their mobile phones has increased from 20% to 35% since 2006. With 32% of people being unsure, down from 40% in 2006. However there is a small group of people who will definitely not recycle their mobile phones, around 3% to 5% and this hasn’t changed over time.47
FIGURE 17. WHERE DID YOU SELL OR TRADE IN YOUR PHONE?

32M
arket research result
FIGURE 16. HOW LIKELY ARE YOU TO RECYCLE YOUR MOBILE PHONE?
PERC
ENTA
GE (%
)
MAR-15MAR-14MAR-13MAR-12MAR-11MAR-10MAR-09MAR-08MAR-07MAR-06MAR-05
MONTH
DEFINATELY NOT
PROBABLY NOT
MIGHT/MIGHT NOT
PROBABLY WILL
DEFINITELY WILL
0
5
10
15
20
25
30
35
40
0
20
40
60
80
100
FIGURE 17. IF YOU HAVE RECYCLED YOUR MOBILE PHONE, WHICH COMPONENT?
PERC
ENTA
GE (%
)
MAR-15MAR-14MAR-13MAR-12MAR-11MAR-10MAR-09MAR-08MAR-07MAR-06
MONTH
HEAD SET/HANDS FREE
SIM CARD
CHARGER
PHONE HANDSET
BATTERY
CASE
OTHER
48 See appendix 3.17 for raw data
49 See appendix 3.18 for raw data
WHEN ARE PEOPLE THINKING OF RECYCLING THEIR MOBILE?
Most Australians (74% in 2015) said the event that prompts them to recycle is when they buy or receive a new handset. 16% of people listed a range of other reasons including receiving a recycling envelope with the phone, saw a collection unit in-store or at the library or it stopped working and/or battery died. 7% of people said when they were doing a spring clean.48
WHAT PARTS OF MOBILE PHONES ARE PEOPLE RECYCLING?
In asking people what part of a mobile phone they have recycled, most people (80%) have recycled the batteries, more people have recycled a handset as well (increased from 54% to 81%), however only half have recycled their charger (showing a slight upward trend) and less people are recycling SIM cards, headsets or cases.49
FIGURE 18. HOW LIKELY ARE YOU TO RECYCLE YOUR MOBILE PHONE?
FIGURE 19. IF YOU HAVE RECYCLED YOUR MOBILE PHONE, WHICH COMPONENT?

33
Market research result
ENCOURAGING PEOPLE TO RECYCLE
Trying to understand what will encourage people to recycle has been an important objective of the market research. It is clear there are three main drivers that encourage recycling – awareness, access and value. The research shows there has been little shift in the degree to which each of these encourages people to recycle.
AWARENESS AND KNOWLEDGE
Knowing where to find recycling bins and promotion of the program are both important drivers to encouraging recycling (on average 77% and 73% respectively), however over time less people advised they would definitely recycle and more people stated they might recycle.50
Likewise being asked to recycle your old phone by a sales person and more bins in phones stores are important drivers to encouraging recycling.
Receiving an SMS did not score high as a way to encourage recycling from 2009 to 2011. However given the increased use of smartphones, and greater consumption of information via mobile phones this may be a more effective mechanism and would be worth testing in the market to see how people respond or simply how it raises general awareness.
50 See appendix 3.19 for definitely and might recycle data
FIGURE 19. AWARENESS OF MOBILE PHONE RECYCLING PROGRAM IN AUSTRALIA
0
20
40
60
80
100
PERC
ENTA
GE (%
)
RURALBRISBANEPERTHADELAIDEMELBOURNESYDNEYTOTAL
DEC-12
FEB-11
FEB-10
NOV-09
JUN-09
FEB-09
FEB-08
JUN-07
MAR-07
MAR-06 NOV-11
JAN-14
FEB-15
MAR-05
There are three main drivers that encourage recycling – awareness, access and value.
FIGURE 21. AWARENESS OF MOBILE PHONE RECYCLING PROGRAM IN AUSTRALIA - NATIONALLY AND BY STATE

34M
arket research result
FIGURE 19. AWARENESS OF MOBILE PHONE RECYCLING PROGRAM IN AUSTRALIA
0
20
40
60
80
100
PERC
ENTA
GE (%
)
RURALBRISBANEPERTHADELAIDEMELBOURNESYDNEYTOTAL
DEC-12
FEB-11
FEB-10
NOV-09
JUN-09
FEB-09
FEB-08
JUN-07
MAR-07
MAR-06 NOV-11
JAN-14
FEB-15
MAR-05
AWARENESS OF MOBILE PHONE RECYCLING AND HOW IT HAS CHANGED
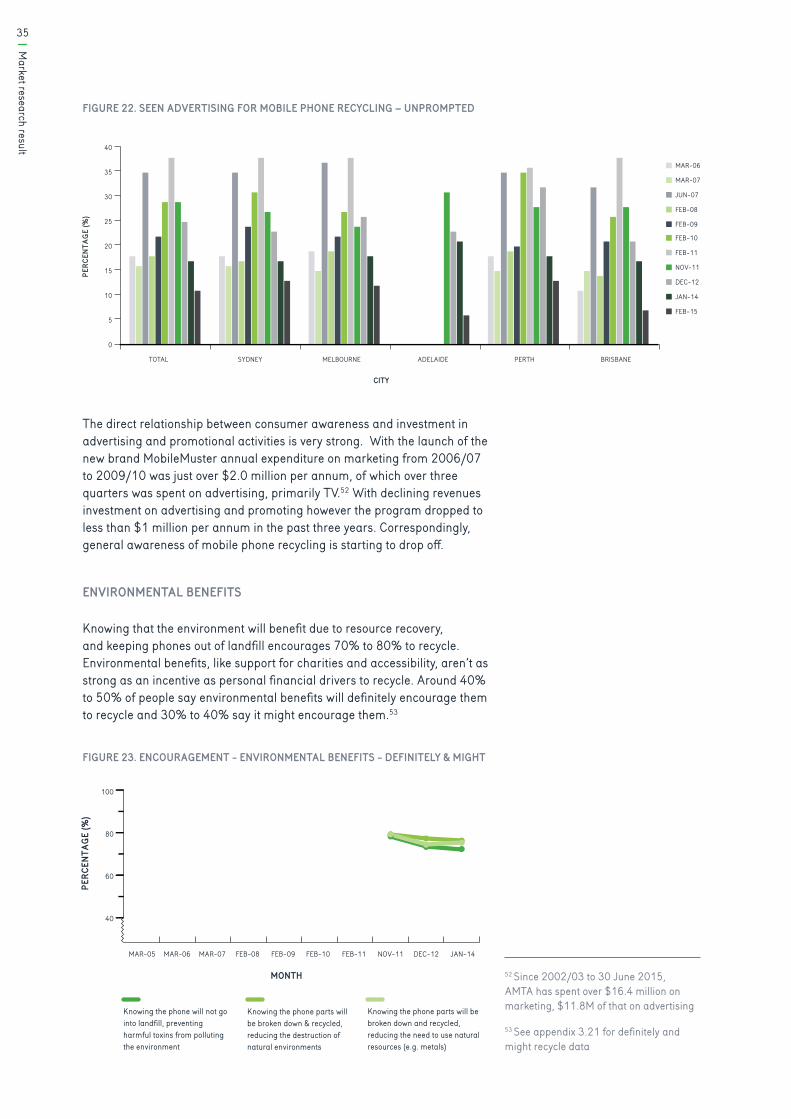
Awareness of a mobile phone recycling program in Australia has grown from 46% to 78%, peaking at 84% in February 2011. Awareness across the country does vary slightly with Adelaide, Sydney and Melbourne being more aware than Brisbane and Perth.51
This combined with additional advertising from new resellers like Mazuma and charity based programs like YouCan entering the market in 2010 significantly boosted awareness of mobile phone recycling generally in Australia (Figure 22).
51 See appendix 3.20 for raw data
FIGURE 18. ENCOURAGEMENT - AWARENESSPE
RCEN
TAGE
(%)
JAN-14 FEB-15DEC-12NOV-11FEB-11FEB-10FEB-09FEB-08MAR-07MAR-06MAR-05
MONTH
Receive an SMS message advising torecycle old phones
More promotion of recycling programs
Knowing where to find recycling bins
Asked to recycle my old phone bysales person of new phone
More phone recycling binsin phone stores
40
60
80
100
FIGURE 20. ENCOURAGEMENT - AWARENESS - DEFINITELY & MIGHT
35
Market research result
The direct relationship between consumer awareness and investment in advertising and promotional activities is very strong. With the launch of the new brand MobileMuster annual expenditure on marketing from 2006/07 to 2009/10 was just over $2.0 million per annum, of which over three quarters was spent on advertising, primarily TV.52 With declining revenues investment on advertising and promoting however the program dropped to less than $1 million per annum in the past three years. Correspondingly, general awareness of mobile phone recycling is starting to drop off.
ENVIRONMENTAL BENEFITS
Knowing that the environment will benefit due to resource recovery, and keeping phones out of landfill encourages 70% to 80% to recycle. Environmental benefits, like support for charities and accessibility, aren’t as strong as an incentive as personal financial drivers to recycle. Around 40% to 50% of people say environmental benefits will definitely encourage them to recycle and 30% to 40% say it might encourage them.53
FIGURE 20. SEEN ADVERTISING FOR MOBILE PHONE RECYCLING – UNPROMPTED
CITY
BRISBANEPERTHADELAIDEMELBOURNESYDNEYTOTAL
DEC-12
FEB-11
FEB-10
FEB-09
FEB-08
JUN-07
MAR-07
MAR-06
NOV-11
JAN-14
FEB-15
0
5
10
15
20
25
30
35
40
PERC
ENTA
GE (%
)
FIGURE 21. ENCOURAGEMENT - ENVIRONMENTAL BENEFITS
40
60
80
100
PERC
ENTA
GE (%
)
MONTH
JAN-14DEC-12NOV-11FEB-11FEB-10FEB-09FEB-08MAR-07MAR-06MAR-05
Knowing the phone will not go into landfill, preventing harmful toxins from polluting the environment
Knowing the phone parts will be broken down & recycled, reducing the destruction of natural environments
Knowing the phone parts will be broken down and recycled, reducing the need to use natural resources (e.g. metals)
CAN WE FOCUS ON THE THREE YEARS?
52 Since 2002/03 to 30 June 2015, AMTA has spent over $16.4 million on marketing, $11.8M of that on advertising
53 See appendix 3.21 for definitely and might recycle data
FIGURE 22. SEEN ADVERTISING FOR MOBILE PHONE RECYCLING – UNPROMPTED
FIGURE 23. ENCOURAGEMENT - ENVIRONMENTAL BENEFITS - DEFINITELY & MIGHT

36M
arket research result
ACCESS
Surveys show convenience is an important driver in encouraging recycling, with drop off points in supermarkets and Australia Post outlets or receiving a free recycling satchel when purchasing a new phone or being delivered at home were cited by consumers as having a similar level of encouragement.
Convenient access to recycling is not as strong as an incentive as a personal financial driver with only 50% dropping down to 35% saying convenience will definitely encourage them to recycle and 35% to 40% saying it might encourage them.54
FIGURE 22. ENCOURAGEMENT - ACCESS
PERC
ENTA
GE (%
)
MAR-15MAR-14MAR-13MAR-12MAR-11MAR-10MAR-09MAR-08MAR-07MAR-06MAR-05
MONTH
A local E-waste collection day
Pre-paid post satchel for free return
Receive a reply paid satchel with my new phone
Pre-paid satchels delivered to me at home
A recycling bin at Australia Post outlets
Free reply paid satchels (envelopes) that you can pick up at local supermarkets and then post
You can put your old mobile phones in your recycling bin at home
Local council to run a drop off day every 6 months
Recycle bins at local supermarket shopping centres
40
60
80
100
54 See appendix 3.22 for data
55 See appendix 3.22 for definitely and might raw data
AT WHAT LOCATIONS DO PEOPLE MOST WANT TO RECYCLE THEIR PHONES?
Convenience is essential to increasing the likelihood of recycling. The top locations that consumers have cited would encourage them to recycle continue to be supermarkets, Australia Post outlets and mobile phone retailers either by dropping off or getting a recycling satchel.55
FIGURE 24. ENCOURAGEMENT - ACCESS - DEFINITELY & MIGHT
37
Market research result
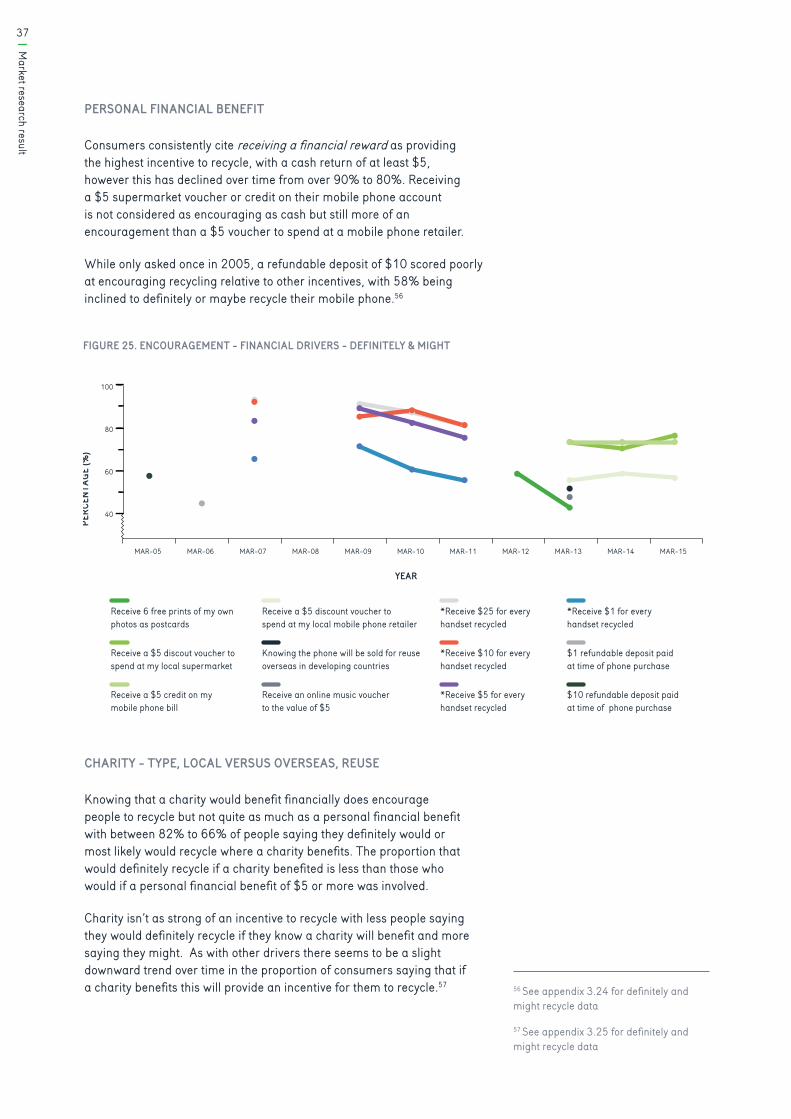
PERSONAL FINANCIAL BENEFIT
Consumers consistently cite receiving a financial reward as providing the highest incentive to recycle, with a cash return of at least $5, however this has declined over time from over 90% to 80%. Receiving a $5 supermarket voucher or credit on their mobile phone account is not considered as encouraging as cash but still more of an encouragement than a $5 voucher to spend at a mobile phone retailer.
While only asked once in 2005, a refundable deposit of $10 scored poorly at encouraging recycling relative to other incentives, with 58% being inclined to definitely or maybe recycle their mobile phone.56
56 See appendix 3.24 for definitely and might recycle data
57 See appendix 3.25 for definitely and might recycle data
FIGURE 23. ENCOURAGEMENT - FINANCIAL DRIVERS
PERC
ENTA
GE (%
)
MAR-15MAR-14MAR-13MAR-12MAR-11MAR-10MAR-09MAR-08MAR-07MAR-06MAR-05
YEAR
Receive an online music voucher to the value of $5
*Receive $25 for every handset recycled
*Receive $10 for every handset recycled
*Receive $5 for every handset recycled
*Receive $1 for everyhandset recycled
$1 refundable deposit paid at time of phone purchase
$10 refundable deposit paid at time of phone purchase
Receive 6 free prints of my own photos as postcards
Receive a $5 discout voucher to spend at my local supermarket
Receive a $5 credit on my mobile phone bill
Receive a $5 discount voucher to spend at my local mobile phone retailer
Knowing the phone will be sold for reuse overseas in developing countries
40
60
80
100
CHARITY - TYPE, LOCAL VERSUS OVERSEAS, REUSE
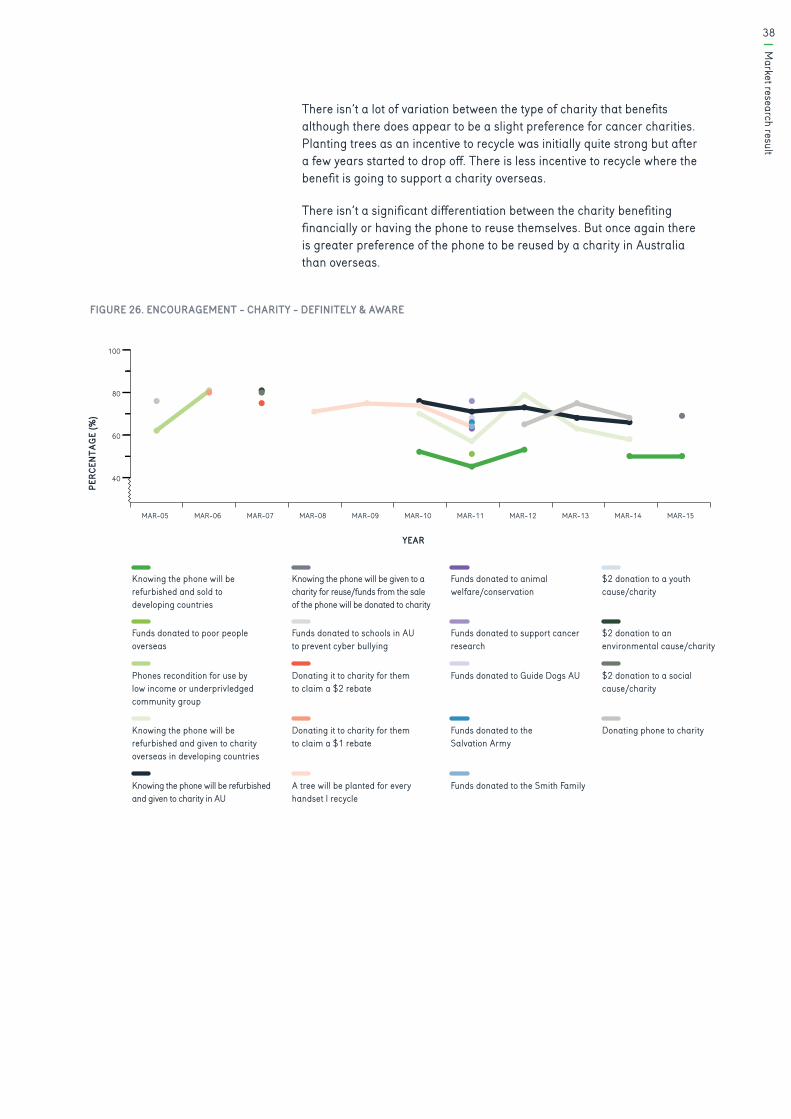
Knowing that a charity would benefit financially does encourage people to recycle but not quite as much as a personal financial benefit with between 82% to 66% of people saying they definitely would or most likely would recycle where a charity benefits. The proportion that would definitely recycle if a charity benefited is less than those who would if a personal financial benefit of $5 or more was involved.
Charity isn’t as strong of an incentive to recycle with less people saying they would definitely recycle if they know a charity will benefit and more saying they might. As with other drivers there seems to be a slight downward trend over time in the proportion of consumers saying that if a charity benefits this will provide an incentive for them to recycle.57
FIGURE 25. ENCOURAGEMENT - FINANCIAL DRIVERS - DEFINITELY & MIGHT
38M
arket research result
FIGURE 24. ENCOURAGEMENT - CHARITY
PERC
ENTA
GE (%
)
MAR-15MAR-14MAR-13MAR-12MAR-11MAR-10MAR-09MAR-08MAR-07MAR-06MAR-05
YEAR
Knowing the phone will be refurbished and sold to developing countries
Funds donated to poor people overseas
Phones recondition for use by low income or underprivledged community group
Knowing the phone will be refurbished and given to charity overseas in developing countries
Knowing the phone will be given to a charity for reuse/funds from the sale of the phone will be donated to charity
Funds donated to schools in AU to prevent cyber bullying
Donating it to charity for them to claim a $1 rebate
Funds donated to animal welfare/conservation
Funds donated to support cancer research
Funds donated to Guide Dogs AU
Funds donated to the Salvation Army
$2 donation to a youth cause/charity
$2 donation to an environmental cause/charity
$2 donation to a social cause/charity
Donating phone to charity
Knowing the phone will be refurbished and given to charity in AU
A tree will be planted for every handset I recycle
Funds donated to the Smith Family
Donating it to charity for them to claim a $2 rebate
40
60
80
100
There isn’t a lot of variation between the type of charity that benefits although there does appear to be a slight preference for cancer charities. Planting trees as an incentive to recycle was initially quite strong but after a few years started to drop off. There is less incentive to recycle where the benefit is going to support a charity overseas.
There isn’t a significant differentiation between the charity benefiting financially or having the phone to reuse themselves. But once again there is greater preference of the phone to be reused by a charity in Australia than overseas.
FIGURE 26. ENCOURAGEMENT - CHARITY - DEFINITELY & AWARE

39
Market research result
COLLECTIONS
COLLECTION NETWORK – DROP OFF OR POST IN
Access to recycling in terms of number, density per population, type and geographic spread has improved dramatically. The extent of the public drop off network has grown five-fold with now one public collection point for every 4,700 people, down from 26,300.
Consumers can now recycle their phones by either dropping them off at one of the 1,900 mobile phone retailers, 1,200 other retail outlets like Officeworks, Battery World and Salvo Stores, 1,500 local council sites or they by posting58 them in for free using a recycling satchel available at any of the 3,800 plus Australia Post outlets or downloading a mailing label from the MobileMuster website.
There has also been substantial growth and diversification in the private collection network expanding from just service/repair centres and distributors to now also include workplaces, schools and second hand dealers of mobile phones (i.e. who refurbish and sell phones either locally or off shore).
58 Reply paid satchels were introduced in 2008 and are now available to the public either at over 3,800 Australian Post outlet or included with a new phone by many of MobileMuster’s manufacturer members
FIGURE 25. COLLECTIONS BY CHANNEL
PERC
ENTA
GE (%
)
YEAR
2014/152013/142012/132011/122010/112009/102008/092007/082006/072005/062004/05
0
10
20
30
40
50
60
70
80
90
100 MOBILE PHONE RETAILER
REPLY PAID
OTHER RETAILER
SERVICE CENTRE
COUNCIL & KERBSIDE
GOVERNMENT
CORPORATE & NFP & EDUCATION
RESELLER REFURBISHER & RECYCLER
MANUFACTURER
MOBILE PHONE REPAIR SHOPS
DISTRIBUTORS
CARRIER
SCHOOL
COLLECTIONS BY CHANNELS
As expected with the diversification of the collection channels we have seen a shift in collections with a third of collections now coming through the post back option. Less product comes through service centres and more through other retailers.
FIGURE 27. COLLECTIONS BY CHANNEL
(VIC, TAS, SA, WA, NT Stores Only)
DROP OFF
POST IN

40M
arket research result
VOLUMES AND TYPE OF MATERIALS COLLECTED
Since the program started in late 1998, MobileMuster has diverted more than 1,168 tonnes of mobile phones and their accessories from landfill, including an estimated 9.95 million handsets (3.89m) and batteries (6.01m).59
Specifically, over the past decade annual collections have grown from 42 tonne to 74 tonne in 2014/15, peaking at 122 tonne in 2008/09. The annual collection rate of available phones has grown from 14% to 53.1%, peaking at 53.2% in 2012/13 and the annual net import collection rate has increased from 4.2% to 9.0%, peaking at 9.9% in 2011/12.
59 See appendix 3.26 for raw data
60 Nickel cadmium batteries average weight 120 gram, lithium ion average weight 27grams, see appendix 25 for raw data
61 See appendix 3.27 for raw data
FIGURE 26. TOTAL WEIGHT COLLECTED
TONN
ES
YEAR
2013/142012/132011/122010/112009/102008/092007/082006/072005/062004/052003/042002/032001/022000/011998/001998/99
0
20
40
60
80
120
100
140
Over time the mix of components by weight has changed from a predominance of batteries and accessories to handsets and accessories. This in part is due to manufacturers replacing two NiCad batteries with one Lithium Ion batteries that are lighter and last longer and weigh a quarter the weight of a Nickel Cadmium battery.60
In the past five years there has also been a gradual decline in the volume of accessories received. This can be attributed to both harmonising of chargers across models to a USB plug, the decreasing size and weight of chargers and in some cases chargers no longer being sold with handsets.61
FIGURE 28. TOTAL WEIGHT COLLECTED
MobileMuster has diverted more than 1,168 tonnes of mobile phones and their accessories from landfill.
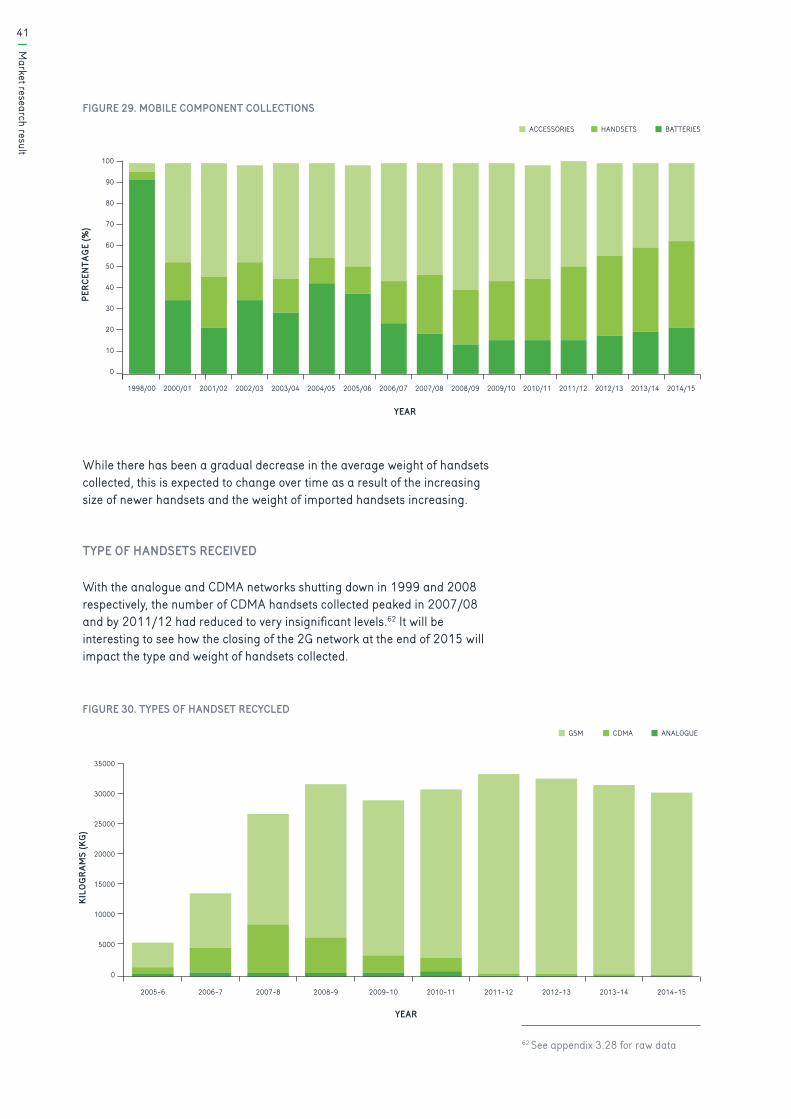
41
Market research result
FIGURE 27. MOBILE COMPONENT COLLECTIONS
PERC
ENTA
GE (%
)
YEAR
BATTERIESHANDSETS ACCESSORIES
2014/152013/142012/132011/122010/112009/102008/092007/082006/072005/062004/052003/042002/032001/022000/011998/00
0
10
20
30
40
50
60
70
80
90
100
While there has been a gradual decrease in the average weight of handsets collected, this is expected to change over time as a result of the increasing size of newer handsets and the weight of imported handsets increasing.
TYPE OF HANDSETS RECEIVED
With the analogue and CDMA networks shutting down in 1999 and 2008 respectively, the number of CDMA handsets collected peaked in 2007/08 and by 2011/12 had reduced to very insignificant levels.62 It will be interesting to see how the closing of the 2G network at the end of 2015 will impact the type and weight of handsets collected.
62 See appendix 3.28 for raw data
FIGURE 29. MOBILE COMPONENT COLLECTIONS
FIGURE 30. TYPES OF HANDSET RECYCLED
FIGURE 28. TYPES OF HANDSETS RECYCLED
KILO
GRAM
S (K
G)
YEAR
ANALOGUECDMA GSM
0
5000
10000
15000
20000
25000
30000
35000
2014-152013-142012-132011-122010-112009-102008-92007-82006-72005-6
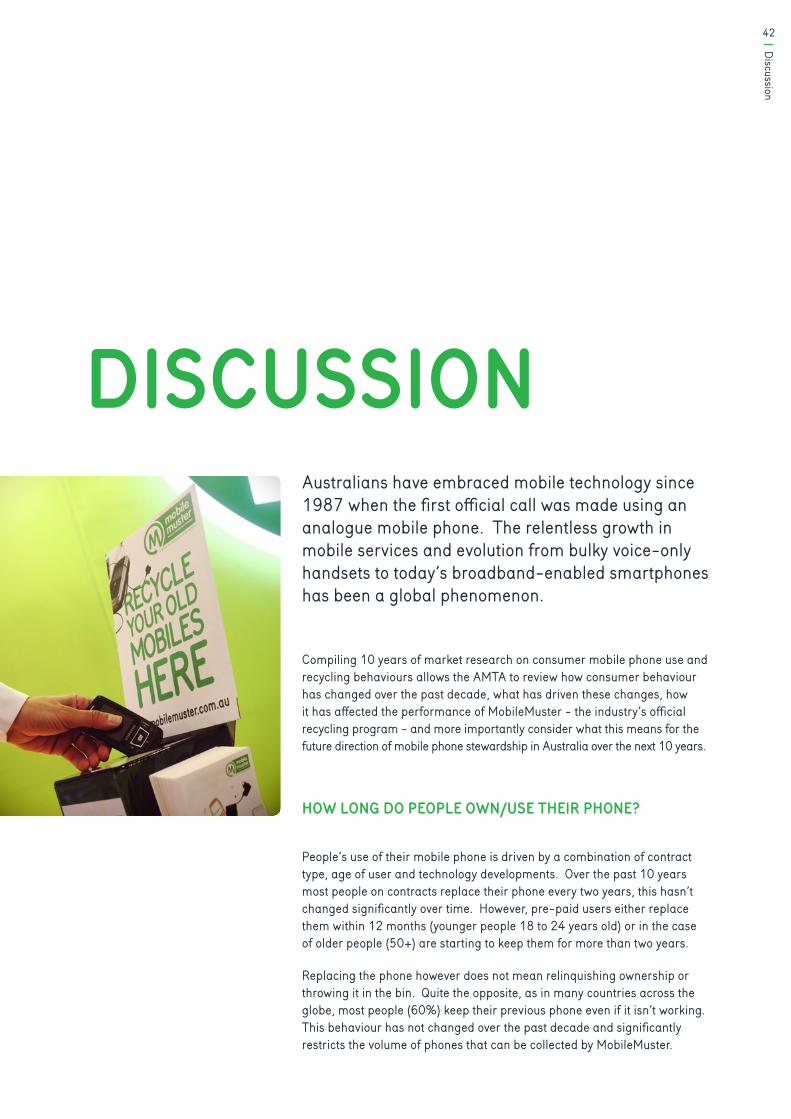
42Discussion
Australians have embraced mobile technology since 1987 when the first official call was made using an analogue mobile phone. The relentless growth in mobile services and evolution from bulky voice-only handsets to today’s broadband-enabled smartphones has been a global phenomenon.
Compiling 10 years of market research on consumer mobile phone use and recycling behaviours allows the AMTA to review how consumer behaviour has changed over the past decade, what has driven these changes, how it has affected the performance of MobileMuster - the industry’s official recycling program - and more importantly consider what this means for the future direction of mobile phone stewardship in Australia over the next 10 years.
HOW LONG DO PEOPLE OWN/USE THEIR PHONE?
People’s use of their mobile phone is driven by a combination of contract type, age of user and technology developments. Over the past 10 years most people on contracts replace their phone every two years, this hasn’t changed significantly over time. However, pre-paid users either replace them within 12 months (younger people 18 to 24 years old) or in the case of older people (50+) are starting to keep them for more than two years.
Replacing the phone however does not mean relinquishing ownership or throwing it in the bin. Quite the opposite, as in many countries across the globe, most people (60%) keep their previous phone even if it isn’t working. This behaviour has not changed over the past decade and significantly restricts the volume of phones that can be collected by MobileMuster.
DISCUSSION
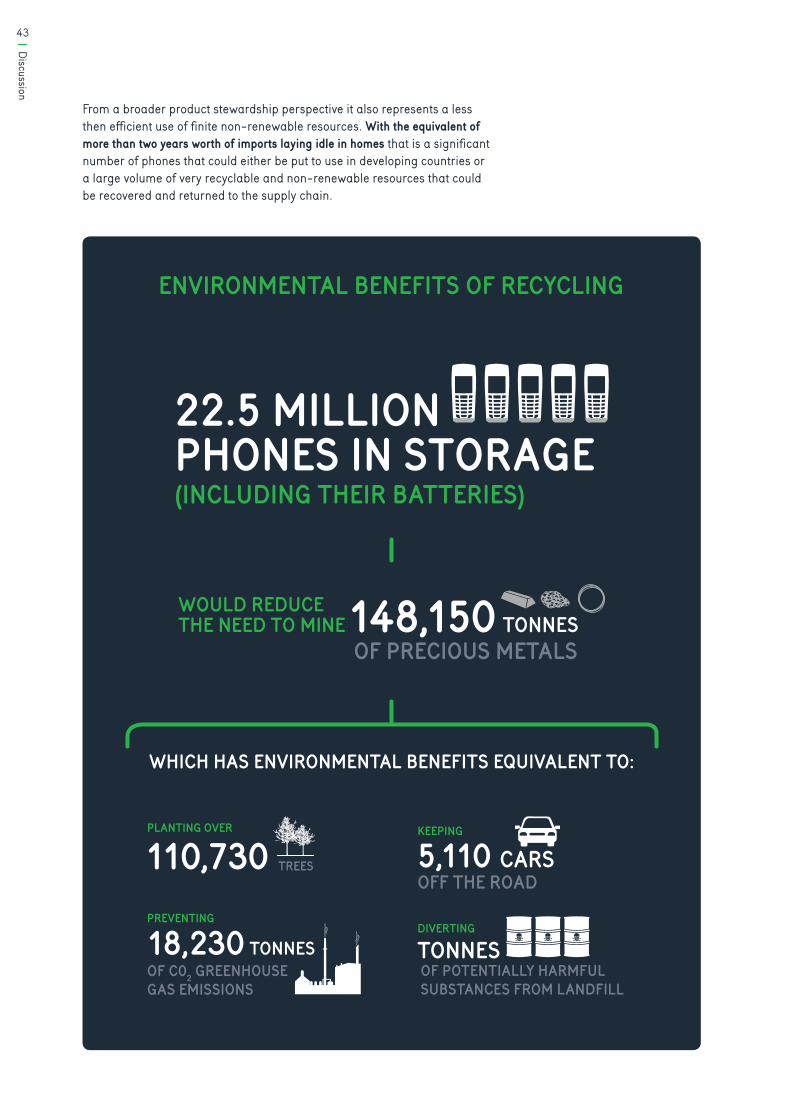
43
Discussion
From a broader product stewardship perspective it also represents a less then efficient use of finite non-renewable resources. With the equivalent of more than two years worth of imports laying idle in homes that is a significant number of phones that could either be put to use in developing countries or a large volume of very recyclable and non-renewable resources that could be recovered and returned to the supply chain.
WOULD REDUCE THE NEED TO MINE
OF PRECIOUS METALS148,150 TONNES
WHICH HAS ENVIRONMENTAL BENEFITS EQUIVALENT TO:
TREES
PLANTING OVER
110,730PREVENTING
18,230 TONNESOF C02 GREENHOUSE GAS EMISSIONS
DIVERTING
TONNESOF POTENTIALLY HARMFUL SUBSTANCES FROM LANDFILL
KEEPING
5,110 CARSOFF THE ROAD
22.5 MILLION PHONES IN STORAGE (INCLUDING THEIR BATTERIES)
ENVIRONMENTAL BENEFITS OF RECYCLING

44Discussion
Taking a circular approach to resource use there is a clear imbalance between mobile use and recovery of mobiles for reuse and recycling.
To ensure non-renewable resources used in mobile phones are used more efficiently and sustainably the industry needs to either; increase the volume of phones collected for recycling and reuse and/or increase the product life span to reduce the rate of consumption.
This is possible but will require a significant change in consumers hoarding behaviours through education and incentives, technical innovations to improve the product’s durability, data security and upgradability (e.g. Fairphone) and novel contractual arrangements such as leasing (i.e. Telstra’s New Phone Feeling or similar plans offered by carriers in the United States and more recently by Apple).
WHY DO PEOPLE REPLACE THEIR PHONE?
Poor functional performance63 has been the primary reason for replacing a phone for many years. However, when there is a significant change or improvement in technology, as in the case of the smartphone, a very strong desire for the latest technology becomes the overwhelming driver for consumers. This has been the case in Australia from 2010 to 2014 with the release of the iPhone 4 in July 2010 where imports peaked at 13.3 million in 2010/11.
As the rate of technology change slows however, so do a consumer’s reasons for replacing their phone. Seeking the latest technology is now no longer the primary reason for buying a new phone. Similarly more people are starting to keep their current phone for two or more years.
It is not clear whether this is a reflection of a saturated market where there is an emerging consumer desire for longer life products that can be more easily repaired and upgraded or simply a reflection of the cycle of technological advancement.
WHAT ARE THE IMPACTS OF STORING PHONES?
Like in many developed64 countries the number of mobile phones in storage has grown over the past 10 years in Australia to a point in 2014 where there were as many phones in storage as there are people in Australia. However, for the first time in 10 years the number of phones in storage in 2015 dropped by more than half a million to 22.5 million, as did the percentage of people with two or more phones in storage.65
While there has been no significant change in the proportion of people who keep their old phone over the past decade, there have been changes in what consumers do with those phones they don’t keep. Specifically, less people throw them out in the rubbish now, more people are recycling them, and more people are starting to trade and resell their phones.
63 Phone deteriorating/not working
64 Green Alliance (2005)
65 See appendix 3.12
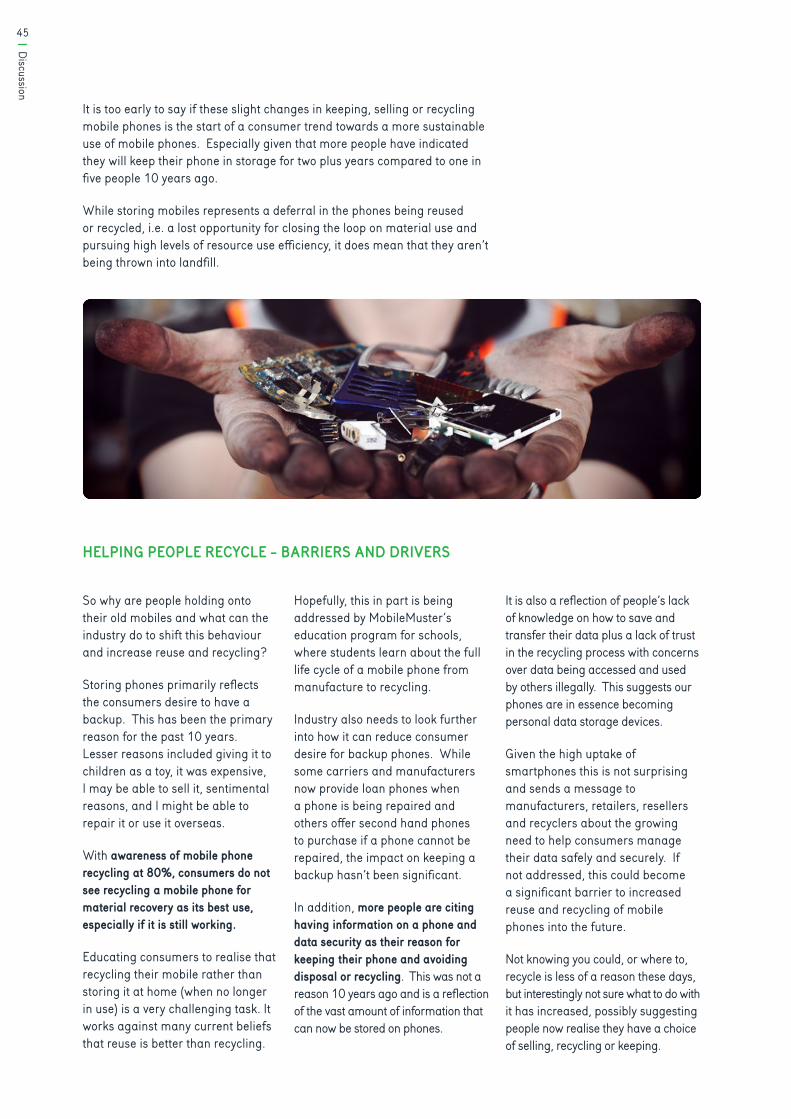
45
Discussion
It is too early to say if these slight changes in keeping, selling or recycling mobile phones is the start of a consumer trend towards a more sustainable use of mobile phones. Especially given that more people have indicated they will keep their phone in storage for two plus years compared to one in five people 10 years ago.
While storing mobiles represents a deferral in the phones being reused or recycled, i.e. a lost opportunity for closing the loop on material use and pursuing high levels of resource use efficiency, it does mean that they aren’t being thrown into landfill.
HELPING PEOPLE RECYCLE - BARRIERS AND DRIVERS
So why are people holding onto their old mobiles and what can the industry do to shift this behaviour and increase reuse and recycling?
Storing phones primarily reflects the consumers desire to have a backup. This has been the primary reason for the past 10 years. Lesser reasons included giving it to children as a toy, it was expensive, I may be able to sell it, sentimental reasons, and I might be able to repair it or use it overseas.
With awareness of mobile phone recycling at 80%, consumers do not see recycling a mobile phone for material recovery as its best use, especially if it is still working.
Educating consumers to realise that recycling their mobile rather than storing it at home (when no longer in use) is a very challenging task. It works against many current beliefs that reuse is better than recycling.
Hopefully, this in part is being addressed by MobileMuster’s education program for schools, where students learn about the full life cycle of a mobile phone from manufacture to recycling.
Industry also needs to look further into how it can reduce consumer desire for backup phones. While some carriers and manufacturers now provide loan phones when a phone is being repaired and others offer second hand phones to purchase if a phone cannot be repaired, the impact on keeping a backup hasn’t been significant.
In addition, more people are citing having information on a phone and data security as their reason for keeping their phone and avoiding disposal or recycling. This was not a reason 10 years ago and is a reflection of the vast amount of information that can now be stored on phones.
It is also a reflection of people’s lack of knowledge on how to save and transfer their data plus a lack of trust in the recycling process with concerns over data being accessed and used by others illegally. This suggests our phones are in essence becoming personal data storage devices.
Given the high uptake of smartphones this is not surprising and sends a message to manufacturers, retailers, resellers and recyclers about the growing need to help consumers manage their data safely and securely. If not addressed, this could become a significant barrier to increased reuse and recycling of mobile phones into the future.
Not knowing you could, or where to, recycle is less of a reason these days, but interestingly not sure what to do with it has increased, possibly suggesting people now realise they have a choice of selling, recycling or keeping.

46Discussion
ENCOURAGING PEOPLE TO RECYCLE
In terms of what encourages people to recycle, the three main drivers have remained the same for the past 10 years.
66 https://www.starship.org.nz/foundation/fundraising/mobile-phone-appeal/
VALUE - THE ROLE OF INCENTIVES
People clearly value their phones and a cash incentive remains the strongest driver in encouraging people to recycle. This trend is illustrated by the steady growth in the online cash for phones market over the past five years and the gradual increase in the number of people who are selling their phones.
While community benefit encourages people to recycle as demonstrated by many of MobileMuster’s ‘old phones for good’ campaigns, it is not as strong as a personal cash return and seems to becoming a weaker incentive over time.
Feedback received from Australian charities suggests the quality and type of phones received are of lower value and that the proportion of phones received for resale appear to be dropping. This in part could be due to the fact that people can sell their phones more easily now.
There is a similar example in New Zealand, where the Starship Foundation has decided after six years of raising funds through turning old unwanted phones into valuable funds that this is no longer an effective way to raise money for the foundation.
The reason given by the Foundation for making this decision was that their recent experience suggests people are holding onto new smartphones for longer, selling them or passing them on to family and friends and that the supply and value of phones for the Foundation to resell and raise funds has diminished over time.66
While the increased growth in selling and trading mobiles phones is positive in driving greater reuse of newer phones, it would appear that pure altruistic or ecological drivers alone, are increasingly ineffective in driving collections for recycling and that the value of the material in phones is still not sufficient enough to pay consumers what they expect to recycle their phones.
This gap in consumer expectation and what industry is prepared to fund is a significant challenge. Perhaps it is time for the industry to consider more novel ways to fund the collection and recycling of phones, such as introducing a consumer levy on the sale of each handset which would be used to fund consumer financial rewards rated highly by consumers in this research such as, credit on mobile phone credit or vouchers at supermarkets.
(personal or community benefit) (why, where and how) (convenience)VALUE AWARENESS ACCESS

47
Discussion
AWARENESS - THE ROLE OF MARKETING
It is clear that effective advertising and promotions has a direct impact on awareness and engagement of consumers and that if promotions are not maintained to a certain level awareness and collections will drop.
As evident of the past three years of MobileMuster where reduced marketing expenditure has seen a reduction in awareness and drop in collections. In particular knowing where, why and how to recycle remain important drivers to encourage recycling.
With most people citing that purchasing a new phone was the event that prompted them to recycle it is crucial retailers consistently remind customers around the time of purchase why, where and how they can recycle or reuse their old phones to maximise collection and recycling rates of unwanted or redundant phones.
Manufacturers are also optimally placed to positively intervene through increased and timely consumer communications to raise awareness and engagement.
ACCESS - THE ROLE OF COLLECTION NETWORKS
In terms of access with more than 4,800 public drop off points and a free post back option using either a recycling satchel or downloading a label from the MobileMuster website, it could be argued the public have very good access.
But is this most preferred and cost effective collection network? Can people recycle their phones from the places they buy them? From the market research people say they are most likely to recycle at the local supermarket and Australia Post stores, i.e. places that are visited frequently.
While all major mobile phone retailers host collection points and assist in encouraging their customers to recycle in store, Australia Post has elected to distribute free recycling satchels to customers rather than host collection points.
On the other hand, local supermarkets, who also retail mobile phones have been very be reluctant to host collection points or offer satchels to customers, even though many of their overseas counterparts, like Tesco’s for example, offer mobile phone recycling to their customers.
While Australian supermarkets have been active players on some environmental measures such as packaging and energy efficiency, the breadth of initiatives related to phone recycling and handheld batteries is embryonic at best.
Collecting phones at local council drop off days or with TVs and computers is least preferred. The possibility however of recycling mobile phones along with batteries, globes or other small electronics, as in the case of the City of Sydney offering integrated collection units located in libraries, improve convenience.

48Conclusion
There have been some significant shifts in behaviour over the past ten years. More people are aware of how, why and where to recycle with awareness of mobile phone recycling growing from 46% to 79%. More people are recycling with collections increasing from 42 tonne per annum to 74 tonne in 2014-15, peaking at 122 tonne in 2008/09 and the annual available collection rate growing from 14.1% to 53.1% peaking at 53.2% in 2012-13.
Less people are disposing their phones into landfill, decreasing from 9% to 2%. Similarly, with the recent growth of online cash for phone and trade-in programs, more people are selling or trading in their phones as a way of recovering some financial return, up to 6%.
Consumer desire however to keep old phones remains unchanged (60% even if not working). As a result the number of unused phones stored away in homes has grown from 12 million to over 22.5 million in the past decade. This equates to nearly one phone for every person in Australia.
Storing of phones represents a significant loss of resources, creating an unsustainable balance between the rate of consumption and the rate of reuse and recycling, with substantially more mobiles sitting dormant in homes rather than being reused or responsibly recycled.
Financial incentives, awareness and access continue to be the three main drivers which encourage people to recycle, with personal financial rewards continuing to be the primary motivation. While MobileMuster has raised awareness and made recycling widespread and very accessible, altruistic incentives appear to becoming less of a driver in recent years as a way of encouraging people to recycle their old phones.
CONCLUSION

49
Conclusion
Certain social themes and factors are also relevant within the context of personal motivation and key drivers where it appears from the research that there are essentially four recycling personality types:
Technological developments have had both positive and negative impacts on mobile phone recycling in Australia. They have driven rapid consumption of resources as functionality is enhanced (e.g. introduction of the smartphone) and made past technology redundant as networks are upgraded (e.g. CDMA). They have also improved resource efficiency through miniaturisation, dematerialisation and use of recycled content. Advances in product design and production methods have also reduced specific types of environmental impacts through the elimination or minimisation of hazardous
substances. The avoidance of conflict minerals has also been a noteworthy achievement.
The research data also points towards several implications and opportunities for the future of mobile phone stewardship in Australia.
The storage of old mobile phones is still a significant issue, representing a lost opportunity for reuse and recycling. There are compelling reasons for industry to look more closely at how it can change or adjust consumer desire to keep a phone as a back-up by:
• Improving the product’s durability and upgradability
• Streamlining repair and replacement of damaged phones
• Making data management and security a simple yet robust process
• Offering innovative and attractive contracts that encourage the return of mobiles (i.e. 1 in 1 out, trade-in, leasing, product-service ownership initiatives)
• Explore novel ways to fund the collection and recycling of phones (e.g. a consumer levy on the sale of each handset to fund financial incentives).
THOSE THAT WILL RECYCLE AS SOON AS THEY KNOW WHY, WHERE AND HOW
THOSE THAT NEED A REMINDER AND AN ADDITIONAL REASON TO RECYCLE such as seeing something or someone benefiting from the phone being recycled – e.g. cash to a charity, planting trees, or being reused by people in need
THOSE THAT WANT A FINANCIAL REWARD some may be happy with a voucher or discount on their mobile phone bill, others want cash
THOSE THAT WILL NEVER RECYCLE fortunately this represents less than 5% of respondents

50Conclusion
The potential for significant environmental advances across the mobile phone life cycle will start to emerge when greater focus is applied to monetising functionality and ‘service’ as opposed to just purchasing a manufactured item.
Greater engagement and coordination of activities and reporting by all players of the mobile phone lifecycle is also required to improve consumer awareness and access to recycling. From manufacturers, network carriers, retailers and service centres/repairers, through to second-hand traders and recyclers, including:
Continuing research to monitor changes in consumer mobile phone use, recycling, storage, reuse and the extent of phones available for recycling is required. The market research to date has been a particularly useful tool in guiding the program’s marketing activities and the development of its collection network. It has also provided deeper insights into the triggers and motivations behind Australian consumers, and why they choose to participate in recycling programs.
This will ensure that the program adapts to ever-changing use and disposal patterns as well as the need to accurately monitor the effectiveness of program activities on consumer behaviour and the associated impacts of technology and markets.
NON-PARTICIPATING MANUFACTURERS/DISTRIBUTORS
e.g. Apple, Sony Mobile, LG, Blackberry, ALDI and Oppo to promote and offer recycling as well as publicly reporting on collections and recycling processes
SECOND-HAND TRADERS
e.g. Mazuma Mobile, Cash A Phone, PhoneCycle, eBay, GumTree, Cash Converters, Boomerang and Bounce to ensure product not sold is recycled responsibly and contribute to recycling schemes in markets where second hand product is sold
NON-PARTICIPATING RETAILERS
e.g. Coles, Woolworths, Harvey Normans, Kogan, eBay, and other mass retailers who sell mobiles - to include consumer messaging on recycling, as well as offering a free collection service or providing post back alternatives
RECYCLERS
e.g.MRI, PGM, Sims to ensure that all mobiles and accessories are recycled responsibly and report publicly on volumes processed and material recovery rates
SERVICE CENTRE/REPAIRERS
to ensure that all mobiles and accessories that cannot be repaired are recycled as well as encouraging customers to recycle

51
References
REFERENCESAustralian Mobile Telecommunication Association (AMTA) 2005 Australian Mobile Telecommunications industry: Economic Significance - The Allen Consulting Group.
ACMA, December 2014, Communications report 2013–14.
Credit Suisse First Boston, 2005, Australian Telecommunications 2005, Equity Research.
Gertsakis, J. Facilitating EcoDesign and Product Stewardship in Australia. Masters Thesis, RMIT University, Melbourne 2003.
Green Alliance, 2015, A circular economy for smart devices. Opportunities in the US, UK and India.
International Data Corporation (IDC), 2005, No Strings Attached: Australian Cellular Forecast and Analysis, 2004-2009.
Fear, J., 2008, Stuff happens: Unused things cluttering up our homes, The Australia Institute, viewed 16 July 2015, http://apo.org.au/node/603.
Tanskanen, Pia, 2009, Electronics Waste: Recycling of Mobile Phones.
Randy O. Frost, Veselina Hristova, Gail Steketee, David F. Tolin, 2013, Activities of daily living scale in hoarding disorder, Journal of Obsessive-Compulsive and Related Disorders, Volume 2, Issue 2, Pages 85-90.
Telstra/Nielsen, 2014, Cross-platform Consumers: Media Multitasking and Multi Screening in Today’s Mobile Landscapte, Whitepaper.

52Appendices
APPENDICES1.0 Key performance indicators
2014/15 to 2018/19 53
2.0 Market research survey timeline 54
3.0 Market research raw data 553.1 Shipments, imports, exports,
market share 553.2 How many mobile phones
have you ever owned? 553.3 Number of phones in
current use 56
3.4 How long would you expect to use your new phone for? 56
3.5 Length of ownership by plan type 56
3.6 Reason for obtaining current phone 57
3.7 Brand of current mobile phone 573.8 Where are people buying
their phones from? 573.9 When do people buy /
receive their new phone? 57
3.10 What happened to your previous mobile phone? 58
3.11 What are you planning to do with your current phone when you get a new one? 58
3.12 Number of phones not in current use 58
3.13 Number of phones in Australian Households 59
3.14 If storing how long do you expect to keep your phone for? 59
3.15 Why are you not recycling the old phone that you kept? 60
3.16 Why does the information on your unused phone stop you from recycling it? 60
3.17 How likely are you to recycle your mobile phone? 60
3.18 Have you ever recycled any part of an old mobile phone? 61
3.19 How much awareness encourages recycling 61
3.20 Awareness of mobile phone recycling 61
3.21 How much environmental benefits encourage recycling 62
3.22 How much access encourages recycling 62
3.23 Likelihood to recycle at the following outlets 63
3.24 How much personal financial incentives encourage recycling 63
3.25 How much charity benefits encourage recycling 64
3.26 Estimated number of batteries and handsets received 65
3.27 Battery and component percentages and weights being recycled 65
3.28 Types of handsets recycled by weight (kg) 66
Page PagePage

53
Appendices
APPENDIX 1.0: KEY PERFORMANCE INDICATORS
KEY PERFORMANCE INDICATORS 2014/15Est’d
2015/16Est’d
2016/17Est’d
2017/18Est’d
2018/19Est’d
COLLECTIONSMobile Phone Collections (weight - tonnes) 100 106 113 120 127
Annual Collection Rate, Available Phones (%) 51% 52% 53% 54% 55%
Annual Collection Rate, Net imports (%) 10.20% 10.40% 10.60% 10.80% 11.00%
RECYCLINGDiversion from Landfill 97% 97% 97% 97% 97%
Recycling Rate (estimated material recovered) 96% 96% 96% 96% 96%
CONSUMER BEHAVIOUR Personal Storage Rate (% users with 2 or more handsets at home)
37% 37% 37% 37% 37%
Disposal to Landfill Rate 2% 2% 2% 2% 2%
Awareness of Mobile Phone Recycling >80% >80% >80% >80% >80%
INDUSTRY PARTICIPATIONManufacturers 56% 56% 56% 56% 56%
Mobile Network Carriers 91% 91% 91% 91% 91%
54Appendices
APPENDIX 2.0: MARKET RESEARCH SURVEY TIMELINE
• March 2005 – Consumer (900, age 15+ ) and business (200) telephone interviews and 20 stakeholder face-to-face interviews conducted by The Klien Partnership Demographically representative of population, 87% owned mobiles 13% didn’t own mobiles
• March 2006 – online consumer (n=650, 16-64 years) survey by IPSOS – Syd, Melb, Adel, Perth, 100% owned mobiles
• March 2007 – online consumer (n=665. 16-64 years) survey by IPSOS – Syd, Melb, Adel, Perth , 100% owned mobiles
• July 2007 - online consumer (n=658, 16-64 years) survey by IPSOS – Syd, Melb, Adel, Perth , 100% owned mobiles
• February 2008 - online consumer (n=670, 16-64 years) survey by IPSOS – Syd, Melb, Adel, Perth. , 100% owned mobiles
• June 2008 – online consumer survey (n=704, 18-64 years) Newspoll Sydney, Melbourne, Brisbane, Adelaide and Perth , 100% owned mobiles, Assessing the effectiveness Old phones for Trees advertisement on driving behaviour
• November 2008 – online consumers survey (N=1048, 18+) Omnibus, IPSOS Assessing the effectiveness of advertising campaign on driving behaviour
• February 2009 – online consumer (n=665, 16-64 years) survey by IPSOS. Syd, Melb, Adel, Perth , 100% owned mobiles
• June 2009 – online consumers survey (N=1045 18+) Omnibus, IPSOS Assessing the effectiveness of “Old phones more trees” advertising campaign on driving behaviour
• November 2009 – online consumers survey (N=1045 18+) Omnibus, IPSOS Assessing the effectiveness of “Dive In” advertising campaign on driving behaviour and looking at value and age of mobiles in storage
• February 2010 – online consumer (n=680, 16-64 years) survey by IPSOS. Syd, Melb, Adel, Perth , 100% owned mobiles
• February 2011 - online consumer (n=679, 16-64 years) survey by IPSOS. Syd, Melb, Adel, Perth , 100% owned mobiles
• November 2011 - online consumer (n=1000, 16+, nationally representative sample – metro and regional) survey by IPSOS. Due to a need to profile those who are aware of mobile recycling and those who are not, a change to a more nationally representative sample was necessary. Any major changes in the data were looked at filtered by the previous sample specs to ensure changes were real and not as a result of altered sample definition.
• December 2012 - online consumer (n=1027, 16+, nationally representative sample – metro and regional) survey by IPSOS.
• January 2014 - online consumer (n=1029, 16+, nationally representative sample – metro and regional) survey by IPSOS.
• February 2015 - online consumer (n=1050, 16+, nationally representative sample – metro and regional) survey by IPSOS.

55
Appendices
APPENDIX 3.0: MARKET RESEARCH RAW DATA
3.1 SHIPMENTS, IMPORTS, EXPORTS, MARKET SHARE
Year Shipments Imports ExportsMember market shares
1998/99 3,907,832
1999/00 4,288,786
2000/01 3,822,544
2001/02 4,900,000
2002/03 4,977,613
2003/04 7,122,832
2004/05 7,827,531
2005/06 8,406,642 9,525,714 1,175,045 88%
2006/07 8,679,094 10,231,520 1,239,540 85%
2007/08 9,675,482 11,495,358 1,050,141 84%
2008/09 9,026,572 11,148,806 1,437,921 81%
2009/10 8,664,111 11,992,400 1,432,945 72%
2010/11 8,703,384 13,348,294 2,276,995 65%
2011/12 7,796,532 12,784,881 1,844,143 61%
2012/13 6,667,937 11,971,921 1,788,383 56%
2013/14 6,204,913 11,225,341 2,022,293 55%
2014/15v 5,564,751 12,265,096 1,484,431 45%
TOTAL 05-15 79,389,418 115,989,331 15,751,837
Date One Two Three 4 Or more
Mar-05 26.0% 24.0% 21.0% 29.0%
Mar-06 7.0% 19.0% 26.0% 48.0%
Mar-07 8.0% 16.0% 25.0% 51.0%
Jun-07 6.0% 18.0% 24.0% 52.0%
Feb-08 7.0% 19.0% 26.0% 48.0%
Feb-09 11.0% 17.0% 24.0% 49.0%
Feb-10 8.0% 17.0% 21.0% 54.0%
Feb-11 7.0% 14.0%4 23.0% 56.0%
Nov-11 8.0% 14.0% 22.0% 57.0%
Dec-12 8.0% 16.0% 20.0% 57.0%
Jan-14 6.0% 16.0% 20.0% 58.0%
Feb-15 6.0% 14.0% 23.0% 57.0%
3.2 HOW MANY MOBILE PHONES HAVE YOU EVER OWNED?

56Appendices
Date One Two Three 4 Or more
Feb-08 79.0% 17.0% 3.0% 1.0%
Feb-09 77.0% 19.0% 4.0% 1.0%
Feb-10 77.0% 19.0% 3.0% 1.0%
Feb-11 78.0% 18.0% 3.0% 2.0%
Nov-11 76.0% 18.0% 3.0% 1.0%
Dec-12 79.0% 18.0% 2.0% 1.0%
Jan-14 80.0% 17.0% 2.0% 0.0%
Feb-15 79.0% 18.0% 2.0% 1.0%
3.3 NUMBER OF PHONES IN CURRENT USE
DateUnder 6 months 6 - 11 Months
12 - 18 Months
19 - 24 Months 2+ Years Don’t know
Mar-06 0.6% 3.5% 25.5% 25.8% 40.7% 3.8%
Mar-07 0.2% 3.8% 21.8% 28.0% 42.6% 3.7%
Jun-07 0.4% 3.1% 18.2% 26.5% 46.9% 4.9%
Feb-08 0.0% 2.0% 17.0% 21.0% 54.0% 7.0%
Feb-09 1.0% 3.0% 16.0% 21.0% 51.0% 7.0%
Feb-10 1.0% 4.0% 15.0% 29.0% 44.0% 7.0%
Feb-11 0.0% 3.0% 16.0% 27.0% 47.0% 7.0%
Nov-11 1.0% 3.0% 15.0% 24.0% 51.0% 6.0%
Dec-12 1.0% 3.0% 11.0% 24.0% 54.0% 7.0%
Jan-14 0.0% 2.0% 10.0% 23.0% 57.0% 8.0%
Feb-15 1.0% 3.0% 11.0% 25.0% 55.0% 4.0%
3.4 HOW LONG WOULD YOU EXPECT TO USE YOUR NEW PHONE FOR?
Date Under 6 months 6 - 11 months 12 - 18 months 19 - 24 months 2+ years Don’t know
Mar-05 6.0% 8.0% 17.0% 8.0% 60% 2.0%
Nov-11 3.0% 8.0% 20.0% 21.0% 46.0% 2.0%
Dec-12 3.0% 5.0% 18.0% 22.0% 50.0% 2.0%
Jan-14 2.0% 5.0% 14.0% 23.0% 52.0% 3.0%
Feb-15 3.0% 5.0% 16.0% 24.0% 51.0% 2.0%
Average 1 2.8% 5.8% 17.0% 22.5% 49.8% 2.3%
3.5 LENGTH OF OWNERSHIP BY PLAN TYPE

57
Appendices
Date
Phone Deteriorated/ not working/broke
Wanted latest technology/Model/iPhone/smartphone
New/ expired contract
$0 up front with new contract
Phone lost/ stolen
Given phone/ gift/ someone else bought
Work related/ supplied by employer
Upgrading from CDMA network
Needed a phone Other
Mar-05 19.0% 19.0% 6.0% 1.0% 3.0% 3.0% 6.0% 29.0% 12.0%
Mar-06 24.3% 31.6% 17.7% 10.3% 4.6% 2.6% 2.3% 2.8% 5.7%
Mar-07 25.8% 30.0% 15.8% 10.1% 4.3% 3.3% 3.0% 4.3% 2.3% 1.0%
Jun-07 26.0% 27.4% 16.0% 11.9% 4.6% 5.6% 1.2% 3.5% 2.6% 1.4%
Feb-08 25.0% 23.0% 17.0% 11.0% 5.0% 4.0% 2.0% 5.0% 2.0% 5.0%
Feb-09 22.0% 22.0% 18.0% 11.0% 5.0% 1.0% 4.0% 4.0% 3.0%
Feb-10 26.0% 29.0% 19.0% 12.0% 4.0% 2.0% 1.0% 3.0% 1.0% 3.0%
Feb-11 21.0% 31.0% 23.0% 8.0% 4.0% 3.0% 1.0% 2.0% 1.0% 6.0%
Nov-11 24.0% 34.0% 17.0% 9.0% 4.0% 4.0% 1.0% 4.0% 3.0% 1.0%
Dec-12 26.0% 35.0% 19.0% 7.0% 3.0% 3.0% 1.0% 1.0% 0.0%
Jan-14 24.0% 33.0% 16.0% 8.0% 3.0% 0.0%
Feb-15 23.0% 20.0% 16.0% 5.0% 3.0% 15.0%
3.6 REASON FOR OBTAINING CURRENT PHONE
Date iPhone Samsung Nokia HTC Other LG Sony Huawei Motorola Blackberry ZTE
Nov-11 21.0% 16.0% 33.0% 7.0% 4.0% 6.0% 5.0% 1.0% 3.0% 2.0% 1.0%
Dec-12 24.0% 26.0% 23.0% 7.0% 4.0% 4.0% 4.0% 2.0% 3.0% 2.0% 1.0%
Jan-14 33.0% 28.0% 16.0% 5.0% 5.0% 4.0% 4.0% 2.0% 1.0% 1.0% 1.0%
Feb-15 34.0% 33.0% 12.0% 5.0% 0.0% 5.0% 4.0% 2.0% 1.0% 0.0% 1.0%
3.7 BRAND OF CURRENT MOBILE PHONE
DateMobile phone retailers
Electronics Store i.e. Dick Smith, JB Hi Fi Apple
Discount stores/ supermarkets auspos ebay Online Other
Don’t know/didn’t answer
gift - hand me down Work Overseas TOTAL
Nov-11 68.00% 5.0% 7.0% 2.0% 2.0% 2.0% 3.0% 8.0% 1.0% 0.0% 98.00%
Dec-12 73.00% 6.0% 9.0% 1.0% 2.0% 3.0% 1.0% 4.0% 0.0% 1.0% 100.00%
Jan-14 64.00% 0.0% 9.0% 0.0% 0.0% 27.0% 0.0% 0.0% 0.0% 0.0% 100.00%
Feb-15 55.00% 10.0% 3.0% 5.0% 3.0% 22.0% 0.0% 0.0% 0.0% 0.0% 98.00%
3.8 WHERE ARE PEOPLE BUYING THEIR PHONES FROM?
Date Other
When I went travelling overseas for work or leisure
In the Summer or Boxing Day sales
Towards the end of the financial year
When previous phone was lost or stolen
When I started a new job
On your birthday At Christmas
When an updated model was launched (new technology)
When my contract was up
When previous phone stopped working properly/broke
Jan-14 30.0% 2.0% 2.0% 5.0% 0.0% 3.0% 5.0% 6.0% 20.0% 31.0% 0.0%
Feb-15 14.0% 1.0% 2.0% 3.0% 3.0% 5.0% 6.0% 7.0% 12.0% 25.0% 31.0%
3.9 WHEN DO PEOPLE BUY / RECEIVE THEIR NEW PHONE?
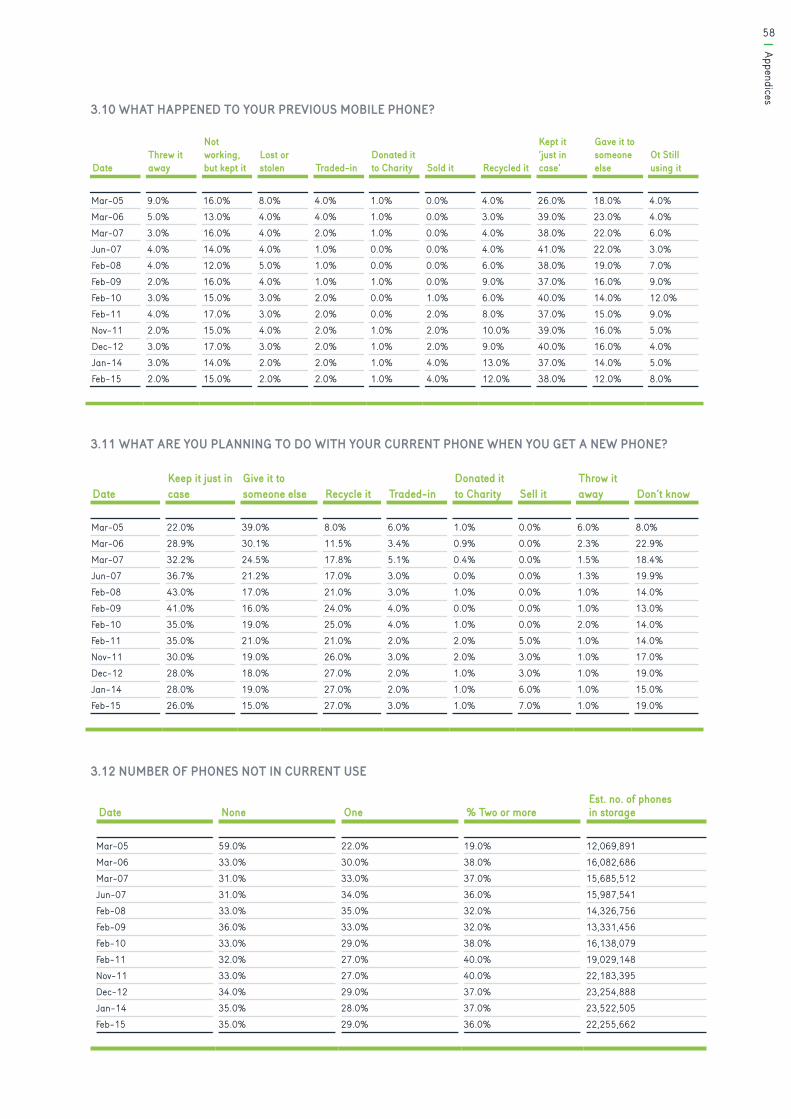
58Appendices
DateThrew it away
Not working, but kept it
Lost or stolen Traded-in
Donated it to Charity Sold it Recycled it
Kept it ‘just in case’
Gave it to someone else
Ot Still using it
Mar-05 9.0% 16.0% 8.0% 4.0% 1.0% 0.0% 4.0% 26.0% 18.0% 4.0%Mar-06 5.0% 13.0% 4.0% 4.0% 1.0% 0.0% 3.0% 39.0% 23.0% 4.0%Mar-07 3.0% 16.0% 4.0% 2.0% 1.0% 0.0% 4.0% 38.0% 22.0% 6.0%Jun-07 4.0% 14.0% 4.0% 1.0% 0.0% 0.0% 4.0% 41.0% 22.0% 3.0%Feb-08 4.0% 12.0% 5.0% 1.0% 0.0% 0.0% 6.0% 38.0% 19.0% 7.0%Feb-09 2.0% 16.0% 4.0% 1.0% 1.0% 0.0% 9.0% 37.0% 16.0% 9.0%Feb-10 3.0% 15.0% 3.0% 2.0% 0.0% 1.0% 6.0% 40.0% 14.0% 12.0%Feb-11 4.0% 17.0% 3.0% 2.0% 0.0% 2.0% 8.0% 37.0% 15.0% 9.0%Nov-11 2.0% 15.0% 4.0% 2.0% 1.0% 2.0% 10.0% 39.0% 16.0% 5.0%Dec-12 3.0% 17.0% 3.0% 2.0% 1.0% 2.0% 9.0% 40.0% 16.0% 4.0%Jan-14 3.0% 14.0% 2.0% 2.0% 1.0% 4.0% 13.0% 37.0% 14.0% 5.0%Feb-15 2.0% 15.0% 2.0% 2.0% 1.0% 4.0% 12.0% 38.0% 12.0% 8.0%
3.10 WHAT HAPPENED TO YOUR PREVIOUS MOBILE PHONE?
DateKeep it just in case
Give it to someone else Recycle it Traded-in
Donated it to Charity Sell it
Throw it away Don’t know
Mar-05 22.0% 39.0% 8.0% 6.0% 1.0% 0.0% 6.0% 8.0%Mar-06 28.9% 30.1% 11.5% 3.4% 0.9% 0.0% 2.3% 22.9%Mar-07 32.2% 24.5% 17.8% 5.1% 0.4% 0.0% 1.5% 18.4%Jun-07 36.7% 21.2% 17.0% 3.0% 0.0% 0.0% 1.3% 19.9%Feb-08 43.0% 17.0% 21.0% 3.0% 1.0% 0.0% 1.0% 14.0%Feb-09 41.0% 16.0% 24.0% 4.0% 0.0% 0.0% 1.0% 13.0%Feb-10 35.0% 19.0% 25.0% 4.0% 1.0% 0.0% 2.0% 14.0%Feb-11 35.0% 21.0% 21.0% 2.0% 2.0% 5.0% 1.0% 14.0%Nov-11 30.0% 19.0% 26.0% 3.0% 2.0% 3.0% 1.0% 17.0%Dec-12 28.0% 18.0% 27.0% 2.0% 1.0% 3.0% 1.0% 19.0%Jan-14 28.0% 19.0% 27.0% 2.0% 1.0% 6.0% 1.0% 15.0%Feb-15 26.0% 15.0% 27.0% 3.0% 1.0% 7.0% 1.0% 19.0%
3.11 WHAT ARE YOU PLANNING TO DO WITH YOUR CURRENT PHONE WHEN YOU GET A NEW PHONE?
Date None One % Two or moreEst. no. of phones in storage
Mar-05 59.0% 22.0% 19.0% 12,069,891Mar-06 33.0% 30.0% 38.0% 16,082,686Mar-07 31.0% 33.0% 37.0% 15,685,512Jun-07 31.0% 34.0% 36.0% 15,987,541Feb-08 33.0% 35.0% 32.0% 14,326,756Feb-09 36.0% 33.0% 32.0% 13,331,456Feb-10 33.0% 29.0% 38.0% 16,138,079Feb-11 32.0% 27.0% 40.0% 19,029,148Nov-11 33.0% 27.0% 40.0% 22,183,395Dec-12 34.0% 29.0% 37.0% 23,254,888Jan-14 35.0% 28.0% 37.0% 23,522,505Feb-15 35.0% 29.0% 36.0% 22,255,662
3.12 NUMBER OF PHONES NOT IN CURRENT USE
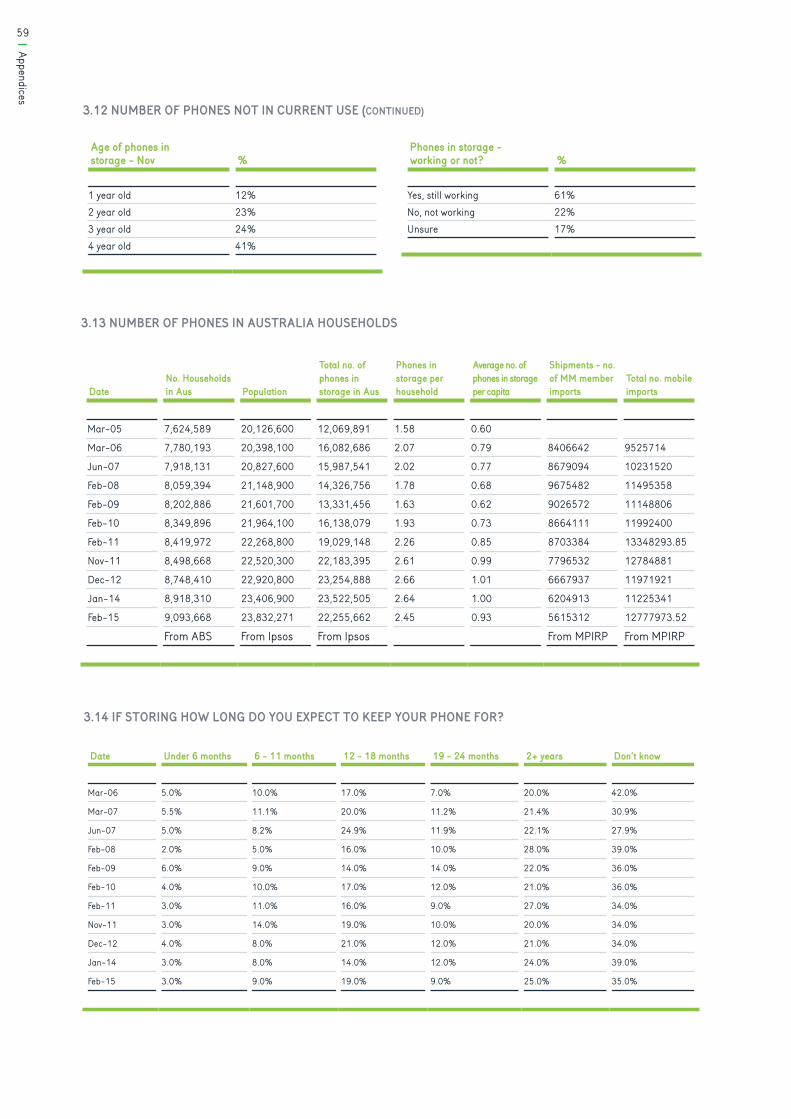
59
Appendices
Age of phones in storage - Nov %
1 year old 12%2 year old 23%3 year old 24%4 year old 41%
Phones in storage - working or not? %
Yes, still working 61%No, not working 22%Unsure 17%
DateNo. Households in Aus Population
Total no. of phones in storage in Aus
Phones in storage per household
Average no. of phones in storage per capita
Shipments - no. of MM member imports
Total no. mobile imports
Mar-05 7,624,589 20,126,600 12,069,891 1.58 0.60
Mar-06 7,780,193 20,398,100 16,082,686 2.07 0.79 8406642 9525714
Jun-07 7,918,131 20,827,600 15,987,541 2.02 0.77 8679094 10231520
Feb-08 8,059,394 21,148,900 14,326,756 1.78 0.68 9675482 11495358
Feb-09 8,202,886 21,601,700 13,331,456 1.63 0.62 9026572 11148806
Feb-10 8,349,896 21,964,100 16,138,079 1.93 0.73 8664111 11992400
Feb-11 8,419,972 22,268,800 19,029,148 2.26 0.85 8703384 13348293.85
Nov-11 8,498,668 22,520,300 22,183,395 2.61 0.99 7796532 12784881
Dec-12 8,748,410 22,920,800 23,254,888 2.66 1.01 6667937 11971921
Jan-14 8,918,310 23,406,900 23,522,505 2.64 1.00 6204913 11225341
Feb-15 9,093,668 23,832,271 22,255,662 2.45 0.93 5615312 12777973.52
From ABS From Ipsos From Ipsos From MPIRP From MPIRP
3.13 NUMBER OF PHONES IN AUSTRALIA HOUSEHOLDS
Date Under 6 months 6 - 11 months 12 - 18 months 19 - 24 months 2+ years Don’t know
Mar-06 5.0% 10.0% 17.0% 7.0% 20.0% 42.0%
Mar-07 5.5% 11.1% 20.0% 11.2% 21.4% 30.9%
Jun-07 5.0% 8.2% 24.9% 11.9% 22.1% 27.9%
Feb-08 2.0% 5.0% 16.0% 10.0% 28.0% 39.0%
Feb-09 6.0% 9.0% 14.0% 14.0% 22.0% 36.0%
Feb-10 4.0% 10.0% 17.0% 12.0% 21.0% 36.0%
Feb-11 3.0% 11.0% 16.0% 9.0% 27.0% 34.0%
Nov-11 3.0% 14.0% 19.0% 10.0% 20.0% 34.0%
Dec-12 4.0% 8.0% 21.0% 12.0% 21.0% 34.0%
Jan-14 3.0% 8.0% 14.0% 12.0% 24.0% 39.0%
Feb-15 3.0% 9.0% 19.0% 9.0% 25.0% 35.0%
3.14 IF STORING HOW LONG DO YOU EXPECT TO KEEP YOUR PHONE FOR?
3.12 NUMBER OF PHONES NOT IN CURRENT USE (CONTINUED)

60Appendices
DateKept spare for backup
May need it / still works / has info in it
May be able to sell/ Expensive phone / Paid good money for it
Keeping for kids/to play with
Might be able to repair
Security concerns
Sentimental reasons / value / really like it
To use overseas
Don’t know where to recycle
Didn’t know you could recycle phone
Not sure what to do with it
No convenient recycling points
Hand it down to friends/family
Other (lost it, easier to throw outm gave it back to employer Don’t know
Haven’t got around to it yet
Didn’t think of it/ forgot about it
never replaced phone or accessory
Mar-05 19.0% 1.0% 26.0% 26.0% 14.0% 16.0% 3.0% 24.0%Mar-06 34.0% 4.0% 4.0% 47.0% 47.0% 12.0% 7.0% 6.0%Mar-07 44.0% 7.0% 0.0% 4.0% 0.0% 0.0% 0.0% 0.0% 9.0% 13.0% 8.0% 0.0% 0.0% 3.0% 6.0% 11.0% 0.0%Jun-07 60.0% 2.0% 0.0% 4.0% 0.0% 0.0% 0.0% 0.0% 11.0% 4.0% 2.0% 0.0% 0.0% 4.0% 2.0% 11.0% 0.0%Feb-08 57.0% 14.0% 0.0% 6.0% 0.0% 0.0% 0.0% 0.0% 9.0% 3.0% 2.0% 0.0% 0.0% 10.0% 3.0% 8.0% 0.0%Feb-09 61.0% 8.0% 0.0% 3.0% 0.0% 0.0% 0.0% 0.0% 9.0% 3.0% 1.0% 0.0% 0.0% 6.0% 3.0% 15.0% 0.0%Feb-10 45.0% 19.0% 0.0% 4.0% 0.0% 0.0% 0.0% 0.0% 10.0% 6.0% 0.0% 0.0% 0.0% 6.0% 6.0% 16.0% 0.0%Feb-11 43.0% 16.0% 3.0% 2.0% 3.0% 2.0% 0.0% 2.0% 6.0% 4.0% 1.0% 9.0% 4.0% 0.0% 7.0% 18.0% 0.0%Nov-11 41.0% 18.0% 2.0% 4.0% 1.0% 2.0% 0.0% 1.0% 6.0% 3.0% 2.0% 1.0% 3.0% 2.0% 6.0% 16.0% 0.0%Dec-12 37.0% 21.0% 2.0% 2.0% 2.0% 1.0% 2.0% 1.0% 7.0% 6.0% 3.0% 1.0% 3.0% 2.0% 7.0% 16.0% 0.0%Jan-14 36.0% 21.0% 2.0% 3.0% 2.0% 2.0% 1.0% 1.0% 8.0% 3.0% 3.0% 1.0% 4.0% 3.0% 7.0% 12.0% 0.0%Feb-15 49.0% 16.0% 6.0% 16.0% 5.0% 14.0% 2.0% 7.0% 5.0% 25.0% 10.0%
3.15 WHY ARE YOU NOT RECYCLING THE OLD PHONE THAT YOU KEPT?
Date
I might need the information at a later date
I am worried if I recycle my mobile phone someone else may access and use my information
I don’t believe the information will be destroyed in the recycling process
I don’t know how to delete the information off the phone
I don’t know how to save/ transfer the data to my new phone or computer Other
Nov-11 37.0% 57.0% 20.0% 19.0% 21.0% 9.0%
Dec-12 37.0% 64.0% 24.0% 24.0% 31.0% 3.0%
Jan-14 33.0% 69.0% 33.0% 22.0% 22.0% 5.0%
Feb-15 42.0% 66.0% 29.0% 22.0% 21.0% 4.0%
3.16 WHY DOES THE INFORMATION ON YOUR UNUSED PHONE STOP YOU FROM RECYCLING IT?
Date Definitely will Probably will Might/Might not Probably not Definitely not
Mar-06 20.0% 25.0% 40.0% 12.0% 3.0%
Mar-07 25.4% 20.7% 38.8% 12.0% 3.1%
Jun-07 22.8% 19.8% 38.8% 14.3% 4.3%
Feb-08 27.0% 21.0% 33.0% 15.0% 4.0%
Feb-09 36.0% 20.0% 30.0% 11.0% 2.0%
Feb-10 35.0% 22.0% 30.0% 11.0% 2.0%
Feb-11 30.0% 20.0% 34.0% 12.0% 4.0%
Nov-11 37.0% 19.0% 31.0% 10.0% 4.0%
Dec-12 37.0% 19.0% 30.0% 10.0% 4.0%
Jan-14 34.0% 16.0% 32.0% 12.0% 5.0%
Feb-15 35.0% 18.0% 32.0% 11.0% 4.0%
3.17 HOW LIKELY ARE YOU TO RECYCLE YOUR MOBILE PHONE?

61
AppendicesDate Total Sydney Melbourne Adelaide Perth Brisbane Rural
Mar-05 46%
Mar-06 54.2% 53.8% 58.8% 51.3% 43.4%
Mar-07 66.8% 67.5% 69.1% 65.0% 60.7%
Jun-07 79.0% 79.3% 78.3% 80.6% 76.3%
Feb-08 75.0% 71.0% 77.0% 79.0% 79.0%
Feb-09 79.0% 79.0% 79.0% 82.0% 80.0%
Jun-09 76.0% 79.0% 80.0% 88.0% 73.0%
Nov-09 77.0% 77.0% 81.0% 85.0% 82.0% 65% 75%
Feb-10 79.0% 79.0% 79.0% 83.0% 77.0%
Feb-11 84.0% 84.0% 83.0% 85.0% 83.0%
Nov-11 82.0% 81.0% 76.0% 78.0% 80.0% 81.0%
Dec-12 83.0% 80.0% 86.0% 81.0% 79.0% 85.0%
Jan-14 80.0% 77.0% 78.0% 74.0% 78.0% 82.0%
Feb-15 78.0% 76.0% 82.0% 80.0% 72.0% 73.0%
Date Battery Phone Handset Charger SIM CardHead set / hands free Case Other
Mar-06 77.0% 54.0% 52.9% 28.7% 6.9% 4.6% 4.6%Mar-07 76.4% 58.8% 53.1% 34.3% 4.7% 8.2% 1.5%Jun-07 80.0% 61.0% 50.0% 26.0% 5.0% 2.0%Feb-08 81.0% 73.0% 58.0% 19.0% 1.0% 1.0% 9.0%Feb-09 80.0% 74.0% 48.0% 23.0% 0.0% 0.0% 7.0%Feb-10 82.0% 70.0% 49.0% 15.0% 1.0% 1.0% 4.0%Feb-11 77.0% 76.0% 44.0% 21.0% 2.0% 2.0%Nov-11 73.0% 75.0% 51.0% 16.0% 0.0% 2.0%Dec-12 81.0% 83.0% 52.0% 13.0% 3.0% 1.0%Jan-14 77.0% 84.0% 55.0% 17.0% 1.0% 1.0%Feb-15 72.0% 81.0% 58.0% 15.0% 0.0% 0.0%
3.18 HAVE YOU EVER RECYCLED ANY PART OF AN OLD MOBILE PHONE?
3.19 HOW MUCH AWARENESS ENCOURAGES RECYCLING - DEFINITELY (%)
3.20 AWARENESS OF MOBILE PHONE RECYCLING
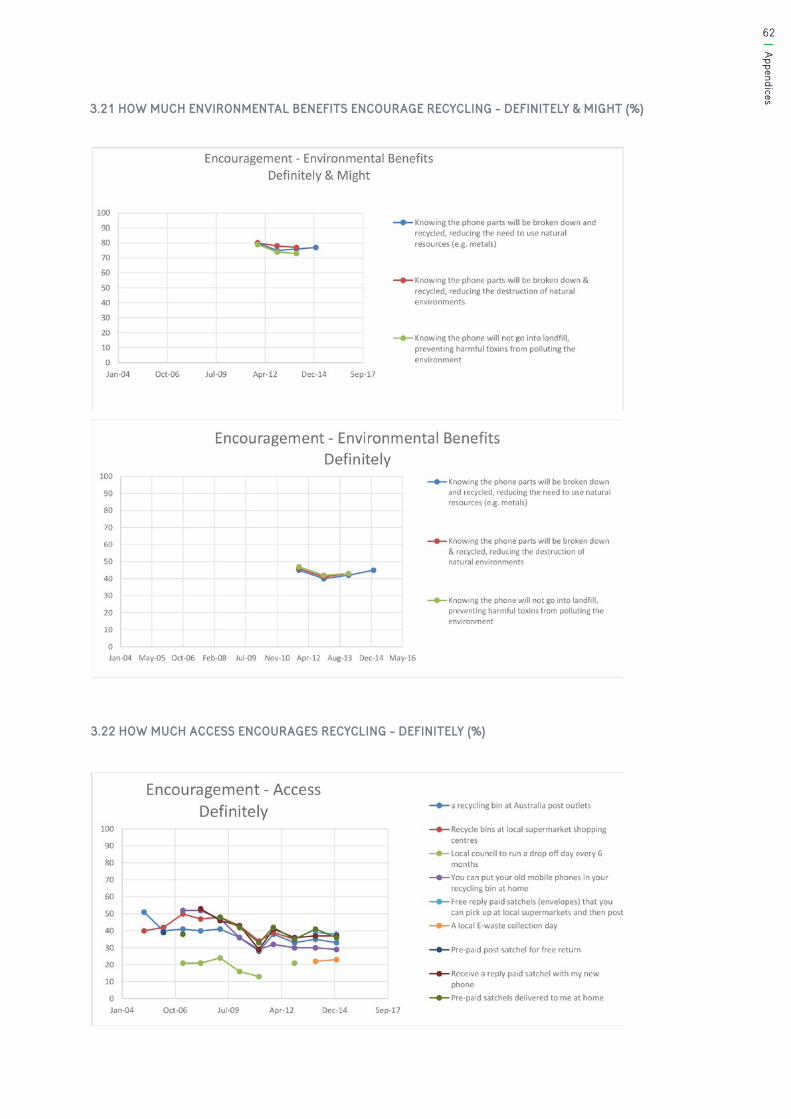
62Appendices
3.21 HOW MUCH ENVIRONMENTAL BENEFITS ENCOURAGE RECYCLING - DEFINITELY & MIGHT (%)
3.22 HOW MUCH ACCESS ENCOURAGES RECYCLING - DEFINITELY (%)

63
Appendices
3.23 LIKELIHOOD TO RECYCLE AT THE FOLLOWING OUTLETS - VERY AND SOMEWHAT LIKELY (%)
3.24 HOW MUCH PERSONAL FINANCIAL INCENTIVES ENCOURAGE RECYCLING - DEFINITELY & MIGHT (%)

64Appendices
3.25 HOW MUCH CHARITY BENEFITS ENCOURAGE RECYCLING - DEFINITELY & MIGHT (%)
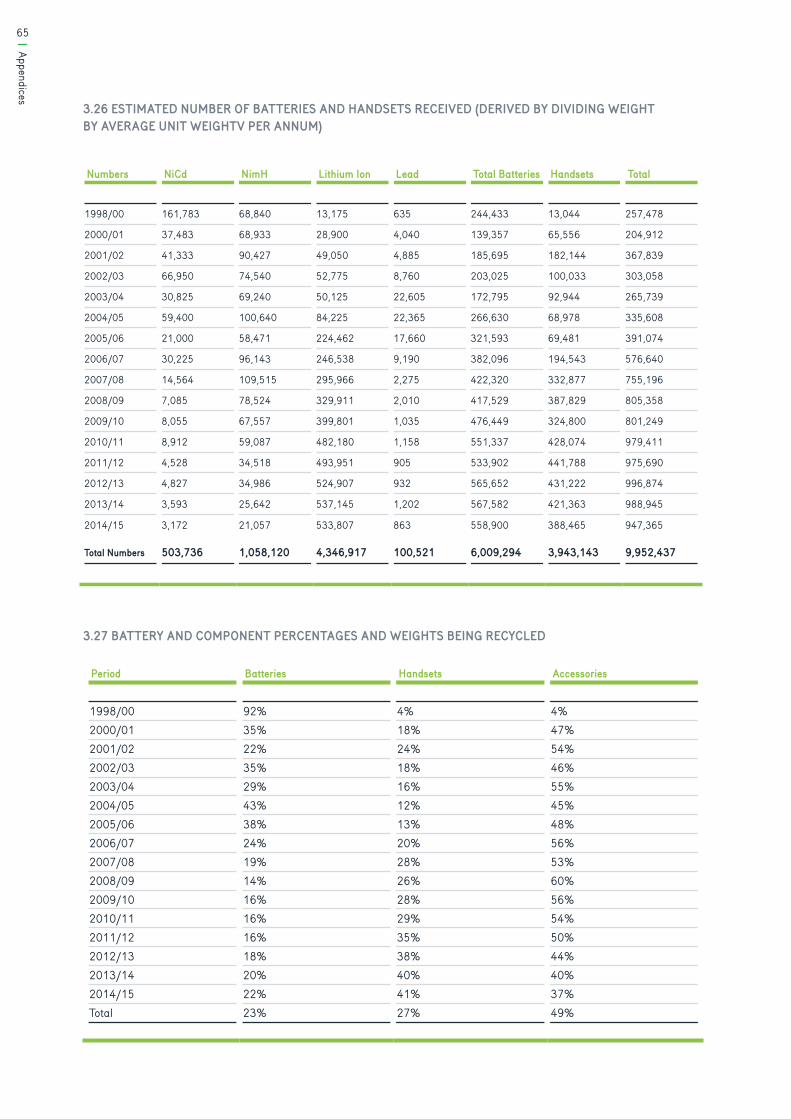
65
Appendices
Numbers NiCd NimH Lithium Ion Lead Total Batteries Handsets Total
1998/00 161,783 68,840 13,175 635 244,433 13,044 257,478
2000/01 37,483 68,933 28,900 4,040 139,357 65,556 204,912
2001/02 41,333 90,427 49,050 4,885 185,695 182,144 367,839
2002/03 66,950 74,540 52,775 8,760 203,025 100,033 303,058
2003/04 30,825 69,240 50,125 22,605 172,795 92,944 265,739
2004/05 59,400 100,640 84,225 22,365 266,630 68,978 335,608
2005/06 21,000 58,471 224,462 17,660 321,593 69,481 391,074
2006/07 30,225 96,143 246,538 9,190 382,096 194,543 576,640
2007/08 14,564 109,515 295,966 2,275 422,320 332,877 755,196
2008/09 7,085 78,524 329,911 2,010 417,529 387,829 805,358
2009/10 8,055 67,557 399,801 1,035 476,449 324,800 801,249
2010/11 8,912 59,087 482,180 1,158 551,337 428,074 979,411
2011/12 4,528 34,518 493,951 905 533,902 441,788 975,690
2012/13 4,827 34,986 524,907 932 565,652 431,222 996,874
2013/14 3,593 25,642 537,145 1,202 567,582 421,363 988,945
2014/15 3,172 21,057 533,807 863 558,900 388,465 947,365
Total Numbers 503,736 1,058,120 4,346,917 100,521 6,009,294 3,943,143 9,952,437
Period Batteries Handsets Accessories
1998/00 92% 4% 4%2000/01 35% 18% 47%2001/02 22% 24% 54%2002/03 35% 18% 46%2003/04 29% 16% 55%2004/05 43% 12% 45%2005/06 38% 13% 48%2006/07 24% 20% 56%2007/08 19% 28% 53%2008/09 14% 26% 60%2009/10 16% 28% 56%2010/11 16% 29% 54%2011/12 16% 35% 50%2012/13 18% 38% 44%2013/14 20% 40% 40%2014/15 22% 41% 37%Total 23% 27% 49%
3.26 ESTIMATED NUMBER OF BATTERIES AND HANDSETS RECEIVED (DERIVED BY DIVIDING WEIGHT BY AVERAGE UNIT WEIGHTV PER ANNUM)
3.27 BATTERY AND COMPONENT PERCENTAGES AND WEIGHTS BEING RECYCLED
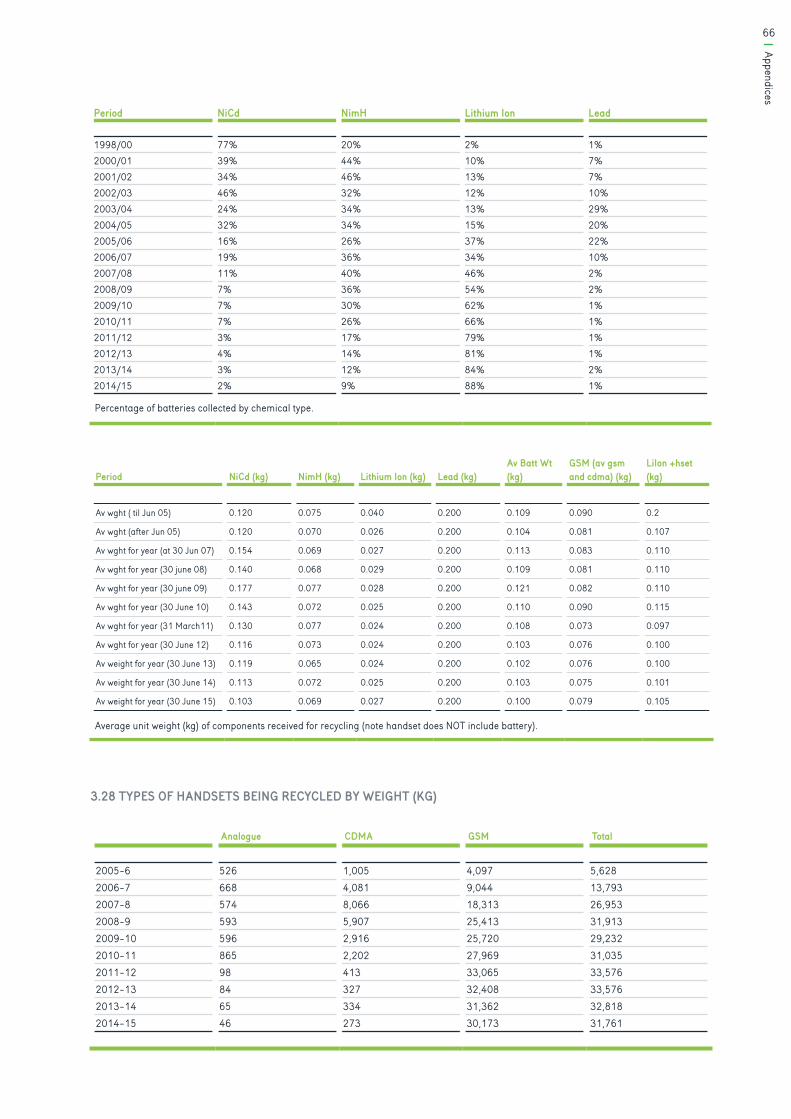
Appendices66
Period NiCd NimH Lithium Ion Lead
1998/00 77% 20% 2% 1%2000/01 39% 44% 10% 7%2001/02 34% 46% 13% 7%2002/03 46% 32% 12% 10%2003/04 24% 34% 13% 29%2004/05 32% 34% 15% 20%2005/06 16% 26% 37% 22%2006/07 19% 36% 34% 10%2007/08 11% 40% 46% 2%2008/09 7% 36% 54% 2%2009/10 7% 30% 62% 1%2010/11 7% 26% 66% 1%2011/12 3% 17% 79% 1%2012/13 4% 14% 81% 1%2013/14 3% 12% 84% 2%2014/15 2% 9% 88% 1%
Analogue CDMA GSM Total
2005-6 526 1,005 4,097 5,6282006-7 668 4,081 9,044 13,7932007-8 574 8,066 18,313 26,9532008-9 593 5,907 25,413 31,9132009-10 596 2,916 25,720 29,2322010-11 865 2,202 27,969 31,0352011-12 98 413 33,065 33,5762012-13 84 327 32,408 33,5762013-14 65 334 31,362 32,8182014-15 46 273 30,173 31,761
Period NiCd (kg) NimH (kg) Lithium Ion (kg) Lead (kg)Av Batt Wt (kg)
GSM (av gsm and cdma) (kg)
LiIon +hset (kg)
Av wght ( til Jun 05) 0.120 0.075 0.040 0.200 0.109 0.090 0.2
Av wght (after Jun 05) 0.120 0.070 0.026 0.200 0.104 0.081 0.107
Av wght for year (at 30 Jun 07) 0.154 0.069 0.027 0.200 0.113 0.083 0.110
Av wght for year (30 june 08) 0.140 0.068 0.029 0.200 0.109 0.081 0.110
Av wght for year (30 june 09) 0.177 0.077 0.028 0.200 0.121 0.082 0.110
Av wght for year (30 June 10) 0.143 0.072 0.025 0.200 0.110 0.090 0.115
Av wght for year (31 March11) 0.130 0.077 0.024 0.200 0.108 0.073 0.097
Av wght for year (30 June 12) 0.116 0.073 0.024 0.200 0.103 0.076 0.100
Av weight for year (30 June 13) 0.119 0.065 0.024 0.200 0.102 0.076 0.100
Av weight for year (30 June 14) 0.113 0.072 0.025 0.200 0.103 0.075 0.101
Av weight for year (30 June 15) 0.103 0.069 0.027 0.200 0.100 0.079 0.105
3.28 TYPES OF HANDSETS BEING RECYCLED BY WEIGHT (KG)
Percentage of batteries collected by chemical type.
Average unit weight (kg) of components received for recycling (note handset does NOT include battery).

©Australian Mobile Telecommunications AssociationWritten by Rose Read, Manager Recycling, AMTAEdited by The BraveryGraphic Design by The Republic of EveryonePrinted on 250gsm & 110gsm Ecostar 100% Recycled UncoatedISBN 978 0 646 94660 3October 2015
Managed by the Australian Mobile Telecommunications Association
PRODUCT STEWARDSHIPAustralian Government Accredited
MobileMuster – The only not-for-profit government accredited mobile phone recycling program in Australia. An initiative of the Australian Mobile Telecommunications Association (AMTA).
Acknowledgements
The AMTA would like to thank the following people for their contributions in editing, proofing and reviewing the document Julia Diamond, Larissa Shashkof, Spyro Kalos and Glenn Brown from AMTA; Helen Lewis (Principal, Helen Lewis Research); John Gertsakis (Chief Sustainability Officer from Infoactiv); Associate Professor Damien Giurco (Research Director, UTS Institute of Sustainable Futures); Ben Brown and Laura Shepherd from IPSOS; Claire Maloney and Alexandra McDonald from The Bravery; Scott Matyus-Flynn, Rachel Strobridge and the Design Team at The Republic of Everyone.
CONTACT USwww.mobilemuster.com.au1300 730 070+61 2 8920 [email protected]
MobileMusterLevel 8, 71 Walker Street, North Sydney NSW 2060
Australian Mobile Telecommunications AssociationPO Box 4309 Manuka, ACT Australia 2603ABN: 98 065 814 315
Author: Rose ReadManager RecyclingAMTA
Like us on Facebook/mobilemuster
Follow us on Twitter/mobilemuster1