australias performance in the g20 supported by origin · pdf fileaustralias performance in the...
TRANSCRIPT

Carbon analytics Australia’s performance in the G20 Supported by Origin Energy
Consumption-based carbon emissions August 2015
#2

This page left intentionally blank
Deloitte refers to one or more of Deloitte Touche Tohmatsu Limited, a UK private company limited by guarantee, and its network of member firms, each of which is a legally separate and independent entity. Please see www.deloitte.com/au/about for a detailed description of the legal structure of Deloitte Touche Tohmatsu Limited and its member firms. Liability limited by a scheme approved under Professional Standards Legislation. © 2015 Deloitte Access Economics Pty Ltd
Deloitte Access Economics: Carbon Analytics #2
Contents
Executive summary i
1 Introduction 1
1.1 Background and overview 1
1.2 Structure of this report 1
2 Updated benchmarks – how does Australia compare to the G20? 2
2.1 Benchmarks based on IEA data 2
2.2 Benchmarks based on EDGAR data 4
2.3 Benchmarks based on CDIAC data 5
2.4 Australia’s energy carbon emissions 7
2.5 Summary 8
3 Consumption-based carbon emissions 9
3.1 Overview of key concepts 9
3.2 Why measure consumption-based emissions? 9
3.3 The EORA MRIO 10
4 Key results 12
4.1 Consumption-based emissions in the G20 12
4.2 Emissions importing countries 15
4.3 Emissions exporting countries 20
4.4 Australia’s import and export emissions 25
5 How does Australia compare on consumption-based emissions? 28
5.1 Consumption-based emissions in the G20 28
6 Implications for target setting 30
6.1 Is the current approach to target setting effective? 30
6.2 Who should bear responsibility for decarbonisation? 30
6.3 Implications for target setting 31
Appendix A MRIO databases 33

Deloitte Access Economics: Carbon Analytics #2 i
Executive summary Consumption-based emissions analysis – a different way of looking at emissions
This is the second report in Deloitte Access Economics’ Carbon Analytics series supported by Origin Energy, which aims to provide new insights and foster informed debate on current issues affecting carbon emissions from the energy sector in Australia.
In our first report in the Carbon Analytics series, we presented benchmarks of carbon emissions per Gross Domestic Product (GDP) for the G20 countries using production-based or territorial emissions measures – that is, emissions arising from the production of goods and services within a country’s borders. The use of production-based emissions is the most commonly applied approach to measuring emissions, is followed by the Kyoto Protocol and United Nations Framework Convention on Climate Change and forms the basis of the current G20 dialogue on emissions targets. In this report, we approach energy emissions from the alternative perspective of consumption-based emissions, which allocates emissions to a country’s final demand, rather than production. The key differences between the two metrics can be summarised as follows:
Consumption-based emissions allocate emissions to consumption, explicitly take into account emissions embedded in international trade flows, and include emissions embedded in imports but exclude emissions from goods and services produced to serve overseas markets.
Production-based emissions allocate emissions to production and include all emissions from domestic production, regardless of whether it is to serve domestic or overseas markets.
At a global level, consumption-based and production-based emissions are two sides of the same coin – total consumption-based emissions must be equal to total production-based emissions; the only difference is allocation. However, from an individual country perspective, the two measures can differ substantially depending on the nature and extent of international trade engaged in.
Production-based emissions provide an incomplete picture of the drivers of emissions and the impact of global trade on emissions
Considering emissions from the production-side only when setting targets and designing policy may result in unintended outcomes, such as:
Carbon leakage – where emissions reductions in countries with targets are offset by increases in emissions in countries without targets due to shifts in production from the countries with targets to those without.
Inefficient incentives for abatement by deterring production of traded goods that are relatively emissions intensive to produce but result in lower emissions than alternatives when the total lifecycle emissions (encompassing emissions from production and consumption) are taken into account. Examples of where this might occur include energy efficient technologies such as electric vehicles and batteries, low emissions generation technologies and fuels.

Deloitte Access Economics: Carbon Analytics #2 ii
Consumption-based emissions analysis can assist in identifying these issues. By allocating all emissions from production and consumption to the final consumer, consumption-based emissions provide a more complete picture of total lifecycle emissions and explicitly account for the impacts of international trade.
Internationally traded emissions are a significant and growing component of global emissions
Consumption-based emissions reflect both the extent to which a country relies on overseas production to serve domestic demand, and the emissions intensity of overseas production. As shown in the figure below, more than half of the United Kingdom’s and France’s carbon footprint occurs in other countries. Around 31% of Australia’s carbon footprint relates to production in other countries.
Figure E-1: Proportion of carbon footprint occurring overseas, 2011 (Mt CO2)
Source: Eora MRIO
Figure E-2 illustrates the extent to which countries in the G20 are either net importers or net exporters of emissions. The two key drivers of whether a country is a net importer or net exporter of emissions are:
Carbon intensity (production-based CO2/GDP) of the domestic economy and of major trading partners.
Type of goods traded – complex manufactured and finished goods tend to have higher embodied emissions than primary or intermediate goods.
Net emissions exporters are primarily large, emerging economies such as China and India, or significant exporters of energy (Russia, Saudi Arabia and South Africa). On the other hand, net emissions imports are concentrated in the service-based economies of North America, Europe, and Japan. In 2011, Australia transitioned from being a net exporter to a

Deloitte Access Economics: Carbon Analytics #2 iii
small net importer of emissions, mainly due to the strengthening trade relationship with China and the associated increase in relatively emissions-intensive imports – China’s carbon intensity is almost five times higher than that of our next largest trade partner, the United States. In 2011 China accounted for around 15% of Australia’s total imports, but around 27% of total emissions embedded in imports. As Australia’s resources sectors transition from an investment to production phase, exported emissions are likely to increase with the ramp up in commodity exports.
Figure E-2: G20 countries’ net energy emissions balance, 2011 (Mt CO2)
Source: Eora MRIO
Analysis of consumption-based emissions suggests that reductions in production-based emissions from advanced economies have been offset by carbon leakage to emerging economies
A number of countries in the G20 have made significant progress in moderating or reducing their production-based emissions in the last decade. However, as shown in the figure below, while the United States and United Kingdom have reduced or constrained production-based emissions, consumption-based emissions have grown. The widening gap between consumption-based emissions and production-based emissions suggests that reductions in emissions have been off-set to some extent by increases in consumption-based emissions (i.e. carbon leakage).

Deloitte Access Economics: Carbon Analytics #2 iv
Figure E-3: Carbon leakage? The widening gap between production-based and consumption-based emissions for advanced G20 economies – energy emissions (Mt CO2)
Source: Eora MRIO
As noted above, net emissions import or export balances (i.e. the difference between consumption-based and production-based emissions) can largely be traced back to differences in carbon intensity and the nature of trade. Figure E-4, below, shows that the carbon intensity of consumption (consumption-based CO2/Gross National Expenditure (GNE)) of advanced economies in the G20 tends to significantly outstrip the carbon intensity of production (production-based CO2/GDP). For the United Kingdom and France, for example, overseas production to serve domestic demand is almost twice as emissions intensive as domestic production. Australia’s carbon intensity of production and carbon intensity of consumption are broadly matched, with the higher emissions embedded in imports from China balanced by the lower emissions from imports from countries such as the United States. All else remaining equal, if imports from China continue to increase relative to other sources, Australia will see an increase in its consumption-based emissions.
Figure E-4: Benchmarks of production-based energy emissions intensity (Mt CO2/GDP (US$ billion)) and consumption-based energy emissions intensity (Mt CO2/GNE (US$ billion)), 2011
Source: Carbon emissions based on Eora MRIO; GDP and GNE based on IEA and World Bank data
0
1,000
2,000
3,000
4,000
5,000
6,000
7,000
8,000
Consumption-based emissions
Production-based emissions
0
100
200
300
400
500
600
700
800
900
Consumption-based emissions
Production-based emissions
United States United Kingdom
Deloitte Access Economics: Carbon Analytics #2 v
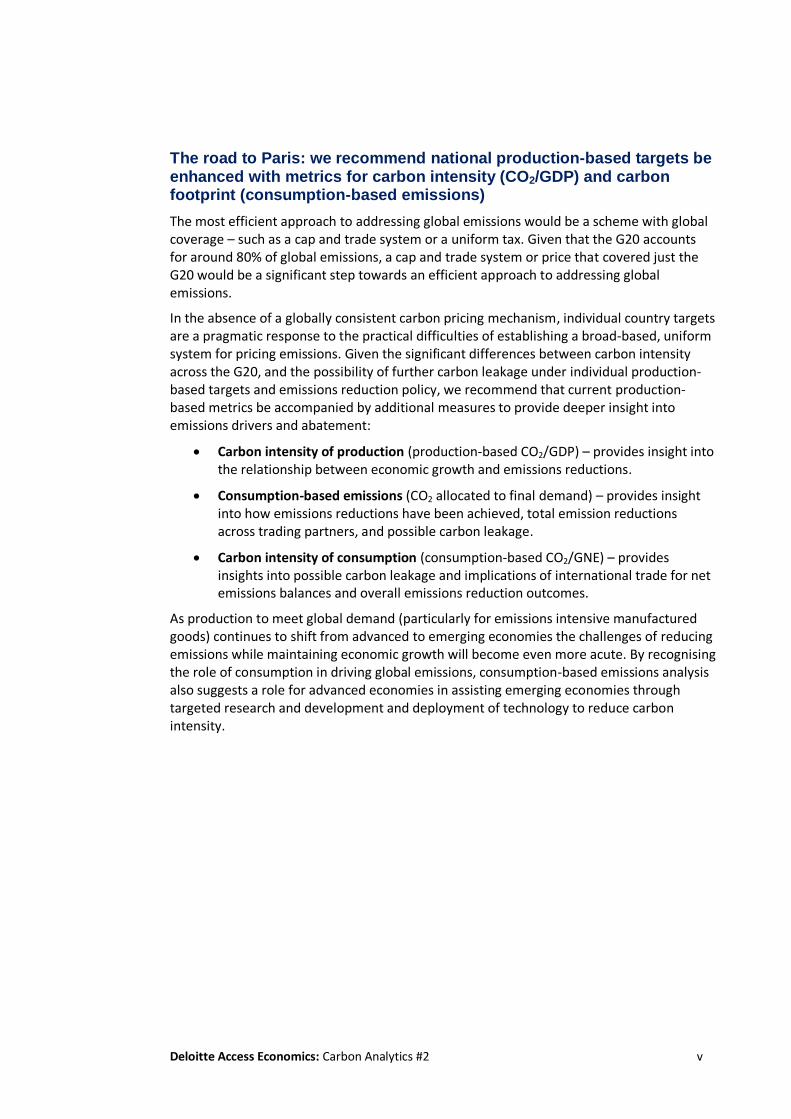
The road to Paris: we recommend national production-based targets be enhanced with metrics for carbon intensity (CO2/GDP) and carbon footprint (consumption-based emissions)
The most efficient approach to addressing global emissions would be a scheme with global coverage – such as a cap and trade system or a uniform tax. Given that the G20 accounts for around 80% of global emissions, a cap and trade system or price that covered just the G20 would be a significant step towards an efficient approach to addressing global emissions.
In the absence of a globally consistent carbon pricing mechanism, individual country targets are a pragmatic response to the practical difficulties of establishing a broad-based, uniform system for pricing emissions. Given the significant differences between carbon intensity across the G20, and the possibility of further carbon leakage under individual production-based targets and emissions reduction policy, we recommend that current production-based metrics be accompanied by additional measures to provide deeper insight into emissions drivers and abatement:
Carbon intensity of production (production-based CO2/GDP) – provides insight into the relationship between economic growth and emissions reductions.
Consumption-based emissions (CO2 allocated to final demand) – provides insight into how emissions reductions have been achieved, total emission reductions across trading partners, and possible carbon leakage.
Carbon intensity of consumption (consumption-based CO2/GNE) – provides insights into possible carbon leakage and implications of international trade for net emissions balances and overall emissions reduction outcomes.
As production to meet global demand (particularly for emissions intensive manufactured goods) continues to shift from advanced to emerging economies the challenges of reducing emissions while maintaining economic growth will become even more acute. By recognising the role of consumption in driving global emissions, consumption-based emissions analysis also suggests a role for advanced economies in assisting emerging economies through targeted research and development and deployment of technology to reduce carbon intensity.

Deloitte Access Economics: Carbon Analytics #2 1
1 Introduction 1.1 Background and overview This is the second report in our Carbon Analytics series. In our first report, Emission Metrics: Australia’s carbon footprint in the G20, we benchmarked the G20 countries on the carbon intensity of their economies (CO2/Gross Domestic Product (GDP)) using production-based measures of carbon emissions. We also benchmarked the drivers of carbon intensity, being the energy intensity of the economy (energy/GDP) and the carbon intensity of energy (CO2/energy). Finally, we developed a number of econometric models to explain the relationship between a country’s carbon emissions and various socio-economic variables including economic growth, population, fuel mix and urbanisation. Our aim in the first report was to foster a more sophisticated discussion on carbon emissions and build a platform for shifting the debate towards using explanatory metrics that capture the complexities of the underlying drivers of carbon emissions.
This second report, Consumption-based carbon emissions, presents data on consumption-based emissions for the G20 countries and explores various trends and relationships. Production-based emissions include all carbon emissions that are emitted from the production of goods and services within a country’s borders. A country’s consumption-based emissions differ from conventional, production-based reporting frameworks by allocating emissions to a country’s final demand for goods and services (which may relate to goods produced overseas), rather than production (which may relate to goods destined for overseas markets). We also include updates for the benchmarks of CO2/GDP (production-based emissions) from the first report with an additional two years of data (2012 and 2013).
With this second report, we aim to contribute to the carbon discussion and policy response both here in Australia and globally by providing insights into alternative ways of looking at carbon emissions and implications of the interconnectedness of the global economy on action on climate change.
1.2 Structure of this report The remainder of this report is structured as follows:
Chapter 2 provides updates for the benchmarks for CO2/GDP (production-based emissions) from our previous report with more recent data.
Chapter 3 introduces consumption-based carbon emissions and sets out the methodology applied in this report.
Chapter 4 presents the results of our analysis of consumption-based carbon emission data and analysis for the G20 countries.
Chapter 5 sets out the results of our consumption-based emissions analysis for Australia and benchmarks Australia against the G20.
Chapter 6 summarises the key issues raised by the use of consumption-based emission metrics and implications for global and national climate change policy.

Deloitte Access Economics: Carbon Analytics #2 2
2 Updated benchmarks – how does Australia compare to the G20? In our previous report in the Carbon Analytics series, we presented benchmarks of carbon intensity (CO2/GDP) for the G20 countries for total emissions and emissions produced by fuel consumption for energy.
These benchmarks were based on 2011 data sourced from the International Energy Association (IEA). As new data has become available, we have updated our database with more recent information from several sources. This includes emissions data from the following sources:
IEA: updated data for 2012.
Emission Database for Global Atmospheric Research (EDGAR): 2011, 2012 and 2013 data.
Carbon Dioxide Information Analytics Centre (CDIAC): 2011, 2012 and 2013 data.
The IEA, EDGAR and CDIAC data series are similar but not identical. We attribute these differences to inconsistencies in definitions and timing of data collection. All three sources use a production-based approach to reporting emissions data – that is emissions that result from the production of goods and services within a country’s borders.
2.1 Benchmarks based on IEA data The IEA is an international independent body comprised of 29 member countries. It was initially designed to help member countries co-ordinate a collective response to major disruptions in the supply of oil. While this remains a key aspect of its work, the IEA has evolved, providing authoritative statistics and analysis on a range of energy-related issues.
IEA data presents emissions from fossil fuel combustion for 140 countries from 1970 to 2014. Emissions from fuel combustion represent around 70% of total global emissions, by far the largest share from human activity. The IEA data does not include emissions resulting from agriculture, industrial gases or other sources.1
The following figure presents benchmarks for carbon emissions from energy per GDP for 2011 and 2012 for the G20 countries.
1 IEA (2014), CO2 emissions from fuel combustion (2014 Edition),
http://www.iea.org/media/statistics/topics/emissions/CO2_Emissions_Overview.pdf
Deloitte Access Economics: Carbon Analytics #2 3
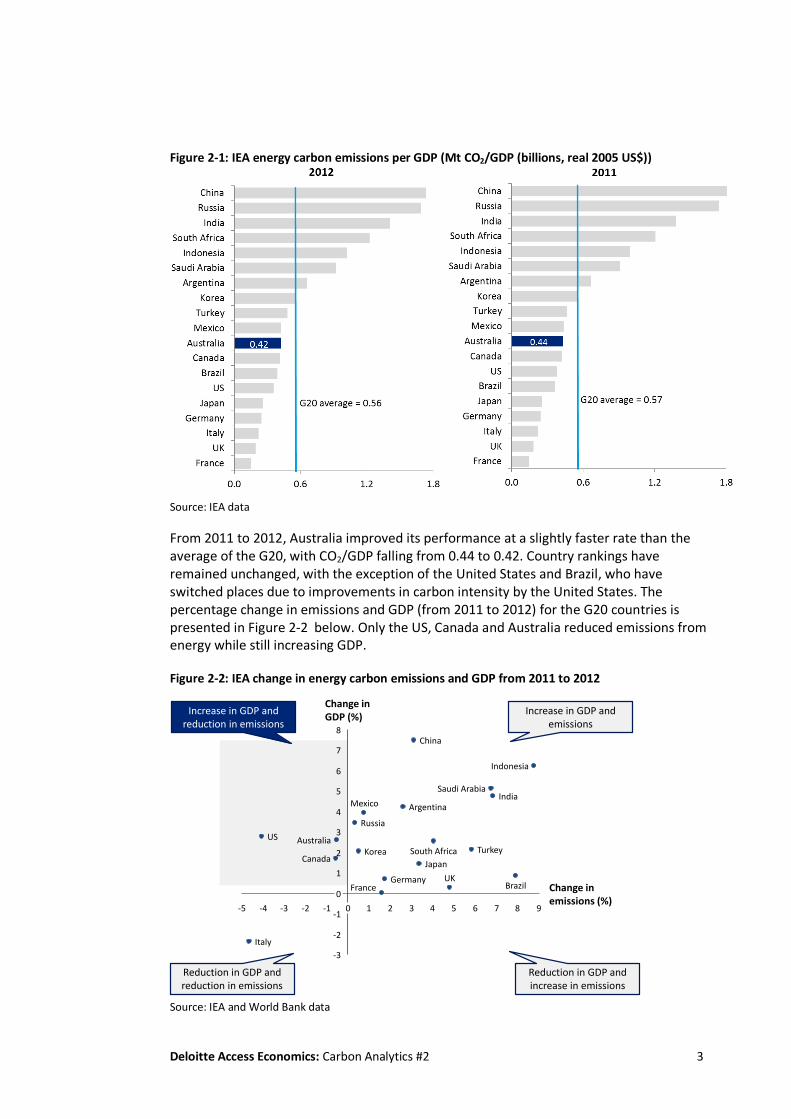
Figure 2-1: IEA energy carbon emissions per GDP (Mt CO2/GDP (billions, real 2005 US$))
Source: IEA data
From 2011 to 2012, Australia improved its performance at a slightly faster rate than the average of the G20, with CO2/GDP falling from 0.44 to 0.42. Country rankings have remained unchanged, with the exception of the United States and Brazil, who have switched places due to improvements in carbon intensity by the United States. The percentage change in emissions and GDP (from 2011 to 2012) for the G20 countries is presented in Figure 2-2 below. Only the US, Canada and Australia reduced emissions from energy while still increasing GDP.
Figure 2-2: IEA change in energy carbon emissions and GDP from 2011 to 2012
Source: IEA and World Bank data
Increase in GDP and emissions
Increase in GDP and reduction in emissions
Reduction in GDP and reduction in emissions
Reduction in GDP and increase in emissions
-3
-2
-1
0
1
2
3
4
5
6
7
8
-5 -4 -3 -2 -1 0 1 2 3 4 5 6 7 8 9
China
Russia
India
South Africa
Indonesia
Saudi Arabia
Argentina
Korea Turkey
Mexico
Australia
Canada
Brazil
US
Japan
Germany
Italy
UKFrance
Change in GDP (%)
Change in emissions (%)

Deloitte Access Economics: Carbon Analytics #2 4
2.2 Benchmarks based on EDGAR data The Emissions Database for Global Atmospheric Research (EDGAR) provides global anthropogenic emissions by country and on a spatial grid. EDGAR is a joint project of the European Commission JRC (Joint Research Centre) and the Netherlands Environmental Assessment Agency (PBL).
EDGAR reports time series, country-specific CO2 emissions from fossil fuel use and industrial processes (cement production, carbonate use of limestone and dolomite, non-energy use of fuels and other combustion). It does not include short-cycle biomass burning (such as agricultural waste burning) or large-scale biomass burning (such as forest fires).2
The following figures present benchmarks for carbon emissions from fossil fuel and cement production per GDP for 2011 and 2013 for the G20 countries.
Figure 2-3: EDGAR energy carbon emissions per GDP (Mt CO2/GDP (billions, real 2005 US$))
Source: EDGAR carbon emissions data, World Bank GDP data Note: includes CO2 from fossil fuels and cement production
Based on data sourced from EDGAR, in 2011 Australia was below the average but higher than Turkey and Mexico on emissions per GDP. By 2013, Australia’s ranking improves, reflecting both lower emissions and solid GDP growth.
The percentage change in emissions and GDP (from 2011 to 2013) for the G20 countries is presented in Figure 2-4 below. Consistent with the IEA data, only the US, Canada and Australia have reduced emissions while still increasing GDP. Australia has reduced emissions by 9% from fossil fuel and cement production while delivering GDP growth of just over 6%.
2 European Commission JRC website http://edgar.jrc.ec.europa.eu/overview.php?v=CO2ts1990-2013

Deloitte Access Economics: Carbon Analytics #2 5
Figure 2-4: EDGAR change in carbon emissions (from fossil fuel and cement production) and GDP from 2011 to 2013
Source: EDGAR and World Bank data.
2.3 Benchmarks based on CDIAC data The Carbon Dioxide Information Analysis Centre (CDIAC), which includes the World Data Centre for Atmospheric Trace Gases, serves as a primary climate-change data and information analysis collection centre for the United States Department of Energy (DOE).
CDIAC maintains estimates of carbon emissions from fossil fuel consumption and cement production.3
The following figures present benchmarks for carbon emissions from fossil fuel and cement production per GDP for 2011 and 2013 for the G20 countries.
3 Le Quere, C et al (2014), “Global Carbon Budget 2013”, in Earth System Science Data,
http://www.earth-syst-sci-data.net/6/235/2014/essd-6-235-2014.pdf
Increase in GDP and emissions
Increase in GDP and reduction in emissions
Reduction in GDP and reduction in emissions
Reduction in GDP and increase in emissions
-6
-4
-2
0
2
4
6
8
10
12
14
16
-10 -8 -6 -4 -2 0 2 4 6 8 10 12 14
France
China
Italy
Russia
India
Indonesia
South Africa
Saudi Arabia
ArgentinaKorea
Turkey
MexicoAustralia
BrazilCanada
USJapan
Germany
UK
Change in GDP (%)
Change in emissions (%)
Deloitte Access Economics: Carbon Analytics #2 6
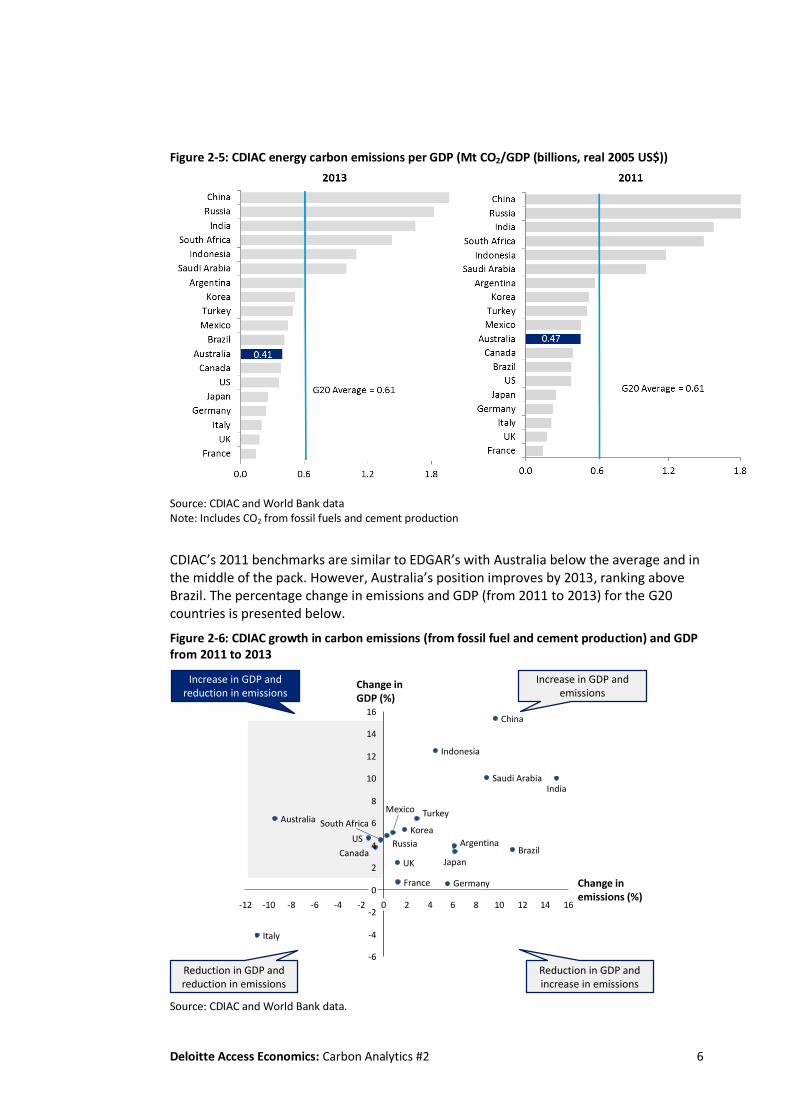
Figure 2-5: CDIAC energy carbon emissions per GDP (Mt CO2/GDP (billions, real 2005 US$))
Source: CDIAC and World Bank data Note: Includes CO2 from fossil fuels and cement production
CDIAC’s 2011 benchmarks are similar to EDGAR’s with Australia below the average and in the middle of the pack. However, Australia’s position improves by 2013, ranking above Brazil. The percentage change in emissions and GDP (from 2011 to 2013) for the G20 countries is presented below.
Figure 2-6: CDIAC growth in carbon emissions (from fossil fuel and cement production) and GDP from 2011 to 2013
Source: CDIAC and World Bank data.
Increase in GDP and emissions
Increase in GDP and reduction in emissions
Reduction in GDP and reduction in emissions
Reduction in GDP and increase in emissions
-6
-4
-2
0
2
4
6
8
10
12
14
16
-12 -10 -8 -6 -4 -2 0 2 4 6 8 10 12 14 16
India
South Africa
Indonesia
Saudi Arabia
Argentina
TurkeyMexico
Brazil
Australia
Canada
US
Japan
Germany
Italy
UK
Korea
France
China
Russia
Change in emissions (%)
Change in GDP (%)

Deloitte Access Economics: Carbon Analytics #2 7
Consistent with the EDGAR data, the CDIAC data shows that Australia has reduced emissions by 9% from 2011 to 2013, while delivering relatively strong GDP growth.
2.4 Australia’s energy carbon emissions In Australia, carbon emissions from energy are mainly from electricity generation, followed by stationary energy used in manufacturing and transport energy emissions. From 2011 to 2013, total energy emissions fell by 3%, with the electricity sector reducing emissions by about 9%.
Figure 2-7: Australia’s carbon emissions from energy (Mt CO2)
Source: NGER data (calendar year). Data not complete for 2014
The National Electricity Market (NEM), which accounts for over 85% of national electricity generation, saw emissions from electricity generation fall by 10% from 2011 to 2013. Cumulative emission reductions from 2011 to 2013 in the NEM are presented in Figure 2-8 below. Falling customer demand was the key source of reductions, followed by increased hydro generation, other sources (such as changes in the wholesale generation mix, with a lower reliance on coal-fired generation) and increased renewable energy generation to meet the Large-scale Renewable Energy Target (LRET).
0
50
100
150
200
250
300
350
400
Stationary Energy (excluding electricity)
Transport
Electricity
201320122011
-1% -2%

Deloitte Access Economics: Carbon Analytics #2 8
Figure 2-8: Breakdown of reduction in emissions in the NEM from 2011 to 2013 (Mt CO2)
Source: Deloitte Access Economics analysis, AEMO data
National Greenhouse and Energy Reporting (NGER) data for total energy emissions is not available for 2014, however we note that after falling in the previous years, emissions in the NEM increased by around 1% from 2013 to 2014 (calendar year) due to stabilisation in demand and greater output from coal-fired generation.
2.5 Summary While there are some differences between the sources, data from the IEA, EDGAR and CDIAC all indicate that Australia has improved its energy carbon emissions per unit of GDP in recent years. Both the EDGAR data and CDIAC data also show that Australia has improved its relative position among the G20 concerning energy carbon emissions from 2011 to 2013. Further, Australia, the United States and Canada are the only countries that reduced carbon emissions from energy while increasing GDP over the same period. De-linking GDP growth from emissions, or de-carbonisation of the economy, is crucial in achieving the twin objectives of maintaining economic growth while addressing climate change.
The analysis above and in our previous report follows the conventional framework of measuring emissions on a production basis – that is, emissions occurring within a country’s territorial borders. In the remainder of this paper we consider the role of consumption in driving emissions and the implications for global action on climate change.
32
28
24
20
16
12
8
4
0
Other
4.2
Reduction due forced outages
0.4
Reduction due to increased Hydro
7.7
Reduction due to LRET
2.7
Reduction due to fall in demand
13.4
Total emissions reduction
28.4
MT

Deloitte Access Economics: Carbon Analytics #2 9
3 Consumption-based carbon emissions This chapter provides an overview of the conceptual framework for consumption-based emissions and outlines the approach taken and data used for this report.
3.1 Overview of key concepts Consistent with the United Nations Framework Convention on Climate Change (UNFCCC) international climate negotiations and target setting discussions have to-date centred on production-based or territorial emissions – that is, emissions arising from the production of goods and services within a country’s borders.4 Consumption-based measures of emissions provide an alternative view by considering the emissions related to a country’s final demand (i.e. carbon footprint), rather than production.
Consumption-based emissions allocate emissions to consumption, explicitly take into account emissions embedded in international trade flows, and include emissions embedded in imports but exclude emissions from goods and services produced to serve overseas markets.
Production-based emissions allocate emissions to production and include all emissions from domestic production, regardless of whether it is to serve domestic or overseas markets.
At a global level, consumption-based and production-based emissions are ultimately two sides of the same coin – total consumption-based emissions must be equal to total production-based emissions; the only difference is allocation. However, from an individual country perspective, the two measures can differ substantially depending on the nature and extent of international trade the country engages in.
3.2 Why measure consumption-based emissions? The emissions embodied in the international trade of goods and services are significant. Imported emissions have historically accounted for, on average, around 20% of energy-related carbon emissions of countries in the G20. This implies that a significant proportion of emissions attributable to the consumption of goods and services occur outside the direct control of the consuming country.
By failing to explicitly recognise emissions associated with international trade, production-based emissions measures provide an incomplete picture of the drivers of emissions and the effectiveness of action to reduce emissions. In particular, a production-based emissions target which does not encompass all centres of production creates a risk of ‘carbon leakage’. Carbon leakage is defined by the Intergovernmental Panel on Climate Change
4 2006 IPCC Guidelines for National Greenhouse Gas Inventories, Volume 1: General Guidance and
Reporting. The Guidelines set out the requirements for reporting emissions to the UNFCCC and under the Kyoto Protocol, and define anthropogenic emissions as emissions “…taking place within national territory and offshore areas over which the country has jurisdiction.” p.1.4

Deloitte Access Economics: Carbon Analytics #2 10
(IPCC) as “the increase in CO2 emissions outside the countries taking domestic mitigation action divided by the reduction in the emissions of these countries.”5 More broadly, carbon leakage can refer to the shifting of productive activity from countries with emissions reduction targets to those without targets. To the extent that production moves to countries with more emissions-intensive economies, carbon leakage may lead to a net increase in global emissions.
3.3 The EORA MRIO The estimation of consumption-based emissions requires an assessment of not only the emissions intensity of production within a country’s borders, but also the emissions intensity of production of all of the country’s trading partners.
It is widely accepted that multi-regional input-out (MRIO) analysis is the best approach to estimating consumption-based emissions. Consumption-based emissions and MRIO modelling can provide crucial insights into the drivers of carbon leakage and changes in global production more generally. Appendix A provides a summary and comparison of some of the most widely used MRIO databases and models for estimating consumption-based emissions.
For the purpose of our analysis, we have selected the Eora MRIO database6 and model as the preferred tool for a number of reasons:
Specifically designed to assess resource use efficiency, including carbon emissions, from a consumption-based viewpoint – this differs from databases such as GTAP and WIOD, which have a much broader function in modelling economic impacts.
Most extensive coverage – Effectively covers the entire globe with 189 countries in the database. GTAP is the next largest, with 140 countries, while GRAM and WIOD cover 53 and 40 countries, respectively.
Most up to-date data set and most frequent updates – Data has been updated to 2011 and is in the process of being updated for 2012. Furthermore, like WIOD, Eora contains a continuous time-series of historical data, as opposed to GTAP which only includes reference year data in 3-4 year intervals for model calibration, and is not designed for time-series analysis.
Locally based and accessible – while other databases are United States or European-based, the Eora database was developed at Sydney University and is now based at KGM & Associates in Sydney. Deloitte Access Economics has a good working relationship with the Eora team, enabling us direct access to the compilers of the database to test assumptions and extract specific outputs.
Track record of producing analysis – Eora is used by the CSIRO and the United Nations Environment Development Programme studies on resource use efficiency.
Note that in comparing carbon emissions across countries, consumption-based models will typically treat emissions from international transport differently from production-based databases such as the IEA. The IEA figures are designed to accord with the IPCC Guidelines
5 IPCC (2007), Fourth Assessment Report: Climate Change 2007,
https://www.ipcc.ch/publications_and_data/ar4/wg3/en/ch11s11-7-2.html 6 Lenzen M, Kanemoto K, Moran D, and Geschke A (2012) “Mapping the structure of the world
economy”, in Environmental Science & Technology, vol. 46(15), pp 8374-8381

Deloitte Access Economics: Carbon Analytics #2 11
for National Greenhouse Gas Inventories, which exclude international transport emissions from country totals.7 Consumption-based emissions accounting frameworks, such as the Eora MRIO database used for this report, allocate all emissions from the supply chain including from international transport to the country where final consumption occurs. According to the IEA data, in 2012 emissions from international transport (international aviation and marine bunkers) amounted to 3.4% of total emissions from fuel combustion.8
7 Independent Panel on Climate Change (2006) 2006 IPCC Guidelines for National Greenhouse Gas Inventories, p.1.5 8 IEA (2014), CO2 Emissions from fuel combustion highlights

Deloitte Access Economics: Carbon Analytics #2 12
4 Key results This chapter sets out the key results of our analysis of consumption-based emissions from energy in the G20. We first look at the G20 as a whole, before reviewing the trends and drivers of changes in emissions among major emissions importing and exporting countries.
4.1 Consumption-based emissions in the G20
4.1.1 Comparison of consumption and production-based emissions
The following chart illustrates both consumption and production-based carbon emissions from energy for the G20 over the last two decades.
Figure 4-1: Consumption and production-based energy emissions in the G20 (Mt CO2)
Source: Eora MRIO
Production-based and consumption-based emissions have generally moved in unison in the G20 over the last two decades, with very little in the way of net trade in emissions into or out of the G20. The overall stability of net emissions flows is expected, given that the G20 accounts for the vast majority of global trade and this trade is predominantly internal trade between G20 nations.
However, we note that the significance of traded emissions to total emissions has grown substantially, with more than half of the consumption-based emissions (i.e. carbon footprint) of some countries now coming from emissions produced elsewhere.
-
5,000
10,000
15,000
20,000
25,000
30,000
Production-based emissions
Consumption-based emissions

Deloitte Access Economics: Carbon Analytics #2 13
Figure 4-2: Imported energy emissions as a % of total consumed energy emissions, 2011 (Mt CO2)
Source: Eora MRIO
4.1.2 Key importers and exporters of emissions within the G20
While the G20 as a whole is balanced, significant emissions import and export imbalances for individual countries within the G20 are common. The following chart illustrates the net emissions trade balance of each country within the G20 for 2011.
Figure 4-3: G20 countries’ net energy emissions balance, 2011 (Mt CO2)
Source: Eora MRIO
Deloitte Access Economics: Carbon Analytics #2 14
The countries at the top of the previous chart are net importers of embedded emissions through trade – that is, the emissions embedded in their imports of goods and services exceed the emissions embedded in their exports. For these countries, consumption-based emissions will be greater than production-based emissions.
There are several key factors that will typically determine whether a country is a net importer or net exporter of emissions:
Carbon intensity (CO2/GDP) of the domestic economy (encompassing energy intensity and emissions intensity) and of major trading partners.
Type of goods traded – a country that imports mainly finished products (with relatively high levels of embodied emissions) and exports mainly primary or intermediate products (with relatively low embodied emissions) will tend to be a net importer of emissions.
Underlying trade balance – generally, a net importer of goods and services will also be a net importer of emissions. However, this is not always the case – carbon intensity and the nature of traded goods may over-ride the underlying trade balance.
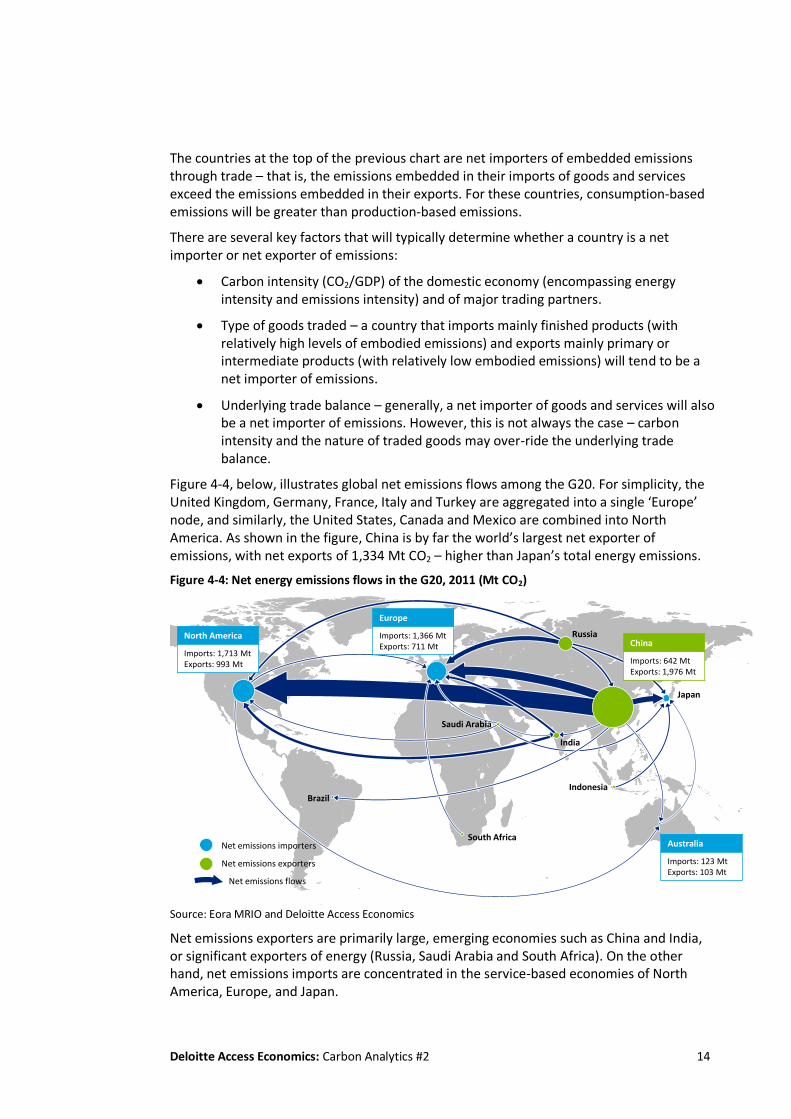
Figure 4-4, below, illustrates global net emissions flows among the G20. For simplicity, the United Kingdom, Germany, France, Italy and Turkey are aggregated into a single ‘Europe’ node, and similarly, the United States, Canada and Mexico are combined into North America. As shown in the figure, China is by far the world’s largest net exporter of emissions, with net exports of 1,334 Mt CO2 – higher than Japan’s total energy emissions.
Figure 4-4: Net energy emissions flows in the G20, 2011 (Mt CO2)
Source: Eora MRIO and Deloitte Access Economics
Net emissions exporters are primarily large, emerging economies such as China and India, or significant exporters of energy (Russia, Saudi Arabia and South Africa). On the other hand, net emissions imports are concentrated in the service-based economies of North America, Europe, and Japan.
Brazil
North America
Imports: 1,713 MtExports: 993 Mt
Europe
Imports: 1,366 MtExports: 711 Mt China
Imports: 642 MtExports: 1,976 Mt
Russia
Japan
India
Indonesia
Saudi Arabia
Net emissions importers
Net emissions exporters
Net emissions flows
South AfricaAustralia
Imports: 123 MtExports: 103 Mt

Deloitte Access Economics: Carbon Analytics #2 15
4.2 Emissions importing countries The largest net importers of emissions from energy in 2011 were the United States, Japan, and the European members of the G20 (the UK, Italy, France and Germany). In general, the imbalance of imported over exported emissions is likely to reflect factors such as:
Transition to service-based economies – as economies transition away from energy intensive sectors such as agriculture and manufacturing towards more service-based economies, products from these sectors must be imported from other countries, driving up consumption-based emissions, even while production-based emissions might stabilise or fall.
Decarbonisation of the energy supply – increasing penetration of gas, renewables and nuclear energy will tend to lower production-based emissions relative to consumption-based emissions (all else being equal), increasing net imports of emissions.
In this section we review emissions trends and drivers for the United States, United Kingdom and France to illustrate how some of these issues have played out for these countries.
4.2.1 United States
In 2011, the United States’ production-based emissions accounted for around 20% of total emissions in the G20. As such, trends in production-based and consumption-based emissions for the United States (driven by underlying trade relationships and emissions profiles of key trading partners) will have a significant impact on collective action to reduce emissions.
The following figure provides a comparison of consumption-based emissions and production-based emissions for the United States from 1992 to 2011.
Figure 4-5: United States – consumption and production-based energy emissions (Mt CO2)
Source: Eora MRIO
0
1,000
2,000
3,000
4,000
5,000
6,000
7,000
8,000
Consumption-based emissions
Production-based emissions

Deloitte Access Economics: Carbon Analytics #2 16
The United States has undergone a dramatic change in its traded emissions, from being a fairly minor net exporter of emissions in the early 1990s, to rapidly becoming the world’s largest net importer of emissions from 1997 onwards. From 1992 to 2011:
Production-based emissions grew by 9%, or 454 Mt.
Consumption-based emissions grew by 26%, or 1,225 Mt.
A comparison of emissions embedded in imports to emissions embedded in exports for the United States (Figure 4-6, below) illustrates that while exported emissions have remained relatively stable, imported emissions have risen by several multiples. The net result is the appearance of the wedge between consumption-based emissions and production-based emissions, as shown in the chart above.
Figure 4-6: United States – energy emissions embodied in trade (Mt CO2)
Source: Eora MRIO
A key driving factor of the United States’ increasing emissions imports and the gap between consumption-based and production-based emissions appears to be the United States’ trade relationship with China. Imports from China increased by almost 20 times over the period, growing from approximately US$25 billion in 1992 to nearly US$400 billion in 2011.9
As set out in our first report and Chapter 2 of this report, the United States is a relatively strong performer on carbon-intensity (CO2/GDP) of the economy (ranking fifth among the G20). From 1992 to 2011, the United States’ GDP grew at an average rate of 2.8% per annum, while production-based emissions grew by only 0.5% per annum (on average).10 This suggests a promising outlook for the United States’ prospects for maintaining economic growth while stabilising, or even reducing, production-based emissions. However, absent significant action to reduce carbon intensity (CO2/GDP) by its key trading partners, to the extent that current trends of a widening trade deficit continue, there are likely to be further increases in the United States’ consumption-based emissions.
9 United States Census Bureau, https://www.census.gov/foreign-trade/balance/c0004.html
10 Compound Average Growth Rates based on Eora MRIO data
-1,000
-500
0
500
1,000
1,500
2,000Emission imports
Emission exports
Net emissions imports
Canada
Japan
China
Mexico
UK
Other
US 2011 emission exports
China
Canada
Mexico
India
Japan
Other US 2011 emission imports

Deloitte Access Economics: Carbon Analytics #2 17
4.2.2 United Kingdom
The following figure compares consumption-based emissions and production-based emissions from energy for the United Kingdom.
Figure 4-7: United Kingdom – consumption and production-based energy emissions (Mt CO2)
Source: Eora MRIO
The UK’s consumption-based emissions have consistently been higher than its production-based emissions with the difference between the two metrics steadily increasing over the last two decades. From 1992 to 2011:
Production-based emissions fell by 112 Mt CO2, or 21%.
Consumption-based emissions increased by around 7 Mt CO2, or 1%.
As of 2011, the United Kingdom was second only to France in terms of carbon intensity (CO2/GDP). Over the analysis period, the United Kingdom achieved both higher average GDP growth than France (2.5% per annum versus 1.6% per annum) and reduced emissions by more (1.2% per annum versus France’s reductions of 0.7% per annum).11
However, like the United States, the United Kingdom has also experienced significant increases in imported emissions. The figure below illustrates the trends for imports and exports of emissions embedded in trade.
11 Compound Average Growth Rates based on Eora MRIO data
0
100
200
300
400
500
600
700
800
900
Consumption-based emissions
Production-based emissions

Deloitte Access Economics: Carbon Analytics #2 18
Figure 4-8: United Kingdom – energy emissions embodied in trade (Mt CO2)
Source: Eora MRIO
There appear to be several factors driving the UK’s reductions in production-based emissions and (relative) increase in consumption-based emissions:
Decarbonisation of energy supply (and consequent reductions in CO2/GDP) – the 1990s saw dramatic changes in the UK’s generation mix, with gas-fired generation displacing oil and coal. In 1992, coal and oil made up 61% and 11% of the primary energy supply, respectively, with natural gas accounting for only 1%. By 2011, natural gas had risen to 35%, with coal falling to 34% and oil to 1%. Notably, while nuclear power is a significant contributing factor to the UK’s low carbon intensity, from 1992 to 2011 the share of capacity accounted for by nuclear fell from 24% to 20%.12
Transition to a services economy – the contribution to GDP from manufacturing declined significantly over the period, largely to be replaced by a services economy.13 As a result, the United Kingdom must now source more manufactured products from overseas. The impact of this is to reduce production-based emissions and increase imported emissions, due to the generally higher emissions intensity of manufacturing output as compared to the services sector.
Increasing trade deficit – the United Kingdom has historically been a net importer of goods and services, and its trade deficit has grown substantially over the last 20 years, from around US$30 billion in 1992 to US$160m in 2011.14 All else remaining equal, growth in the trade deficit will tend to increase imports of emissions and consumption-based emissions, while reducing production-based emissions as more and more domestic demand is served by overseas producers.
12
Department of Energy and Climate Change (2014), Historical electricity data: 1920 to 2013, statistical data set, https://www.gov.uk/government/collections/electricity-statistics 13 UK Office for National Statistics 14
OECD (2015), Trade in goods and services (indicator), Accessed on 18 June 2015, https://data.oecd.org/trade/trade-in-goods-and-services.htm
-200
-100
0
100
200
300
400
500Emission imports
Emission exports
Net emissions imports
China
US
Russia Germany
India
OtherUK 2011 emission imports

Deloitte Access Economics: Carbon Analytics #2 19
The United Kingdom has made significant advances in decarbonisation of its energy supply and economy, thereby reducing production-based emissions over the analysis period through improvements in carbon intensity and the changing structure of the economy. However, in terms of the net effect on global emissions, this appears to have been off-set to some extent by increases in imported emissions to satisfy domestic consumption.
4.2.3 France
The following figure provides a comparison of consumption-based emissions and production-based emissions for France.
Figure 4-9 France – consumption and production-based energy emissions (Mt CO2)
Source: Eora MRIO
France leads the G20 in carbon intensity (0.15 Mt CO2/GDP (US$ billions) in 2012). As set out in our first report in the Carbon Analytics series, this is primarily due to the dominance of nuclear power in the generation mix. In 2011 only 8% of France’s electricity was produced from fossil fuels compared to 89% for Australia.15 This comparative advantage in carbon intensity sustains the wedge between production-based emissions and consumption-based emissions, and also suggests that the goods that France imports will have higher emissions intensity than those produced locally.
A comparison of imported and exported emissions for France is shown in Figure 4-10.
15
Deloitte Access Economics (2014), Emissions metrics: Australia’s carbon footprint in the G20, IEA data, p. 19.; EIA, ‘Country analysis’ http://www.eia.gov/beta/international/analysis.cfm?iso=FRA
0
100
200
300
400
500
600
Consumption-based emissions
Production-based emissions

Deloitte Access Economics: Carbon Analytics #2 20
Figure 4-10: France – energy emissions embodied in trade (Mt CO2)
Source: Eora MRIO
As shown above, emissions from imports have consistently been around three times higher than emissions embedded in exports. However, France’s imports and exports of goods and services have historically been relatively balanced. While France has become a net importer of goods and services since around 2000, the value of the trade deficit, US$120 billion in 2011, is small in relation to exports of US$600 billion and imports of US$720 billion. Therefore, the gap between France’s imported and exported emissions appears to be largely driven by differences in emissions intensity between France and its key trading partners.
4.3 Emissions exporting countries In the early 1980s, energy exports made Russia and Saudi Arabia the most significant net exporters of emissions in the G20. However, rapid economic growth has seen China overtake Russia to become (by far) the largest net exporter, and India overtake the United States, South Africa and Saudi Arabia to move from sixth to third largest net exporter. In this section we review emissions trends and drivers for China, India and Canada.
4.3.1 China
The following figure provides a comparison of consumption-based emissions and production-based emissions for China from 1992 to 2011.
-150
-100
-50
0
50
100
150
200
250
300
350Emission imports Emission exports Net emissions imports
US
UK
Germany
Italy
China
Other
France 2011
emission exports
Deloitte Access Economics: Carbon Analytics #2 21
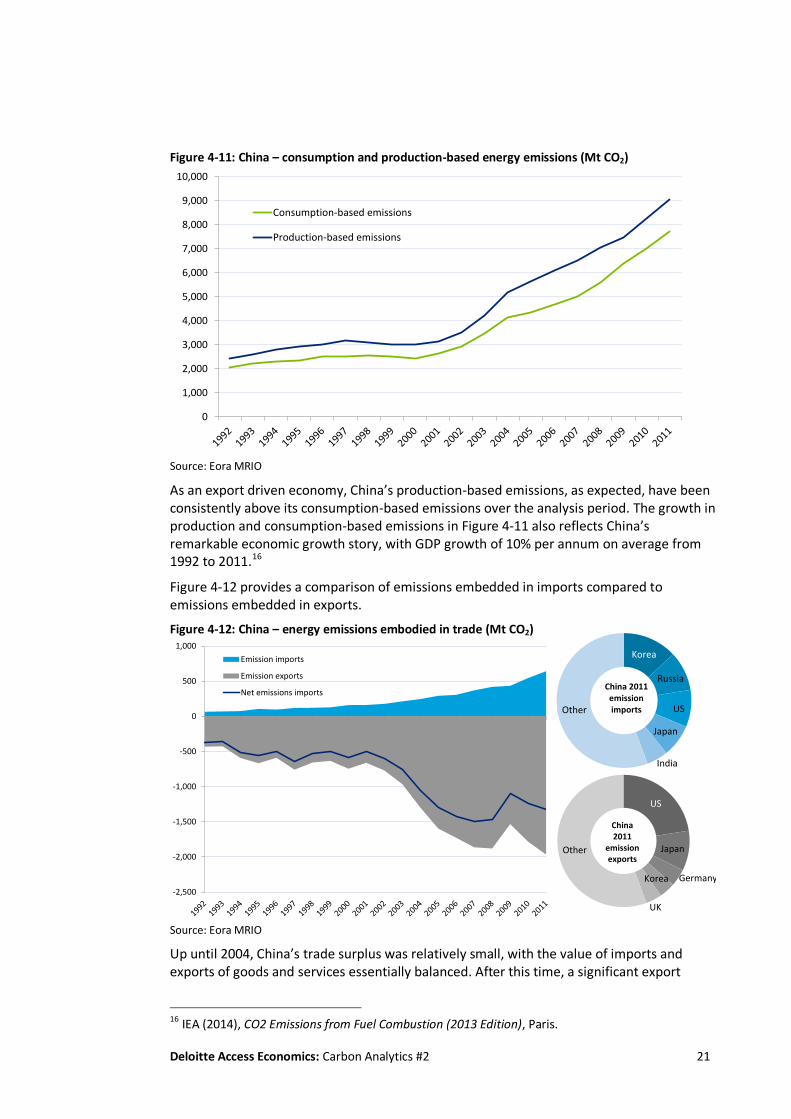
Figure 4-11: China – consumption and production-based energy emissions (Mt CO2)
Source: Eora MRIO
As an export driven economy, China’s production-based emissions, as expected, have been consistently above its consumption-based emissions over the analysis period. The growth in production and consumption-based emissions in Figure 4-11 also reflects China’s remarkable economic growth story, with GDP growth of 10% per annum on average from 1992 to 2011.16
Figure 4-12 provides a comparison of emissions embedded in imports compared to emissions embedded in exports.
Figure 4-12: China – energy emissions embodied in trade (Mt CO2)
Source: Eora MRIO
Up until 2004, China’s trade surplus was relatively small, with the value of imports and exports of goods and services essentially balanced. After this time, a significant export
16 IEA (2014), CO2 Emissions from Fuel Combustion (2013 Edition), Paris.
0
1,000
2,000
3,000
4,000
5,000
6,000
7,000
8,000
9,000
10,000
Consumption-based emissions
Production-based emissions
-2,500
-2,000
-1,500
-1,000
-500
0
500
1,000
Emission imports
Emission exports
Net emissions imports
US
Japan
GermanyKorea
UK
Other
China 2011
emission exports
Korea
Russia
US
Japan
India
Other
China 2011 emission imports

Deloitte Access Economics: Carbon Analytics #2 22
surplus appears in the trade data, which is consistent with the upswing in exported emissions. However, even prior to the appearance of the trade surplus, China’s exported emissions were up to eight times higher than its imported emissions. The key driver of this differential is China’s high carbon-intensity (highest in the G20 at 1.73 Mt CO2/GDP (US$ billions) in 2012) and the relative carbon-intensities of key trading partners.
In relation to exported emissions, China’s growth in production-based emissions due to its rapid economic growth is well known. Over the analysis period, China’s generation mix has remained relatively unchanged, with fossil fuel based generation (primarily coal, followed by oil) comprising 70-80% of generation capacity.17 As set out in our first report in the Carbon Analytics series, China’s carbon intensity fell substantially during the 1990s, but has largely stabilised since 2000. The significant increase in production-based and consumption-based emissions since this time reflects continued growth in the economy but a relatively constant carbon intensity.
In relation to China’s imports, the decarbonisation of energy supply of key trading partners, such as South Korea and the United States, plus increasing imports of services and decreasing imports of manufactured goods, will have moderated growth in emissions embodied in imports.
4.3.2 India
The following figure provides a comparison of consumption-based emissions and production-based emissions for India.
Figure 4-13: India – consumption and production-based energy emissions (Mt CO2)
Source: Eora MRIO
India’s production-based emissions have consistently been higher than its consumption-based emissions. As such, India is a long-standing net exporter of emissions.
A comparison of emissions embedded in imports compared to emissions embedded in exports for India (Figure 4-14, below) provides a clear illustration of the growing wedge
17 IEA data, http://www.eia.gov/countries/cab.cfm?fips=ch; and United States Energy Information Administration, International Energy Statistics http://www.eia.gov/cfapps/ipdbproject/IEDIndex3.cfm?tid=2&pid=2&aid=7
0
500
1,000
1,500
2,000
2,500
Consumption-based emissions
Production-based emissions

Deloitte Access Economics: Carbon Analytics #2 23
between production-based and consumption-based emissions, and India’s increasing net emission’s exports.
Figure 4-14: India – energy emissions embodied in trade (Mt CO2)
Source: Eora MRIO
In general, net emissions exporting countries are expected to operate under a trade surplus. However, the opposite is true for India, which has not only maintained a significant net trade deficit over the analysis period, but the trade deficit has been increasing over time (Figure 4-15).
Figure 4-15 India - net trade in goods and services (US$, billions)
Source: OECD (2015), Trade in goods and services (indicator), Accessed on 18 June 2015,
https://data.oecd.org/trade/trade-in-goods-and-services.htm
This disconnect between India’s underlying net trade position with respect to goods and services (net importer) and emissions trade (net exporter), is likely to be due to the carbon intensity of the economy and the nature of imports and exports:
India’s carbon intensity is the third highest in the G20 at 1.41 Mt CO2/GDP (US$ billions) in 2012, with 81% of its energy generation coming from fossil fuels,
-500
-400
-300
-200
-100
0
100
200
300
Emission imports
Emission exports
Net emissions imports
US
China
UKGermany
Japan
Other
India 2011
emission exports
China
Saudi Arabia
USRussia
Korea
Other
India 2011
emission imports

Deloitte Access Economics: Carbon Analytics #2 24
including 59% of its installed capacity coming from coal.18 While India has made improvements in carbon intensity over the period (down from 1.82 Mt CO2/GDP (US$ billions) in 1992), most G20 countries (including India’s key trading partners) have been improving carbon intensity at a faster rate.
India’s main import is crude oil, followed by gold and silver, all of which have relatively low embedded emissions in that limited processing is required prior to export. On the other hand its main exports, refined petroleum products, gems and jewellery require higher levels of domestic processing and therefore will have higher embedded emissions (India essentially imports the raw materials for its main exports).19
4.3.3 Canada
Canada provides a useful point of comparison for Australia within the G20, as there are similarities between the two countries on factors such as GDP (Canada US$1.83 trillion versus Australia’s US$1.56 trillion) and energy intensity of the economies (around 0.4-0.5 kg CO2 /US$ of GDP).20 However, there are also some significant differences – Canada’s trading relationships are dominated by the United States (as opposed to Australia with a closer relationship with China), and only 22% of Canada’s electricity is produced from fossil fuels compared to 89% for Australia due to Canada’s high proportion of hydroelectric generation (just over 60%) and significant contribution from nuclear power (around 15%).21
Figure 4-16 below sets out Canada’s consumption-based and production-based energy emissions over the last two decades.
Figure 4-16: Canada – consumption and production-based energy emissions (Mt CO2)
Source: Eora MRIO
18
EIA (2014), International Energy Data and Analysis http://www.eia.gov/beta/international/analysis.cfm?iso=IND? 19 Reserve Bank of India 20
IEA, CO2 Emissions from Fuel Combustion (2013 Edition) 21 Ibid.
0
100
200
300
400
500
600
Consumption-based emissions
Production-based emissions

Deloitte Access Economics: Carbon Analytics #2 25
Figure 4-17 shows Canada’s energy emissions embodied in trade, plus key trading partners for emissions imports and exports for 2011.
Figure 4-17: Canada – energy emissions embodied in trade (Mt CO2)
Source: Eora MRIO
Canada has historically been a strong net exporter in terms of both goods and services and emissions. This changed at the onset of the global financial crisis, with Canada recording a (small) trade deficit in 2009 for the first time since the 1970s, largely due to a severe drop in exports to the United States, by far Canada’s most significant trade partner.
In the last few years Canada’s imports and exports of emissions have been roughly balanced, which also corresponds to the balance in the underlying trade of goods and services. This implies that even though Canada’s traded emissions as a proportion of its total emissions are relatively high (around 36%), on average the carbon intensity of Canada’s imports matches the carbon intensity of its exports.
On the other hand, while Australia has run a trade deficit for the majority of the last two decades, its emissions exports have been higher than its emissions imports for most of this period. Australia’s higher carbon intensity (largely due to higher usage of fossil fuels) and the nature of exports are likely to be key drivers of this outcome. For example, both countries are significant exporters of natural gas, but while all of Canada’s gas exports are via pipeline to the United States, Australia’s gas exports must all leave the country as LNG, which is more emissions intensive to produce.
4.4 Australia’s import and export emissions As shown in Figure 4-18 Australia’s production-based emissions have historically exceeded its consumption-based emissions. However, the differential between the two measures has been eroded over the last decade.
-250
-200
-150
-100
-50
0
50
100
150
200
250
Emission imports
Emission exports
Net emissions imports
US
China
JapanUK
Other
Canada 2011
emission exports
US
China
India Russia
OtherCanada
2011 emission imports

Deloitte Access Economics: Carbon Analytics #2 26
Figure 4-18: Australia – consumption and production-based energy emissions (Mt CO2)
Source: Eora MRIO
A review of Australia’s emissions embedded in trade shows that while Australia has generally been a net emissions exporter, the increase in emissions imports has outstripped that of emissions exports since 2000, with Australia transitioning to a net importer of emissions in the last few years.
Figure 4-19: Australia – energy emissions embodied in trade (Mt CO2)
Source: Eora MRIO
Even though 2009 saw Australia transition from being a net importer of goods and services to a net exporter, this also corresponded with moving from a net exporter of emissions to a net importer. This somewhat counterintuitive result is driven to a large extent by a change in key trading partners, and in particular, relatively high-emissions intensity products from China displacing trade from the United States.
China has high carbon intensity (CO2/GDP) relative to Australia’s other key trading partners – in 2011, China’s 1.81 Mt CO2/GDP (US$ billions) was almost five times higher than the
0
50
100
150
200
250
300
350
400
450
500
Consumption-based emissions
Production-based emissions
-150
-100
-50
0
50
100
150
Emission imports
Emission exports
Net emissions imports
Japan
China
US
Korea
India
Other
Australia 2011
emission exports
China
US
Saudi Arabia Japan India
OtherAustralia
2011 emission imports
Deloitte Access Economics: Carbon Analytics #2 27
United States metric of 0.38 Mt CO2/GDP (US$ billions). In 2009 China overtook the United States to become the single largest source of imports, and also imported emissions, for Australia. By 2011 China accounted for around 15% of Australia’s total imports, but around 27% of total emissions embedded in imports. In contrast, the United States accounted for around 13% of Australia’s imports and only 18% of imported emissions.22
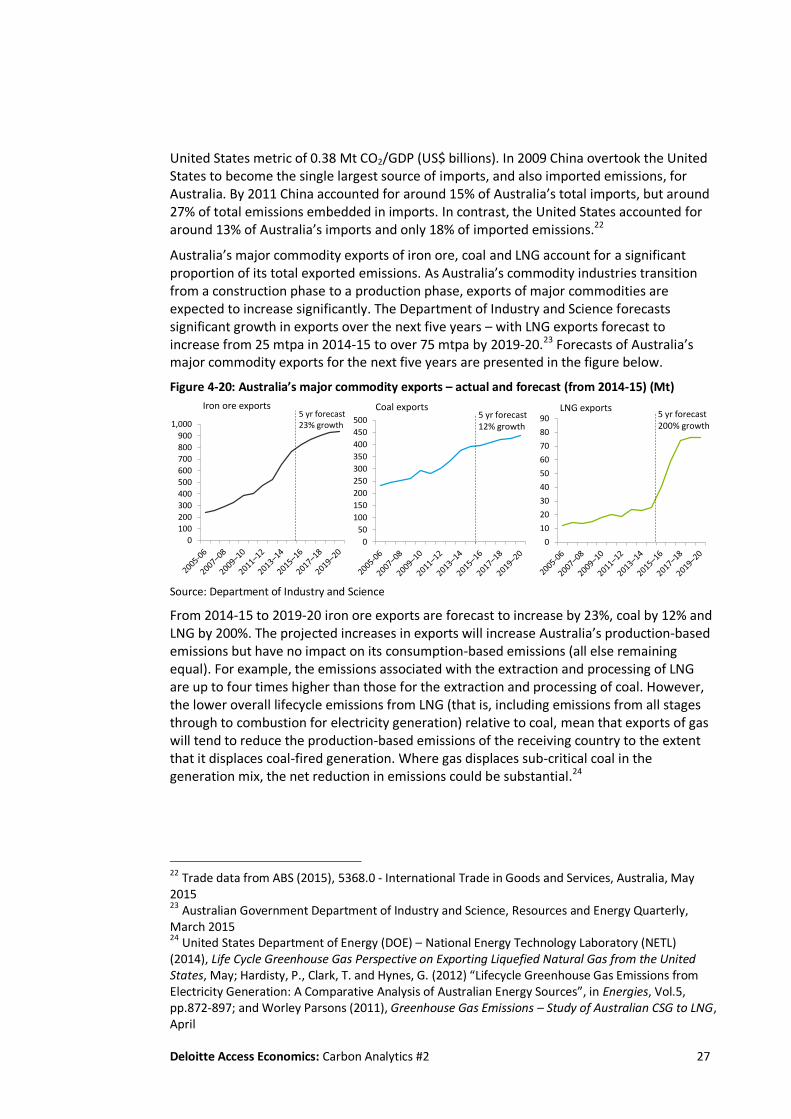
Australia’s major commodity exports of iron ore, coal and LNG account for a significant proportion of its total exported emissions. As Australia’s commodity industries transition from a construction phase to a production phase, exports of major commodities are expected to increase significantly. The Department of Industry and Science forecasts significant growth in exports over the next five years – with LNG exports forecast to increase from 25 mtpa in 2014-15 to over 75 mtpa by 2019-20.23 Forecasts of Australia’s major commodity exports for the next five years are presented in the figure below.
Figure 4-20: Australia’s major commodity exports – actual and forecast (from 2014-15) (Mt)
Source: Department of Industry and Science
From 2014-15 to 2019-20 iron ore exports are forecast to increase by 23%, coal by 12% and LNG by 200%. The projected increases in exports will increase Australia’s production-based emissions but have no impact on its consumption-based emissions (all else remaining equal). For example, the emissions associated with the extraction and processing of LNG are up to four times higher than those for the extraction and processing of coal. However, the lower overall lifecycle emissions from LNG (that is, including emissions from all stages through to combustion for electricity generation) relative to coal, mean that exports of gas will tend to reduce the production-based emissions of the receiving country to the extent that it displaces coal-fired generation. Where gas displaces sub-critical coal in the generation mix, the net reduction in emissions could be substantial.24
22
Trade data from ABS (2015), 5368.0 - International Trade in Goods and Services, Australia, May 2015 23
Australian Government Department of Industry and Science, Resources and Energy Quarterly, March 2015 24
United States Department of Energy (DOE) – National Energy Technology Laboratory (NETL) (2014), Life Cycle Greenhouse Gas Perspective on Exporting Liquefied Natural Gas from the United States, May; Hardisty, P., Clark, T. and Hynes, G. (2012) “Lifecycle Greenhouse Gas Emissions from Electricity Generation: A Comparative Analysis of Australian Energy Sources”, in Energies, Vol.5, pp.872-897; and Worley Parsons (2011), Greenhouse Gas Emissions – Study of Australian CSG to LNG, April
0
100
200
300
400
500
600
700
800
900
1,000
Iron ore exports
0
10
20
30
40
50
60
70
80
90LNG exports
0
50
100
150
200
250
300
350
400
450
500
Coal exports5 yr forecast 23% growth
5 yr forecast 12% growth
5 yr forecast200% growth

Deloitte Access Economics: Carbon Analytics #2 28
5 How does Australia compare on consumption-based emissions? This chapter presents benchmarking results for the G20 countries based on consumption-based emissions per Gross National Expenditure (GNE) and compares them with benchmarks derived from production-based emissions per GDP.
5.1 Consumption-based emissions in the G20 In our previous report in the Carbon Analytics series we investigated the use of GDP, rather than population, as a normalising factor for use in benchmarking production-based carbon emissions. Production-based emissions and GDP are well-aligned, in that both metrics relate to productive activity within a country’s borders – that is, they include all domestic production inclusive of exports, and either deduct, or omit, imports from the calculation. Consumption-based emissions on the other hand explicitly include emissions embodied in imports, while netting off exported emissions. We use Gross National Expenditure (GNE) as a normalising factor for consumption-based emissions – GNE measures the value of final demand in an economy, and includes imports but nets off exports and therefore provides a comparable treatment of exports and imports to consumption-based emission estimates. Figure 5-1 and Figure 5-2 below compare the production-based emissions/GDP benchmarks from Chapter 2 with benchmarks based on consumption-based emissions/GNE.
Figure 5-1: Benchmarks of production-based energy emissions intensity (Mt CO2/GDP (US$ billion)) and consumption-based energy emissions intensity (Mt CO2/GNE (US$ billion)), 2011
Source: Carbon emissions based on Eora MRIO, GDP and GNE based on IEA and World Bank data

Deloitte Access Economics: Carbon Analytics #2 29
There are two key factors at play when comparing production-based emissions/GDP and consumption-based emissions/GNE:
Whether a country is a net importer or net exporter of emissions – as set out in the previous chapter, net importers of emissions (typically post-industrial, service-based economies) will have higher consumption-based than production-based emissions.
The underlying balance of trade in goods and services – countries that have a significant trade deficit (i.e. net importers) will have higher GNE relative to GDP, which will tend to lower their consumption-based emissions/GNE relative to production-based emissions/GDP.
In general, the first factor (the difference between imports and exports of emissions) tends to outweigh the second, since emissions embodied in trade generally make up a higher proportion of total emissions than trade as a proportion of GDP (or GNE). Figure 5-1 shows that consumption-based emissions/GNE for countries that are large exporters of carbon emissions, such as China, India, Russia and South Africa is lower than production-based emissions/GDP. Large importers of emissions such as France and United Kingdom tend to see their metrics increase significantly. Australia’s consumption-based emissions/GNE are marginally higher than its production-based emissions/GDP, however its ranking among the G20 remains unchanged.
The percentage difference between the consumption-based metrics and production-based metrics is shown in the figure below. The difference is representative of the difference between the emissions intensity of domestic production and the emissions intensity of overseas production serving domestic consumption.
Figure 5-2: The percentage difference between consumption and production-based metrics, 2011
Source: Carbon emissions based on Eora MRIO, GDP based on IEA data

Deloitte Access Economics: Carbon Analytics #2 30
6 Implications for target setting In this chapter we consider the implications of the results of our analysis for current frameworks for measuring carbon emissions and target setting at a national and international level.
6.1 Is the current approach to target setting effective? Emission reduction targets and policies at a national and international level currently use production-based emissions as the basis for setting targets and measuring outcomes. However, in the absence of a global, uniform mechanism for putting a price on, or capping emissions, there is a risk that efforts to drive emission reductions from the production-side only may result in unintended outcomes, such as:
Carbon leakage – where changes in the location of emissions-intensive production are captured as reductions in production-based emissions in one country even though the overall impact may be to increase on global emissions, due to the productive task being taken up by a trading partner with higher emissions-intensity. Consumption-based emissions analysis can inform an understanding of the extent to which carbon leakage has occurred, or may occur, between key trading partners. Our analysis has identified a number of countries that have achieved reductions in production-based emissions while increasing consumption-based emissions, which may be an indicator that carbon leakage has occurred (however, we also note that there are numerous sources of comparative advantage that may drive changes in the structures and emissions intensity of economies).
Inefficient signals for abatement – such as in the case of LNG exports from the United States and Australia, which may result in increases in the production-based emissions of these countries, even though from a whole of lifecycle perspective LNG may displace higher emissions fuels and play a role in reducing overall global carbon emissions.
Further analysis would be required to assess the extent to which these factors have affected, or might affect, global action on climate change. However, it is clear that solely focussing on production-based emissions may not provide a full picture of the impact of emissions reduction policies on global emissions. Complementing production-based analysis with analysis of carbon emissions from a consumption perspective can provide insights into these challenges and inform appropriate policy responses.
6.2 Who should bear responsibility for decarbonisation? Formulating emissions reduction targets and policies using production-based emissions puts the responsibility for abatement with producers – the ‘polluter pays’ principle. The polluter pays principle is a widely applied and accepted form of addressing externalities and changing behaviour. However, where there is less than full coverage of all sources of the externality, then application of a polluter pays principle may lead to increased costs for the

Deloitte Access Economics: Carbon Analytics #2 31
parties covered, while not necessarily addressing the underlying problem if production is simply transferred to an uncovered party (e.g. carbon leakage).
On the other hand, consumption-based targets would put the responsibility on consumers to act to address the externality. Recognition of the role played by increasing consumption in driving emissions is important for both providing a complete picture of the causes of emissions and also recognising the implications of different metrics on countries at different stages of economic development.
In general, a production-based approach to emissions target setting favours net importers (mainly advanced, service-based economies), while a consumption-based approach favours net exporters (mainly emerging economies). However, this needs to be balanced with other costs and benefits associated with production and consumption. On one hand, emerging economies may be disadvantaged by production-based emissions targets, however, to the extent that production-based targets in more advanced economies result in shifts in industrial activity and investment to emerging economies, there may be economic benefits to the recipient country.
In order to continue to meet global demand for goods and services, increases in production and energy use are inevitable. Efficiently allocating resources to ensure that the production task is completed at the lowest cost (including carbon costs) requires a complete picture of the costs and emissions. Consumption-based emissions analysis provides valuable insights into different countries’ production costs and trade relationships that are crucial for ensuring that emissions reductions targets and policies are as efficient and effective as possible.
6.3 Implications for target setting The most efficient approach to addressing global emissions would be a scheme with global coverage – such as a cap and trade system or a uniform tax. Given that the G20 accounts for around 80% of global emissions, a cap and trade system or price that covered just the G20 would be a significant step towards an efficient approach to addressing global emissions.
In the absence of a globally consistent carbon pricing mechanism, individual country targets are a pragmatic response to the practical difficulties of establishing a broad-based, uniform system for pricing emissions. Given the significant differences between carbon intensity across the G20, and the possibility of further carbon leakage under individual production-based targets and emissions reduction policy, we recommend that current production-based metrics be accompanied by additional measures to provide deeper insight into emissions drivers and abatement:
Carbon intensity of production (production-based CO2/GDP) – provides insight into the relationship between economic growth and emissions reductions.
Consumption-based emissions (CO2 allocated to final demand) – provides insight into how emissions reductions have been achieved, total emission reductions across trading partners, and possible carbon leakage.
Carbon intensity of consumption (consumption-based CO2/GNE) – provides insights into possible carbon leakage and implications of international trade for net emissions balances and overall emissions reduction outcomes.

Deloitte Access Economics: Carbon Analytics #2 32
As production to meet global demand (particularly for emissions intensive manufactured goods) continues to shift from advanced to emerging economies the challenges of reducing emissions while maintaining economic growth will become even more acute. By recognising the role of consumption in driving global emissions, consumption-based emissions analysis also suggests a role for advanced economies in assisting emerging economies through targeted research and development and deployment of technology to reduce carbon intensity.
Deloitte Access Economics: Carbon Analytics #2 33
Appendix A MRIO databases
Overview of MRIO analysis
Input-output (IO) analysis takes the national IO tables published by individual countries to allocate emissions that occur on the production side to final consumers by tracking embodied emissions through (often highly complex) supply chains. While national IO data is generally considered to be highly reliable, the links between production and consumption are only available at a national level. MRIO analysis extends IO analysis by combining different national IO tables to form a global model of production and consumption and enables the analysis to extend to traded goods and services, treating the global economy as a single system within which all flows must be balanced. IO tables and trade data for each country within the database are used to trace the flows of embedded emissions through the economy and back to the associated consumption. Combining these matrix relationships with emissions accounts enables estimation of exported and imported emissions that takes into account variations in emissions intensities for different countries.25
It is also possible to estimate consumption-based emissions using a single-region input-output model (SRIO) (i.e. a model with only one region or country included). The SRIO approach has been trialled by the Australian Bureau of Statistics (ABS). The approach used by the ABS was to deduct exports from production-based emissions and include imports by assuming that they were produced using technology of the same emissions intensity as domestic production.26 While the SRIO approach has the advantage of being much less data intensive than MRIO modelling, it does not provide insights into the implications of differing production technologies and emissions intensities, since production functions for imported products are assumed to be identical to those used for local production.
Whilst we consider MRIO modelling to be the most suitable application for measuring consumption-based emissions and assessing the implications of international trade, there are a number of challenges with this approach:
The requirement for large quantities of data – updates and model-runs are a complex and time consuming exercise. Databases may be infrequently updated, and there may be underlying inconsistencies in the data where a number of sources are relied upon.
Mismatches in trade data – one of the main drawbacks of the MRIO approach is managing discrepancies between reported imports and exports between countries. Solving this issue must necessarily lead to departures from the source data (i.e. national accounts on trade statistics), and is a key reason why modelled results may differ from one database to another.
25
Lenzen M, Kanemoto K, Moran D, and Geschke A (2012) “Mapping the structure of the world economy”, in Environmental Science & Technology, vol. 46(15), pp 8374-8381 26
ABS (2013), Information Paper: Towards the Australian Environmental-Economic Accounts, Chapter 5 Greenhouse Gas Emissions, Cat. No. 4655.0.55.002

Deloitte Access Economics: Carbon Analytics #2 34
Key MRIO databases
There are several MRIO databases and models with functionality to estimate consumption-based emissions. Some of the most widely used databases are described in the table below.
Table 6-1: MRIO databases for consumption-based emissions accounting
Database Description Coverage
Eora Records the bilateral economic and emissions flows between 15,000 sectors in 189 countries (26 to 511 sectors per country). Key data sources:
74 IO tables from National Statistical Offices, other country data from UN National Accounts Main Aggregates Database
Trade data from UN Comtrade and Service trade databases
Emissions from Emission Database for Global Atmospheric Research (EDGAR) and IEA
189 countries with 26-511 sectors
1980 to 2012
Updated annually with a 2 year lag
GTAP
Global Trade Analysis Project
Public global data base representing the world economy with bilateral trade information, transport and protection linkages. Key data sources:
National IO tables submitted by GTAP members
Trade data from UN Comtrade UN Service trade databases
CO2 derived from IEA energy data
140 countries with 57 sectors
2004, 2007 and 2011
Updated every 3 years with a 4 year lag
WIOD
World Input-Output Database
Public database time-series of world input-output tables for forty countries worldwide and a model for the rest-of-the-world. Key data sources:
National IO tables based on supply and use tables from National Accounts
Trade data from UN Comtrade, European Commission (Eurostat) and OECD
Emissions from Eurostat’s environmental accounts
40 countries plus a ‘rest-of-the-world’ region
1995-2011
Updates funding dependant (project ended in 2012)
GRAM
Global Resource Accounting Model
Designed to calculate historic data on (not a forecasting model): CO2 emissions and resource use by consuming country and not by producing or extracting country. Key data sources:
IO tables published by the OECD
Trade data from OECD’s Bilateral Trade Database
CO2 and energy balances from IEA
Raw material data from the Sustainable Europe Research Institute (SERI) Global Material Flows Database for global resource extraction.
53 countries and 2 ‘rest-of-the-world’ regions with 48 sectors (trade in 25 product groups and 1 service sector)
1995 to 2005
Currently being updated to 2010
Source: Owen, A., Steen-Olsen, K., Barret, J., Weidmann, T. and Lenzen, M., “A structural decomposition approach to comparing MRIO databases”, in Economic Systems Research, 2014; additional information sourced from GTAP website (https://www.gtap.agecon.purdue.edu), WIOD website (http://www.wiod.org/new_site/home.htm), GRAM website (http://www.gws-os.com/de/content/view/627/302) and SERI website (http://seri.at/en/projects/completed-projects/gram/)

Contact us
Deloitte Access Economics ACN: 149 633 116 Level 10 550 Bourke Street Melbourne VIC 3000 GPO Box 78 Melbourne VIC 3001 Australia
Tel: +61 3 9671 7000 www.deloitteaccesseconomics.com.au
General use restriction This report is prepared solely for the use of Origin Energy Ltd. This report is not intended to and should not be used or relied upon by anyone else and we accept no duty of care to any other person or entity. The report has been prepared for the purpose set out in our engagement with Origin Energy Ltd. You should not refer to or use our name or the advice for any other purpose.
Deloitte Access Economics is Australia’s pre-eminent economics advisory practice and a member of Deloitte's global economics group. The Directors and staff of Access Economics joined Deloitte in early 2011.
Deloitte refers to one or more of Deloitte Touche Tohmatsu Limited, a UK private company limited by guarantee, and its network of member firms, each of which is a legally separate and independent entity. Please see www.deloitte.com/au/about for a detailed description of the legal structure of Deloitte Touche Tohmatsu Limited and its member firms.
About Deloitte
Deloitte provides audit, tax, consulting, and financial advisory services to public and private clients spanning multiple industries. With a globally connected network of member firms in more than 150 countries, Deloitte brings world-class capabilities and deep local expertise to help clients succeed wherever they operate. Deloitte's approximately 170,000 professionals are committed to becoming the standard of excellence.
About Deloitte Australia
In Australia, the member firm is the Australian partnership of Deloitte Touche Tohmatsu. As one of Australia’s leading professional services firms. Deloitte Touche Tohmatsu and its affiliates provide audit, tax, consulting, and financial advisory services through approximately 5,400 people across the country. Focused on the creation of value and growth, and known as an employer of choice for innovative human resources programs, we are dedicated to helping our clients and our people excel. For more information, please visit our web site at www.deloitte.com.au.
Liability limited by a scheme approved under Professional Standards Legislation.
Member of Deloitte Touche Tohmatsu Limited
© 2015 Deloitte Access Economics Pty Ltd