australia's wine industry: collaboration and learning …€¦ · 7 preface this report,...
TRANSCRIPT

AUSTRALIA'S WINE INDUSTRY:
Collaboration and Learningas Causes of Competitive Success
Ian Marsh & Brendan Shaw
May 2000

Table of Contents
Page No.
Executive Summary 3
Preface 6
Introduction 7
I. Frameworks 11Neo-Classical Perspectives 11Institutional Perspectives 12
Economic Learning and 'Economic Rationality' 14Framing 15Levels of Learning 16What Makes Ideas Powerful? 16
Innovation 17Transaction Costs 22Clusters 24‘Alliance Capitalism’
26Evaluating the Causes of Wine Industry Performance 28
II. The Development of Collaboration 30Structure and Ownership Patterns 30Industry Associations
33Collaboration and Economic Learning 33
Strategy 2025 35Medium Term Implementation 36Export Development 36Research and Development 37
Industry Media 39The Dynamics of Collaboration 39
III. Collaboration and Learning as Causes of Industry Performance 42
IV. Future Implications for the Wine Industry 53A Wine Industry Cluster? 55
V. Implications for Other Industry Sectors and Governments 57Bootstrap Effort 58Industry Associations as Change Agents 59Government as Catalyst 59

3
VI. Conclusions 65

4
Executive Summary
The Australian wine industry has experienced remarkable change since the mid-1980s. Inthe mid 1980s, Australia exported 2% of total production and was a net importer of wine.Since this time, industry performance has been spectacular. Exports now total 32% of totalproduction (compared to 17% for the major producers, France and Italy). Australiaproduces only 2% of world wine, but now holds 2.4% of the world wine market by volumeand 3.5% by value.
How is this performance to be explained? A decline in the value of the Australian dollar wasone stimulus. Another factor was change in industry ownership affecting the structure andscale of individual firms. Other changes affected the industry's overall business orientation,its general engagement with international markets and its commitment to innovation.
Industry collaboration has facilitated, or contributed to, the last three of these changes. Inthe process, the wine industry has transformed itself. It has ceased to be composed solelyof rivalrous, competitive firms. Fierce competitive rivalry between individual producerspersists. But this has been supplemented by industry collaboration around matters of sharedconcern. The industry has raised its level of integration and is developing into a knowledge-driven cluster.
This achievement may embody experience of wider significance. Australia's past economicprosperity was essentially grounded on commodities and mineral products that wereexported to world markets. Human skills were not insignificant in these activities - but theywere secondary to what were seen to be naturally occurring comparative advantages.
The wine industry's success is based on a reversal of these relationships. Naturaladvantages still count. But humanly created advantages predominate. These have beenamplified through collaborative action. A combination of collaboration and competition hasreplaced solely competitive relationships. This combination has been decisive in sustainedsuccess.
Three issues arise:
• What are the lessons for other business areas where similar international orientationsneed to be cultivated?
• What are the lessons for other areas where the transforming application of knowledgeand innovation is essential to growth and competitive success?
• Can public policy contribute to these outcomes?
Answering these questions is the broad purpose of this study.

5
Recent scholarly theories about the conditions for industry growth are affirmed in wineindustry practice. These theories concern the power of clustering, and the role ofcollaboration, in industry development. These literatures qualify, or amplify, neo-classicalfindings, which currently dominate public policy. In neo-classical perspectives, market failureand 'externalities' are to be corrected by market or quasi-market remedies. Collaboration isseen as an inhibitor, not facilitator, of competitive success. Action by governments isdiscounted - it encourages ‘rent seeking.’
Recent literatures shift the focus of attention in two significant ways. First, they look behindmarkets to the conditions for their establishment. They look to conditions which are prior tomarket activity – conditions which rather create its possibility. Where innovation and globalmarkets are critical to competitive success, these conditions cannot be taken for granted.Second, they give equal place to both transaction and production costs – and explore theresulting implications for firm success.
One of the conditions for the establishment of markets involves economic learning – that is,the recognition of opportunities and interdependencies by relevant firms and other players.The Strategy 2025 exercise, the keystone of Australian wine industry collaboration, was aclassic example of this approach. This established an export objective and growth target forthe industry, and identified the actions necessary for these outcomes to be realised. Itbroadened recognition of new growth opportunities and deepened recognition of thesources of competitive strength.
Once opportunities are recognised, other inhibiting conditions to businesses performancecan arise from transaction costs, the costs involved in undertaking productive economicactivity. Both exporting and innovation involve high transaction costs. Transaction costs area distinct category, different from production costs, and gain in significance as firms arerequired to operate in distant markets or to base competitive advantage on innovation orknowledge.
Transaction costs can include those associated with searching for trading partners andmarkets and doing business effectively and efficiently. Transaction costs also arise inpursuing innovation and investing in research and development. There are costs involved inanswering business questions like: will research address industry priorities, not just those ofresearcher? Will necessary interaction while research is in progress be facilitated? Willinnovations be disseminated?
Without deliberate amelioration, the costs of gaining assurance about such matters readilydeter firms from appropriate action.
The emergence of networking and collaboration is an organisational arrangement formanaging such transaction costs.

6
Wine industry experience demonstrates conclusively the synergies that can be gained, andthe energies that can be liberated, through a combination of collaboration and competition.It illustrates the challenge in sustaining collaboration - as a complement to, and facilitator of,competitive strengths amongst producers.
This experience has important lessons for other Australian sectors - and for government.One possibility is for groups of firms to emulate the wine industry approach. Other clustersor industries could act in concert to enhance their own efforts at marketing, innovation andoverall industry strategy.
Another possibility is for industry associations to act as change agents. They could help theirmember businesses identify the additional competitive synergies available throughcollaboration and put in place the mechanisms to allow firms to pursue joint endeavours andstrategic alliances.
Finally, the wine industry also suggests a catalytic role for government in encouraging othersectors to collaborate, to identify new opportunities, and to enhance their own performance.
Well orchestrated collaboration offers a way to create an ‘export culture.’ It offers a wayto identify shared economic interests and to overcome otherwise prohibitive transactioncosts. It shows how clusters can ground their continued growth and success on distantmarkets and on innovation.
The approach adopted in the wine industry suggests a pattern for other Australian sectors.It shows how static commodity or production focussed businesses might be renewed -through the synergies of association that enhance the competitive power of human creativityand ambition.

7
Preface
This report, Australia’s Wine Industry: Collaboration and Learning as Causes ofCompetitive Success, was commissioned by the Australian Business Foundation to explorethe recent performance and export success of the Australian wine industry and to investigatethe lessons it has for other sectors of Australian business and industry.
The Australian Business Foundation is an independent, private sector think-tank. Its missionis to strengthen Australian enterprise through research and policy innovation. It does this byconducting ground-breaking research, which it uses to foster informed and well-argueddebates and imaginative policy solutions and initiatives.
The Australian Business Foundation was created at arm’s length from its founder andsponsor, the eminent business services organisation, Australian Business Limited. The endgoal is to advance the store of knowledge about how best to generate future growth,prosperity and jobs for the widest reach of the Australian community.
This is what prompted the Australian Business Foundation to commission this investigation,led by Professor Ian Marsh of the Australian Graduate School of Management, into theAustralian wine industry’s experience of collaboration and learning as the causes ofcompetitive success.
The study provides an analysis of recent developments and successful performance of theAustralian wine industry and with the backdrop of current economic literature, tests theproposition that it was the wine industry’s efforts in strategic collaboration that were thecornerstone of its remarkable business growth and export achievements. The study alsocomments on whether the approach followed by the wine industry could be readilyreplicated by other firms and industries in Australia.
The investigation was undertaken and the report authored by Ian Marsh and Brendan Shaw.Ian Marsh is an Associate Professor at the Australian Graduate School of Management.His books include: Beyond the Two Party System (Cambridge University Press,Melbourne, 1995) and with Takashi Inoguchi and Jean Blondel, Democracy, Governanceand Economic Performance, East & South East Asia (United Nations University Press,Tokyo, 1999). Brendan Shaw is a Doctoral candidate at Monash University. He wasformally a Research Analyst with the Department of Industry, Science and Technology.
It is hoped that Australia’s Wine Industry: Collaboration and Learning as Causesof Competitive Success will provide new understandings of contemporary economicliterature and more importantly, will throw light on how such theory can be applied by firmsin Australia as they seek to compete in an increasingly competitive and volatile businessenvironment.
Narelle Kennedy

8
Chief Executive
Australian Business Foundation

9
Introduction
The Australian wine industry has performed remarkably in recent years. Australia producesonly 2% of world wine. In the mid 1980s, Australia was a net importer of wine. Exportsnow total 32% of total production. Australia now holds 2.4% of the world wine market byvolume and 3.5% by value. Australian wineries hold 11% of the U.K. market, 7% of theJapanese market and 4% of the German and US markets. Exports go to a total of 82countries. Thirty-eight per cent of the 1431 winemakers in the Australian and New ZealandWine Industry Directory (ANZWID) export.
Over this same period, sales have shifted from bulk and cask to semi-premium ($7-10 perbottle) and premium ($10-15) segments. For the third time, in January 1999, Penfold'sGrange appeared on the front cover of the US Wine Spectator, arguably the most influentialwine magazine in the world. In this issue, three Grange vintages were included in its ‘dreamdozen.’
How are these developments to be explained? The decline in the Australian exchange ratein the mid-1980s influenced demand. Australia's natural endowments or advantages mightalso be cited - as in the theory of comparative advantage. Tastes and incomes in consumingmarkets may have moved in favour of Australian styles – although the speed and ubiquity ofthe supply response would remain to be explained.
In an analysis of industry growth in the 1986-96 period, Wittwer and Anderson note the keyrole of the switch from non-premium to premium grades and the consequent increase inprice and revenues (43% for wine and 116% for wine grapes).1 This switch occurred in theearly 1990s - seven years after the fall in exchange rates. They conclude that exportdemand accounted for half of the industry's premium output growth and domestic incomegrowth a further 20%. The extensive adoption of mechanical harvesting and pruning is alsocited as an influence.
But premium wines are highly differentiated products. How did the industry make the(rapid) switch from a commodity to what might be described as a knowledge-basedproduct?
How did the industry in an apparently short period establish reputation and brands in remotemarkets?
How did exporting become so ubiquitous amongst producers? Why - and how - wasmechanical harvesting and pruning invented; how was it commercialised; and how was itsadoption accomplished in such a seemingly short period of time?
1 Glyn Wittwer and Kym Anderson, Accounting for Growth in Australia's Grape and Wine Industries,1986-2003, Seminar paper 99-02, Centre for International Economic Studies, University of Adelaide,March, 1999.

10
In sum, how has the industry changed its mind-set and processes from those of anagricultural producer to a high value-added, knowledge-intensive, globally competitivemanufacturing and service industry?
Over the period of industry growth through reorientation to world markets, a high level ofintra-industry collaboration has also developed. Its particular contribution to industrysuccess is the focus of this study. The purpose of the following analysis is threefold: first, toanalyse the scope and sources of collaboration; second, to evaluate its contribution toindustry success; and third, to assess the implications for industry policy more generally.
The analysis is organised in five sections:
• Frameworks: The first section reviews alternative theoretical frameworks for evaluatingthe causes of industry success.
• The Development of Collaboration: The second section reviews changes in industrystructure from the late 1980s, covering changes at both firm and associational levels andthe development of collaborative planning at the industry level.
• The Impact of Collaboration: The third section reviews evidence of the contribution ofcollaboration to industry success.
• Wine Industry Implications: Fourth, on-going issues in sustaining integratedarrangements in the wine industry are identified.
• Implications for Other Industries & Governments: The final section assesses thebroader implications of this experience for other industry sectors and for public policytowards industry more generally.

11
I. Frameworks
A threshold step involves establishing relevant theories. Theory provides the frameworkwithin which facts and causes can be identified. This section introduces two broad familiesof theory. One, the neo classical group, currently dominates public policy formation. Thesecond group, which has only emerged in recent years, might be broadly described asinstitutionalist.
Neo-Classical Perspectives
The current predominant perspective in public policy emphasises the positive contribution ofmarket forces. A market is constituted by an exchange, which is mediated by a price.According to neo-classical theory, interdependence between markets patterns resourceallocation in value-adding production systems. Price-based exchange facilitates flexibility inresource allocation and induces innovation in products and processes. The theory impliesthat the removal of impediments to market exchange is the right path to achieve botheconomic growth and consumer well-being.
Expanding the role of market forces, and removing distortions or inhibitions to theiroperation, is seen to be the best foundation for industry growth and competitive success.The consequent stimulus to efficiency and innovation is seen to transcend any possibleoutcome based on even limited collaboration. The impersonal character of marketoperations facilitates adjustments. Indeed interventions that attempt to anticipate marketdecisions are seen to risk substantial opportunity costs and/or to encourage dysfunctionalrent seeking.2 However, these judgements presume necessary information is freely availableand that its significance is sufficiently recognised. They presume that related and supportingmarkets (eg. capital markets, overseas markets) are appropriately undistorted. They alsoassume transaction costs (as distinct from production costs) are not a significant influence onfirm decisions.
Meantime, comparative advantage theory, which underpins official thinking about tradepolicy, assumes natural endowments, not created advantages, are fundamental to levels oftrade, and to the competitive success of individual firms in international markets. Since thebasis for trade is relative (not absolute) advantages, all participants can benefit.3 This theoryhas been the basis for trade liberalisation, which has contributed significantly to the spread ofeconomic prosperity. However comparative advantage theory is static. It assumes theadvantages that any country has at a particular point in time are fixed. In Ricardo's classicexample, Britain trades cloth for Portuguese wine. Both countries gain from the exchange.
2 Matthias Kelm, Evolutionary and New Institutional Economics: Some Implications for IndustrialPolicy, ESRC Centre for Business Research, University of Cambridge, Working Paper 46, December1996; also , Economic Growth as an Evolutionary Process, ESRC Centre for Business Research,University of Cambridge, Working Paper No. 17, September, 1995.3 Paul Krugman, Competitiveness: A Dangerous Obsession, in Pop Internationalism, MIT Press,Cambridge, 1996.

12
But cloth making was then the high technology, high growth, high value added industry. IfPortugal persisted in producing only wine, she would be permanently locked in to lowerlevels of national income. In a dynamic perspective, trade liberalisation may be problematicfor a country that is trying to shift its business structure to new, higher-value activities.
The movement of neo-classical theory to the status of conventional wisdom in recent yearshas been buttressed by a general flowering of its sub-fields. A variety of new applicationshave emerged - for example, contestable markets theory, agency theory, public choicetheory, transaction cost economics, and information economics. These theories are unitedby their grounding assumptions which involve methodological individualism and instrumentalrationality. Methodological individualism holds that the ideas, motives and preferences ofentrepreneurs and consumers are determined independently, or, in the jargon, exogenously.Instrumental rationality holds all participants base their decisions on the maximisation ofthese independently determined preferences. These simplifying premises have permittedhigh levels of methodological rigour. But recent theoretical developments challenge thevalidity of these assumptions. These are briefly summarised in the next section.
At a policy level, neo-classical and comparative advantage perspectives have driven avariety of changes in frameworks over the past decade. These changes include: exchangerate flexibility; financial liberalisation; trade liberalisation; reduction of protection; labourmarket deregulation; competition policy; and the termination or contraction of targetedindustry incentive schemes. Neo-classical perspectives continue to dominate official andpolitical thinking about industry policy.
Institutional Perspectives
Institutional theories have emerged in recent years as a supplement to neo-classicalperspectives. Interest in institutions has burgeoned, spreading across a variety of disciplines,including economics, political science and sociology.4 Institutional theories start from theinter-subjective character of social, economic and political interaction and calculation.5
They thus abandon the neo-classical premises of methodological individualism andinstrumental rationality.
Institutional analysis directs attention back from firms, towards the institutions or systems inwhich they are embedded. Markets are one important institutional setting - but they are notthe only ensemble that is relevant to competitiveness. Political, financial, education andinnovation systems may all contribute resources or capabilities that are more or less pertinentto the competitiveness of a particular sector.
4 R. Scott, Institutions and Organisations, Sage Publications, California, 1995;Peter Hall and RosemaryTaylor, Political Science and Three New Institutionalisms, Political Studies, XLIV, 1996, pp. 936-957; E.Immergut, The Theoretical Core of the New Institutionalism, Politics and Society, Vol. 26, No. 1, March,1998, pp. 5-34.5 J. G. Ruggie, What makes the World Hang Together? Neo-utilitarian and Social ConstructivistChallenges, International Organisation, 52, 4, Autumn, 1998, pp. 855-885.

13
Further, the historically derived pattern of any of these systems may be more or lessconsistent with present competitive requirements. In general, this approach shifts attentionfrom an exclusive focus on markets to the wider institutional ensemble in which particularfirms and industries are embedded.
Institutional theory is especially associated with the work of Douglas North. His approach ispertinent to this study because of its focus on economic performance. North definesinstitutions as:
‘the humanly devised constraints imposed on human interaction. They consistof the formal rules, informal constraints (norms of behaviour, conventions andself-imposed codes of conduct), and their enforcement characteristics. Inshort, they consist of the structure that humans impose on their dealings witheach other.’6
Elsewhere, they are defined as ‘regularities in repetitive interactions among individuals. Theyprovide a framework within which people have some confidence as to how outcomes willbe determined.’7 There are both formal and informal institutions. Formal institutions includelaws, regulations, states and constitutions. Informal institutions include social norms,conventions, personal habits, organisational routines and the like.
The institutional framework is a fundamental determinant of a society's economicperformance. Institutions organise economic activity by reducing uncertainty in interactionsand by simplifying decision-making. North proposes the norm of ‘adaptive efficiency’ as thedynamic benchmark for institutional effectiveness. This is the pivotal concept in his theory oflonger run economic growth and contrasts with other norms of efficiency (eg. allocative orproductive efficiency). Adaptive efficiency is created by institutions. It embodies ‘thewillingness of a society to acquire knowledge and learning, to induce innovation, toundertake risk and creative activity of all sorts, as well as resolve problems and bottlenecksof the society through time.’ 8
Particular historic decisions can embed patterns of economic (or other) activity that may bedysfunctional from the perspective of present economic opportunities. The (mostlyunconscious) projection of past determinations into current practices, attitudes and decisionsis termed path dependence.
6 Douglas North, Towards a Theory of Institutional Change, Quarterly Review of Economics andBusiness, Vol. 31, No. 4, Winter, 1991, p. 4.7 D. North, The New Institutional Economics , Journal of Institutional and Theoretical Economics, 142,1986, p. 231.8 D. North, Institutions, Institutional Change and Economic Performance, Cambridge University Press,1992, p. 80.

14
Once a development path is set on a particular course, the network externalities, the learningprocesses of organisations, and the historically derived subjective modelling of the issuereinforces the course.’9 Path dependence makes economic adaptation processes muchmore problematic than is suggested by neo-classical theory.
In general, in an institutional perspective, prices have specific limitations as transmitters ofinformation, transaction costs are pervasive and of equal importance to transformation costs,and market forces are deficient mediators of innovation. These findings attack thefoundations of neo-classical theories and thereby undermine conventional wisdom about therole of the State in the economy. They qualify substantially the exclusive focus on marketforces that is the hallmark of neo-classical analysis.
North’s highly abstract, but encompassing, analysis invites attention to arrangements thatmight enhance collaboration, supplement market based coordination and reduce transactioncosts. This provides a general theoretical framework within which particular patterns ofcollaborative activity - such as those to be considered later in the wine industry - can beevaluated.
Economic Learning and 'Economic Rationality'
One fundamental facet of institutional theory involves the genesis of the ‘ideas, choice setsand motives’ that animate economic actors - such as business managers and consumers.These are held to be seeded and propagated by institutions. Preferences, motives andinformation are not assumed to germinate independently or exogenously – rather they areincubated by institutions.
This introduces the concept of economic learning as an alternative to the neo-classicalconcept of economic rationality. Economic rationality assumes that relevant information isavailable and that preferences are determined autonomously. It assumes all agents willfollow a common choice process. It assumes they will maximise the satisfaction of their(independently derived) preferences. Institutional theory relaxes each of these assumptions.Preferences, choice metrics and information are dependent, not autonomous variables - andthus are contingent outcomes, determined by the institutional environments within which firmsand industries are embedded. Hence, in an institutional perspective, economic learning is acontingent concept and a problematic process.
Drawing on recent cognitive literature, North and Dentsau suggest choice is framed bymental models that are widely shared, that are established collectively, and that areinherently partial (‘ideologies’).10 As a medium for decision making, shared mental modelshave inherent limitations. Further, feedback may not be corrective since this process is itselfgoverned by the same (contingent) shared mental model. 9 D. North, Institutions, Institutional Change and Economic Performance, p. 99.10 D. North and A. Dentzau, Shared Mental Models, Ideologies and Institutions, Kyklos, Vol. 47, 1994,pp.3-31.

15
Institutional theory is thus much less sanguine about the likely consistency between currenteconomic decisions and longer term, adaptive outcomes. This contrasts with the optimism ofneo classical theory.
Because widely shared mental models are established collectively, by and throughinstitutions, the latter's effectiveness in generating economic learning is critical to thecompetitiveness of organisations. This analysis suggests a wholly novel perspective fromwhich the effectiveness of institutions might be judged - namely their impact on, andcontribution to, economic learning.
The idea of learning has come to play an increasing role in management and strategyliterature in recent years.11 Some literatures explore the structures through which thisoutcome can be best advanced. 12 Others consider learning processes. For example,scenario analysis has gained currency as one methodology for anticipating discontinuities incomplex, interdependent systems.13 We will see later, the wine industry itself placedparticular emphasis on collaborative planning through a visioning process. Such approachesinvite attention to ways ideas become influential for practice. In this context, Schon andRein's work on what they term 'framing' is pertinent.14
Framing
The concept of ‘framing’ was developed in the context of intractable policy problems. Itdraws attention to the role of narrative in ‘defining’ reality. Framing involves thedevelopment of narratives of explanation. In Schon and Rein's words: (Narratives)
‘carry out the essential problem-setting functions. They select for attention afew salient features out of what would otherwise be an overwhelminglycomplex reality. They give these elements a coherent organisation, and they
11 Ikujiro Nonaka and Hirotaka Takeuchi, The Knowledge Creating Company, Harvard BusinessSchool Press, Cambridge, 199 ; David A. Garvin, Building a Learning Organisation, Harvard BusinessReview, July, 1993, pp. 78-91; Peter Senge, The Leaders New Work: Building Learning Organisations,Sloan Management Review, Fall, 1990, pp 7-23; John Kay, Foundations of Corporate Success, OxfordUniversity Press, Oxford, 1995; Arie de Geus, The Living Company, Nicholas Brearly Publishing,London, 1998, also Planning as Learning, Harvard Business Review, March, 1988, pp. 70-74.12 I review some aspects of this process at the sectoral and national level in: The State and theEconomy: Opinion Formation and Collaboration as Facets of Economic Management, Political Studies,Vol 47, No. 4, November, 1999, pp.13 Kees van der Heijden, Scenarios: The Art of Strategic Conversation, John Wiley, Chichester, 1996;Gary Hamel and C. K. Prahalad, Seeing the Future First, Fortune, September 5th, 1994, pp. 73-76; Paul J.Schoemaker, Scenario Planning: A Tool for Strategic Thinking, Sloan Management Review, Winter,1995, pp. 25-40.14 D. Schon and M. Rein, Frame Reflection, Towards the Resolution of Intractable Policy Conflicts,Basic Books, New York, 1994; J. Richardson and S. Mezey, Framing and Reframing Public Policy in theEU: Ideas, Interest and Institutions in Sex Equality and Environmental Politics, Paper for presentation atthe Workshop on the Role of Ideas in Policy-making, European Consortium for Political research,Warwick University, March, 1998.

16
describe what is wrong with the present situation in such a way as to set thedirection for its future transformation.
Through the process of naming and framing the stories make the "normativeleap" from data to recommendations, from fact to values, from "is" to"ought." It is typical of such diagnostic-prescriptive stories, that they executethe normative leap in such a way as to make it seem graceful, compelling,even obvious.'15
Levels of Learning
Through Strategy 2025, the wine industry sought to shift producer orientations fromdomestic to global markets. This form of learning points to a distinction between the various‘levels’ at which economic learning might be aimed. Two basic levels can be identified: 16
• First order learning might involve adapting to constraints, imitating the successful orundertaking a bounded search process. This involves adaptation within given strategicparameters. It involves non-routine, operational decision making.
• Second order learning, by contrast, involves more profound reconceptualisation eg.recognising a new systemic pattern. Second order learning involves picturing a worldthat might be: it is the projection of empirically grounded aspirations. A visioning processis one means of stimulating second order learning. This is designed to lift ambitions (ie.motives and preferences) to a new level and to facilitate collaboration and therecognition of shared interests - in other words, to enlist new commitment and tomobilise new energies. It is not a linear projection of developments.
What Makes Ideas Powerful?
Many ideas, later vindicated by events, languish unacknowledged. What distinguishesinfluential from non-influential ideas? There are both empirical and theoretical analyses ofpertinent conditions and processes.17 Garret and Weingast propose three causal pathwaysthat link ideas to perceived needs for explanations:18
1. Ideas can serve as road maps, a role that ‘derives from the need of individuals todetermine their own preferences or to understand the causal relationship between theirgoals and alternative strategies by which to reach these goals.’
15 Schon and Rein, p. 26.16 Peter Senge, The Leaders New Work: Building Learning Organisations, op. cit.17 Eg. Robert Reich, The Power of Public Ideas, Harvard University Press, Cambridge, 1992; DanielYankelovitch, Coming to Public Judgement, Syracue University Press, 1988; John Kingdom, Ideas,Institutions and Public Policies, ; James Q. Wilson, ' Policy Intellectuals and Public Policy, PublicInterest, vol. 64, Summer, 1981, pp. 31-47.; James March, The Pursuit of Organisational Intelligence,Blackwells, London, 1999.18 quoted in Ruggie, op. cit., p.866.

17
2. Ideas can serve as focal points ‘in strategic situations of multiple equilibria, that isseveral equally "efficient" outcomes.’ Here ideas can help individuals select one fromamong the set of viable outcomes.
3. Ideas can become causes of behaviour through institutionalisation, ‘whereby ideas,once they have become encrusted in institutions, continue to specify policy in theabsence of innovation’.
Goldstein and Keohane offer another perspective. 19 They suggest influential ideas fall intoone of three categories: world views; principled beliefs: and causal beliefs:
• World views are ‘entwined with people's conceptions of their identities, evoking deepemotions and loyalties.’
• Principled beliefs ‘specify criteria for distinguishing right from wrong and just fromunjust.’
• Causal beliefs are ‘beliefs about cause-effect relations derived from the sharedconsensus of recognised authorities.
An official report, following an enquiry chaired by Professor Helen Hughes, identifiedAustralia's need for ‘a new export culture,’ but declared its ignorance about how such anorientation might be seeded, much less embedded.20 Recent scholarly work on the role ofinstitutions, the categorisation of ideas, and on processes of economic learning begin to fillthis gap. We will see in the next section how economic learning was deliberately seededand propagated in the wine industry.
Innovation
Knowledge-based innovation theories provide another contrast with neo-classicalapproaches. Proponents argue neo-classical theories are a poor guide to its requirements.In 1947, Schumpeter identified what has since been termed the paradox of competition:
A system...that at every point of time fully utilises its possibilities to the bestadvantage may yet in the long run be inferior to a system that does so at nogiven point of time, because the latter's failure to do so may be a condition forthe level or speed of long run performance.21
19 Ideas, Interests and Institutions, in J. Goldstein and R. Keohane, (eds), Ideas and Foreign Policy,Cornell University Press, Ithaca, 1993, pp 203-205.20 Helen Hughes (chair), Australian Exports: Performance, Obstacles, and Issues of Assistance,Australian Government Publishing Service, Canberra, 1989.21 J. Michie and R. Prendergast, Competition and Competitive Advantage, ESRC Centre for BusinessResearch, University of Cambridge, Working Paper 41, September, 1996, p. 8.

18
Whereas, from the point of view of static efficiency, ‘restrictive practices may seem to serveonly to enrich the sellers at the expense of the buyers, in the context of long run expansion,these same practices may have important stabilising and incentive functions.’ Thecontribution of imperfect markets to long run innovation and growth has been one stimulus tothe development of evolutionary or knowledge based theories of innovation, in contrast toneo-classical information-based theories.
A key distinction between these approaches concerns the nature and role of knowledge.Neo-classical or information based theories recognise two distinct forms of knowledge:basic research and information. The former is a public good, and the latter a tradeablegood. It is distinguished by being codified, quantifiable and transmissible.
Knowledge based theories, on the other hand, treat this key variable as a more complex andless sharply differentiated phenomenon. In this perspective, knowledge creation isdistinguished by one or more of the following features: tacitness, heterogeneity andspecificity. According to Blackenburg, these features might be defined as follows:
‘Tacit knowledge resides either in the heads of people engaged in particulartransformation processes or in the organisational routines and institutionalrules underlying such processes, and cannot be copied or acquired through anyexplicit transfer of information............Knowledge is heterogeneous in that amultiplicity of skills, experiences and information from a variety of primarysources are combined in the search for solutions to specific problems.Knowledge accumulation therefore requires a high level of organisationaldiversity to accommodate the multiplicity of combinations of differentelements of knowledge............The increasing technological division of labour,resulting in a high degree of specificity of knowledge, reinforces both theimportance of tacit knowledge as well as the heterogeneity of knowledge ingeneral.’22
This implies innovation is a more interdependent, reciprocal and differentiated process thanis recognised in information economics. Table 1.1 contrasts neo-classical and knowledgebased approaches to the conceptualisation of innovation. The contrast is in twelvedimensions.
In this evolutionary perspective, processes that generate variation and selection, and thatsustain transmission and dissemination all become critical. In evolutionary theory, firms areagencies for transforming technological knowledge into knowledge about products.Blankenburg defines this process as ‘drawing on the present state of technologicalknowledge and projecting it in a direction that brings about a coupling with some substantial 22 Stephanie Blankenburg, University-Industry Relations, Innovation and Power: A TheoreticalFramework for the Study of Technology Transfer from the Science Base, ESRC Centre for BusinessResearch, University of Cambridge, Working Paper 102, September, 1998, p. 19; also J. S. Metcalfe,Technology Systems and Technology Policy in an Evolutionary Framework, Cambridge Journal ofEconomics, 19, 1995, pp. 25-46; R. Nelson, The Sources of Industrial Leadership: A Perspective onIndustrial Policy, De Economist, Vol. 147, No. 1, 1999, pp. 1-18.

19
category of consumer needs and desires’. This directs attention to systems or structures ofcollaboration, and to tests of their effectiveness: for example, in reconciling variation andselection, prime mover advantage without premature lock-in etc. Imagining innovation as aflow involving interactions between multiple agents also directs attention to the key role ofwhat are termed transaction costs.

20
Table 1.1 Information Economics and Knowledge Based Approaches to theConceptualisation of Innovation
Approach
Conceptualisationof:
Neoclassical /Informational
Knowledge-Theoretic /Evolutionary
Innovation Linear sequential stage-model,one-time transfer from sciencedownstream to technology /engineering and the market
Ongoing search activity, involvingnonlinearities, cumulativeness, path-dependency and feedback loops from"downstream" sources, therefore two-directional
Main Source ofInnovation
R&D, science Capabilities and competencies built upfrom R&D and science as well as fromother economic, technological andinstitutional sources, such as education,training, production engineering, design,quality control, accident
Technology Blueprint, applied science Embodied knowledge of various types:tacit, locally bounded, formal, informal,interdisciplinary, scientific, engineering,organised in paradigms and evolving alongtrajectories
Knowledge Codified, homogenous, freelyaccessible (public good), oftenequated with information
Socially embedded, context-specific, non-homogenous, both codified and non-codified
Productive Unit Individual profit-maximising firm (Learning) Networks / National System ofInnovation / productive systems
Organisational Principle (Constrained) Optimisation Adaptation through self-organisedprocesses
Time Reversible Irreversible
Uncertainty Probabilistic (risk), arising due toabsence of complete set ofmarkets
Non-probabilistic ("true, genuine")
Process of Accumulationof Technological
Capabilities
Comparative-static; movementtowards innovative possibilityfrontier through increasedinnovative effort translatedthrough regular input-outputrelations of "knowledge"production function
Evolutionary (learning) process, involvingcreation of variety (from both "blind" andpurposeful action/sources), selection (oftechnologies through markets andcoordinated choice), and feedback loopfrom selected outcomes to re-generation ofvariety
Change / Diffusion Exogenous invention plusendogenous incrementalimprovements, costless imitation
Endogenous relation between incrementalchanges and radical ruptures, diffusionnon-separable from innovation and notcostless

21
Competition Price / oligopolistic Technological, product based,conceptualised as process of discoverybased on differential behaviour
Policy Objectives "Picking the winner" / gettingthe incentive structure right forefficient use of productiveresources
Adaptive government support forenhancement of national and regionalcompetence base(s), creation of newresources
Source: Blankenburg, op.cit. pp 33

22
The policy implications of these divergent accounts of the dynamics of innovation are verydifferent. Neo-classical theories focus on innovation as an accomplished discovery, andthus on appropriability and tradeability. This involves attention to property rights, patentsand individual incentives. By contrast, knowledge based theories image technicaldevelopment as a flow, organised around a reciprocal process of interaction, involvingpriority-setting, design, feedback and redesign. Markets are not the only medium in whichsuch exchanges occur. Rather innovation develops through a variety of channels, prior to,or supplementary to, market exchange - for example, academic and technical journals,training, personnel transfer, informal communication networks.
Transaction Costs
The general significance of transaction costs for competitiveness was noted earlier. Thecontemporary emergence of networking and collaboration can be conceived as anorganisational arrangement for managing such costs.23
Transaction costs are defined as 'the costs of running the economic system'.24 Theseinclude:
• Search costs in finding new trading partners;
• Costs of negotiating and drafting agreements or other less formal connections;
• Costs associated with flows between firms and with non-firm organisations (eg.independent research centres);
• Costs associated with servicing on-going relationships;
• Costs of adjustment associated with changing business or technological conditions;
• Costs of monitoring existing contracts and of enforcing contracts when parties renege.
These costs can be contrasted with transformation or production costs - the primary focusof the theory of the firm and of micro economics more generally.
There is no theory of transactional efficiency to match the notion of allocative efficiency inneo-classical theory. Milgrom and Roberts propose a contingent norm: ‘As suggested bythe efficiency principle, transactions tend to occur in the market when doing so is mostefficient, and they are brought within firms or some other formal organisation when doing sominimises the costs of carrying them out.’25
23 eg Peter Dicken, Global Shift, The Internationalisation of Economic Activity, Paul ChapmanPublishing, London, 2nd Edition, pp. 212-221.24 Arrow, quoted by M. Sako, 1992, p.33.25 Paul Milgrom and John Roberts, Economic Organisation and Management, Prentice Hall,Englewood Cliffs, NJ, 1992, p. 29.

23
Coordination costs are a specific sub-set of transaction costs and express the costs ofbringing relevant parties together. The formation and maintenance of industry associations,or other institutions that express the aspiration to collaborate amongst relevant parties, mightbe classified as coordination costs.
At least five features of transaction costs determine their significance and complexity:
• The specificity of the investment required to conduct the transaction – the larger theinvestment the more likely the transaction will be internalised, managed collaboratively,or will constitute a barrier to action;
• The frequency and duration of the transaction – the more frequent or the longer theduration, the more likely on-going organisations will be established;
• Uncertainty and complexity of the transaction - for example in relation to market dataand technological assessments;
• The difficulty of measuring performance;
• The connectedness of transactions to other transactions, involving other participants.26
When not internalised within organisations or networks, transaction costs are determined byinstitutions.
Transaction costs are especially salient in current competitive environments. Businessgrowth is now substantially driven by innovation and participation in the global economy.Both these activities are suffused with transaction costs.27 For example, participation inglobal markets magnifies the complexities and risks for any single firm in strategy, marketing,and distribution. These complexities and risks can be addressed through internalisation anddevelopment of scale and/or through networks, alliances and other forms of collaboration.
26 Paul Milgrom and John Roberts, Economic Organisation and Management, Prentice Hall,Englewood Cliffs, NJ, 1992, p. 30.27 John Dunning, Governments and the Macro-Organisation of Economic Activity: A Historical andSpatial Perspective, in J. H. Dunning (ed), Governments, Globalisation and International Business,Oxford University press, Oxford, 1997, pp. 31-73; also Alliance Capitalism and Global Business,Routledge, London, 1997.

24
Clusters
Clustering as a foundation of competitiveness has a considerable theoretical provenance.28
Contemporary attention to this structural pattern has developed in response to the observedsustained superior performance of particular countries or regions - for example, northernItalian regions in leather shoes, fashion and electrical machinery.29 In Australia's case,Marceau, and Marceau, Sicklen and Manley, have used aggregate data to estimate thepresence of such linkages.30 Michael Porter provides perhaps the most comprehensive(inductive) account of their character and competitive contribution.31
According to Porter: ‘A cluster is a geographically proximate group of interconnectedcompanies and associated institutions in a particular field, linked by commonalities andcomplementarities.’ He nominates as potential elements: end-product or service companies;suppliers of specialised inputs, components, machinery and services; financial institutions;firms in related industries; firms in downstream industries; producers of complementaryproducts; specialised infrastructure providers; government and other institutions providingspecialised training, education, information and technical support; and finally, tradeassociations.32
Germane to this study, Porter illustrates the latter's architecture through an image of theCalifornia wine cluster (Fig.1.1). He comments: ‘The California wine cluster includes anextensive complement of supporting industries to both winemaking and grape growing. Onthe growing side, there are strong connections to the larger California agriculture cluster. Onthe winemaking side, the cluster enjoys strong links to both the California restaurant andfood preparation industries and the tourism cluster in Napa and other wine-producingregions of the state.....(Other institutions) involved with wine include the world-renownedviticulture and oenology program at the University of California, Davis and specialcommittees of the California Senate and Assembly.’
28 Michael E. Porter, Historical and Intellectual Antecedents of Cluster Theory, in On Competition,Harvard Business Review Press, Cambridge, Mass., 1998, p. 206-208; and Clusters and the NewEconomics of Competition, Harvard Business Review, December, 1998, pp. 77-90; also Theo A.Roelandt, Cluster Analysis and the System of Innovation Approach, paper presented at the OECDConference on Innovation Systems, Growth Engines of the 21st Century, Sydney, 19-20 November,1998; L. Nachum and D. Keeble, Neo-Marshallian Nodes, Global Networks and Firm Competitiveness:The Media Cluster of Central London, Working Paper 138, September, 1999, ESRC Centre for BusinessResearch, University of Cambridge.29 Michael Porter, The Competitive Advantage of Nations, Macmillan, London, 1990.30 Jane Marceau, Derek Sicklen and Karen Manley, The High Road or the Low Road, Alternatives forAustralia's Future, Australian Business Foundation, Sydney, 1997; also Jane Marceau, TheDisappearing Trick: Clusters in the Australian Economy, Paper prepared for the OECD conference onclusters, Amsterdam, October, 1997.31 Michael E. Porter, Clusters and Competition: New Agendas for Companies, Governments andInstitutions, in On Competition, ibid. pp. 197-289.32 There is also an extensive literature on the role of industry associations in Japan, for example, M.Sako, Suppliers' Associations in the Japanese Automobile Industry, Cambridge Journal of Economics,1996, Vol. 20, pp. 651-671; T. Horiuchi, Structure and Information Sharing Function of the JapaneseOptoelectronics Industry, Rivista Internationale di Scienze Economiche e Commerciali, Vol. 37, No.12, 1990, pp. 1083-1103.

25
Figure 1.1 The Californian Wine Cluster
GrapestockGrapestock
Fertilizer, pesticides,
herbicides
Fertilizer, pesticides,
herbicides
Grape harvesting
equipment
Grape harvesting
equipment
Irrigation technologyIrrigation technology Growers/
vineyards
Wineries/
processing
facilities
Educational, research, and tradeorganizations (e.g., Wine Institute,
UC Davis, culinary institutes)
Educational, research, and tradeorganizations (e.g., Wine Institute,
UC Davis, culinary institutes)
California agriculturalcluster
Food cluster
Tourism cluster
WinemakingEquipment
WinemakingEquipment
State government agencies (e.g.,Select Committee on WineProduction and Economy)
State government agencies (e.g.,Select Committee on WineProduction and Economy)
BarrelsBarrels
BottlesBottles
Caps and CorksCaps and Corks
LabelsLabels
Public relations andadvertising
Public relations andadvertising
Specialized publications(e.g., Wine Spectator,
trade journals
Specialized publications(e.g., Wine Spectator,
trade journals
Sources: Based on research by Harvard MBA students R. Alexander, R. Arney, N. Black,E. Frost, and A. Shivananda. Illustration from M. Porter, On Competition, p.201
The boundaries of clusters are defined contingently. They rarely follow the traditionalcategories used for classifying industrial and economic statistics. They are driven rather byan understanding of the most important linkages from the perspective of competitivesuccess. They can link traditional and newer sectors and can evolve in step with markets orparticular segments of markets and/or technology. They can vary in size, breadth and stateof development and can be evaluated at varying levels of aggregation.
In discussing the advantage of this concept over a focus on sectors or individual firms,Porter comments:
‘Clusters align better with the nature of competition and the sources ofcompetitive advantage. Clusters, broader than industries, capture importantlinkages, complementarities, and slipovers of technology, skills, information,marketing and customer needs that cut across firms and industries....Suchconnections are fundamental to competition, to productivity, and especially, tothe direction and pace of new business formation and innovation.....Viewing agroup of companies and institutions as a cluster highlights opportunities forcoordination and mutual improvement in areas of common concern withoutthreatening or distorting competition or limiting the intensity of rivalry.’(p.205)

26
Clusters offer an especially powerful medium for linking specific firms to wider economicpolicy objectives (Fig. 1.2).Figure 1.2 Clusters and Economic Policy
Clusters
Collection andDisseminationof EconomicInformation
ExportPromotion
RegulatoryReform
Developmentof Advanced
andSpecialized
Factors
Science andTechnology
Policy
Attraction ofForeign direct
Investment
Source: M. Porter, On Competition, p. 254
‘Alliance Capitalism’
These varied theoretical developments - institutional theory, learning, the new role oftransaction costs, attention to innovation systems, and clustering - are symptomatic of thechanging contexts confronting firms and of the new requirements for competitive success.Working at the intersection of economics and business strategy, John Dunning suggeststhese contexts and requirements can be summarised in a new competitive paradigm whichhe terms ‘alliance or flexible capitalism.’33 He contrasts this with two earlier economicphases, entitled respectively ‘entrepreneurial capitalism’ and ‘hierarchical capitalism’ (Table1.2). The contrast is based on changes in seven core dimensions of the economic system:markets, specialisation, key resources, asset mobility, organisation, production system andgovernment role.
Four features of alliance or flexible capitalism might be especially noted.
• First, the emergence of alliance capitalism is partly a response to the redefinition ofmarkets as regional or global in character. This involves operations at a distance withaugmented complexity and risk in all aspects of operations but especially control,distribution, and marketing.
• Second, innovation in products or processes is increasingly decisive in sustainedsuperior performance. This raises by a quantum step the significance of transaction
33 John Dunning, pp. 31-73, op, cit.

27
costs in firm decision-making and affects traditional as well as so-called high technologyindustries.
Table 1.2 Three Patterns of Capitalism
Phase 1.ENTREPRENEURIALCAPITALISM(1770-1875)
Phase 2.HIERARCHICALCAPITALISM(1875-1980)
Phase 3.ALLIANCE ORFLEXIBLECAPITALISM(1980-?)
Markets Small and fragmentary,local and national: mainlycompetitive
National or international:increasingly oligopolistic
Regional and global:dynamic and morecompetitive
Specialisation Simple and modest,based mainly ondistribution of naturalassets
Becoming more complex:both national andinternational
Extensive andinterdependent: theparadox of an increasingglobal division of labourbased on location ofcreated assets, togetherwith sub-nationalspecialised clusters ofeconomic activity
KeyResources
Natural assets, e.g., fruitsof the land and relativelyunskilled labour
Physical and someknowledge capital
Intangible assets, e.g.human competence andknowledge, information,organisational andlearning capability
Mobility ofAssets
Little except for financecapital, and someemigration
Gradually increasing viaMNE operations
Substantial mobility offirm specific createdassets. But less mobilityof some location specificcreated assets
Organisation Factory, small firms Large integratedcorporate hierarchies
More inter-firm alliances,single firm hierarchies,corporate networks
ProductionSystem
D form, batch M form, mass or scale Innovation driven:flexible
GovernmentRole
Limited involvement:active
Growing intervention:growth
More systemic andmarket enabling
Source: John Dunning, Governments and the Macro-Organisation of Economic Activities, pp 33
• Third, as a consequence of the enhanced mobility of firm specific assets, relativelyimmobile location specific assets have attained a new importance. These include such‘constructed’ factors as: skills, the extra competitive leverage provided by access tocomplementary and supporting firms, the availability of sophisticated business services,

28
political stability, a transparent legal regime, and a government alive to its systemicresponsibilities.
• Fourth, in the context of all the foregoing, networks, alliances and collaboration haveattained a new prominence. There is clear evidence of the more extensive reliance oninter- firm networks and other forms of linkage and collaboration.34
In relation to innovation, as already noted, the potential disjunction between social costs andbenefits, cluster costs and benefits, and firm level costs, has been widely recognised.Institutions determine the incentive effects. They determine whether ‘the social externalitiesof markets for dynamic goods are fully realised, and whether the social assets necessary forthe efficient upgrading and exploitation of the core competencies of firms and industries areadequately provided.’35
Similarly, economic globalisation enhances the significance of spatially related coordinationand transaction costs. These increase as markets become more uncertain and volatile, morespecialised, complex and interdependent, or characterised by externalities, informationasymmetries and opportunism.
Further, according to Dunning, the withdrawal of the State from many operational roles inthe 1980s has been matched by the need to enhance its effectiveness in systemic roles. Thisis because of the new salience of transaction costs to business competitiveness. Transactioncosts are caused by public policy structures and frameworks. Their new salience introducesa new dimension to the management of public policy systems (eg. the tax, education orresearch systems).
This provides an overarching framework for evaluating the new challenges faced not just bythe wine industry - but by all industries whose competitive success involves participation inglobal markets and/or continuous innovation. It also provides a practical justification forattention to institutional theory and its various progeny. By contrast, neo-classical theory isincreasingly less applicable to the actual competitive circumstances confronting firms in aglobalised economy.
Evaluating the Causes of Wine Industry Performance
In evaluating the performance of the wine industry, two broad families of theory are thuspertinent. First, neo-classical approaches invite a focus on market conditions and marketforces. At a normative level, this theory implies competitiveness is best enhanced throughthe operation of market forces: the less fettered or distorted their operation, the better willallocative efficiency be realised.
34 For example, M. Sako, Prices, Quality and Trust, Inter Firm Relations in Britain and Japan,Cambridge University Press, 1992.35 Dunning, 1997, p.124-129.

29
However, the wine industry has succeeded in remote global markets, has adjusted rapidly insupply and production capacity to changed conditions, has raised its profile in consumer andfinancial markets and has, at least in its own self-understanding, based its success onprojection of an image of quality, which is grounded in a superior willingness to innovate. Inthe process of accomplishing these outcomes, extensive collaborative arrangements havebeen established.
This suggests the merit of considering industry experience through the lens of the secondbroad family of theories - those concerned with innovation, transaction costs, ‘learning’ andclustering. Their common ground lies in an emphasis on market-enhancing collaboration asa complement to robust competition in product markets. In these perspectives, marketconditions are the ultimate determinants of action and market outcomes the ultimate arbitersof performance. But within this framework, collaboration and competition, mixed accordingto relevant contingencies, constitute a performance-enhancing strategy.
In the case of the wine industry, we will want to see if more ambitious ideas, choice sets andmotives have been seeded amongst industry participants, and if transaction costs, associatedwith entry to overseas markets and with innovation, have been ameliorated. Finally, we willwant to establish if these explanations for industry success are more plausible thancompeting accounts. First however, the evolution of the wine industry structure and thedevelopment of collaboration are reviewed.

30
II. The Development of Collaboration
The wine industry has experienced substantial structural change in the past ten years. Thishas affected both the pattern of firms and the pattern of industry associations. Thesedevelopments were a prelude to the development of collaboration. The present pattern offirms originated in the mid 1980s when international investors exited the Australian industry.
Extensive structural change has also occurred at the Association level. The development ofcollaboration has been a signal achievement of the past ten years.36 In the mid-1980s theindustry was divided and fragmented. Large producers saw their interests as distinct fromthose of small producers, growers saw their interests to be distinct from producers, and aplethora of state and national associations enjoyed separate existence and advanceddifferent and/or uncoordinated claims. By 1992, all but one of the nine national bodies thatnow define and manage shared interests in research, marketing, exporting, and governmentand institutional liaison, had either been newly established or had adopted new roles.
Industry associations provided the context within which collaboration germinated.Collaboration extended progressively from exporting to research and development,culminating in 1996, in Strategy 2025. This was the critical step, introducing a vision of theindustry’s potential. Through this process, the mutually antagonistic relationships evident inthe mid-1980s gave way to a progressively expanding conception of synergies and sharedinterests. Developments in firm and associational structure, and in collaboration and learningare described in turn.37
Structure and Ownership Patterns
The pattern of ownership and participation in the Australian wine industry has undergonesubstantial change since the mid-1980s. Production is now concentrated in three majorfirms - Southcorp, BRL-Hardy and Orlando-Wyndham Group - all exceeded 100,000 tonsproduction in 1997. Together, these three firms accounted for 51% of total production(Figure 2.1). The next biggest firm, Mildara-Blass, had total production of 52,000 tons.The top 9 companies accounted for 78% of total production. There are over 1000 wineproducers in Australia and an additional 4000 winegrape growers. Concentration in theAustralian industry is reflected in an even greater extent in export shares with the top threecompanies accounting for 70% of total exports (Figure 2.2).
36 The following section draws extensively on the invaluable history of the industry by James Halliday,A History of the Australian Wine industry, 1949-1994, Australian Wine and BrandyCorporation/Winetitles, Adelaide, 1994.37 All statistical data for this paper is current at 31st July, 1999 and all value data is in current prices –that is not adjusted for inflation unless otherwise indicated.

31
Figure 2.1 Concentration in Australian Wine Production 1996 (by company rank,
by value)
51%
18%
9%
22%
Largest 3 4th - 6th 7th - 9th Others
Source: Derived from Osmond & Anderson (1998), p. 83.
Figure 2.2 Concentration in Australian Wine Exports, 1996 (by company rank, byvalue)
70%
17%
8%5%
Largest 3 4th - 6th 7th - 9th Others
Source: Derived from Osmond & Anderson (1998), p. 83.

32
The top twenty Australian firms are listed in Table 2.1. The major firms are not large byinternational standards. Measured by wine sales, the top three Australian firms rank 13th,16th and 18th respectively.38
Table 2.1 Australia’s 20 Largest Wine Producers by Tonnes Processed – 1997.
Company TonnesSouthcorp Wines Pty Ltd (group total) 165,000BRL Hardy Ltd (group total) 142,000Orlando-Wyndham Group Pty Ltd 104,000Mildara-Blass Ltd (group total)52,000 52,000McWilliams Wines Pty Ltd (group total) 44,000De Bortoli Wines Pty Ltd (group total) 42,000Australian Vintage Ltd* 31,000Miranda Wines Pty Ltd (group total) 26,000Riverina Wines Pty Ltd* 23,000Yalumba (S. Smith & Son Pty Ltd.)* 16,500Kingston Estate Wines Pty Ltd* 16,200The Alambie Wine Co. (Aust. Premium Wines)* 15,500Rosemount Estates Pty Ltd 15,500Angoves Wines Pty Ltd 15,000Brown Bros. Milawa Pty Ltd 14,000Normans Wines Ltd* 13,500Peter Lehmann Wines Ltd* 12,400Wingara Wine Group Pty Ltd* 12,000
Rosetto Wines (Griffith) Pty Ltd* 11,500Cranswick Smith & Son Pty Ltd 11,000
Source: "Australian Wine Online" http://www.winetitles.com.au/overview/index.html, accessed 4/2/99Note: Total grape tonnage processed in 1997 for company own branded and bottled products, incl.
distillation, and inter-winery bulk grape juice/wine sales as indicated by asteriskNote: Figures are based on group crush and include subsidiary companies.
The development of the major groups is depicted in Table 2.2. These groups were formedor consolidated in the late 1980s. For example, Southcorp grew out of South AustralianBrewing (SAB), which had initially acquired the Seppelts vineyard in the late 1980s. SABsinitial ambition to extend into wine in the late 1980s, was thwarted by the conglomerateAdsteam, which took over Lindemans and Penfolds in 1990. When the Adsteam empireimploded later that year, its wine interests were acquired by SAB. This was followed by thechange of name. In 1991 Southcorp deliberately focussed its expansion on global marketsand began the creation of an international selling, marketing and distribution network.Offices were established in Richmond (U.K.), Monterey (California) and Singapore.Southcorp joined other makers to establish brand identification through participation ininternational competitions and in 1995 Wine Spectator named the 1990 Grange Vintage‘Wine of the Year.’39
38 Rabobank, The World Wine Business, May, 1999, p. 11.39 David Combe, Grapes of Success, Australian to International – the Southcorp Story , Monash – Mt.Eliza Review, November, 1998.

33
Table 2.2 Rationalisation in the Wine Industry
Southcorp BRL Hardy Orlando
Wyndham
Mildara Blass
1994 Yalamba's
GalwayPipe/
Fortified Wines
1993 51% Yarra Ridge
1992 Thomas Hardy
Berri Renmano
1991 Wolf Blass
1990 Lindemans, Leo
Buring, Rouge
Homme, Matthew
Lang, Seppelt,
Queen Adelaide,
Hungerford Hill
Wyndham Estate
1988 Clarevale Co-
operative
Montrose
1987 Tollana, Loxton Stanley Leasingham Saxonville
1986 Krondorf
1985 Tulloch, Seaview
Wynns, Kilawarra
Balgownie
1984 Craigmoor Yellowglen
1982 Kaiser Stuhl Chateau Reynella,
Rhinecastle
Previous Penfolds,
Minchinbury
Houghton Hermitage Estate,
Richmond Grove
Source: James Halliday, A History of the Australian Wine Industry, p.59.
Industry Associations
The development of industry associations occurred progressively, primarily under thestimulus of government initiatives. On the positive side, and as part of its review of the roleand function of primary industry statutory authorities, the government established theAustralian Wine and Brandy Corporation (AWBC) in 1981.

34
This change reflected a new emphasis on user pays.40 The Corporation was givenresponsibility for export marketing and the power to levy growers and producers. Thisbrought into focus the conflict between representative organisations for large and smallproducers. It also exposed the absence of a national body representing the interests of smalland medium producers. Thus, in 1984, the Australian Winemakers Forum was established.
Meantime, to bring the contending factions together, the government proposed theestablishment of an interim Wine Industry Advisory Council. This was also established in1984. After the government proposed an increase in AWBC levies in 1986, disagreementintensified. The increase was finally endorsed. Meantime the Advisory Council was fundedfor a further three years. Changes in personnel at a number of large wineries helped toinduce a new atmosphere and, at the conclusion of its three year funding in 1989, theAdvisory Council was replaced by a new industry association, the Winemakers Federationof Australia (WFA) which constituted a single voice for producers.
This is an umbrella organisation with a 1998 budget of some $1.5 million. It unites tenassociated or affiliated bodies (eg. four state level industry associations, and four regionalindustry associations) and has links (eg through overlapping governance structures) witheight related industry bodies (eg. Australian Wine Research Institute, Australian Council ofViticulture etc).
A variety of other organisational developments occurred between 1988 and 1992. First, theAustralian Wine Foundation was established in 1988 by donation to focus on the wine-health relationship. The Foundation subsequently expanded its role. It funded a variety ofspecial projects: Strategy 2025; the Five Year Plan; seed funding for the Australian Societyof Wine Educators (ASWE), established in 1990 to respond to burgeoning consumerinterest in wine; the Wine Industry Outlook Conferences; and particular research activities ofthe long established Australian Wine Research Institute (AWRI) – eg. Drug StrategyReview Committee, National Partnership on Alcohol, Advertising etc. The Foundation wasabolished in September 1999 and its activities were absorbed back into the WFA.
The Grape and Wine Research and Development Corporation (GWRDC) wasestablished in 1991 to manage the (partial user pays) statutory levy introduced to fundresearch and development. This organisation built on the long established research traditionin the industry. For example, specialist wine training commenced with the establishment ofRoseworthy Agricultural College in 1883. Meantime the Australian Wine Board initiatedresearch in 1934 and the Australian Wine Research Institute was established in 1955. In1975 a triennial technical conference was initiated. In that year Wine Science andViticulture was also introduced at the Wagga Wagga campus of what is now the CharlesSturt University.
40 Siwan Lovett, Revitalising Rural Research and Development in Australia, Land and WaterResources Research and Development Corporation, Canberra, 1997.

35
The GWRDC was intended to increase user contributions and to link researchers moreclosely to growers. The Corporation is funded by compulsory levy and matchingCommonwealth funds up to 0.5% of the Gross Value of Production (GVP).
The Australian Wine Export Council was established in 1992 to separate the promotionactivities of the AWBC from its regulatory, information and certification activities. In 1993 aWine Agreement with the European Community was concluded. This was followed by theestablishment of a Geographical Indications Committee within the AWBC, and by thephasing out of European expressions. The industry had established its domestic market bythe use of these names. Their abandonment thus reflected its new international orientation.
The Australian Council of Viticulture was established in 1991. It allows liaison betweenwine educators and industry representatives, including CSIRO Division of Horticulture, andthe South Australian, Victorian, New South Wales and Western Australian Departments ofAgriculture. This became the basis for the establishment of a CRC in Viticulture with totalfunds of nearly $40 million - made up of a $12.5 million federal grant, supplementing theestablished $26.3 million research programs of the other parties.
Finally, two educational institutions - Wagga and Roseworthy – have played significant rolesin socialising common perspectives among industry participants.
Thus by 1992 eight of the current nine industry bodies were established. Grape growers arerepresented by another body, the Winegrape Growers Council of Australia. Thesearrangements were a rationalisation of the plethora of bodies that existed previously.Further, all these bodies operate from adjacent offices in one building at Magill, SouthAustralia. Organisational arrangements, including scope, budget and governancearrangements for the nine principal industry bodies, are listed in Table 2.3.
One stimulus to deeper collaboration was provided by a proposal in the 1993 FederalBudget to increase the sales tax on wine. A bitter public campaign followed. Thisexperience convinced industry leaders that more needed to be done to develop recognitionof the industry's special circumstances and vulnerability. A special report by the IndustryCommission on industry tax issues followed.41
41 Winegrape and Wine Industry in Australia: a Report by the Committee of Inquiry into theWinegrape and Wine Industry, Draft Report, March, 1995, Industry Commission: Canberra.

36
Table 2.3 Nine Principal Industry AssociationsWINE MAKERSFEDERATIONOFAUSTRALIA(WFA)
WINE GRAPEGROWERSCOUNCIL OFAUSTRALIA(WGCA)
AUSTRALIANWINE &BRANDYCORPORATION(AWBC)
GRAPE & WINERESEARCH &DEVELOPMENTCORPORATION (GWRDC)
AUSTRALIANSOCIETY FORWINEEDUCATION
AUSTRALIANWINERESEARCHINSTITUTE
CO-OPRESEARCHCENTRE FORVITICULTURE
WINEINDUSTRYEDUCATION &TRAININGGROUP
WINE
AUSTRALIA
MISSION • Representproducers
• Representgrowers
• StatutoryAuthority
• Qualityregulation /Exportpromotion
• StatutoryAuthority
• DetermineR&D strategy;fund R&D
• Facilitatedomestic wineeducation /promotion
• Research &development
• Research &development
• Coordination betweenindustry &educationalinstitutions
• Stageexpositionevery 2 years
FUNDING1997/98
$1.4m $2.0m $6.4m
(1998)
$4.9m $200,000 $4.0m $6.0m $5 m
SOURCES • Membersubscriptions& speciallevies(graduatedscale)
• Membersubscription
• Statutorylevy
• Statutorylevy
• Subscriptions & levies($50,000W.F.A.)
• GWRDC
• Contractresearch
• GWRDC
• Contractresearch
• Exhibitorcontributions
GOVERNANCE • Electedboard
(11 members)
• Electedboard (9members)
• Federalorganisation(3 StateCouncils)
• Mixednominee /elected board
• 9 membersappointed byminister
• Subsidiaryof W.F.A.
• Nominatedboard
• Nominatedboard
• Industryrepsnominated byassociations
• 6 memberboard (W.F.A.Sponsored)
STAFF 5 1 26 2.5 1 45 (15 PhD) 45 1 P/T providedby S.A. WineCorp.
2

37
OUTREACH • AnnualReport
• Periodicnewsletter
• Annualreport
• Newsletters
• Annualreport
• Annualreport
• Newletter
• Technicalbulletin
• Conferences / training
• Newsletter
• Annualreport
Source: Industry interviews, Annual Reports

38
This led to consideration in the industry about how best to develop broader awareness of itsneeds and opportunities, culminating in the decision in 1995, to proceed to development ofthe Strategy 2025 project.
Scale differences between firms in the industry create differential stakes in collaboration. Asnoted earlier, output is dominated by four companies. They gain from collaboration in atleast seven business areas: trade issues, government relations generally, taxation issues,education and training, generic marketing, research and development and investorawareness.
Whole-industry advocacy provides more leverage than would be available to a singlecompany. On research and development, large organisations have greater stakes in linkagethan smaller enterprises.
Meantime, the statutory levy arrangements eliminate the possibility of free riding - whilst thedifferential level of levies recognises the different stakes of producers and growers ofdiffering size.
Collaboration and Economic Learning
Collaborative action and learning was pioneered in exporting. The development ofAustralia's exports was initially stimulated by a fortuitous conjunction of developments,involving both marketing efforts and the devaluation of the $A.42 The first export target wasestablished in 1990. This was for export sales of $200 million by 1993.
The AWBC matched this with increased promotional expenditure. A transfiguring targetwas established in 1991. This was for $1 billion of export sales by 2000. 43 The adoption ofthis target marked a particularly significant step. It focussed the industry on new marketopportunities – and created awareness of a potential that many had not recognised or haddismissed as unrealistic.
The Australian Wine Export Council was then officially launched. Initial promotionalactivities are summarised in Table 2.4. Collaborative learning attained a new level with thedevelopment and launch of Strategy 2025 in 1996.
42 James Halliday, A History of the Australian Wine industry, 1949-1994, Australian Wine and BrandyCorporation/Winetitles, Adelaide, 1994, pp. 96-106.43 This report was commissioned by Southcorp from the strategy consultancy LEK.

39
Table 2.4 Development of Collaborative Marketing Major Markets – 1982 – 1994
Year United Kingdom United States* Other
1982 • Hazel Murphy(Austrade) organises allAustralian Wine Tasting
1984 • First Australian tour byEnglish Masters ofWine
1986 • $Aust. Depreciated x%• AWBC levy increased:
$220k, UK programendorsed
• Hazel Murphyappointed residentPromotions Manager forAWBC
• Growth commencesunder impetus decline in$Aust. And Paul Hoganadvertising campaign
• Canadian market grewfrom 1985/86. Eachprovince monopolisesliquor sales /distribution. Large cosonly participants
1987 • Export Area campaigninitiated: 19 wineries,$220k budget
• Australian WineImporters Associationformed. Promotionalexpenditure $150,000
• Swedish marketexpanded followingChernobyl. Largestmarket by volume until1990/91. Mainly bulksales
1988 –1990
• Sales growth continued1987-1988. Bulk winesaccounted 33% exports
• Great Australian WineTasting (N.Y., Boston,Chicago) – October 1988
• Repeated in differentcities 1989 - 1990
1990 • Oddbins (retail chain)promotes Australianwines
• AWBC formulatedcorporate plan withsales target of $200million by 1993.Promotional expendituredoubled from $635k to$1.15 million
• Growth resumedpremium categories
• Export Area campaign:participation 37 wineries
1992 • AWEC established • Full-time managerappointed AustralianWine ImportersAssociation
1992 • Wine Flight initiated –120 members U.K. tradeand press

40
1994 • Export Area campaignenrolled 45 producers
• Second Wine Flightconducted
• Australian product 20%of above L5 segment;6% total market
*State level distribution complicates market access for small/medium producersSource: James Halliday, A History of the Australian Wine Industry, 1949–1994, pp 94-106
Strategy 2025
The decision to initiate a visioning exercise for the whole industry grew partly out of thesuccess of the export effort, partly out of the 1994 tax proposal, and partly from long heldambitions of industry leaders such as Brian Croser and Len Evans.
Strategy 2025 articulated the opportunity inherent in the orientation to world markets andthe move from non-premium to premium segments. By 1995, these had clearly emerged asdrivers of industry growth and profitability. Brian Croser commented on this trend at the1997 Wine Outlook conference:
‘Whether a profound structural change occurred in the world’s affluent,sophisticated wine markets from about the middle of 1993 is yet to be provenin longer term events. However, in the four years since June 1993, bottledtable wine consumption has quadrupled the long term growth rate and isaccelerating in many markets, perhaps driven by the emerging story of wine’shealth benefits.’
The Winemakers Federation was the catalyst. Overlapping governance and co-locationwith the WGGA, GWRDC and AWBC facilitated the coordination exercise, as did theirrelatively small professional staffs (approximately 15 people). The first step involved therecruitment of Paul van der Lee, a professional economist with experience of industryplanning approaches.
A longer-term vision marked a deliberate move to what can be termed ‘second order’learning. In other growth cycles, the domestic market had been the primary focus. Thevision sought to shift producer focus to the world market. It attempted to lift Australianproducers’ awareness of competitors in other regions - particularly California, Chile andSouth Africa. Finally, it attempted to shift from a primary concern with the product to afocus on business courses marketing. According to van der Lee: ‘It was the application ofnew technology which played the critical role in enabling new world producers toreformulate wine as a consumer proposition.’44
44 2025 – Meeting the Technical Challenge, address to Tenth Australian Wine Industry TechnicalConference, Sydney, August, 1998. According to Peter Dawson, BRL-Hardy’s chief winemaker:‘Generally, Australian winemakers have a greater awareness of what consumers and the trade are

41
The Strategy nominated innovation and product quality as ‘core industry values.’ Thesenorms were operationalised through a focus on six key issues: customers, markets, image,wine tourism, competitive advantage and resource capacity. The Vision document alsonominated growth benchmarks for a number of key inputs including investment, acreage,water, processing and storage capacity and skilled employment.
The process for completing the vision mobilised a variety of stakeholders. It was developedby a small task force (only three people, assisted by consultants), who were engaged over anine month period (to June, 1996). This group was supported by a thirty-strong,representative reference group. The completed document was an accessible, professionallyprepared report of twelve pages.
This base document provided a focus for other collaborative activity, particularly concerningdomestic marketing and research and development. Indeed it lifted both activities to a newlevel of aspiration. It also signalled industry prospects to related and supporting industries(eg. investors and stock markets) and to governments and other relevant institutions (eg.research and educational institutions).
Medium Term Implementation
The Strategy not only had to be disseminated among producers and growers, it also neededto be translated into medium term operational strategies. This occurred in 1997,coordinated by the WFA. A consolidated five-year plan was released that year. Fourteenspecific strategies were identified. These covered domestic consumer markets, increasedfunding for export development, collaboration to ensure adequate supply of skilledpersonnel and research and development. Five of the fourteen strategies involved domesticor export marketing. The balance covered research, operations, training and theenvironment. For example, as a result of the Strategy exercise, the industry identified theneed for 25,000 trained people over the next thirty years. A new coordinating body wasproposed to enhance attention to education and training and government relations. In eachcase, specific steps and timelines were proposed. The direct costs of undertaking researchprojects was estimated at $1.5 million.
The WFA initiated the strategy building exercise. Thereafter many of the coordination costswere incurred by other representative organisations, including all the national bodies plusstate and regional producer and grower associations.
Export Development
looking for in wine styles. They adapt winemaking processes to make these wines. A lot of Europeansare still hung up on traditional practices.’ Huon Hooke, The Flying Winemakers, Sydney MorningHerald, January 26, 1999, p. 4.

42
Both the Australian Wine and Brandy Corporation, and its subsidiary, the Australian WineExport Corporation, adopted the priorities of Strategy 2025 as a framework for their ownpolicy development.
Wine Flights from major export markets and collaborative in-country marketing programscontinued. Strategy 2025 provided a rationale for the expansion of these efforts and for afocus on new markets, such as Japan and Germany. A new post was established toevaluate, compile and distribute industry information. New AWEC offices were establishedin Stockholm and Tokyo and wine writer visits were extended to Germany and Scandinavia.
Dissemination of information occurs primarily through a bi-monthly newsletter distributed toall levy payers and a periodical, Wine Contact. The AWBC annual report is also widelycirculated. The AWBC Board meets in particular regions and followed its formal meetingswith bilateral discussions with local producer and grower organisations (Victoria, Padthawayand Coonawarra).
Research and Development
A number of organisations undertake research on behalf of the industry. These are theAustralian Wine Research Institute, the Cooperative Research Centre for Viticulture, theCSIRO Division of Horticulture and the teaching institutions, the University of Adelaide andCharles Sturt University.
The Strategy 2025 process contributed to the integration of research in two ways. First, theGWRDC based its own agenda on the broad purposes articulated in the Strategy 2025Vision and the detailed priorities identified in the subsequent Five Year Operational Plan. Itscriteria for funding were also elaborated to take account of the latter.
Second, the Strategy exercise provided the grounds for the increase in the research levy,voted in 1998. Speaking at the 1997 Outlook Conference, Brian Croser, then President ofthe AWF, observed: ‘The industry provides $2.6 million of research levies for grape andwine or 0.16% of total value of production.’45 Since the government offered to match thelevy up to 0.5% of GVP, he pointed to possible levy-driven research funding of $8.1million. He also noted the industry currently contributed 15% ($2.6 million) of then totalwine research expenditure of $18 million. The four biggest wine makers contributed 50% ofthis amount.
Technological developments, widely adopted throughout the industry in the late 1980s,affected both wine and grape production and prepared the industry to respond rapidly to thechange in consumer tastes evident from the early 1990s. In wine production, the changesincluded air bag presses and cold and closed fermentation. In grape production, research
45 Brian Croser, A Proposed Action Agenda, Wine Industry Journal, Vol. 12, No. 4, November, 1997, pp.346-349.

43
resulted in new canopy management approaches, trellising, summer pruning, mechanicalpruning, mechanical harvesting and watering methods. These changes increased yields andgrape quality. Partial root zone drying process, promises both to reduce water consumptionand to increase flavour.
Australia’s major volume brands such as Jacobs Creek and Lindemans Bin 65 Chardonnayetc are produced from grapes mostly grown in the irrigation areas of Riverina, Riverland andSunraysia. According to Huon Hooke: ‘It is impossible to overstate the influence ofimproved viticulture on the rise in Riverland wine quality.’ Drip irrigation has given winemakers control over watering regimes.
Regulated deficit irrigation (RDI), which involves using moisture probes to determine exactlywhen irrigation should be applied, is now being adopted. Partial root zone drying (PRD),which involves two sets of drippers that sequentially irrigate half the root, is beingdeveloped. This switches effort away from foliage development to fruiting and saves 40%water.46
Research currently in progress involves genetic engineering and new strains of winemakingyeasts. Other projects include a process to analyse the molecule containing the flavourcompounds – a so-called glycosyl-glucose (G-G) analysis. This would increase the capacityto produce high quality fruit. It would change the terms on which grapes are evaluated (nowbased on sugar content, temperature range and presence of foreign matter).
Following Strategy 2025, the five-year operational plan, and its initial levy increase, theGWRDC outlined a new approach in its 1997/98 report. Priorities were determined byStrategy 2025. Six research areas were nominated for viticulture and five for production. Afurther increase in levies was foreshadowed. Dissemination of research and information wasespecially emphasised and a survey of growers to establish awareness, sources ofinformation and the like was planned. Regional development planning was supported toaccelerate dissemination. The industry statistics task force was funded along with anindustry outlook analysis by the Centre for Economic Research, University of Adelaide.
A survey of winegrape grower awareness of the CRC on Viticulture was undertaken in late1998.47 The sample included 240 growers, 27% from the MIA, 25% from South Australia,21% from North East Victoria and 27% from Sunraysia. The findings provide essential datafor evaluating the scale of the dissemination challenge. The survey found overall only 48%of growers were aware of the Centre but with marked regional variations – for example,67% of Northeast Victoria growers were aware of CRCV. Awareness was alsosignificantly more widespread amongst producers - 62% of growers who were alsowinemakers acknowledged awareness. Half of all growers interviewed could mention oneor more positive research outcomes, as follows:
46 Huon Hooke, The $10 Tipple, Sydney Morning Herald, 18 May, 1999.47 TQA Research, Survey of Grower Attitudes and Behaviour, on behalf of the GWRDC, Adelaide,1998.

44
• Water management and irrigation issues (19%)
• Improving grape quality (14%)
• Pest management and chemical management (13%)
• Nutrition and fertiliser (5%)
The sources of information were magazines and newsletters (30%), seminars and field days(13%), wine industry buyers or makers (8%) – especially prevalent amongst growers inMIA/Griffith (14%) and South Australia (11%).
Industry Media
Industry media are critical to communication and information exchange. The wine industry isrichly served by industry association and commercial media. Each industry associationpublishes newsletters and pamphlets which are disseminated to levy payers (ie. all producersand growers). Industry information and opinion is also disseminated through threecommercial journals, of which the most substantial is the Wine Industry Journal (WIJ).This has a circulation of around 3000. Australian Viticulture serves grapegrowers and theGrapegrower and Winemaker serves both. Print runs for these latter two journals areestimated at 7000 and 4000 respectively. The dedicated publishing house Winetitlesproduces the WIJ as well as the annual Wine Industry Directory and the specialisedAustralian Journal of Grape and Wine Research. It also publishes an array of specialisttitles related to the industry.48
The Dynamics of Collaboration
The industry has created a comprehensive collaborative structure, which is unique inAustralia. Figure 2.3 pictures this structure and its dynamics.
The overall ensemble might be conceived as made up of three zones. The first and mostprominent zone is the familiar competitive market place. The industry operates in a complexarray of markets, both in terms of geography and culture, and in terms of segments. This isthe primary domain of competitive firms, supplemented by the Australian Wine ExportCorporation which champions national brand awareness through a variety of programs andin conjunction with producers.
The second and third zones of action are differently based. The second zone is based oncollaboration and the third on negotiation. Industry associations are the key organisations inboth arenas. In the second zone, shared interests amongst industry participants areidentified, collective intelligence is accumulated and disseminated, and common purposes areforged. The industry associations take the lead in these tasks. These activities can impact
48 Winetitles web site is at: winetitles.com.au.

45
directly on producer competitiveness in up to five dimensions – aspirations, national branddevelopment, market knowledge, individual brand projection and innovation. Thesepotential impacts are relevant to all producers – although size will vary their degree ofinterests.
Industry representations to governments, suppliers and other stakeholders also impact onproducer competitiveness. Such representations occur in the third zone and involverepresentation and negotiation.

46
Figure 2.3: The Impact of Collaboration on Firm-Level Competitiveness
Governments, factorsuppliers
Industry associations Australian firms
Zone 3: Negotiation Zone 2: Collaboration Zone 1: Competition
InternationalMarkets
DomesticMarkets
Government
Otherinstitutions,
stakeholders
•Positive spillovers
•Negative spillovers
•Factor supplies
• Media
•Stock exchange
•Tertiary training
•Related and supportingindustries
Australian WineExport Corp
Australian Wine& Brandy Corp
WinemakersFederation
Winegrape GrowersAssociation
GWRDC,AWRI,CRC, viticultureCSIRO
Grapegrowers
Top 3 51%
4-9 27%
Rest 22%
Australianproducers (100%)
Firm-levelcompetitiveness•National brand
•Market knowledge
•Innovation
•Systemic spillovers
•Factor availability
Strategy
Strategy Transaction costs
Transaction costs
Marketing
Inno
vatio
n
Strate
gic
Vision/m
edium
term
industry
priorit
ies
UKMarket
USMarket
JapanMarket
Canada
Sweden
Hong Kong
Germany
Key Organisations

47
This might involve such steps as:
• document and promote awareness of industry contributions to wider public policyobjectives (eg. exporting, employment, environment etc),
• analyse industry need for inputs and negotiate resource flows (eg trained personnel),
• articulate and defend industry interests in relation to regulation, taxation, trade policyetc., and
• project industry messages to, and/or liaison with, stakeholders, including the media,stock exchanges, educational institutions and related and supporting industries.
For example, the Centre for International Economic Studies has documented what itassesses to be the disproportionate contribution of the wine industry to tax revenue throughvarious special retail levies. This provides a base in research for advocacy to governments,relevant departments, parliamentarians and the media. Research and advocacy are bothdistinct and specialist, albeit complementary, activities49
Dynamic processes within each zone vary and this leads to different requirements formaintenance, development and adaptation. The requirements of the competitive arena arethe direct daily concern of producers and growers. The requirements and dynamics of thezones of collaboration (Zone 2) and negotiation (Zone 3) are quite different. Both industryconcerns, and opportunities for synergies between firms, need to be identified.Understanding of shared interests needs to be nurtured and support for action programsneeds to be mobilised. These are on-going processes. Where third-party actions impinge onthe industry, appropriate representations need to be made and agreements framed andmonitored.
Strategy 2025 represented an effort to leverage industry performance by raising andfocussing aspirations, and by enhancing producer, grower, and supplier integration. It builton the formerly piecemeal and disaggregated approaches, evident in marketing andinnovation, and placed these activities in a new context. Its frame was the internationalmarket place.
The intellectual challenge to policy making is no different in a multi-firm environment. But thestructural context is vastly more complex. Shared aspirations need to be articulated,common purposes endorsed and common interests pursued. This distinguishes industry wideaction from single-firm settings - and, from the perspective of institutional design, makes itparticularly challenging. The organisational arrangements developed by the wine industry,and imaged in Figure 2.3, offer a paradigmatic pattern.
Detailed assessment of the impact industry performance of this dynamic structure is the issueto which we now turn.
49 Kym Anderson, Australia’s Grape and Wine Industry into the 21st Century, CIES Discussion Paper,No 99/24, University of Adelaide, November, 1999.

48
III. Collaboration and Learning as Causes of Industry Performance
The development of economic learning and the amelioration of transaction costs waspursued through the collaborative activities outlined in the last section. To evaluate theirimpacts, published data was sought or reworked and comparisons with other industries inroughly comparable circumstances were sought.
This approach was chosen following neo-classical logic. If the competitive environment isthe central cause of performance, as neo-classical theory implies, rates of performancebetween sectors should not vary excessively. If they do, this implies the presence of otherfactors. Where superior performance occurs in areas in which the industry has either itselfseeded new aspirations collaboratively, or established collective management, it seemsreasonable to infer these processes have had causal effects (unless other special factors arepresent). In addition, in international comparisons, Australia and other New World wineproducers started from broadly the same competitive position in 1986. If Australia’sperformance outstrips that of other countries, this too would suggest the presence ofadditional causes, although it would remain to be shown that collaborative activity was thecritical factor.
Performance was assessed in areas expressed in industry goals. Six areas were evaluated:reorientated global markets, export growth, capital raising, move to higher value segments,research and development, comparisons with other new world producers. All value data isin current prices - it is not adjusted for inflation, unless otherwise indicated.
Reorientation to global markets: Industry planning sought to shift producer aspirationsfrom domestic to international markets. There is powerful evidence this has occurred, on ascale beyond what might have happened had competitive forces alone been operating.First, the number of exporting companies grew more rapidly than the growth in the numberof companies. Exporting firms grew from 270 in 1994 to 414 in 1998, a 53% increase.50
Over the same period, the total number of wineries has increased from 802 to 1104, or by38%. The more rapid growth in export participation suggests that the wine industry isbecoming more export oriented.
Export participation seems to be on a far greater scale than in other Australian sectors. In1998, 38% of all producers were exporters. This compares with 21% for food beveragesand tobacco industries generally, and 7% for the whole manufacturing sector through theperiod 1992-93 to 1994-95.51 An earlier disaggregated survey of export participation in17 manufacturing sectors showed only two with higher export participation rates then thereseem in the wine industry – pharmaceuticals (participation rate, 76%), and photographic andscientific equipment (participation rate, 39%).52
50 Australian and New Zealand Wine Industry Directory.51 Industry Commission and Department of Industry, Science and Tourism, A Portrait of AustralianBusiness, Small Business Research Programs, AGPS, Canberra, 1997,p.121.52 Emerging Exporters, Australia’s High Value-Added Manufacturing Exporters, AustralianManufacturing Council/ McKinsey and Co., June, 1993, p. 38.
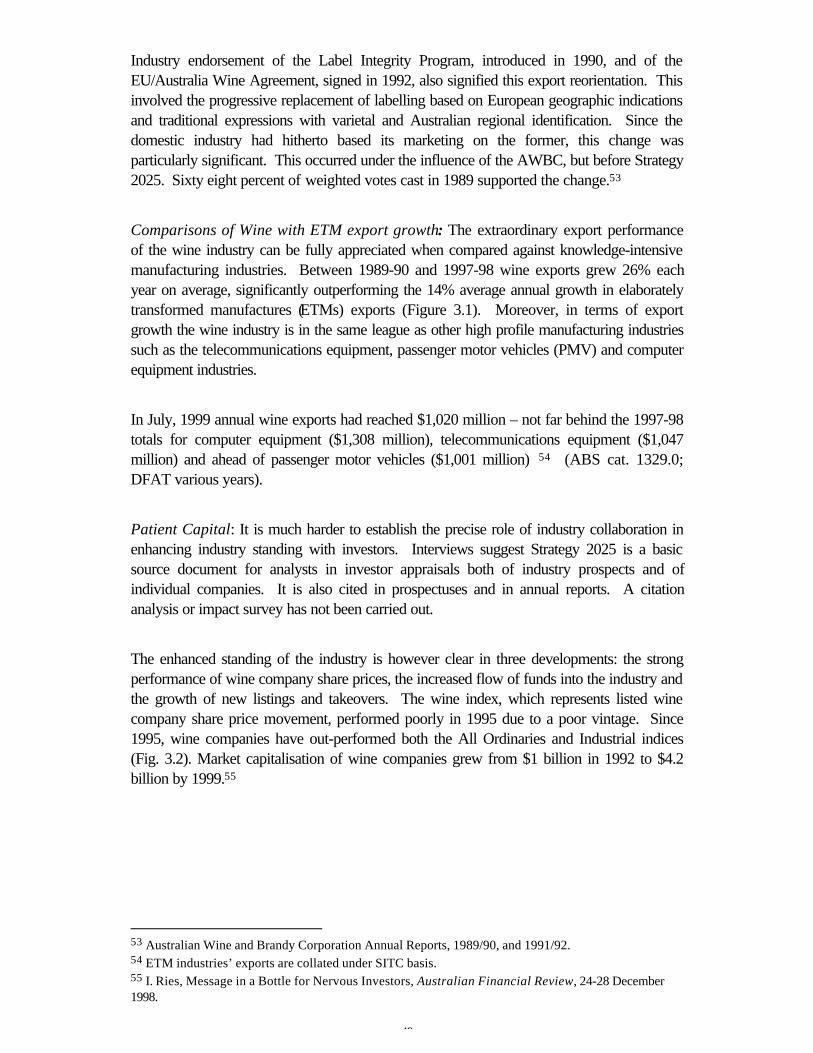
49
Industry endorsement of the Label Integrity Program, introduced in 1990, and of theEU/Australia Wine Agreement, signed in 1992, also signified this export reorientation. Thisinvolved the progressive replacement of labelling based on European geographic indicationsand traditional expressions with varietal and Australian regional identification. Since thedomestic industry had hitherto based its marketing on the former, this change wasparticularly significant. This occurred under the influence of the AWBC, but before Strategy2025. Sixty eight percent of weighted votes cast in 1989 supported the change.53
Comparisons of Wine with ETM export growth: The extraordinary export performanceof the wine industry can be fully appreciated when compared against knowledge-intensivemanufacturing industries. Between 1989-90 and 1997-98 wine exports grew 26% eachyear on average, significantly outperforming the 14% average annual growth in elaboratelytransformed manufactures (ETMs) exports (Figure 3.1). Moreover, in terms of exportgrowth the wine industry is in the same league as other high profile manufacturing industriessuch as the telecommunications equipment, passenger motor vehicles (PMV) and computerequipment industries.
In July, 1999 annual wine exports had reached $1,020 million – not far behind the 1997-98totals for computer equipment ($1,308 million), telecommunications equipment ($1,047million) and ahead of passenger motor vehicles ($1,001 million) 54 (ABS cat. 1329.0;DFAT various years).
Patient Capital: It is much harder to establish the precise role of industry collaboration inenhancing industry standing with investors. Interviews suggest Strategy 2025 is a basicsource document for analysts in investor appraisals both of industry prospects and ofindividual companies. It is also cited in prospectuses and in annual reports. A citationanalysis or impact survey has not been carried out.
The enhanced standing of the industry is however clear in three developments: the strongperformance of wine company share prices, the increased flow of funds into the industry andthe growth of new listings and takeovers. The wine index, which represents listed winecompany share price movement, performed poorly in 1995 due to a poor vintage. Since1995, wine companies have out-performed both the All Ordinaries and Industrial indices(Fig. 3.2). Market capitalisation of wine companies grew from $1 billion in 1992 to $4.2billion by 1999.55
53 Australian Wine and Brandy Corporation Annual Reports, 1989/90, and 1991/92.54 ETM industries’ exports are collated under SITC basis.55 I. Ries, Message in a Bottle for Nervous Investors, Australian Financial Review, 24-28 December1998.

50
Figure 3.1: Wine and Elaborately Transformed Manufacture Industries’ Average
Annual Export Growth56 1989-90 to 1997-98 – current prices.
0 5 10 15 20 25 30
Per cent
Telecom equip
PMV
Wine
IT & office equip
ETMs
Source: ABS cat. 1329.0; DFAT (various years).
This improved performance of wine stocks has led more wine companies to list on the ASX.At the beginning of the 1990s there were only 3 wine companies listed on the ASX,whereas by the end of the decade there were 17 listed wine companies. In addition 5companies delisted as a result of takeovers – a further indication of interest in the industry(Macquarie Equities).
The combined effect of more listed wine companies and increased investor receptiveness towine investments has helped increase the industry’s ability to raise funds. As with winecompanies’ share performance, capital raising by listed wine companies has seen an increasesince 1995-96. In 1998-99, the industry raised $131 million on the stock market(Macquarie Equities). Further, since the launch of Strategy 2025 in mid-1996 around $1billion has been invested in Australian vineyard development.57 The growth in share price,capital raising and the number of listed wine companies suggests the new popularity of wineindustry investment – but although the industry’s collaborative efforts appear to be asignificant cause, their precise contribution remains to be more thoroughly established.
56 ETM industries’ exports are collated under SITC basis. Exports are by value.57 D. Travers, The Grape Rush, Wine Industry Journal, Vol. 14, No. 1, January, 1999, p. 73.
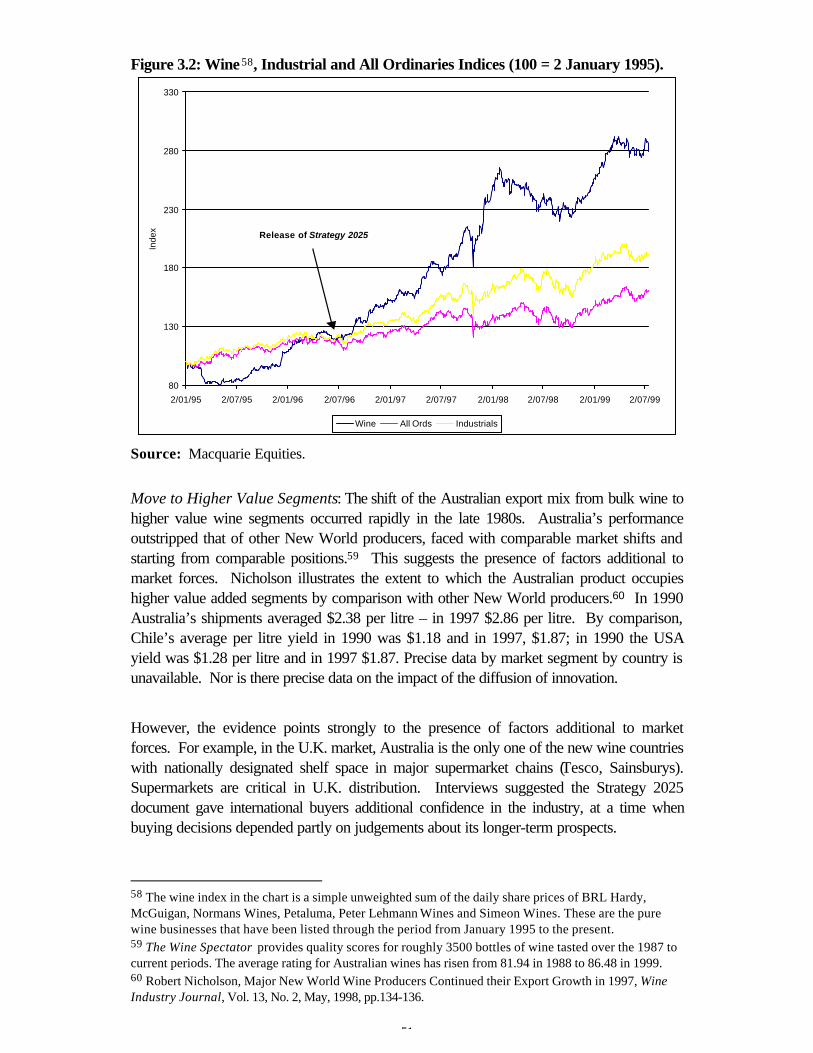
51
Figure 3.2: Wine58, Industrial and All Ordinaries Indices (100 = 2 January 1995).
80
130
180
230
280
330
2/01/95 2/07/95 2/01/96 2/07/96 2/01/97 2/07/97 2/01/98 2/07/98 2/01/99 2/07/99
Inde
x
Wine All Ords Industrials
Release of Strategy 2025
Source: Macquarie Equities.
Move to Higher Value Segments: The shift of the Australian export mix from bulk wine tohigher value wine segments occurred rapidly in the late 1980s. Australia’s performanceoutstripped that of other New World producers, faced with comparable market shifts andstarting from comparable positions.59 This suggests the presence of factors additional tomarket forces. Nicholson illustrates the extent to which the Australian product occupieshigher value added segments by comparison with other New World producers.60 In 1990Australia’s shipments averaged $2.38 per litre – in 1997 $2.86 per litre. By comparison,Chile’s average per litre yield in 1990 was $1.18 and in 1997, $1.87; in 1990 the USAyield was $1.28 per litre and in 1997 $1.87. Precise data by market segment by country isunavailable. Nor is there precise data on the impact of the diffusion of innovation.
However, the evidence points strongly to the presence of factors additional to marketforces. For example, in the U.K. market, Australia is the only one of the new wine countrieswith nationally designated shelf space in major supermarket chains (Tesco, Sainsburys).Supermarkets are critical in U.K. distribution. Interviews suggested the Strategy 2025document gave international buyers additional confidence in the industry, at a time whenbuying decisions depended partly on judgements about its longer-term prospects.
58 The wine index in the chart is a simple unweighted sum of the daily share prices of BRL Hardy,McGuigan, Normans Wines, Petaluma, Peter Lehmann Wines and Simeon Wines. These are the purewine businesses that have been listed through the period from January 1995 to the present.59 The Wine Spectator provides quality scores for roughly 3500 bottles of wine tasted over the 1987 tocurrent periods. The average rating for Australian wines has risen from 81.94 in 1988 to 86.48 in 1999.60 Robert Nicholson, Major New World Wine Producers Continued their Export Growth in 1997, WineIndustry Journal, Vol. 13, No. 2, May, 1998, pp.134-136.

52
The changing mix between premium and bulk exports indicates rapid adaptive capacity onthe part of Australian producers and the rapid assimilation of market signals in productionplanning. Australia’s exports of premium wine increased from $198 million in 1991-92 to$932 million in 1998-99 (Figure 3.3). Over the same period, non-premium wine exportshave never been more than $59 million per annum.
Premium exports contributed 97% of the growth in the value of Australia’s wine exportssince the early 1990s. While the value of non-premium exports have grown by an average9% per annum since 1991-92, the value of premium exports have grown an average 25%per year over the same period (AWBC). Overall, the value of Australia’s wine exports hasgrown by an average 38% per year since 1985-86 (ABS cat. 1329.0; AWBC).
Figure 3.3: Australia’s Wine Exports by value and segment – current prices.61
0
100
200
300
400
500
600
700
800
900
1000
$ m
illi
on
19
85
-86
19
86
-87
19
87
-88
19
88
-89
19
89
-90
19
90
-91
19
91
-92
19
92
-93
19
93
-94
19
94
-95
19
95
-96
19
96
-97
19
97
-98
19
98
-99
Total Non-premium Premium
Source: ABS cat. 1329.0; AWBC.
Research and Development: The wine industry is knowledge-driven. Research anddevelopment (R & D) has been, and continues to be, critical to its success. Interviewssuggest technological developments were widely adopted throughout the industry in the late1980s and affected both wine and grape production. These prepared the industry torespond rapidly to the change in consumer tastes evident from the early 1990s. In wineproduction, the changes included the adoption of air bag presses and cold and closedfermentation.
61 ‘Premium’ wine here is defined as bottled wine. Non-premium is wine sold in other forms ofpackaging, namely bulk, flagons and soft packs (casks). Data from 1985-86 to 1990-91 is from ABS, whiledata over period 1991-92 to 1998-99 from AWBC. Segmented export data (premium versus non-premium)on a value basis is only available from 1991-92.

53
In grape production, research resulted in new canopy management approaches, trellising,summer pruning, mechanical pruning, mechanical harvesting and more effective irrigationmethods. These changes increased yields and grape quality. The new partial root zonedrying process promises both to reduce water consumption further and to increase flavour.Data on the precise impacts of these innovations is not available.
The research and development levy was increased from $3.00 per ton to $5.00 per ton(67% increase) commencing with the 1999 harvest.62 This industry willingness to imposeadditional costs on itself suggests wine and grape producers think they receive significantbenefits from collaborative R & D.
In total around $20.9 million was spent on grape and wine research and development(R&D) in Australia in 1996-97 (CRCV; ABS unpublished data). Funding for grape andwine R&D is partly funded by the private sector through levies paid to the GWRDC, andthrough direct research expenditure by wine companies separate to their levy payments.63.In 1996-97 the private sector funded $4.3 million of R&D, $2.6 million through levies and afurther $1.7 million in additional R&D (CRCV; ABS unpublished data). Meanwhilegovernments advanced almost four times the level of private sector funding, granting $16.6million through matching levies to the GWRDC and other grants to research organisationsand universities.64
Current spending levels are comparable to other manufacturing segments. Total turnover inthe Australian wine industry was around $2.3 billion in 1996-97 (ABS cat. 1329.0). Thissuggests that grape and wine R&D represents just over 0.9% of wine industry turnover,almost the same as the 1.1% R&D intensity for the whole of the manufacturing sector (Table3.1).
The wine industry is also an R&D intensive industry amongst the food, beverage andtobacco group, where R&D represents around 0.5% of turnover. The industry’scommitment is similar to other resource-based manufacturing industries such as thepetroleum (0.9%), non-metallic mineral product (0.8%) and metal products (1.0%). On theother hand, if the industry is compared to other integrated companies its research anddevelopment commitment is relatively low. For example, based on 1997/98 data, BHP, anintegrated steel and commodity company, spent about 2.21% on research and development,Amcor, a paper company, 2.1%, Telstra, 1.4%, and Ericsson, 8.3%.65
62 Winemakers Federation of Australia Press Release, 23 July, 1998.63 Anecdotal information from GWRDC (23/7/99).64 Estimates from CRC, Viticulture. Hoj and Hayes estimate spending in 1996/97 at $17.9 million. Theyargue this amount is insufficient. P. B. Hoj and P. F. Hayes, The Australian Wine Industry’s Researchand Development and its Importance for Sustained Growth, Proceedings, Tenth Australian WineIndustry Technical Conference, Winetitles Adelaide, forthcoming, 1999, pp. 2-7.65 R and D gets razor treatment, The Age, 1st May, 1999. Another set of comparisons is proposed in Hojand Hayes, ibid. International comparisons on research spending are in Robin Day, Into the NextCentury – Without Fear, Wine Industry Journal, November, 1997, pp. 352-353.

54
Table 3.1: R&D Performance: Wine and Other Manufacturing Industries, 1996-97.
ANZSIC
Code
R&D
$m
Turnover
$m
R&D
intensity66
%
Wine67 21 2,270 0.9
21 Food, beverages & tobacco 232 44,978 0.5
22 Textiles, clothing, footwear & leather 21 9,935 0.2
23 Wood and paper 191 11,481 1.7
24 Printing, publishing & recorded media 17 14,868 0.1
25 Petroleum, coal, chemicals & assoc. 309 32,863 0.9
26 Non-metallic mineral products 66 8,622 0.8
27 Metal products 365 37,894 1.0
281-282 Motor vehicles & parts 401 19,697 2.0
283 Photographic & scientific equip 91 1,598 5.7
284-285 Electronic and electrical equip 423 12,063 3.5
286 Industrial machinery & equip 144 7,902 1.8
29 Other manufacturing 46 6,446 0.7
C Manufacturing 2,305 208,348 1.1
Source: CRCV; ABS cat. 1329.0, 8104.0, 8221.0 and unpublished data.
Although complete data is not available, evidence suggests a high rate of take-up oftechnological innovations in the wine industry, by comparison with other Australianmanufacturing industries. Data on take-up, or on the rapidity of take-up has not beengathered for the wine industry.
However, a survey of winegrape grower innovation was undertaken in late 1998.68 Thisshowed 68% of growers had adopted one or more innovations. Areas of innovation were:water management and irrigation issues (19%); improving grape quality (14%); pestmanagement and chemical management (13%); nutrition and fertiliser (5%). This comparedwith the average for innovation take-up in food, beverages and tobacco of 36.3% and totalmanufacturing of 26% (Table 3.2).
66 ‘R&D Intensity’ is industry R&D as a percentage share of industry turnover.67 ‘Wine’ R&D includes grape R&D.68 TQA Research, Survey of Grower Attitudes and Behaviour, on behalf of the GWRDC, Adelaide, 1998.

55
Table 3.2: Proportion of Businesses Undertaking Technological Innovation,
1996-97, by industry (%).
Type of technological
innovation
Industry Subdivision Product Process Total
Food, beverages & tobacco 33.0 29.1 36.3
Textiles, clothing, footwear & leather 14.7 13.6 15.4
Wood & paper products 11.8 12.0 15.7
Printing, publishing & recorded media 17.6 20.7 25.6
Petroleum, coal, chemical & assoc. products 34.8 29.3 42.1
Non-metallic mineral products 32.6 20.7 35.5
Metal products 20.3 12.7 21.1
Machinery & equipment 33.0 19.8 35.3
Other manufacturing 18.9 14.7 20.9
Total manufacturing 22.9 17.8 26.0
Source: ABS cat. 8116.0.
Comparisons with other New World Producers: As already noted, comparative data onchanges in rates of penetration of premium segments in particular national markets, based onthe share of supplier countries shows the superior performance of the Australian industry bycomparison with other New World producers. Changing country market shares showAustralia’s strong performance in the U.K. and EU and Chile’s strong performance in Japanand the US (Table 3.3). Australia’s strong penetration of the U.K. market shows it almostmatching Italy’s importance as a wine supplier and Australia has managed to match thestrong growth of Chile’s share of U.S. wine imports.
Another indicator that Australian approaches are regarded as ‘best practice’ would be theirimitation – in fact, both California and South Africa propose to emulate the planningapproach adopted in Australia. Domestically, the gold industry has also indicated an interestin this approach.69
69 Australian Financial Review, 12th March, 1999.

56
Table 3.3 Wine Producing Countries’ Share of Selected Wine Markets’ Imports( % )
Markets UK USA Germany Japan Europe
Producers
1990 1997 1990 1997 1990 1997 1990 1997 1990 1997
France 52 40 47 45 49 39 65 56 51 40
Italy 15 13 31 27 32 34 5 13 20 18
Spain 8 9 8 5 8 12 3 3 8 12
Portugal 4 4 3 3 2 1 - - 6 5
Germany 13 7 5 2 - 9 6 4
Australia 2 10 2 7 - 1 2 2 1 4
USA 1 5 - 1 6 5 1 3
South Africa - 3 - - - 1 - - - 2
Chile - 3 2 8 - 1 1 3 - 2
New Zealand - 1 - - - - - - 1 1
Other 5 5 2 3 9 10 18 9 6 9
Total 100 100 100 100 100 100 100 100 100 100
Source: DFAT, UN database.“-” means no significant sales.
Overall, Australia's export performance has outstripped that of competitor countries. Of thetwelve fastest growing wine-exporting countries in the ten years from 1986 to 1996, fivecountries exceeded Australia’s growth rate (Figure 3.4). Of these, Sweden, Finland andUruguay were growing from virtually minimal volumes. The two major competitors, SouthAfrica and Chile, achieved much lower total volumes despite starting from similar minimalexport levels in 1986-87 and despite enjoying sales growth over this whole period.
57
Figure 3.4. Twelve Fastest Growing Wine Exporting Countries (1986-1996) and
Their Value of Exports (1996)
UruguayFinlandSweden
South Africa
Chile
Australia
Brazil
New Zealand
MexicoASEAN 4
NIE 4Argentina
0
50
100
150
200
250
300
350
400
450
500
20 25 30 35 40 45 50 55
Growth (%)
Exp
ort
s (U
S$
mill
ion
)
Source: Berger, Anderson & Stringer (1998), pp. 126-127.
A third source of evidence comes from the Rabobank70 survey of the international wineindustry. The report rates established and New World producers in a league table of elevenattributes (Table 3.4). Three are natural endowments (geography, climate and land); fiveare created assets (labour, capital, infrastructure, knowledge infrastructure, and networks);and three involve the environment (domestic market, economy and government).
Australia is not rated ‘outstanding’ in relation to any natural asset. The Australian industryscores highest in relation to created assets. The US, Germany and Australia each receiveoutstanding assessments in three categories and good assessments in the others. Australia israted outstanding for both knowledge infrastructure and networks, along with the USA,Germany and France. No other New World producers are so rated.
This suggests that Australia’s strategic-collaborative approach has allowed it to buildknowledge links and networks that are a source of competitive edge. Australia’s principalstrengths according to these ratings flow from its created assets. Only France rated aheadof Australia in overall tally (France: 5 outstanding and 4 good ratings; Australia: 4 and 5respectively). The US scored the same overall result as Australia.
70 The World Wine Business, Rabobank International, Utrecht, Holland, May, 1999, p. 47.

58
Table 3.4: Comparison of competitiveness old wine vs new wine countries
Production Factors Fra
nce
Italy
Ge
rma
ny
Sp
ain
Po
rtu
ga
l
Gre
ece
US
A
Arg
entin
a
Sou
th A
fric
a
Au
stra
lia
Ch
ile
Ne
w Z
ea
lan
d
Geography + + + + •• •• + •• •• •• •• ••
Climate ++ + - + + + + + ++ + ++ ++
Land and raw materials + + + + + + + ++ •• + ++ +
Labour •• •• •• •• •• •• •• + + •• + ••
Capital ++ + ++ + •• •• ++ - + ++ •• +
Infrastructure + + + •• •• •• + - + + •• ••
Knowledge Infrastructure ++ + ++ + •• •• ++ •• + ++ + +
Domestic Market ++ + - + - - ++ •• •• + + +
Network ++ •• ++ •• •• - ++ - + ++ + +
Government = = = + = = + •• - + + +
Economic variable + •• + + •• + + - + ++ + +
Note: - moderate + good
++ outstanding • no specific advantage
= balance between advantages and disadvantages
Source: Rabobank International
Old New

59
IV. Future Implications for the Wine Industry
Strategy 2025 sought to ‘reframe’ the idea of the industry.71 It sought to create a commonawareness of the priority of international participation, marketing and innovation, and of theimplications of these new priorities for a variety of current activities. This potential gain wasthe basic ground for producers to ‘buy in’. Further, reaching their gains requiredcollaboration amongst producers. The complex structural ensemble of collaboration in thewine industry depicted earlier in Figure 2.3 was given coherence and direction through thisprocess.
Considerable initial momentum was generated. But maintenance and development ofstrategic collaboration is an on-going task and requires continual action on several fronts (eg.research, marketing, competitor developments etc). It also requires action that is specificallytailored to the differing needs of producer and grower segments.
The first requirement is the continual nourishing of strategic awareness amongst industryparticipants. Through Strategy 2025, the industry has moved to constitute itself as anintegrated cluster. This is in a context in which authority is based on consent, not hierarchy,and needs to be continually renewed and negotiated. Continuing momentum andcommitment requires the active engagement of industry members. The seeding of strategicawareness is an on-going process of consultation, information generation and collaboration.The strategic envelope provides the rationale for producer participation. It suggests thegains available to all through collaborative action. The processes by which strategicawareness might be nourished are varied – but research, information, outreach anddissemination are critical.
A second reason to sustain strategic focus arises from the need to maintain industrycommitment to the unfolding medium term and operational agenda. The strategic frameworkprovides the integrated rationale for on-going activity in innovation and marketing, and innegotiations with governments, other stakeholders and factor suppliers.72
The theoretical approaches introduced earlier suggest the potential contribution of thiscollaborative architecture. But its full flowering requires commitment of substantial financialand other resources. It is not clear that this has occurred to a sufficient level in theAustralian wine industry. Data on association spending and staffing was gathered for thisstudy – but more detailed work would be required to assess its appropriateness. Cursoryevidence suggests more resources are is required.
71 For a critique of the failure of Strategy 2025 to sufficiently emphasise profitability and returns seeDavid Wollan, The Australian Wine industry, A Sceptics View, Wine Industry Journal, February, 1998,pp.22-24.72 Several contributors have argued for an increase in research and development spending – Hoj andHayes, op. cit; Brian Croser, A Proposed Action Agenda, Wine Industry Journal, Vol. 12, No. 4,November, 1997, pp. 346-349.

60
For example, the WFA has only two senior staff members to manage both strategicdevelopment arising from the unfolding of Strategy 2025, and the on-going requirements foranalysis and liaison associated with the various public agencies and bodies surrounding theindustry. Marketing strategy in the critical international arena is managed by one or twopeople with a variety of other responsibilities. Similarly, oversight of research strategyrequires engagement with its overarching purposes.
In addition, there is no process that would routinely focus attention on the operatingimplications of Strategy 2025 priorities. The Five-Year Operating Plan represented aneffort – but it is not clear how many of the foreshadowed programs have been implementedor who is responsible for coordination and monitoring.
One complexity in sustaining collaboration arises from the differing incentives. Scaledifferences between firms in the industry create differential stakes and concerns. All firmshave deep interests in united action, but intensity of concern can vary between areas. Thestatutory levy arrangements eliminate the possibility of free riding - whilst the differential levelof levies recognises the different stakes of producers and growers of differing size.
One fundamental theme of Strategy 2025 was marketing. Marketing seems likely to be ofeven greater significance in the next phase of industry development. This is underlined bythe shift to premium segments. In addition, major growth opportunities would seem to lie inculturally more difficult environments (Japan, Germany, perhaps China). The majorinternational review of the industry, published in May 1999 by Rabobank, provides anunequivocal endorsement of the importance of marketing. This was reinforced in interviewsconducted for this study. Marketing may, in fact, be one approach to sustaining strategic‘learning’ amongst industry members. Marketing offers a multi-facetted theme that could bethe subject of coordinated attention both at strategic and operational levels. Action atstrategic levels is desirable to cultivate the ‘learning’ that not only enhances the effectivenessof individual producers – but also reinforces and augments commitment to collaborativeprograms.
The rapid expansion of the whole industry is one reason to raise awareness of marketingissues. This is indicated in the increase in acreage planted. Over 19,700 hectares are dueto come into production in the next few years, an increase of 25% in acreage, and indicativeof the growth in demand for wine grapes (Figure 4.1).

61
Figure 4.1 Area of Vines (hectares)
0
20
40
60
80
100
120
1994 1995 1996 1997 1998
' 00
0 he
ctar
es
Bearing Planted previously Planted current year
Currently 78,709 hectares bearing
grapes in 1998 ….
… with another 19,729 hectares soon
to come on line.
Source: ABS cat. 1329.0Note: 1998 figures are preliminary.
Approximately 60% of acreage is owned by major companies or tied to them through longterm growing contracts. The balance is more speculative - and represents that segmentwhere fluctuations in supply and demand will be absorbed in grape prices. Enhancedmarketing efforts seem to offer the best opportunity to sustain industry growth rates. Bycontrast, disputes between producers and growers might fracture industry unity, weaken itsstanding in crucial fora and damage its reputation for coherent and purposive action.
The continuing internationalisation of the wine industry is also an increasingly important issuefor the Australian wine industry. Several large wine makers are currently expanding, orplanning to expand, their operations overseas. Retaining an industry base in Australiarequires the maintenance of what Dunning describes as ‘location specific assets.’ These arethe institutional and infrastructural features that leverage competitive advantage – forexample, education facilities, R & D capacity, skilled personnel and the like. Locationspecific assets are mostly linked to public policy, not to firm strategy.
A Wine Industry Cluster?
The development of cluster relationships is implicit in industry collaboration. Although not aperfect guide, ABS input-output data provides some indication of the potential fordevelopment of an Australian cluster (ABS unpublished data). This data highlights otherindustries with important links to the wine industry.
‘Other agriculture’ industries contributed 29% of total supplies of intermediate goods to thewine industry ($366 million) in 1994-95, the overwhelming proportion of which was

62
supplied domestically by Australian firms, mostly from winegrape producers. The papercontainer and products industry supplied $132 million or 10.4% of intermediate inputs.
Glass and glass products supplied $103 million, or 8.1% of industry inputs. These werepredominantly sourced domestically. Partly under ACCC influence, and partly throughnegotiation between the industry and the glass provider (ACI), the price of bottles hasprogressively reduced towards world market levels.73
Industries where imports supplied a significant proportion of inputs to the Australian wineindustry were insurance services (73% imported) and plastic products (46%imported)(ABS unpublished data). A substantial portion of the oak barrels used by theAustralian wine industry are also imported.74 The demand for such barrels has increased asAustralian wine production has grown, particularly in premium wines. Service industrylinkages were with accommodation, cafes and restaurants, wholesale trade and roadtransport. The enhanced flow of investment funds to the industry, despite the lead-time inrealising returns, has already been noted.
The 1999 ANZWID lists a total of 663 firms supplying a wide range of specialised inputs.The areas with more than 50 listed suppliers include: winery equipment manufactures (108firms), chemical manufactures and suppliers (66 firms for production and 37 for viticulture),cooperage (54 firms), filters (83 firms), pump suppliers (72 firms), packaging specialists (67firms), and tanks (55firms). A number of these firms may deal in imported products. TheDirectory also lists 175 distributors, 70 specialised consulting firms and 242 organisationsthat provide various types of support services to firms in the industry.
This quantitative and descriptive data reflects formal or trade based interdependencies.Clustering is above all an associative process, involving identification of critical linkages, andthe establishment of processes to manage performance at these junctures - for example, bydefining common interests, identifying spillovers and interdependencies and speeding upresponse times.
The collaborative processes instituted in the Australian wine industry are a framework forthe development of more elaborate cluster arrangements. The industry has increased itscollaborative effort, but there is considerable scope for more formalised activity to capturegreater commercial value from the latter.
73 Chris Snow, Bottle Heat Cools .... but heat still on ACI, Wine Industry Journal, February, 1998, pp.26-32.74 Australian Financial Review, 9th April, 1999.

63
V. Implications for Other Industry Sectors and Governments
The theoretical grounds for an augmented public policy and industry development approachwere earlier sketched. To summarise, a combination of collaboration and competition mightbe expected to yield superior performance outcomes to vigorous competition alone. This isbecause a combination of collaboration and competition is consonant with the new drivers ofcompetitive success.
In the present economic phase, characterised by Dunning as ‘alliance capitalism’,competitive success requires firm, but preferably cluster, capabilities for innovation andparticipation in international markets.75 Competitive success increasingly requires alliancesbetween firms and other institutions. These developments raise the significance of transactioncosts in firm level decision-making. Transaction costs can only be ameliorated in one of twoways: internally within firms, or through focussed collaborative action. The latter requires theadoption of an appropriate (and shared) strategic outlook amongst protagonists.
An industry-level strategy helps reduce transaction costs by increasing information,establishing common goals and coordinating activities. It allows gains to be shared andcluster synergies to be realised. The strategy provides the instrumental ground for linkage.It needs to be developed participatively. It also needs to be deliberately disseminated tomobilise industry participants. Since the goal of collaboration is enhanced market outcomes,feedback is relatively straightforward and relatively readily available.
The wine industry provided an ideal milieu for testing these theoretical propositions. This isbecause all three elements – internationalisation, innovation and a shared outlook – havebeen deliberately cultivated. The evidence reported earlier vindicates the theory. Itdemonstrates an international reorientation on the part of industry participants. It showstheir greater proportionate participation in exporting by comparison with other Australianindustry sectors. It shows superior performance in export markets by Australianparticipants by comparison with competitors. It shows industry participants themselvesjudge collaboration to have added value to firm level operations. Finally, it shows aprogressively developing commitment to research and development – and a reasonablecontribution to this activity by comparison with other Australian sectors, albeit amplified by avery substantial public sector contribution.
Developments in this industry occurred under the pressure of fortuitous changes and theambition and ‘enlightened opportunism’ of a few industry leaders. The industry structure –four major, substantially locally owned producers and a growing number of medium andsmall producers – emerged as a result of contingencies in the late 1980s.
75 Dunning, op. cit; also Alliance Capitalism and Global Business, Routledge, London, 1997; alsoDavid B. Yoffie, (ed), Beyond Free Trade: Firms, Governments and Global Competition, HarvardBusiness School Press, 1996.

64
The industry associations that supported industry collaboration emerged at the same time.This occurred under the pressure of another set of contingencies. The contention betweenproducers evident until the late 1980s was progressively displaced.
Collaboration did not develop systematically or sequentially. Joint action in relation toinnovation and exporting occurred independently and partly under the pressure of moregeneral government action. Legislation underwrote compulsory levies and the othersanctions exercised by the exporting authority. Exporting was itself progressively recognisedas an opportunity, partly as a result of the sales surge arising from exchange rate changes inthe mid 1980's, and partly as a result of the vision and commitment of a few leaders. Anoverall framework, embodied in Strategy 2025, was added in 1996 - some years after thedevelopment of deepened industry commitments to innovation and internationalisation. Thisframework has since provided the foundation for reconfiguring and enhancing both theseactivities.
Other relevant considerations include the special features of the industry. These particularlyrelate to the socialising of industry participants. This occurs through training at one of twoinstitutions, which builds relationships between industry participants and imparts traditions ofquality and research. In addition, the product is particularly favourable to the projection of adistinctive 'Brand Australia.'
These varied considerations circumscribe the generalisability of this industry’s experience.Yet the patterns evident in the wine industry case suggest approaches to building competitivestrength that may fit other sectors – and that may be mutually reinforcing. There would seemto be at least three possible strategies, which are not mutually exclusive. The first mightinvolve a ‘bootstrap’ effort under the influence of acknowledged industry leaders. Thesecond might involve leadership by established industry associations. And the third mightinvolve government acting in a catalytic role. These possibilities are considered in turn.
Bootstrap Effort – Industries do it for themselves
In principle, there seems no reason why any cluster/industry should not bootstrap its ownefforts in marketing, innovation, overall strategy or some combination of these activities.Innovation, internationalisation and a shared vision might all be developed in appropriatecircumstances – and if the theory cited at the outset is correct, many business sectors withinternationally tradeable products will experience gain through participation in externalmarkets and/or innovation. In the wine industry case, the change agents wereacknowledged industry leaders. The circumstances of this industry nourished the recognitionof such individuals – for example, through participation in awards, through publicity inestablished industry media etc. Others may judge the extent to which functionally equivalentcircumstances exist in other industries. Where they do, the opportunity to bootstrapperformance may be available. In practice, however, transaction costs, externalities andgenuine uncertainty are likely to inhibit action.
65
Industry Associations as Change Agents
A second possibility involves industry associations acting as change agents. As alreadynoted, industry associations were critical actors in wine industry collaborative outcomes. Adense network of nine organisations mediated collaboration. These organisations carried thebasic coordinating costs in expressing the common interests and aspirations of otherwisecompetitive actors. Australia is fortunate in having a plethora of industry associations - albeitmostly now with a focus on external, mainly government, relationships and on industrialrelations.
Associations might extend their services to members by conducting ‘opportunity audits’ fortheir industry or cluster and by offering to manage linkages to facilitate innovation and/orinternationalisation. The problem of free riders would need to be addressed. But assumingthis could be managed, associations might be the vehicles for undertaking audits of industrypotential as a basis for defining opportunities from enhanced collaboration.
The scope of such audits is suggested in the following checklist (Table 5.1).
The issue for associations may be the stimulus to undertake the initial investments ininformation gathering, learning and strategy development. Initial costs would be quite high.Co-ordination problems are large. The temptation to free ride would be considerable. In thewine industry case, the tradition of collaboration was buttressed by compulsory levyarrangements for export marketing and research and development. This suggests the needfor incentives to stimulate association effort, perhaps, matched by firm-level incentives toencourage buy-in.
Government as Catalyst
A third possibility would involve the State playing a catalytic role. This approach would becontrary to current conventional wisdom about the appropriate role for the State inadvancing competitiveness. Such a view is based on neo-classical economic perspectivesand focuses on the contribution of competitive markets to consumer well being. A variety oftheories and doctrines underwrite these approaches including allocative efficiency as a norm,competitive advantage, contestable markets, information economics, agency theory, andpublic choice theory. This constellation is generally hostile to any active role for the State inpromoting industry.
A second more eclectic family of theories has emerged in the past decade, driven partly byobserved real world developments (‘alliance capitalism’), and partly by dissatisfaction withwhat is occluded by the premises of the neo-classical paradigm. This constellation, whatmight be generally termed ‘institutional’ theory, includes a focus on the significance andimpact of transaction costs, path dependence and innovation.

66
Table 5.1: Industry Audits Checklist
• The export potential of the cluster
• The organisation of the cluster/complex, including:
- the number, size and focus of companies operating in thew cluster or complex;
- the range and skills of the suppliers especially subcontractors in this sector;
• The success of the cluster and any weak points as seen in:
- the technology capacity of the cluster;
- the R&D capacity available in the complex as a whole among the firms;
- the R&D capacity in the public sector which is available to the private sector;
- the efficiency of information flows between the sectors in the diffusion of existing
knowledge of all the kinds mentioned in part one;
- the adequacy of the technological transfer mechanisms in place in the complex;
• The support needed for development of training capacity:
- the training capacity of both firms and public sector institutions in the arena at both
initial and permanent education levels;
- the level of skills available in the workforce and whether there are any shortages. If
so, the audit should identify capacity to rectify those shortages;
• Εnvironmental factors affecting cluster/complex success:
- the presence or absence of related and supporting industries, such as supply
industries or appropriate business services and problems, which may be caused by
the patchy nature of the industrial structure most relevant to the complex;
- the adequacy or otherwise of capital needed for expansion by firms of all types in
the complex;
- whether government regulations relating to the area cramp development and what
would be specific desirable changes;
- the ways in which public procurement could aid the development of the cluster;
• The ways in which public sector research can be harnessed better via cooperative
arrangements with private players.
Source: Jane Marceau, Derek Sicklen and Karen Manley, The High Road and the LowRoad, Australian Business Foundation, 1997 Chapter 11, p.5/6

67
It highlights the nature and new importance of location specific assets (versus the nowrelatively more mobile firm specific assets) and the contribution of institutions (for example,clustering) to economic performance.76 Finally, it recognises that the presence ofappropriate ‘ideas, choice sets and motives’ cannot be taken for granted. Institutionalanalysis explores conditions that precede engagement in markets by firms - indeed, theypoint to the conditions that are, so-to-speak, incubators of market engagement.
The institutional group of theories coincide in implying a constitutive and systemic role for theState in relation to market activity. For example, Dunning summarises potential areas ofcontribution to competitiveness from public policy in his elaborations of Porter’s competitivediamond (Figure 5.1). These positive roles assume States retain a significant interest inindustry structure – for example, for the broader, economy-wide consequences of thepresence of industries that offer ‘high’ quality’ jobs, and or, that have a high propensity toexport. This view would be contested in neo-classical theory.77
Neo-classical and institutional approaches are based on different premises and they mostlyemploy different methodologies. This precludes theoretical fusion or intersection. It alsoprecludes conclusive findings about relative explanatory power.
At the operational level, however, there is potential complementarity. This is because eachconstellation ‘fits’ different dimensions or facets of economic activity. The neo-classicalconstellation implies attention to the quality of markets, once they are established. Theinstitutional family focuses on the conditions necessary for the establishment of markets - oron the conditions necessary for market participation (eg. in remote markets). It incidentallyincludes strong public interest arguments for building a State role. This is to nourish locationspecific assets. In a world in which firm specific assets are relatively more mobile, locationspecific assets anchor firms in particular places.
The State might play a catalytic role in industry development by offering to facilitate actionby industry leaders and/or industry associations. Seed funds might be offered (on acontributory basis) for preliminary analysis.78 Industry associations might be encouraged toplay roles analogous to those of the WFA and the other specialist groupings in the wineindustry. Public funds might be offered on a contributory basis to support collaborativeaction – for example, to develop cluster visions, based on exporting and innovation.
Figure 5.1: Role of Government in Cluster-Upgrading
76 The Singapore government has based its current development strategy on an analysis of clusterpatterns and gaps. The base document provides a model of how such analysis might be approached.Task Force Report, The Strategic Economic Plan, Towards a Developed Nation, The EconomicPlanning Committee, Ministry of Trade and Industry, Singapore, 1992.77 Michael Porter specifically addresses this argument in On Competition, op. cit., especially Chapter 6,The Competitive Advantage of Nations.78 In principle, there seems no reason why the added value of exporting might not be calculated on abasis analogous to that used earlier by the Productivity Commission to estimate the gains fromderegulation and privatisation of public utilities. Some net present value estimates might provide afoundation for establishing incentive levels.
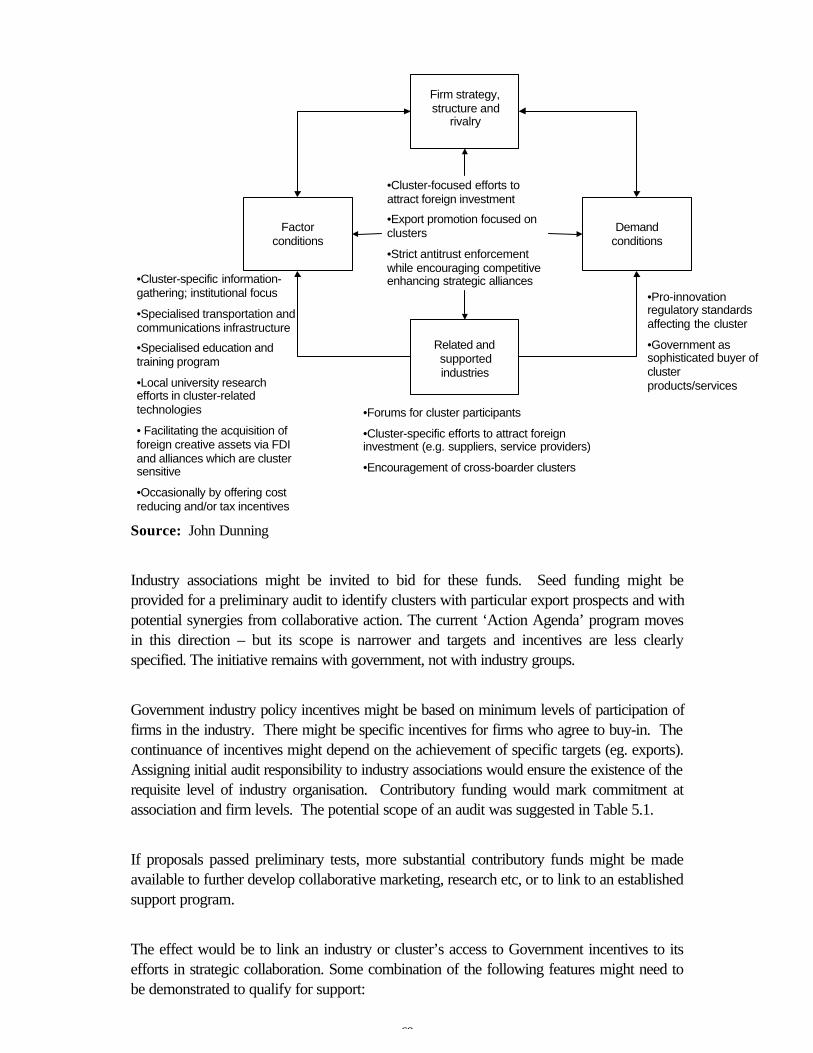
68
Demandconditions
Factorconditions
Firm strategy,structure and
rivalry
Related andsupportedindustries
•Cluster-focused efforts toattract foreign investment
•Export promotion focused onclusters
•Strict antitrust enforcementwhile encouraging competitiveenhancing strategic alliances
•Forums for cluster participants
•Cluster-specific efforts to attract foreigninvestment (e.g. suppliers, service providers)
•Encouragement of cross-boarder clusters
•Pro-innovationregulatory standardsaffecting the cluster
•Government assophisticated buyer ofclusterproducts/services
•Cluster-specific information-gathering; institutional focus
•Specialised transportation andcommunications infrastructure
•Specialised education andtraining program
•Local university researchefforts in cluster-relatedtechnologies
• Facilitating the acquisition offoreign creative assets via FDIand alliances which are clustersensitive
•Occasionally by offering costreducing and/or tax incentives
Source: John Dunning
Industry associations might be invited to bid for these funds. Seed funding might beprovided for a preliminary audit to identify clusters with particular export prospects and withpotential synergies from collaborative action. The current ‘Action Agenda’ program movesin this direction – but its scope is narrower and targets and incentives are less clearlyspecified. The initiative remains with government, not with industry groups.
Government industry policy incentives might be based on minimum levels of participation offirms in the industry. There might be specific incentives for firms who agree to buy-in. Thecontinuance of incentives might depend on the achievement of specific targets (eg. exports).Assigning initial audit responsibility to industry associations would ensure the existence of therequisite level of industry organisation. Contributory funding would mark commitment atassociation and firm levels. The potential scope of an audit was suggested in Table 5.1.
If proposals passed preliminary tests, more substantial contributory funds might be madeavailable to further develop collaborative marketing, research etc, or to link to an establishedsupport program.
The effect would be to link an industry or cluster’s access to Government incentives to itsefforts in strategic collaboration. Some combination of the following features might need tobe demonstrated to qualify for support:

69
• Increased export activity;
• Increased investment in R&D or other innovative, capability-enhancing activities .
Cluster development might also be encouraged through evidence of enhanced commitmentto the following outcomes:
• Greater investment in training for both management and workforce;
• Increased local sourcing;
• Employment expansion;
• Networking with others in the same or complementary sectors;
• Productivity growth.
A positive analysis and assessment might lead to the development of collaborativeframeworks involving such steps as:
• Establishing a developmental strategy and detailed strategic industry objectives forexport development, thus creating awareness (and motives) for expansion in individualfirms and providing analysis to stimulate their planning.
• Anticipating industry requirements for skilled personnel and thus ensuring skill shortagesdo not hamper growth.
• Promoting generic product and process technology development. This would ensure alevel of technology development greater than would be available to any single firm andone that all firms have access to, and are stimulated by, product or process innovations.
• Expanding industry promotion, marketing and brand recognition by pooling efforts.
• Enhancing product quality by establishing and monitoring industry-wide standards.
Funding bids might be made at various stages in the life of a collaborative program. At leastthree conditions might need to be satisfied for funds to be allocated:
• A net national benefit would need to be demonstrated. This could be in terms of criteriaalready established;
• There would need to be measurable performance objectives to mark particular phasesof the process. A failure to meet these objectives would automatically trigger a reviewprocess; and
• There would need to be evidence of tangible industry commitment.
The contribution of the underlying socialisation in the wine industry has already been noted.In the judgement of some observers, this was a critical ingredient – an element whoseabsence would negate equivalent possibilities in other sectors. This issue is sidestepped inthe proposals outlined above. These place government in the role of catalyst facilitator, notof primary actor or sole sponsor. Further, support is contingent on clear performance

70
benchmarks, based on market outcomes, what Aoki has termed elsewhere 'contingentrents.'79 Finally, the work of the Productivity Commission, in its various mutations, indicatesthat outcomes can be independently evaluated. Its performance refutes argumentsconcerning State capture and 'rent seeking'. It shows governments are capable ofindependent analysis. Governments can withdraw, as well as grant, benefits.
In summary, the theory and practice reviewed in this case study suggests a comprehensiveframework through which a government role in economic development might be renewed -a role that is consonant with contemporary imperatives. Historically, such a role was criticalboth to the development of advanced industry in Australia, and, through job creation, to thebroader quality of community life. The foregoing suggests how it might be renewed - inways that are in harmony with the emerging global economy and with innovation orknowledge-driven competitiveness.
79 M. Aoki et al, The Role of Government in East Asian Economic Development, Clarendon Press,Oxford, 1997, pp. 14-17.

71
VI. Conclusions
There is strong evidence that the Australian wine cluster has benefited from the developmentof collaboration, particularly in fostering its export orientation, and its commitment toresearch and development. The institutions, methodologies and techniques through whichthis has been accomplished are all clear. Industry association structures allowed a fewvisionary leaders to translate their ambitions into practical programs. Fortuitous factorscontributed. But industry leaders capitalised positively on the opportunities thus created.
This enquiry looked to explanations of performance to refine or augment those based onmarket forces and natural endowments. It considered the specific contribution of two otherfactors – knowledge and clustering. One aim was to show how the mobilisation ofknowledge (economic learning) contributed to firm and industry success.
In the wine industry case, collaboration was the means through which knowledge enhancedcompetitive performance. Collaboration was the means by which knowledge of exportopportunities, and of innovation, was developed and disseminated.
A second key idea emerging from this study concerns the potential power of clustering.Through linkage in clusters, the competitive strength of individual firms can be augmentedthrough association with related and supporting firms. Michael Porter argues: ‘The clusterconcept represents a new way of thinking about national, state and city economies, andpoints to new roles for companies, governments, and other institutions striving to enhancecompetitiveness.’80 The competitive leverage or stretch derived from cluster linkage can bedecisive to success at the level of individual firms.
Contemporary conditions make attention to knowledge and clustering especially salient.The most prominent of these are economic globalisation as the source of economicopportunities, and innovation as the driver of competitive success. The theory and practicethat currently mostly informs policy in Australia assumes domestic competitive conditions areprimary. It assumes that, if the domestic competitive regime is relatively undistorted, and if amarket is generally free from regulation, participation in global markets and innovation will‘naturally’ germinate. But this approach does not recognise the problematic character ofthese latter activities.
Present public policy approaches are based on theories that were developed when nationalboundaries were significant economic barriers, and when technological change was periodicor episodic, rather than primary and continuous. Globalisation and knowledge-basedproduct and process development have undermined both conditions, with structural andpolicy implications that have only recently been recognised.
80 On Competition, Harvard Business Review Books, Cambridge, Mass., 1998, p.197-198.
72
Although national boundaries are now much less significant as barriers to economic activity,differences of tastes and language, of political and regulatory systems remain large. Thismakes participation in remote markets much more problematic for individual firms, evenfirms that are, by Australian standards, relatively large.81 Similarly, technologicaldevelopment can be prohibitively expensive for individual firms; many of its phases requirecollaborative interactions between researchers and business. An exclusive reliance on pricebased relationships in these phases is prohibitive, not facilitative.
Moreover, the fact that national boundaries are relatively less significant as barriers toeconomic activity means firms are relatively more footloose. Cluster linkages, embeddedcapabilities and knowledge infrastructure thus acquire much greater importance in anchoringfirms to particular regions or countries. This creates wider public interest grounds for newpolicy approaches. These could focus on the identification and development of capabilitiesanalogous to those that have contributed to the competitiveness of the wine industry.
Finally, the real power of the wine industry example is not in precise imitation. It is rather insuggesting how other clusters might be encouraged to bootstrap their own aspirations, goalsand performance. The rationale for such an approach is thoroughly grounded in recentdevelopments in scholarly theory. By such means, the competitiveness of an array ofAustralian clusters might be developed and their contribution to broader public policyobjectives renewed.
81 For example, in the wine industry, the largest Australian company, Southcorp, ranks 13 in the toptwenty (by sales). BRL-Hardy ranks 16th and Mildara Blass 18th (Rabobank Survey, May 1999, p.11).