author: nikolaos efkarpidis co-authors: carlos gonzalez thomas wijnhoven
DESCRIPTION
Coordinated voltage control scheme for Flemish LV distribution grids utilizing OLTC transformers and D-STATCOM’s. Author: Nikolaos Efkarpidis Co-authors: Carlos Gonzalez Thomas Wijnhoven Tom De Rybel Johan Driesen. Content. The problem The purpose of this work - PowerPoint PPT PresentationTRANSCRIPT
Coordinated voltage control scheme for Flemish LV distribution grids utilizing OLTC
transformers and D-STATCOM’s
Author: Nikolaos EfkarpidisCo-authors: Carlos Gonzalez
Thomas WijnhovenTom De Rybel Johan Driesen

Content• The problem• The purpose of this work• OLTC control strategies• Technical impacts on LV grids• Inputs and assumptions• Evaluation of OLTC’s performance• Coordinated control scheme • Results• Conclusions-future work
Image Source: MR, “GRIDCON iTAP, The system solution for voltage regulated distribution transformers,” Tech. Rep., 2012
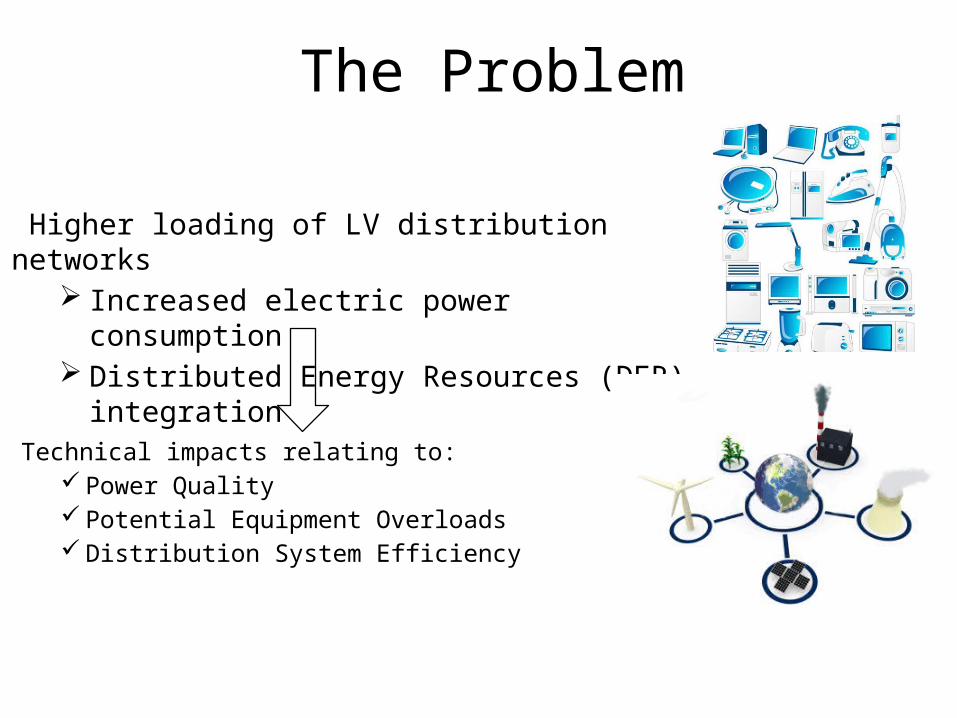
The Problem
Higher loading of LV distribution networks Increased electric power consumption Distributed Energy Resources (DER) integration
Technical impacts relating to: Power Quality Potential Equipment Overloads Distribution System Efficiency
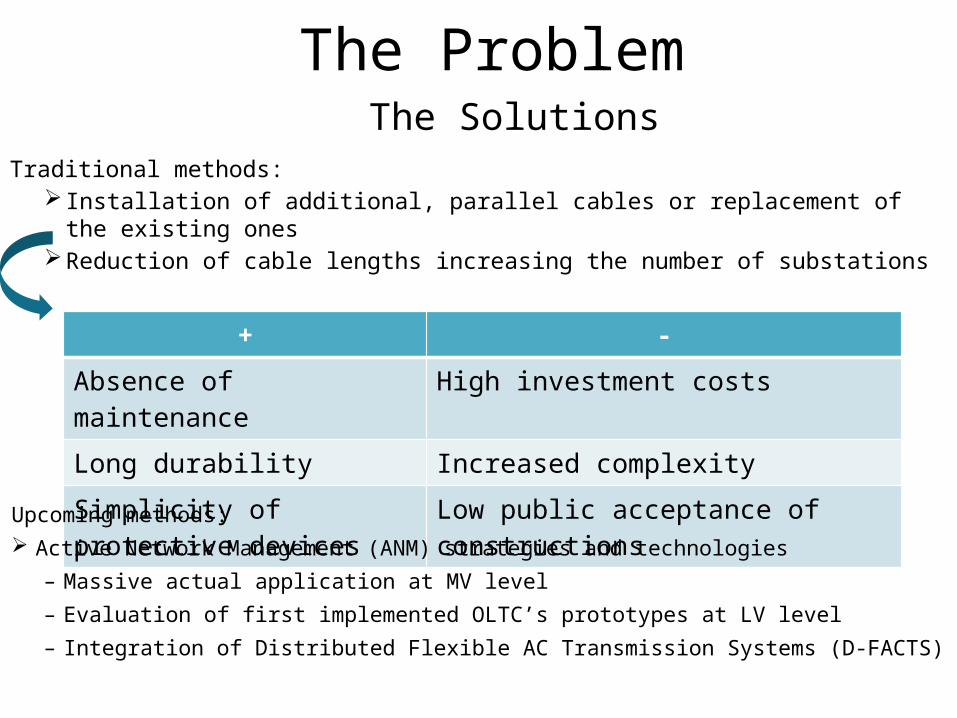
The ProblemThe Solutions
Traditional methods: Installation of additional, parallel cables or replacement of the existing ones Reduction of cable lengths increasing the number of substations
+ -Absence of maintenance High investment costsLong durability Increased complexitySimplicity of protective devices Low public acceptance of constructions
Upcoming methods: Active Network Management (ANM) strategies and technologies
– Massive actual application at MV level– Evaluation of first implemented OLTC’s prototypes at LV level– Integration of Distributed Flexible AC Transmission Systems (D-FACTS)
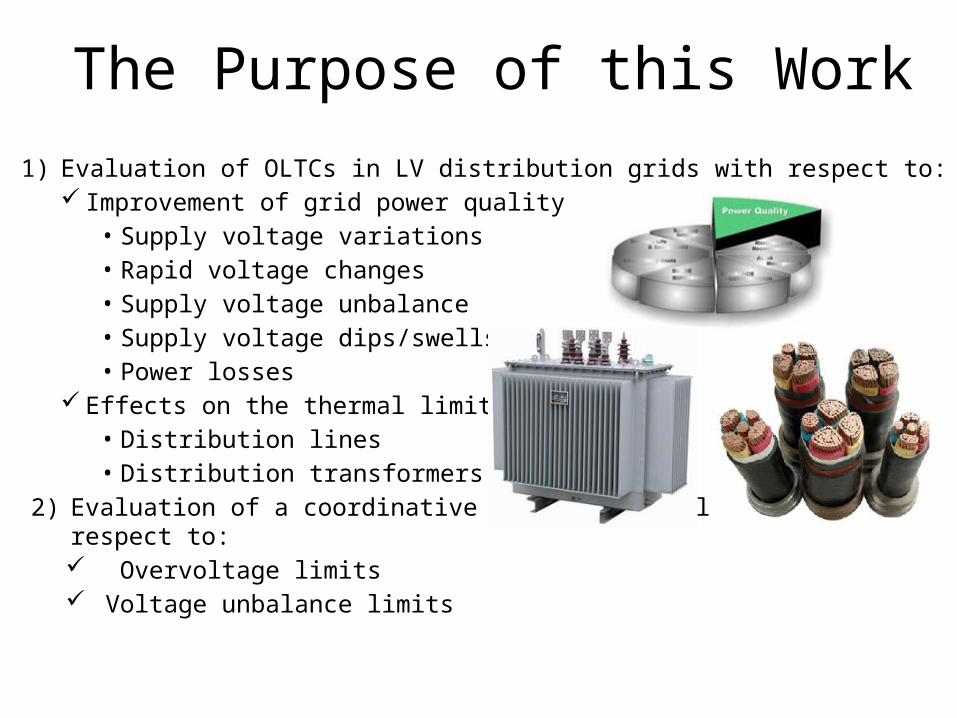
The Purpose of this Work
1) Evaluation of OLTCs in LV distribution grids with respect to: Improvement of grid power quality
• Supply voltage variations• Rapid voltage changes• Supply voltage unbalance• Supply voltage dips/swells• Power losses
Effects on the thermal limits of:• Distribution lines• Distribution transformers
2) Evaluation of a coordinative voltage control scheme with respect to: Overvoltage limits Voltage unbalance limits

OLTC Control Strategies Conventional method• Line Drop Compensation (LDC) of the Active Voltage Regulator (AVR)
Local measurement of voltage on the secondary side of the transformer (Vbus1)
Estimation of load currents (I2,I3,I4) and line impedances (Z2,Z3,Z4)
+ Straightforward method+ Low investment cost+ Low complexity‒ Difficulties of current prediction‒ Low reliability
OLTC Control Strategies
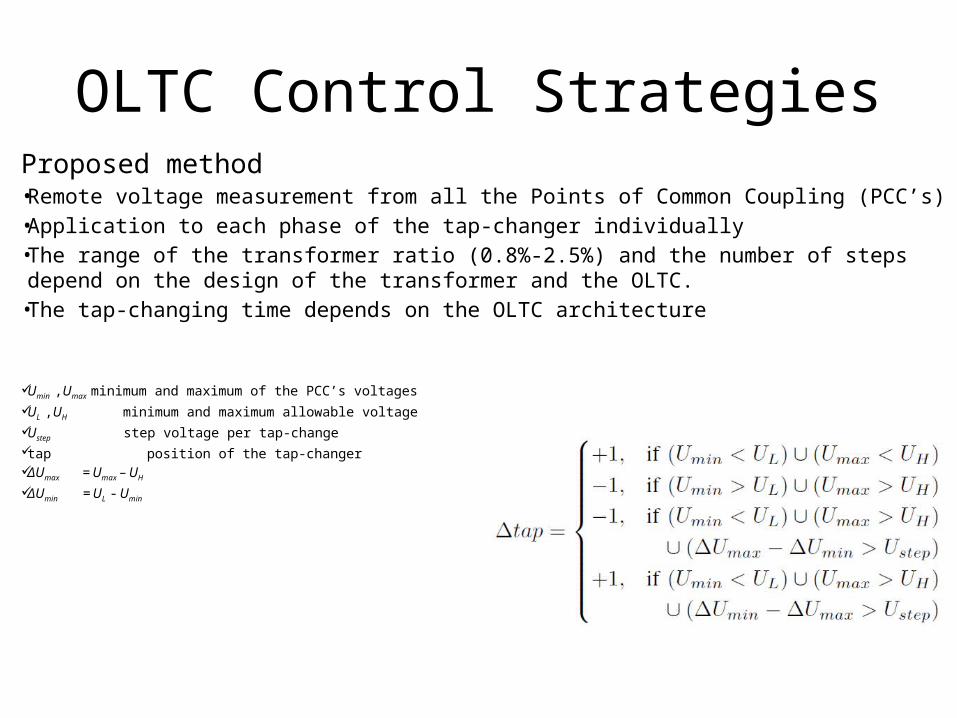
Proposed method• Remote voltage measurement from all the Points of Common Coupling (PCC’s)• Application to each phase of the tap-changer individually• The range of the transformer ratio (0.8%-2.5%) and the number of steps depend on the
design of the transformer and the OLTC.• The tap-changing time depends on the OLTC architecture
Umin ,Umax minimum and maximum of the PCC’s voltages UL ,UΗ minimum and maximum allowable voltage Ustep step voltage per tap-change tap position of the tap-changer ΔUmax = Umax – UΗ ΔUmin = UL - Umin

8
Technical Impacts on LV GridsPower quality issuesA. Customer voltage rise/drop EN-50160 requirements:
– 10 minutes mean r.m.s voltage within the statutory limits 230 V +10%/-10% (253 V; 207 V) at least during 95% of the week
– 10 minutes mean r.m.s voltage within the statutory limits 230 V +10%/-15% (253 V; 195,5 V) during 100% of the week
Voltage drop due to: Higher loading, large voltage drop over long distribution lines in radial
networks. Voltage rise due to: High DER penetration levels in radial networks, return current flowing
through the neutral conductor in unbalanced four-wire LV networks.
9
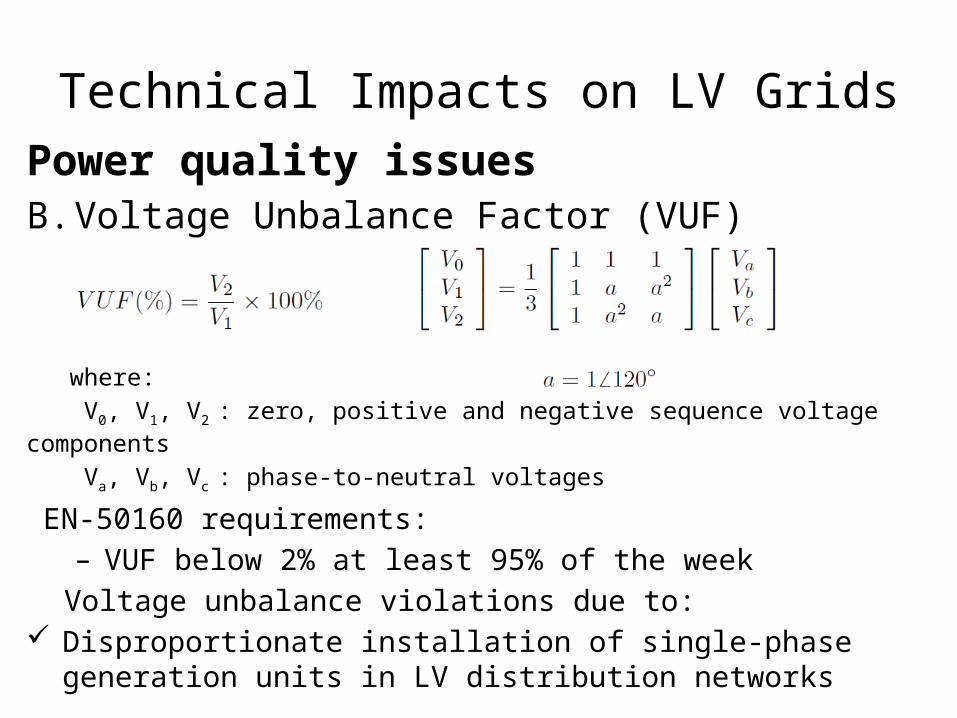
Technical Impacts on LV GridsPower quality issuesB. Voltage Unbalance Factor (VUF)
where: V0, V1, V2 : zero, positive and negative sequence voltage components
Va, Vb, Vc : phase-to-neutral voltages
EN-50160 requirements:– VUF below 2% at least 95% of the week
Voltage unbalance violations due to: Disproportionate installation of single-phase generation units in LV
distribution networks
10
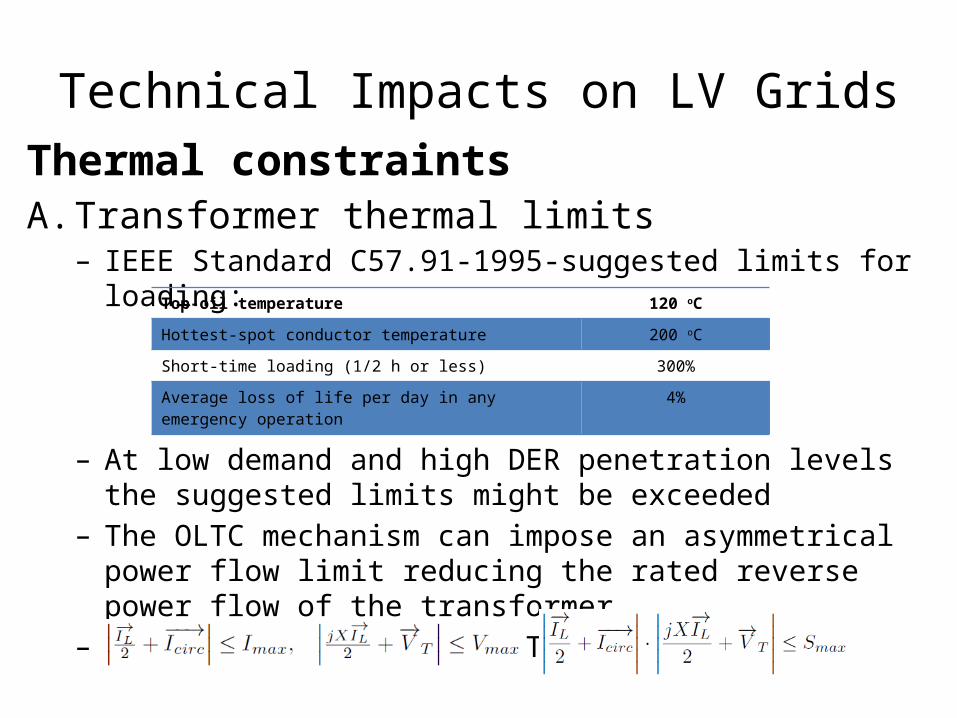
Technical Impacts on LV GridsThermal constraintsA. Transformer thermal limits
– IEEE Standard C57.91-1995-suggested limits for loading:
– At low demand and high DER penetration levels the suggested limits might be exceeded
– The OLTC mechanism can impose an asymmetrical power flow limit reducing the rated reverse power flow of the transformer
– IEEE Standard C57.131-OLTC constraints:
Top-oil temperature 120 oC
Hottest-spot conductor temperature 200 oC
Short-time loading (1/2 h or less) 300%
Average loss of life per day in any emergency operation 4%
11
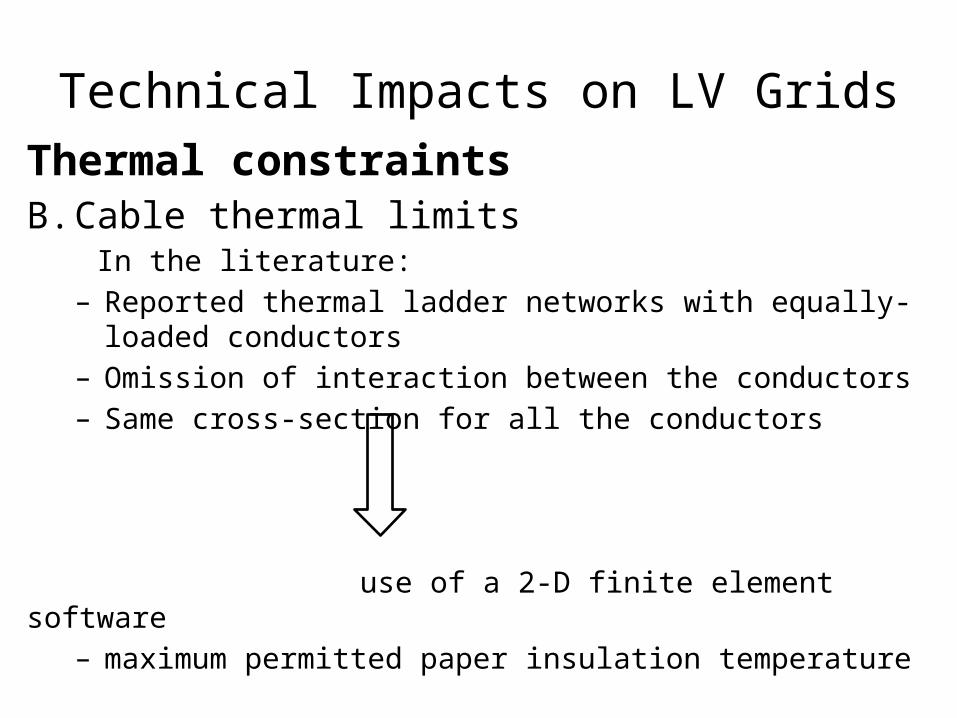
Technical Impacts on LV GridsThermal constraintsB. Cable thermal limits In the literature:
– Reported thermal ladder networks with equally-loaded conductors– Omission of interaction between the conductors– Same cross-section for all the conductors
use of a 2-D finite element software
– maximum permitted paper insulation temperature
12
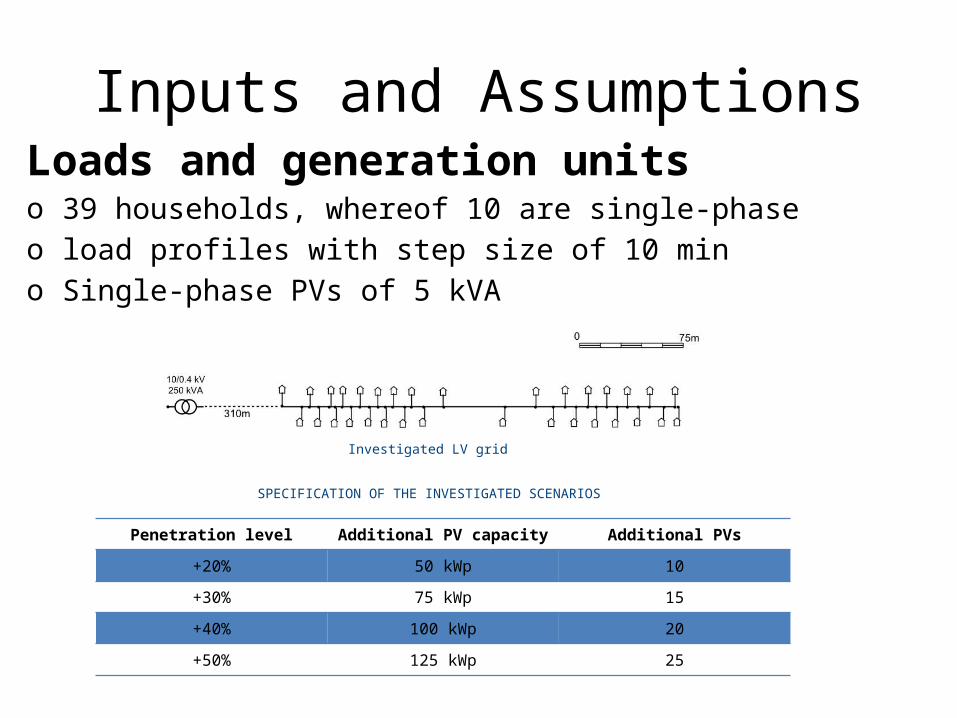
Inputs and AssumptionsLoads and generation unitso 39 households, whereof 10 are single-phaseo load profiles with step size of 10 mino Single-phase PVs of 5 kVA
Investigated LV grid
Penetration level Additional PV capacity Additional PVs
+20% 50 kWp 10
+30% 75 kWp 15
+40% 100 kWp 20
+50% 125 kWp 25
SPECIFICATION OF THE INVESTIGATED SCENARIOS
13
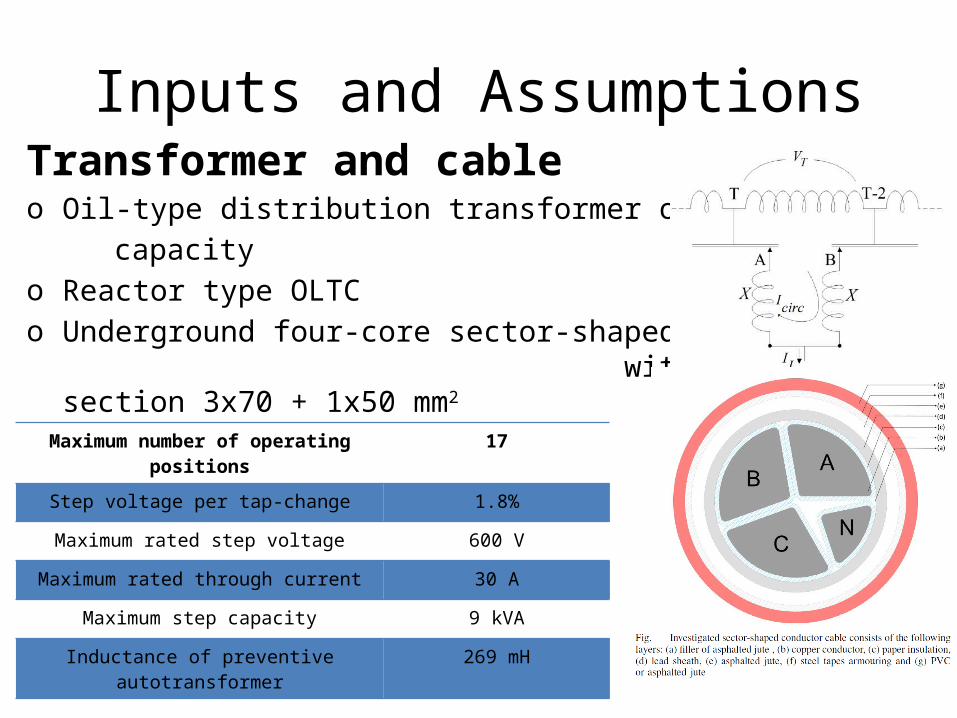
Inputs and AssumptionsTransformer and cableo Oil-type distribution transformer of 250 kVA capacityo Reactor type OLTCo Underground four-core sector-shaped conductor
with cross-section 3x70 + 1x50 mm2
Maximum number of operating positions 17
Step voltage per tap-change 1.8%
Maximum rated step voltage 600 V
Maximum rated through current 30 A
Maximum step capacity 9 kVA
Inductance of preventive autotransformer 269 mH

14
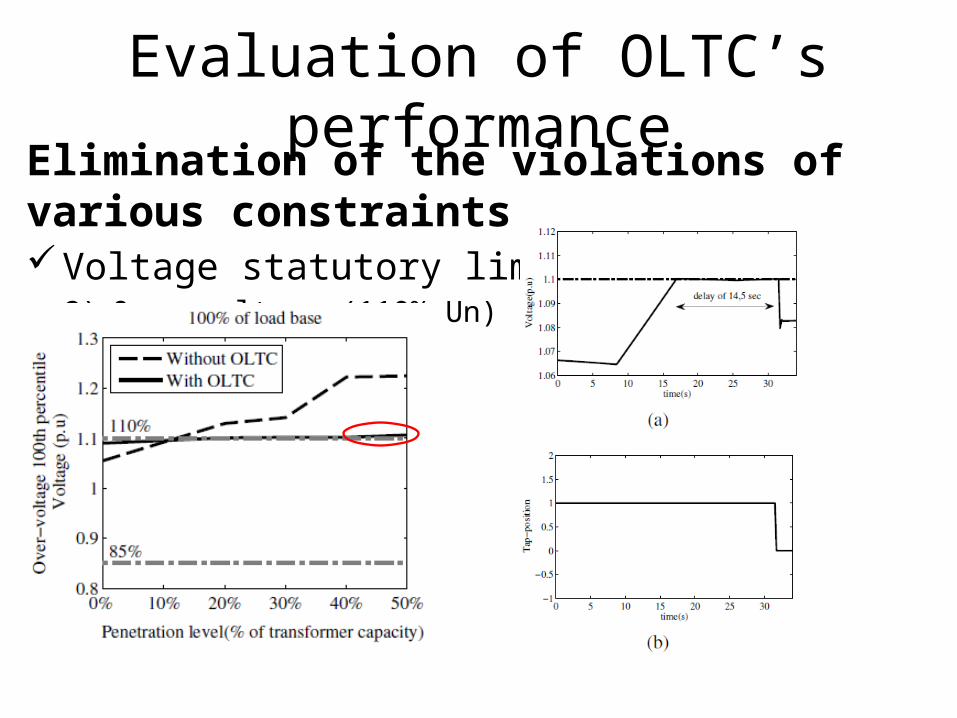
Evaluation of OLTC’s performanceElimination of the violations of various constraintsVoltage statutory limits:
1) Under-voltage (85% Un, 90% Un)
15
Evaluation of OLTC’s performanceElimination of the violations of various constraintsVoltage statutory limits:
2) Over-voltage (110% Un)
16
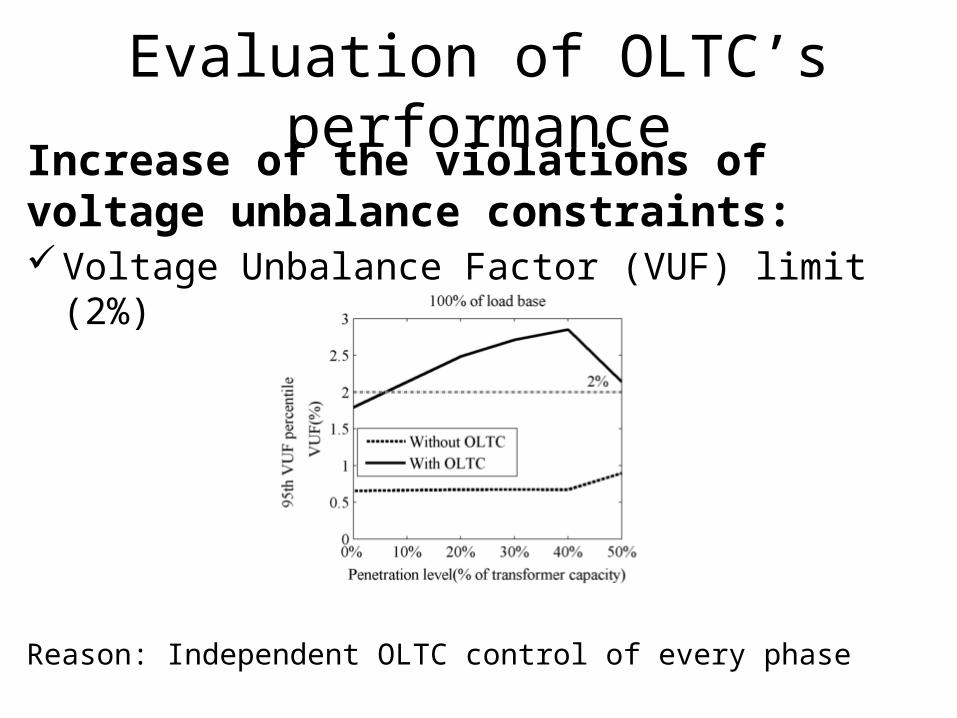
Evaluation of OLTC’s performanceIncrease of the violations of voltage unbalance constraints:Voltage Unbalance Factor (VUF) limit (2%)
Reason: Independent OLTC control of every phase
17
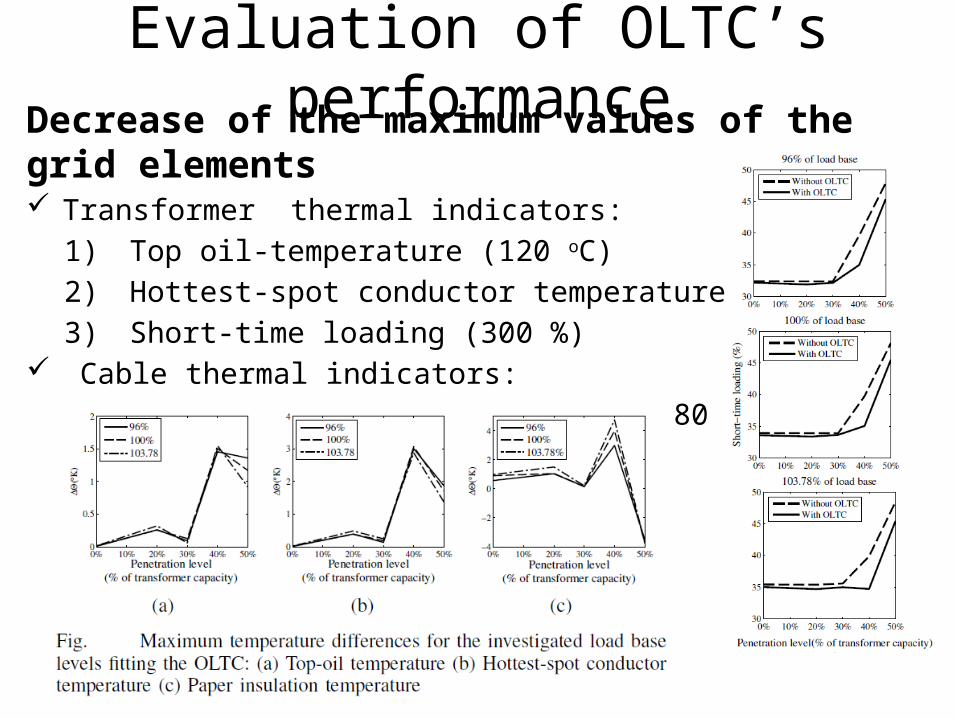
Evaluation of OLTC’s performanceDecrease of the maximum values of the grid elements Transformer thermal indicators:
1) Top oil-temperature (120 oC)2) Hottest-spot conductor temperature (200 oC)3) Short-time loading (300 %)
Cable thermal indicators:1) Paper insulation temperature (80 oC)
18
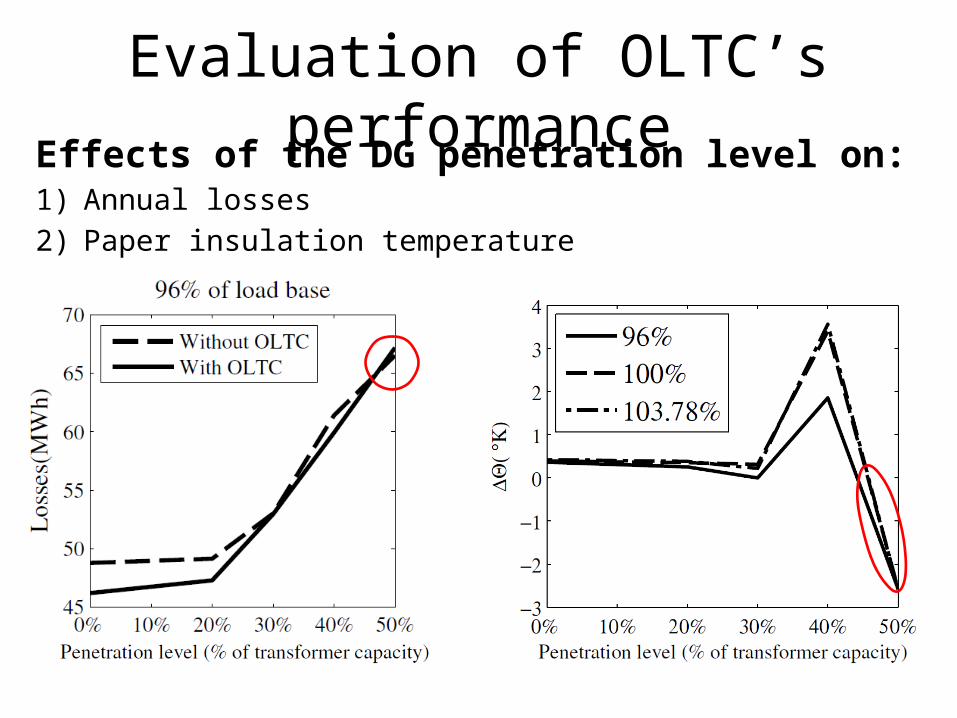
Evaluation of OLTC’s performanceEffects of the DG penetration level on: 1) Annual losses 2) Paper insulation temperature

19
Evaluation of OLTC’s performanceOLTC parameters

20
Evaluation of OLTC’s performanceConclusions Partly improvement of the over-voltage and under-voltage indicators Deterioration of voltage unbalances in the grid Decrease of annual network losses and paper insulation temperature of
the cables Distinct drop of both the temperature indicators and the maximum short-
time loading of the transformer
Next step Combination of the proposed voltage control algorithm with additional
ANM technologies
Efkarpidis N., González de Miguel C., Wijnhoven T., Van Dommelen D., De Rybel T., Driesen J. 2013. Technical Assessment of On-Load Tap-Changers in Flemish LV Distribution Grids. In Solar Integration Workshop. London, 21-22 October 2013 (London) , pp. 94-101
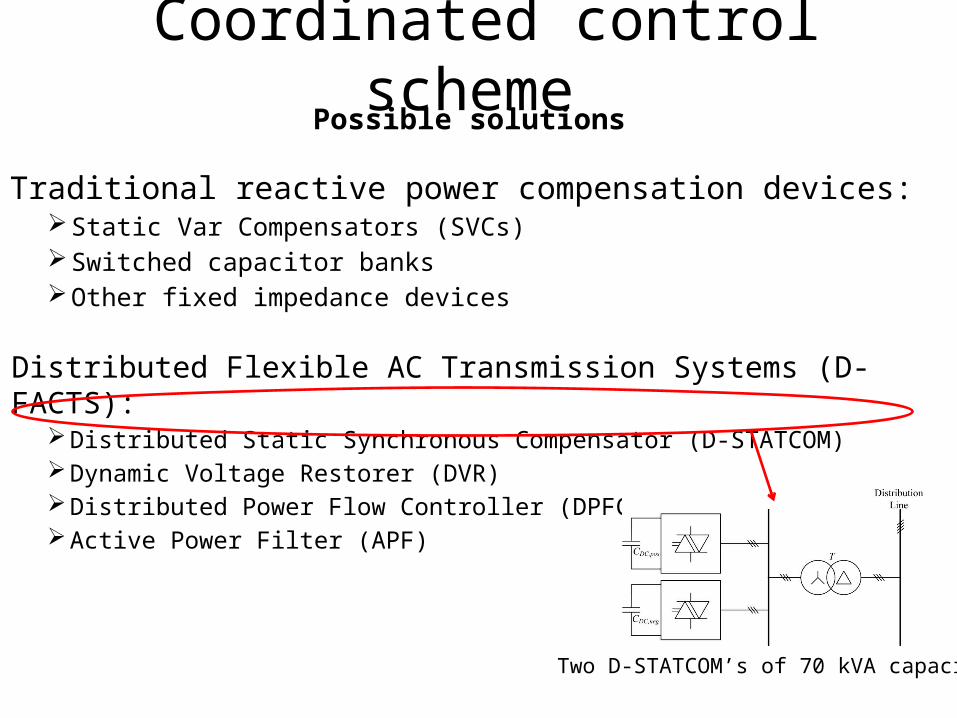
Coordinated control scheme Possible solutions
Traditional reactive power compensation devices: Static Var Compensators (SVCs) Switched capacitor banks Other fixed impedance devices
Distributed Flexible AC Transmission Systems (D-FACTS): Distributed Static Synchronous Compensator (D-STATCOM) Dynamic Voltage Restorer (DVR) Distributed Power Flow Controller (DPFC) Active Power Filter (APF)
Two D-STATCOM’s of 70 kVA capacity
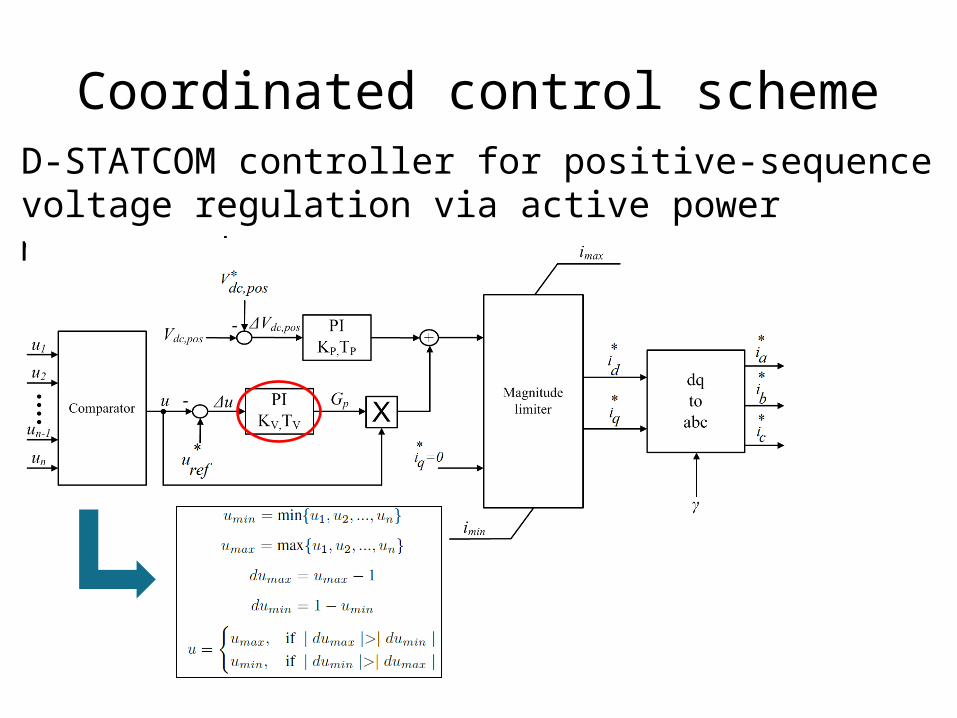
Coordinated control schemeD-STATCOM controller for positive-sequence voltage regulation via active power management
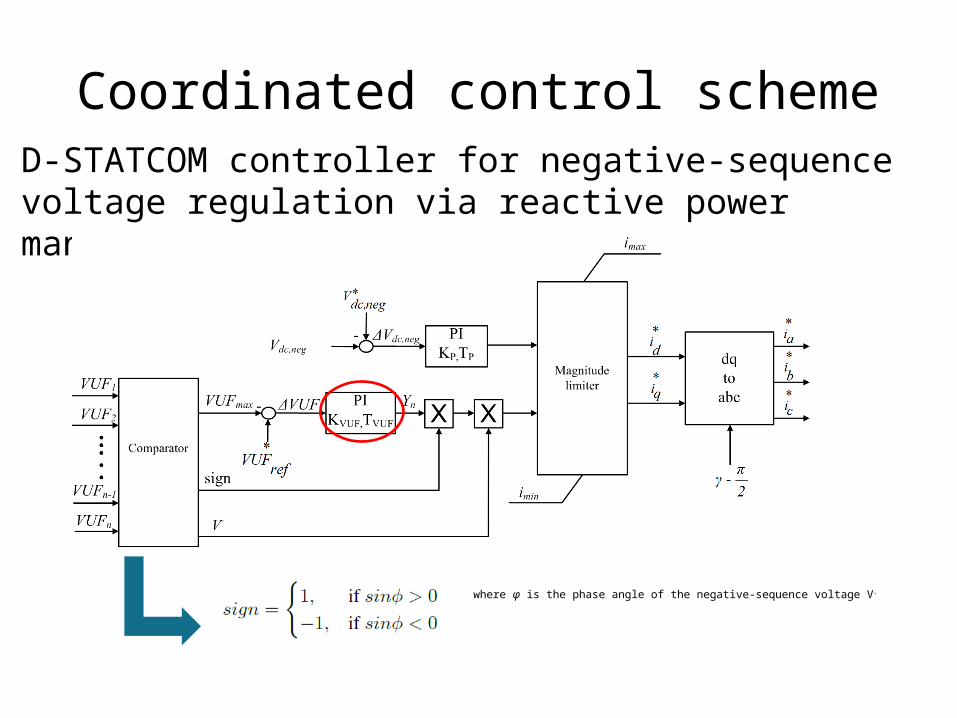
Coordinated control schemeD-STATCOM controller for negative-sequence voltage regulation via reactive power management
where φ is the phase angle of the negative-sequence voltage V-
24
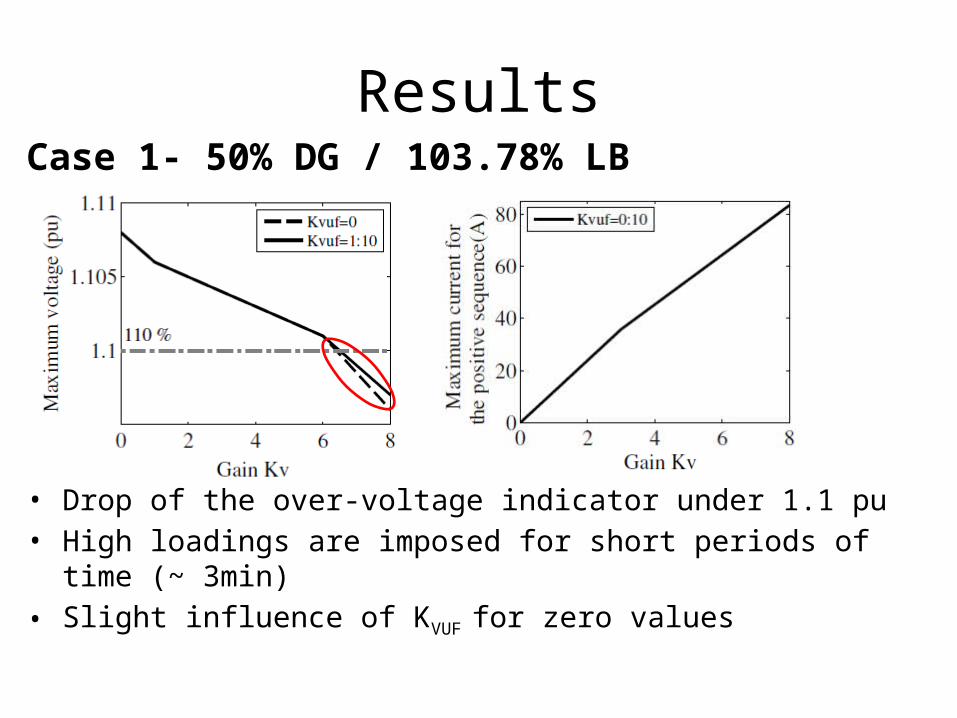
ResultsCase 1- 50% DG / 103.78% LB
• Drop of the over-voltage indicator under 1.1 pu• High loadings are imposed for short periods of time (~ 3min)• Slight influence of KVUF for zero values
25
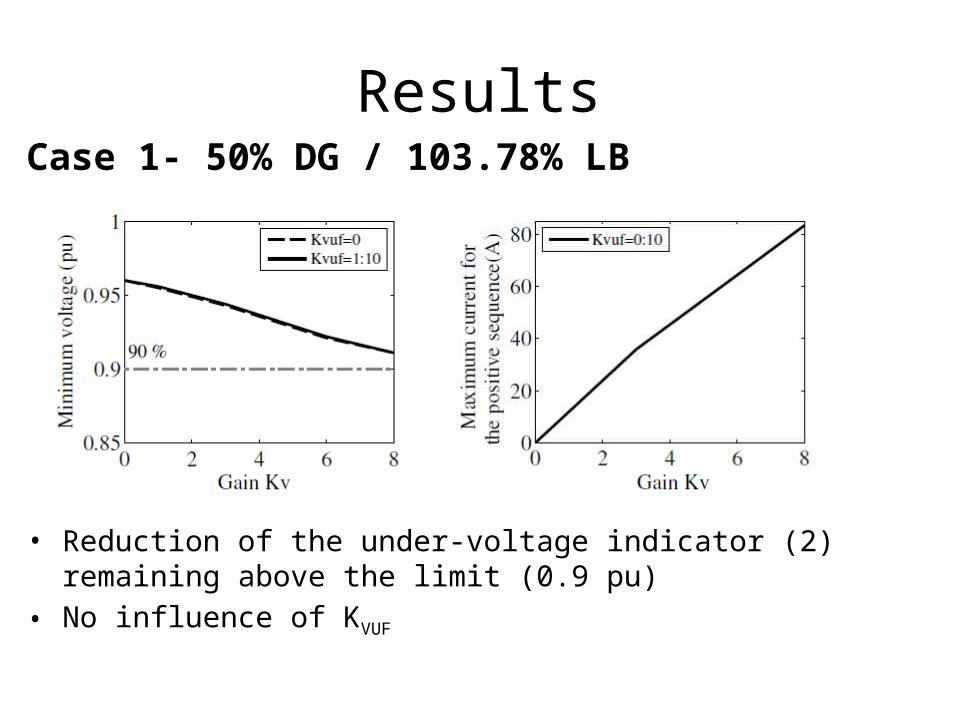
ResultsCase 1- 50% DG / 103.78% LB
• Reduction of the under-voltage indicator (2) remaining above the limit (0.9 pu)
• No influence of KVUF
26
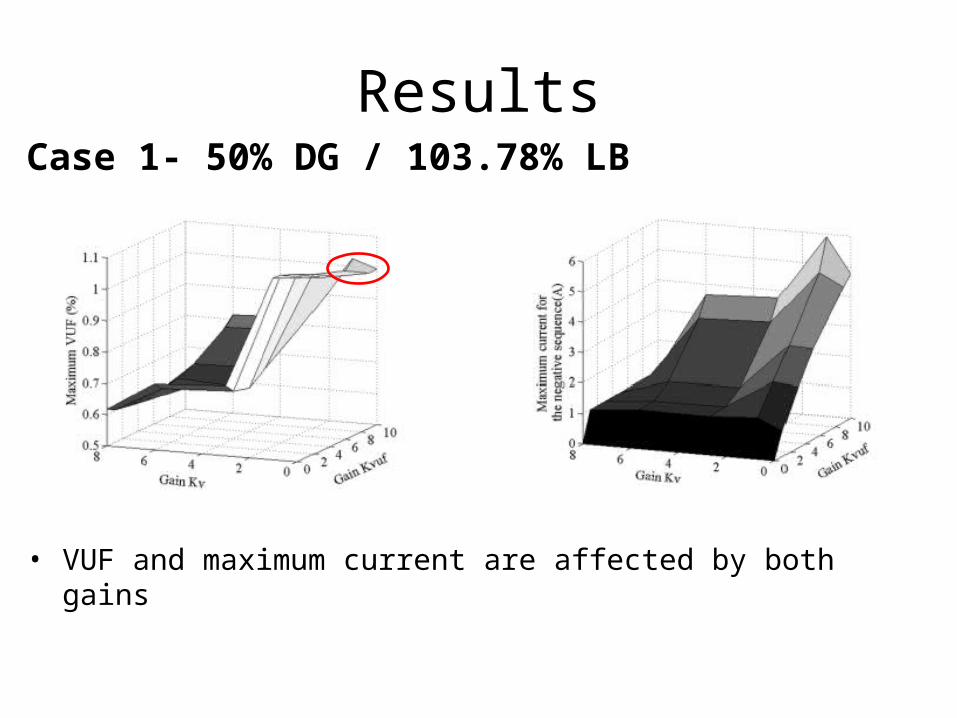
ResultsCase 1- 50% DG / 103.78% LB
• VUF and maximum current are affected by both gains
27
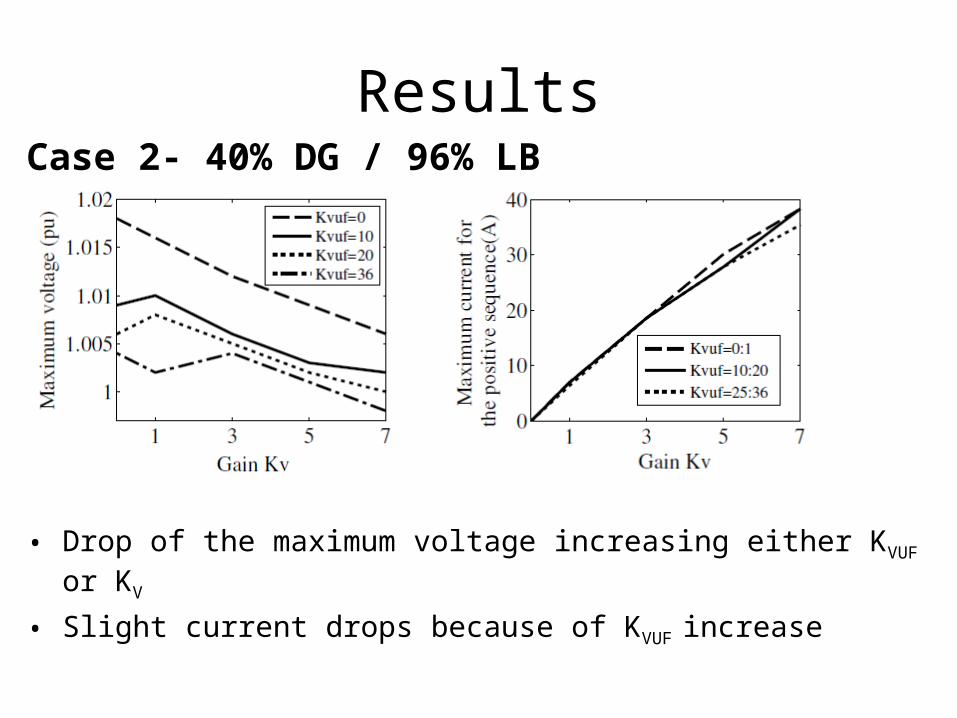
ResultsCase 2- 40% DG / 96% LB
• Drop of the maximum voltage increasing either KVUF or KV
• Slight current drops because of KVUF increase
28
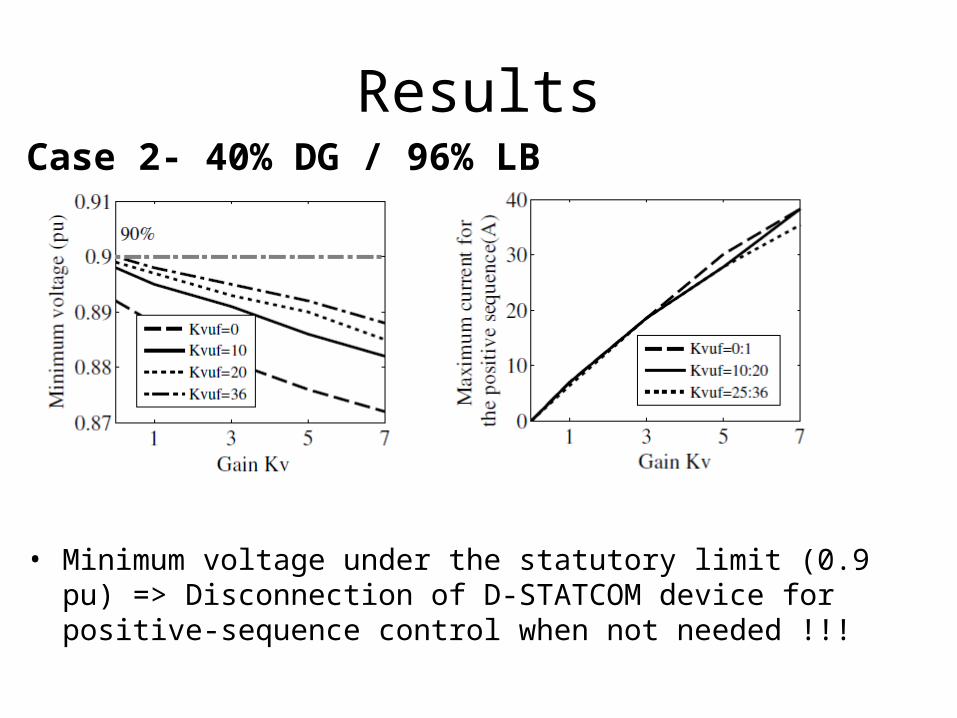
ResultsCase 2- 40% DG / 96% LB
• Minimum voltage under the statutory limit (0.9 pu) => Disconnection of D-STATCOM device for positive-sequence control when not needed !!!
29
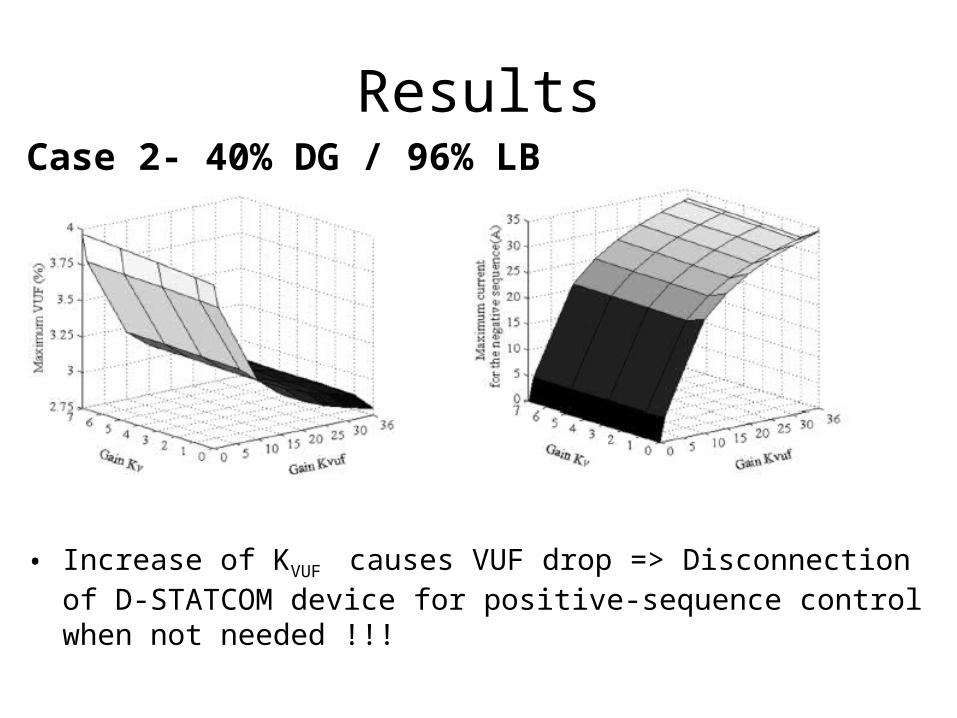
ResultsCase 2- 40% DG / 96% LB
• Increase of KVUF causes VUF drop => Disconnection of D-STATCOM device for positive-sequence control when not needed !!!
30
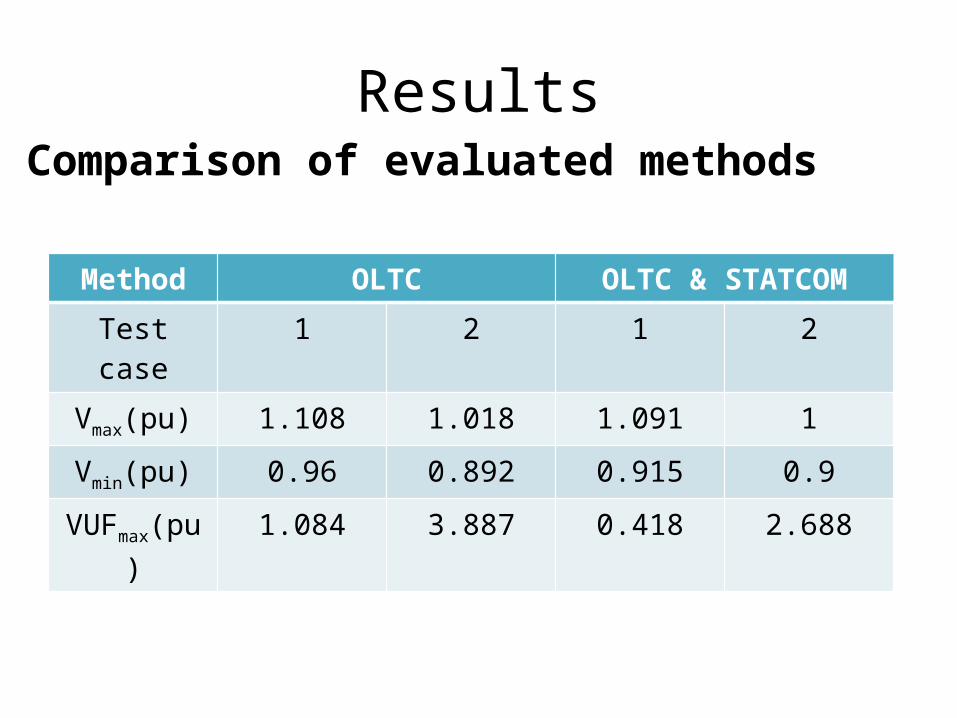
ResultsComparison of evaluated methods
Method OLTC OLTC & STATCOMTest case 1 2 1 2Vmax(pu) 1.108 1.018 1.091 1Vmin(pu) 0.96 0.892 0.915 0.9
VUFmax(pu) 1.084 3.887 0.418 2.688
31
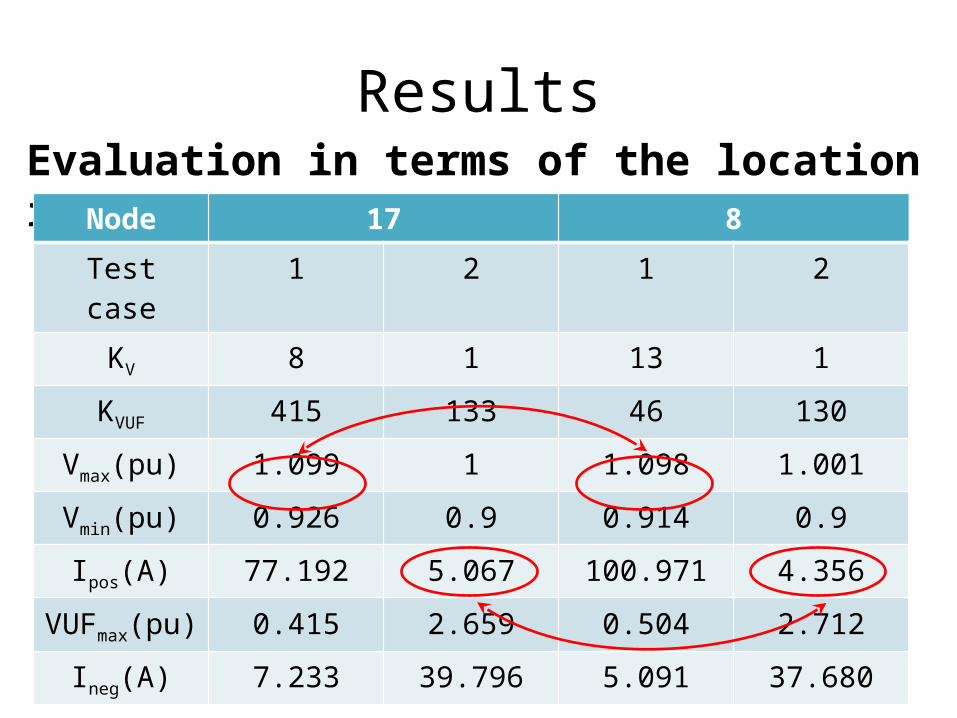
ResultsEvaluation in terms of the location in the grid
Node 17 8Test case 1 2 1 2
KV 8 1 13 1KVUF 415 133 46 130
Vmax(pu) 1.099 1 1.098 1.001Vmin(pu) 0.926 0.9 0.914 0.9Ipos(A) 77.192 5.067 100.971 4.356
VUFmax(pu) 0.415 2.659 0.504 2.712Ineg(A) 7.233 39.796 5.091 37.680
32
Conclusions-future workConclusions Partly improvement of overvoltage indicators and deterioration of voltage
unbalances with independent tap-changing control per phase Full remediation of the violations of the voltage indicators via active
power management Considerable reduction of voltage unbalances via reactive power
management
Future work Combination of the proposed voltage control algorithm with additional
ANM technologies
Efkarpidis N., Wijnhoven T., González de Miguel C., De Rybel T., Driesen J. 2014. Coordinated voltage control scheme for Flemish LV distribution grids utilizing OLTC transformers and D-STATCOM’s. In DPSP-IET Events. , Copenhagen 2014, pp. 1-6

Thank you for your attentionQuestions ??