author of customer and corporate profitability -...
TRANSCRIPT
Driving ROI with Measurements that Matter
Jim Lenskold / Ron EnsAuthor of Marketing ROI, The Path to Campaign, Customer and Corporate Profitability
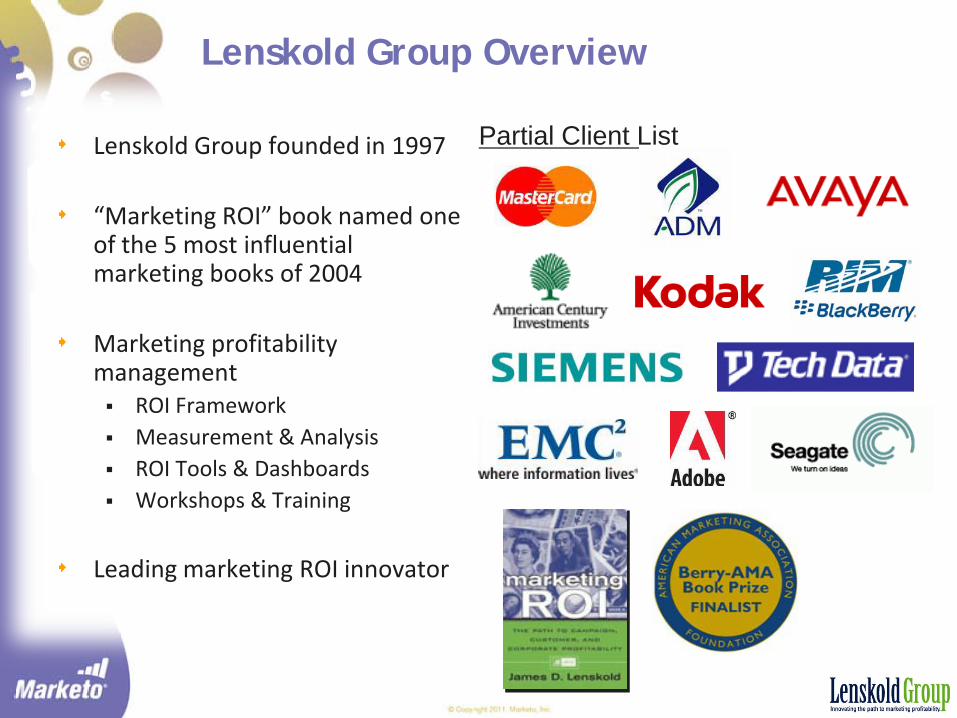
Lenskold Group Overview
Lenskold Group founded in 1997
“Marketing ROI” book named one of the 5 most influential marketing books of 2004
Marketing profitability management ROI Framework Measurement & Analysis ROI Tools & Dashboards Workshops & Training
Leading marketing ROI innovator
Partial Client List
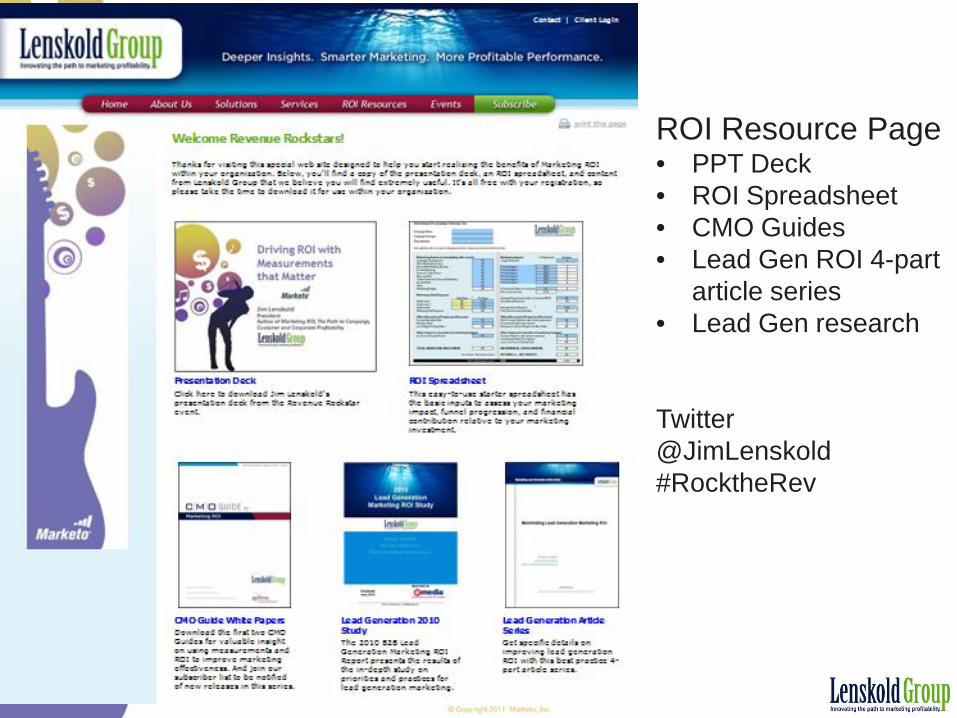
ROI Resource Page• PPT Deck• ROI Spreadsheet• CMO Guides• Lead Gen ROI 4-part
article series• Lead Gen research
Twitter@JimLenskold#RocktheRev
12%
20%
15%
9%
44%
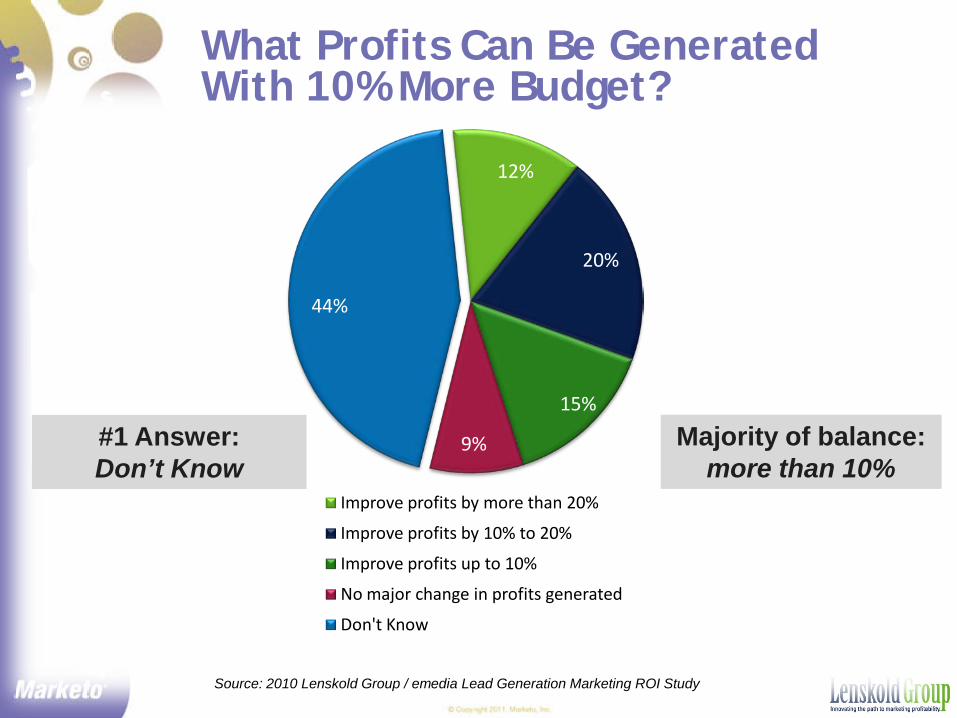
Improve profits by more than 20%
Improve profits by 10% to 20%
Improve profits up to 10%
No major change in profits generated
Don't Know
What Profits Can Be Generated With 10% More Budget?
#1 Answer:Don’t Know
Majority of balance: more than 10%
Source: 2010 Lenskold Group / emedia Lead Generation Marketing ROI Study
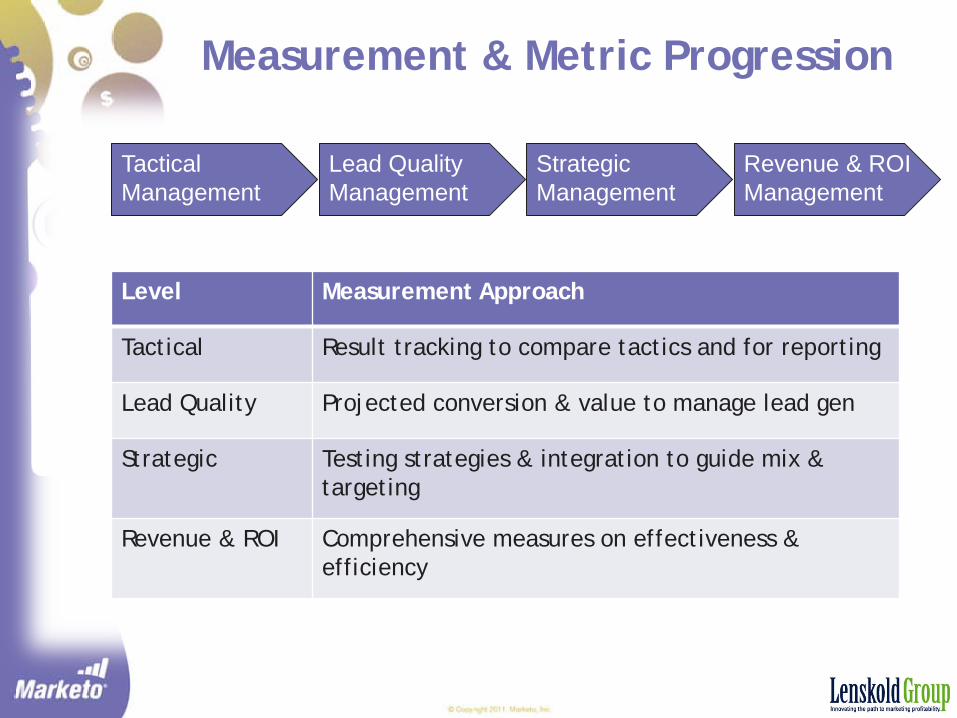
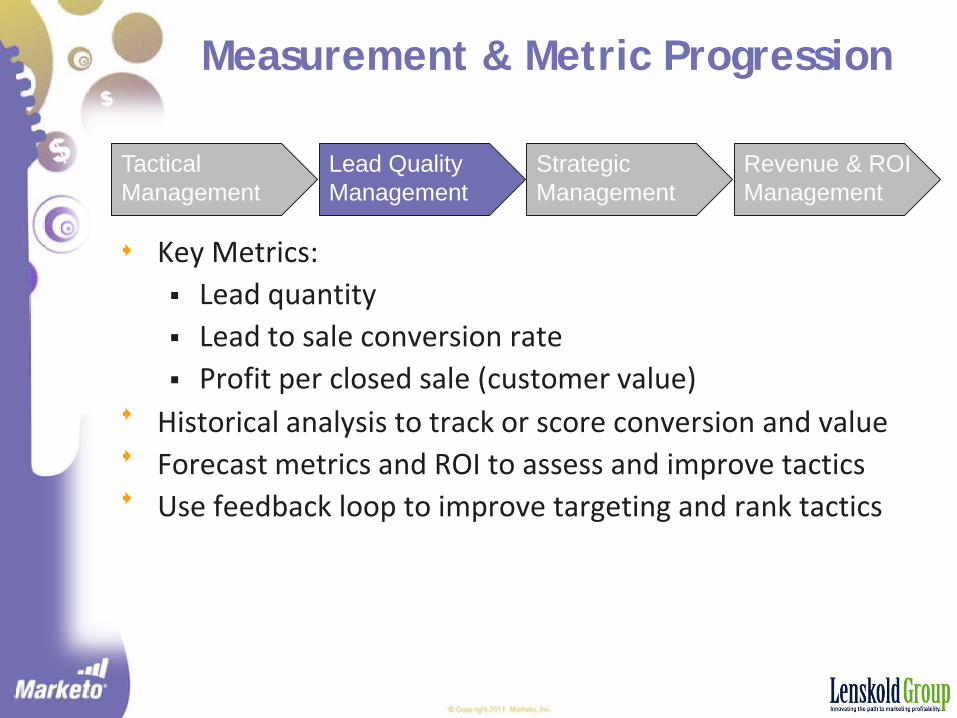
Measurement & Metric Progression
TacticalManagement
Lead Quality Management
StrategicManagement
Revenue & ROI Management
Level Measurement Approach
Tactical Result tracking to compare tactics and for reporting
Lead Quality Projected conversion & value to manage lead gen
Strategic Testing strategies & integration to guide mix & targeting
Revenue & ROI Comprehensive measures on effectiveness & efficiency
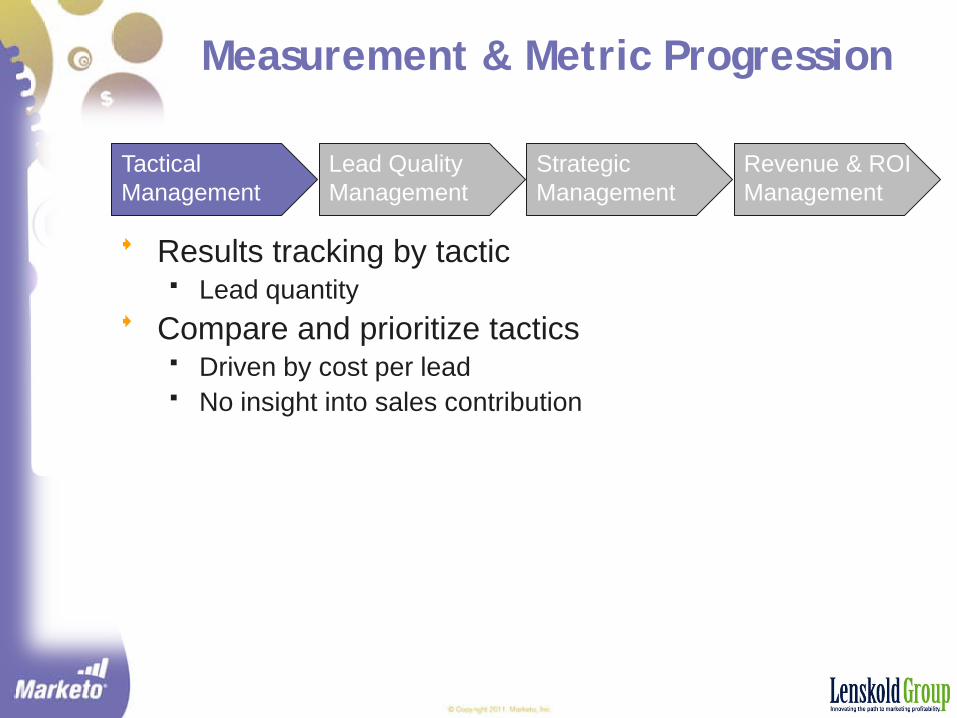
Measurement & Metric Progression
Results tracking by tactic Lead quantity
Compare and prioritize tactics Driven by cost per lead No insight into sales contribution
TacticalManagement
Lead Quality Management
StrategicManagement
Revenue & ROI Management
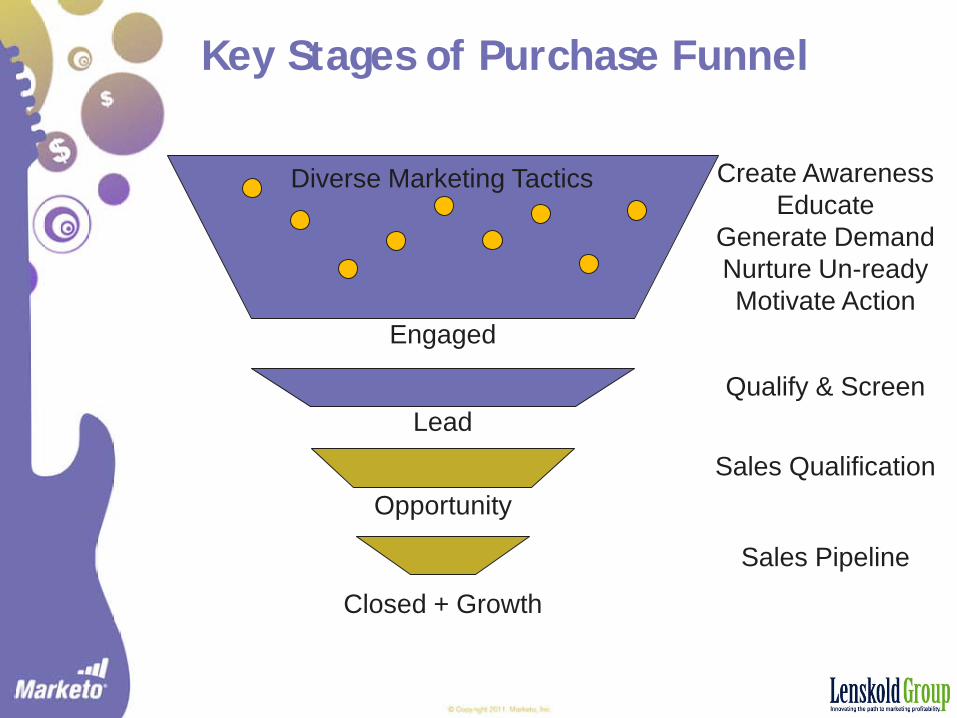
Key Stages of Purchase Funnel
Qualify & Screen
Create AwarenessEducate
Generate DemandNurture Un-readyMotivate Action
Sales Qualification
Sales Pipeline
Diverse Marketing Tactics
Engaged
Lead
Opportunity
Closed + Growth
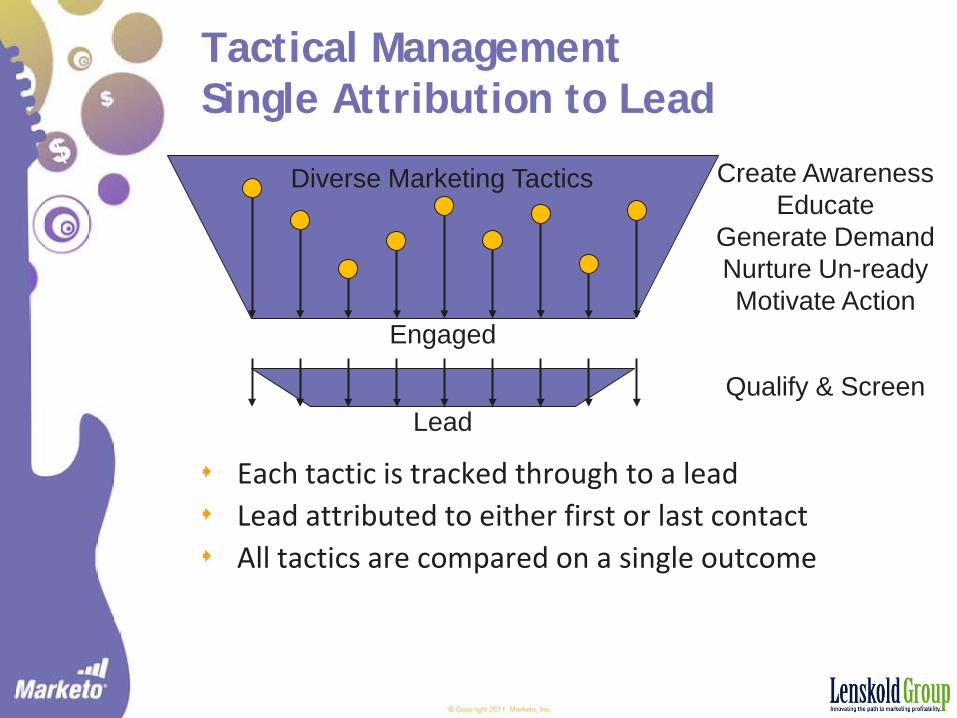
Tactical ManagementSingle Attribution to Lead
Each tactic is tracked through to a leadLead attributed to either first or last contactAll tactics are compared on a single outcome
Qualify & Screen
Create AwarenessEducate
Generate DemandNurture Un-readyMotivate Action
Diverse Marketing Tactics
Engaged
Lead
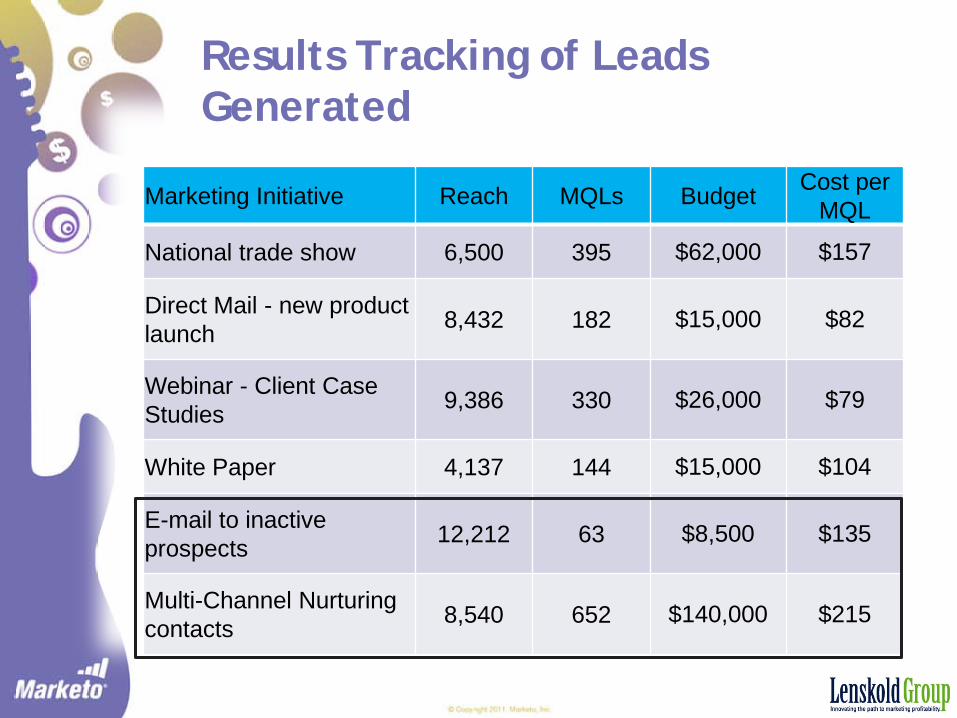
Results Tracking of Leads Generated
Marketing Initiative Reach MQLs Budget Cost per MQL
National trade show 6,500 395 $62,000 $157
Direct Mail - new product launch 8,432 182 $15,000 $82
Webinar - Client Case Studies 9,386 330 $26,000 $79
White Paper 4,137 144 $15,000 $104
E-mail to inactive prospects 12,212 63 $8,500 $135
Multi-Channel Nurturing contacts 8,540 652 $140,000 $215
Measurement & Metric Progression
Key Metrics: Lead quantity Lead to sale conversion rate Profit per closed sale (customer value)
Historical analysis to track or score conversion and valueForecast metrics and ROI to assess and improve tacticsUse feedback loop to improve targeting and rank tactics
TacticalManagement
Lead Quality Management
StrategicManagement
Revenue & ROI Management
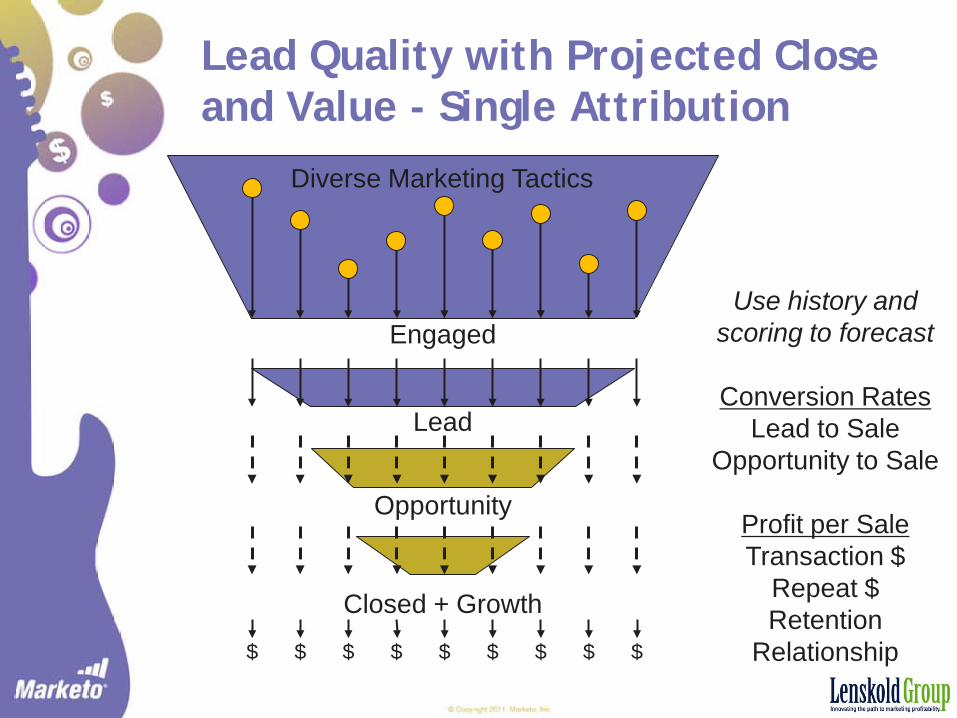
Diverse Marketing Tactics
Lead Quality with Projected Close and Value - Single Attribution
Engaged
Lead
Opportunity
Closed + Growth
$ $$ $ $ $$ $ $
Use history and scoring to forecast
Conversion RatesLead to Sale
Opportunity to Sale
Profit per SaleTransaction $
Repeat $Retention
Relationship
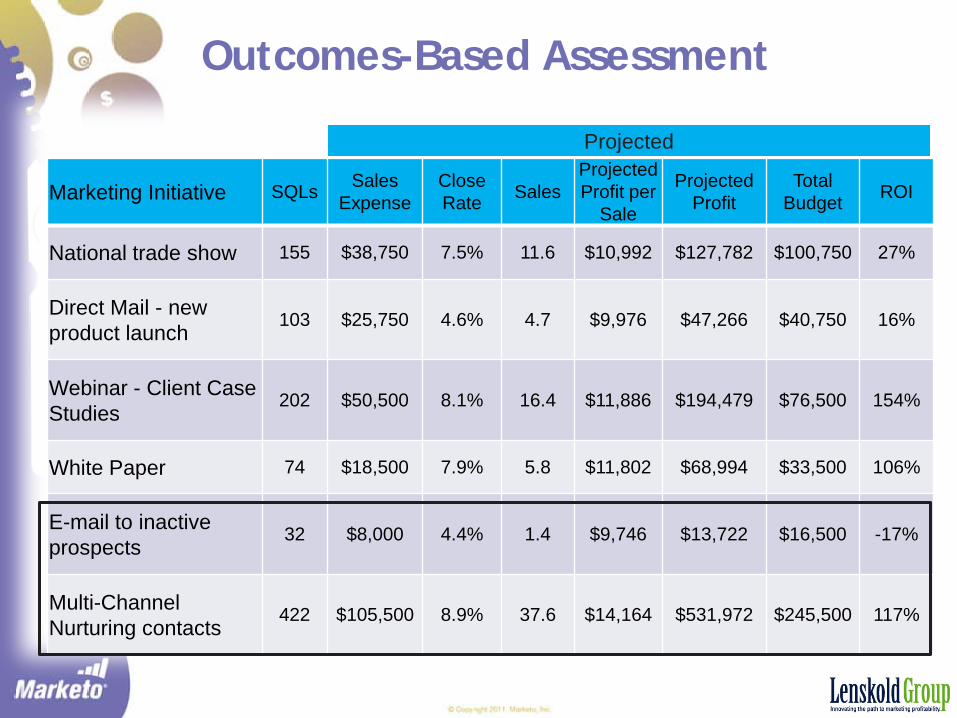
Outcomes-Based Assessment
Marketing Initiative SQLs Sales Expense
Close Rate Sales
Projected Profit per
Sale
Projected Profit
Total Budget ROI
National trade show 155 $38,750 7.5% 11.6 $10,992 $127,782 $100,750 27%
Direct Mail - new product launch
103 $25,750 4.6% 4.7 $9,976 $47,266 $40,750 16%
Webinar - Client Case Studies
202 $50,500 8.1% 16.4 $11,886 $194,479 $76,500 154%
White Paper 74 $18,500 7.9% 5.8 $11,802 $68,994 $33,500 106%
E-mail to inactive prospects
32 $8,000 4.4% 1.4 $9,746 $13,722 $16,500 -17%
Multi-Channel Nurturing contacts
422 $105,500 8.9% 37.6 $14,164 $531,972 $245,500 117%
Projected
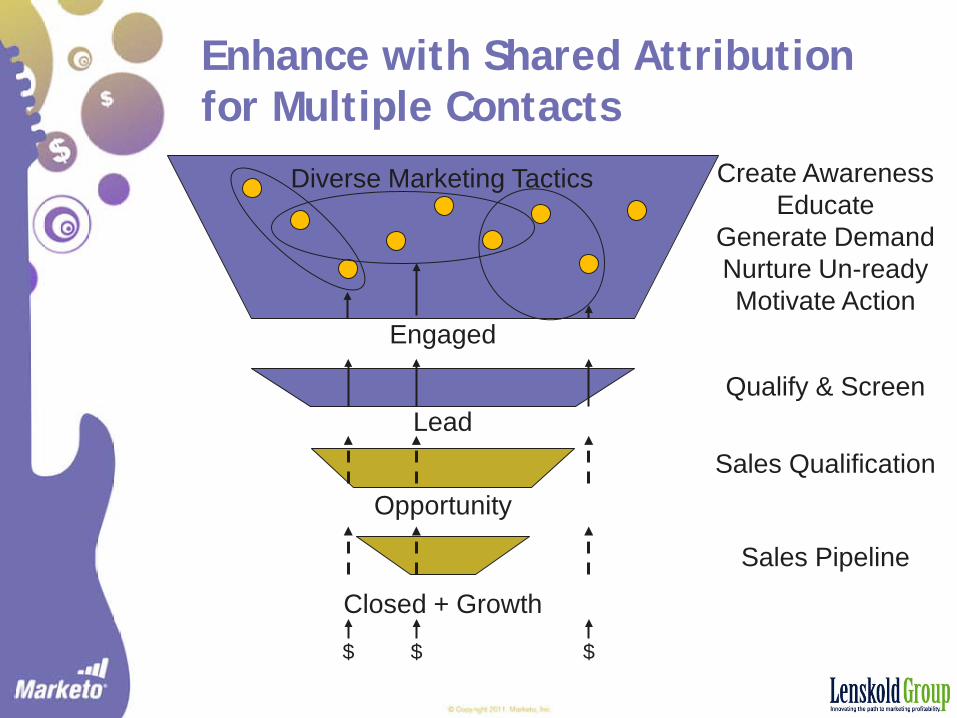
Enhance with Shared Attribution for Multiple Contacts
Qualify & Screen
Create AwarenessEducate
Generate DemandNurture Un-readyMotivate Action
Sales Qualification
Sales Pipeline
Diverse Marketing Tactics
Engaged
Lead
Opportunity
Closed + Growth
$ $$
Shared Attribution Tied to Lead Quality Adds Insight
Approaches for Distributing Contribution Split across contacts Split across responses and interactions
Identify hidden contributorsRisk of crediting low impact touch pointsLacks insight into synergy of tactics
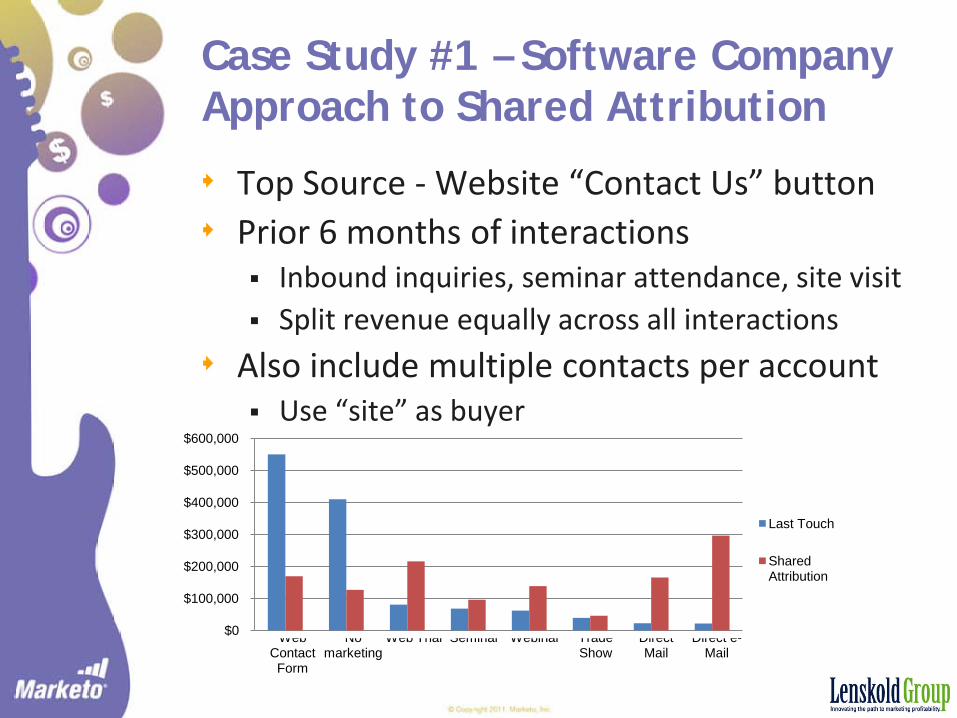
Case Study #1 – Software Company Approach to Shared Attribution
Top Source - Website “Contact Us” buttonPrior 6 months of interactions Inbound inquiries, seminar attendance, site visit Split revenue equally across all interactions
Also include multiple contacts per account Use “site” as buyer
$0
$100,000
$200,000
$300,000
$400,000
$500,000
$600,000
Web Contact Form
No marketing
Web Trial Seminar Webinar Trade Show
Direct Mail
Direct e-Mail
Last Touch
$0
$100,000
$200,000
$300,000
$400,000
$500,000
$600,000
Last Touch
Shared Attribution
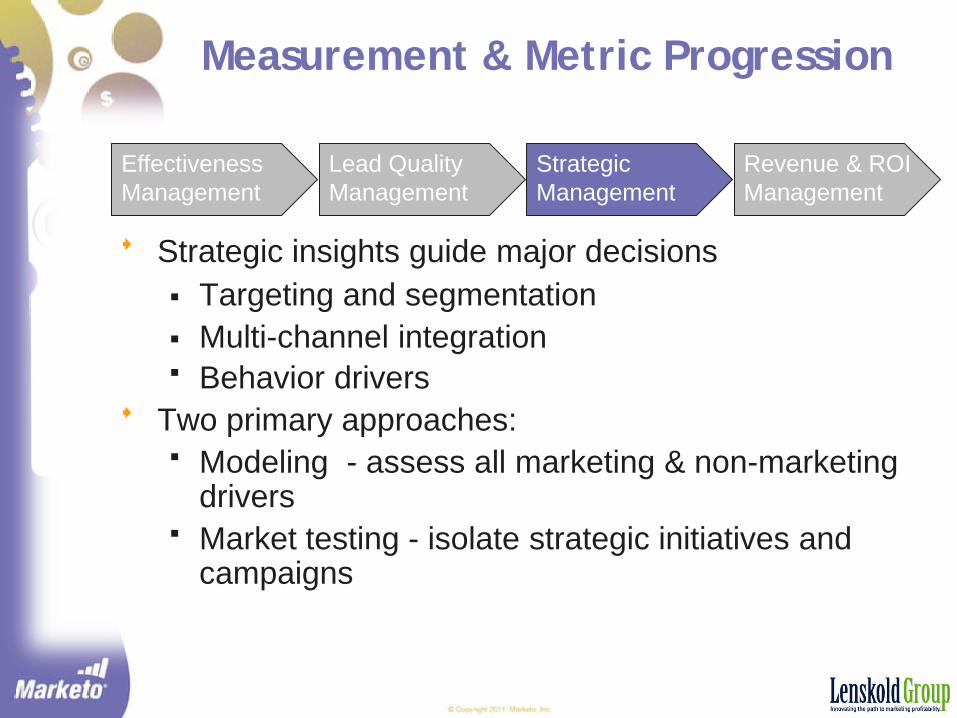
Measurement & Metric Progression
Strategic insights guide major decisions Targeting and segmentation Multi-channel integration Behavior drivers
Two primary approaches: Modeling - assess all marketing & non-marketing
drivers Market testing - isolate strategic initiatives and
campaigns
EffectivenessManagement
Lead Quality Management
StrategicManagement
Revenue & ROI Management
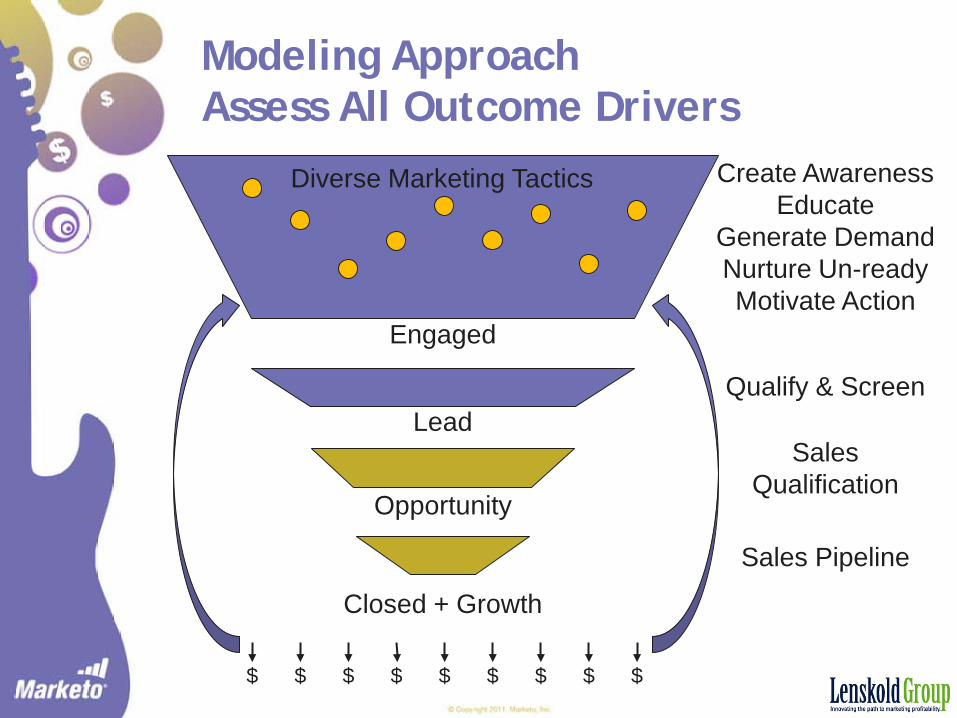
Modeling Approach Assess All Outcome Drivers
Qualify & Screen
Create AwarenessEducate
Generate DemandNurture Un-readyMotivate Action
Sales Qualification
Sales Pipeline
$ $$ $ $ $$ $ $
Engaged
Lead
Opportunity
Closed + Growth
Diverse Marketing Tactics
0
500
1000
1500
2000
2500
1 2 3 4 5 6 7 8 9 10 11 12
Out
com
e U
nits
Time Period
Total
0
500
1000
1500
2000
2500
1 2 3 4 5 6 7 8 9 10 11 12
Out
com
e U
nits
Time Period
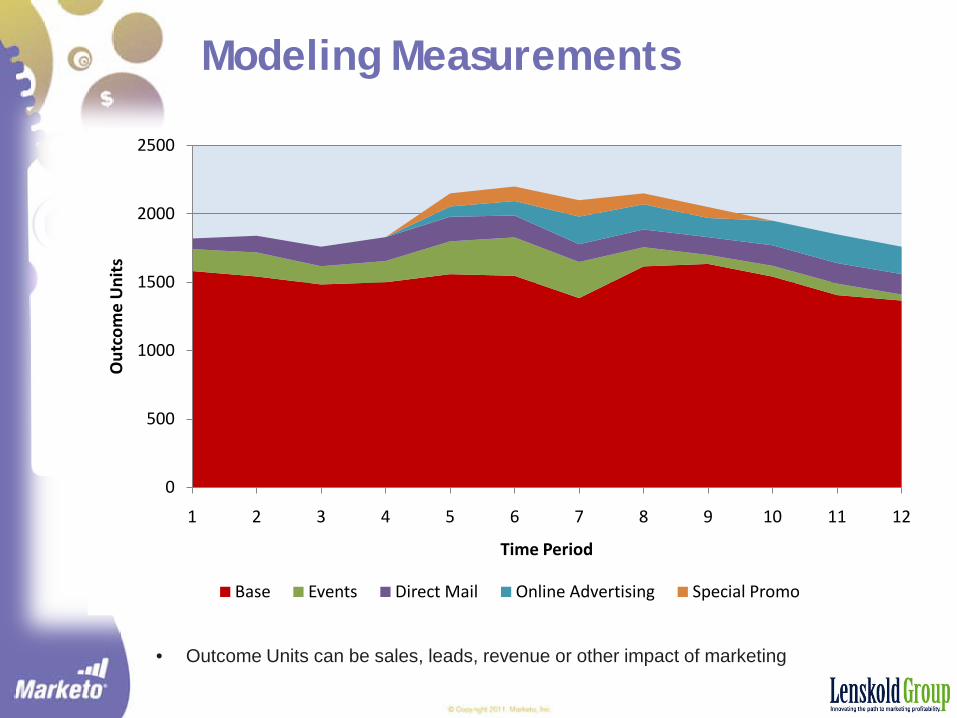
Base Events Direct Mail Online Advertising Special Promo
Modeling Measurements
• Outcome Units can be sales, leads, revenue or other impact of marketing
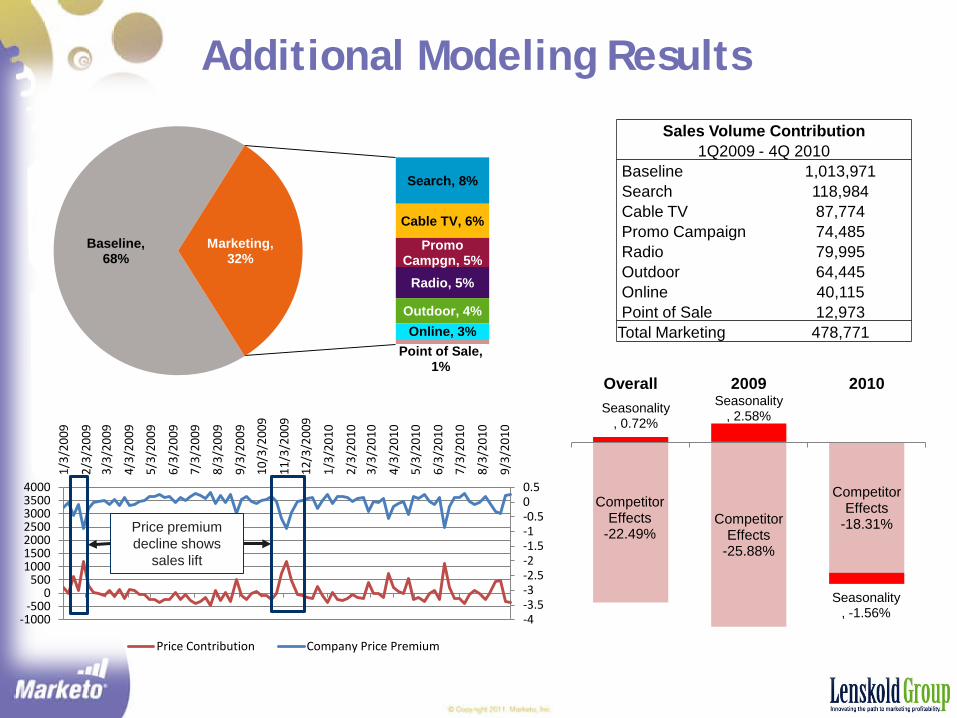
Additional Modeling Results
-4-3.5-3-2.5-2-1.5-1-0.500.5
-1000-500
0500
1000150020002500300035004000
1/3/
2009
2/3/
2009
3/3/
2009
4/3/
2009
5/3/
2009
6/3/
2009
7/3/
2009
8/3/
2009
9/3/
2009
10/3
/200
9
11/3
/200
9
12/3
/200
9
1/3/
2010
2/3/
2010
3/3/
2010
4/3/
2010
5/3/
2010
6/3/
2010
7/3/
2010
8/3/
2010
9/3/
2010
Price Contribution Company Price Premium
Price premium decline shows
sales lift
Baseline, 68%
Search, 8%
Cable TV, 6%
Promo Campgn, 5%
Radio, 5%
Outdoor, 4%Online, 3%
Point of Sale, 1%
Marketing, 32%
Competitor Effects
-22.49%Competitor
Effects-25.88%
Competitor Effects
-18.31%
Seasonality, 0.72%
Seasonality, 2.58%
Seasonality, -1.56%
Overall 2009 2010
Sales Volume Contribution1Q2009 - 4Q 2010
Baseline 1,013,971Search 118,984Cable TV 87,774Promo Campaign 74,485Radio 79,995Outdoor 64,445Online 40,115Point of Sale 12,973Total Marketing 478,771

0
500
1000
1500
2000
2500
1 2 3 4 5 6 7 8 9 10 11 12
Out
com
e U
nits
Time Period
Baseline Campaign
Market Test Approach -Isolate & Assess Alternatives
• Time Period can be weeks, months or quarters• Outcome Units can be sales, leads, revenue or other impact of marketing
Control group adjusted to treatment group size
Baseline includes all other marketing and non-marketing impact
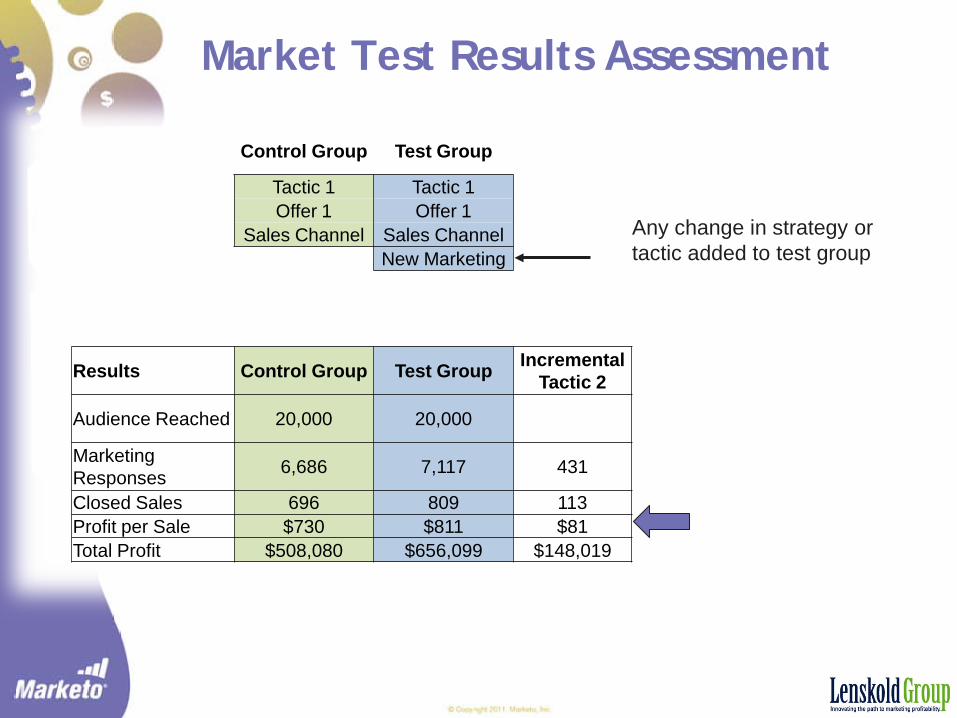
Control Group Test Group
Tactic 1 Tactic 1Offer 1 Offer 1
Sales Channel Sales ChannelNew Marketing
Market Test Results Assessment
Any change in strategy or tactic added to test group
Results Control Group Test Group Incremental Tactic 2
Audience Reached 20,000 20,000
Marketing Responses 6,686 7,117 431
Closed Sales 696 809 113Profit per Sale $730 $811 $81 Total Profit $508,080 $656,099 $148,019
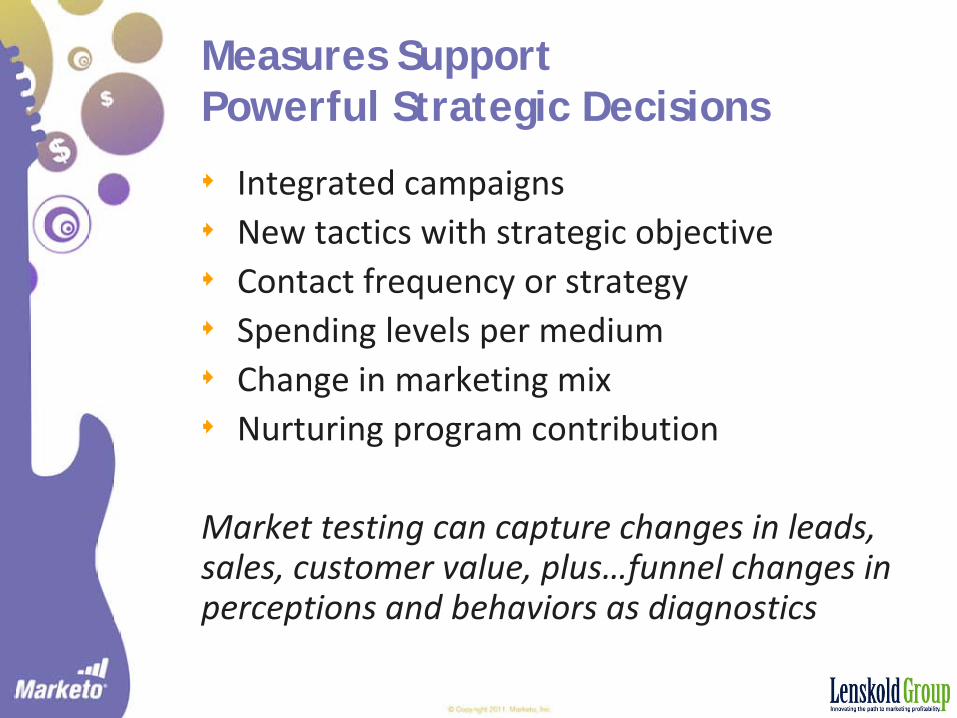
Measures SupportPowerful Strategic Decisions
Integrated campaignsNew tactics with strategic objectiveContact frequency or strategySpending levels per mediumChange in marketing mixNurturing program contribution
Market testing can capture changes in leads, sales, customer value, plus…funnel changes in perceptions and behaviors as diagnostics

Measurement & Metric Progression
ROI insights in strategic and tactical planning Optimize marketing mix, integration & spend levels Use financial scenarios to compare alternatives and
improve profit potential in planning stage
Insights to guide ROI improvement Funnel view for diagnostics Segment-level management
EffectivenessManagement
Lead Quality Management
StrategicManagement
Revenue & ROI Management
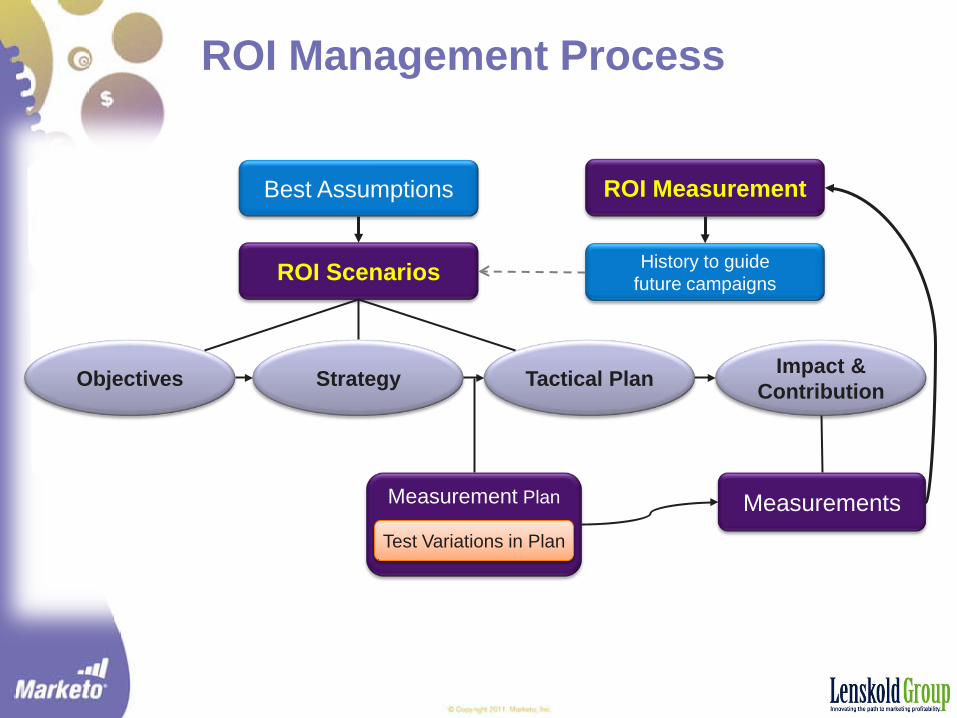
ROI Management Process
Strategy Tactical Plan
Measurement Plan Measurements
Impact & Contribution
ROI Scenarios
ROI Measurement
Test Variations in Plan
Objectives
Best Assumptions
History to guide future campaigns
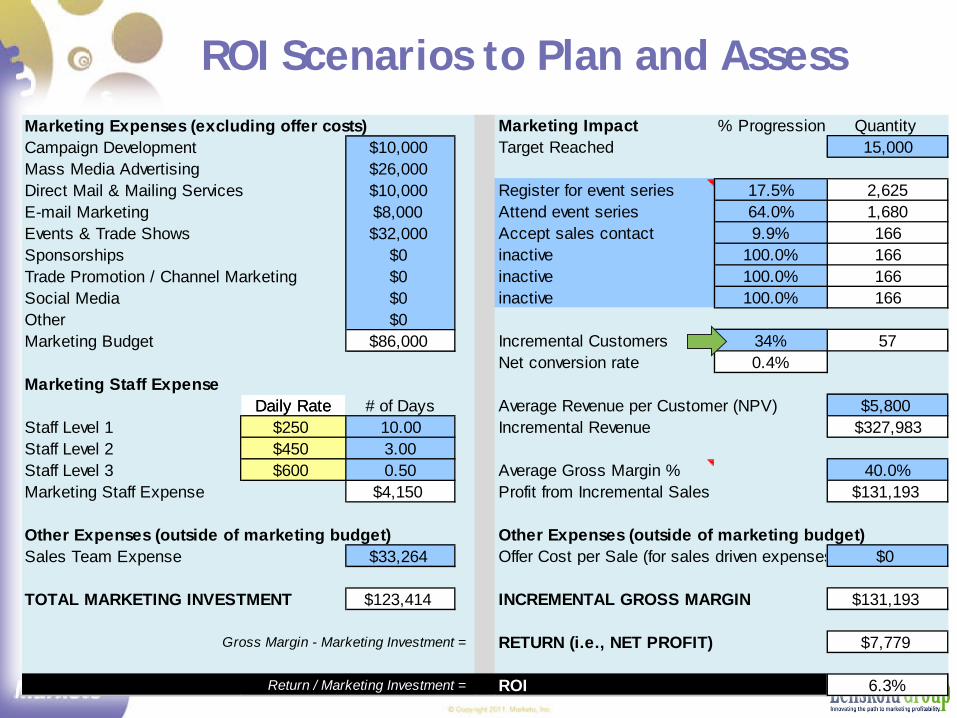
Marketing Expenses (excluding offer costs) Marketing Impact % Progression Quantity Campaign Development $10,000 Target Reached 15,000Mass Media Advertising $26,000Direct Mail & Mailing Services $10,000 Register for event series 17.5% 2,625E-mail Marketing $8,000 Attend event series 64.0% 1,680Events & Trade Shows $32,000 Accept sales contact 9.9% 166Sponsorships $0 inactive 100.0% 166Trade Promotion / Channel Marketing $0 inactive 100.0% 166Social Media $0 inactive 100.0% 166Other $0Marketing Budget $86,000 Incremental Customers 34% 57
Net conversion rate 0.4%Marketing Staff Expense
Daily Rate # of Days Average Revenue per Customer (NPV) $5,800Staff Level 1 $250 10.00 Incremental Revenue $327,983Staff Level 2 $450 3.00Staff Level 3 $600 0.50 Average Gross Margin % 40.0%Marketing Staff Expense $4,150 Profit from Incremental Sales $131,193
Other Expenses (outside of marketing budget) Other Expenses (outside of marketing budget)Sales Team Expense $33,264 Offer Cost per Sale (for sales driven expenses $0
TOTAL MARKETING INVESTMENT $123,414 INCREMENTAL GROSS MARGIN $131,193
Gross Margin - Marketing Investment = RETURN (i.e., NET PROFIT) $7,779
Return / Marketing Investment = ROI 6.3%
ROI Scenarios to Plan and AssessMarketing Expenses (excluding offer costs) Marketing Impact % Progression Quantity Campaign Development $10,000 Target Reached 15,000Mass Media Advertising $26,000Direct Mail & Mailing Services $10,000 Register for event series 17.5% 2,625E-mail Marketing $8,000 Attend event series 64.0% 1,680Events & Trade Shows $32,000 Accept sales contact 9.9% 166Sponsorships $0 inactive 100.0% 166Trade Promotion / Channel Marketing $0 inactive 100.0% 166Social Media $0 inactive 100.0% 166Other $0Marketing Budget $86,000 Incremental Customers 34% 57
Net conversion rate 0.4%Marketing Staff Expense
Marketing Expenses (excluding offer costs) Campaign Development $10,000 Mass Media Advertising $26,000Direct Mail & Mailing Services $10,000 E-mail Marketing $8,000 Events & Trade Shows $32,000 Sponsorships $0Trade Promotion / Channel Marketing $0Social Media $0Other $0Marketing Budget $86,000
Marketing Staff Expense
Daily Rate # of Days Staff Level 1 $250 10.00 Staff Level 2 $450 3.00Staff Level 3 $600 0.50 Marketing Staff Expense $4,150
Other Expenses (outside of marketing budget) Sales Team Expense $33,264
TOTAL MARKETING INVESTMENT $123,414
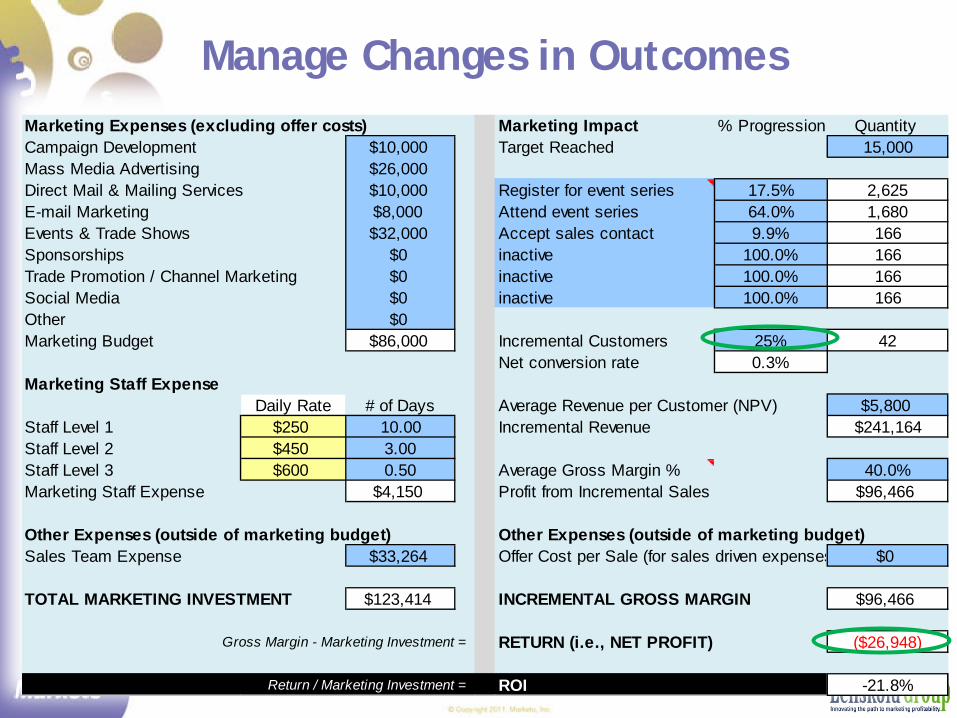
Marketing Expenses (excluding offer costs) Marketing Impact % Progression Quantity Campaign Development $10,000 Target Reached 15,000Mass Media Advertising $26,000Direct Mail & Mailing Services $10,000 Register for event series 17.5% 2,625E-mail Marketing $8,000 Attend event series 64.0% 1,680Events & Trade Shows $32,000 Accept sales contact 9.9% 166Sponsorships $0 inactive 100.0% 166Trade Promotion / Channel Marketing $0 inactive 100.0% 166Social Media $0 inactive 100.0% 166Other $0Marketing Budget $86,000 Incremental Customers 25% 42
Net conversion rate 0.3%Marketing Staff Expense
Daily Rate # of Days Average Revenue per Customer (NPV) $5,800Staff Level 1 $250 10.00 Incremental Revenue $241,164Staff Level 2 $450 3.00Staff Level 3 $600 0.50 Average Gross Margin % 40.0%Marketing Staff Expense $4,150 Profit from Incremental Sales $96,466
Other Expenses (outside of marketing budget) Other Expenses (outside of marketing budget)Sales Team Expense $33,264 Offer Cost per Sale (for sales driven expenses $0
TOTAL MARKETING INVESTMENT $123,414 INCREMENTAL GROSS MARGIN $96,466
Gross Margin - Marketing Investment = RETURN (i.e., NET PROFIT) ($26,948)
Return / Marketing Investment = ROI -21.8%
Manage Changes in Outcomes
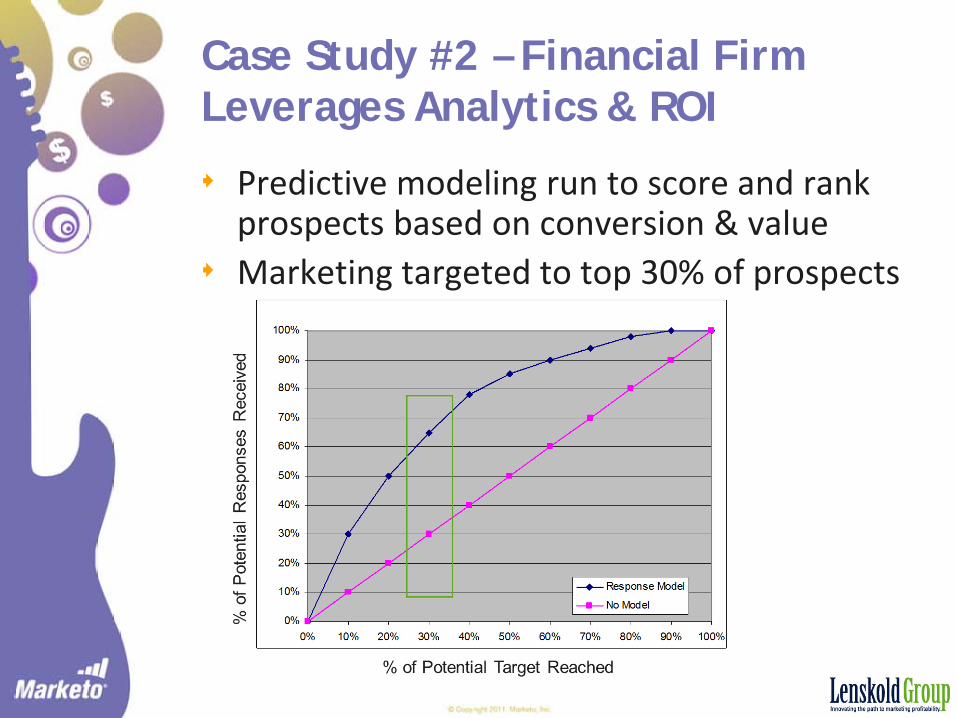
Case Study #2 – Financial Firm Leverages Analytics & ROI
Predictive modeling run to score and rank prospects based on conversion & valueMarketing targeted to top 30% of prospects
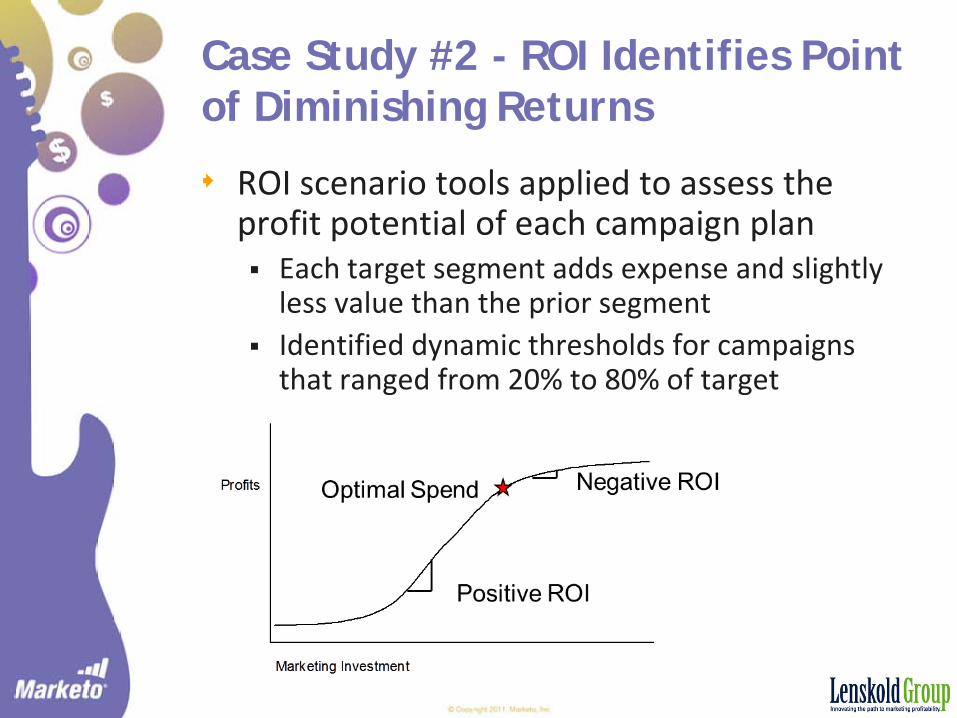
Case Study #2 - ROI Identifies Point of Diminishing Returns
ROI scenario tools applied to assess the profit potential of each campaign plan Each target segment adds expense and slightly
less value than the prior segment Identified dynamic thresholds for campaigns
that ranged from 20% to 80% of target
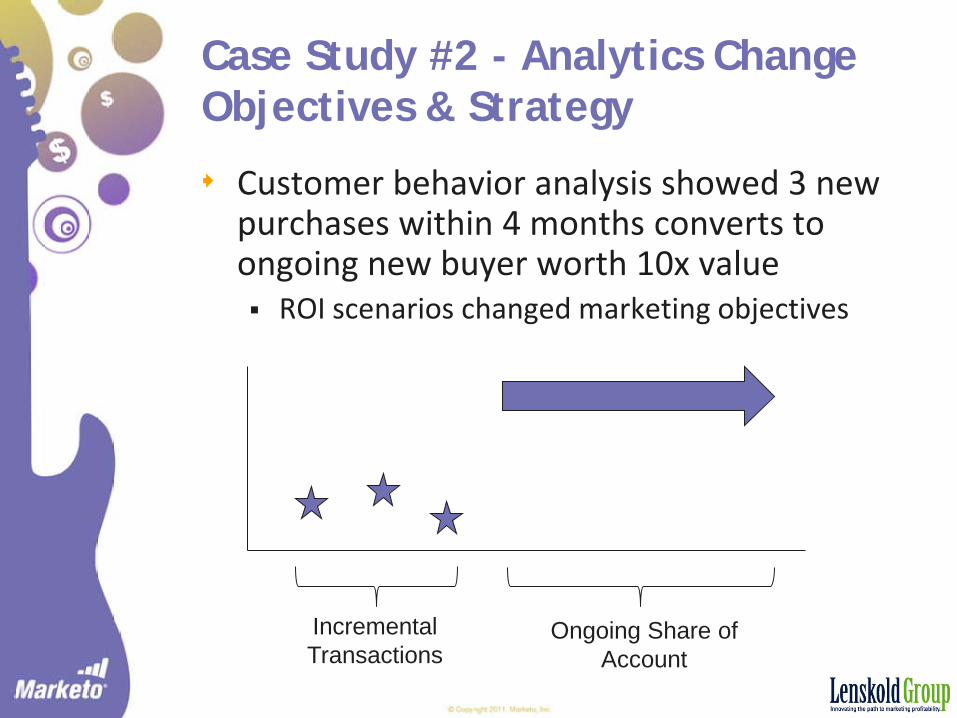
Case Study #2 - Analytics Change Objectives & Strategy
Customer behavior analysis showed 3 new purchases within 4 months converts to ongoing new buyer worth 10x value ROI scenarios changed marketing objectives
Incremental Transactions
Ongoing Share of Account
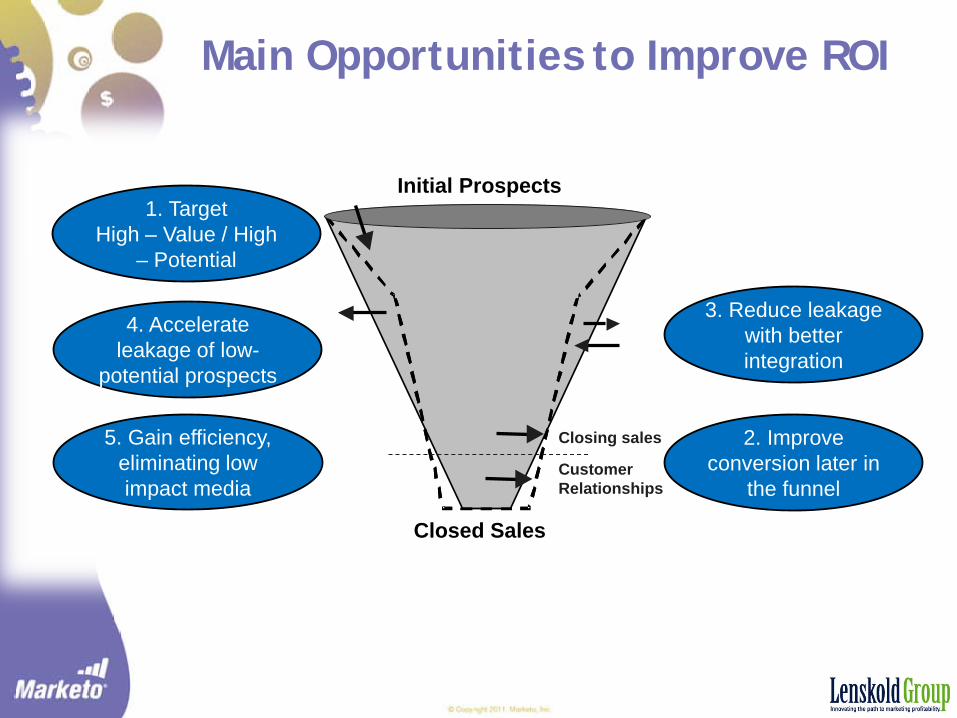
Main Opportunities to Improve ROI
Initial Prospects
Closed Sales
3. Reduce leakage with better integration
4. Accelerate leakage of low-
potential prospects
5. Gain efficiency, eliminating low impact media
2. Improve conversion later in
the funnel
Closing sales
Customer Relationships
1. Target High – Value / High
– Potential
Progression SupportsMarketing & Sales Alignment
Lead quality aligns to sales objectives Conversion Customer value
Strategic & Revenue Management improves marketing performance in key areas Stronger tactics Better targeting More influential content
Measurements can validate impact Small % improvements can be significant
financially but not apparent to the sales team
Charting Your Course on the Measurement & ROI Path
Improve & solidify results trackingTrack metrics to manage lead qualityAdd basic ROI calculations for assessment and scenario planningFind opportunities to apply strategic measures

© 2011 Lenskold Group, Inc. / Marketo. All rights reserved.
Additional Insights at www.lenskold.com
Marketing ROI Research Studies
White Papers
Articles
E-newsletter subscription
33