author's personal copy -...
TRANSCRIPT
Autho
r's
pers
onal
co
py
Toxicology 232 (2007) 37–49
Toxic doses of paraoxon alter the respiratory patternwithout causing respiratory failure in rats
Antoine F. Villa a,b,c, Pascal Houze a,b,d, Claire Monier a,b, Patricia Risede a,b,Hala Sarhan a,b, Stephen W. Borron e, Bruno Megarbane a,b,f,
Robert Garnier c, Frederic J. Baud a,b,f,∗a INSERM U705, CNRS UMR 7157, Universite Paris 5, Hopital Fernand Widal, 75010 Paris, Franceb INSERM U705, CNRS UMR 7157, Universite Paris 7, Hopital Fernand Widal, 75010 Paris, France
c Poison Control Centre of Paris, Hopital Fernand Widal, 75010 Paris, Franced Laboratory of Biochemistry, Hopital Saint Louis, 75010 Paris, France
e University of Texas, Health Science Center, San Antonio, TX 78229, USAf Medical and Toxicological Critical Care Department, Hopital Lariboisiere, 75010 Paris, France
Received 29 September 2006; received in revised form 1 December 2006; accepted 7 December 2006Available online 15 December 2006
Abstract
Respiratory failure, through a combination of muscarinic, nicotinic, and central effects, is the primary cause of death in acuteorganophosphate poisoning. However, the mechanisms inducing respiratory failure remain unclear. In rats poisoned subcuta-neously with paraoxon at doses near the LD50, we studied the pattern of respiration using whole body plethysmography andthe occurrence of respiratory failure using arterial blood gases. Subsequently, we studied the effects of atropine on paraoxon-induced modification of ventilation and arterial blood gases. Fifty and 75%, but not 10% of the subcutaneous LD50 of paraoxoninduced marked and sustained signs and symptoms. At 30 min post-injection and throughout the study, there was a significantdecrease in the respiratory frequency (34% (50% versus solvent), and 29% (75% versus solvent)) and a significant increase inthe expiratory time (72% (50% versus solvent) and 60% (75% versus solvent)) with no modifications of the inspiratory time.The tidal volume was significantly increased for the 75% but not for the 50% dose. Apnea was never detected. Even at the 75%dose, paraoxon had no effects on PaO2, PaCO2 or HCO3
−; however, a significant decrease in arterial pH was observed at 30 min(7.34 ± 0.07 versus 7.51 ± 0.01, p = 0.03). Atropine completely reversed the paraoxon-induced respiratory alterations. We concludethat paraoxon, at doses equal to 50 and 75% of the LD50, alters ventilation at rest without inducing respiratory failure during the studyperiod.© 2006 Elsevier Ireland Ltd. All rights reserved.
Keywords: Paraoxon; Atropine; Rats; Plethysmography; Arterial blood gases; Respiration
∗ Corresponding author at: Medical and Toxicological Critical CareDepartment, Hopital Lariboisiere, 2 Rue Ambroise Pare, 75010 Paris,France. Tel.: +33 1 49 95 89 61; fax: +33 1 49 95 65 78.
E-mail address: [email protected] (F.J. Baud).
1. Introduction
Organophosphates are used daily throughout theworld as pesticides. However, they remain a major healthconcern due to the large number of annual acute poison-ings. Indeed, according to the World Health Organizationdata, there are more than 3 million organophosphate
0300-483X/$ – see front matter © 2006 Elsevier Ireland Ltd. All rights reserved.doi:10.1016/j.tox.2006.12.006
Autho
r's
pers
onal
co
py
38 A.F. Villa et al. / Toxicology 232 (2007) 37–49
intoxications and more than 220,000 deaths annually(Jeyaratnam, 1990; Segura et al., 1999).
The early and intermediate phases of toxicity oforganophosphates are related to the inhibition ofcholinesterase activity, resulting in the accumulation ofacetylcholine within the synapses throughout the bodywhich induces an overstimulation of the autonomicnervous system. Respiratory failure is considered the pri-mary cause of death (Durham and Hayes, 1962; Lermanand Gutman, 1988; Yamashita et al., 1997). However, itsmechanism remains unclear. Organophosphate-inducedacute respiratory failure is thought to result from adirect depressant effect on the respiratory center in thebrainstem, constriction of and increased secretion by theairways, and paralysis of the respiratory musculature(Bartholomew et al., 1985). Data support the hypothesisthat some organophosphates, including paraoxon, canalso injure the air-blood membrane (Delaunois et al.,1992).
A number of experimental studies have demonstratedthe detrimental effect of organophosphates on ventilationat rest in various species, ranging from rodents to pri-mates. However, the clinical relevancy of these findingsremains debatable. Indeed, a large number of experi-ments were performed using chemical weapons (Aaset al., 1987; Anzueto et al., 1990; Edery and Berman,1985; Gillis et al., 1988; Johnson and Wilcox, 1975;Lipp, 1976; Rickett et al., 1986; Worek et al., 1995)and the extension of these findings to pesticides remainsquestionable. A recent prospective study on human self-poisonings resulting from chlorpyrifos, fenthion, anddimethoate ingestion showed that the clinical findings,including the onset of respiratory failure requiring endo-tracheal intubation as well as the final outcome, weresignificantly different from each other (Eddleston et al.,2005). Finally, Segura and coworkers provided defini-tive evidence that paraoxon impaired the mechanicsof breathing, although arterial blood gases were notmeasured (Segura et al., 1999). Surprisingly, in goatsreceiving intravenous dichlorvos followed by atropine,a significant alteration of the pattern of breathing wasobserved, without any significant modification of arterialblood gases (Bakima et al., 1989).
Thus, we conducted an experimental study to assessthe effects of paraoxon on the pattern of respiration atrest using whole body plethsymography and the effectson arterial blood gases in awake rats. First, we confirmedthe LD50 of paraoxon administered subcutaneously. Sec-ondly, we studied the effects of three doses, namely 10,50, and 75% of the LD50 of paraoxon, on ventilation atrest and on arterial blood gases in comparison with thoseinduced by the solvent. Finally, we studied the antido-
tal effects of atropine on paraoxon-induced respiratoryeffects.
2. Materials and methods
All experiments were carried out within the ethical guide-lines established by the National Institutes of Health and theFrench Minister of Agriculture.
2.1. Animals
Animals employed were Sprague–Dawley male rats (Iffa-Credo, France) weighing between 250 and 350 g at the time ofexperimentation. They were housed for 8 days before exper-imentation in a temperature- and light-controlled animal-careunit. They were allowed food and water ad libitum until oneday prior to experimentation.
2.2. Chemicals and drugs
Paraoxon (diethyl p-nitrophenyl phosphate) was obtainedfrom Sigma–Aldrich Chemie Gmbh, Steinheim, Germany.Paraoxon was diluted in sterile distilled water to obtain a stocksolution of 3.5 mg/ml. Several dilution of paraoxon were pre-pared (280, 140 and 28 �g/ml), to inject doses equal to 75, 50and 10% of the LD50. Solutions of paraoxon were preservedfrom light and stored at 4 ◦C during a maximum of 4 weeks.
The stability of these aqueous solutions of paraoxon wasverified using high liquid performance chromatography withUV detection at 280 nm, on a Lichrosphere RP18 5 �m column(125 mm × 4 mm, Merck). The mobile phase was composed ofwater–methanol–acetonitrile (40/50/10%, v/v). Parathion wasused as internal standard at concentration of 2 �g/mL. Usinga flow gradient (0.4–0.9 ml/min.), the paraoxon was typicallyeluted at 6 min 36 s and parathion at 9 min 42 s.
Atropine sulfate was supplied by Sigma–Aldrich, Saint-Quentin Fallavier, France. Atropine sulfate was diluted insterile distilled water in order to obtain a stock solution of18 mg/ml. One dilution (9 mg/ml) was then prepared to injectdoses corresponding to 10 mg/kg. This solution was freshlyprepared the day of the experimentation.
Propionylthiocholine, 4,4′-dipyridyl disulfide (Aldrithiol®)dihydrated disodium phosphate, and monopotassium phos-phate were obtained from Sigma–Aldrich (St QuentinFallavier, France). Distilled water (Fresenius FrancePharma,Louviers, France) was used for preparation of the variousreagents.
2.3. Study 1: median lethal dose (LD50) of subcutaneousparaoxon in rats
Approximatively 18 h prior to experimentation, the ani-mals were fasted, but allowed free access to water. Followingdrug administration, animals were placed in individual cages,allowed to eat and drink, and maintained in the laboratory,which was temperature- and light-controlled. Every effort was
Autho
r's
pers
onal
co
py
A.F. Villa et al. / Toxicology 232 (2007) 37–49 39
made to reduce the number of animals required for the study.Accordingly, the up-and-down method as proposed by Dixon(Dixon, 1991; Dixon and Mood, 1948) and refined by Bruce(Bruce, 1985, 1987), was employed.
Paraoxon was administered in awake, unrestrained animals,via subcutaneous injection in the neck. Animals were examinedrepeatedly during the first 4-h period after injection, then dailyfor 7 days, for evidence of toxicant-related side effects or otherillness. At the end of the study period, animals were euthanizedusing a carbon dioxide chamber.
The animals were observed and the following signs wererecorded: dyspnea, fasciculations, salivation and lacrimation,ataxia, paralysis, tonic-clonic seizures, coma, and death. Clin-ical observations were made before injection and thereafter at5, 10, 15 30, 60, 90, 120, 150, 180, 210, 240 min, then at 5,6, 12, 24 h, and then daily up to 7 days post-injection. Eachparameter was graded as absent, mild, moderate, or severe.
2.4. Study 2: effects of paraoxon on respiration at restand arterial blood gases
2.4.1. Clinical examinationThe animals were clinically observed while plethysmog-
raphy measurements were performed. The following signswere noted: fasciculations, salivation and lacrimation, urina-tion, defecation, ataxia, tonic–clonic seizures, coma, and death.The rectal temperature was measured at the same time.
2.4.2. Whole body plethysmographyVentilatory parameters were recorded in a whole-body
plethysmograph by the barometric method described and val-idated in the rat by Bartlett and Tenney (1970). The animalswere placed in a rectanglar Plexiglas chamber with a volume of3 l connected to a reference chamber of the same size by a high-resistance leak to minimize the effect of pressure changes inthe experimental room. The animal chamber was flushed con-tinuously with humidified air at a rate of 5 l/min. During therecording periods, the inlet and outlet tubes were temporar-ily clamped and the pressures changes associated with eachbreath were recorded with a differential pressure transducer(Validyne MP, 45 ± 3 cm H2O, Northridge, CA), connectedto the animal and reference chambers. During each measure-ment, calibration was performed by one injection of 1 ml ofair into the chamber and the ambient temperature was noted.The spirogram was recorded and stored on a computer with anacquisition data card (PCI-DAS1000, Dipsi, Chatillon, France)using a respiratory acquisition software (Acquis1 Software,CNRS, Gif-sur-Yvette, France) for analysis off-line.
This technique was validated daily with a series of leak tests(a leak was signaled by a diminution of the signal amplitudeexceeding 33% in 5 s). The quantification threshold corre-sponded to a minimum air volume injection of 30 �l. In therange of volumes tested (0.1 to 3 ml), the measurement waslinear. The mean coefficient of intra-day variability (four seriesof 5 measurements carried out the same day) was 1.3 ± 0.2%.The mean coefficient of inter-day variability (25 measurements
carried out on 3 different days) was 1.7 ± 0.1%. We verifiedthat the mean CO2 measured using an Ohmeda 5250 RGMcapnograph (rebreathing test) during clamping periods did notexceed 0.6% of the air contained in the chamber.
The design of the study was to assess respiratory parametersin unrestrained animals using plethysmography. Whole bodyplethysmography requires the simultaneous measurements ofpressure, as well as ambient and rectal temperatures. However,using unrestrained rats precluded the continuous measurementof the temperature using a rectal probe, while it is well estab-lished that toxic doses of organophosphates induce highlysignificantly effects on core temperature (Coudray-Lucas etal., 1981). Thus, the rectal temperature was measured in a sep-arate study. The animals were placed in the plethysmographychamber under the same conditions as the others, but weretemporally restrained for measurement of rectal temperatureusing a Plexiglas cylinder (internal diameter: 6.5 cm, adjustablelength up to 20 cm) (Harvard Apparatus, Inc., Holliston, MA).
2.4.3. Measurement of arterial blood gasesThe day before the study, the animals were anesthetized
with ketamine (Ketalar®) 70 mg/kg and xylazine (Rompum®)10 mg/kg intraperitoneally and then placed on a warming blan-ket with a regulating thermostat. A rectal probe permittedfeedback control of the temperature. The adequacy of anes-thesia was judged by complete immobility, deep sleep, andlack of response to painful stimuli.
The femoral artery was catheterized with silastic tubing:external and internal diameters 0.94 and 0.51 mm, respectively;length 30 cm (Dow Corning Co., Midland, MI). The arterialcatheters were then tunneled subcutaneously and fixed at theback of the neck. Heparinized saline was injected into thecatheter to avoid thrombosis and catheter obstruction. Then,the rats returned to their individual cages for a minimum24-h recovery period, to allow for complete washout of theanesthesia. On the day of the experiment, rats were placedin a restraining chamber. Before drug injection, the catheterwas exteriorized, purged, and its permeability verified. Nomajor problems were encountered during catheterization, drugadministration, or collection of arterial blood samples.
The day of the experimentation, rats were placed indi-vidually in a Plexiglas cylinder (internal diameter: 6.5 cm,adjustable length up to 20 cm) (Harvard Apparatus, Inc,Massachusetts). The Plexiglas cylinders, as provided, had 4openings on the cranial extremity and two longitudinal open-ings in the ventral and dorsal faces. Additionally, we placedseveral holes at the cranial end of the cylinders in the order toprevent CO2 rebreathing. One hundred microliters of arterialblood samples were collected in preheparinized syringes andimmediately analyzed on a Rapidlab® 248, (Bayer Diagnos-tics). Paraoxon was injected subcutaneously in the neck. Bloodsamples were taken using the femoral arterial catheter. Onehundred microliters of blood were collected before paraoxonor solvent injection, then every 15 min up to 210 min post-injection. The temperatures of the animals were systematicallyrecorded at each sampling time.
Autho
r's
pers
onal
co
py
40 A.F. Villa et al. / Toxicology 232 (2007) 37–49
2.4.4. Whole blood cholinesterase activityFrom catheterized animals, one hundred and fifty micro-
liters of heparinized blood were collected in a glass tubeat the same time as arterial blood gases. Fifty microlitersof blood were transferred to an Eppendorf tube. The sam-ple was then diluted to 1/20 in water. This preparation wasimmediately frozen at −20 ◦C until the measurement. Thewhole blood cholinesterase activity (total cholinesterase activ-ity) was determined by UV kinetic method (324 nm) accordingto Augustinsson et al. (1978). Briefly, 100 �l of hemolyzedwhole blood (1:20 in water) were mixed to 2850 �l Aldrithiol®
(0.1 mM in phosphate buffer 50 mM, pH 8). The mixture wasincubated for 2 min at 30 ◦C, then 50 �l of the substrate (pro-pionylthiocholine 0.3 M in distilled water) were added. Aftermixing, absorbance was determined at 30 ◦C after an interval of30 s during 5 min. Sample activity (IU l−1) was assessed usingchange in absorbance per min multiplied by a factor (60,000)determined according to various parameters (sample volume,total reaction volume, molecular absorbance coefficient ofreaction product,. . .). On each hemolyzed sample, hemoglobinwas determined according to the method of Drabkin (Drabkin,1949) in order to express activity in IU g−1 hemoglobin. Themethod was linear between 1 and 5 min, with a good between-runs precision (coefficient of variation <6%, n = 5). In ourresults, the total cholinesterase activity of treated groups isexpressed as a percentage of the control group activity.
2.4.5. Study design2.4.5.1. Effects of paraoxon on ventilation at rest and arterialblood gases. Ventilation at rest was studied in animals random-ized to four groups of 8 animals each, namely the control, 10,50, and 75% × LD50 groups. The first measurement was per-formed after a period of accommodation of 30–60 min whilethe animal was quiet and not in deep or rapid eye movementsleep which can be roughly estimated from their behavior, theresponse to noise, and the pattern of breathing. Measurementswere made three times to obtain baseline values. Then, the ani-mal was gently removed from the chamber for the subcutaneousinjection, and replaced in the chamber for another session ofrespiratory recording. Ventilation was recorded every 15 minduring 4 h, each record lasting about 60 s. The following param-eters were measured: the tidal volume (VT), the inspiratory time(TI), the expiratory time (TE) and the total respiratory time(TTOT = TI + TE). Additional parameters were calculated: therespiratory frequency (f), the minute ventilation (VE = VT × f),the TI/TTOT ratio, and the mean inspiratory flow (=VT/TI). Dueto the lack of impairment of respiratory parameters in the 10%group, we considered it unnecessary to measure the arterialblood gases and whole blood cholinesterase activities in thisgroup. Arterial blood gases and cholinesterase activities werethus measured in catheterized animals having received the sol-vent, 50, and 75% LD50 of paraoxon. Blood specimens werecollected before any treatment and then 30, 60, 90, 150, and210 min after paraoxon injection.
The rats were subsequently euthanized using a carbon diox-ide chamber.
2.4.5.2. Reversal of the paraoxon-induced respiratory effectsusing atropine. Plethysmography revealed that the maximumeffects of paraoxon on ventilation at rest were observed 30 minpost-injection in the 75% group. Thus, atropine was adminis-tered 30 min after paraoxon. Atropine sulfate was administeredsubcutaneously at a dose of 10 mg/kg. The respiratory param-eters were measured before paraoxon administration, then at15 and 30 min after paraoxon injection. Thereafter, measure-ments were made at 15, 30, 60, 75, 120, 180 min after injectionof atropine. Arterial blood gases were measured at the sametimes as plethysmography measurements.
The rats were subsequently euthanized using a carbon diox-ide chamber.
2.4.5.3. Effects on the whole blood cholinesterase activities.The whole blood cholinesterase activities were measured in thesolvent, 50%, and 75% groups as well as in the 75% groupstreated with atropine. Activities were determined before anytreatment and at 30, 60, 90, 150, 210 min post-injection.
2.5. Statistical analysis
The results are expressed as mean ± S.E.M. Baseline valueswere compared using the Kruskall-Wallis one-way analysis ofvariance followed by multiple Dunn’s comparison tests. Foreach animal, and for each parameter at each sampling time,we calculated the difference between the value at that time andits corresponding baseline value. The areas under the curve(AUC) after paraoxon, atropine or solvent injection until thecompletion of the study were calculated using the trapezoidalmethod (Tallarida and Murray, 1981). The AUCs were com-pared using the Kruskall–Wallis one-way analysis of variancefollowed by multiple Dunn’s comparison test. In each studywe also compared the effect of treatment at each time usingthe Kruskall-Wallis one-way analysis of variance followed bymultiple Dunn’s comparison test or the Mann-Whitney test.All tests were two-tailed and performed using Prism version3.0 (GraphPad Software, Inc., San Diego, CA). A p-value ofless than 0.05 was considered significant.
3. Results
3.1. Study 1: estimated lethal dose (LD50) ofsubcutaneous paraoxon in rats
The LD50 by the subcutaneous route was0.430 mg/kg. The animals exhibited various signsincluding fasciculations, dyspnea, lacrimation, andataxia.
3.2. Study 2: effects of paraoxon on respiration atrest and on arterial blood gases
3.2.1. Clinical findingsNo animals died during the 240 min study period
of the plethysmography study. Four (4/8) animals died
Autho
r's
pers
onal
co
py
A.F. Villa et al. / Toxicology 232 (2007) 37–49 41
Table 1Baseline values of ventilation at rest in the solvent, 10, 50, and 75% LD50 paraoxon groups
Solvent 10% DL50 50% LD50 75% LD50
f (b/min) 115.8 ± 5.1 107.9 ± 5.1 110.6 ± 4.4 116.1 ± 3.5TTOT (s) 0.52 ± 0.02 0.57 ± 0.03 0.56 ± 0.02 0.52 ± 0.02TI (s) 0.18 ± 0.01 0.18 ± 0.01 0.20 ± 0.01 0.17 ± 0.01TE (s) 0.35 ± 0.01 0.38 ± 0.02 0.35 ± 0.01 0.35 ± 0.01TI/TTOT 0.34 ± 0.01 0.36 ± 0.01 0.32 ± 0.01 0.32 ± 0.01VT (�l) 2069 ± 107.6 1891 ± 106.0 1704 ± 45.5 1863 ± 125.6VE (�l/min) 240711 ± 18528 204290 ± 16972 186122 ± 9325 222389 ± 16107
Values are presented as mean ± S.E.M.
in the 75% group catheterized for arterial blood gasmeasurement. Animals in the solvent and 10% groupwere free of symptoms. In animals receiving the 50and 75% dose, the most frequent clinical abnormalitieswere fasciculations, dyspnea, defecation, urination, andataxia. There were no significant differences in the meanbaseline body temperatures. In contrast, there were asignificant decrease in the mean body temperatures atthe completion of the study in the 50 (p < 0.05) and 75%(p < 0.001) groups in comparison with the solvent. Themean body temperatures at the completion of the studyin the solvent, 10, 50, and 75% groups were, 37.7 ± 0.1,37.6 ± 0.2, 36.1 ± 0.3, and 35.3 ± 0.5 ◦C, respectively.During the arterial blood gas study, symptoms weremore marked at the 50 and 75% doses than the ratsin the plethysmography study. In the 75% group, twoanimals out of five died. Rats which eventually diedpresented intense dyspnea, bradypnea with prolongedexpiratory phase, and stertorous breathing. Generalizedclonus was frequently observed. Gasping respirationswere followed by death.
3.2.2. Comparison of baseline valuesThere were no significant differences in ventilatory
parameters or arterial blood gases among the groups(Tables 1 and 2).
3.2.3. Effects of toxic doses of paraoxon onventilation at rest and arterial blood gases3.2.3.1. Ventilation at rest. There were no significantdifferences in any parameters between the solvent and
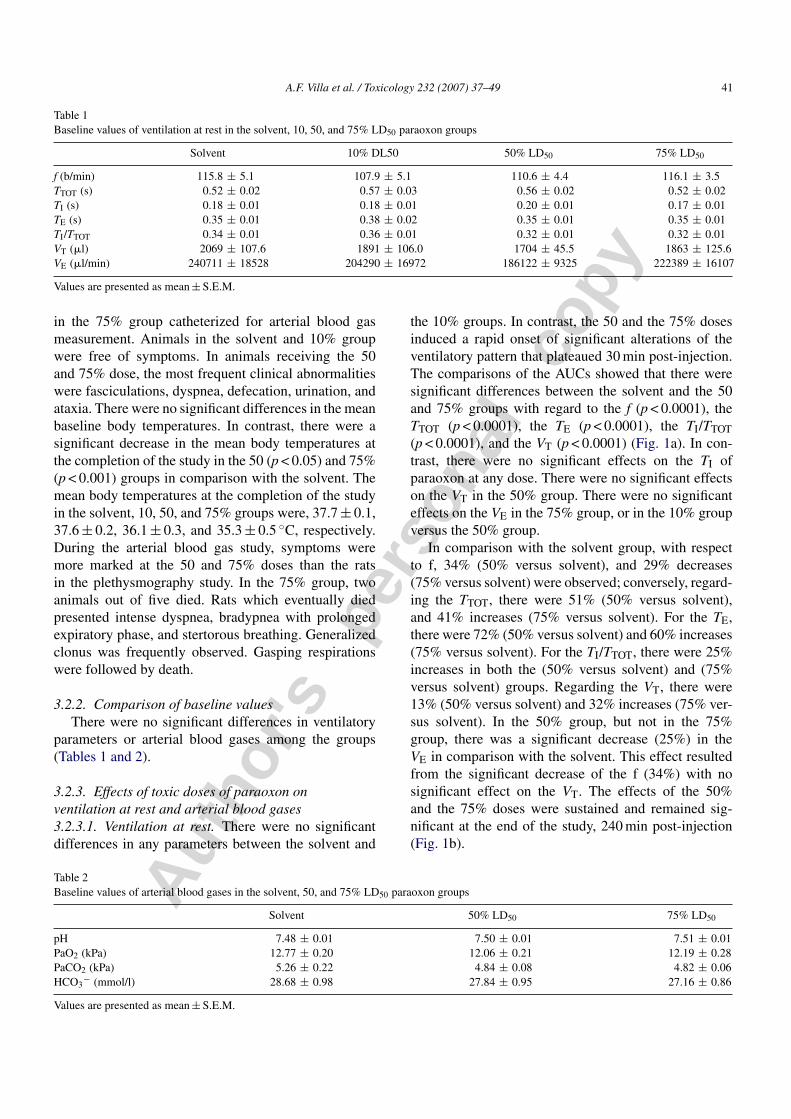
the 10% groups. In contrast, the 50 and the 75% dosesinduced a rapid onset of significant alterations of theventilatory pattern that plateaued 30 min post-injection.The comparisons of the AUCs showed that there weresignificant differences between the solvent and the 50and 75% groups with regard to the f (p < 0.0001), theTTOT (p < 0.0001), the TE (p < 0.0001), the TI/TTOT(p < 0.0001), and the VT (p < 0.0001) (Fig. 1a). In con-trast, there were no significant effects on the TI ofparaoxon at any dose. There were no significant effectson the VT in the 50% group. There were no significanteffects on the VE in the 75% group, or in the 10% groupversus the 50% group.
In comparison with the solvent group, with respectto f, 34% (50% versus solvent), and 29% decreases(75% versus solvent) were observed; conversely, regard-ing the TTOT, there were 51% (50% versus solvent),and 41% increases (75% versus solvent). For the TE,there were 72% (50% versus solvent) and 60% increases(75% versus solvent). For the TI/TTOT, there were 25%increases in both the (50% versus solvent) and (75%versus solvent) groups. Regarding the VT, there were13% (50% versus solvent) and 32% increases (75% ver-sus solvent). In the 50% group, but not in the 75%group, there was a significant decrease (25%) in theVE in comparison with the solvent. This effect resultedfrom the significant decrease of the f (34%) with nosignificant effect on the VT. The effects of the 50%and the 75% doses were sustained and remained sig-nificant at the end of the study, 240 min post-injection(Fig. 1b).
Table 2Baseline values of arterial blood gases in the solvent, 50, and 75% LD50 paraoxon groups
Solvent 50% LD50 75% LD50
pH 7.48 ± 0.01 7.50 ± 0.01 7.51 ± 0.01PaO2 (kPa) 12.77 ± 0.20 12.06 ± 0.21 12.19 ± 0.28PaCO2 (kPa) 5.26 ± 0.22 4.84 ± 0.08 4.82 ± 0.06HCO3
− (mmol/l) 28.68 ± 0.98 27.84 ± 0.95 27.16 ± 0.86
Values are presented as mean ± S.E.M.
Autho
r's
pers
onal
co
py
42 A.F. Villa et al. / Toxicology 232 (2007) 37–49
Fig. 1. (a) Effects of solvent (white), paraoxon 10% LD50 (vertical line), paraoxon 50% LD50 (slanting line), and paraoxon 75% LD50 (cross-ruling)on the ventilatory pattern. Each group consisted of eight rats. Data are represented by areas under the curve (AUC). Paraoxon induced a significantdecrease in respiratory frequency, a significant increase in total time, and expiratory time for the 50 and 75% LD50 groups, a significant increase inthe tidal volume for the 75% LD50 group only, and a significant decrease in the minute volume for the 50% LD50 group. Differences among groupswere compared using the Kruskall–Wallis test followed by Dunn’s test. (b) Effects of solvent (square), paraoxon 10% LD50 (circle), 50% LD50
(rhomb) and 75% LD50 (triangle) on ventilatory pattern. Each group consisted of eight rats. Data are represented by mean ± S.E.M. at each timeafter injection. At each time, paraoxon induced a significant decrease in respiratory frequency, a significant increase in total time, expiratory time,and tidal volume for the 50% LD50 and 75% LD50 groups, untill the end of the study. Differences among groups at each time were compared usingthe Kruskall–Wallis test followed by Dunn’s test. Paraoxon 50% LD50 vs. solvent: *p < 0.05, **p < 0.01 and ***p < 0.001. Paraoxon 75% LD50 vs.solvent: +p < 0.05, ++p < 0.01 and +++p < 0.001.
Autho
r's
pers
onal
co
py
A.F. Villa et al. / Toxicology 232 (2007) 37–49 43
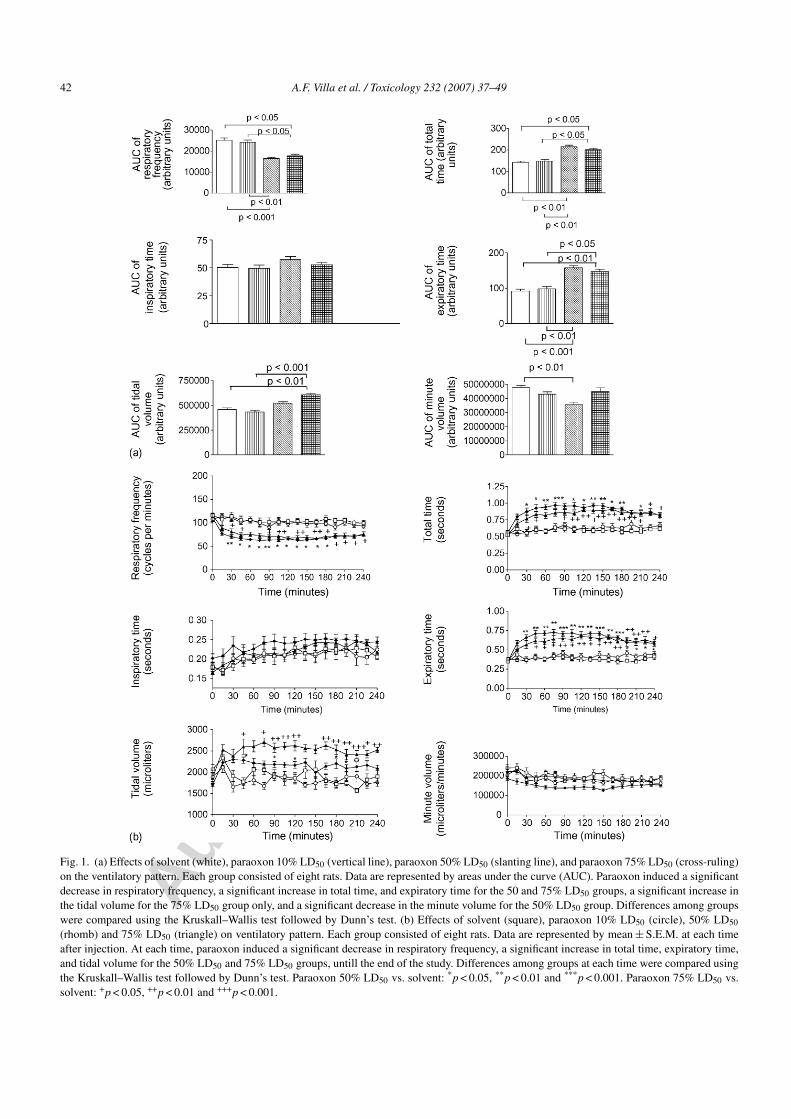
Fig. 2. (a) Effects of solvent (white), paraoxon 50% LD50 (slanting line), paraoxon 75% LD50 (cross-ruling) on the arterial pH, PaO2, PaCO2,HCO3
−. Each group consisted of five rats. Data are represented by areas under curve (AUC). There was no significant difference among groups.Differences among groups were compared using the Kruskall–Wallis test followed by Dunn’s test. (b) Effects of solvent (circle), 50% LD50
(square) and 75% LD50 (triangle) paraoxon on the arterial pH, PaO2, PaCO2, HCO3−. Each group consisted of five rats. Data are represented
by mean ± S.E.M. at each time after injection. The pH was significantly lower in the 75% LD50 group but only at 30 min (p < 0.05), than in theother groups. The PaO2 was significantly higher in the 75% LD50 group vs. the solvent group at 60 min. There were no significant differenceswhen comparing the arterial PaO2, PaCO2 and HCO3
− of the solvent group and the 50 and 75% group at any other sampling time. Differencesamong groups at each time were compared using the Kruskall–Wallis test followed by Dunn’s test: Paraoxon vs. solvent: *p < 0.05, **p < 0.01and ***p < 0.001.
3.2.3.2. Arterial blood gases. As there was no impair-ment of the ventilation at rest in the 10% group, thearterial blood gases were compared only in the solvent,50%, and 75% groups. The AUCs regarding the arte-rial pH, the PaCO2, the PaO2, and the blood bicarbonateconcentrations were not significantly different (Fig. 2a).Regarding the effect of time and treatment, the arterialpH was significantly lower at 30 min post-injection inthe 75% group compared to the 50% and solvent groups(7.34 ± 0.07, 7.51 ± 0.01, and 7.51 ± 0.01, respectively;p = 0.03) (Fig. 2b).
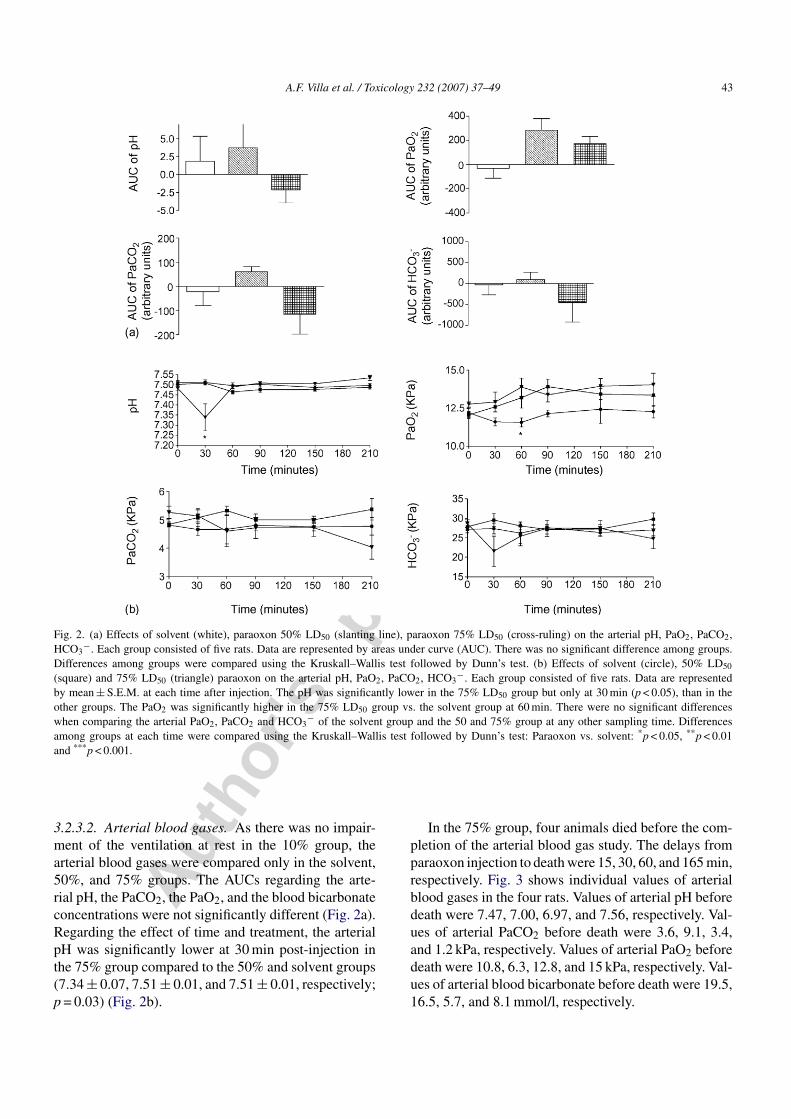
In the 75% group, four animals died before the com-pletion of the arterial blood gas study. The delays fromparaoxon injection to death were 15, 30, 60, and 165 min,respectively. Fig. 3 shows individual values of arterialblood gases in the four rats. Values of arterial pH beforedeath were 7.47, 7.00, 6.97, and 7.56, respectively. Val-ues of arterial PaCO2 before death were 3.6, 9.1, 3.4,and 1.2 kPa, respectively. Values of arterial PaO2 beforedeath were 10.8, 6.3, 12.8, and 15 kPa, respectively. Val-ues of arterial blood bicarbonate before death were 19.5,16.5, 5.7, and 8.1 mmol/l, respectively.
Autho
r's
pers
onal
co
py
44 A.F. Villa et al. / Toxicology 232 (2007) 37–49
Fig. 3. In the 75% group, four animals died before the completion of the arterial blood gas study. This figure shows individual values of arterialblood gases in the four rats.
3.3. Study 3: effects of atropine onparaoxon-induced alteration of ventilation at restand arterial blood gases
3.3.1. Comparison of baseline valuesThere were no significant differences in ventilatory
parameters among the three groups (Table 3).
3.3.2. Effects of atropine on paraoxon-inducedalteration of ventilation at rest
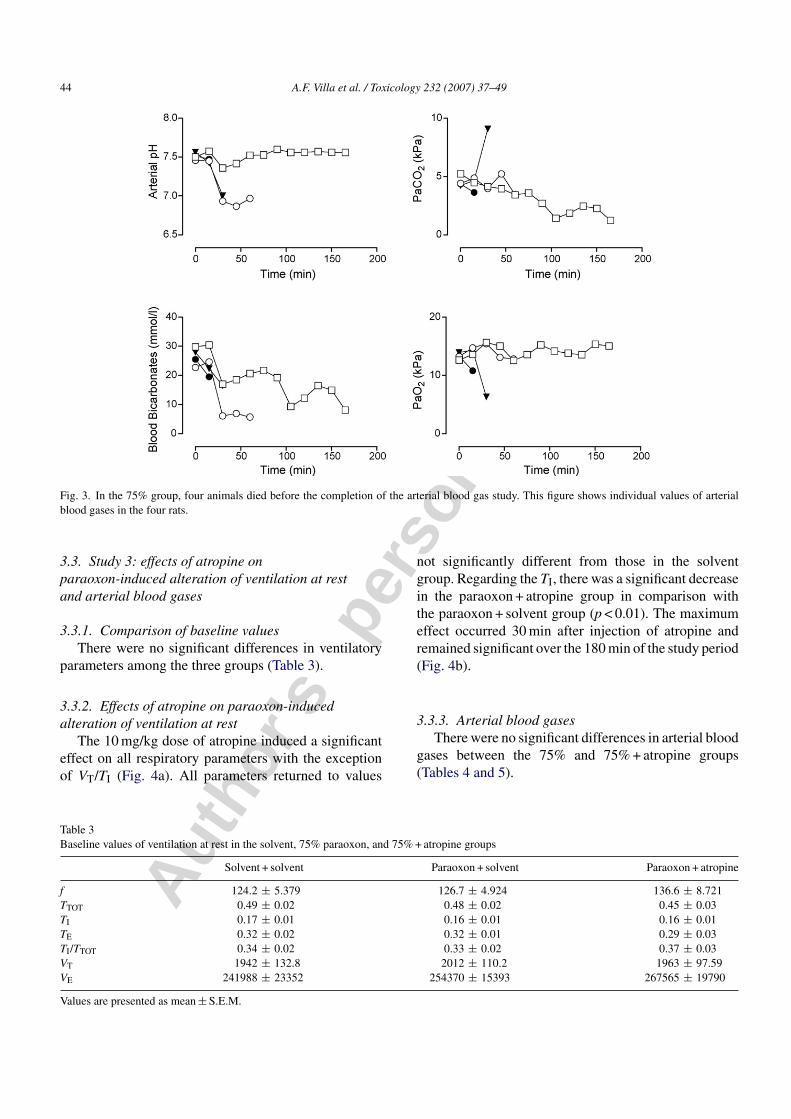
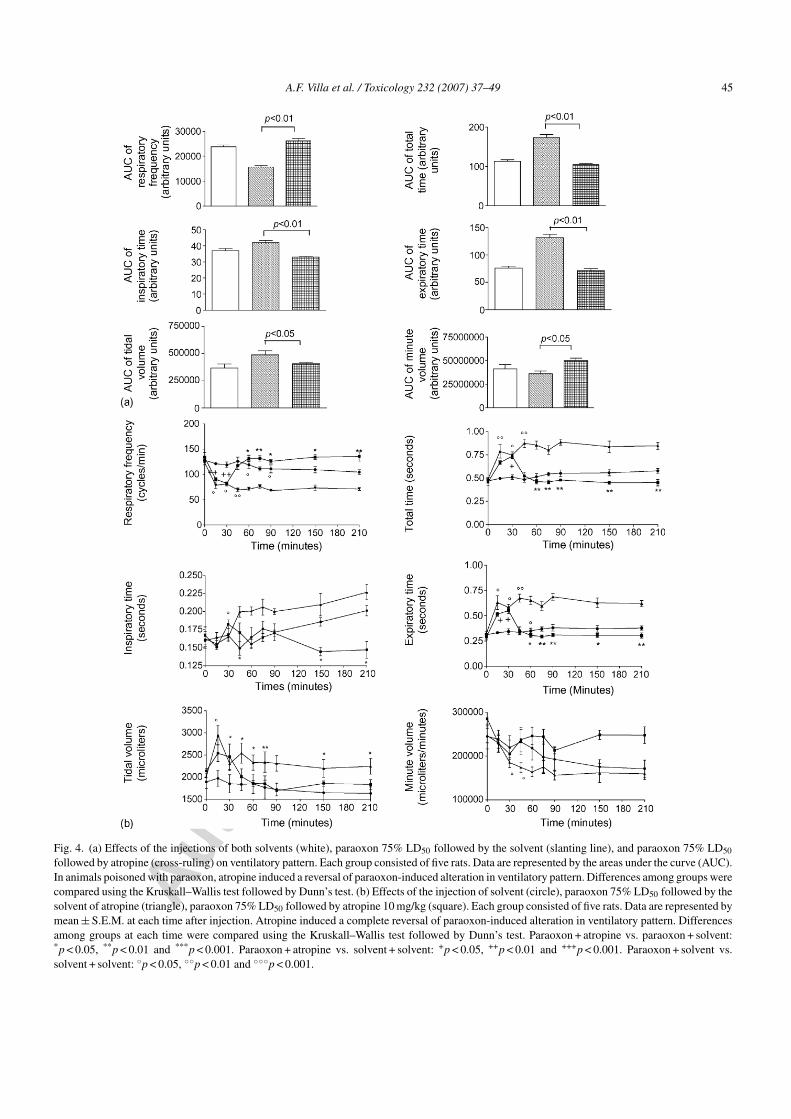
The 10 mg/kg dose of atropine induced a significanteffect on all respiratory parameters with the exceptionof VT/TI (Fig. 4a). All parameters returned to values
not significantly different from those in the solventgroup. Regarding the TI, there was a significant decreasein the paraoxon + atropine group in comparison withthe paraoxon + solvent group (p < 0.01). The maximumeffect occurred 30 min after injection of atropine andremained significant over the 180 min of the study period(Fig. 4b).
3.3.3. Arterial blood gasesThere were no significant differences in arterial blood
gases between the 75% and 75% + atropine groups(Tables 4 and 5).
Table 3Baseline values of ventilation at rest in the solvent, 75% paraoxon, and 75% + atropine groups
Solvent + solvent Paraoxon + solvent Paraoxon + atropine
f 124.2 ± 5.379 126.7 ± 4.924 136.6 ± 8.721TTOT 0.49 ± 0.02 0.48 ± 0.02 0.45 ± 0.03TI 0.17 ± 0.01 0.16 ± 0.01 0.16 ± 0.01TE 0.32 ± 0.02 0.32 ± 0.01 0.29 ± 0.03TI/TTOT 0.34 ± 0.02 0.33 ± 0.02 0.37 ± 0.03VT 1942 ± 132.8 2012 ± 110.2 1963 ± 97.59VE 241988 ± 23352 254370 ± 15393 267565 ± 19790
Values are presented as mean ± S.E.M.
Autho
r's
pers
onal
co
py
A.F. Villa et al. / Toxicology 232 (2007) 37–49 45
Fig. 4. (a) Effects of the injections of both solvents (white), paraoxon 75% LD50 followed by the solvent (slanting line), and paraoxon 75% LD50
followed by atropine (cross-ruling) on ventilatory pattern. Each group consisted of five rats. Data are represented by the areas under the curve (AUC).In animals poisoned with paraoxon, atropine induced a reversal of paraoxon-induced alteration in ventilatory pattern. Differences among groups werecompared using the Kruskall–Wallis test followed by Dunn’s test. (b) Effects of the injection of solvent (circle), paraoxon 75% LD50 followed by thesolvent of atropine (triangle), paraoxon 75% LD50 followed by atropine 10 mg/kg (square). Each group consisted of five rats. Data are represented bymean ± S.E.M. at each time after injection. Atropine induced a complete reversal of paraoxon-induced alteration in ventilatory pattern. Differencesamong groups at each time were compared using the Kruskall–Wallis test followed by Dunn’s test. Paraoxon + atropine vs. paraoxon + solvent:*p < 0.05, **p < 0.01 and ***p < 0.001. Paraoxon + atropine vs. solvent + solvent: +p < 0.05, ++p < 0.01 and +++p < 0.001. Paraoxon + solvent vs.solvent + solvent: ◦p < 0.05, ◦◦p < 0.01 and ◦◦◦p < 0.001.
Autho
r's
pers
onal
co
py
46 A.F. Villa et al. / Toxicology 232 (2007) 37–49
Table 4Baseline values of arterial blood gases in the 75 and 75% + atropinegroups
75% LD50 75% LD50 + atropine
pH 7.47 ± 0.01 7.48 ± 0.02PaO2 12.82 ± 0.35 12.92 ± 0.19PaCO2 5.59 ± 0.08 5.42 ± 0.23HCO3
− 29.76 ± 0.73 29.24 ± 1.25
Values are presented as mean ± S.E.M.
3.4. Study 4: effects of solvent, paraoxon alone, andparaoxon + atropine on whole blood cholinesteraseactivity
3.4.1. Comparison of baseline valuesThere were no significant differences in blood
cholinesterase activities among the four groups (Table 6).
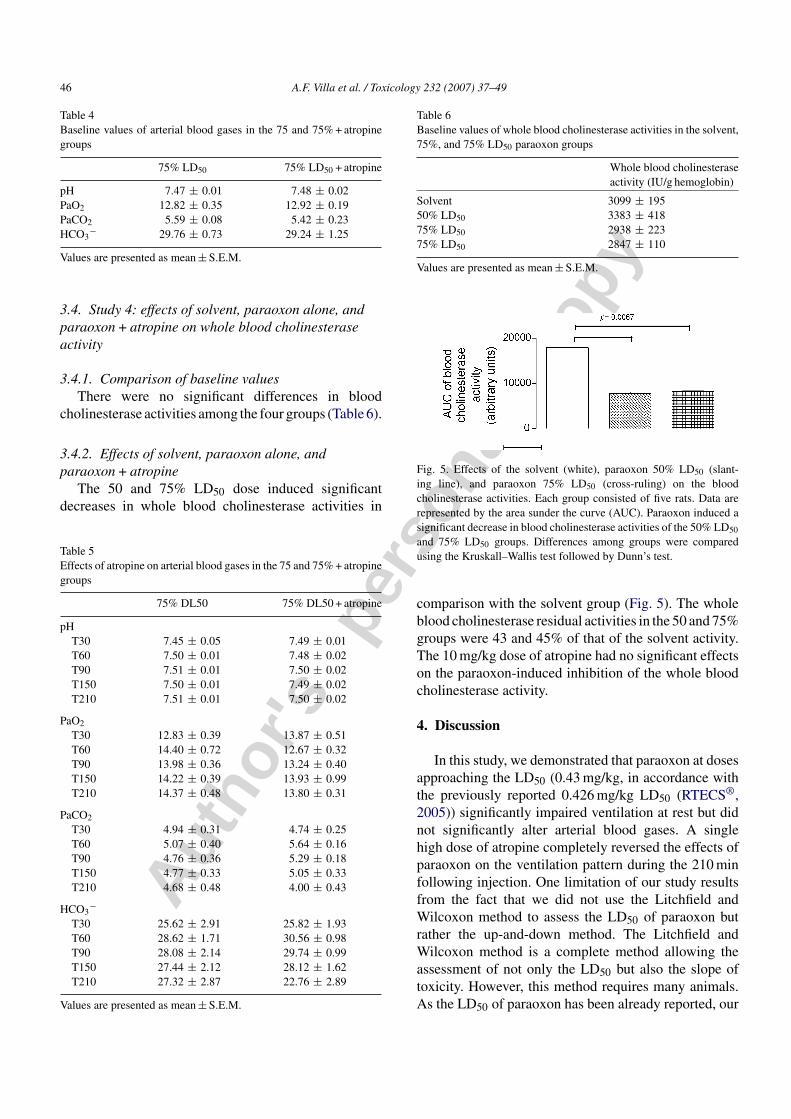
3.4.2. Effects of solvent, paraoxon alone, andparaoxon + atropine
The 50 and 75% LD50 dose induced significantdecreases in whole blood cholinesterase activities in
Table 5Effects of atropine on arterial blood gases in the 75 and 75% + atropinegroups
75% DL50 75% DL50 + atropine
pHT30 7.45 ± 0.05 7.49 ± 0.01T60 7.50 ± 0.01 7.48 ± 0.02T90 7.51 ± 0.01 7.50 ± 0.02T150 7.50 ± 0.01 7.49 ± 0.02T210 7.51 ± 0.01 7.50 ± 0.02
PaO2
T30 12.83 ± 0.39 13.87 ± 0.51T60 14.40 ± 0.72 12.67 ± 0.32T90 13.98 ± 0.36 13.24 ± 0.40T150 14.22 ± 0.39 13.93 ± 0.99T210 14.37 ± 0.48 13.80 ± 0.31
PaCO2
T30 4.94 ± 0.31 4.74 ± 0.25T60 5.07 ± 0.40 5.64 ± 0.16T90 4.76 ± 0.36 5.29 ± 0.18T150 4.77 ± 0.33 5.05 ± 0.33T210 4.68 ± 0.48 4.00 ± 0.43
HCO3−
T30 25.62 ± 2.91 25.82 ± 1.93T60 28.62 ± 1.71 30.56 ± 0.98T90 28.08 ± 2.14 29.74 ± 0.99T150 27.44 ± 2.12 28.12 ± 1.62T210 27.32 ± 2.87 22.76 ± 2.89
Values are presented as mean ± S.E.M.
Table 6Baseline values of whole blood cholinesterase activities in the solvent,75%, and 75% LD50 paraoxon groups
Whole blood cholinesteraseactivity (IU/g hemoglobin)
Solvent 3099 ± 19550% LD50 3383 ± 41875% LD50 2938 ± 22375% LD50 2847 ± 110
Values are presented as mean ± S.E.M.
Fig. 5. Effects of the solvent (white), paraoxon 50% LD50 (slant-ing line), and paraoxon 75% LD50 (cross-ruling) on the bloodcholinesterase activities. Each group consisted of five rats. Data arerepresented by the area sunder the curve (AUC). Paraoxon induced asignificant decrease in blood cholinesterase activities of the 50% LD50
and 75% LD50 groups. Differences among groups were comparedusing the Kruskall–Wallis test followed by Dunn’s test.
comparison with the solvent group (Fig. 5). The wholeblood cholinesterase residual activities in the 50 and 75%groups were 43 and 45% of that of the solvent activity.The 10 mg/kg dose of atropine had no significant effectson the paraoxon-induced inhibition of the whole bloodcholinesterase activity.
4. Discussion
In this study, we demonstrated that paraoxon at dosesapproaching the LD50 (0.43 mg/kg, in accordance withthe previously reported 0.426 mg/kg LD50 (RTECS®,2005)) significantly impaired ventilation at rest but didnot significantly alter arterial blood gases. A singlehigh dose of atropine completely reversed the effects ofparaoxon on the ventilation pattern during the 210 minfollowing injection. One limitation of our study resultsfrom the fact that we did not use the Litchfield andWilcoxon method to assess the LD50 of paraoxon butrather the up-and-down method. The Litchfield andWilcoxon method is a complete method allowing theassessment of not only the LD50 but also the slope oftoxicity. However, this method requires many animals.As the LD50 of paraoxon has been already reported, our
Autho
r's
pers
onal
co
py
A.F. Villa et al. / Toxicology 232 (2007) 37–49 47
aim was only to confirm the LD50 in the animal specieswe used for the study. Thus, we used a well-describedmethod using a smaller number of animals than the clas-sic method.
We chose to study the effects of paraoxon at dosesnear the LD50 in awake rats. Similarly, Foutz andcoworkers studied the effects of paraoxon adminis-tered by intracerebroventricular injection to awake andanaesthetized cats on the ventilatory pattern, usingwhole body plethysmography (Foutz et al., 1987).Intracerebroventricular injection was performed to avoidperipheral effects of paraoxon such as paralysis of res-piratory muscles. In awake animals, paraoxon did notdepress respiration but conversely stimulated respira-tion inducing a 4 to 5-fold increase in the respiratoryfrequency and minute volume. In contrast, pentobarbi-tal or halothane anaesthesia induced opposite effects ofparaoxon, with respiratory depression and even respira-tory arrest.
We showed that paraoxon at 50 and 75% of the LD50induced the rapid onset of alterations in the ventila-tory pattern with maximum effects occurring between30 and 45 min after paraoxon injection, followed by aplateau until the study completion. There was a signifi-cant increase in the TTOT and conversely a significantdecrease in the f. The increase in the TTOT resultedfrom an increase in the TE, without any effects onthe TI. Segura and coworkers studied the effects ofparathion on the respiratory mechanics in unrestrainedguinea pigs, using whole body plethysmography (Seguraet al., 1999). There was a significant dose-dependentincrease in the total lung resistance index in females,known to be more sensitive to acute toxicity of parathion.This effect was assessed using the determination ofthe enhanced pause, a calculated index dependent onseveral parameters including the TE (Segura et al.,1999). Accordingly, prolongation of the TE in our studystrongly suggested peripheral airway obstruction andflow restriction increasing expiratory effort. This is evenmore underscored by resolution of the changes in theTE with atropine. Paraoxon caused peripheral airwayobstruction, preferentially expressed during exhalation.The lack of change in PaCO2 suggested that alveo-lar ventilation was maintained. Thus, since the f wasdecreased, then the VT had to increase, maintaining theminute alveolar ventilation and the PaCO2 with fewerbreaths.
A significant increase in the VT was only observed inthe 75% group. Consistent with this finding, there was asignificant decrease in the VE in the 50% group while inthe 75% group, there was a significant increase in the VEin comparison with the solvent. While our data did not
show any significant effects of paraoxon on the VT/TIratio, the simultaneous increase in VT with no signifi-cant effects on TI failed to support the hypothesis of amajor depressant effect of paraoxon on the control ofbreathing within this range of doses. However, the relia-bility of plethysmography to measure the ventilation inawake animals can be questioned for the measurement ofVT which can be underestimated, but this technique hasbeen validated against pneumotachography and directplethysmography with a systemic error on VT of <7%(Bonora et al., 2004).
Respiratory failure is defined by alteration of arte-rial blood gases while breathing room air. Arterialblood gases have been performed only in a very lim-ited number of studies (Bakima et al., 1989; Bardinet al., 1987; Stefanovic et al., 2006). Our study didnot show any decrease in PaO2 in the 50 and 75%groups. There was even a trend towards an initial increasein PaO2. There was no significant effect of the 50%dose on the arterial pH at any time. In contrast, therewas a significant but limited effect of the 75% doseon the arterial pH at 30 min post-injection in compar-ison with the solvent group. There were no significanteffects of the 50 or 75% doses on the PaCO2. Therewere no significant effects of the 50 or 75% doses onthe blood bicarbonate concentrations using the com-parison of AUCs. However, the comparison of valuesat each sampling time showed that, at 30 min post-injection the blood bicarbonate concentration was lower,although not significantly, in the 75% group versusthe solvent group. Our results are in agreement withthose previously reported by Bakima and colleagues(Bakima et al., 1989) who administered intravenousdichlorvos to French alpine goats followed by atropine5–10 min later. Within 2 min of dichlorvos administra-tion, all the goats showed acute respiratory distress.Dynamic compliance decreased while pulmonary resis-tance significantly increased. However, neither minuteventilation, nor arterial oxygen or PaCO2 were sig-nificantly altered. Atropine treatment reversed all theclinical and functional parameters. Similarly, Rickett andcoworkers (Rickett et al., 1986) examined the effectsof soman, sarin, tabun, and VX in cats. At the time ofrespiratory arrest, PaCO2 and PaO2 varied little fromcontrols for each of the four agents. However, ourresults contrasted with those of Stefanovic and cowork-ers showing the presence of respiratory distress in thedichlorvos-treated rats (1.3 LD50), in comparison to con-trols (Stefanovic et al., 2006). These authors reported asignificant decrease in the pH, a significant decrease inthe PaO2, and a significant increase in the PaCO2. Dif-ferences with our results could be related to differences
Autho
r's
pers
onal
co
py
48 A.F. Villa et al. / Toxicology 232 (2007) 37–49
in the organophosphate, the dose, and administrationprotocol.
Four of eight rats studied using arterial blood gasesafter a 75% LD50 dose died during the procedure. Webelieve there are two possible explanations for thisobservation. First, the effects of anaesthesia and surgicalplacement of arterial lines may have effectively loweredthe lethal dose. On the other hand, the results of arterialblood gases collected in these animals suggest theonset of incompletely compensated metabolic acidosis(Fig. 3). It should be noted that only one animal hadan increase in PaCO2 before death while there wasa progressive decrease in PaCO2 in the three others.Furthermore, in spite of lower pH and PaCO2, thePaO2 remained within the upper limit of the normalrange while breathing room air. Thus, the deathscannot be attributed to hypoxia. Further insight on themechanisms of death in these animals would requirethe assessment of hemodynamic parameters and plasmalactate concentrations.
We studied the effects of atropine in the 75%group. A 10 mg/kg dose of atropine sulfate adminis-tered subcutaneously 30 min after paraoxon completelyand definitively corrected the paraoxon-induced impair-ment of the ventilatory pattern. Regarding the arterialblood gases, atropine did not induce any significanteffects. Animals in the 50 and 75% LD50 dose exhib-ited clinical findings suggestive of both muscarinicsyndrome and nicotinic syndrome. In contrast, thealteration of ventilation at rest without impairment ofarterial blood gases, the lack of apnea, as well asthe complete and sustained effect of atropine sup-ported the hypothesis of primarily muscarinic effectson the respiratory system. Thus, these data sug-gested that clinical examination does not allow anyassumption about the mechanisms, muscarinic and/ornicotinic, of impairment of ventilation. The presentresults obtained in rats supported the assumption thatmale Sprague–Dawley rats may be more sensitive toparaoxon than humans as both muscarinic and nico-tinic signs were observed with a moderate decrease inwhole blood cholinesterase activity in comparison withthat observed in humans.
Our study suffers from a number of limitations. Westudied the effects of paraoxon only. Thus, we cannotassume that these results can be extended without cautionto other compounds. A recent prospective study showedsignificant differences of frequency as well as severity ofrespiratory failure in humans self-poisoned with chlor-pyrifos, fenthion or dimethoate (Eddleston et al., 2005).Rats are not the species having ventilation at rest the mostsimilar to that of humans. Thus, extrapolation of our data
to paraoxon effects in humans may not be justified. Fur-thermore, we used male rats, while sex-dependency ofparaoxon respiratory effects were reported in guinea pigs(Segura et al., 1999). Thus, paraoxon effects on ventila-tion at rest in females remain to be determined. Finally,in our study, the duration of observation was limited to210 min after injection. Thus, the late and even delayedeffects of toxic doses of paraoxon on ventilation at restremain unknown. We observed only a moderate decreasein whole blood acetylcholinesterase activity. However inrat diaphragm muscles, neuromuscular dysfunction wasnot observed until 70% of acetylcholinesterase activitywas inhibited (Eyer, 2003). Similarly, in organophos-phate poisoned humans, Thiermann and coworkersshowed that cholinergic signs subsided when acetyl-cholinesterase activity was above 20% of the normal(Thiermann et al., 1999). We use atropine sulfate and oneimportant limitation is that atropine may cross the brainblood barrier. Thus, disruption of ventilatory changes byatropine dose not necessarily indicate that it is periph-erally mediated, sparing the respiratory control centres.Methyl-atropine, an antimuscarinic that does not enterthe central nervous system would have been useful here.In conclusion, the injection of 50 and 75% of the sub-cutaneous LD50 of paraoxon induced overt poisoningin male Sprague–Dawley rats and significantly impairedventilation at rest without inducing respiratory failure.The impairment of the ventilatory pattern induced bythe 75% LD50 was completely reversed with a singledose of atropine suggesting that muscarinic effects werethe primary mechanism of alteration of ventilation atrest.
Conflict of interest
None.
Acknowledgements
We are indebted to Drs M. Bonora (Inserm E213,Croissance et Reparation du Poumon, Hopital SaintAntoine, Bat Raoul Kourilsky, 184 rue du FaubourgSaint Antoine 75571 Paris cedex 12) and A. Foutz(Neurobiologie Genetique et Integrative, Institut deNeurobiologie Alfred Fessard, C.N.R.S., 91198 Gis-sur-Yvette cedex France) for teaching us whole bodyplethysmography. Dr Bonora kindly accepted to reviewthe part of the manuscript devoted to whole body plethys-mography. This study was supported in part by SERBLaboratories (75020 Paris, France).

Autho
r's
pers
onal
co
py
A.F. Villa et al. / Toxicology 232 (2007) 37–49 49
Appendix A. List of abbreviations
AUC Area under the curveCNRS Centre National de la Recherche Scientifiquef Respiratory frequencyHCO3
− Blood bicarbonate concentrationLD50 Lethal dose 50PaCO2 Partial pressure of carbon dioxide in arterial bloodPaO2 Partial pressure of oxygen in arterial bloodpHa Arterial pHS.E.M. Standard error of the meanTE Expiratory timeTI Inspiratory timeTI/TTOT Ratio of inspiratory time to total timeTTOT Total timeUV UltravioletVE Minute ventilationVT Tidal volumeVT/TI Ratio of tidal volume to inspiratory time
References
Aas, P., Veiteberg, T.A., Fonnum, F., 1987. Acute and sub-acuteinhalation of an organophosphate induce alteration of cholinergicmuscarinic receptors. Biochem. Pharmacol. 36, 1261–1266.
Anzueto, A., deLemos, R.A., Seidenfeld, J., Moore, G., Hamil, H.,Johnson, D., Jenkinson, S.G., 1990. Acute inhalation toxicity ofsoman and sarin in baboons. Fundam. Appl. Toxicol. 14, 676–687.
Augustinsson, K.B., Eriksson, H., Faijersson, Y., 1978. A newapproach to determining cholinesterase activities in samples ofwhole blood. Clin. Chim. Acta 89, 239–252.
Bakima, M., Baudet, H.M., Lekeux, P., Lomba, F., 1989. Respira-tory and pulmonary haemodynamic changes during experimentalorganophosphate poisoning in goats. Vet. Res. Commun. 13,127–133.
Bardin, P.G., van Eeden, S.F., Joubert, J.R., 1987. Intensive care man-agement of acute organophosphate poisoning. A 7-year experiencein the western Cape. S. Afr. Med. J. 72, 593–597.
Bartlett Jr., D., Tenney, S.M., 1970. Control of breathing in experimen-tal anemia. Respir. Physiol. 10, 384–395.
Bonora, M., Bernaudin, J.F., Guernier, C., Brahimi-Horn, M.C., 2004.Ventilatory responses to hypercapnia and hypoxia in consciouscystic fibrosis knockout mice Cftr. Pediatr. Res. 55, 738–746.
Bruce, R.D., 1985. An up-and-down procedure for acute toxicity test-ing. Fundam. Appl. Toxicol. 5, 151–157.
Bruce, R.D., 1987. A confirmatory study of the up-and-down methodfor acute oral toxicity testing. Fundam. Appl. Toxicol. 8, 97–100.
Coudray-Lucas, C., Prioux-Guyonneau, M., Tassel, A., Coq, H.M.,Cohen, Y., Wepierre, J., 1981. Influence of intoxication by anti-cholinesterase agents on core temperature in rats: relationshipsbetween hypothermia and acetylcholinesterase inhibition in differ-ent brain areas. Acta Pharmacol. Toxicol. (Copenh.) 49, 215–222.
Delaunois, A., Gustin, P., Ansay, M., 1992. Altered capillary fil-tration coefficient in parathion- and paraoxon-induced edema inisolated and perfused rabbit lungs. Toxicol. Appl. Pharmacol. 116,161–169.
Dixon, W.J., 1991. Staircase bioassay: the up-and-down method. Neu-rosci. Biobehav. Rev. 15, 47–50.
Dixon, W.J., Mood, A.M., 1948. A method for obtaining and analysingsensitivity data. J. Am. Stat. Assoc. 43, 109–126.
Drabkin, D.L., 1949. A simplified technic for a large crystallisation ofhuman hemoglobin. Arch. Biochem. 21, 224–227.
Durham, W.F., Hayes Jr., W.J., 1962. Organic phosphorus poisoningand its therapy. With special reference to modes of action andcompounds that reactivate inhibited cholinesterase. Arch. Environ.Health 5, 21–47.
Eddleston, M., Eyer, P., Worek, F., Mohamed, F., Senarathna, L., vonMeyer, L., Juszczak, E., Hittarage, A., Azhar, S., Dissanayake, W.,Sheriff, M.H., Szinicz, L., Dawson, A.H., Buckley, N.A., 2005.Differences between organophosphorus insecticides in human self-poisoning: a prospective cohort study. Lancet 366, 1452–1459.
Edery, H., Berman, H.A., 1985. Yohimbine antagonism of the vasode-pression elicited by organophosphates applied on ventral medullaoblongata. J. Auton Nerv. Syst. 14, 229–238.
Eyer, P., 2003. The role of oximes in the management of organophos-phorus pesticide poisoning. Toxicol. Rev. 22, 165–190.
Foutz, A.S., Boudinot, E., Denavit-Saubie, M., 1987. Central res-piratory depression induced by acetylcholinesterase inhibition:involvement of anaesthesia. Eur. J. Pharmacol. 142, 207–213.
Gillis, R.A., Walton, D.P., Quest, J.A., Namath, I.J., Hamosh, P.,Dretchen, K.L., 1988. Cardiorespiratory effects produced by acti-vation of cholinergic muscarinic receptors on the ventral surfaceof the medulla. J. Pharmacol. Exp. Ther. 247, 765–773.
Jeyaratnam, J., 1990. Acute pesticide poisoning: a major global healthproblem. World Health Stat. Q. 43, 139–144.
Johnson, D.D., Wilcox, W.C., 1975. Studies on the mechanism of theprotective and antidotal actions of diazepam in organophosphatepoisoning. Eur. J. Pharmacol. 34, 127–132.
Lerman, Y., Gutman, H., 1988. The use of respiratory stimulants inorganophosphates’ intoxication. Med. Hypotheses 26, 267–269.
Lipp, J.A., 1976. Effect of atropine upon the cardiovascular systemduring soman-induced respiratory depression. Arch. Int. Pharma-codyn. Ther. 220, 19–27.
Rickett, D.L., Glenn, J.F., Beers, E.T., 1986. Central respiratory effectsversus neuromuscular actions of nerve agents. Neurotoxicology 7,225–236.
RTECS®, 2005. Registry of Toxic Effects of Chemical Substances.Canadian Centre for Occupational Health and Safety (CCOHS),MDL Information Systems, Inc., Hamilton, Canada.
Segura, P., Chavez, J., Montano, L.M., Vargas, M.H., Delaunois,A., Carbajal, V., Gustin, P., 1999. Identification of mechanismsinvolved in the acute airway toxicity induced by parathion. NaunynSchmiedebergs Arch. Pharmacol. 360, 699–710.
Stefanovic, D., Antonijevic, B., Bokonjic, D., Stojiljkovic, M.P., Milo-vanovic, Z.A., Nedeljkovic, M., 2006. Effect of sodium bicarbonatein rats acutely poisoned with dichlorvos. Basic Clin. Pharmacol.Toxicol. 98, 173–180.
Tallarida, R., Murray, R.B., 1981. Area Under a Curve: Simpson’s Ruleand Trapezoidal Rule. Manual of Pharmacologic Calculations withComputer Programs. Springer-Verlag, New York, pp. 47–49.
Thiermann, H., Szinicz, L., Eyer, F., Worek, F., Eyer, P., Felgenhauer,N., Zilker, T., 1999. Modern strategies in therapy of organophos-phate poisoning. Toxicol. Lett. 107, 233–239.
Worek, F., Kleine, A., Falke, K., Szinicz, L., 1995. Arrhythmias inorganophosphate poisoning: effect of atropine and bispyridiniumoximes. Arch. Int. Pharmacodyn. Ther. 329, 418–435.
Yamashita, M., Tanaka, J., Ando, Y., 1997. Human mortality inorganophosphate poisonings. Vet. Hum. Toxicol. 39, 84–85.