author's personal copy · extent. the fmlp-induced shedding caused a reduction in glycocalyx...
TRANSCRIPT

This article appeared in a journal published by Elsevier. The attachedcopy is furnished to the author for internal non-commercial researchand education use, including for instruction at the authors institution
and sharing with colleagues.
Other uses, including reproduction and distribution, or selling orlicensing copies, or posting to personal, institutional or third party
websites are prohibited.
In most cases authors are permitted to post their version of thearticle (e.g. in Word or Tex form) to their personal website orinstitutional repository. Authors requiring further information
regarding Elsevier’s archiving and manuscript policies areencouraged to visit:
http://www.elsevier.com/copyright

Author's personal copy
Regular Article
Composition of the endothelial glycocalyx and its relation to its thickness anddiffusion of small solutes
Lujia Gao, Herbert H. Lipowsky ⁎Department of Bioengineering, The Pennsylvania State University, University Park, PA 16802, USA
a b s t r a c ta r t i c l e i n f o
Article history:Received 26 April 2010Revised 13 June 2010Accepted 14 June 2010Available online 21 June 2010
Keywords:GlycocalyxGlycosaminoglycansGlycocalyx thicknessDiffusion coefficientLectin bindingfMLPInflammation
The endothelial glycocalyx is well endowed with the glycosaminoglycans (GAGs) heparan sulfate,chondroitin sulfate and hyaluronan. The current studies aimed to assess the relative contributions of eachof these GAGs to the thickness and permeability of the glycocalyx layer by direct enzymatic removal of eachusing micropipettes to infuse heparinase, chondroitinase and hyaluronidase into post-capillary venules ofthe intestinal mesentery of the rat. The relative losses of GAGs due to enzymatic removal were comparedwith stimulated shedding of glycans induced by superfusing the mesentery with 10−7 M fMLP. Thickness ofthe glycocalyx was assessed by infiltration of the glycocalyx with circulating FITC labeled 70 kDa dextran(Dx70) and measuring the distance from the dye front to the surface of the endothelium (EC), whichaveraged 463 nm under control conditions. Reductions in thickness were 43.3%, 34.1% and 26.1% followingheparinase, chondroitinase and hyaluronidase, respectively, and 89.7% with a mixture of all three enzymes.Diffusion coefficients of FITC in the glycocalyx were determined using a 1-D diffusion model. By comparisonof measured transients in radial intensity of a bolus of FITC with that of a computational model a diffusioncoefficient D was obtained. Values of D were obtained corresponding to the thickness of the layerdemarcated by Dx70 (DDx70), and a smaller sublayer 173 nm above the EC surface (D173), prior to andfollowing enzyme infusion and superfusion with fMLP. The magnitude of DDx70 was twice that of D173
suggesting that the glycocalyx is more compact near the EC surface. Chondroitinase and hyaluronidasesignificantly increased both DDx70 and D173. However, heparinase decreased DDx70, and did not induce anysignificant change for the D173. These observations suggest that the three GAGs are not evenly distributedthroughout the glycocalyx and that they each contribute to permeability of the glycocalyx to a differingextent. The fMLP-induced shedding caused a reduction in glycocalyx thickness (which may increasepermeability) and as with heparinase, decreased the diffusion coefficient of solutes (which may decreasepermeability). This behavior suggests that the removal of heparan sulfate may cause a collapse of theglycocalyx which counters decreases in thickness by compacting the layer to maintain a constant resistanceto filtration.
© 2010 Elsevier Inc. All rights reserved.
Introduction
The luminal surface of endothelial cells is endowed with acarbohydrate-rich surface layer referred to as the endothelialglycocalyx. It has been shown to be an important barrier totransvascular exchange of water and solutes (Adamson, 1990;Henry and Duling, 1999) and sieving of plasma-borne macromole-cules (Huxley and Williams, 2000; van Haaren et al., 2003; Vink andDuling, 2000). The glycocalyx has been shown to be a physiologicallysignificant binding site for antithrombin III, tissue factor pathwayinhibitors, lipoprotein lipase, vascular endothelial growth factor,fibroblast growth factor, and extracellular superoxide dismutase(Reitsma et al., 2007). The glycocalyx has also been shown to serve
as a barrier to leukocyte–endothelium adhesion (Mulivor andLipowsky, 2002), shear stress sensor and regulator of mechanotrans-duction (Florian et al., 2003).
Studies have explored the fine structure of the glycocalyx and itspotential impact on permeability using techniques of electronmicroscopy (Squire et al., 2001; Van den Berg et al., 2003), intravitalmicroscopy (Henry and Duling, 1999; Vink and Duling, 2000) andmathematical modeling (Stace and Damiano, 2001; Sugihara-Sekiet al., 2008; Weinbaum et al., 2003). It has been suggested that theglycocalyx is a porous layer composed of a matrix of molecules thatare arranged in a regular pattern (Squire et al., 2001). The mostprominent components of the glycocalyx are the glycosaminoglycans(GAGs) heparan sulfate (HS), chondroitin sulfate (CS) and hyaluronan(HA). Both HS and CS carry negatively charged sulfate groups and arecovalently linked to transmembrane proteoglycans (PGs). The GAG-carrying ability of PGs and glycoproteins can be variable (Reitsmaet al., 2007) and carry multiple chains of HS and CS. The ratio of HS to
Microvascular Research 80 (2010) 394–401
⁎ Corresponding author. Department of Bioengineering, Penn State University, 205Hallowell Building, University Park, PA 16802, USA. Fax: +1 814 863 0490.
E-mail address: [email protected] (H.H. Lipowsky).
0026-2862/$ – see front matter © 2010 Elsevier Inc. All rights reserved.doi:10.1016/j.mvr.2010.06.005
Contents lists available at ScienceDirect
Microvascular Research
j ourna l homepage: www.e lsev ie r.com/ locate /ymvre
Author's personal copy
CS chains has been shown to be on the order of 4:1, respectively(Rapraeger, 1989) and their sulfation level may change depending onthe physiological micro-environment (Rapraeger, 1989; Vogl-Willisand Edwards, 2004). HA is the only GAG that has no sulfate groups andis not covalently linked to any proteins (Laurent and Fraser, 1992).
Both HS and CS are synthesized inside the Golgi apparatus,whereas HA synthases (HASs) are plasma membrane associated suchthat newly synthesized HA strands are extruded outside the cell(Prehm, 1989). There are several ways for HA to be integrated into theglycocalyx. The primary HA receptor in the glycocalyx is thought to beCD44 (Aruffo et al., 1990) along with HA binding protein (Toole,1990). HA chains can be self-assembled by steric interaction intorandom fibrous networks (Scott and Heatley, 1999). Besides GAG-carrying proteoglycans, blood-borne soluble proteins are also impor-tant components of the glycocalyx, shown experimentally to bedecreased by removing plasma proteins (Adamson and Clough, 1992;Huxley and Curry, 1991). Under normal physiological conditions, thestructure of the glycocalyx layer is fairly stable but its molecularcontents represent a dynamic balance between biosynthesis of newglycans and shear dependent removal of existing constituents(Mulivor and Lipowsky, 2004).
The endothelial glycocalyx has been shown to be shed in responseto inflammation (Henry and Duling, 2000; Mulivor and Lipowsky,2004), hyperglycemia (Zuurbier et al., 2005), endotoxemia and septicshock (Hofmann-Kiefer et al., 2009), presence of oxidized LDL(Constantinescu et al., 2001), TNFα (Chappell et al., 2009), atrialnatriuretic peptide (Bruegger et al., 2005), abnormal blood shearstress (Gouverneur et al., 2006; Haldenby et al., 1994), ischemia-reperfusion injury (Mulivor and Lipowsky, 2004), and during by-passsurgery (Rehm et al., 2007; Svennevig et al., 2008). These observationshave lead to the hypothesis of an underlying connection betweenintegrity of the glycocalyx and vascular homeostasis (Mulivor andLipowsky, 2004; Zuurbier et al., 2005). The exact cellular signalingcascades between these pathological conditions and shedding of theglycocalyx are not yet fully understood. However, evidence suggeststhat several key enzymes, such as the matrix metalloproteases, aredirectly responsible for shedding of the glycocalyx components(Mulivor and Lipowsky, 2009).
The present studies were undertaken to explore the relativecontribution of each of these three principal GAGs to the apparentthickness of the glycocalyx and its permeability to small solutes inpost-capillary venules of the rat intestinal mesentery. Thickness of theglycocalyx (δ) was assessed using established techniques of macro-molecule exclusion (Vink and Duling, 1996) and permeability to smallsolutes (namely the fluorescent dye FITC) was determined by directmeasurement of its diffusion through the EC surface layer and fittingthe observed variations to a mathematical model based upon anapparent diffusion coefficient, D. Changes in δ and Dwere determinedfollowing enzymatic removal of selected GAGs by direct infusion ofheparinase, chondroitinase and hyaluronidase in post-capillaryvenules using micropipettes.
Materials and methods
Animal preparation and intravital microscopy
Adequate measures were taken to minimize pain or discomfort,and all experiments were conducted in accordance with internationalstandards on animal welfare and compliant with local and nationalregulations. MaleWistar rats, weighing 200–300 g, were anesthetizedusing Inactin (135 mg/kg, i.p.). A tracheostomy was performed tofacilitate spontaneous respiration. The right internal jugular vein wascannulated with PE50 tubing for systemic administration of anes-thetic. Arterial blood pressure was monitored by means of a cannulain the left carotid artery connected to a strain-gage pressuretransducer and monitored to assess depth of anesthesia. Rectal
temperature was monitored to control a heating pad using a closed-loop automatic controller set to maintain core body temperature at37° C. The terminal ileum was exteriorized through a mid-lineabdominal incision and draped over a clear glass pedestal for viewingthe mesentery by intravital microscopy. Surrounding tissues werecovered with sterile cotton gauze and irrigated with warmed (37° C)Hepes-buffered (pH=7.4) Ringer's solution. Post-capillary venuleswere selected for microscopic observation under bright field orfluorescent epi-illumination, using a Zeiss 40x/0.75NA water immer-sion objective. Video recordings of post-capillary venules weredigitized with a PCO 1600 digital CCD camera (PCO Imaging,Germany) at a spatial resolution of 1600×1200 pixels with a depthof 14 bits for subsequent analysis. The effective magnification yieldeda pixel spacing of 17.3 pixels/μm. Calibration studies under fluores-cence illumination revealed that pixel intensity was linearly related tofluorophore concentration within a 5% RMS error.
Cannulation of post-capillary venules
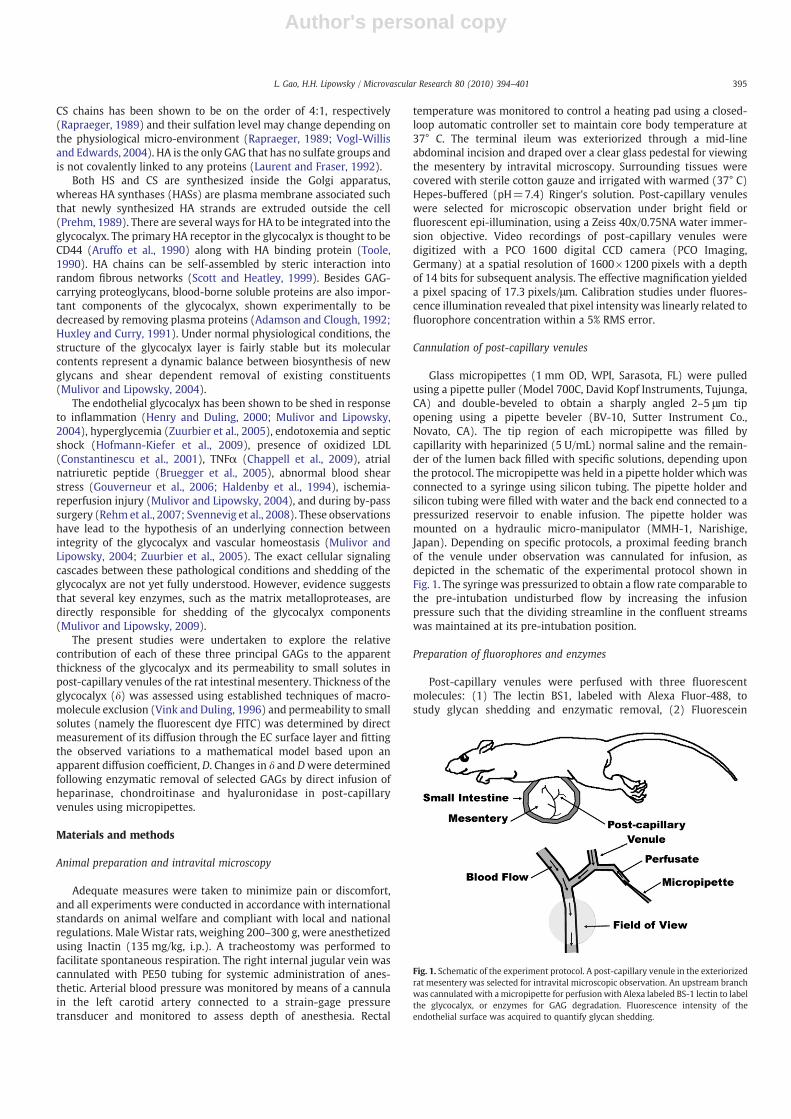
Glass micropipettes (1 mm OD, WPI, Sarasota, FL) were pulledusing a pipette puller (Model 700C, David Kopf Instruments, Tujunga,CA) and double-beveled to obtain a sharply angled 2–5 μm tipopening using a pipette beveler (BV-10, Sutter Instrument Co.,Novato, CA). The tip region of each micropipette was filled bycapillarity with heparinized (5 U/mL) normal saline and the remain-der of the lumen back filled with specific solutions, depending uponthe protocol. The micropipette was held in a pipette holder which wasconnected to a syringe using silicon tubing. The pipette holder andsilicon tubing were filled with water and the back end connected to apressurized reservoir to enable infusion. The pipette holder wasmounted on a hydraulic micro-manipulator (MMH-1, Narishige,Japan). Depending on specific protocols, a proximal feeding branchof the venule under observation was cannulated for infusion, asdepicted in the schematic of the experimental protocol shown inFig. 1. The syringe was pressurized to obtain a flow rate comparable tothe pre-intubation undisturbed flow by increasing the infusionpressure such that the dividing streamline in the confluent streamswas maintained at its pre-intubation position.
Preparation of fluorophores and enzymes
Post-capillary venules were perfused with three fluorescentmolecules: (1) The lectin BS1, labeled with Alexa Fluor-488, tostudy glycan shedding and enzymatic removal, (2) Fluorescein
Fig. 1. Schematic of the experiment protocol. A post-capillary venule in the exteriorizedrat mesentery was selected for intravital microscopic observation. An upstream branchwas cannulated with amicropipette for perfusion with Alexa labeled BS-1 lectin to labelthe glycocalyx, or enzymes for GAG degradation. Fluorescence intensity of theendothelial surface was acquired to quantify glycan shedding.
395L. Gao, H.H. Lipowsky / Microvascular Research 80 (2010) 394–401

Author's personal copy
isothiocyanate (FITC) labeled 70 kDa dextran (Dx70), to obtain ameasure of the thickness of the glycocalyx, and free FITC, fordetermination of its diffusion coefficient within the glycocalyx. Thelectin BS1 (L2380, Sigma, St. Louis, MO) was conjugated with AlexaFluor 488 (A20000, Invitrogen, Eugene, OR) to yield 2.7 mole offluorophore per mole BS1, and its concentration adjusted to 1% in PBS.FITC–Dextran 70 kDa (FD-70S, Sigma) was dissolved in PBS to make a0.1% solution. Prior to each experiment, FITC–Dx70 solution wascentrifuged at 16000g for 5 min to remove particulates and thenfiltered through a 0.26 μm polycarbonate syringe filter. FITC (F7250,Sigma) was solubilized (1%) in PBS and the pH adjusted to 7.4 fordirect infusion in post-capillary venules.
Enzymes used to cleave specific GAGs included heparinase III(50 U/mL in PBS, H8891, Sigma), chondroitinase ABC (10 U/mL in PBS,C2905, Sigma) and hyaluronidase (3000 U/mL in PBS, H3631, Sigma).All enzyme solutions were applied to selected post-capillary venulesfor a 10 min perfusion via micropipette. To ensure maximal digestion,in separate studies concentration and perfusion duration weredoubled to demonstrate that no significant additional effects occurredfor all three enzymes (data not shown).
Measurement of BS1-GAG binding
To examine enzymatic removal of components of the glycocalyx,BS1 was used, which has been shown to bind to all three principalGAGs, HS, CS and HA (Schnitzer et al., 1990). BS1-Alexa solution wasinfused via micropipettes for 10 min, following which the micropi-pette was withdrawn and normal blood flow allowed to resume.Following washout of non-bound fluorophore, the venule was re-intubatedwith amicropipette for perfusionwith enzyme solutions for10 min to cleave specific GAGs. Video recordings of BS1 bound to theEC surface were taken 20–30 min following BS1 infusion, followingwhich recordings were taken again prior to 10 min infusion ofenzymes. A third set of video recordings was taken 10 min followingcompletion of the enzyme infusion, which occurred on average 30–40 min after the end of the BS1 perfusion. Control measurements inthe absence of enzyme treatment were taken 40 min following BS1perfusion to obtain a non-stimulated reference for subsequentmeasurements.
The method for quantifying the extent of BS1-Alexa binding to theEC is illustrated in Fig. 2 for a representative post-capillary venule inboth brightfield (Fig. 2A) and fluorescence (Fig. 2B) illumination. Inthis particular venule, the infused BS1-Alexa solution stream wasconfined to the left venular wall (Fig. 2B). The luminal surface of theEC was identified as the outer edge of the dark refractive band in thebrightfield image. BS1 staining appears on the luminal side of the EC. Ameasurement line was drawn along the center of the fluorescent bandand the average fluorescence intensity was recorded in a region ofinterest along this line bounded by the edges of the band, whichtypically spanned about 500 nm on either side of the line.
Measurement of glycocalyx thickness using FITC–Dx70
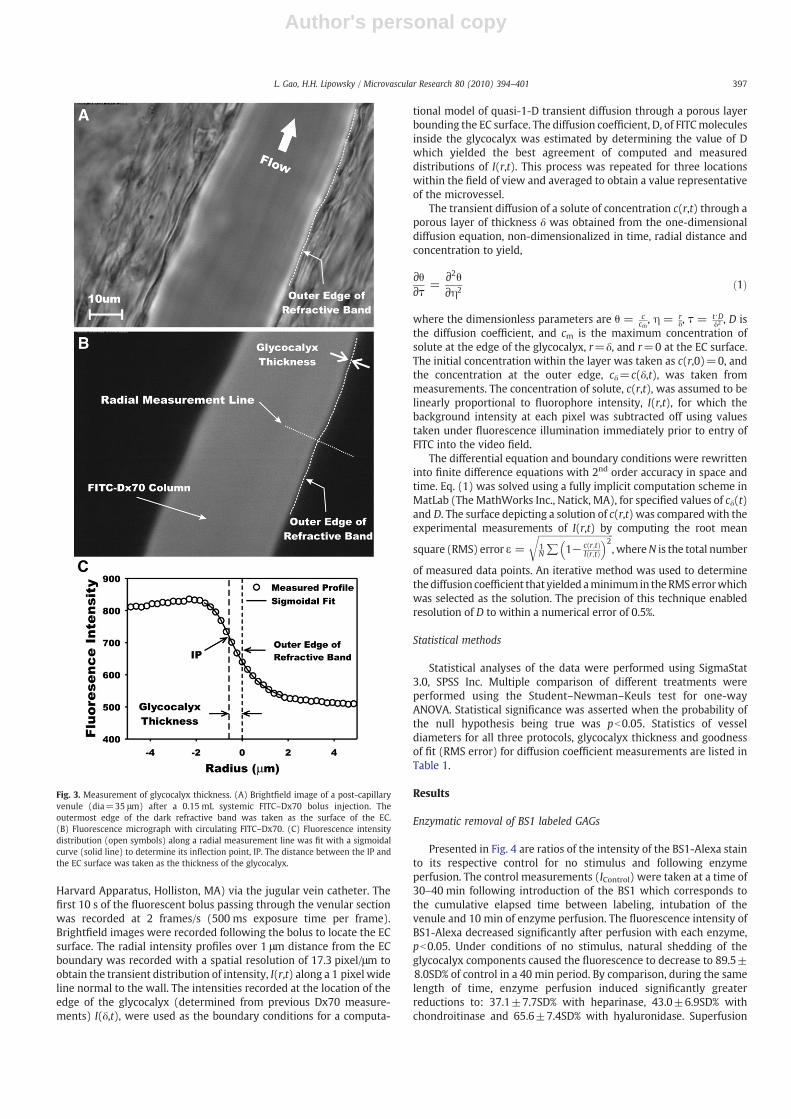
The thickness of the glycocalyx layer was estimated by measuringthe distance between the luminal surface of the EC and the edge ofcirculating FITC–Dx70, introduced into the systemic circulation (0.1%in 0.15 mL) via the jugular vein cannula. After completion of the bolusinfusion, brightfield images were taken of selected post-capillaryvenules, in a focal plane where the dark refractive band at the ECluminal surface was sharply in focus. The microscope was thenswitched to fluorescence epi-illumination and video scenes of theedge of the FITC–Dx70 dye column were recorded without disturbingthe image alignment with the brightfield image.
The images were analyzed by drawing a line along the EC surfaceunder brightfield (Fig. 3A) and then overlaying this line on thefluorescence image (Fig. 3B). The radial distribution of fluorescence
intensity was then obtained along a radial measurement line with itscenter on, and normal to, the EC boundary line, as shown in Fig. 3B.This radial measurement line was moved along the EC boundary lineto acquire a radial distribution at each pixel of the boundary line andcalculate an average radial intensity profile for up to 1600 locationsalong the boundary (symbols in Fig. 3C). The radial distribution ofintensity was then fit with a 5-parameter sigmoidal curve,I = I0 + a 1 + e
r−r0b
� �−c(solid line in Fig. 3C). The inflection point of
this curve (IP) was calculated from the curve fit parameters asIP = r0 + b⋅ ln cð Þand taken as the location of the edge of theglycocalyx. The distance between the EC wall and IP was taken asthe thickness of the glycocalyx layer. All image processing andmeasurements were done using ImageJ (NIH, Bethesda, MD).
Diffusion coefficient measurement
The diffusion of a small solute (FITC) through the glycocalyx wascharacterized by measurement of its concentration (fluorescenceintensity) in the radial direction as a function of time near the ECsurface of post-capillary venules. Using measured values of fluores-cence intensity at known distances from the EC as they varied withtime, an effective diffusion coefficient (D) was computed from theequation governing one-dimensional diffusion in a homogenousmedium. Free FITC solution was given as a systemic bolus (0.16 mLat 1.875 mL/min) using a syringe pump (PhD2000 Programmable,
Fig. 2. Fluorescent labeling of the endothelial cell (EC) glycocalyx. (A) Brightfield imageof a post-capillary venule (diameter=40.7 μm). The plasma membrane of the EC wastaken as the outermost edge of the dark refractive band between the EC and plasmalayer. (B) Fluorescence image 10 min following proximal micropipette infusion of BS1-Alexa lectin. In this example fluorescence was confined to the left microvessel wall dueto heterogeneity of network perfusion. Ameasurement line was drawn along the left ECwall and fluorescence intensity was averaged over an area within 0.5 μm on either sideof the measurement line.
396 L. Gao, H.H. Lipowsky / Microvascular Research 80 (2010) 394–401
Author's personal copy
Harvard Apparatus, Holliston, MA) via the jugular vein catheter. Thefirst 10 s of the fluorescent bolus passing through the venular sectionwas recorded at 2 frames/s (500 ms exposure time per frame).Brightfield images were recorded following the bolus to locate the ECsurface. The radial intensity profiles over 1 μm distance from the ECboundary was recorded with a spatial resolution of 17.3 pixel/μm toobtain the transient distribution of intensity, I(r,t) along a 1 pixel wideline normal to the wall. The intensities recorded at the location of theedge of the glycocalyx (determined from previous Dx70 measure-ments) I(δ,t), were used as the boundary conditions for a computa-
tional model of quasi-1-D transient diffusion through a porous layerbounding the EC surface. The diffusion coefficient, D, of FITCmoleculesinside the glycocalyx was estimated by determining the value of Dwhich yielded the best agreement of computed and measureddistributions of I(r,t). This process was repeated for three locationswithin the field of view and averaged to obtain a value representativeof the microvessel.
The transient diffusion of a solute of concentration c(r,t) through aporous layer of thickness δ was obtained from the one-dimensionaldiffusion equation, non-dimensionalized in time, radial distance andconcentration to yield,
∂θ∂τ =
∂2θ∂η2 ð1Þ
where the dimensionless parameters are θ = ccm, η = r
δ, τ = t⋅Dδ2 , D is
the diffusion coefficient, and cm is the maximum concentration ofsolute at the edge of the glycocalyx, r=δ, and r=0 at the EC surface.The initial concentration within the layer was taken as c(r,0)=0, andthe concentration at the outer edge, cδ=c(δ,t), was taken frommeasurements. The concentration of solute, c(r,t), was assumed to belinearly proportional to fluorophore intensity, I(r,t), for which thebackground intensity at each pixel was subtracted off using valuestaken under fluorescence illumination immediately prior to entry ofFITC into the video field.
The differential equation and boundary conditions were rewritteninto finite difference equations with 2nd order accuracy in space andtime. Eq. (1) was solved using a fully implicit computation scheme inMatLab (The MathWorks Inc., Natick, MA), for specified values of cδ(t)and D. The surface depicting a solution of c(r,t) was compared with theexperimental measurements of I(r,t) by computing the root mean
square (RMS) error ε =
ffiffiffiffiffiffiffiffiffiffiffiffiffiffiffiffiffiffiffiffiffiffiffiffiffiffiffiffiffiffiffiffiffiffi1N∑ 1− c r;tð Þ
I r;tð Þ� �2
r, whereN is the total number
of measured data points. An iterative method was used to determinethediffusion coefficient that yielded aminimumin theRMSerrorwhichwas selected as the solution. The precision of this technique enabledresolution of D to within a numerical error of 0.5%.
Statistical methods
Statistical analyses of the data were performed using SigmaStat3.0, SPSS Inc. Multiple comparison of different treatments wereperformed using the Student–Newman–Keuls test for one-wayANOVA. Statistical significance was asserted when the probability ofthe null hypothesis being true was pb0.05. Statistics of vesseldiameters for all three protocols, glycocalyx thickness and goodnessof fit (RMS error) for diffusion coefficient measurements are listed inTable 1.
Results
Enzymatic removal of BS1 labeled GAGs
Presented in Fig. 4 are ratios of the intensity of the BS1-Alexa stainto its respective control for no stimulus and following enzymeperfusion. The control measurements (IControl) were taken at a time of30–40 min following introduction of the BS1 which corresponds tothe cumulative elapsed time between labeling, intubation of thevenule and 10 min of enzyme perfusion. The fluorescence intensity ofBS1-Alexa decreased significantly after perfusion with each enzyme,pb0.05. Under conditions of no stimulus, natural shedding of theglycocalyx components caused the fluorescence to decrease to 89.5±8.0SD% of control in a 40 min period. By comparison, during the samelength of time, enzyme perfusion induced significantly greaterreductions to: 37.1±7.7SD% with heparinase, 43.0±6.9SD% withchondroitinase and 65.6±7.4SD% with hyaluronidase. Superfusion
Fig. 3. Measurement of glycocalyx thickness. (A) Brightfield image of a post-capillaryvenule (dia=35 μm) after a 0.15 mL systemic FITC–Dx70 bolus injection. Theoutermost edge of the dark refractive band was taken as the surface of the EC.(B) Fluorescence micrograph with circulating FITC–Dx70. (C) Fluorescence intensitydistribution (open symbols) along a radial measurement line was fit with a sigmoidalcurve (solid line) to determine its inflection point, IP. The distance between the IP andthe EC surface was taken as the thickness of the glycocalyx.
397L. Gao, H.H. Lipowsky / Microvascular Research 80 (2010) 394–401

Author's personal copy
with 10−7 M fMLP for 10 min resulted in a reduction in intensity to64.5±7.6SD%. This decrease was consistent with previous studiesusing BS1-FITC and superfusion with 10−7 M fMLP for 10 min(Mulivor and Lipowsky, 2004). Treating the glycocalyx with hepar-inase or chondroitinase leads to a significantly greater reduction inBS1 label compared with fMLP, but hyaluronidase did not.
Thickness of the glycocalyx layer
The apparent thickness of the glycocalyx estimated by Dx70exclusion is shown in Fig. 5A for control conditions (no treatment),enzymatic removal of HS, CS andHA and superfusionwith fMLP. Undercontrol condition, the Dx70 exclusion thickness averaged 463.1±146.1 SD nm, which was consistent with prior measurements usingDx70 (Vink and Duling, 2000). Enzymatic GAG shedding by hepar-inase, chondrotinase and hyaluronidase decreased the barrier thick-ness to 234.0±106.0 SD nm, 285.6±145.2 SD nm and 303.3±165.8SD nm, respectively. The greater decrease in thickness with hepar-inase, compared to chondroitinase and hyaluronidase, was notsignificantly different from the thickness corresponding to these twoenzymes.When all threeGAGswere removedby amixture of the threeenzymes (same concentration as used individually) the barrierthickness decreased to 51.8±41.3 SD nm.
The fractional decreases in thickness (δTreated/δControl) are illustrat-ed in Fig. 5B. Individually, the reductions in thickness for each enzymewere not significantly different from the 28% reduction incurred by
superfusionwith fMLP. Themixture of enzymes removednearly 90%ofthe barrier thickness, i.e. δTreated/δControl=0.103±0.07 SD.
Diffusion coefficient of FITC in the glycocalyx
Typical results for comparison of the computed and measuredtransient diffusion of FITC into the glycocalyx are shown in Fig. 6. Theshaded region shows the radial concentration profile with time,
Table 1Statistics of vessel diameters and curve fits determining the boundary of the glycocalyx and the diffusion coefficient of FITC.
Treatment Control Heparinase Chondroitinase Hyaluronidase Enzyme mix fMLP
(A) BS1 cleavage assay n 12 8 8 12 11Diameter (μm) 42.6±6.19 45.4±8.1 47.2±8.3 44.6±7.1 42.1±11.4
(B) Sigmoidal fits of FITC–Dx70 radial intensity * n 77 14 17 16 17 13Diameter (μm) 38.3±7.58 37.8±10.3 40.0±8.5 39.9±6.2 36.9±5.7 36.2±5.2
(C) Intensity–distance–timefits for diffusion coefficient calculation
n 10 7 7 8 9Diameter (μm) 25.5±5.9 27.7±8.1 38.3±10.8 35.7±13.3 27.4±7.4RMS error (%) DDx70 35.0±0.9 33.8±0.2% 33.9±0.2 34.5±0.6 34.2±0.4RMS error (%) D173 33.7±0.2% 33.6±0.1% 33.5±0.1% 33.8±0.2% 33.7±0.2%
Data are mean±SD.In each case, all treatments were not statistically significant from control for diameter and goodness of fit.⁎ For all sigmoidal fits, R2=0.9998±0.0001 SD.
Fig. 4. Fluorescence intensity of BS1-Alexa along the endothelial surface of post-capillary venules 30–40 min following proximal infusion of the lectin with amicropipette. Control measurements were taken 10 min prior to each treatment.Intensities were normalized with respect to control, ITreated/IControl. Intensity of thefluorescent stain fell 15% with no stimulus, due to natural shedding of glycans.Following 10 min of enzymatic degradation with heparinase, chondroitinase andhyaluronidase, and superfusion of the mesentery with fMLP, glycan labeling wasreduced significantly compared to natural shedding (no stimulus), *pb0.05.
Fig. 5. Estimation of the thickness of the glycocalyx from the thickness of the barrier toinfiltration of FITC–Dx70. (A) Thickness measurements taken as the distance betweenthe inflection point in the radial intensity profile at the wall and the EC surface, forcontrol (no perfusion) and micropipette perfusion with the indicated enzymes, andsuperfusion with fMLP. (B) Ratio of the post to pre-treatment thickness, δTreated/δControl.The number of observations is given along with the number of post-capillary venules(in parenthesis). All treatments caused a significant decrease (*pb0.05) relative tocontrol measurements.
398 L. Gao, H.H. Lipowsky / Microvascular Research 80 (2010) 394–401

Author's personal copy
computed using the fluorescence intensity-time curve measured atthe edge of the glycocalyx (r=462 nm, control in Fig. 5A). The ECluminal surface is at R=0. Measured fluorescence intensities(symbols) agreed with the computational model to within an RMSerror of 34.6%. The greatest errors in the fit appear to occur near thewall as the concentration of the FITC accumulates at maximal time,and scattered light or possible dye leakage through the wall interfereswith the measurements. In this example, the best fit solution wasobtained for a diffusion coefficient of 2.61×10⁻⁹ cm2/s.
To explore the heterogeneity of the glycocalyx structure, twodifferent boundary conditions were employed for calculation of thediffusion coefficient for all treatments: (a) Using the intensity-timecurve at r=δ, where δwas determined by the Dx70 exclusion, and (b)using the intensity-time curve at 4 pixels from the EC surface(r=173 nm from the EC surface). This latter sublayer represented theminimum number of pixels (thickness) needed to compute thetransient dye concentration profile. Results for computation of Dbased on the Dx70 exclusion thickness (DDx70) are shown in Fig. 7Afor all treatments. Under control conditions (δ=462 nm),DDx70 for FITCequaled 2.30±0.44×10⁻⁹ cm2/s, which was three-orders less than itsfree diffusion coefficient of 2.7×10⁻⁶ cm2/s. After application ofchondroitinase and hyaluronidase, DDx70 increased significantly to3.27±0.89×10⁻⁹ and 3.24±1.28×10⁻⁹ cm2/s, respectively, roughlya 1.4-fold increase. However, decreases were found following hepar-inase (1.37±0.35×10⁻⁹ cm2/s) and fMLP (1.90±0.38×10⁻⁹ cm2/s)treatments.
Diffusion coefficients for the sublayer at 173 nm from the ECsurface (D173) are shown in Fig. 7B. Under control conditions,D173 wason the order of 1×10⁻⁹ cm2/s, which was roughly half of the DDx70,suggesting a more compact sublayer. In contrast, D173 for heparinasetreatment was not significantly different from control (p=0.860),and was only 25% less than that for the Dx70 thickness. Treatmentwith chondroitinase and hyaluronidase resulted in an increase in D173
to on the order of 2×10⁻⁹ cm2/s compared to control. Within thesublayer, the effect of fMLP was similar to that of heparinase. Theserelative changes are addressed in the Discussion. The statistics ofvessels size and goodness of the fits are summarized in Table 1.
Discussion
The present studies have aimed to delineate the relative contribu-tions of the three principal GAGs which serve as a barrier totransvascular exchange ofmacromolecules and leukocyte–endotheliumadhesion. The lability of the glycocalyx has been shown previously inmodels of inflammation by topical application of either the cytokineTNF-α (Henry and Duling, 2000) or the chemoattractant fMLP (Mulivorand Lipowsky, 2004). In the latter case, rapid shedding of glycans wasindicated by a reduction in the bound fluorescent lectin BS1. Given thepermissive nature of lectin binding (Schnitzer et al., 1990) and theincrease of circulatingHA found in response to stimuli such as shear andoxidative stress (Gouverneur et al., 2006) and hyperglycemia (Nieuw-uwdorp et al., 2006), the effectiveness of enzymatically removing theBS1 stained glycocalyx was compared with the acute fMLP response(Fig. 4). The results of these experiments suggest that heparinase,chondroitinase and hyaluronidase are equal to or greater in cleavingtheir respective targets compared with the physiologically inducedshedding by fMLP. Although the binding and staining of lectin to each ofthe GAG species may not be in proportion to GAG concentration, theslightly greater decrease in HS-bound lectin compared to that bound toCS is consistent with prior studies of the greater amounts of HScompared toCS. It has been shown that in the case ofHSandCS bound tosyndecans, there exists one or two CS chains for every four HS chain(Rapraeger and Bernfield, 1985).
Building upon techniques established by Vink and Duling (1996,2000), a measure of the thickness of the glycocalyx was derived fromthe depth of infiltration of Dx70 which was consistent with their
Fig. 6. Radial concentration at the wall of a post-capillary venule following systemicinfusion (jugular vein, i.v.) of a small solute (FITC). Measured fluorescence intensityprofiles (○) were obtained with time, normal to venular wall. The shaded surfacerepresents the solution to the 1-D diffusion model, computed using the measuredintensity-time curve at a distance δ from the wall, determined by the exclusion of FITC–Dx70 (Fig. 5). In this illustrative case, the experimental data and the computationalprediction agreed within an RMS error of 34.6%, and correspond to a diffusioncoefficient for FITC of 2.61×10⁻⁹ cm2/s.
Fig. 7. Calculated diffusion coefficient, D, of FITC in the glycocalyx obtained from amodel of unsteady one-dimensional diffusion normal to the EC surface. (A) Diffusioncoefficient (DDx70) from solution of the diffusion equation based upon time variation ofFITC concentration at a distance from the EC surface equal to the exclusion thickness ofDx70. (B) Diffusion coefficient (D173) assessed for a sublayer 173 nm above the ECsurface. Neither heparinase nor fMLP significantly affected D173. The number ofobservations is given along with the number of post-capillary venules in parentheses.*Significantly different from control, pb0.05.
399L. Gao, H.H. Lipowsky / Microvascular Research 80 (2010) 394–401
Author's personal copy
measurements for the undisturbed surface layer thickness, δ. Priorreports of the effect of hyaluronidase on δ are similar in manyrespects, albeit derived using other methods (systemic infusion vs.direct perfusion of individual microvessels), different species (ham-ster or mouse vs. rat), and/or different classes of microvessels(arterioles, capillaries or venules). Henry and Duling showed thatsystemic infusion of hyaluronidase for 1 h resulted in a 35% reductionin δ in small post-capillary venules (10–15 μm) (Henry and Duling,1999) which was equivalent to the decrease found herein by 10 minof direct perfusion using micropipettes in larger venules (14–60 μm).A similar loss of δ in response to infusion of hyaluronidase wasinferred by the indirect technique of particle image velocimetry byextrapolation of venular velocity profiles in cremaster muscle (Potterand Damiano, 2008). The uniqueness of the present study is itsattempt to make a systematic comparison of the individual contribu-tion of all three GAGs to the barrier thickness in post-capillary venuleswhere physiological shedding of glycans have been shown to governthe adhesion of leukocytes in models of inflammation and ischemia(Mulivor and Lipowsky, 2004).
Enzyme specificity
Interpretation of the effect of each enzyme treatment needs to bemade in light of their specificity for each GAG. It has been shown thatheparinase III only cleaves HS and does not react with CS or HA (Lohseand Linhardt, 1992). However, hyaluronidase can degrade CS andchondroitinase can degrade HA. As a result, the chondroitinase orhyaluronidase treatments may not lead to exclusive degradation of CSor HA. To address the possible cross-reactivity, all three enzymesweremixed and applied to the venular glycocalyx to degrade all threeGAGs, as shown in Fig. 5B. The thickness of the glycocalyx wasreduced dramatically to 10.3% of the control for an 89.7% loss. Bycomparison, the percentage loss in thickness for individual enzymeswas 43.3%, 34.1% and 26.1% for heparinase, chondroitinase andhyaluronidase, respectively. A simple model can be applied toattribute the loss in layer thickness to the fractional reduction ofeach individual GAG by assuming that the loss of each specific GAG isproportional to the decrease in glycocalyx thickness caused by eachspecific enzyme. A set of simultaneous algebraic equations may bewritten if one assumes that the specificity of each enzyme is such that:(1) All enzymatic degradations are maximal, (2) chondrotinase doesnot degrade HA significantly due to the low rate of enzymatic activityagainst HA (Hamai et al., 1997), and (3) hyaluronidase can cross-reactwith CS (Volpi et al., 1995). Based upon the data in Fig. 5, thepercentage loss (PL) of the barrier thickness corresponding to eachenzyme may then be expressed by the following equations:
PLHS = 1−δHeparinase = δControl = 43:3% ð2Þ
PLCS = 1−δChondroitinase = δControl = 34:1% ð3Þ
PLHS + PLCS = 1−δHyaluronidase = δControl = 26:1% ð4Þ
PLHS + PLCS + PLHA = 1−δEnzymeMix = δControl = 89:7% ð5Þ
where PLCS′ refers to the percentage of the thickness reduction due toshedding of CS by hyaluronidase and the percentages on the right handside are from Fig. 5B. Solution of these equations indicates that HS, CSand HA contributed 43.3%, 34.1% and 12.3% respectively to the barrierthickness, and collectively, the three GAGs account for 90% of thebarrier thickness. Hyaluronidase also induced a major 13.8% (PLCS′)drop in barrier thickness through cross-reacting with CS.
Thus, this simplified model suggests that HS provides the greatestcontribution to the barrier thickness of the glycocalyx, followed by CSand HA. However, caution should be taken to interpret the reductionof ‘barrier thickness’ as reduction of ‘glycocalyx thickness.’ It has been
shown that the magnitude of post-hyaluronidase reduction measuredwith Dx70 is similar to that with Dextran 145 kDa, but completelyvanished when using larger molecular weight dextrans of 580 kDa or2000 kDa (Henry and Duling, 1999), suggesting that infiltration ofDx70may follow an increase of porosity, instead of a decrease in layerthickness.
Structural implications
The present results suggest a non-uniformity of GAG distributionthrough the depth of the glycocalyx. In control experiments, thesignificantly lower diffusion coefficient of FITC in the 173 nm thicksublayer compared to the value at the Dx70 exclusion thickness(463 nm) (Fig. 7) may reflect a non-uniform density of the glycocalyx.The difference suggests a denser sublayer that hinders FITC diffusion.The effective diffusion coefficient of small solutes in a porous media isproportional to the free media diffusion coefficient, porosity andconstrictivity, and inversely proportional to the tortuosity of path-ways. In a fibrous matrix such as the glycocalyx, the void volume islikely high enough to render the tortuosity as a trivial factor. Theconstrictivity is dependent upon size of the particle relative to thepore size. For FITC, with a Stokes–Einstein diameter of 1.68 nm,variations in pore size from 4 to 10 nm (Squire et al., 2001) mayintroduce significant heterogeneities in diffusion throughout theglycocalyx layer. The lower diffusion coefficient found in the sublayeris consistent with the their findings of a more compact layer near theEC surface, as indicated by greater staining of the glycocalyx 50–100 nm above the EC. This denser sublayer may result from continuedbiosynthesis of HA chains near the EC membrane and loss of distalGAGs by shear stress effects of blood flow on the outer boundary ofthe glycocalyx.
The variation of diffusion coefficient with specific enzymetreatment is also suggestive of the heterogeneity of GAG distribution.In Fig. 7, shedding of HS by heparinase failed to induce any change inthe diffusion coefficient of the sublayer from the control. This suggeststhat HS predominantly resides in the top portion of the glycocalyxlayer. In contrast, shedding of CS and HA both significantly increasedthe diffusion coefficient two-fold from control within the 173 nmsublayer, suggesting greater amounts of CS and HA. The overalldistributions of CS and HA are also likely to be biased toward the ECsurface, because after shedding by chondroitinase or hyaluronidase,D173 increased two-fold, but only by a factor of 1.4 for DDx70. Thisfinding is consistent with previous studies on syndecan-1 proteogly-can (a major glycocalyx associated GAG carrier) that the HSattachment sites are closer to the N-terminal where the CS attachmentsites are in the proximity of the transmembrane domain on the coreprotein (Kokenyesi and Bernfield, 1994). The observation that bothDDx70 and D173 increased dramatically from control after CS or HAwascleaved, but not with removal of HS, suggests that CS and HAcontribute a significantly greater amount to glycocalyx permeability(by affecting the porosity of the glycocalyx layer) compared to HS.
The anomalous decrease in diffusion coefficient at the Dx-70exclusion thickness with heparinase and fMLP may arise fromstructural rearrangements following the treatment. It is plausiblethat the layer collapses due to the loss of HS and associatedmacromolecules. In a previous study, Squire et al. (2001) observedreductions in the perpendicular spacings of the glycocalyx fibermatrix from 22.6 nm under control to 15.5 nm under inflammatoryconditions. It would thus appear that HS could provide the structuralsupport of the upper layer of the glycocalyx.
fMLP-induced shedding
Previous studies have shown that the glycocalyx is rapidly shedafter 10 min application of fMLP (Mulivor and Lipowsky, 2004). In thepresent study, after 10 min fMLP superfusion, the glycocalyx thickness
400 L. Gao, H.H. Lipowsky / Microvascular Research 80 (2010) 394–401

Author's personal copy
was reduced from 463 nm to 332 nm, and the FITC diffusioncoefficient (DDx70) across the glycocalyx layer decreased from 2.3 to1.9×10−9 cm2/s. Thus it appears that fMLP decreased both barrierthickness and porosity. The combination of these two counteractingeffects may result in no significant net change in the solutepermeability across the layer. Previous studies have shown thatfMLP alone was unable to change endothelial permeability, despitethe fact that glycocalyx was lost (Zhu et al., 2005). The pattern ofchange in diffusion coefficient by fMLP is similar to heparinase, inwhich both treatments reduced DDx70 but not D173. However, furtherstudies are needed to determine if the dominant GAG losswith fMLP isheparan sulfate in contrast to chondroitin sulfate or hyaluronan.
In conclusion, this study has measured relative GAG sheddingusing the lectin BS-1, Dx70 exclusion thickness and the diffusioncoefficient of FITC at a 173 nm basal sublayer and the Dx70 exclusionthickness under control, fMLP-induced inflammation as well as post-enzymatic degradation of GAGs by heparinase III, chondroinase ABCand hyaluronidase. It is suggested that HS may be the primary GAGbeing shed during fMLP-induced inflammatory response. Analysis ofthe results suggests three updates to prevailing structural models ofthe glycocalyx: (1) GAGs are not evenly distributed throughout theglycocalyx, HS is distributed predominately on the luminal side of theglycocalyx layer, and the EC-adjacent sublayer is dominated by CS andHA; (2) A denser EC-adjacent sublayer exists that is likely on the orderof 200 nm and (3) HS plays a dominant role in the structural integrityof the glycocalyx and chondroitin sulfate and hyaluronan contributesignificantly to its permeability.
Acknowledgments
The authors appreciate the technical assistance of Ms. AnneLescanic. This work supported by NIH Research Grant HL-39286-20.
References
Adamson, R.H., 1990. Permeability of frog mesenteric capillaries after partial pronasedigestion of the endothelial glycocalyx. J. Physiol. 428, 1–13.
Adamson, R.H., Clough, G., 1992. Plasma proteins modify the endothelial cell glycocalyxof frog mesenteric microvessels. J. Physiol. 445, 473–486.
Aruffo, A., Stamenkovic, I., Melnick, M., Underhill, C.B., Seed, B., 1990. CD44 is theprincipal cell surface receptor for hyaluronate. Cell 61, 1303–1313.
Bruegger, D., Jacob, M., Rehm, M., Loetsch, M., Welsch, U., Conzen, P., Becker, B.F., 2005.Atrial natriuretic peptide induces shedding of endothelial glycocalyx in coronaryvascular bed of guinea pig hearts. Am. J. Physiol. Heart Circ. Physiol. 289,H1993–H1999.
Chappell, D., Hofmann-Kiefer, K., Jacob, M., Rehm, M., Briegel, J., Welsch, U., Conzen, P.,Becker, B.F., 2009. TNF-alpha induced shedding of the endothelial glycocalyx isprevented by hydrocortisone and antithrombin. Basic Res. Cardiol. 104, 78–89.
Constantinescu, A.A., Vink, H., Spaan, J.A., 2001. Elevated capillary tube hematocritreflects degradation of endothelial cell glycocalyx by oxidized LDL. Am. J. Physiol.Heart Circ. Physiol. 280, H1051–H1057.
Florian, J.A., Kosky, J.R., Ainslie, K., Pang, Z., Dull, R.O., Tarbell, J.M., 2003. Heparan sulfateproteoglycan is a mechanosensor on endothelial cells. Circ. Res. 93, e136–e142.
Gouverneur, M., Spaan, J.A., Pannekoek, H., Fontijn, R.D., Vink, H., 2006. Fluid shearstress stimulates incorporation of hyaluronan into endothelial cell glycocalyx. Am.J. Physiol. Heart Circ. Physiol. 290, H458-2.
Haldenby, K.A., Chappell, D.C., Winlove, C.P., Parker, K.H., Firth, J.A., 1994. Focal andregional variations in the composition of the glycocalyx of large vesselendothelium. J. Vasc. Res. 31, 2–9.
Hamai, A., Hashimoto, N., Mochizuki, H., Kato, F., Makiguchi, Y., Horie, K., Suzuki, S.,1997. Two distinct chondroitin sulfate ABC lyases. An endoeliminase yieldingtetrasaccharides and an exoeliminase preferentially acting on oligosaccharides. J.Biol. Chem. 272, 9123–9130.
Henry, C.B., Duling, B.R., 1999. Permeation of the luminal capillary glycocalyx isdetermined by hyaluronan. Am. J. Physiol. 277, H508–H514.
Henry, C.B., Duling, B.R., 2000. TNF-alpha increases entry of macromolecules intoluminal endothelial cell glycocalyx. Am. J. Physiol. Heart Circ. Physiol. 279,H2815–H2823.
Hofmann-Kiefer, K.F., Kemming, G.I., Chappell, D., Flondor, M., Kisch-Wedel, H., Hauser,A., Pallivathukal, S., Conzen, P., Rehm, M., 2009. Serum heparan sulfate levels areelevated in endotoxemia. Eur. J. Med. Res. 14, 526–531.
Huxley, V.H., Curry, F.E., 1991. Differential actions of albumin and plasma on capillarysolute permeability. Am. J. Physiol. 260, H1645–H1654.
Huxley, V.H., Williams, D.A., 2000. Role of a glycocalyx on coronary arteriolepermeability to proteins: evidence from enzyme treatments. Am. J. Physiol. HeartCirc. Physiol. 278, H1177–H1185.
Kokenyesi, R., Bernfield, M., 1994. Core protein structure and sequence determine thesite and presence of heparan sulfate and chondroitin sulfate on syndecan-1. J. Biol.Chem. 269, 12304–12309.
Laurent, T.C., Fraser, J.R., 1992. Hyaluronan. FASEB J. 6, 2397–2404.Lohse, D.L., Linhardt, R.J., 1992. Purification and characterization of heparin lyases from
Flavobacterium heparinum. J. Biol. Chem. 267, 24347–24355.Mulivor, A.W., Lipowsky, H.H., 2002. Role of glycocalyx in leukocyte-endothelial cell
adhesion. Am. J. Physiol. Heart Circ. Physiol. 283, H1282–H1291.Mulivor, A.W., Lipowsky, H.H., 2004. Inflammation- and ischemia-induced shedding of
venular glycocalyx. Am. J. Physiol. Heart Circ. Physiol. 286, H1672–H1680.Mulivor, A.W., Lipowsky, H.H., 2009. Inhibition of glycan shedding and leukocyte-
endothelial adhesion in postcapillary venules by suppression of matrix metallo-protease activity with doxycycline. Microcirculation 16, 657–666.
Nieuwdorp, M., van Haeften, T.W., Gouverneur, M.C., Mooij, H.L., van Lieshout, M.H.,Levi, M., Meijers, J.C., Holleman, F., Hoekstra, J.B., Vink, H., Kastelein, J.J., Stroes, E.S.,2006. Loss of endothelial glycocalyx during acute hyperglycemia coincides withendothelial dysfunction and coagulation activation in vivo. Diabetes 55, 480–486.
Potter, D.R., Damiano, E.R., 2008. The hydrodynamically relevant endothelial cellglycocalyx observed in vivo is absent in vitro. Circ. Res. 102, 770–776.
Prehm, P., 1989. Identification and regulation of the eukaryotic hyaluronate synthase.Ciba Found. Symp. 143, 21–30.
Rapraeger, A., 1989. Transforming growth factor (type beta) promotes the addition ofchondroitin sulfate chains to the cell surface proteoglycan (syndecan) of mousemammary epithelia. J. Cell Biol. 109, 2509–2518.
Rapraeger, A., Bernfield, M., 1985. Cell surface proteoglycan of mammary epithelialcells. Protease releases a heparan sulfate-rich ectodomain from a putativemembrane-anchored domain. J. Biol. Chem. 260, 4103–4109.
Rehm, M., Bruegger, D., Christ, F., Conzen, P., Thiel, M., Jacob, M., Chappell, D.,Stoeckelhuber, M., Welsch, U., Reichart, B., Peter, K., Becker, B.F., 2007. Shedding ofthe endothelial glycocalyx in patients undergoing major vascular surgery withglobal and regional ischemia. Circulation 116, 1896–1906.
Reitsma, S., Slaaf, D.W., Vink, H., van Zandvoort, M.A., oude Egbrink, M.G., 2007. Theendothelial glycocalyx: composition, functions, and visualization. Pflugers Arch.454, 345–359.
Schnitzer, J.E., Shen, C.P., Palade, G.E., 1990. Lectin analysis of common glycoproteinsdetected on the surface of continuous microvascular endothelium in situ and inculture: identification of sialoglycoproteins. Eur. J. Cell Biol. 52, 241–251.
Scott, J.E., Heatley, F., 1999. Hyaluronan forms specific stable tertiary structures inaqueous solution: a 13C NMR study. Proc. Natl. Acad. Sci. USA 96, 4850–4855.
Squire, J.M., Chew, M., Nneji, G., Neal, C., Barry, J., Michel, C., 2001. Quasi-periodicsubstructure in the microvessel endothelial glycocalyx: a possible explanation formolecular filtering? J. Struct. Biol. 136, 239–255.
Stace, T.M., Damiano, E.R., 2001. An electrochemical model of the transport of chargedmolecules through the capillary glycocalyx. Biophys. J. 80, 1670–1690.
Sugihara-Seki, M., Akinaga, T., Itano, T., 2008. Flow across microvessel walls through theendothelial surface glycocalyx and the interendothelial cleft. J. Fluid Mech. 601,229–252.
Svennevig, K., Hoel, T., Thiara, A., Kolset, S., Castelheim, A., Mollnes, T., Brosstad, F.,Fosse, E., Svennevig, J., 2008. Syndecan-1 plasma levels during coronary arterybypass surgery with and without cardiopulmonary bypass. Perfusion 23, 165–171.
Toole, B.P., 1990. Hyaluronan and its binding proteins, the hyaladherins. Curr. Opin. CellBiol. 2, 839–844.
Van den Berg, B.M., Vink, H., Spaan, J.A., 2003. The endothelial glycocalyx protectsagainst myocardial edema. Circ. Res. 92, 592–594.
van Haaren, P.M., VanBavel, E., Vink, H., Spaan, J.A., 2003. Localization of thepermeability barrier to solutes in isolated arteries by confocal microscopy. Am. J.Physiol. Heart Circ. Physiol. 285, H2848–H2856.
Vink, H., Duling, B.R., 1996. Identification of distinct luminal domains for macro-molecules, erythrocytes, and leukocytes within mammalian capillaries. Circ. Res.79, 581–589.
Vink, H., Duling, B.R., 2000. Capillary endothelial surface layer selectively reducesplasma solute distribution volume. Am. J. Physiol. Heart Circ. Physiol. 278,H285–H289.
Vogl-Willis, C.A., Edwards, I.J., 2004. High-glucose-induced structural changes in theheparan sulfate proteoglycan, perlecan, of cultured human aortic endothelial cells.Biochim. Biophys. Acta 1672, 36–45.
Volpi, N., Sandri, I., Venturelli, T., 1995. Activity of chondroitin ABC lyase andhyaluronidase on free-radical degraded chondroitin sulfate. Carbohydr. Res. 279,193–200.
Weinbaum, S., Zhang, X., Han, Y., Vink, H., Cowin, S.C., 2003. Mechanotransduction andflow across the endothelial glycocalyx. Proc. Natl Acad. Sci. USA 100, 7988–7995.
Zhu, L., Castranova, V., He, P., 2005. fMLP-stimulated neutrophils increase endothelial[Ca2+]i and microvessel permeability in the absence of adhesion: role of reactiveoxygen species. Am. J. Physiol. Heart Circ. Physiol. 288, H1331–H1338.
Zuurbier, C.J., Demirci, C., Koeman, A., Vink, H., Ince, C., 2005. Short-term hyperglycemiaincreases endothelial glycocalyx permeability and acutely decreases lineal densityof capillaries with flowing red blood cells. J. Appl. Physiol. 99, 1471–1476.
401L. Gao, H.H. Lipowsky / Microvascular Research 80 (2010) 394–401