author's personal copy - golden gate...
TRANSCRIPT

This article appeared in a journal published by Elsevier. The attachedcopy is furnished to the author for internal non-commercial researchand education use, including for instruction at the authors institution
and sharing with colleagues.
Other uses, including reproduction and distribution, or selling orlicensing copies, or posting to personal, institutional or third party
websites are prohibited.
In most cases authors are permitted to post their version of thearticle (e.g. in Word or Tex form) to their personal website orinstitutional repository. Authors requiring further information
regarding Elsevier’s archiving and manuscript policies areencouraged to visit:
http://www.elsevier.com/authorsrights

Author's personal copy
Energy and Buildings 65 (2013) 310–321
Contents lists available at SciVerse ScienceDirect
Energy and Buildings
j ourna l ho me pa g e: www.elsev ier .com/ locate /enbui ld
Cooling load differences between radiant and air systems
Jingjuan (Dove) Feng ∗, Stefano Schiavon, Fred BaumanCenter for the Built Environment, University of California, Berkeley, 390 Wurster Hall, Berkeley, CA 94720, USA
a r t i c l e i n f o
Article history:Received 11 April 2013Accepted 10 June 2013
Keywords:Radiant coolingCooling loadHeat gainAir systemRadiant cooling panel (RCP)Embedded surface cooling systems (ESCS)Thermally activated building systems(TABS)
a b s t r a c t
Unlike the case of air systems where the cooling load is purely convective, the cooling load for radiantsystems consists of both convective and radiant components. The objectives of this simulation studywere to investigate whether the same design cooling load calculation methods can be used for radiantand air systems by studying the magnitude of the cooling load differences between the two systems overa range of design configurations. Simulation results show that (1) zone level 24-h total cooling energyof radiant systems can be 5–15% higher than air systems due to higher conduction load through theenvelope; (2) peak cooling rate at the radiant cooled surface can be 7–35% higher than air system forzones without solar load. This difference can increase up to 85% for floor system in zones with solar load;(3) the peak cooling rate differences originate from: (a) radiant cooling surface(s) reduce radiant heatgain accumulation in the building mass; (b) only part of the convective heat gain becomes instantaneouscooling load. As a result, tools using response factor methods such as radiant time series method forcooling load calculations are not appropriate for radiant system design.
© 2013 Elsevier B.V. All rights reserved.
1. Introduction
Water-based radiant cooling systems are gaining popularityas an energy efficient approach for conditioning buildings [1–3].The design of radiant systems is complicated because of the cou-pling between thermal load, building structure and the hydronicsystem and because of the important impact of both radiationand convection on thermal comfort. Dedicated radiant systemdesign and testing standards have been developed to address issueslike system sizing, installation, operation and control [4–9]. How-ever, radiant cooling systems are still considered as an innovativeapproach, and their application in North America is still limited[10,11]. In this study, we investigated the impacts of the presenceof activated cooled surface on zone cooling loads.
Cooling load calculations are a crucial step in designing anyHVAC system. Compared to air systems, the presence of an activelycooled surface changes the heat transfer dynamics in the room,and two potential impacts on zone cooling loads studied here are(1) cooled surfaces may create different inside surface tempera-tures of the non-active exterior building walls, causing differentheat gain through the building envelope, and in turn different zonelevel total energy, and (2) changes the effect of thermal mass oncooling loads, and therefore creating different peak cooling load.
∗ Corresponding author at: Center for the Built Environment, University ofCalifornia, Berkeley, 373C Wurster Hall, Berkeley, CA 94720, USA.Tel.: +1 510 366 3139.
E-mail addresses: [email protected], [email protected] (J. Feng).
Two research studies were identified that looked at heatingload calculations in terms of the impact of the radiant system onwall surface temperatures and the resultant room load [12,13].However, both studies focused on heating load calculation understeady-state conditions. In another study, Chen [14] suggested thatthe total heating load of a ceiling radiant heating system was 17%higher than that of the air heating system because of the role of ther-mal mass and higher heat loss through the building envelope dueto slightly higher inside surface temperatures. For cooling applica-tions, no studies were found on this topic, and in current radiantsystem design guidelines [4,8], such impacts are not considered orevaluated.
Secondly, the interaction of building mass with heat source isinfluenced by the presence of activated radiant cooling surface(s).One phenomenon mentioned in the literature was radiant sur-face(s) as part of the building mass, instead of storing themal energyas in the case of air systems, removes radiant heat gain (e.g. solar,radiative internal load and radiative envelope load) that is directlyimpinging on it. This phonomenon fundamentally changes the cool-ing load dynamics in a room. Niu [15] pointed out that this directradiation may create high peak cooling loads. He modified the ther-mal analysis program ACCURACY [16] to account for the directradiant heat gain as instantaneous cooling load for radiant systems.However, no information can be found on how he implemented themodification and the software is not accessible for the public. In aneffort to develop a new cooling load calculation approach for radi-ant systems, Corgnati [17] also tackled the direct radiant heat gaineffect using a similar strategy to Niu. Based on Corgnati’s work,Causone et al. [18] focused on the cases with the presence of direct
0378-7788/$ – see front matter © 2013 Elsevier B.V. All rights reserved.http://dx.doi.org/10.1016/j.enbuild.2013.06.009

Author's personal copy
J. Feng et al. / Energy and Buildings 65 (2013) 310–321 311
Nomenclature
RCP radiant cooling panelsESCS embedded surface cooling systems (lightweight)TABS thermally activated building systemsG1–G6 simulation group indexq′′ heat flux (W/m2)q′′
surfheat flux at the exposed face of the cooling surface(s)
(W/m2)q′′
surf,condconduction heat transfer at the exposed face of the
cooling surface(s) (W/m2)q′′
surf,conv convection heat transfer at the exposed face of the
cooling surface(s) (W/m2)q′′
surf,radradiation heat transfer at the exposed face of the
cooling surface(s) (W/m2)q′′
lw surfnet longwave radiation flux to radiant active surface
from other surfaces (W/m2)q′′
lw int longwave radiant exchange flux from internal load(W/m2)
q′′sw sol
transmitted solar radiation flux absorbed at surface(W/m2)
q′′sw int net shortwave radiation flux to surface from internal
load (lights) (W/m2)q′′
surf,pkspecific peak radiant system surface cooling load
(W/m2)q′′
hyd,pkspecific peak radiant system hydronic cooling load
(W/m2)q′′
air,pkspecific peak sensible cooling load for air system
(W/m2)qsurf,tot specific 24-h total surface cooling energy (kJ/m2)qhyd,tot specific 24-h total hydronic cooling energy (kJ/m2)qair,tot specific 24-h total sensible cooling energy (kJ/m2)Psurf,pk percentage difference of surface peak cooling rate
between radiant and air system (%)Phyd,pk percentage difference of hydronic peak cooling rate
between radiant and air system (%)Psurf,tot percentage difference of surface level 24-h total
cooling energy between radiant and air system (%)Phyd,tot percentage difference of hydronic level 24-h total
cooling between radiant and air system (%)
Subscriptsurf variable measured at radiant surface levelhyd variable measured at radiant cooling water looppk peak cooling loadtot 24 h total cooling energy
solar gain. However, the methods proposed in these research stud-ies only looked at the effect of direct radiant heat gain on coolingload, and the rest of the radiant heat gain and the convective heatgain are still considered to interact with building mass as if the radi-ant system does not exist. In addition, no research can be found thatfundamentally studies the differences of the heat transfer processin zones conditioned by an air and a radiant system, and how thesedifferences are going to impact the cooling load calculation andwhat could be the magnitude of the differences.
Although research has demonstrated that cooling loads for radi-ant systems need to be considered differently than for air systems,current radiant design standards do not explicitly acknowledgethese differences. Several standards and handbooks were reviewed,including: Chapter 6 of ASHRAE Equipment and HVAC systems [19],
radiant heating and cooling handbook (2002) [9], Chapter 18 ofASHRAE Fundamental (2012), ISO 11855 (2012) [4], and Europeanstandard EN 15377 (2008) [8]. The first three do not offer any guid-ance on the selection of the calculation methods when radiantsystems are involved. In chapter 18 of ASHRAE Fundamental (2012)handbook, the description of the cooling load calculation processis based on the implicit assumption that an air system is used forconditioning the space. Some simplified cooling load calculationmethods, such as transfer function method (TF) [20] and radianttime series method (RTS) [21], have also been developed for airsystem. These algorithms are widely implemented in building ther-mal simulation or load calculation tools, including HAP (TF), TRANETRACE (RTS), BLAST, and DOE-2 (TF) based tools such as eQuest,Energy-pro, Green Building Studio and VisualDOE. These tools areoften used for cooling load estimates during initial design stage andfor detailed energy and comfort analysis even when radiant sys-tems are involved [22]. The European standards reviewed indireclyreference EN 15255 [23] for cooling load calculation procedure.EN 15255 classified all cooling load calculation methods into dif-ferent catogories according to their capability to model differenttypes of cooling system and control method. Methods that are ableto simulate radiant systems controlled by operative temperatureare in Class 4b. This implies that cooling load calculation methodfor radiant systems should be properly distinguished from air sys-tems. However, this standard does not explicitly provide coolingload calculation mehtods for radiant system.
A recent survey conducted by the authors of radiant cool-ing design practitioners revealed that the differences in coolingload between radiant and air systems are not fully understood.Some of the most experienced professionals acknowledge thecomplications and lack of guidance in the standards and devel-oped rule-of-thumb methods for initial system design calculation.Among those methods, either heat gain is directly used as cool-ing load for system sizing [24,25], or a portion of the heat gain isconsidered as direct heat removal by the active radiant surface.The percentages of the direct removal depend on load type (light-ing/people/equipment), and are obtained based on experience [26].In design practice, it is not often that dynamic simulation tools thatcan properly model radiation heat transfer are used at the coolingload estimation stage. Radiant system manufacturers have devel-oped some tools for system sizing [27], but they are mainly used forheating applications, where steady-state heat transfer is adequateto capture the thermal behavior.
The objectives of this simulation study are to (1) assess the cool-ing load differences between the two systems by comparing thezone level peak zone cooling load and 24-h total cooling energy fora radiant cooling system (with activated chilled surface) vs. an airsystem; and (2) suggest potential improvements in current designguidelines for radiant cooling system.
2. Background and theory
In this section, we give a brief introduction to the three typesof radiant cooling systems investigated in this paper and explainhow their thermal characteristics affect the design approach. Sinceradiant and air systems are different in many ways, the simulationstudy had to be designed carefully to provide a fair comparison.
2.1. Radiant cooling systems
The REHVA guidebook on radiant systems [7] has roughly cat-egorized these systems into three types: radiant cooling panels(RCP), water-based embedded surface cooling systems (ESCS), andthermally activated building systems (TABS). As shown in Fig. 1, RCPare metal panels with integrated pipes usually suspended under the

Author's personal copy
312 J. Feng et al. / Energy and Buildings 65 (2013) 310–321
Fig. 1. Schematic of the three types of radiant surface ceiling systems (not to scale).
ceiling with heat carrier temperature relatively close to room tem-perature. ESCS have pipes embedded in plaster or gypsum boardor cement screed, and they are thermally decoupled from the mainbuilding structure (floor, wall and ceiling) by the use of thermalinsulation. They are used in all types of buildings and work withheat carriers at relatively high temperatures for cooling. Finally,“systems with pipes embedded in the building structure (slab,walls), TABS, which are operated at heat carrier temperatures veryclose to room temperature and take advantage of the thermal stor-age capacity of the building structure.” These systems usually havedifferent applications due to their thermal and control characteris-tics, and therefore, the design and dimensioning strategies for thesesystems vary.
2.2. Radiant vs. air systems
A comparison between radiant and air systems is challenging.In this section, we discuss the differences between the two systemsthat dictate the modeling approach used in this study. Besides thosementioned in the literature [28], the main difficulties include:
• Types of load (sensible/latent) and the expected amount of loadto be handled by the two systems are different. Air systems areusually designed to be the only system to handle both latentand sensible loads, while radiant systems must operate in hybridmode with a reduced-sized air system (for ventilation and latentloads). Radiant cooling systems are always sized to handle aportion (as much as possible) of the sensible-only cooling load. Toaddress this issue, neither the latent load nor ventilation systemwas simulated. This was to simplify our analysis.
• The design cooling load concept is different for the two systems.According to ASHRAE Handbook [29], the sensible cooling loadfor an air system is calculated in terms of maintaining a constantzone air temperature, while radiant systems, particularly TABS,are not capable of maintaining a constant zone air temperaturedue to large thermal inertia of the active surfaces. For this reason,in this comparison study, we sized and controlled the simulatedradiant systems to maintain an acceptable thermal comfort rangeduring the simulation period. Operative temperature was usedas the control temperature for both systems [28,30]. To ensureequivalent comfort conditions between the two systems for faircomparison, all simulations of the air system were subsequentlycontrolled to closely track the hourly operative temperature pro-file derived from the radiant system simulation for the identicalinput conditions.
• For an air system the zone cooling load is equal to the heatextraction rate by the mechanical system when the room air tem-perature and humidity are constant. But this is not always thecase in a radiant system. Other than panel systems, radiant cool-ing systems (ESCS and TABS) are integrated with the buildingstructure with hydronic pipes embedded in the mass. As a result,heat removed from the zone at the chilled surface can be quitedifferent from the heat removed by the hydronic loop. Sizing ofthe radiant system cooling equipment is highly dependent onspecifications of the cooling surface (slab material/thickness, tubespacing, and surface finishing). This indicated that we needed to
investigate heat transfer of the radiant system at both the surfaceand hydronic levels, which is discussed in detail below.
2.3. Heat transfer at radiant surface and hydronic level
Radiant systems remove the sensible heat in a room at the cool-ing surface. We define this cooling rate as surface cooling rate.Define the control volume as the inside face of the cooling slab, withpositive sign means heat being transferred into the control volumeand negative indicates heat leaving the control volume, the heatbalance for the cooling surface can be written as follows (1) [31]:
q′′
surf = q′′surf,conv + q′′
surf,rad = −q′′surf,cond (1)
Surface cooling rate serves as one key design parameter fordetermining required radiant system area and selection of systemtype.
Hydronic cooling rate is the heat extraction rate based on anenergy balance on the hydronic circuit. The hydronic cooling rateis important for sizing of waterside equipment, such as pumps,chillers and cooling tower. Hydronic cooling rate can be calculatedby Eq. (2) [31]:
q′′hyd = (mcp)water(Twi − Two) (2)
Both RCP and most ESCS operate during occupied hours to maintaina relatively constant comfort condition in the space, so the differ-ence between the surface and hydronic rate is only a function ofthermal properties of the panel/slab. For RCP systems, if insulationis installed on the backside of the panel, hydronic cooling rate can beassumed to be the same as surface cooling output due to high con-ductivity of the surface material [6], which is usually desired. TABSare usually designed and operated to take advantage of the thermalstorage effect of the slab, so the difference between the surface andhydronic rate is also a function of the operational strategies, whichwill be discussed later.
3. Methodology and modeling approach
To investigate the impacts of the presence of activated cooledsurface on zone cooling load, we adopted the following methodol-ogy:
• Two single zone models, one conditioned by an air system and oneby radiant system were developed in EnergyPlus v7.1 for com-parison. All three radiant systems (RCP/ESCS/TABS) were studied.Because the construction of each radiant system type is differentand is highly influential on overall building response, the com-parison air models were configured to match the construction ofthe radiant systems.
• The models were parameterized for studying the influences ofenvelope thermal insulation, thermal mass, type of internal gain,solar heat gain with different shading options, and radiant surfaceorientation (ceiling, floor).
EnergyPlus v7.1 was used for the simulation study because itperforms a fundamental heat balance on all surfaces in the zone.The heat balance model ensures that all energy flows in each zoneare balanced and involve the solution of a set of energy balance

Author's personal copy
J. Feng et al. / Energy and Buildings 65 (2013) 310–321 313
Table 1Simulation runs summary.
Group Case Building Int. heat gaina Window Radiant surface Boundary conditionsc
G1: insulation hw r2 heavyweight No No Ceiling Environmenthw r1 hW smallRb No No Ceiling Environment
G2: thermal mass hw r2 heavyweight No No Ceiling Environmentlw r2 lightweight No No Ceiling Environment
G3: Int. heat gaina rad0 heavyweight RadFraca = 0 No Ceiling Adiabaticrad0.3 heavyweight RadFrac = 0.3 No Ceiling Adiabaticrad0.6 heavyweight RadFrac = 0.6 No Ceiling Adiabaticrad1 heavyweight RadFrac = 1 No Ceiling Adiabatic
G4: ceiling with solar cl noshade heavyweight No Yes Ceiling Environmentcl shade heavyweight No Yes + shade Ceiling Environment
G5: floor with solard flr noshade heavyweight No Yes Floor Environmentflr shade heavyweight No Yes + shade Floor Environment
G6: typical ceiling cl shade rad0.6 heavyweight RadFrac = 0.6 Yes + shade Ceiling Environment
a Int. heat gain, internal heat gain; RadFrac, radiative fraction of internal heat gain.b HW smallR, heavy weight construction with half thermal insulation at exterior walls.c Both roof and floor have boundary conditions set to adiabatic for simplicity, and the boundary conditions specified in this column are for exterior walls.d These cases are not simulated for radiant panel systems.
equations for zone air and the interior and exterior surfaces ofeach wall, roof, and floor. It captures both longwave and shortwaveradiation heat transfer and has been extensively validated [32,33].In addition, EnergyPlus is able to integrate the heat transfercalculation in the radiant cooling systems with changing zoneconditions; therefore it is able to capture the transient behavior ofthe systems [31].
3.1. Simulation runs
In total, 74 simulation cases were configured, including 13 (11for RCP) variations for the three types of radiant systems and theirequivalent air systems. The different combinations and ranges ofparameters are listed in Table 1.
Table 2Radiant surface constructions specifications (inside to outside).
Thickness (m) Specific heat(J/kg K)
Density (kg/m3) Conductivity(W/m K)
RCP ceilingAluminum panel 0.001 910 2800 273.0
Water tubeInsulation 0.05 1210 56 0.02Concrete slab 0.08 1000 1400 1.13Insulations 0.1118 840 12 0.04Roof deck 0.019 900 530 0.14
ECS ceilingLime plaster 0.012 840 1050 0.7
Water tubeLime plaster 0.014 840 1050 0.7Insulation 0.05 1210 56 0.02Concrete 0.08 1000 1400 1.13Insulations 0.1118 840 12 0.04Roof deck 0.019 900 530 0.14
ECS floorFloor finish 0.0016 1250 1922 0.17Cement Screed 0.04 988 1842 1.2
Water tubeCement screed 0.01 988 1842 1.2Insulation 0.05 1210 56 0.02Concrete 0.08 1000 1400 1.13Insulation 1.007 n/a n/a 0.04
TABS ceilingConcrete 0.04 1000 1400 1.13
Water tubeConcrete 0.04 1000 1400 1.13Insulations 0.1118 840 12 0.04Roof deck 0.019 900 530 0.14
TABS floorConcrete 0.04 1000 1400 1.13
Water tubeConcrete 0.04 1000 1400 1.13Insulations 1.007 n/a n/a 0.04

Author's personal copy
314 J. Feng et al. / Energy and Buildings 65 (2013) 310–321
830.5 1
2.7
2.0
0.2
6
unit: (m)
N
Wind ow Wind ow
Fig. 2. Isometric base case (only G4-G6 have windows).
Cases hw r2 and hw r1 in Group 1 are designed for studies ofthe impact of thermal insulation, and hw r2 and lw r1 in Group 2are for studies of thermal mass. These represent perimeter zoneswithout windows, only subjected to building envelope conductiveheat gains. Cases in G3, rad0 to rad1, are to evaluate the impacts ofinternal load with different radiant fractions, defined as the portionof radiative heat gain to total heat gain given off by a heat source.Radiant fraction of lighting ranges from 0.48 to 1.0 depending onluminaire type [34]; for people the radiant fraction can be from 0.2to 0.6 depending on surrounding air velocity and people’s activ-ity (e.g., walking, running, etc.) [29]; and for office equipment, therange is usually between 0.1 and 0.4 depending on equipment type[35]. For these cases, the building envelope was set to be adiabaticto represent an interior zone and isolate the influences from out-side environment. Two windows were modeled on the south wallin the next groups, G4–G6, in order to study the impact of solargains in perimeter zones. Radiant ceiling and floor systems wereboth simulated. Case cl shade rad0.6 was configured to representa zone with real internal load and windows with exterior shadingthat is conditioned by a radiant ceiling system. All three types ofradiant systems were modeled for all cases, except that the RCPsystems were not simulated for the radiant floor case because it isnot a common practice.
3.2. Model specifications
Since the objective of the study was to understand the heattransfer and the resultant cooling load differences between a radi-ant and an air system, a representative single zone model isadequate. The model was developed primarily based on ASHRAEStandard 140 [36]. Weather file provided in the standard was used.System and design parameters for the radiant system were adoptedfrom RADTEST [37]. Additional details are summarized below.
The test case (Fig. 2) was a rectangular, heavy weight construc-tion single zone building (8 m wide × 6 m long × 2.7 m high) withno interior partitions. Both the floor and roof boundary conditionswere set to be adiabatic to simplify the analysis. Only cases inG4-G6 have 12 m2 of south-facing windows. The overall U-Factorwas 2.721 W/(m2 K) with Glass SHGC at 0.788. The baseline con-struction was based on case 900 (Table 11 in ASHRAE 140 2007),except that the ceiling/floor constructions were modified so thatradiant ceiling/floor systems can be simulated. Exterior walls forCase hw r2 had U-value of 0.454 W/(m2 K). Case hw r1 was modi-fied to have U-value of 0.83 W/(m2 K), and Case lw r2 was modifiedwith lightweight construction based on case 600 (ASHRAE 140 2007Table 1). Floor and ceilings were configured separately for each casedepending on location of the activated cooling surface and radiantsystem types. Table 2 is a summary of the radiant ceiling/floor con-struction specifications. For cases in G3, the internal gain was 720 W
Table 3Hydronic loop specifications.
Inner diameter (m) 0.015Total pipe length (m) 139.2Inlet water temp (◦C) 15Tube spacing (m) 0.3 (0.15 for cases with windows)Design mass flow rate (kg/s) 0.167 (0.06 for RCP system in cases
without window)
from 6:00 to 18:00. The radiant fraction was different for each runas specified in Table 1. There was zero air infiltration for all runsbecause we did not want to have an additional confounding factor.Table 3 lists the radiant system design specifications that are devel-oped based on RADTEST case 2800. When windows were simulated,tube spacing changed from 0.3 to 0.15 m in order to maintain sim-ilar thermal comfort level. Design flow rates for RCP were reducedfor cases in Group 1 and 2, since these systems have higher cool-ing capacity as compared to the other two radiant systems. As forcontrol, the goal was to maintain operative temperature setpoint at23 ◦C for 24 h with a 2 ◦C deadband [31]. For the air system models,the EnergyPlus object “IdealLoadsAirSystem” was used for simplic-ity to ensure the same operative temperature as the correspondingradiant systems.
4. Parameters investigated
Table 4 lists the parameters that were evaluated during the sim-ulations. Peak cooling rate is commonly used for equipment sizingin the case of air system and the fast responsive RCP and lightweightESCS. 24-h total cooling energy is studied for all radiant systemsbecause it reflects the consequence of the impact of radiant coolingsystem on exterior wall surface temperature. Comparisons weremade at both the surface and hydronic levels for the radiant sys-tems. Percentage differences between the radiant and air systemswere reported, and are defined in the last two rows in Table 4.
5. Results
Results from the 99.6% cooling design day simulations arereported and compared for surface cooling rate, hydronic coolingrate and air system cooling rate in this section. To evaluate theinfluence of each investigated parameter, the ranges of the Psurf,pk,Phyd,pk, Psurf,tot, and Phyd,tot are reported graphically.
5.1. 24-h total cooling energy
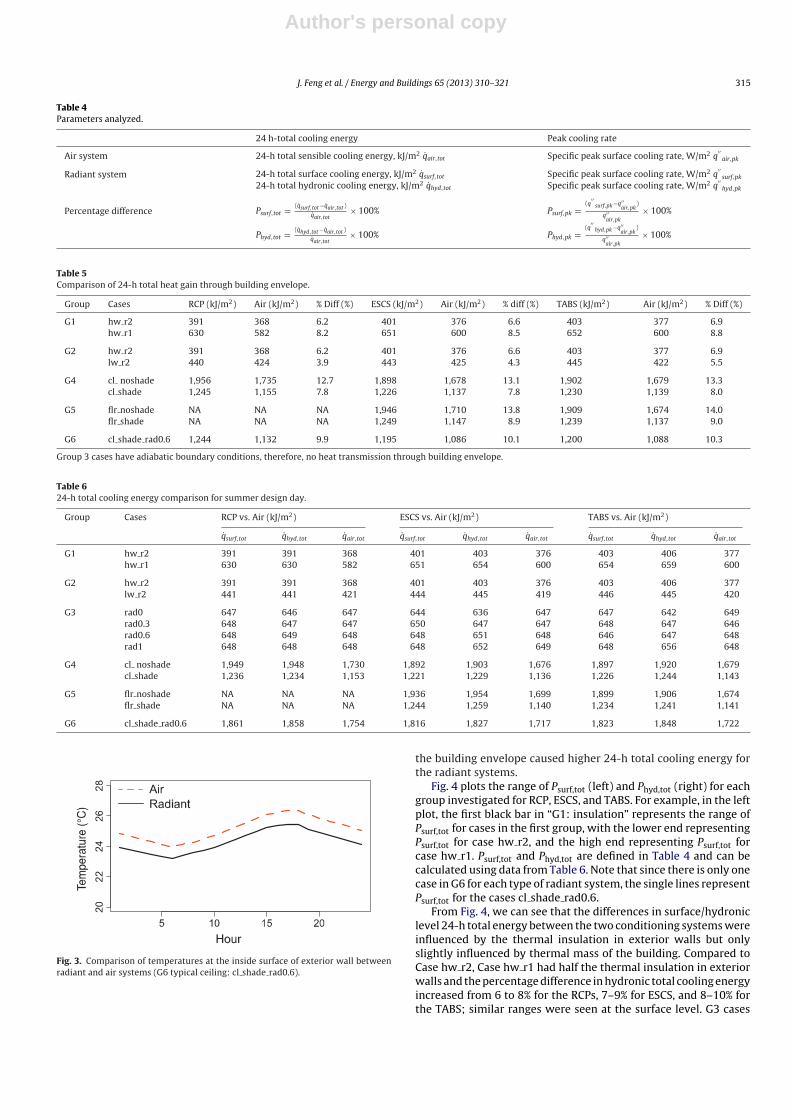
The expected impact of the radiant cooling system is to causelower surface temperatures at the inside of building envelope,resulting in higher envelope heat gain and total cooling energy.This hypothesis was tested by a comparison of the 24-h total enve-lope heat gain for a zone conditioned by a radiant vs. air system,as shown in Table 5. For cases in G1 and G2, the heat gains weremerely heat conduction through exterior walls, and for the othercases, the heat gains also included solar radiation through windows.G3 cases were not reported because they were modeled to have adi-abatic boundary conditions for all exterior surfaces that resulted innear zero heat gain through the building envelope. Table 5 showshigher conductive heat transfer through the building envelope forthe radiant system. The reason for this finding was the lower surfacetemperature (at an average of 0.5 ◦C) at the inside face of the exte-rior walls caused by the radiant system, as is proved by Fig. 3. Table 6presents the summer design day 24-h total cooling energy for bothradiant and air systems. Comparing heat gain differences betweenthe two systems reported in Table 5 and the 24-h total energy dif-ferences reported in Table 6, we can confirm that heat gain through
Author's personal copy
J. Feng et al. / Energy and Buildings 65 (2013) 310–321 315
Table 4Parameters analyzed.
24 h-total cooling energy Peak cooling rate
Air system 24-h total sensible cooling energy, kJ/m2 qair,tot Specific peak surface cooling rate, W/m2 q′′
air,pk
Radiant system 24-h total surface cooling energy, kJ/m2 qsurf,tot Specific peak surface cooling rate, W/m2 q′′
surf,pk
24-h total hydronic cooling energy, kJ/m2 qhyd,tot Specific peak surface cooling rate, W/m2 q′′
hyd,pk
Percentage difference Psurf,tot = (qsurf,tot −qair,tot )
qair,tot× 100% Psurf,pk =
(q′′
surf,pk−q′′air,pk
)
q′′air,pk
× 100%
Phyd,tot = (qhyd,tot −qair,tot )
qair,tot× 100% Phyd,pk =
(q′′
hyd,pk−q′′air,pk
)
q′′air,pk
× 100%
Table 5Comparison of 24-h total heat gain through building envelope.
Group Cases RCP (kJ/m2) Air (kJ/m2) % Diff (%) ESCS (kJ/m2) Air (kJ/m2) % diff (%) TABS (kJ/m2) Air (kJ/m2) % Diff (%)
G1 hw r2 391 368 6.2 401 376 6.6 403 377 6.9hw r1 630 582 8.2 651 600 8.5 652 600 8.8
G2 hw r2 391 368 6.2 401 376 6.6 403 377 6.9lw r2 440 424 3.9 443 425 4.3 445 422 5.5
G4 cl noshade 1,956 1,735 12.7 1,898 1,678 13.1 1,902 1,679 13.3cl shade 1,245 1,155 7.8 1,226 1,137 7.8 1,230 1,139 8.0
G5 flr noshade NA NA NA 1,946 1,710 13.8 1,909 1,674 14.0flr shade NA NA NA 1,249 1,147 8.9 1,239 1,137 9.0
G6 cl shade rad0.6 1,244 1,132 9.9 1,195 1,086 10.1 1,200 1,088 10.3
Group 3 cases have adiabatic boundary conditions, therefore, no heat transmission through building envelope.
Table 624-h total cooling energy comparison for summer design day.
Group Cases RCP vs. Air (kJ/m2) ESCS vs. Air (kJ/m2) TABS vs. Air (kJ/m2)
qsurf,tot qhyd,tot qair,tot qsurf,tot qhyd,tot qair,tot qsurf,tot qhyd,tot qair,tot
G1 hw r2 391 391 368 401 403 376 403 406 377hw r1 630 630 582 651 654 600 654 659 600
G2 hw r2 391 391 368 401 403 376 403 406 377lw r2 441 441 421 444 445 419 446 445 420
G3 rad0 647 646 647 644 636 647 647 642 649rad0.3 648 647 647 650 647 647 648 647 646rad0.6 648 649 648 648 651 648 646 647 648rad1 648 648 648 648 652 649 648 656 648
G4 cl noshade 1,949 1,948 1,730 1,892 1,903 1,676 1,897 1,920 1,679cl shade 1,236 1,234 1,153 1,221 1,229 1,136 1,226 1,244 1,143
G5 flr noshade NA NA NA 1,936 1,954 1,699 1,899 1,906 1,674flr shade NA NA NA 1,244 1,259 1,140 1,234 1,241 1,141
G6 cl shade rad0.6 1,861 1,858 1,754 1,816 1,827 1,717 1,823 1,848 1,722
Fig. 3. Comparison of temperatures at the inside surface of exterior wall betweenradiant and air systems (G6 typical ceiling: cl shade rad0.6).
the building envelope caused higher 24-h total cooling energy forthe radiant systems.
Fig. 4 plots the range of Psurf,tot (left) and Phyd,tot (right) for eachgroup investigated for RCP, ESCS, and TABS. For example, in the leftplot, the first black bar in “G1: insulation” represents the range ofPsurf,tot for cases in the first group, with the lower end representingPsurf,tot for case hw r2, and the high end representing Psurf,tot forcase hw r1. Psurf,tot and Phyd,tot are defined in Table 4 and can becalculated using data from Table 6. Note that since there is only onecase in G6 for each type of radiant system, the single lines representPsurf,tot for the cases cl shade rad0.6.
From Fig. 4, we can see that the differences in surface/hydroniclevel 24-h total energy between the two conditioning systems wereinfluenced by the thermal insulation in exterior walls but onlyslightly influenced by thermal mass of the building. Compared toCase hw r2, Case hw r1 had half the thermal insulation in exteriorwalls and the percentage difference in hydronic total cooling energyincreased from 6 to 8% for the RCPs, 7–9% for ESCS, and 8–10% forthe TABS; similar ranges were seen at the surface level. G3 cases

Author's personal copy
316 J. Feng et al. / Energy and Buildings 65 (2013) 310–321
Fig. 4. Range of 24-h total energy percentage difference between air system and radiant system at surface level (left) and hydronic level (right).
have adiabatic boundary conditions, and therefore, have negligibledifferences in total cooling energy. For G4 and G5, the total sur-face energy was 6–14% higher, and hydronic energy was 6–15%higher. The difference in total energy was not sensitive to the typeof radiant surface (ceiling or floor), but was sensitive to the amountof direct solar radiation. When exterior shadings were modeled,Psurf,tot and Phyd,tot decreased about 5%. This means higher windowsurface temperature (caused by direct solar) enhanced the radia-tion heat transfer between the window surfaces and radiant coolingsurface, and resulted in larger heat gain through the window forradiant system.
The three types of radiant systems displayed similar trends. ForRCP systems, zone hydronic level cooling energy was almost thesame as surface level, while for the ESCS and TABS, hydronic levelenergy was always slightly higher than surface level total energy.The difference was the energy used to cool the mass of the slabitself.
In general, even if the total zone level cooling energy may be5–15% higher for radiant systems compared to air systems, thereare many potential advantages of using hydronic-based radiantsystems such as, improved plant-side equipment efficiency withwarmer chilled water temperatures [38], possibility of nighttimepre-cooling to reduce peak demand [39], utilization of natural cool-ing resources, and energy efficiency in transporting energy withwater compared to air [3]. The combination of all these factorshas the potential to produce lower energy consumption for radiantcooling vs. air systems.
5.2. Peak cooling rate
Fig. 5 gives an example (G6: typical ceiling) of the cooling rateprofiles for the radiant systems and their equivalent air systems. Itcan be seen that radiant system cooling rate profiles were differentfrom the case of an air system. In general, a large portion of theheat was removed during the occupied period for the radiant case,and the radiant systems peak cooling rates were higher than the airsystem. Table 7 reports the values of the specific peak cooling ratefor the radiant (both hydronic and surface) and the air systems.
Fig. 6 plots the ranges of Psurf,pk and Phyd,pk for RCP, ESCS, andTABS. Results show that the radiant system peak surface/hydroniccooling rates exceed that of the air system by a wide range depend-ing on radiant system type and zone load conditions.
• For cases in G1 and G2, representing perimeter zones that areonly subjected to building envelope load, Psurf,pk ranged from 12to 25% for the RCPs, and 16–27% for the ESCS. For RCP and ESCS,
Phyd,pk was in a similar range as Psurf,pk,While little variation inboth Psurf,pk and Phyd,pk can be noted for changes in thermal insu-lation conditions, reduction of thermal mass resulted in muchless peak load differences between the radiant and air systems.
• For G3, the total internal load was the same for all cases but withdifferent radiant and convective splits for each case. The peakcooling rate differences ranged from 7 to 27% at the surface leveland from 7 to 33% at the hydronic level. Higher radiant fraction inheat gain produces larger differences in peak loads between thetwo systems at the surface level. This was further demonstratedin G4–G6.
• For G4, solar gain contributed to a pronounced increase in theradiation heat transfer at the radiant surface(s). When exteriorshading was not modeled, RCP ceiling surface peak cooling rateis 36% higher than the air system, and for ESCS ceiling systemit is 35%. When exterior shading was modeled, the transmittedsolar gain was mostly diffuse allowing it to be evenly distributedamong all surfaces. Exterior shading reduced the direct solarimpact, but the surface peak cooling rates were still 24–33%higher for the ceiling system.
• When the floor was used as the radiant cooling surface andwhen it was illuminated by direct solar, both Psurf,pk and Phyd,pkincreased dramatically compared to the ceiling cases. The ESCSsurface peak cooling rate was 69% higher and for TABS it was 85%higher. Exterior shadings greatly reduced the absolute values ofthe peak load in all systems and the difference between radiantand air systems at the surface level for both radiant systems.
While the high peak-cooling rate shown may be regarded asan enhancement of cooling capacity of the radiant cooling system[40,41], the sizing of the associated waterside equipment must takethis increase into account.
6. Discussion
6.1. Cooling load dynamic for radiant system
In order to explain why the radiant system peak cooling rateis higher than the equivalent air systems, Fig. 7 investigates zonecooling load dynamics for the two systems. Using case rad0.6 (RCP)as an example, the figure compares the processes of how radiativeand convective heat gains are converted into zone cooling load forthe two systems. To assist the explanation, Fig. 8 plots the opera-tive temperature, air temperatures, and active and non-active wallsurface temperatures for the two systems. Radiant cooling surfacetemperature is also plotted. For Case rad0.6, the total internal heat

Author's personal copy
J. Feng et al. / Energy and Buildings 65 (2013) 310–321 317
Fig. 5. Comparison of design day cooling rate profiles between radiant and air systems. (G6 typical ceiling: cl shade rad0.6).
Table 7Peak cooling rate comparison for summer design day.
Group Cases RCP vs. Air (W/m2) ESCS vs. Air (W/m2) TABS vs. Air (W/m2)
q′′
surf,pk q′′hyd,pk
q′′air,pk
q′′surf,pk
q′′hyd,pk
q′′air,pk
q′′surf,pk
q′′hyd,pk
q′′air,pk
G1 hw r2 7.7 7.8 6.2 8.5 8.7 6.7 8.5 9.7 6.3hw r1 12.9 13.0 10.4 13.9 14.2 11.0 13.6 15.1 10.1
G2 hw r2 7.7 7.8 6.2 8.5 8.7 6.7 8.5 9.7 6.3lw r2 14.1 14.0 12.6 14.4 14.6 12.4 14.4 16.6 11.0
G3 rad0 14.5 14.5 13.6 14.6 14.7 13.6 14.0 15.0 12.8rad0.3 13.9 13.9 12.6 14.5 14.6 12.7 14.0 15.1 11.4rad0.6 13.2 13.2 11.7 13.8 13.9 12.0 13.8 14.9 11.2rad1 12.5 12.6 10.9 13.1 13.3 11.3 13.0 13.7 10.3
G4 cl noshade 51.7 52.2 37.9 39.8 39.5 29.4 39.9 40.6 26.8cl shade 29.4 29.7 23.5 26.0 26.7 21.0 25.6 29.0 19.3
G5 flr noshade NA NA NA 54.6 62.1 32.2 48.4 44.7 26.2flr shade NA NA NA 28.8 33.0 20.6 25.1 30.7 18.3
G6 cl shade rad0.6 41.9 42.2 35.2 35.6 36.0 30.6 35.5 37.3 28.0
gain (15 W/m2 during occupied hours) was divided into convectiveheat gain (6 W/m2) and radiative heat gain (9 W/m2). As shown, thecooling load for both systems was composed of two components,one that originated as convective heat gain from internal loads,and one that originated as radiative heat gain from internal loads.The instantaneous cooling load depends both on the magnitudeand on the nature of the heat gains acting at the same instant. In azone conditioned by an air system, the cooling load is 100% convec-tive, while for the radiant systems the cooling load represents the
total heat removed at the activated ceiling surface, which includesincident radiant loads, longwave radiation with non-activated zonesurfaces and convective heat exchange with the warmer room air.In the case of air system (left plots), convective heat gain becomescooling load instantaneously, and radiative gains are absorbed byzone thermal mass and re-released as convective load. The fact thatbuilding mass delays and dampens the instantaneous heat gain iswell recognized by cooling load calculation methods. For the radi-ant cooling system (right plots), a large portion of the radiative heat
Fig. 6. Peak cooling rate percentage difference between radiant and air systems.

Author's personal copy
318 J. Feng et al. / Energy and Buildings 65 (2013) 310–321
Fig. 7. Comparison of surface cooling breakdown (convective and radiative part) for G3 Case rad0.6: air system (left) and radiant cooling panel (RCP) system (right).
5 10 15 20
28
26
24
22
20
Air_Operative temp.
Air_Air te mp.
Air_Exwall surface temp.
Rad_ Operative temp.
Rad_ Air temp.
Rad_E xwa ll surf ace tem p
Rad_ rad iant surface temp
Fig. 8. Comparison of zone air temperatures, operative temperatures, active andnon-active surface temperatures between radiant and air systems (G6 typical ceil-ing: cl shade rad0.6).
gain converts to cooling load directly during the occupied perioddue to the presence of the cooling surface(s). Not all convectivegains instantaneously contribute to cooling load, a smaller amountcompared to the air system, during the occupied hours because ahigher zone air temperature is reached to balance the cooler ceilingsurface temperature, thereby maintaining an equivalent operativetemperature, as is shown in Fig. 8. And because of the higher zoneair temperature, a small part of the convective heat gain is absorbedby non-activated building mass and removed by the radiant surfacevia longwave radiation. The bottom plots stack up the two coolingload components, and the solid black lines in the bottom plots arehourly cooling loads, which reach their peak value at the end of theoccupied period for both systems. These predicted cooling loadsrepresent the total amount of heat being removed by each systemto maintain the same operative temperature profile. Note that thepeak cooling rate for the radiant system is predicted to be 13.0%greater than that for the air system.
Based on the discussion above, the author modified the coolingload generation diagram presented in Chapter 18 of ASHRAE Fun-damentals (2009) to represent the cooling load generation processwhen the zone is cooled by a radiant system (Fig. 9). The originaldiagram was used to explain the cooling load generation processfor an air system, and based on which most of the simplified coolingload calculation methods have been developed. The modificationsare highlighted in red lines.

Author's personal copy
J. Feng et al. / Energy and Buildings 65 (2013) 310–321 319
Fig. 9. The cooling load generation scheme for air system adapted from ASHRAE Fundamentals (2009) and proposed modifications for radiant system.
This modified diagram illustrates that the cooling load differ-ences between the two systems originate from two aspects: (1)radiant cooling surface(s) directly remove part of the radiant heatgain and reduce heat accumulation in the building mass; (2) onlypart of the convective heat gain becomes instantaneous coolingload, and the remainder partly contributes to increased air tem-perature and partly is stored in building mass and removed by theradiant surface as surface cooling load.
6.2. Definition of cooling load for different radiant system types
Throughout this study, we felt there is a need to clarify the def-initions of design cooling load for sizing radiant systems and todistinguish between the three types of systems for the followingreasons:
1. There is no clear definition of design cooling load for sizing radi-ant systems. According to ASHRAE Handbook [29], cooling loadis defined as: “the rate at which sensible and latent heat mustbe removed from the zone to maintain a constant zone air tem-perature and humidity”. However, zone air temperature is notrecommended as the control temperature when radiant systemsare involved [4]. In addition, in ISO 11855 (2012), design sensi-ble cooling load is defined as: “required sensible thermal outputnecessary to achieve the specified design conditions at the outsidesummer conditions.” It is not clear from this definition what the“specified design conditions” is.
2. Differences in thermal and control characteristics of the threeradiant system types are usually not accounted for when deter-mining design cooling loads. Peak instantaneous cooling loadis normally used for sizing air system equipment, but it is notthe most relevant for sizing all types of radiant systems. Oneexample is the TABS. The reasons are (1) intermittent or night-time operation is often implemented in order to take advantageof the storage capability of the active surface for load shifting,(2) time constants for these systems are large so it is not fea-sible to control the hydronic system in response to short-termenvironmental changes (load, setpoint changes) [30,42].
3. As mentioned before, radiant cooling systems (ESCS and TABS)are integrated with the building mass. As a result, cooling ratesat the surface and at the hydronic level are different due to themass (thermal storage and delay). In cases of air systems, zonecooling load is directly used for sizing the HVAC systems, whilein the case of a radiant system, the cooling load imposed on thehydronic loop is a better reference for sizing of cooling plantequipment.
Based on the discussion above, we propose to (1) distinguishthe design cooling load definition for sizing the quicker-responseRCP/ESCS from the slower-response TABS; (2) define surface cool-ing load for the determination of required cooling surface area,and define hydronic cooling load for sizing hydronic equipment(pumps, cooling plant, etc.).
For RCP and lightweight ESCS, the cooling load definitions areSurface cooling load: the rate at which sensible heat must be
removed by the actively cooled surface(s) from the zone to main-tain a constant zone operative temperature during cooling designday. Peak surface cooling load should be used for determining totalrequired cooling surface area.
Hydronic cooling load: the rate at which heat must be removedby the hydronic loop to maintain a constant zone operative temper-ature during cooling design day. Peak hydronic cooling load shouldbe used for sizing cooling plant equipment.
The specific surface cooling load can be theoretically calculatedby Eq. (1) at design conditions. If we further breakdown the surfaceradiation term into different radiation components, Eq. (1) can beexpanded as following,
q′′
surf = q′′conv + q′′
lw surf + q′′lw int + q′′
sw sol + q′′sw int (3)
The last three terms, longwave radiant exchange flux from internalloads, transmitted solar radiation flux absorbed at surface and netshortwave radiation flux to surface from internal loads (lights), arethe incident radiation that we discussed in the previous sections.During the sizing process, these three terms can be considered as anenhancement of cooling capacity [41], therefore, even if the peakcooling load of a radiant system may be higher than the coolingload calculated using traditional tools without capability to captureradiation heat transfer, the total area required may not need to beincreased. Future research is needed to quantify how the three inci-dent radiation terms mentioned above will affect sizing of coolingsurface area.
For the RCP, hydronic cooling load is the surface cooling loadplus heat loss from the backside of the panels, if any. For ESCS, thecorrelation between surface cooling rate and hydronic cooling rateis complicated by the heat conduction through the slab. Part 2 of ISO11855 [4] recommends three methods for estimating surface cool-ing output and correlating the output with hydronic side operatingconditions.
Design cooling load calculation for TABS has to take into accountthe control and operation strategy.
For example, Part 4 of ISO 11855 (2012) provides guidance oncalculating cooling capacity and cooling power demand on water-side to be used to select the cooling system, and it proposed to sizethe cooling equipment based on the sum of the heat gain values

Author's personal copy
320 J. Feng et al. / Energy and Buildings 65 (2013) 310–321
acting during the whole design day, internal load pattern, hydronicloop operation schedule, as well as radiant system specifications.Therefore, cooling load used for sizing TABS is not a unique value.
6.3. Proposed improvements in the design standards
As mentioned before, current radiant cooling design standardsdo not explicitly identify the differences in cooling load calculationsbetween radiant and air systems. This results in the misapplica-tion of tools in design practice not just for cooling load calculationsbut sometimes for detailed energy and comfort analysis. Currently,there are three classes of zone thermal models used in energy simu-lation tools: heat balance (HB), thermal network (TN), and transferfunction (TF) models [43]. The HB and TN methods require rela-tively extensive computation time and effort from their users, andtherefore are not widely adopted in tools used by design practition-ers. The tools that use these two zone models, however, have thecapability to capture detailed heat transfer processes in the zonesand are recommended for use when radiant cooling systems areinvolved in the design. Modifications to the TF method, in partic-ular the RTS method for radiant system cooling load calculationscould be a good solution, but would require future research andis not an easy job due to the coupling of the radiant slab with thebuilding structure.
Radiant systems should be modeled to ensure that the cooledsurfaces are participating at the zone level heat transfer during thedesign calculation. A review of design tool showed that even thoughdynamic simulation tools are used for energy analysis, the coolingequipment sizing is often based on cooling loads calculated for anideal air system. For example, the authors observed this in the Ener-gyPlus “autosizing” algorithm for radiant systems. In EnergyPlus,the HB method is used as the zone heat transfer model so it has thecapability to calculate cooling load accurately when radiant sys-tems are involved. However, it also assumes that the cooling loadfor a radiant system is the same as for an air system. Therefore, if“autosizing” function is used, an “ideal air system” is simulated firstfor load calculation, and this cooling load is used for sizing all asso-ciated cooling equipment, including radiant system design massflow rate, total tube length, and radiant system plant equipment.The users can manually adjust the design parameters if necessary,but failure to realize the cooling load differences between radiantand air systems can produce significant errors.
In summary, the following text and recommendations could beincluded in radiant cooling design guidelines to improve under-standing of radiant cooling system and to facilitate better designsolution:
• The cooling load for zones conditioned by a radiant system isdifferent from the cooling load for zones conditioned by an airsystem. The differences between the two systems originate fromtwo aspects: (1) active radiant cooling surface(s) directly removepart of the radiant heat gain and reduce heat accumulation in thebuilding mass; (2) only part of the convective heat gains becomesinstantaneous zone cooling load (as is the case in an air system),and the other portion partly contributes to increased air tem-perature and partly is stored in building mass and subsequentlyremoved by the active radiant surface as surface cooling load.
• For RCP and lightweight ESCS, peak surface cooling load shall beused for dimensioning total required cooling surface area, andpeak hydronic cooling load shall be used for sizing associatedcooling equipment. For TABS, equipment sizing depends on totalheat gain energy, heat pattern, operational strategy, etc.
• Simulation tools that use either heat balance or thermal networkmethods for zone level thermal modeling are recommended fordesign cooling load and system sizing calculations for radiant
systems. Examples of the recommended tools are: EnergyPlus,IES Virtual Environment, IDA ICE, Esp-r, TRNSYS.
• The following design procedure is recommended for load calcu-lation and system equipment sizing: (1) conduct a basic coolingload calculation as if an ideal air system with unlimited cool-ing capacity is used for conditioning the space. This basic coolingload value can be used for comparing different design options.If a radiant system is choosen, the basic cooling load value canbe used as a starting point for dimensioning the radiant coolingsystem; (2) recalculate design surface cooling load and hyrdoniccooling load for the radiant system. During this process, the radi-ant cooling system should be modeled with a computer programthat meets the prescribed requirements mentioned above. Sizethe radiant system properly to satify prescribed thermal com-fort requirements. (3) Size the cooling plant equipment based ondesign hydronic cooling load calculated from step 2.
7. Conclusions
This simulation study investigated the impacts of the presenceof an activated cooled surface on zone cooling loads by comparingthe peak cooling rate and the 24-h total cooling energy for radiantand air systems. Three radiant system types (RCP/ESCS/TABS) andsingle zone models were developed for comparison between eachradiant system type and their equivalent air system. The modelswere configured to study the impacts of the following parameters:envelope thermal insulation, thermal mass, type of internal gain,solar heat gain with different shading options, and radiant surfaceorientation (ceiling, floor). The simulation results are summarizedbelow:
• For the simulated cases, when compared to an air system forequivalent comfort conditions (operative temperature), zonelevel 24-h total cooling energy removed by the RCP systemhydronic loop was 5–13% higher, 6–15% higher for the ESCS, and6–15% higher for the TABS. This was caused by lower surface tem-peratures at the inside surfaces of the building envelope createdby the active (cooled) radiant surface.
• For perimeter zones that were only subjected to building enve-lope conduction heat gain, Psurf,pk ranged from 12 to 25% for theRCPs, 16 to 27% for the ESCS, and 31 to 35% for the TABS. For theRCP and the ESCS, Phyd,pk were in the similar range as Psurf,pk,butfor the TABS, Phyd,pk increased to 50–54%.
• For interior zones with longwave radiant heat gain, the peak cool-ing rate differences ranged from 7 to 27% at the surface leveland from 7 to 33% at the hydronic level. This implies that higherradiant fraction in heat gain produces larger differences in peakcooling rates between the two systems at the surface level. Thiswas further demonstrated in cases with solar load.
• For perimeter zones and atrium where direct solar heat gainconstitutes a large portion of the cooling load, the peak coolingload difference is pronounced. When exterior shading was notinstalled, RCP ceiling surface peak cooling rate is 36% higher thanthe air system, and for ESCS ceiling system it is 35%, and 49% forTABS ceiling systems. Exterior shading reduced the direct solarimpact, but the surface peak cooling rate were still 24–33% higherfor the ceiling system.
• When the floor was used as the radiant cooling surface and whenit was illuminated by direct solar, both Psurf,pk and Phyd,pk increaseddramatically compared to the ceiling cases. The ESCS surfacepeak cooling rate was 69% higher and for TABS, 85% higher. Exte-rior shading greatly reduced the difference between radiant andair systems at the surface level for both radiant systems. How-ever, Phyd,pk for TABS was not much affected by the installation ofshading system.

Author's personal copy
J. Feng et al. / Energy and Buildings 65 (2013) 310–321 321
• Cooling rate differences between the two systems originate fromtwo effects: (1) radiant cooling surface(s) directly remove partof the radiant heat gain and reduce heat accumulation in thebuilding mass; (2) only part of the convective heat gain becomesinstantaneous cooling load, the remainder partly contributes toincreased air temperature and partly is stored in the buildingmass and removed by the radiant surface as surface cooling load.
In conclusion, zones conditioned by a radiant system have dif-ferent peak cooling loads than those conditioned by an air system.While the increase in 24-h total cooling energy is relatively smalland may be offset by other energy savings benefits associated withradiant cooling systems, the differences in peak cooling load both interms of magnitude and time compared to the air systems requirespecial attention in system and control design. In the radiant designstandard, these differences in cooling load should be clearly statedand translated into requirements for tools and methods. Trans-fer function (TF) based methods are not appropriate for coolingload calculation when radiant cooling systems are involved. Radi-ant systems should be modeled using a dynamic simulation toolthat employs either heat balance (HB) model or thermal network(TN) models during the design process for accurate cooling loadcalculation.
References
[1] B.A. Thornton, W. Wang, M. Lane, M. Rosenberg, B. Liu, Technical Support Doc-ument: 50% Energy Savings Design Technology Packages for Medium OfficeBuildings, in: PNNL-19004, Pacific Northwest National Laboratory, 2009.
[2] B. Olesen, Using building mass to heat and cool, ASHRAE Journal (2012) 19–24.[3] H. Feustel, C. Stetiu, Hydronic radiant cooling – preliminary assessment, Energy
and Buildings 22 (1995) 193–205.[4] ISO, ISO-11855: Building Environment Design – Design, Dimensioning, Instal-
lation and Control of Embedded Radiant Heating and Cooling Systems,International Organization for Standardization, 2012.
[5] ASHRAE, ANSI/ASHRAE 138-2009: Method of Testing for Rating Ceiling Panelsfor Sensible Heating and Cooling, in: American Society of Heating, Refrigeratingand Air Conditioning Engineers Inc., Altanta, GA, 2009.
[6] CEN, EN14240: Ventilation for buildings – chilled ceiling testing and rating,2004.
[7] J. Babiak, B. Olesen, D. Petras, Low temperature heating and high tem-perature cooling – REHVA Guidebook, Federation of European Heating ahdAir-Conditioning Associations, 2007.
[8] CEN, EN15377: Heating systems in buildings-design of embedded water basedsurface heating and cooling systems, 2008.
[9] R.D. Watson, K.S. Chapman, Radiant Heating and Cooling Handbook, McGraw-Hill, New York, 2002.
[10] Z. Tian, Design of energy efficient building with radiant slab cooling, NR33817,University of Calgary (Canada), 2007.
[11] G. McDonell, Energy and Control Issues Related to Radiant Slab Systems,in: http://www.healthyheating.com/downloads/Geoff%20McDonell%203.pdf,2005.
[12] R. Howell, Final Report for ASHRAE RP-394: A study to determine methods fordesigning radiant heating and cooling systems, Department of Mechanical andAerospace Engineering, University of Missouri-Rolla, 1987.
[13] K.S. Chapman, J. Rutler, R.D. Watson, Impact of heating systems and wall surfacetempeartures on room operative temperature fields, ASHRAE Transactions 106(1) (2000) 506–514.
[14] Q. Chen, Comfort and energy consumption analysis in buildings with radiantpanels, Energy and Buildings 14 (4) (1990) 287–297.
[15] J. Niu, Cooling load dynamics of rooms with cooled ceilings, Building ServicesEngineering Research and Technology 18 (4) (1997) 201–207.
[16] Q. Chen, J.v.d. Kooi, ACCURACY – a computer program for combined problemsof energy analysis, indoor airflow and airquality, ASHRAE Transactions 94 (2)(1988).
[17] S.P. Corgnati, Heat flows and air distribution in rooms cooled by radiant panels,Department of Energetics, Politecnico de Torino, 2002 (Ph.D dissertation).
[18] F. Causone, S.P. Corgnati, M. Filippi, B.W. Olesen, Solar radiation and coolingload calculation for radiant systems: definition and evaluation of the DirectSolar Load, Energy and Buildings 42 (3) (2010) 305–314.
[19] ASHRAE, Panel heating and cooling, in: ASHRAE Handbook: HVAC Systems andEquipment, American Society of Heating, Refrigerating and Air ConditioningEngineers Inc., Altanta, GA, 2012.
[20] F.C. McQuiston, J.D. Spitler, Cooling and heating load calculation manual,ASHRAE, Atlanta, GA, 1992.
[21] J.D. Spitler, D.E. Fisher, C.O. Pedersen, The radiant time series cooling loadcalculation procedure, ASHRAE Transactions 103 (1997) 503–518.
[22] P. Simmonds, Radiant success: design for energy-efficient comfort in California,Engineered Systems (December) (2012) 24–31.
[23] CEN, EN 15255: Energy performance of buildings – sensible room cooling loadcalculation – general criteria and validation procedures, European Committeefor Standardization, 2007.
[24] PRICE, Introduction to radiant heating and cooling, in: Engineer’s HVAC Hand-book – A Comprehensive Guide to HVAC Fundamentals, Price IndustriesLimited, Winnipeg, MB, Canada, 2011.
[25] P. Simmonds, I. Chambers, B. Mehlomakulu, C. Simmonds, Applied performanceof radiant ceiling panels for cooling, ASHRAE Transactions (2006) 368–376.
[26] G. McDonell, Personal communication, 2012.[27] Uponor, LoopCAD 2012, 2012.[28] E. Fabrizio, S.P. Corgnati, F. Causone, M. Filippi, Numerical comparison between
energy and comfort performances of radiant heating and cooling systemsversus air systems, HVAC&R Research 18 (4) (2011) 692–708.
[29] ASHRAE, Nonresidential cooling and heating load calculations, in: ASHRAEHandbook: Fundamentals, American Society of Heating, Refrigerating and AirConditioning Engineers Inc., Altanta, GA, 2009.
[30] J. Babiak, Low temperature heating and high temperature cooling – thermallyactivated building system, Department of Building Services, Technical Univer-sity of Denmark, 2007.
[31] DOE, EnergyPlus Engineering Reference, 2011.[32] DOE, EnergyPlus Energy Simulation Software, 2012 (2012).[33] C. Chantrasrisalai, V. Ghatti, D.E. Fisher, D.G. Scheatzle, Experimental validation
of the EnergyPius low-temperature radiant simulation, ASHRAE Transactions109 (2) (2005).
[34] D. Fischer, Final Report for ASHRAE RP-1282: Lighting heat gain distribution inbuildings, Okalahoma State University, 2006.
[35] M.H. Hosni, B.T. Beck, ASHRAE RP1482 Final Report: Update to measurementof office equipment heat gain data, Kansas State University, 2009.
[36] ASHRAE, ANSI/ASHRAE Standard 140: Standard Method of Test Fort the Eval-uation of Building Energy Analysis Computer Program, ASHRAE, Atlanta, GA,2007.
[37] M. Achermann, G. Zweifel, RADTEST – Radiant Heating and Cooling Test Cases,IEA Task 22, Subtask C, International Energy Agency, 2003.
[38] N.T. Gayeski, Predictive pre-cooling control for low lift radiant cooling usingbuilding thermal mass, Department of Architecture, Massachusettes Instituteof Technology, 2010.
[39] T.X. Nghiem, Green scheduling of control systems, University of California, 2012(PhD dissertation).
[40] P. Simmonds, B. Mehlomakulu, T. Ebert, Radiant cooled floors: operation andcontrol dependant upon solar radiation, ASHRAE Transactions (2006) 358–367.
[41] J. Feng, S. Schiavon, F. Bauman, Impact of solar heat gain on radiant floor coolingsystem design, in: Proceedings of the 11th REHVA World Congress-CLIMA 2013,Prague, Czech Republic, 2013.
[42] B. Olesen, New European standards for design, dimensioning and testingembedded radiant heating and cooling systems, in: Proceedings of Clima 2007,2007.
[43] ASHRAE, Energy estimating and modeling method, in: ASHRAE Handbook: Fun-damentals, American Society of Heating, Refrigerating and Air ConditioningEngineers Inc., Altanta, GA, 2009.