author's personal copy - research.coquipr.com · received in revised form 17 march 2009...
TRANSCRIPT
Author's personal copy
Automated classi!cation of bird and amphibian calls using machine learning: Acomparison of methods
Miguel A. Acevedo a,!, Carlos J. Corrada-Bravo c, Héctor Corrada-Bravo b,Luis J. Villanueva-Rivera d, T. Mitchell Aide a
a University of Puerto Rico, Department of Biology, Puerto Ricob University of Wisconsin-Madison, Department of Computer Sciences, United Statesc University of Puerto Rico, Department of Computer Science, Puerto Ricod Purdue University, Department of Forestry and Natural Resources, United States
a b s t r a c ta r t i c l e i n f o
Article history:Received 2 December 2008Received in revised form 17 March 2009Accepted 20 June 2009
Keywords:Amphibian callsBird callsDecision treeLinear discriminant analysisMachine learningSupport vector machine
We compared the ability of three machine learning algorithms (linear discriminant analysis, decision tree,and support vector machines) to automate the classi!cation of calls of nine frogs and three bird species. Inaddition, we tested two ways of characterizing each call to train/test the system. Calls were characterizedwith four standard call variables (minimum and maximum frequencies, call duration and maximum power)or eleven variables that included three standard call variables (minimum and maximum frequencies, callduration) and a coarse representation of call structure (frequency of maximum power in eight segments ofthe call). A total of 10,061 isolated calls were used to train/test the system. The average true positive rates forthe three methods were: 94.95% for support vector machine (0.94% average false positive rate), 89.20% fordecision tree (1.25% average false positive rate) and 71.45% for linear discriminant analysis (1.98% averagefalse positive rate). There was no statistical difference in classi!cation accuracy based on 4 or 11 callvariables, but this ef!cient data reduction technique in conjunction with the high classi!cation accuracy ofthe SVM is a promising combination for automated species identi!cation by sound. By combining automateddigital recording systems with our automated classi!cation technique, we can greatly increase the temporaland spatial coverage of biodiversity data collection.
© 2009 Published by Elsevier B.V.
1. Background
Our understanding of ecological systems is inadequate because ourknowledge is based on very limited spatial and temporal scales (Levin,1992; Condit, 1995; Porter et al., 2005). New advances in satelliteimaging and sensor networks have provided invaluable tools for col-lecting land-cover and abiotic data over larger scales; however,collecting biodiversity data, especially for fauna is still limited due tothe need for species identi!cation by humans. Recent developmentsin computer science for pattern recognition and classi!cation areproviding new tools to meet this challenge.
Most classi!cationmethods used for the automated identi!cation ofspecies classify samples based on morphological characteristics (Gauldet al., 2000) or bioacoustic signals (Brandes et al., 2006; Nickerson et al.,2006; Fagerlund, 2007). Classi!cation of samples based on morpholo-gical characteristics requires the collectionof theorganismorportions ofthe organism (such as wings, pollen or genitalia) which requiresintensive !eld sampling. However, sound can be collected easily in the
!eld through automated digital recorders, which can collect data con-tinuously and have the ability to detect more species than traditionalscienti!c surveys (Acevedo and Villanueva-Rivera, 2006). Furthermore,these recordings can be analyzed with classi!cation methods to auto-mate species identi!cation.
The two most important tasks in the process of automated speciesidenti!cationwith sound are signal detection and signal characteriza-tion (Rickwood and Taylor, 2008). Signal detection refers to the ex-traction of vocalizations of interest from the noisy environment of acontinuous recording. Signal characterization refers to the classi!ca-tion of these extracted vocalizations into species. Signal detection hasbeen well studied for human speech recognition; however, eventhough multiple classi!cation methods have been applied for signalcharacterization, few studies have compared the precision and accu-racy of these methods (Skowronski and Harris, 2006).
Many studies argue that supervised machine learning algorithmssuch as linear discriminant analysis (Simmonds et al., 1996; Parsonsand Jones, 2000), decision trees (Herr et al., 1997), Arti!cial NeuralNetworks (ANN) (Balfoort et al., 1992; Boddy et al., 1994; Do et al.,1999; Chesmore et al., 2001), Hidden Markov Chains (Kogan andMargoliash, 1998) and support vector machines (SVMs) (Fagerlund,2007) are the best choice for automated species identi!cation because
Ecological Informatics 4 (2009) 206–214
! Corresponding author.E-mail address: [email protected] (M.A. Acevedo).
1574-9541/$ – see front matter © 2009 Published by Elsevier B.V.doi:10.1016/j.ecoinf.2009.06.005
Contents lists available at ScienceDirect
Ecological Informatics
j ourna l homepage: www.e lsev ie r.com/ locate /eco l in f

Author's personal copy
of their high accuracy (N90% accuracy) when compared to humanclassi!cation. The major disadvantage of these algorithms is that theyrequire large numbers of samples (hundreds to thousands) to trainthe system to obtain this high accuracy. Moreover, the training stage ofmost of these supervised ML algorithms is computationally demand-ing due to the large amount of data used as input. Thus, there is a needfor new ways to reduce the amount of data used for training withoutcompromising precision or accuracy.
The objectives of this study are (1) to compare three machinelearning algorithms (linear discriminant analysis, decision tree andsupport vector machine) in the automated classi!cation of bird andamphibian calls and (2) to compare two methods of training data re-duction, one that characterizes each call with four standard variables(minimum and maximum frequencies, call duration and maximumpower) and another that included 11 call variables (minimum fre-quency, maximum frequency, call duration and the frequency ofmaximum power in eight segments of the call). To make these com-parisons we used 2132 recordings from Puerto Rico that include ninespecies of Eleutherodactylus frogs and three birds.
2. Study sites
Recordings were collected from 14 montane sites in Puerto Rico(Fig. 1). One site was located in the Guajataca State Forest and twosites in the Maricao State Forest. Three other sites were located in theToro Negro State Forest, two sites were located in the Carite StateForest and six sites in El Yunque National Forest.
3. Methods
3.1. Sound recordings
Recordings were made using an automated digital recording sys-tem (ADRS) (Acevedo and Villanueva-Rivera, 2006). This recordingsystem was composed of a Nomad Jukebox 3 digital mp3 player andrecorder (DAP-HD0003, Creative Labs, California) which recorded 16-bit wav !les at a sampling rate of 48 kHz (Villanueva-Rivera, 2007).We used a Sony ECM-MS907 electret condenser microphone with adirected angle of 120°. To improve sound quality the microphone wasconnected to a preampli!er (SP-PREAMP, The Sound Professionals,Inc., New Jersey). The microphonewas placed ~1 m above the ground.At each site the automated recorder collected 1 min of sound every30 min for !ve consecutive days.
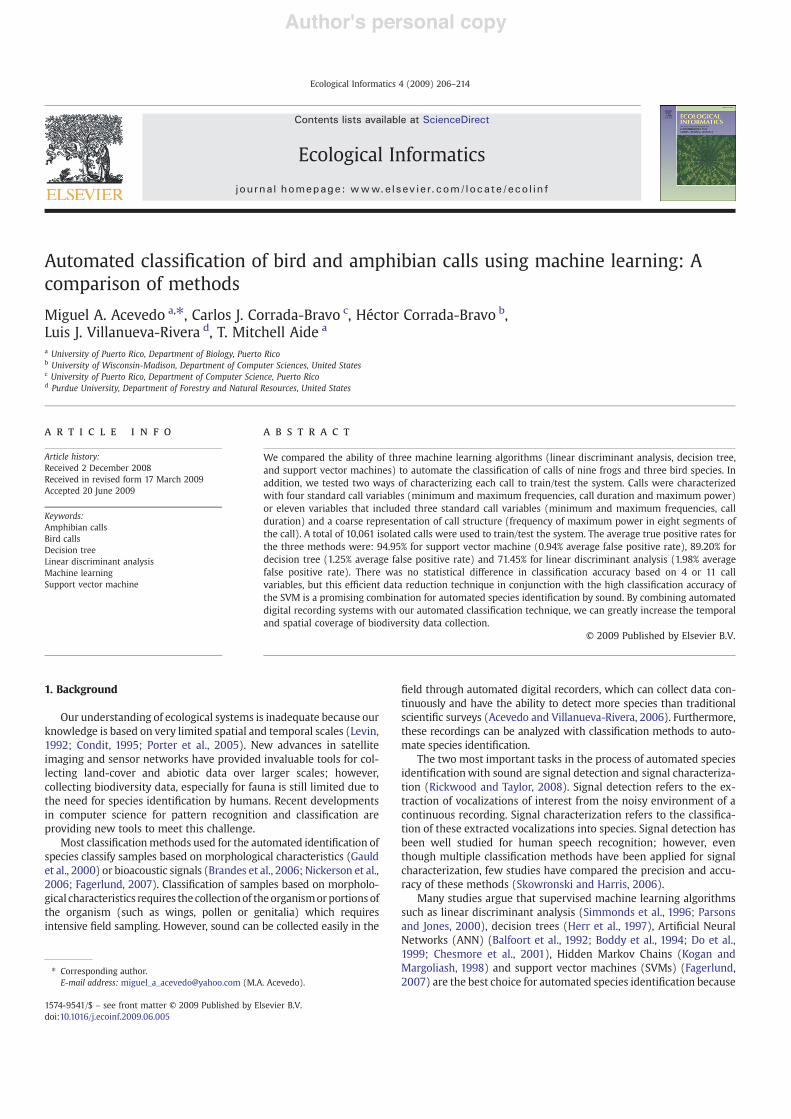
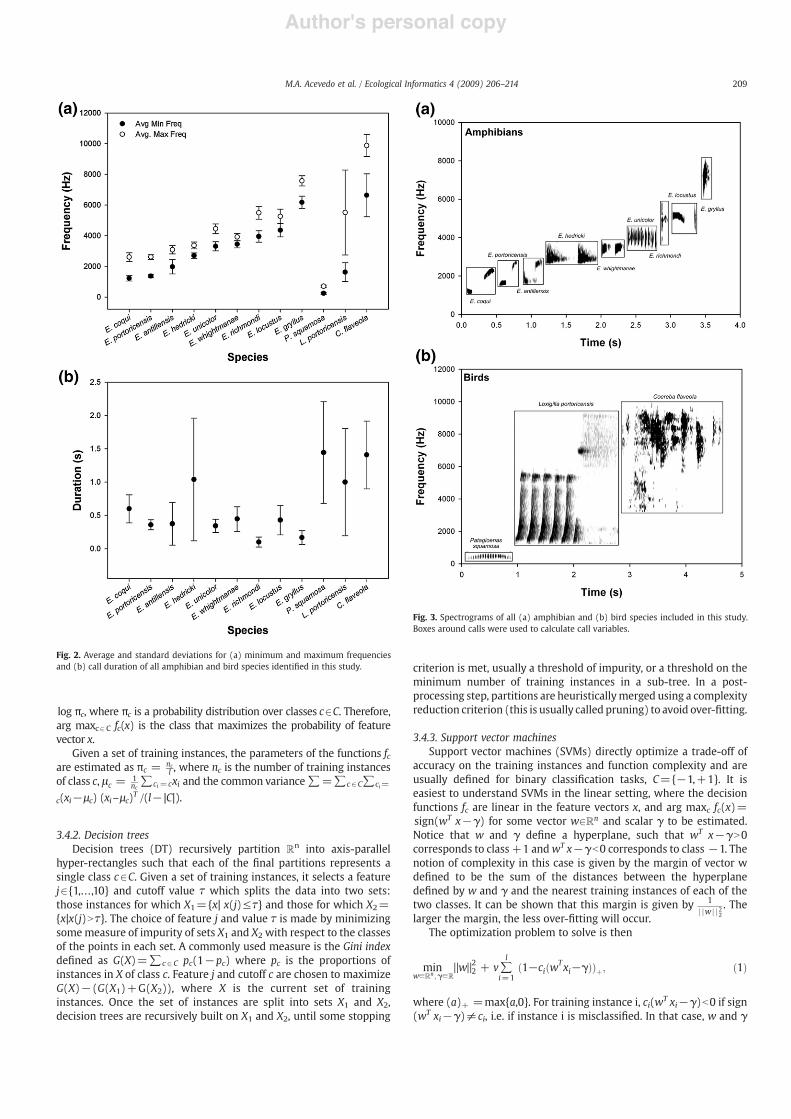
The recording dataset included samples of 12 species (9 frogs and 3birds). These include most of the extant Eleutherodactylus frog com-munity in Puerto Rico'smountains (E. coqui, E. portoricensis, E. antillensis,E. hedricki, E. wightmanae, E. unicolor, E. richmondi, E. locustus andE. gryllus) and three common mountain bird species (Patagioenassquamosa, Loxigilla portoricensis and Coereba !aveola). These 12 speciesvary greatly in frequency bandwidth, call duration and call structurewhich makes it an appropriate dataset to test classi!cation accuracy ofmachine learning methods in complex acoustical communities (Fig. 2).Moreover, E. coqui and E. portoricensis are species with very similar callcharacteristics which provide a true classi!cation challenge (Fig. 3).
3.2. Data collection and veri"cation
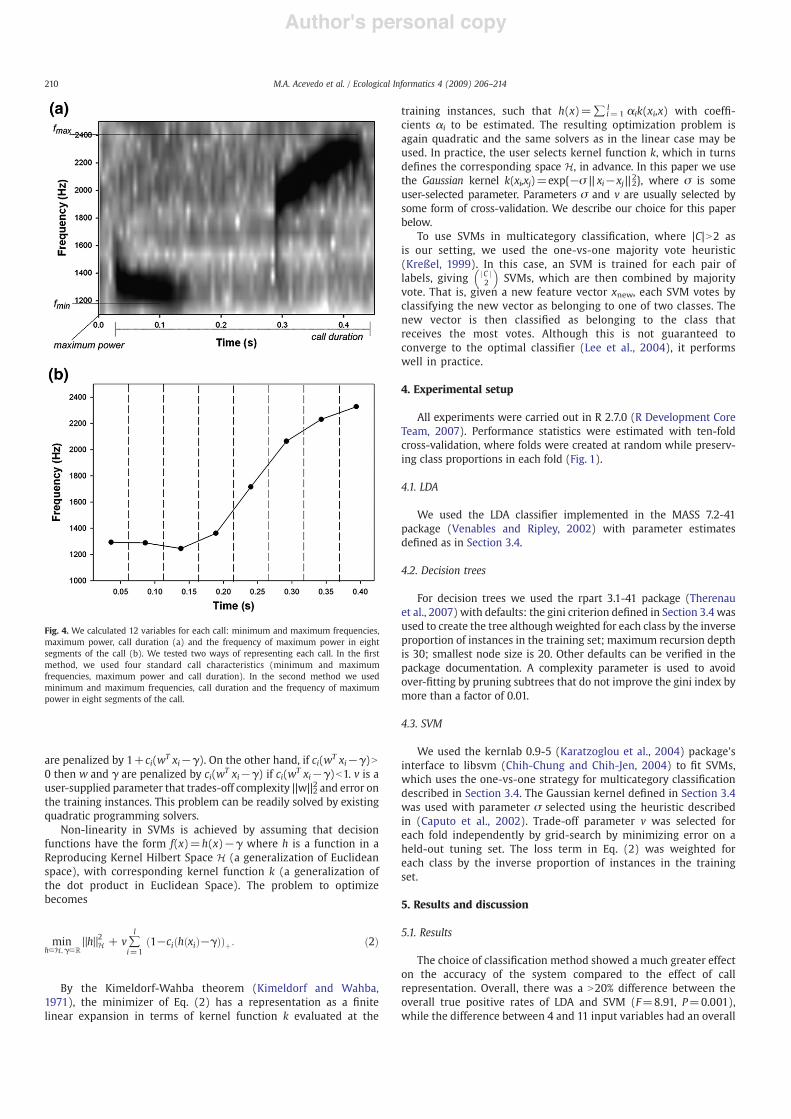
A total of 2,132 one minute recordings were made using ADRS(Fig. 1). These recordings were analyzed twice, !rst by one of us (L. J.Villanueva-Rivera) to identify all the frogs present. Then, a group oftrained students listened to the recordings, identi!ed the species offrogs and birds present, and isolated three sample calls of each species,using the box tool of Raven Pro 1.2.1. FFT transformations wereconstructed using a Hann window with 512 samples. In each isolatedcall we calculated minimum frequency, maximum frequency, maxi-mum power and call duration. These measures were chosen because
they show little overlap between species (Fig. 2). In addition, wedivided each call into eight segments in which we calculated thefrequency of the maximum power in each segment (Fig. 4).
We compared the species list made by both observers and in caseof a mismatch, a third person (M. Acevedo) listened to the recordingand determined the correct species list. In addition, we created corre-lation plots between variables (e.g. minimum frequency vs. maximumfrequency) to study outliers. These outliers were potential errors thatmay have been missed by the species list comparisons, thus we ver-i!ed that they were correctly classi!ed and/or that the box was cor-rectly drawn. Once we were certain that the data set was clean, weused the variables calculated for each call to train/test the threemachine learning algorithms (Fig. 1).
3.3. Signal Representation
We represented each call as a pair !x,c", where x2!n is a real-valuedvector of length 4 or 11 depending on the training data reductionmethod used to describe each call. We refer to this vector as a featurevector. Element c2C is an indicator of the species to which the signalbelongs (Eleutherodactylus coqui, E. portoricensis, E. antillensis, E. hedricki,E. wightmanae, E. unicolor, E. richmondi, E. gryllus, E. locustus, Patagioenassquamosa, Loxigilla portoricensis or Coereba !aveola).
A total of 10,061 sample calls were used to train/test the system.Given that Eleutherodactylus coqui is the most abundant frog in themountains of Puerto Rico, it was also the most common species in therecordings with the highest number of samples (N=4641) followedby E. unicolor (N=1052), E. portoricensis (N=857), E. wightmanae(N=769), E. richmondi (N=663), E. hedricki (N=320), E. gryllus(N=254), E. antillensis (N=196) and E. locustus (N=128). Coereba!aveolawas themost common bird (N=730) followed by Patagioenassquamosa (N=260) and Loxigilla portoricensis (N=191).
3.4. Signal classi"cation
The combination of variables that characterize each of the 10,061analyzed calls composed a set of independent and identically dis-tributed training instances {!x1,c1",…,!xl,cl"} used to estimate a set ofdecision functions fc, such that, given a new feature vector xnewclassi!es the call to the species de!ned by ! =arg maxc2C fc(xnew).This is the usual mathematical formulation of the supervised clas-si!cation setting. The challenge in this setting is avoiding over-!ttingthe estimated decision functions fc to the training instances. When thedecision functions are over-!tted they classify the training instancesalmost perfectly but fail to classify new calls correctly. The mainstrategy to avoid over-!tting is to limit the complexity of theestimated decision functions. For example, by assuming that decisionfunctions belong only to very restricted types, say linear in featurevectors x, or by allowing richer types of functions, but optimizingsome trade-off of complexity and accuracy on the training instances.See Hastie et al. (2001) for more details on the over-!tting problem inthe methods compared in this study.
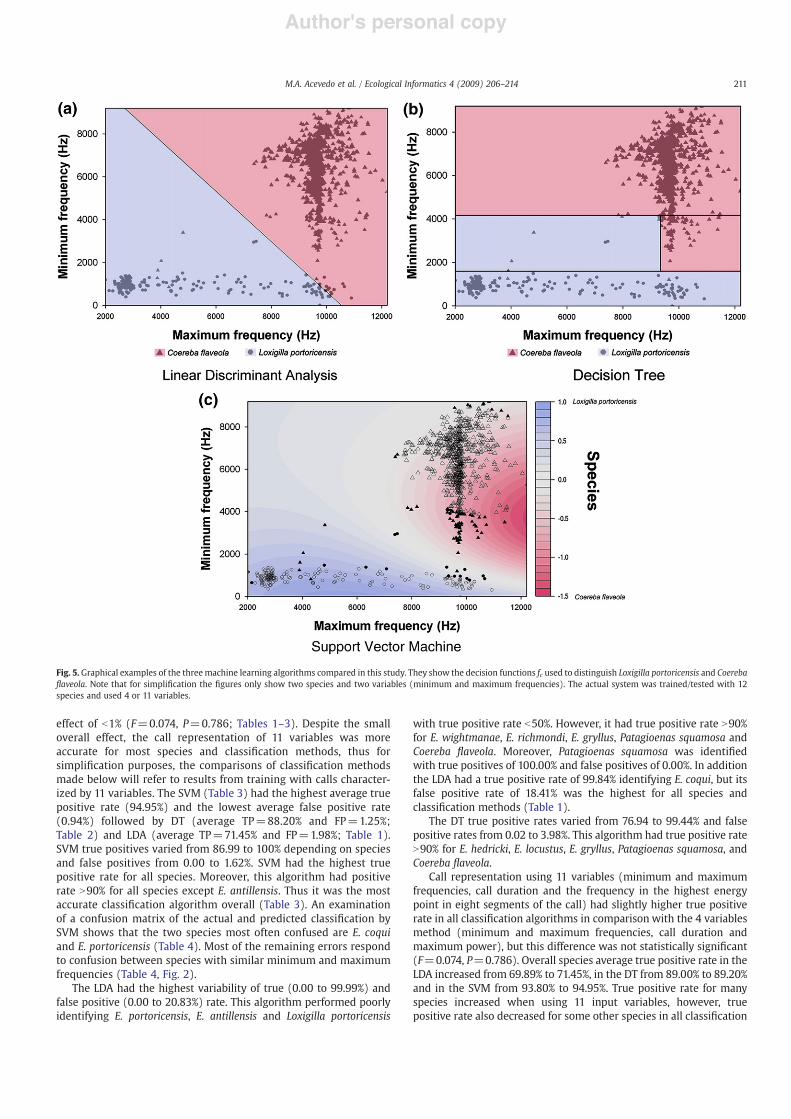
In this paper we report the results for three classi!cation algo-rithms: 1) linear discriminant analysis (LDA) which restricts functionsfc to be linear in feature vector x and assumes a probabilistic model foreach class (Fig. 5a); 2) decision trees which recursively partition !n
into axis-parallel hyper-rectangles and assigns a class to each partition(Fig. 5b). In this case, arg maxc2C fc(x) is given implicitly by the classassigned to the hyper-rectangle containing x. The complexity of thedecision tree is given by the number of partitions and the recursiondepth required to de!ne them. This is controlled by “pruning” the tree,usually a post-processing step done after an initial tree is createdfrom the training instances. 3) Support vector machines (SVMs)functions are allowed to be nonlinear in the feature vectors x and atrade-off between complexity and accuracy is directly optimized(Fig. 5c).
207M.A. Acevedo et al. / Ecological Informatics 4 (2009) 206–214

Author's personal copy
3.4.1. Linear discriminant analysisLinear discriminant analysis (LDA) assumes that feature vectors
x2!n belonging to each class c2C follow a multivariate Gaussian dis-
tributionN(µc,!c). Furthermore, it assumes that the covariance matricesof all classes are equal, i.e. !c=! for all c2C. Decision function fc(x)is the log-likelihood of x, i.e., log Pr(x; µc,!)" xT!#1µc#1
2µcT!#1µc+
Fig. 1. Flow of information from automated !eld recordings to automated call classi!cation. Automated digital recording systems (ADRS) were place in 14 !eld sites in the island ofPuerto Rico. These recordings were digitally stored and later manually classi!ed. This manual classi!cation was later veri!ed for human errors. Once the data set was cleaned weperformed feature vector extraction describing each call as a pair !x,c", where xa!4 or xa!11. We did ten-fold cross-validation (using 90% of the data to train and 10% to test) tocompare three machine learning methods (linear discriminant analysis; LDA, decision tree; DT and support vector machine; SVM). We compared the accuracy of each method andeach data reduction technique.
208 M.A. Acevedo et al. / Ecological Informatics 4 (2009) 206–214
Author's personal copy
log !c, where !c is a probability distribution over classes c2C. Therefore,arg maxc2C fc(x) is the class that maximizes the probability of featurevector x.
Given a set of training instances, the parameters of the functions fcare estimated as !c = nc
l , where nc is the number of training instancesof class c, !c = 1
nc!ci = cxi and the common variance!=!c2C!ci=
c(xi#µc) (xi–µc)T /(l# |C|).
3.4.2. Decision treesDecision trees (DT) recursively partition !n into axis-parallel
hyper-rectangles such that each of the !nal partitions represents asingle class c2C. Given a set of training instances, it selects a featurej2{1,…,10} and cutoff value " which splits the data into two sets:those instances for which X1={x| x(j)$"} and those for which X2={x|x(j)N"}. The choice of feature j and value " is made by minimizingsomemeasure of impurity of sets X1 and X2 with respect to the classesof the points in each set. A commonly used measure is the Gini indexde!ned as G(X)=!c2C pc(1#pc) where pc is the proportions ofinstances in X of class c. Feature j and cutoff c are chosen to maximizeG(X)#(G(X1)+G(X2)), where X is the current set of traininginstances. Once the set of instances are split into sets X1 and X2,decision trees are recursively built on X1 and X2, until some stopping
criterion is met, usually a threshold of impurity, or a threshold on theminimum number of training instances in a sub-tree. In a post-processing step, partitions are heuristicallymerged using a complexityreduction criterion (this is usually called pruning) to avoid over-!tting.
3.4.3. Support vector machinesSupport vector machines (SVMs) directly optimize a trade-off of
accuracy on the training instances and function complexity and areusually de!ned for binary classi!cation tasks, C={#1,+1}. It iseasiest to understand SVMs in the linear setting, where the decisionfunctions fc are linear in the feature vectors x, and arg maxc fc(x)=sign(wT x##) for some vector w2!n and scalar # to be estimated.Notice that w and # de!ne a hyperplane, such that wT x##N0corresponds to class +1 andwT x##b0 corresponds to class #1. Thenotion of complexity in this case is given by the margin of vector wde!ned to be the sum of the distances between the hyperplanede!ned by w and # and the nearest training instances of each of thetwo classes. It can be shown that this margin is given by 1
j jw j j22. The
larger the margin, the less over-!tting will occur.The optimization problem to solve is then
minw%!n ;"%!
"w"22 + v!
l
i=1!1#ci!w
Txi#"""#; !1"
where (a)+ =max{a,0}. For training instance i, ci(wT xi##)b0 if sign(wT xi##)&ci, i.e. if instance i is misclassi!ed. In that case, w and #
Fig. 3. Spectrograms of all (a) amphibian and (b) bird species included in this study.Boxes around calls were used to calculate call variables.
Fig. 2. Average and standard deviations for (a) minimum and maximum frequenciesand (b) call duration of all amphibian and bird species identi!ed in this study.
209M.A. Acevedo et al. / Ecological Informatics 4 (2009) 206–214
Author's personal copy
are penalized by 1+ci(wT xi##). On the other hand, if ci(wT xi##)N0 then w and # are penalized by ci(wT xi##) if ci(wT xi##)b1. v is auser-supplied parameter that trades-off complexity ||w||22 and error onthe training instances. This problem can be readily solved by existingquadratic programming solvers.
Non-linearity in SVMs is achieved by assuming that decisionfunctions have the form f(x)=h(x)## where h is a function in aReproducing Kernel Hilbert Space H (a generalization of Euclideanspace), with corresponding kernel function k (a generalization ofthe dot product in Euclidean Space). The problem to optimizebecomes
minh%H;"%!
"h"2H + v!l
i=1!1#ci!h!xi"#"""#: !2"
By the Kimeldorf-Wahba theorem (Kimeldorf and Wahba,1971), the minimizer of Eq. (2) has a representation as a !nitelinear expansion in terms of kernel function k evaluated at the
training instances, such that h(x)=!i=1l $ik(xi,x) with coef!-
cients $i to be estimated. The resulting optimization problem isagain quadratic and the same solvers as in the linear case may beused. In practice, the user selects kernel function k, which in turnsde!nes the corresponding space H, in advance. In this paper we usethe Gaussian kernel k(xi,xj)=exp{#% || xi#xj || 22}, where % is someuser-selected parameter. Parameters % and v are usually selected bysome form of cross-validation. We describe our choice for this paperbelow.
To use SVMs in multicategory classi!cation, where |C|N2 asis our setting, we used the one-vs-one majority vote heuristic(Kreßel, 1999). In this case, an SVM is trained for each pair oflabels, giving jC j
2
! "SVMs, which are then combined by majority
vote. That is, given a new feature vector xnew, each SVM votes byclassifying the new vector as belonging to one of two classes. Thenew vector is then classi!ed as belonging to the class thatreceives the most votes. Although this is not guaranteed toconverge to the optimal classi!er (Lee et al., 2004), it performswell in practice.
4. Experimental setup
All experiments were carried out in R 2.7.0 (R Development CoreTeam, 2007). Performance statistics were estimated with ten-foldcross-validation, where folds were created at random while preserv-ing class proportions in each fold (Fig. 1).
4.1. LDA
We used the LDA classi!er implemented in the MASS 7.2-41package (Venables and Ripley, 2002) with parameter estimatesde!ned as in Section 3.4.
4.2. Decision trees
For decision trees we used the rpart 3.1-41 package (Therenauet al., 2007) with defaults: the gini criterion de!ned in Section 3.4 wasused to create the tree although weighted for each class by the inverseproportion of instances in the training set; maximum recursion depthis 30; smallest node size is 20. Other defaults can be veri!ed in thepackage documentation. A complexity parameter is used to avoidover-!tting by pruning subtrees that do not improve the gini index bymore than a factor of 0.01.
4.3. SVM
We used the kernlab 0.9-5 (Karatzoglou et al., 2004) package'sinterface to libsvm (Chih-Chung and Chih-Jen, 2004) to !t SVMs,which uses the one-vs-one strategy for multicategory classi!cationdescribed in Section 3.4. The Gaussian kernel de!ned in Section 3.4was used with parameter % selected using the heuristic describedin (Caputo et al., 2002). Trade-off parameter v was selected foreach fold independently by grid-search by minimizing error on aheld-out tuning set. The loss term in Eq. (2) was weighted foreach class by the inverse proportion of instances in the trainingset.
5. Results and discussion
5.1. Results
The choice of classi!cation method showed a much greater effecton the accuracy of the system compared to the effect of callrepresentation. Overall, there was a N20% difference between theoverall true positive rates of LDA and SVM (F=8.91, P=0.001),while the difference between 4 and 11 input variables had an overall
Fig. 4. We calculated 12 variables for each call: minimum and maximum frequencies,maximum power, call duration (a) and the frequency of maximum power in eightsegments of the call (b). We tested two ways of representing each call. In the !rstmethod, we used four standard call characteristics (minimum and maximumfrequencies, maximum power and call duration). In the second method we usedminimum and maximum frequencies, call duration and the frequency of maximumpower in eight segments of the call.
210 M.A. Acevedo et al. / Ecological Informatics 4 (2009) 206–214
Author's personal copy
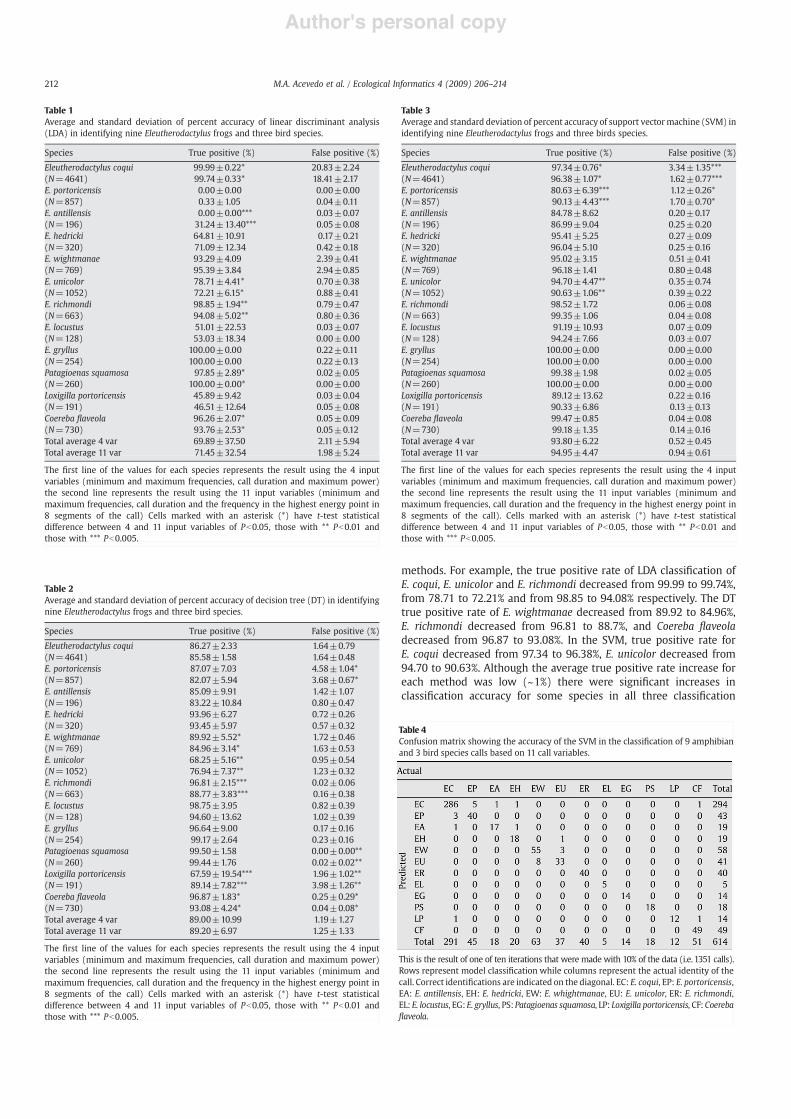
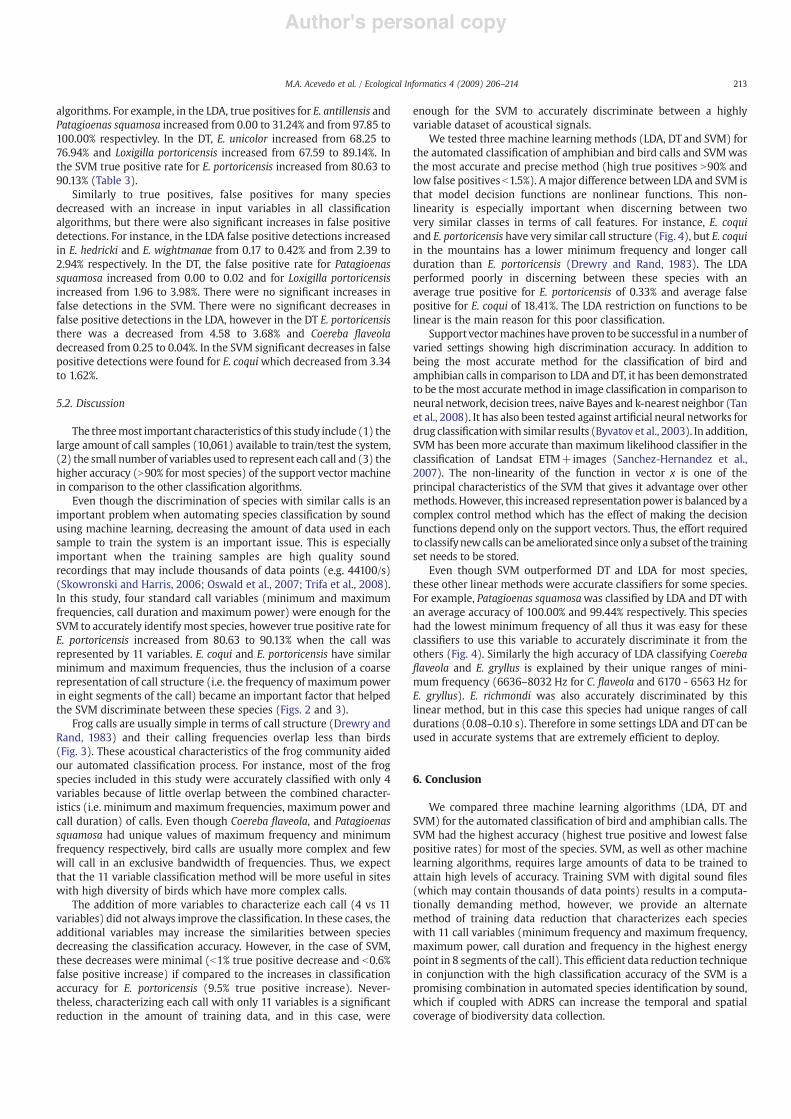
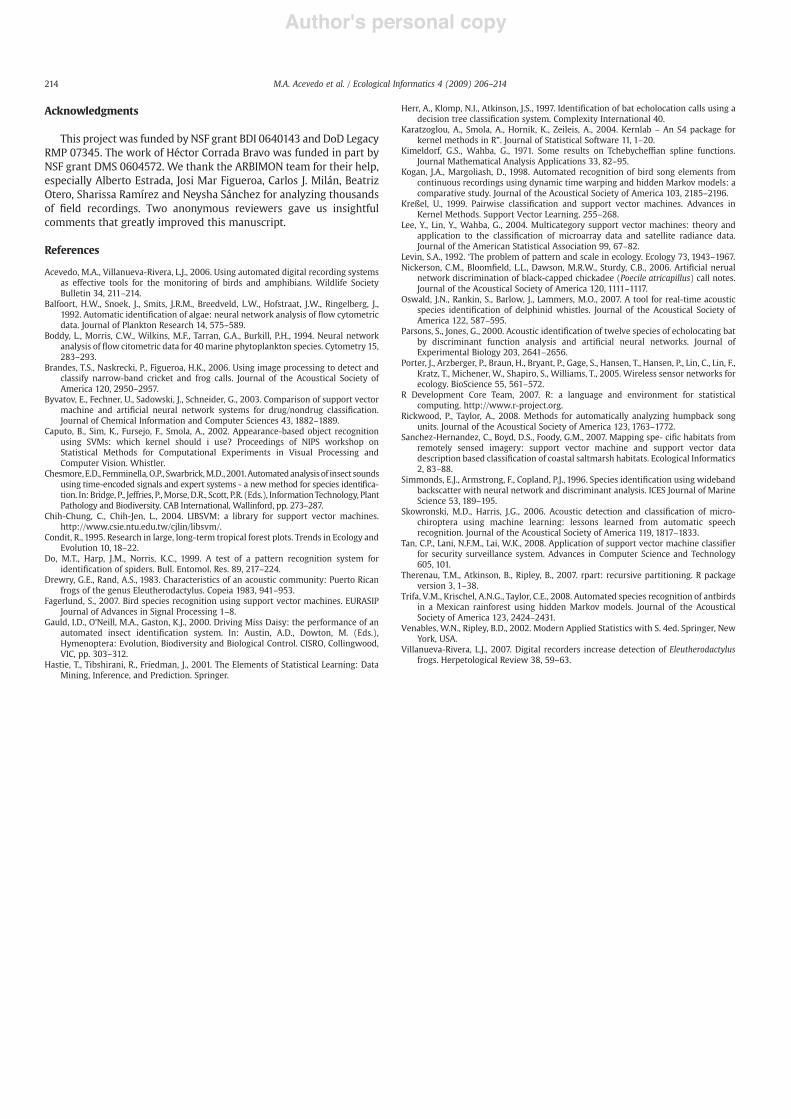
effect of b1% (F=0.074, P=0.786; Tables 1–3). Despite the smalloverall effect, the call representation of 11 variables was moreaccurate for most species and classi!cation methods, thus forsimpli!cation purposes, the comparisons of classi!cation methodsmade below will refer to results from training with calls character-ized by 11 variables. The SVM (Table 3) had the highest average truepositive rate (94.95%) and the lowest average false positive rate(0.94%) followed by DT (average TP=88.20% and FP=1.25%;Table 2) and LDA (average TP=71.45% and FP=1.98%; Table 1).SVM true positives varied from 86.99 to 100% depending on speciesand false positives from 0.00 to 1.62%. SVM had the highest truepositive rate for all species. Moreover, this algorithm had positiverate N90% for all species except E. antillensis. Thus it was the mostaccurate classi!cation algorithm overall (Table 3). An examinationof a confusion matrix of the actual and predicted classi!cation bySVM shows that the two species most often confused are E. coquiand E. portoricensis (Table 4). Most of the remaining errors respondto confusion between species with similar minimum and maximumfrequencies (Table 4, Fig. 2).
The LDA had the highest variability of true (0.00 to 99.99%) andfalse positive (0.00 to 20.83%) rate. This algorithm performed poorlyidentifying E. portoricensis, E. antillensis and Loxigilla portoricensis
with true positive rate b50%. However, it had true positive rate N90%for E. wightmanae, E. richmondi, E. gryllus, Patagioenas squamosa andCoereba !aveola. Moreover, Patagioenas squamosa was identi!edwith true positives of 100.00% and false positives of 0.00%. In additionthe LDA had a true positive rate of 99.84% identifying E. coqui, but itsfalse positive rate of 18.41% was the highest for all species andclassi!cation methods (Table 1).
The DT true positive rates varied from 76.94 to 99.44% and falsepositive rates from 0.02 to 3.98%. This algorithm had true positive rateN90% for E. hedricki, E. locustus, E. gryllus, Patagioenas squamosa, andCoereba !aveola.
Call representation using 11 variables (minimum and maximumfrequencies, call duration and the frequency in the highest energypoint in eight segments of the call) had slightly higher true positiverate in all classi!cation algorithms in comparison with the 4 variablesmethod (minimum and maximum frequencies, call duration andmaximum power), but this difference was not statistically signi!cant(F=0.074, P=0.786). Overall species average true positive rate in theLDA increased from 69.89% to 71.45%, in the DT from 89.00% to 89.20%and in the SVM from 93.80% to 94.95%. True positive rate for manyspecies increased when using 11 input variables, however, truepositive rate also decreased for some other species in all classi!cation
Fig. 5. Graphical examples of the threemachine learning algorithms compared in this study. They show the decision functions fc used to distinguish Loxigilla portoricensis and Coereba!aveola. Note that for simpli!cation the !gures only show two species and two variables (minimum and maximum frequencies). The actual system was trained/tested with 12species and used 4 or 11 variables.
211M.A. Acevedo et al. / Ecological Informatics 4 (2009) 206–214
Author's personal copy
methods. For example, the true positive rate of LDA classi!cation ofE. coqui, E. unicolor and E. richmondi decreased from 99.99 to 99.74%,from 78.71 to 72.21% and from 98.85 to 94.08% respectively. The DTtrue positive rate of E. wightmanae decreased from 89.92 to 84.96%,E. richmondi decreased from 96.81 to 88.7%, and Coereba !aveoladecreased from 96.87 to 93.08%. In the SVM, true positive rate forE. coqui decreased from 97.34 to 96.38%, E. unicolor decreased from94.70 to 90.63%. Although the average true positive rate increase foreach method was low (~1%) there were signi!cant increases inclassi!cation accuracy for some species in all three classi!cation
Table 2Average and standard deviation of percent accuracy of decision tree (DT) in identifyingnine Eleutherodactylus frogs and three bird species.
Species True positive (%) False positive (%)
Eleutherodactylus coqui 86.27±2.33 1.64±0.79(N=4641) 85.58±1.58 1.64±0.48E. portoricensis 87.07±7.03 4.58±1.04*(N=857) 82.07±5.94 3.68±0.67*E. antillensis 85.09±9.91 1.42±1.07(N=196) 83.22±10.84 0.80±0.47E. hedricki 93.96±6.27 0.72±0.26(N=320) 93.45±5.97 0.57±0.32E. wightmanae 89.92±5.52* 1.72±0.46(N=769) 84.96±3.14* 1.63±0.53E. unicolor 68.25±5.16** 0.95±0.54(N=1052) 76.94±7.37** 1.23±0.32E. richmondi 96.81±2.15*** 0.02±0.06(N=663) 88.77±3.83*** 0.16±0.38E. locustus 98.75±3.95 0.82±0.39(N=128) 94.60±13.62 1.02±0.39E. gryllus 96.64±9.00 0.17±0.16(N=254) 99.17±2.64 0.23±0.16Patagioenas squamosa 99.50±1.58 0.00±0.00**(N=260) 99.44±1.76 0.02±0.02**Loxigilla portoricensis 67.59±19.54*** 1.96±1.02**(N=191) 89.14±7.82*** 3.98±1.26**Coereba !aveola 96.87±1.83* 0.25±0.29*(N=730) 93.08±4.24* 0.04±0.08*Total average 4 var 89.00±10.99 1.19±1.27Total average 11 var 89.20±6.97 1.25±1.33
The !rst line of the values for each species represents the result using the 4 inputvariables (minimum and maximum frequencies, call duration and maximum power)the second line represents the result using the 11 input variables (minimum andmaximum frequencies, call duration and the frequency in the highest energy point in8 segments of the call) Cells marked with an asterisk (*) have t-test statisticaldifference between 4 and 11 input variables of Pb0.05, those with ** Pb0.01 andthose with *** Pb0.005.
Table 1Average and standard deviation of percent accuracy of linear discriminant analysis(LDA) in identifying nine Eleutherodactylus frogs and three bird species.
Species True positive (%) False positive (%)
Eleutherodactylus coqui 99.99±0.22* 20.83±2.24(N=4641) 99.74±0.33* 18.41±2.17E. portoricensis 0.00±0.00 0.00±0.00(N=857) 0.33±1.05 0.04±0.11E. antillensis 0.00±0.00*** 0.03±0.07(N=196) 31.24±13.40*** 0.05±0.08E. hedricki 64.81±10.91 0.17±0.21(N=320) 71.09±12.34 0.42±0.18E. wightmanae 93.29±4.09 2.39±0.41(N=769) 95.39±3.84 2.94±0.85E. unicolor 78.71±4.41* 0.70±0.38(N=1052) 72.21±6.15* 0.88±0.41E. richmondi 98.85±1.94** 0.79±0.47(N=663) 94.08±5.02** 0.80±0.36E. locustus 51.01±22.53 0.03±0.07(N=128) 53.03±18.34 0.00±0.00E. gryllus 100.00±0.00 0.22±0.11(N=254) 100.00±0.00 0.22±0.13Patagioenas squamosa 97.85±2.89* 0.02±0.05(N=260) 100.00±0.00* 0.00±0.00Loxigilla portoricensis 45.89±9.42 0.03±0.04(N=191) 46.51±12.64 0.05±0.08Coereba !aveola 96.26±2.07* 0.05±0.09(N=730) 93.76±2.53* 0.05±0.12Total average 4 var 69.89±37.50 2.11±5.94Total average 11 var 71.45±32.54 1.98±5.24
The !rst line of the values for each species represents the result using the 4 inputvariables (minimum and maximum frequencies, call duration and maximum power)the second line represents the result using the 11 input variables (minimum andmaximum frequencies, call duration and the frequency in the highest energy point in8 segments of the call) Cells marked with an asterisk (*) have t-test statisticaldifference between 4 and 11 input variables of Pb0.05, those with ** Pb0.01 andthose with *** Pb0.005.
Table 4Confusion matrix showing the accuracy of the SVM in the classi!cation of 9 amphibianand 3 bird species calls based on 11 call variables.
This is the result of one of ten iterations that were made with 10% of the data (i.e. 1351 calls).Rows represent model classi!cation while columns represent the actual identity of thecall. Correct identi!cations are indicated on the diagonal. EC: E. coqui, EP: E. portoricensis,EA: E. antillensis, EH: E. hedricki, EW: E. whightmanae, EU: E. unicolor, ER: E. richmondi,EL: E. locustus, EG:E. gryllus, PS:Patagioenas squamosa, LP: Loxigilla portoricensis, CF:Coereba!aveola.
Table 3Average and standard deviation of percent accuracy of support vectormachine (SVM) inidentifying nine Eleutherodactylus frogs and three birds species.
Species True positive (%) False positive (%)
Eleutherodactylus coqui 97.34±0.76* 3.34±1.35***(N=4641) 96.38±1.07* 1.62±0.77***E. portoricensis 80.63±6.39*** 1.12±0.26*(N=857) 90.13±4.43*** 1.70±0.70*E. antillensis 84.78±8.62 0.20±0.17(N=196) 86.99±9.04 0.25±0.20E. hedricki 95.41±5.25 0.27±0.09(N=320) 96.04±5.10 0.25±0.16E. wightmanae 95.02±3.15 0.51±0.41(N=769) 96.18±1.41 0.80±0.48E. unicolor 94.70±4.47** 0.35±0.74(N=1052) 90.63±1.06** 0.39±0.22E. richmondi 98.52±1.72 0.06±0.08(N=663) 99.35±1.06 0.04±0.08E. locustus 91.19±10.93 0.07±0.09(N=128) 94.24±7.66 0.03±0.07E. gryllus 100.00±0.00 0.00±0.00(N=254) 100.00±0.00 0.00±0.00Patagioenas squamosa 99.38±1.98 0.02±0.05(N=260) 100.00±0.00 0.00±0.00Loxigilla portoricensis 89.12±13.62 0.22±0.16(N=191) 90.33±6.86 0.13±0.13Coereba !aveola 99.47±0.85 0.04±0.08(N=730) 99.18±1.35 0.14±0.16Total average 4 var 93.80±6.22 0.52±0.45Total average 11 var 94.95±4.47 0.94±0.61
The !rst line of the values for each species represents the result using the 4 inputvariables (minimum and maximum frequencies, call duration and maximum power)the second line represents the result using the 11 input variables (minimum andmaximum frequencies, call duration and the frequency in the highest energy point in8 segments of the call). Cells marked with an asterisk (*) have t-test statisticaldifference between 4 and 11 input variables of Pb0.05, those with ** Pb0.01 andthose with *** Pb0.005.
212 M.A. Acevedo et al. / Ecological Informatics 4 (2009) 206–214
Author's personal copy
algorithms. For example, in the LDA, true positives for E. antillensis andPatagioenas squamosa increased from 0.00 to 31.24% and from 97.85 to100.00% respectivley. In the DT, E. unicolor increased from 68.25 to76.94% and Loxigilla portoricensis increased from 67.59 to 89.14%. Inthe SVM true positive rate for E. portoricensis increased from 80.63 to90.13% (Table 3).
Similarly to true positives, false positives for many speciesdecreased with an increase in input variables in all classi!cationalgorithms, but there were also signi!cant increases in false positivedetections. For instance, in the LDA false positive detections increasedin E. hedricki and E. wightmanae from 0.17 to 0.42% and from 2.39 to2.94% respectively. In the DT, the false positive rate for Patagioenassquamosa increased from 0.00 to 0.02 and for Loxigilla portoricensisincreased from 1.96 to 3.98%. There were no signi!cant increases infalse detections in the SVM. There were no signi!cant decreases infalse positive detections in the LDA, however in the DT E. portoricensisthere was a decreased from 4.58 to 3.68% and Coereba !aveoladecreased from 0.25 to 0.04%. In the SVM signi!cant decreases in falsepositive detections were found for E. coquiwhich decreased from 3.34to 1.62%.
5.2. Discussion
The threemost important characteristics of this study include (1) thelarge amount of call samples (10,061) available to train/test the system,(2) the small number of variables used to represent each call and (3) thehigher accuracy (N90% for most species) of the support vector machinein comparison to the other classi!cation algorithms.
Even though the discrimination of species with similar calls is animportant problem when automating species classi!cation by soundusing machine learning, decreasing the amount of data used in eachsample to train the system is an important issue. This is especiallyimportant when the training samples are high quality soundrecordings that may include thousands of data points (e.g. 44100/s)(Skowronski and Harris, 2006; Oswald et al., 2007; Trifa et al., 2008).In this study, four standard call variables (minimum and maximumfrequencies, call duration and maximum power) were enough for theSVM to accurately identifymost species, however true positive rate forE. portoricensis increased from 80.63 to 90.13% when the call wasrepresented by 11 variables. E. coqui and E. portoricensis have similarminimum and maximum frequencies, thus the inclusion of a coarserepresentation of call structure (i.e. the frequency of maximum powerin eight segments of the call) became an important factor that helpedthe SVM discriminate between these species (Figs. 2 and 3).
Frog calls are usually simple in terms of call structure (Drewry andRand, 1983) and their calling frequencies overlap less than birds(Fig. 3). These acoustical characteristics of the frog community aidedour automated classi!cation process. For instance, most of the frogspecies included in this study were accurately classi!ed with only 4variables because of little overlap between the combined character-istics (i.e. minimum andmaximum frequencies, maximum power andcall duration) of calls. Even though Coereba !aveola, and Patagioenassquamosa had unique values of maximum frequency and minimumfrequency respectively, bird calls are usually more complex and fewwill call in an exclusive bandwidth of frequencies. Thus, we expectthat the 11 variable classi!cation method will be more useful in siteswith high diversity of birds which have more complex calls.
The addition of more variables to characterize each call (4 vs 11variables) did not always improve the classi!cation. In these cases, theadditional variables may increase the similarities between speciesdecreasing the classi!cation accuracy. However, in the case of SVM,these decreases were minimal (b1% true positive decrease and b0.6%false positive increase) if compared to the increases in classi!cationaccuracy for E. portoricensis (9.5% true positive increase). Never-theless, characterizing each call with only 11 variables is a signi!cantreduction in the amount of training data, and in this case, were
enough for the SVM to accurately discriminate between a highlyvariable dataset of acoustical signals.
We tested three machine learning methods (LDA, DT and SVM) forthe automated classi!cation of amphibian and bird calls and SVMwasthe most accurate and precise method (high true positives N90% andlow false positives b1.5%). Amajor difference between LDA and SVM isthat model decision functions are nonlinear functions. This non-linearity is especially important when discerning between twovery similar classes in terms of call features. For instance, E. coquiand E. portoricensis have very similar call structure (Fig. 4), but E. coquiin the mountains has a lower minimum frequency and longer callduration than E. portoricensis (Drewry and Rand, 1983). The LDAperformed poorly in discerning between these species with anaverage true positive for E. portoricensis of 0.33% and average falsepositive for E. coqui of 18.41%. The LDA restriction on functions to belinear is the main reason for this poor classi!cation.
Support vectormachines have proven to be successful in a number ofvaried settings showing high discrimination accuracy. In addition tobeing the most accurate method for the classi!cation of bird andamphibian calls in comparison to LDA and DT, it has been demonstratedto be themost accuratemethod in image classi!cation in comparison toneural network, decision trees, naive Bayes and k-nearest neighbor (Tanet al., 2008). It has also been tested against arti!cial neural networks fordrug classi!cationwith similar results (Byvatov et al., 2003). In addition,SVM has been more accurate thanmaximum likelihood classi!er in theclassi!cation of Landsat ETM+images (Sanchez-Hernandez et al.,2007). The non-linearity of the function in vector x is one of theprincipal characteristics of the SVM that gives it advantage over othermethods. However, this increased representationpower is balanced byacomplex control method which has the effect of making the decisionfunctions depend only on the support vectors. Thus, the effort requiredto classifynewcalls canbe ameliorated since onlya subsetof the trainingset needs to be stored.
Even though SVM outperformed DT and LDA for most species,these other linear methods were accurate classi!ers for some species.For example, Patagioenas squamosawas classi!ed by LDA and DT withan average accuracy of 100.00% and 99.44% respectively. This specieshad the lowest minimum frequency of all thus it was easy for theseclassi!ers to use this variable to accurately discriminate it from theothers (Fig. 4). Similarly the high accuracy of LDA classifying Coereba!aveola and E. gryllus is explained by their unique ranges of mini-mum frequency (6636–8032 Hz for C. !aveola and 6170 - 6563 Hz forE. gryllus). E. richmondi was also accurately discriminated by thislinear method, but in this case this species had unique ranges of calldurations (0.08–0.10 s). Therefore in some settings LDA and DT can beused in accurate systems that are extremely ef!cient to deploy.
6. Conclusion
We compared three machine learning algorithms (LDA, DT andSVM) for the automated classi!cation of bird and amphibian calls. TheSVM had the highest accuracy (highest true positive and lowest falsepositive rates) for most of the species. SVM, as well as other machinelearning algorithms, requires large amounts of data to be trained toattain high levels of accuracy. Training SVM with digital sound !les(which may contain thousands of data points) results in a computa-tionally demanding method, however, we provide an alternatemethod of training data reduction that characterizes each specieswith 11 call variables (minimum frequency and maximum frequency,maximum power, call duration and frequency in the highest energypoint in 8 segments of the call). This ef!cient data reduction techniquein conjunction with the high classi!cation accuracy of the SVM is apromising combination in automated species identi!cation by sound,which if coupled with ADRS can increase the temporal and spatialcoverage of biodiversity data collection.
213M.A. Acevedo et al. / Ecological Informatics 4 (2009) 206–214
Author's personal copy
Acknowledgments
This project was funded by NSF grant BDI 0640143 and DoD LegacyRMP 07345. The work of Héctor Corrada Bravo was funded in part byNSF grant DMS 0604572. We thank the ARBIMON team for their help,especially Alberto Estrada, Josi Mar Figueroa, Carlos J. Milán, BeatrizOtero, Sharissa Ramírez and Neysha Sánchez for analyzing thousandsof !eld recordings. Two anonymous reviewers gave us insightfulcomments that greatly improved this manuscript.
References
Acevedo, M.A., Villanueva-Rivera, L.J., 2006. Using automated digital recording systemsas effective tools for the monitoring of birds and amphibians. Wildlife SocietyBulletin 34, 211–214.
Balfoort, H.W., Snoek, J., Smits, J.R.M., Breedveld, L.W., Hofstraat, J.W., Ringelberg, J.,1992. Automatic identi!cation of algae: neural network analysis of "ow cytometricdata. Journal of Plankton Research 14, 575–589.
Boddy, L., Morris, C.W., Wilkins, M.F., Tarran, G.A., Burkill, P.H., 1994. Neural networkanalysis of "ow citometric data for 40marine phytoplankton species. Cytometry 15,283–293.
Brandes, T.S., Naskrecki, P., Figueroa, H.K., 2006. Using image processing to detect andclassify narrow-band cricket and frog calls. Journal of the Acoustical Society ofAmerica 120, 2950–2957.
Byvatov, E., Fechner, U., Sadowski, J., Schneider, G., 2003. Comparison of support vectormachine and arti!cial neural network systems for drug/nondrug classi!cation.Journal of Chemical Information and Computer Sciences 43, 1882–1889.
Caputo, B., Sim, K., Fursejo, F., Smola, A., 2002. Appearance-based object recognitionusing SVMs: which kernel should i use? Proceedings of NIPS workshop onStatistical Methods for Computational Experiments in Visual Processing andComputer Vision. Whistler.
Chesmore,E.D., Femminella,O.P., Swarbrick,M.D.,2001.Automatedanalysisof insect soundsusing time-encoded signals and expert systems - a newmethod for species identi!ca-tion. In: Bridge, P., Jeffries, P.,Morse, D.R., Scott, P.R. (Eds.), InformationTechnology, PlantPathology and Biodiversity. CAB International, Wallinford, pp. 273–287.
Chih-Chung, C., Chih-Jen, L., 2004. LIBSVM: a library for support vector machines.http://www.csie.ntu.edu.tw/cjlin/libsvm/.
Condit, R., 1995. Research in large, long-term tropical forest plots. Trends in Ecology andEvolution 10, 18–22.
Do, M.T., Harp, J.M., Norris, K.C., 1999. A test of a pattern recognition system foridenti!cation of spiders. Bull. Entomol. Res. 89, 217–224.
Drewry, G.E., Rand, A.S., 1983. Characteristics of an acoustic community: Puerto Ricanfrogs of the genus Eleutherodactylus. Copeia 1983, 941–953.
Fagerlund, S., 2007. Bird species recognition using support vector machines. EURASIPJournal of Advances in Signal Processing 1–8.
Gauld, I.D., O'Neill, M.A., Gaston, K.J., 2000. Driving Miss Daisy: the performance of anautomated insect identi!cation system. In: Austin, A.D., Dowton, M. (Eds.),Hymenoptera: Evolution, Biodiversity and Biological Control. CISRO, Collingwood,VIC, pp. 303–312.
Hastie, T., Tibshirani, R., Friedman, J., 2001. The Elements of Statistical Learning: DataMining, Inference, and Prediction. Springer.
Herr, A., Klomp, N.I., Atkinson, J.S., 1997. Identi!cation of bat echolocation calls using adecision tree classi!cation system. Complexity International 40.
Karatzoglou, A., Smola, A., Hornik, K., Zeileis, A., 2004. Kernlab – An S4 package forkernel methods in R”. Journal of Statistical Software 11, 1–20.
Kimeldorf, G.S., Wahba, G., 1971. Some results on Tchebychef!an spline functions.Journal Mathematical Analysis Applications 33, 82–95.
Kogan, J.A., Margoliash, D., 1998. Automated recognition of bird song elements fromcontinuous recordings using dynamic time warping and hidden Markov models: acomparative study. Journal of the Acoustical Society of America 103, 2185–2196.
Kreßel, U., 1999. Pairwise classi!cation and support vector machines. Advances inKernel Methods. Support Vector Learning. 255–268.
Lee, Y., Lin, Y., Wahba, G., 2004. Multicategory support vector machines: theory andapplication to the classi!cation of microarray data and satellite radiance data.Journal of the American Statistical Association 99, 67–82.
Levin, S.A., 1992. ‘The problem of pattern and scale in ecology. Ecology 73, 1943–1967.Nickerson, C.M., Bloom!eld, L.L., Dawson, M.R.W., Sturdy, C.B., 2006. Arti!cial nerual
network discrimination of black-capped chickadee (Poecile atricapillus) call notes.Journal of the Acoustical Society of America 120, 1111–1117.
Oswald, J.N., Rankin, S., Barlow, J., Lammers, M.O., 2007. A tool for real-time acousticspecies identi!cation of delphinid whistles. Journal of the Acoustical Society ofAmerica 122, 587–595.
Parsons, S., Jones, G., 2000. Acoustic identi!cation of twelve species of echolocating batby discriminant function analysis and arti!cial neural networks. Journal ofExperimental Biology 203, 2641–2656.
Porter, J., Arzberger, P., Braun, H., Bryant, P., Gage, S., Hansen, T., Hansen, P., Lin, C., Lin, F.,Kratz, T., Michener, W., Shapiro, S., Williams, T., 2005. Wireless sensor networks forecology. BioScience 55, 561–572.
R Development Core Team, 2007. R: a language and environment for statisticalcomputing. http://www.r-project.org.
Rickwood, P., Taylor, A., 2008. Methods for automatically analyzing humpback songunits. Journal of the Acoustical Society of America 123, 1763–1772.
Sanchez-Hernandez, C., Boyd, D.S., Foody, G.M., 2007. Mapping spe- ci!c habitats fromremotely sensed imagery: support vector machine and support vector datadescription based classi!cation of coastal saltmarsh habitats. Ecological Informatics2, 83–88.
Simmonds, E.J., Armstrong, F., Copland, P.J., 1996. Species identi!cation using widebandbackscatter with neural network and discriminant analysis. ICES Journal of MarineScience 53, 189–195.
Skowronski, M.D., Harris, J.G., 2006. Acoustic detection and classi!cation of micro-chiroptera using machine learning: lessons learned from automatic speechrecognition. Journal of the Acoustical Society of America 119, 1817–1833.
Tan, C.P., Lani, N.F.M., Lai, W.K., 2008. Application of support vector machine classi!erfor security surveillance system. Advances in Computer Science and Technology605, 101.
Therenau, T.M., Atkinson, B., Ripley, B., 2007. rpart: recursive partitioning. R packageversion 3, 1–38.
Trifa, V.M., Krischel, A.N.G., Taylor, C.E., 2008. Automated species recognition of antbirdsin a Mexican rainforest using hidden Markov models. Journal of the AcousticalSociety of America 123, 2424–2431.
Venables, W.N., Ripley, B.D., 2002. Modern Applied Statistics with S. 4ed. Springer, NewYork, USA.
Villanueva-Rivera, L.J., 2007. Digital recorders increase detection of Eleutherodactylusfrogs. Herpetological Review 38, 59–63.
214 M.A. Acevedo et al. / Ecological Informatics 4 (2009) 206–214