author(s) scott doebling, esa-ea - digital library/67531/metadc691094/m2/1/high... · scott...
TRANSCRIPT

c
Title'
Author(s)
Submitted tl
Los Alamos N A T I O N A L L A B O R A T O R Y
STATISTICAL DAMAGE IDENIFICATION TECHNIQUES
RIVER APPLED TO THE 1-40 BRIDGE OVER THE RIO GRANDE
Scott Doebling, ESA-EA Charles Farrar, ESA-EA
16th International Modal Analysis Conference
Santa Barbara, CA
February 2 - 5 , 1 9 9 i 5?
P
Los Alamos National Laboratory, an affirmative actionlequal opportunity employer, is operated by the University of California for the U.S. Department of Energy under contract W-7405-ENG-36. By acceptance of this article, the publisher recognizes that the U.S. Government retains a nonexclusive, royalty-free license to publish or reproduce the published form of this contribution, or to allow others to do so, for US. Government purposes. Los Alamos National Laboratory requests that the publisher identify this article as work performed under the auspices of the U.S. Department of Energy. The Los Alamos National Laboratory strongly supports academic freedom and a researcher's tight to publish; as an institution, however, the Laboratory does not endorse the viewpoint of a publication or guarantee its technical correctness. Form 836 (1 0/96)

DISCLAIMER
This report was prepared as an account of work sponsored by an agency of the United States Government. Neither the United States Government nor any agency thereof, nor any of their employees, makes any warranty, express or implied. or assumes any legal liability or responsibility for the accuracy, completeness, or use- fulness of any information. apparatus, product, or process disclosed, or represents that its use would not infringe privately owned rights. Reference herein to any spe- cific commercial product, process. or service by trade name, trademark, manufac- turer, or otherwise does not necessarily constitute or imply its endorsement, m m - mendation, or favoring by the United Statu Government or any agency thereof. The views and opinions of authors expressed herein do not necessarily state or reflect those of the United States Government or.any agency thereof.

t
STATISTICAL DAMAGE IDENTIFICATION TECHNIQUES APPLIED TO THE 1-40 BRIDGE OVER THE RIO GRANDE RIVER
Scott W. Doeblingl, Charles R. Farrap Los Alamos National Laboratory
Los Alamos, NM, 87545
ABSTRACT
The statistical significance of vibration-based damage identification parameters is studied via application to the data from the tests performed on the Interstate 40 highway bridge in Albuquerque, New Mexico. A test of statistical significance is applied to the mean and confidence interval estimates of the modal properties and the corresponding damage indicators. The damage indicator used in this study is the change in the measured flexibility matrix. Previously presented deterministic results indicate that damage is detectable in all of the damage cases from these data sets. The results of this study indicate that the changes in both the modal properties and the damage indi- cators are statistically significant for all of the damage cases. However, these changes are distributed spatially for the first three damage cases and do not localize the damage until the fourth and final damage case.
INTRODUCTION
Damage identification using changes in measured modal parameters is a topic that has received considerable attention in the literature in recent years. A review of the state of the art in the field is presented in Ref. [l]. The damage identification ex- periments on the 1-40 bridge over the Rio Grande River in Al- buquerque, New Mexico, described in Ref. [2], produced what is to date one of the most studied data sets in the field of vibra- tion-based damage identification. A number of different re- searchers have analyzed these damage cases, including: Stubbs, et al. [3], Jauregui and Farrar [4], [5], [6], Alvin [7], Simmermacher, et al. [8], James, et al. [9], and Mayes [lo].
However, one aspect of these data sets that has not been examined is the statistical significance of the damage identifi- cation results. Characterization of the statistical confidence on the damage identification results is important in order to be able to state that the observed changes are statistically significant, and therefore most likely not the result of random variability in
the measurements. Previously, very little has been published on the application of statistical confidence to damage identifica- tion. The exception is the work of Mazurek [ 111, who used the measured confidence intervals on the damage indicator as an inverse-weighting criteria for damage identification.
This study is motivated by previous damage identification analyses of the 1-40 data sets that have raised questions about false positive indications due to test-to-test random variations rather than statistically significant changes caused by the actual damage. For example, Farrar and Jauregui [6] applied 5 differ- ent damage identification techniques to the 1-40 data sets, and 3 of them successfully identified the damage at the lowest level damage case. However, when they attempted to simulate the lowest level of damage from the 1-40 tests using a finite ele- ment model, they were unable to get the same level of conclu- sive damage indication as from the experimental result. Of course, this result could be an effect of the inability to properly model the dynamic effects of the damage case, but regardless it raises the question of whether the observed indicators in this lowest level of damage are just a result of random variations. In another study, Alvin [7] showed that the three lowest level damage cases from the 1-40 tests did not differ significantly from his FEM than the undamaged case did. Thus, he conclud- ed that the three lower level damage cases did not produce sig- nificant enough changes in the modal properties to enable detection of the damage.
The focus of this study is to explore the issue of the statis- tical significance of the changes in the modal parameters and damage indicators between the various damage cases in the I- 40 experiments. The emphasis is on very simple ways to deter- mine the statistical significance of the changes from case to case. The approach demonstrated in this paper uses Monte Car- lo analysis to compute statistical confidence intervals on the mode shape components and damage indication parameters (in this case modal flexibility components). Then a statistical dif-
1. Technical Staff Member, Engineering Sciences and Applications Division, Engineering Analysis Group (ESA-EA), M/S P946,
2. Materials Behavior Team Leader, Engineering Sciences and Applications Division, Engineering Analysis Group (ESA-EA) (505) 667-6950, [email protected].
ference test is employed to associate a confidence level with the statement that the means between the two sample sets are sig- nificantly different. This statistical difference test is applied to the individual flexibility components to determine if the flexi- bility change at that particular degree of freedom (DOF) should be considered to be statistically significant or not. These differ- ence statistics indicate the relative significance of the changes in a particular parameter relative to changes in other parame- ters.
It should be noted, however, that the results of this analy- sis can only discriminate whether the observed changes are sta- tistically significant, not whether the source of the observed changes is structural damage. For example, a systematic error in the testing procedure or a change in the structural boundary conditions can both lead to a statistically significant change in measured structural flexibility, which the analyst may falsely conclude is the result of structural damage. The exception is when a change of larger significance is isolated at one particu- lar DOF or set of spatially close DOF. Discriminating between changes resulting from damage and changes resulting from oth- er systematic errors or unknown effects is beyond the scope of this research. The only statement that can be made from this re- sult is whether or not the observed changes at each DOF are sta- tistically significant.
The results presented in this paper indicate that the chang- es in both the mode shapes and flexibility components are sta- tistically significant for the first three damage cases, but that there is no significant indication of localized flexibility change (and thus damage) until the fourth damage case. The paper be- gins with a summary of the 1-40 experiment and damage cases. Next, an outline of the theory used to perform the modal iden- tification, the damage identification, and the statistical analysis is presented. Following that, the statistical confidence intervals of the modal parameters are presented, as well as the determin- istic damage identification results and the values indicating the statistical significance of the damage identification results.
THE 1-40 BRIDGE DAMAGE IDENTIFICATION EXPERIMENT
The research described in this paper uses data from a se- ries of modal tests of a section of a highway bridge. The bridge was located along Interstate Highway 40 across the Rio Grande River in Albuquerque, New Mexico. A series of modal tests was performed on this bridge after it had been closed to traffic prior to demolition in 1993. The bridge was constructed of a concrete deck approximately 13.3 m wide and 17.8 cm thick, supported by two steel plate girders, each 3.05m high, and three steel stringers. The section of the bridge that was instrumented for this series of modal tests consisted of three spans with a combined length of about 130 m. The instrumentation consist- ed of 13 accelerometers mounted to each of the two plate gird- ers along the length of the three spans, for a total of 26 response measurements. The excitation system consisted of a 9863 kg reaction mass supported by three air springs moved by a 9.79
kN hydraulic actuator. The actuator system was placed on the deck directly over one of the plate girders in the middle of the span closest to the abutment. Full details of the modal testing of this bridge can be found in Farrar, et al. [2].
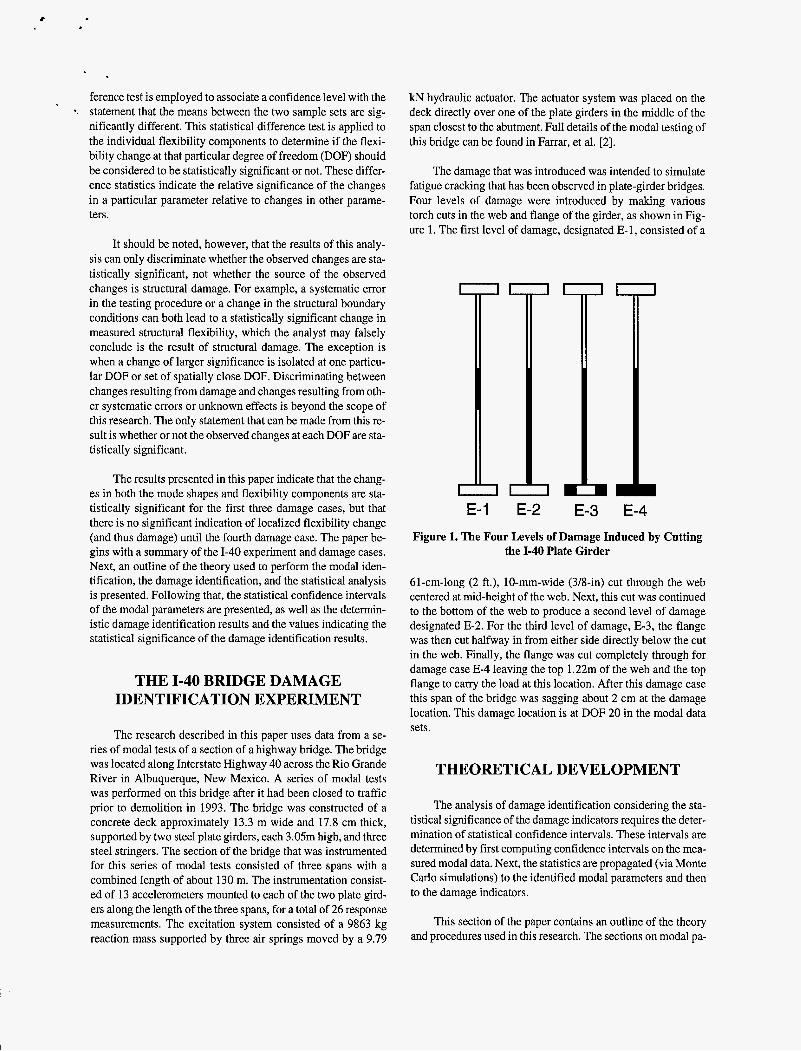
The damage that was introduced was intended to simulate fatigue cracking that has been observed in plate-girder bridges. Four levels of damage were introduced by making various torch cuts in the web and flange of the girder, as shown in Fig- ure 1. The first level of damage, designated E- 1, consisted of a
I I I E-1 E-2 E-3 E-4
Figure 1. The Four Levels of Damage Induced by Cutting the 1-40 Plate Girder
61-cm-long (2 ft.), 10-mm-wide (3/8-in) cut through the web centered at mid-height of the web. Next, this cut was continued to the bottom of the web to produce a second level of damage designated E-2. For the third level of damage, E-3, the flange was then cut halfway in from either side directly below the cut in the web. Finally, the flange was cut completely through for damage case E-4 leaving the top 1.22m of the web and the top flange to carry the load at this location. After this damage case this span of the bridge was sagging about 2 cm at the damage location. This damage location is at DOF 20 in the modal data sets.
THEORETICAL DEVELOPMENT
The analysis of damage identification considering the sta- tistical significance of the damage indicators requires the deter- mination of statistical confidence intervals. These intervals are determined by first computing confidence intervals on the mea- sured modal data. Next, the statistics are propagated (via Monte Carlo simulations) to the identified modal parameters and then to the damage indicators.
This section of the paper contains an outline of the theory and procedures used in this research. The sections on modal pa-
rameter identification, random error analysis on modal data, Monte Carlo simulation, and damage identification using mea- sured flexibility are abbreviated as this information is presented thoroughly in other published sources.
tions is the confidence interval for (approximately) a 95% con- fidence level. Thus, given the mean p and the standard deviation (T of an estimate, and assuming that the distribution is Gaussian, there is a 68% probability that the next value mea- sured, v, will fall into the range
The method for the stated in this paper is the Likewise, there is a 95% probability that the next value mea- Rational Polynomial curve fit, as presented originally by Rich- ardson and Formenti [12], although in practice any modal pa-
sured, v, will fall into the range
rameter identification algorithm could b e used. f h e Rational Polynomial curve fit is based on the expression of the frequen- cy response function (FRF) between a given input-output pair as a ratio of two polynomials. This expression can be written as
m
bkO’o)k k = O
n = 2p m = 2 p - l + r
wherep is the number of modes and r is the number of residual terms. The residual terms account for the influence of modes which are located outside the measurement bandwidth. The ra- tional polynomial form of Eq. (1) can be converted to pole-res- idue form using standard techniques and from there the modal parameters can be extracted.
The first step in this analysis is the determination of ran- dom errors on measured FRF data in the form of statistical con- fidence intervals. Measured data contain errors caused by many sources that result in measured spectral function estimates that are not equal to the actual spectral functions of the structure. The errors that are present in the measured modal data can be divided into two basic categories, as described in Bendat and Piersol [18] and Allemang [13]: bias (systematic) errors and random errors. Bias errors cause the mean of the function esti- mate not to converge to the actual value of the function as more averages are taken. The random errors on these data are quan- tified in the form of a standard deviation associated with the mean of the FRF estimate magnitude and phase at each fre- quency line for each measurement DOF. The details of this computation are presented by Doebling and Farrar [14].
After the mean and the standard deviation of the estimate have been computed, they are usually expressed in association with a statistical confidence level that is defined by the assumed distribution of the estimate. For a normal distribution, plus and minus one standard deviation is the confidence interval for a 68% confidence level and plus or minus two standard devia-
p- 2 0 < v < p + 2 0 (3)
The next step in the analysis is the estimation of confi- dence intervals on the measured modal parameter, e.g. the mod- al frequencies and mode shape components. One approach that can be used to characterize errors on identified modal parame- ters given the distribution of the errors on the data is known as Monte Carlo simulation, as described in Press, et al. [15]. Mon- te Carlo simulation is a procedure whereby noisy data sets are repeatedly “simulated” using the assumed statistical distribu- tion of error on the data. The identification procedure is then applied to each of the simulated data sets, producing a set of identified modal parameters. After a sufficient number of sim- ulations, the distribution of the resulting set of identified modal parameters is assumed to be representative of the distribution of the true modal parameters plus the effects of the measurement errors. A complete description of the procedure used to com- pute the confidence intervals in the modal parameters for this research is presented by Doebling and Farrar [ 141.
The vibration-based damage identification method used in this research idealizes the change in the dynamically measured flexibility matrix as an estimate of the change in the static be- havior of the structure. Because the flexibility matrix is defined as the inverse of the static stiffness matrix, the flexibility matrix [ G] relates the applied static force { u } and resulting structur- al displacement { F } as
(4)
Thus, each column of the flexibility matrix represents the dis- placement pattern of the structure associated with a unit force applied at the associated DOF.
The measured flexibility matrix is estimated from the mass-normalized measured mode shapes [ a ] and squared modal frequencies [A] as

The formulation of the flexibility matrix in Eq. ( 5 ) is approxi- mate due to the fact that only the first few modes of the struc- ture (typically the lowest-frequency modes) are measured. The synthesis of the complete static flexibility matrix would require the measurement of all of the mode shapes and frequencies.
‘
For this particular study, the difference in the diagonal values of the flexibility matrices before and after damage is used as an indicator of damage, in a manner similar to that pre- sented by Robinson, et al. [16]. The change in the diagonal components represents the change in local flexibility at a point; i.e. the change in the point displacement observed by applying a unit load at that point. This technique is sometimes referred to as the “multi-point flexibility change” technique.
. . . als On Fl-
A Monte Carlo procedure similar to that used to estimate the confidence intervals on the identified modal parameters is used to estimate the confidence intervals on the values of the flexibility change used as the damage indicator. Specifically, the confidence intervals on the mode shapes and modal fre- quencies are used to define a normal probability distribution on each component used to compute the flexibility. Then uncertain values of the modal parameters are computed repeatedly and the diagonal values of the flexibility matrix are computed each time for each damage case. After a sufficient number of runs (determined using convergence of the mean and standard devi- ations as well as the skewness and kurtosis of the distribution, as discussed in Ref. [14]), a statistical distribution is formed on the flexibility change parameters and a mean and confidence intervals are computed. Thus, the damage indicator (in this case the diagonal values of the flexibility change) now has statistical confidence intervals associated with it.
To assess whether the observed change between the un- damaged and damaged flexibility coefficients is statistically significant, a statistical test known as the t-test is used. As de- scribed by Freund [17], given two population samples of size n1 and n2 with sample means I, and I, and sample standard deviations SI and S 2 , a test statistic z can be defined as
Using this statistical approach, the objective is to test the hypothesis that one sample mean is statistically larger than the other, written as
I.?, - 2,l > 0 (7)
Solving for z in Eq. (6) with 6 = 0, it can then be stated that Eq. (7) is true to approximately the 95% confidence level if IzI 2 2 . Also, it can be stated that larger values of z indicate more confidence that the difference in the sample means is sta- tistically significant. We can thus define parameter changes that have larger values of z as being “more significant chang- es”.
EXPERIMENTAL RESULTS, STATISTICAL ANALYSIS, AND
DISCUSSION
The most basic sets of results from the identification of the modal parameters using the Monte Carlo estimation technique describe above are the confidence intervals on the identified modal frequencies, modal damping ratios, and mode shape components for each damage case. A comparison of the first modal frequency for each damage case with 20 confidence in- tervals is shown in Figure 2. As shown in this figure, the 2 0 confidence intervals are so small relative to the change from case to case that the -20 and +20 markers are barely distin- guishable from each other. A close up of Figure 2 showing only the undamaged case and the first two damage cases is shown in Figure 3. In this figure, the confidence intervals are distin-
2.55
2.5
2.45
2.4
2.35
2.3
2.25 dan-0 dam1 daW dam3 dam4
0 Mode 1 Mean =Mean + 2 sig =Mean - 2 sig
to describe the hypothesis I, -I2 = 6 , i.e. that the two sample means differ by an arbitrary value 6 . This formulation assumes that nl and n2 are large enough to invoke the central limit theorem and thus assume normal distributions in the pop- ulations.
Figure 2. First Modal Frequency for each Damage Case
guishable, but it is still obvious that the change from case to case is much greater than the confidence interval for each case. These results indicate that the changes in modal frequency from one damage case to the next tend to be statistically significant

.
_" ~ .. . _. __.._.___.__.__.___.._..___..---..--.-----
I I
3c
................................. 2.49 --
..............................................
dam3 dam1 dam
Figure 3. First Modal Frequency for First Two Damage Cases
with respect to the level of uncertainty arising from experimen- tal repeatability.
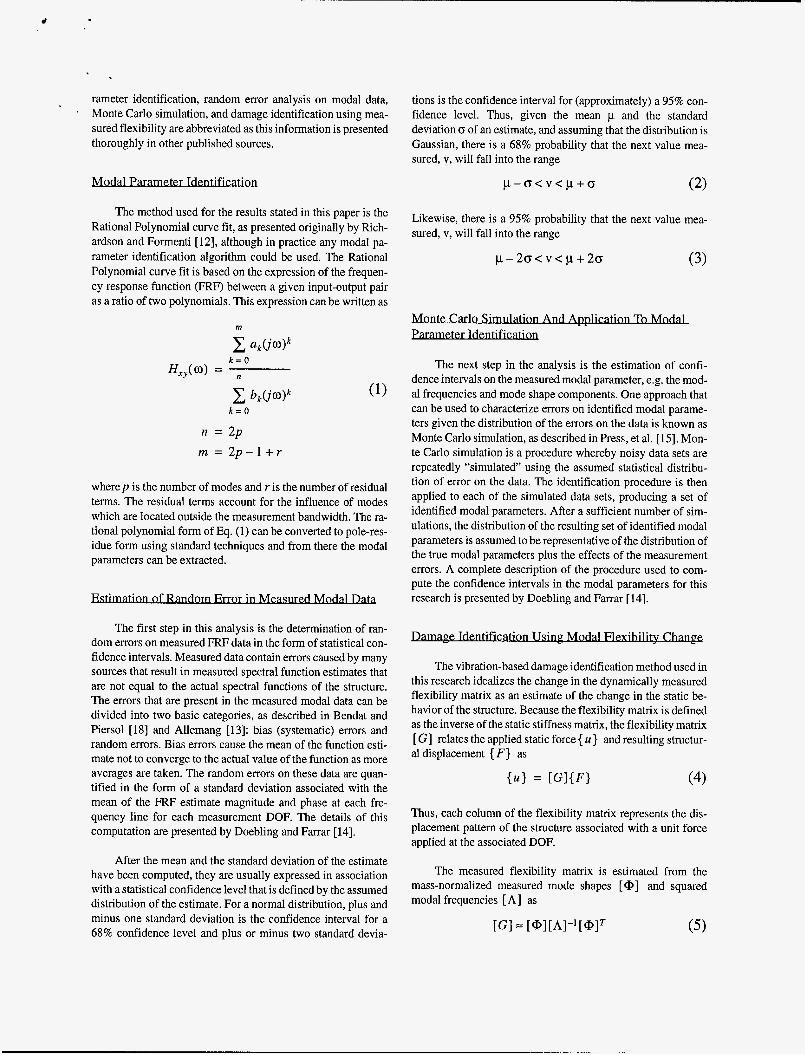
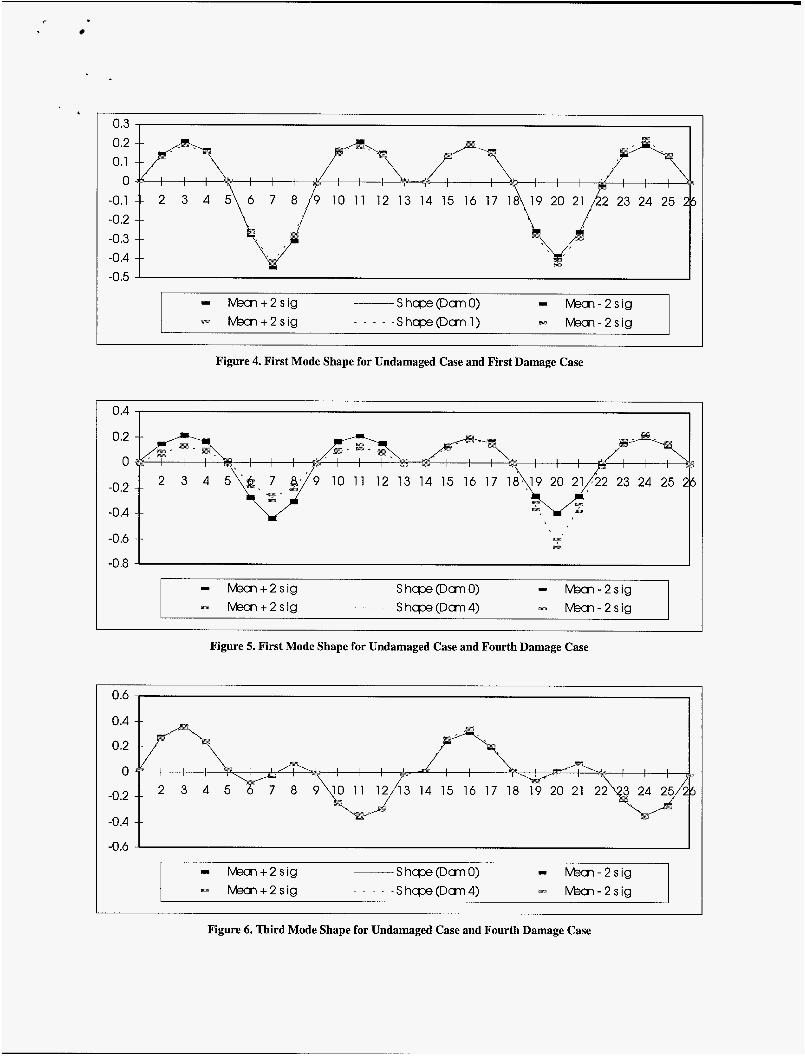
A comparison of the first mode shape (plotted against DOF number) for the undamaged and first damage cases (in- cluding 2 0 confidence intervals) is shown in Figure 4. This figure demonstrates that there is a slight shift in this mode shape after the first damage state is applied. The confidence in- tervals at some degrees of freedom clearly overlap, while the confidence intervals at other degrees of freedom do not overlap. In contrast to Figure 4, a comparison of the first mode shape for the undamaged and fourth damage cases is shown in Figure 5. This figure demonstrates that there is a major shift in this mode shape after the fourth damage state is applied. Thus it is clear that there is a significant change in some components of mode shape 1 for damage case 4, but the result is not as conclusive for damage case 1.
A similar comparison of the third mode shape for the un- damaged and fourth damage cases is shown in Figure 6. This figure demonstrates that there is a very slight shift in this mode shape even after the fourth damage state is applied. The confi- dence intervals at almost all degrees of freedom clearly overlap. Upon close inspection of this mode shape, it is apparent that it has a node at DOF 20, which is the location where the damage is applied. Thus it is logical that this mode is insensitive to dam- age at DOF 20 for all four damage cases.
The previous three comparisons give an idea of the statis- tical significance of the changes of these mode shapes as a re- sult of damage, but in a purely qualitative manner. To compare the relative level of statistical significance of the changes in these mode shapes after damage in a more quantitative manner, the z-statistics for 6 = 0 were computed using Eq. (6). The values of these z-statistics are shown in Figure 7. The three lines represent the z-statistic values of the differences between each of the mode shape pairs in Figure 4, Figure 5, and Figure 6. As discussed in the theory section, the z-statistics give a mea-
sure of statistical significance of the change of each mode shape component. It is clear from this plot that the only mode shape component that has a significantly larger change than the other components is at DOF 20 for the comparison of the undamaged first mode to the first mode after damage case 4. It can be seen in this plot that the change of mode 1 from undamaged to dam- age case 1 and the change of mode 3 from undamaged to dam- age case 4 are of about equal significance. Noting that mode three is almost totally insensitive to the damage, it is logical to assume that the changes in mode shape 3 (as well as mode shape 1 for damage case 1) do not result from damage, but rath- er from some other change in the experimental conditions.
Another comparison of z-statistics, Figure 8, shows the statistical significance of the changes in mode shape 1 for each damage case. This comparison would seem to support the as- sertion that the fourth damage case is the only one that demon- strates significant change in its modal properties as a result of damage. However, the real measure of the statistical signifi- cance of the changes must be made with respect to the damage indicator function and not with respect to the raw modal prop- erties. Such a comparison follows in the next section.
. . . red F l a h h t y Change
The change in the measured flexibility parameters is used as an indicator of structural damage for the 1-40 test results. The changes in the point-flexibility (diagonal values of the flexibil- ity matrix) are shown for each damage case in Figure 9. Ac- cording to these computations, the largest change in flexibility for each of the damage cases occurs at DOF 20, which is the known location of the damage. The second largest change is at DOF 7, which is the symmetric location across the span from the damage location. However, as mentioned in the introduc- tion, other researchers have found reason to believe that this fact is mere coincidence and that damage is not actually being detected until the final damage case.
To study the statistical significance of the flexibility changes presented in Figure 9, it is necessary to compute statis- tical confidence intervals on the measured flexibility from the undamaged case and each damage case. The estimation of these intervals is accomplished by means of a Monte Carlo analysis, as explained earlier in the paper.
The z-statistics of Eq. (6) with 6 = 0 are again used, this time to determine the relative significance of the changes in the measured flexibility components. A chart showing the z- statistic values for the changes in the flexibility components is presented in Figure 10. Upon examination of these values, the first observation that is apparent is that each damage case dem- onstrates a significant change from the undamaged case, as proven by the values of z which are much larger that 2 (in fact, are on the order of 10 and 20). However, this result alone only demonstrates that the changes in the structural flexibility are statistically significant with respect to the measurement repeat-
c
0.3 0.2 0.1
0 -0.1 -0.2 -0 -3 -0 -4 -0.5 - M x m + 2 s i g S hqse (Dan 0) - Mecn-2sig
bkan+2s ig _ _ _ _ - S h v ( D a n 1) = M - 2 s i g
Figure 4. First Mode Shape for Undamaged Case and First Damage Case
0.2
0
-0.2
-0 -4
-0.6
10 1 1 12 13 14 15 16 17 1
-0.8 I 1
= M n + 2 s i g S hape (Dan 0) - Mecn-2sig Mx ln+2s ig - S h v ( D a n 4 ) = Mecn-2sig
Figure 5. First Mode Shape for Undamaged Case and Fourth Damage Case
0.6
Figure 6. Third Mode Shape for Undamaged Case and Fourth Damage Case
M x n + 2 s i g _ _ . _ - 5 4 ) h v ( D m = f v k n - 2 s i g

15 20 25 30 DOF Number
5-
Figure 7. Comparison of Z-Statistics for Mode Shape Change Comparisons
h I1 1 1
I
1 B
1 -
Figure 8. Comparison of Z-Statistics for Mode Shape 1 for Each Damage Case vs. Undamaged
ability, not that the identification of the damage location is sta- tistically significant.
I , I , I 1 I I
0 . - A-
The second observation that is apparent from examination of Figure 10 is that until damage case 4, there is not a single par- ticular flexibility component that is noticeably larger than the others, implying that there is no localized damage. To illustrate this point, consider damage case 1. If the changes in flexibility for damage case 1 were caused by localized damage, then one would expect to see a more significant change at one particular flexibility component. The changes in flexibility of approxi- mately equal significance at several locations on the bridge in- dicate that variabilities other then localized damage are present in this data set. Thus, it can be stated that all four of the damage cases in the 1-40 experiment show statistically significant changes in measured flexibility. However, it cannot be stated that these changes conclusively localize the damage until the fourth and final damage case.
I 0 5 10 15 20 25 30
DOF Number -1 '
Figure 9. Flexibility Change for All 4 Damage Cases
1 I! i! 45 -
N20-
30 10 15 20 25 DOF Number
Figure 1O.Z-statistic values for Flexibility Change for All 4 Damage Cases
CONCLUSIONS
The statistical significance of vibration-based damage identification parameters was studied via application to the data from tests performed on the Interstate 40 highway bridge in Al- buquerque, New Mexico. A test of statistical significance was applied to the mean and confidence interval estimates of the modal properties and the corresponding indicators of damage in the form of the change in the measured flexibility matrix. Previously presented deterministic results indicate that damage is detectable in all of the damage cases from these data sets. The results of this study indicate that the changes in both the modal properties and the damage indicators are statistically significant for all of the damage cases. However, these changes are distrib- uted spatially for the first three damage cases and do not local- ize the damage until the fourth and final damage case. Perhaps an approach to consider for future studies of this type is the gen-
eration of a “damage noise floor” by computing damage indi- cators between multiple undamaged data sets. This approach would produce a baseline value for the damage indicator at each DOF that could be expected as a result of test-to-test vari- ations. The damage indicators computed using subsequent data sets could then be compared to the damage noise floor to quan- tify the statistical significance of the structural damage.
*
ACKNOWLEDGMENTS
This work was supported by Los Alamos National Labo- ratory Directed Research and Development Project #95002, under the auspices of the United States Department of Energy. The authors wish to recognize the Alliance for Transportation Research of the State of New Mexico for the use of the 1-40 ex- perimental data.
REFERENCES
Doebling, S.W., Farrar, C.R., Prime, M.B., and Shevitz, D.W., “Damage Identification and Health Monitoring of Structural and Mechanical Systems From Changes in Their Vibration Characteristics: A Literature Review,” Los Alamos National Laboratory report LA-1 3070-MS, 1996.
Farrar, C.R., Baker, W.E., Bell,T.M., Cone, K.M.,Dar- ling, T.W., Duffey, T.A., Eklund, A., and Migliori, A., “Dynamic Characterization and Damage Detection in the 1-40 Bridge Over the Rio Grande,” Los Alamos Na- tional Laboratory report LA-12767-MS, 1994.
Stubbs, N., Kim, J.-T., and Farrar, C.R., “Field Verifi- cation of a Nondestructive Damage Localization and Severity Estimation Algorithm,” in Proc. 13th Interna- tional Modal Analysis Conference, pp. 210-218, Febru- ary 1995.
Jauregui, D.V. and Farrar, C.R., “Damage Identifica- tion Algorithms Applied to Numerical Modal Data From a Bridge,” in Proc. 14th International Modal Analysis Conference, pp. 119-125, February 1996.
Jauregui, D.V. and Farrar, C.R., “Comparison of Dam- age Identification Algorithms on Experimental Modal Data From a Bridge,” in Proc. 14th International Mod- al Analysis Conference, pp. 1423-1429, February 1996.
Farrar, C.R. and Jauregui, D.V., “Damage Detection Algorithms Applied to Experimental and Numerical Modal Data From the 1-40 Bridge,” Los Alamos Na- tional Laboratory report LA-13074-MS, 1996
Alvin, K.F., “Robust Model Error Localization for Damage Detection and Finite Element Model Update,”
in Proc. of the 1995 International Adaptive Structures Conference, November 1995.
Simmermacher, T., Zimmerman, D., Mayes, R., Reese, G., and James, G., “The Effects of Finite Element Grid Density on Model Correlation and Damage Detection of a Bridge,” in Proc. of the 1995 AIM Adaptive Struc- tures Forum, New Orleans, LA, April 1995.
James, G., Mayes, R., Carne, T., and Reese, G., “Dam- age Detection and Health Monitoring of Operational Structures,” in Proc. of the Adaptive Structures and Materials Systems Symposium of the 1994 ASME Win- ter Annual Meeting, Chicago, IL, November 1994.
Mayes, R., “An Experimental Algorithm for Detecting Damage Applied to the 1-40 Bridge over the Rio Grande,” in Proc. of the 13th International Modal Anal- ysis Conference, Nashville, TN, pp. 219-225, January 1995.
Mazurek, D.F., “Modal Sensitivity to Damage in Mul- tigirder Bridges,” in Proc. of 15th International Modal Analysis Conference, Orlando, FL, pp. 1892-1898, Feb- ruary 1997.
Richardson, M.H. and Formenti, D.L., “Parameter Esti- mation from Frequency Response Measurements Using Rational Fraction Polynomials,” Proc. of 1st Interna- tional Modal Analysis Conference, pp. 167-1 8 l, Febru- ary 1982.
Allemang, R.J., Vibrations: Experimental Modal Anal- ysis Course Notes, UC-SDRL-CN-20-263-663/664, University of Cincinnati, February 1995.
Doebling, S.W. and Farrar, C.R., “A Monte Carlo- based Technique for Determination of Statistical Un- certainty on Identified Modal Parameters,” submitted to Journal of Vibration and Control, May 1997.
Press, W.H., Teukolsky, S.A., Vetterling, W.T., and Flannery, B.P., Numerical Recipes in FORTRAN, 2nd ed., Cambridge University Press, pp. 605-607,684-686, 1992
Robinson, N.A., Peterson, L.D., James, G.H., and Doe- bling, S.W., “Damage Detection in Aircraft Structures Using Dynamically Measured Static Flexibility Matri- ces,” in Proc. of 14th International Modal Analysis Conference, Dearborn, MI, February 1996, pp. 857- 865.
Freund, J., Mathematical Statistics, Prentice-Hall, En- glewood Cliffs, NJ, 5th Ed., 1992, p. 462.
Bendat, J.S. and Piersol, A.G., Engineering Applica- tions of Correlation and Spectral Analysis, John Wiley & Sons, New York, 1980, p. 274

Publ. Date (11) C ~ S ~ O 33 Sponsor Code (18) 3 O l 5 / P I R . 8 . 38E /mf ) x/=
DOE