autistic adolescents show atypical activation of the brain...
TRANSCRIPT

Autistic adolescents show atypical activation of the brain0s mentalizingsystem even without a prior history of mentalizing problems$
Sarah J. White a, Uta Frith a, Julian Rellecke b, Zainab Al-Noor a, Sam J. Gilbert a,n
a Institute of Cognitive Neuroscience, University College London, London, WC1N 3AR, UKb Department of Psychology, Humboldt-Universität zu Berlin, Berlin, Germany
a r t i c l e i n f o
Article history:Received 23 September 2013Received in revised form6 December 2013Accepted 13 December 2013Available online 19 December 2013
Keywords:AutismTheory of mindSocial impairmentDevelopmentLongitudinal
a b s t r a c t
Some autistic children pass classic Theory of Mind (ToM) tasks that others fail, but the significance of thisfinding is at present unclear. We identified two such groups of primary school age (labelled ToMþ andToM�) and a matched comparison group of typically developing children (TD). Five years later we testedthese participants again on a ToM test battery appropriate for adolescents and conducted an fMRI studywith a story based ToM task. We also assessed autistic core symptoms at these two time points. At bothtimes the ToM� group showed more severe social communication impairments than the ToMþ group,and while showing an improvement in mentalizing performance, they continued to show a significantimpairment compared to the NT group. Two independent ROI analyses of the BOLD signal showedactivation of the mentalizing network including medial prefrontal cortex, posterior cingulate and lateraltemporal cortices. Strikingly, both ToMþ and ToM� groups showed very similar patterns of heightenedactivation in comparison with the NT group. No differences in other brain regions were apparent. Thus,autistic adolescents who do not have a history of mentalizing problems according to our ToM batteryshowed the same atypical neurophysiological response during mentalizing as children who did havesuch a history. This finding indicates that heterogeneity at the behavioural level may nevertheless maponto a similar phenotype at the neuro-cognitive level.
& 2013 The Authors. Published by Elsevier Ltd. All rights reserved.
1. Introduction
One of the most enduring puzzles presented by autism is thehuge difference that may be observed between individuals, whileat the same time there is the compelling impression of similarityat some level. The impairments in social communication andinteraction, recently reaffirmed as critical for a clinical diagnosisby DSMV, may also be critical to this intuitive impression.Although the precise nature of the social impairments remainselusive, the ‘Theory of mind’ or ‘mentalizing’ hypothesis (Baron-Cohen, 1995; Baron-Cohen, Leslie, & Frith, 1985; Frith, 2012)represents a systematic attempt to explain both mild and severesocial impairments in autistic individuals. However, there is aproblem for this hypothesis. It has long been known that someautistic individuals can solve Theory of Mind tasks and others donot (Happé, 1995; Moran et al., 2011). The question we addresshere is whether these are two distinct subgroups or whether both
represent a similar neurocognitive phenotype, at the level ofanalysis provided by functional neuroimaging methods. We cananswer the question on the basis of the presence or absence ofatypical brain activation in those autistic children who have ahistory of being able to solve Theory of Mind tasks.
The existence of a mentalizing system in the brain is now wellaccepted (for reviews see Frith & Frith, 2012; Kennedy & Adolphs,2012; Lieberman, 2007; Mitchell, 2009; Van Overwalle, 2009).There is also evidence for atypical brain activation in this system inautistic participants (Brüne & Brüne-Cohrs, 2006; Gilbert, Bird,Brindley, Frith, & Burgess, 2008; Gilbert, Meuwese, Towgood, Frith,& Burgess, 2009; Gotts et al., 2012; Kana, Libero, Hu, Deshpande, &Colburn, 2012; Lombardo et al., 2010; Marsh & Hamilton, 2011;Spengler, Bird, & Brass, 2010). However it is not known whethersuch atypical activation is present even in individuals who cansolve Theory of Mind tasks. There may be an underlying impair-ment which is camouflaged at the behavioural level (Frith, 2004).Camouflage may happen when highly verbal individuals havelearned to give accurate answers to Theory of Mind tests usingeffortful logical inferences. Thus good mentalizing performancedoes not necessarily imply intact intuitive mentalizing ability.Indeed problems in implicit mentalizing have been revealed inautistic adults who performed well on explicit mentalizing tasks(Begeer, Bernstein, van Wijhe, Scheeren, & Koot, 2012; Senju,Southgate, White, & Frith, 2009). On the other hand, it is possible
Contents lists available at ScienceDirect
journal homepage: www.elsevier.com/locate/neuropsychologia
Neuropsychologia
0028-3932/$ - see front matter & 2013 The Authors. Published by Elsevier Ltd. All rights reserved.http://dx.doi.org/10.1016/j.neuropsychologia.2013.12.013
$This is an open-access article distributed under the terms of the CreativeCommons Attribution License, which permits unrestricted use, distribution, andreproduction in any medium, provided the original author and source are credited.
n Correspondence to: Institute of Cognitive Neuroscience, 17 Queen Square,London WC1N 3AR, UK. Tel.: þ44 20 7679 5498, þ44 20 3317 6770;fax: þ44 20 7813 2835.
E-mail address: [email protected] (S.J. Gilbert).
Neuropsychologia 56 (2014) 17–25
that a subgroup of autistic individuals have no problems inunderstanding intentions and beliefs, or that they can fully over-come such problems. This should be evident not only at thebehavioural but also the neural level. If so, this would suggest adistinct neurophysiologically defined phenotype.
To investigate this issue the present study took advantage of anexisting population of autistic as well as neurotypical adolescentswho had been extensively tested in childhood (White, Hill, Happé, &Frith, 2009). The sample of adolescents who participated in thepresent fMRI study were classified on the basis of their performance5 years earlier on a large mentalizing test battery: Thus one subgroupconsisted of those who had shown mentalizing performance as goodas that of neurotypical (NT) children (ToMþ), and another groupconsisted of those who had shown the more familiar pattern ofmentalizing impairment (ToM�). We administered a second menta-lizing test battery to find out to what extent performance changedover time. We also wanted to establish the validity of the mentalizingtask performance. It would be pointless to classify subgroups on theperformance of tests that were neither reliable over time nor valid inrelation to their real world symptoms. Therefore we investigatedwhether ToMþ children had milder core symptoms on diagnostictests, both in childhood and in adolescence.
2. Methods
2.1. Participants
Ethical approval for the study was received from the UCL Research EthicsCommittee and consent was obtained from the parents of all participants prior toinclusion in the study. The majority of individuals with ASD attended mainstreamschools and all had IQs within the normal range (full scale IQ greater than 85).
The participants were aged 11–17 years. They were a self-selected subset ofthose who previously took part in a study by White et al. (2009) at time 1 (T1)when aged 7–12 years. The original sample included 45 children with autismspectrum disorder (ASD), diagnosed independently by a qualified clinician. Ofthese, 29 were willing to be involved in the study 5 years later at time 2 (T2), but7 of these children were either unable to tolerate the scanning environment ortheir data were unusable due to movement in the scanner. The final sample of 22adolescents with ASD was split into ToM� and ToMþ groups of 11 each. A furthergroup of 11 typically developing adolescents was also recruited from the originalsample. The three groups were comparable in age (F(2,30)¼1.56, p¼ .23), gender(χ2(2)¼ .57, p¼ .75), verbal (F(2,30)¼ .90, p¼ .42) and performance IQ (F(2,30)¼2.44, p¼ .10) (see Table 1).
For the assessment of core symptoms the developmental, dimensional anddiagnostic interview (3Di: Skuse et al., 2004) was used at T1, and the autismdiagnostic observation schedule (ADOS-G: Lord et al., 2000) at T2. The 3Di measureis similar to the autism diagnostic interview (ADI-R: Lord, Rutter, & Le Couteur,1994) with which it correlates highly (r for each area of the triad of autistic featuresranges from .53 to.64; Skuse et al., 2004).
2.2. T1 ToM battery
This battery included both the ToM Strange Stories and a false belief ToM battery.The original T1 cohort included 27 NT children (White et al., 2009) and, on the basisof this larger NT group0s performance, individual variance on both sets of stories wascalculated, independent of age and IQ. This was done by entering raw data fromthese 27 NT children as the dependent variable in a regression, with T1 age, verbal,and performance IQ as predictors, and collecting the residuals. The same regressionequation was then applied to the 22 children with ASD taking part in this study andall scores were converted to z-scores in relation to the larger NT group0s means andstandard deviations. The average of the ToM Strange Stories and the false belief ToMbattery z-scores was then calculated to provide an overall measure of T1 ToM testperformance for each child. This method was necessary to provide an individualestimate of ToM ability independent of age and IQ on which the children with ASDcould be divided, so as to avoid the ToM� group being populated with younger andlower-IQ individuals. All participants in the resulting ToM� group had T1 ToM z-scores lower than �2.5 in comparison to the T2 NT group.
2.3. T2 ToM battery
Of the 5 tests given at T2, two had been included in the T1 false belief batteryand found then to be most discriminating between the groups, and three tasks
were new to the participants. The two T1 tasks were 1st order false belief tasks: atest of real versus apparent emotion (Wellman & Liu, 2004), where a characterwanted to create a false belief in others, and an interpretational false belief task(different picture to T1; Luckett, Powell, Messer, Thornton, & Schulz, 2002). Thethree new tasks were 2nd order false belief tasks: the coat story (Bowler, 1992), ahomework story modelled on the icecream van story (Baron-Cohen, 1989), and adouble bluff burglar story involving 2nd order deception (Happé, 1994). These werescored out of a total of 10. In all cases, the participant was asked to predict theknowledge of, behaviour of or emotion felt by another character on the basis oftheir mental state; this answer was marked as a pass or fail (1 or 0). The participantwas also asked to justify why they had made that prediction; this was marked as acorrect mental state justification (e.g., “because he doesn0t know that she knowsthat they0re out of stock”), a correct non-mental state justification (e.g., “becausethat0s where he had said he was going to go”), or an incorrect justification (e.g.,“because he needed to get a new coat”; 1, 0.5, or 0, respectively). This additionalscoring aimed to check for false positive responses when the participant wasachieving the correct answer by guessing, and also was expected to increase thevariation in responses with the aim of avoiding ceiling effects. Control questionswere administered (memory and reality questions plus prompt questions duringthe longer stories), which all individuals were required to pass, to check forcomprehension of the scenario.
2.4. T2 scanner task
Four different types of stories were administered: mental, human, animal andnature; for the present study only mental (ToM) and nature (non-ToM) werecompared as the human and animal stories have previously been found to rely to adegree on mentalizing ability (White et al., 2009). The story text and proceedingquestion were identical to those given in White et al. (2009) but the participant wasrequired to select an answer to this question from a choice of three possibleresponses. Participants listened to each story, question and response phasepresented binaurally through headphones, as well as simultaneously followingthe text visually on a computer screen in order to aid comprehension (see Fig. 1).
The stories were presented during four blocks; each block involved 8 stories,2 of each type, presented in a pseudorandom order, ensuring that two stories of thesame type were not presented consecutively. Each story–question–response serieslasted 58 s in total; the story phase was presented first (taking between 20 and
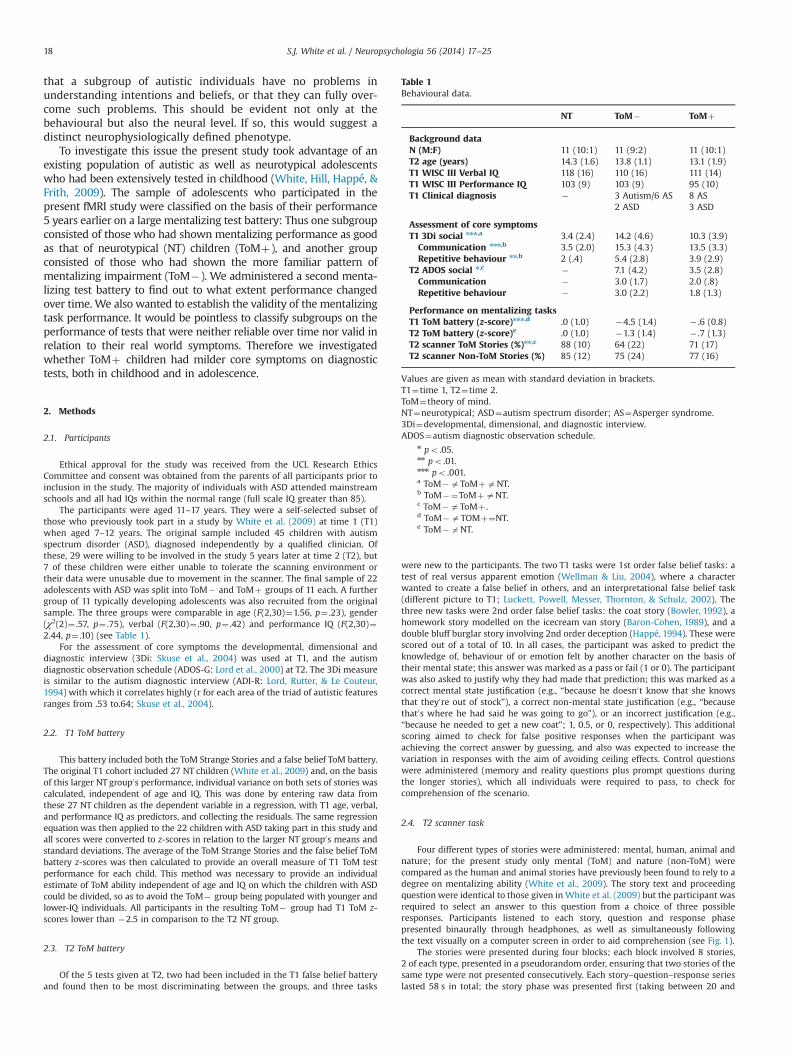
Table 1Behavioural data.
NT ToM� ToMþ
Background dataN (M:F) 11 (10:1) 11 (9:2) 11 (10:1)T2 age (years) 14.3 (1.6) 13.8 (1.1) 13.1 (1.9)T1 WISC III Verbal IQ 118 (16) 110 (16) 111 (14)T1 WISC III Performance IQ 103 (9) 103 (9) 95 (10)T1 Clinical diagnosis � 3 Autism/6 AS 8 AS
2 ASD 3 ASD
Assessment of core symptomsT1 3Di social nnn,a 3.4 (2.4) 14.2 (4.6) 10.3 (3.9)
Communication nnn,b 3.5 (2.0) 15.3 (4.3) 13.5 (3.3)Repetitive behaviour nn,b 2 (.4) 5.4 (2.8) 3.9 (2.9)
T2 ADOS social n,c � 7.1 (4.2) 3.5 (2.8)Communication � 3.0 (1.7) 2.0 (.8)Repetitive behaviour � 3.0 (2.2) 1.8 (1.3)
Performance on mentalizing tasksT1 ToM battery (z-score)nnn,d .0 (1.0) �4.5 (1.4) � .6 (0.8)T2 ToM battery (z-score)e .0 (1.0) �1.3 (1.4) � .7 (1.3)T2 scanner ToM Stories (%)nn,c 88 (10) 64 (22) 71 (17)T2 scanner Non-ToM Stories (%) 85 (12) 75 (24) 77 (16)
Values are given as mean with standard deviation in brackets.T1¼time 1, T2¼time 2.ToM¼theory of mind.NT¼neurotypical; ASD¼autism spectrum disorder; AS¼Asperger syndrome.3Di¼developmental, dimensional, and diagnostic interview.ADOS¼autism diagnostic observation schedule.
n po .05.nn po .01.nnn po .001.a ToM�aToMþaNT.b ToM�¼ToMþaNT.c ToM�aToMþ .d ToM�aTOMþ¼NT.e ToM�aNT.
S.J. White et al. / Neuropsychologia 56 (2014) 17–2518
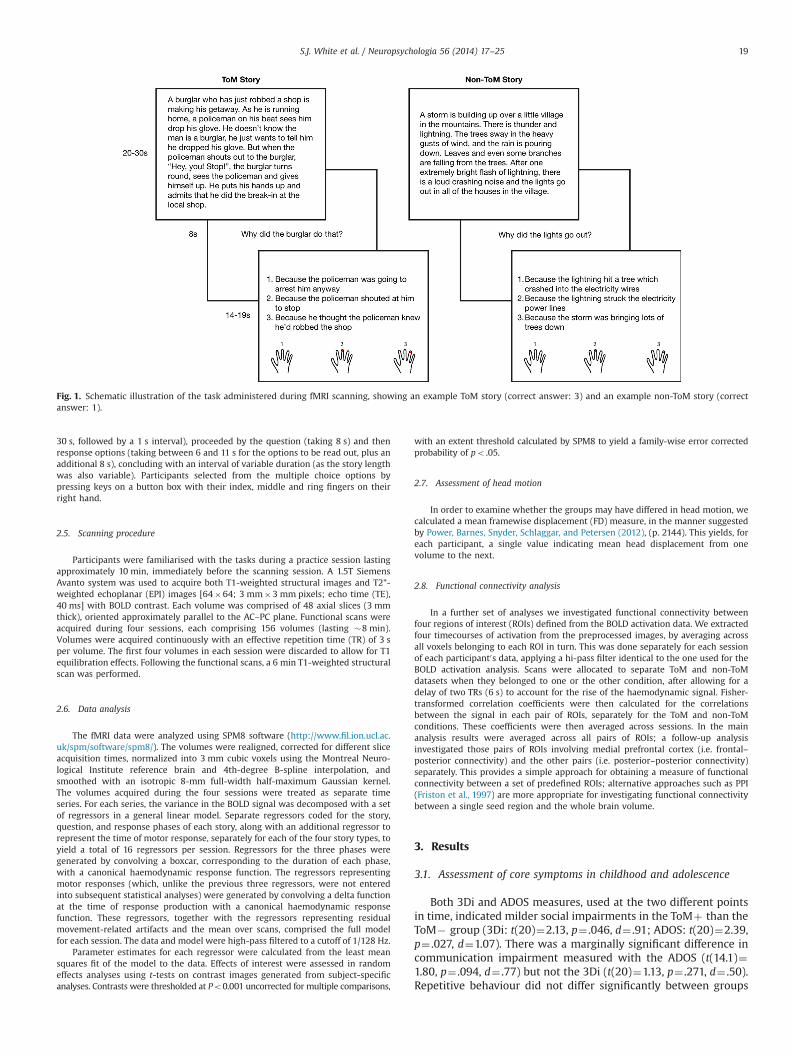
30 s, followed by a 1 s interval), proceeded by the question (taking 8 s) and thenresponse options (taking between 6 and 11 s for the options to be read out, plus anadditional 8 s), concluding with an interval of variable duration (as the story lengthwas also variable). Participants selected from the multiple choice options bypressing keys on a button box with their index, middle and ring fingers on theirright hand.
2.5. Scanning procedure
Participants were familiarised with the tasks during a practice session lastingapproximately 10 min, immediately before the scanning session. A 1.5T SiemensAvanto system was used to acquire both T1-weighted structural images and T2*-weighted echoplanar (EPI) images [64�64; 3 mm�3 mm pixels; echo time (TE),40 ms] with BOLD contrast. Each volume was comprised of 48 axial slices (3 mmthick), oriented approximately parallel to the AC–PC plane. Functional scans wereacquired during four sessions, each comprising 156 volumes (lasting �8 min).Volumes were acquired continuously with an effective repetition time (TR) of 3 sper volume. The first four volumes in each session were discarded to allow for T1equilibration effects. Following the functional scans, a 6 min T1-weighted structuralscan was performed.
2.6. Data analysis
The fMRI data were analyzed using SPM8 software (http://www.fil.ion.ucl.ac.uk/spm/software/spm8/). The volumes were realigned, corrected for different sliceacquisition times, normalized into 3 mm cubic voxels using the Montreal Neuro-logical Institute reference brain and 4th-degree B-spline interpolation, andsmoothed with an isotropic 8-mm full-width half-maximum Gaussian kernel.The volumes acquired during the four sessions were treated as separate timeseries. For each series, the variance in the BOLD signal was decomposed with a setof regressors in a general linear model. Separate regressors coded for the story,question, and response phases of each story, along with an additional regressor torepresent the time of motor response, separately for each of the four story types, toyield a total of 16 regressors per session. Regressors for the three phases weregenerated by convolving a boxcar, corresponding to the duration of each phase,with a canonical haemodynamic response function. The regressors representingmotor responses (which, unlike the previous three regressors, were not enteredinto subsequent statistical analyses) were generated by convolving a delta functionat the time of response production with a canonical haemodynamic responsefunction. These regressors, together with the regressors representing residualmovement-related artifacts and the mean over scans, comprised the full modelfor each session. The data and model were high-pass filtered to a cutoff of 1/128 Hz.
Parameter estimates for each regressor were calculated from the least meansquares fit of the model to the data. Effects of interest were assessed in randomeffects analyses using t-tests on contrast images generated from subject-specificanalyses. Contrasts were thresholded at Po0.001 uncorrected for multiple comparisons,
with an extent threshold calculated by SPM8 to yield a family-wise error correctedprobability of po .05.
2.7. Assessment of head motion
In order to examine whether the groups may have differed in head motion, wecalculated a mean framewise displacement (FD) measure, in the manner suggestedby Power, Barnes, Snyder, Schlaggar, and Petersen (2012), (p. 2144). This yields, foreach participant, a single value indicating mean head displacement from onevolume to the next.
2.8. Functional connectivity analysis
In a further set of analyses we investigated functional connectivity betweenfour regions of interest (ROIs) defined from the BOLD activation data. We extractedfour timecourses of activation from the preprocessed images, by averaging acrossall voxels belonging to each ROI in turn. This was done separately for each sessionof each participant0s data, applying a hi-pass filter identical to the one used for theBOLD activation analysis. Scans were allocated to separate ToM and non-ToMdatasets when they belonged to one or the other condition, after allowing for adelay of two TRs (6 s) to account for the rise of the haemodynamic signal. Fisher-transformed correlation coefficients were then calculated for the correlationsbetween the signal in each pair of ROIs, separately for the ToM and non-ToMconditions. These coefficients were then averaged across sessions. In the mainanalysis results were averaged across all pairs of ROIs; a follow-up analysisinvestigated those pairs of ROIs involving medial prefrontal cortex (i.e. frontal–posterior connectivity) and the other pairs (i.e. posterior–posterior connectivity)separately. This provides a simple approach for obtaining a measure of functionalconnectivity between a set of predefined ROIs; alternative approaches such as PPI(Friston et al., 1997) are more appropriate for investigating functional connectivitybetween a single seed region and the whole brain volume.
3. Results
3.1. Assessment of core symptoms in childhood and adolescence
Both 3Di and ADOS measures, used at the two different pointsin time, indicated milder social impairments in the ToMþ than theToM� group (3Di: t(20)¼2.13, p¼ .046, d¼ .91; ADOS: t(20)¼2.39,p¼ .027, d¼1.07). There was a marginally significant difference incommunication impairment measured with the ADOS (t(14.1)¼1.80, p¼ .094, d¼ .77) but not the 3Di (t(20)¼1.13, p¼ .271, d¼ .50).Repetitive behaviour did not differ significantly between groups
Fig. 1. Schematic illustration of the task administered during fMRI scanning, showing an example ToM story (correct answer: 3) and an example non-ToM story (correctanswer: 1).
S.J. White et al. / Neuropsychologia 56 (2014) 17–25 19
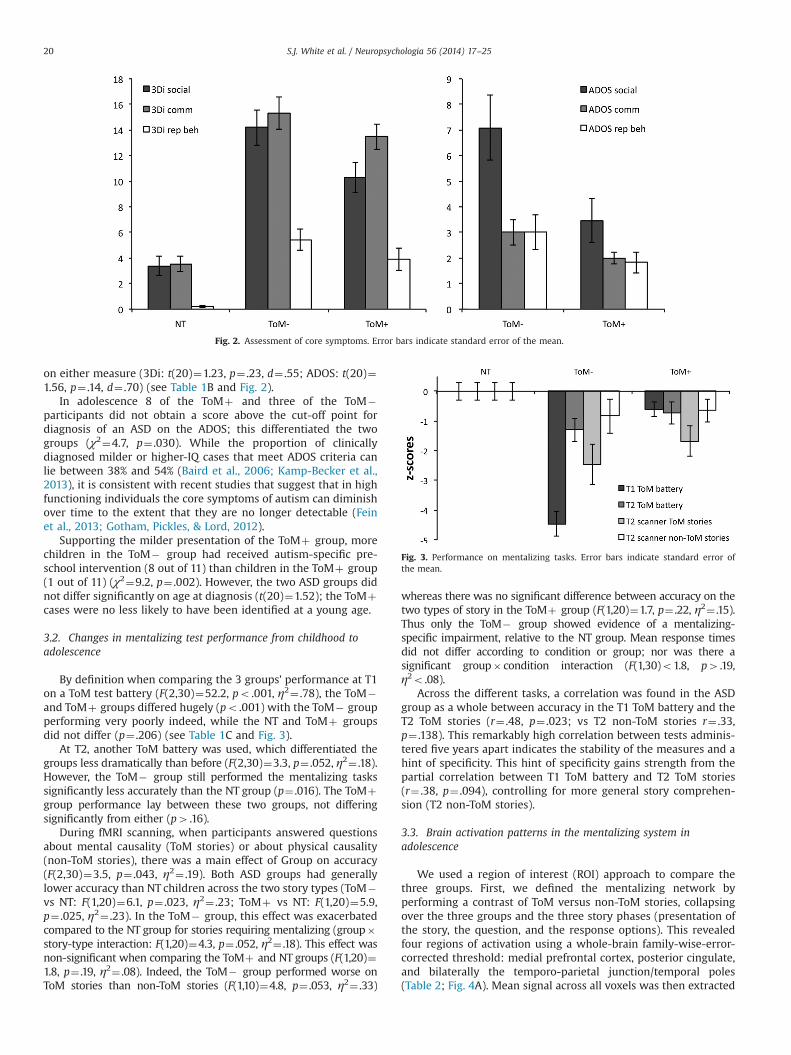
on either measure (3Di: t(20)¼1.23, p¼ .23, d¼ .55; ADOS: t(20)¼1.56, p¼ .14, d¼ .70) (see Table 1B and Fig. 2).
In adolescence 8 of the ToMþ and three of the ToM�participants did not obtain a score above the cut-off point fordiagnosis of an ASD on the ADOS; this differentiated the twogroups (χ2¼4.7, p¼ .030). While the proportion of clinicallydiagnosed milder or higher-IQ cases that meet ADOS criteria canlie between 38% and 54% (Baird et al., 2006; Kamp-Becker et al.,2013), it is consistent with recent studies that suggest that in highfunctioning individuals the core symptoms of autism can diminishover time to the extent that they are no longer detectable (Feinet al., 2013; Gotham, Pickles, & Lord, 2012).
Supporting the milder presentation of the ToMþ group, morechildren in the ToM� group had received autism-specific pre-school intervention (8 out of 11) than children in the ToMþ group(1 out of 11) (χ2¼9.2, p¼ .002). However, the two ASD groups didnot differ significantly on age at diagnosis (t(20)¼1.52); the ToMþcases were no less likely to have been identified at a young age.
3.2. Changes in mentalizing test performance from childhood toadolescence
By definition when comparing the 3 groups’ performance at T1on a ToM test battery (F(2,30)¼52.2, po .001, η2¼ .78), the ToM�and ToMþ groups differed hugely (po .001) with the ToM� groupperforming very poorly indeed, while the NT and ToMþ groupsdid not differ (p¼ .206) (see Table 1C and Fig. 3).
At T2, another ToM battery was used, which differentiated thegroups less dramatically than before (F(2,30)¼3.3, p¼ .052, η2¼ .18).However, the ToM� group still performed the mentalizing taskssignificantly less accurately than the NT group (p¼ .016). The ToMþgroup performance lay between these two groups, not differingsignificantly from either (p4 .16).
During fMRI scanning, when participants answered questionsabout mental causality (ToM stories) or about physical causality(non-ToM stories), there was a main effect of Group on accuracy(F(2,30)¼3.5, p¼ .043, η2¼ .19). Both ASD groups had generallylower accuracy than NT children across the two story types (ToM�vs NT: F(1,20)¼6.1, p¼ .023, η2¼ .23; ToMþ vs NT: F(1,20)¼5.9,p¼ .025, η2¼ .23). In the ToM� group, this effect was exacerbatedcompared to the NT group for stories requiring mentalizing (group�story-type interaction: F(1,20)¼4.3, p¼ .052, η2¼ .18). This effect wasnon-significant when comparing the ToMþ and NT groups (F(1,20)¼1.8, p¼ .19, η2¼ .08). Indeed, the ToM� group performed worse onToM stories than non-ToM stories (F(1,10)¼4.8, p¼ .053, η2¼ .33)
whereas there was no significant difference between accuracy on thetwo types of story in the ToMþ group (F(1,20)¼1.7, p¼ .22, η2¼ .15).Thus only the ToM� group showed evidence of a mentalizing-specific impairment, relative to the NT group. Mean response timesdid not differ according to condition or group; nor was there asignificant group� condition interaction (F(1,30)o1.8, p4 .19,η2o .08).
Across the different tasks, a correlation was found in the ASDgroup as a whole between accuracy in the T1 ToM battery and theT2 ToM stories (r¼ .48, p¼ .023; vs T2 non-ToM stories r¼ .33,p¼ .138). This remarkably high correlation between tests adminis-tered five years apart indicates the stability of the measures and ahint of specificity. This hint of specificity gains strength from thepartial correlation between T1 ToM battery and T2 ToM stories(r¼ .38, p¼ .094), controlling for more general story comprehen-sion (T2 non-ToM stories).
3.3. Brain activation patterns in the mentalizing system inadolescence
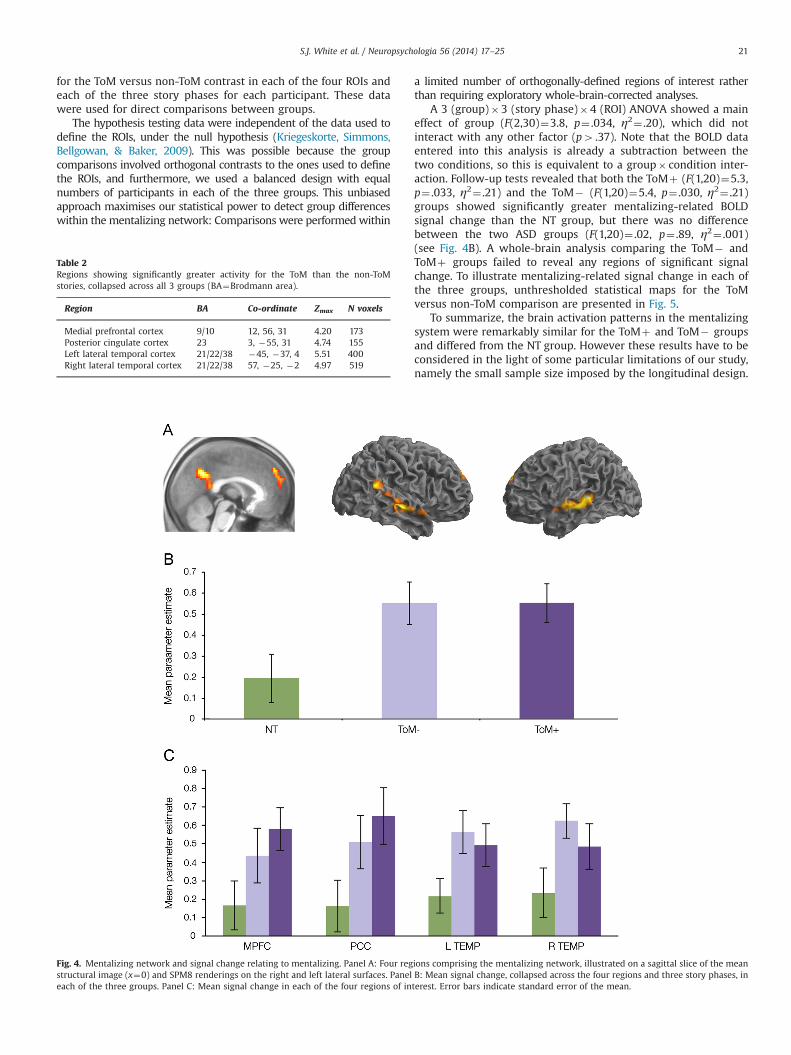
We used a region of interest (ROI) approach to compare thethree groups. First, we defined the mentalizing network byperforming a contrast of ToM versus non-ToM stories, collapsingover the three groups and the three story phases (presentation ofthe story, the question, and the response options). This revealedfour regions of activation using a whole-brain family-wise-error-corrected threshold: medial prefrontal cortex, posterior cingulate,and bilaterally the temporo-parietal junction/temporal poles(Table 2; Fig. 4A). Mean signal across all voxels was then extracted
Fig. 2. Assessment of core symptoms. Error bars indicate standard error of the mean.
Fig. 3. Performance on mentalizing tasks. Error bars indicate standard error ofthe mean.
S.J. White et al. / Neuropsychologia 56 (2014) 17–2520
for the ToM versus non-ToM contrast in each of the four ROIs andeach of the three story phases for each participant. These datawere used for direct comparisons between groups.
The hypothesis testing data were independent of the data used todefine the ROIs, under the null hypothesis (Kriegeskorte, Simmons,Bellgowan, & Baker, 2009). This was possible because the groupcomparisons involved orthogonal contrasts to the ones used to definethe ROIs, and furthermore, we used a balanced design with equalnumbers of participants in each of the three groups. This unbiasedapproach maximises our statistical power to detect group differenceswithin the mentalizing network: Comparisons were performed within
a limited number of orthogonally-defined regions of interest ratherthan requiring exploratory whole-brain-corrected analyses.
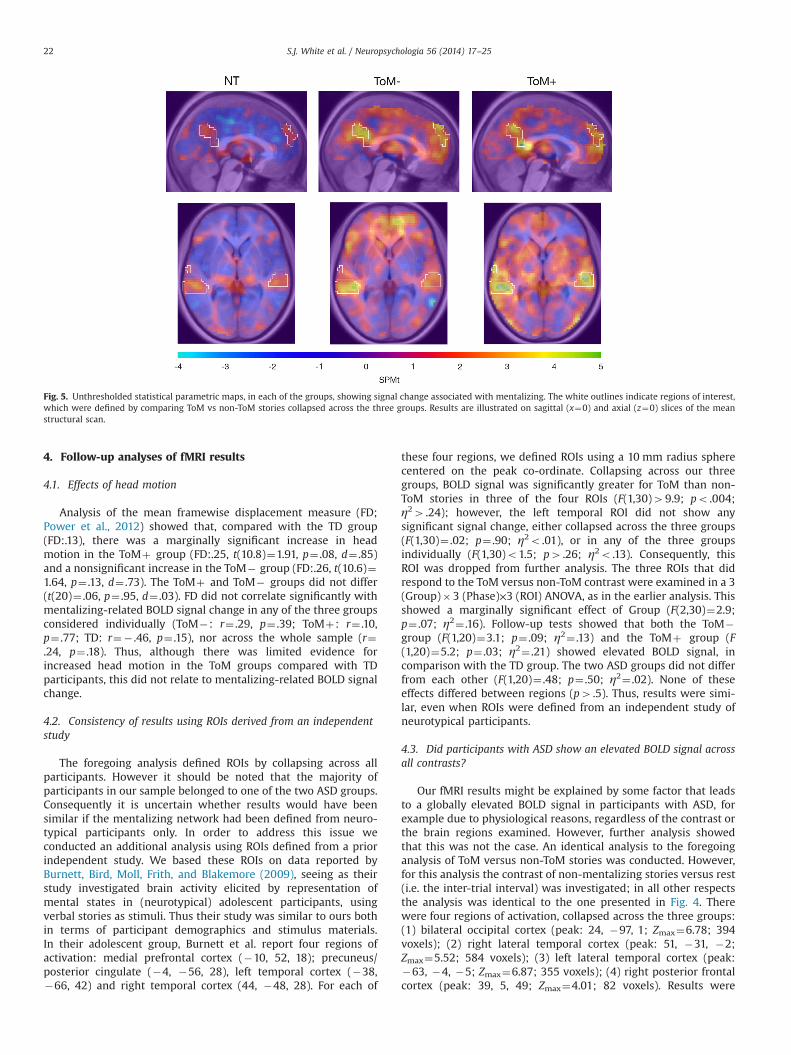
A 3 (group)�3 (story phase)�4 (ROI) ANOVA showed a maineffect of group (F(2,30)¼3.8, p¼ .034, η2¼ .20), which did notinteract with any other factor (p4 .37). Note that the BOLD dataentered into this analysis is already a subtraction between thetwo conditions, so this is equivalent to a group� condition inter-action. Follow-up tests revealed that both the ToMþ (F(1,20)¼5.3,p¼ .033, η2¼ .21) and the ToM� (F(1,20)¼5.4, p¼ .030, η2¼ .21)groups showed significantly greater mentalizing-related BOLDsignal change than the NT group, but there was no differencebetween the two ASD groups (F(1,20)¼ .02, p¼ .89, η2¼ .001)(see Fig. 4B). A whole-brain analysis comparing the ToM� andToMþ groups failed to reveal any regions of significant signalchange. To illustrate mentalizing-related signal change in each ofthe three groups, unthresholded statistical maps for the ToMversus non-ToM comparison are presented in Fig. 5.
To summarize, the brain activation patterns in the mentalizingsystem were remarkably similar for the ToMþ and ToM� groupsand differed from the NT group. However these results have to beconsidered in the light of some particular limitations of our study,namely the small sample size imposed by the longitudinal design.
Table 2Regions showing significantly greater activity for the ToM than the non-ToMstories, collapsed across all 3 groups (BA¼Brodmann area).
Region BA Co-ordinate Zmax N voxels
Medial prefrontal cortex 9/10 12, 56, 31 4.20 173Posterior cingulate cortex 23 3, �55, 31 4.74 155Left lateral temporal cortex 21/22/38 �45, �37, 4 5.51 400Right lateral temporal cortex 21/22/38 57, �25, �2 4.97 519
Fig. 4. Mentalizing network and signal change relating to mentalizing. Panel A: Four regions comprising the mentalizing network, illustrated on a sagittal slice of the meanstructural image (x¼0) and SPM8 renderings on the right and left lateral surfaces. Panel B: Mean signal change, collapsed across the four regions and three story phases, ineach of the three groups. Panel C: Mean signal change in each of the four regions of interest. Error bars indicate standard error of the mean.
S.J. White et al. / Neuropsychologia 56 (2014) 17–25 21
4. Follow-up analyses of fMRI results
4.1. Effects of head motion
Analysis of the mean framewise displacement measure (FD;Power et al., 2012) showed that, compared with the TD group(FD:.13), there was a marginally significant increase in headmotion in the ToMþ group (FD:.25, t(10.8)¼1.91, p¼ .08, d¼ .85)and a nonsignificant increase in the ToM� group (FD:.26, t(10.6)¼1.64, p¼ .13, d¼ .73). The ToMþ and ToM� groups did not differ(t(20)¼ .06, p¼ .95, d¼ .03). FD did not correlate significantly withmentalizing-related BOLD signal change in any of the three groupsconsidered individually (ToM�: r¼ .29, p¼ .39; ToMþ: r¼ .10,p¼ .77; TD: r¼� .46, p¼ .15), nor across the whole sample (r¼.24, p¼ .18). Thus, although there was limited evidence forincreased head motion in the ToM groups compared with TDparticipants, this did not relate to mentalizing-related BOLD signalchange.
4.2. Consistency of results using ROIs derived from an independentstudy
The foregoing analysis defined ROIs by collapsing across allparticipants. However it should be noted that the majority ofparticipants in our sample belonged to one of the two ASD groups.Consequently it is uncertain whether results would have beensimilar if the mentalizing network had been defined from neuro-typical participants only. In order to address this issue weconducted an additional analysis using ROIs defined from a priorindependent study. We based these ROIs on data reported byBurnett, Bird, Moll, Frith, and Blakemore (2009), seeing as theirstudy investigated brain activity elicited by representation ofmental states in (neurotypical) adolescent participants, usingverbal stories as stimuli. Thus their study was similar to ours bothin terms of participant demographics and stimulus materials.In their adolescent group, Burnett et al. report four regions ofactivation: medial prefrontal cortex (�10, 52, 18); precuneus/posterior cingulate (�4, �56, 28), left temporal cortex (�38,�66, 42) and right temporal cortex (44, �48, 28). For each of
these four regions, we defined ROIs using a 10 mm radius spherecentered on the peak co-ordinate. Collapsing across our threegroups, BOLD signal was significantly greater for ToM than non-ToM stories in three of the four ROIs (F(1,30)49.9; po .004;η24 .24); however, the left temporal ROI did not show anysignificant signal change, either collapsed across the three groups(F(1,30)¼ .02; p¼ .90; η2o .01), or in any of the three groupsindividually (F(1,30)o1.5; p4 .26; η2o .13). Consequently, thisROI was dropped from further analysis. The three ROIs that didrespond to the ToM versus non-ToM contrast were examined in a 3(Group)�3 (Phase)×3 (ROI) ANOVA, as in the earlier analysis. Thisshowed a marginally significant effect of Group (F(2,30)¼2.9;p¼ .07; η2¼ .16). Follow-up tests showed that both the ToM�group (F(1,20)¼3.1; p¼ .09; η2¼ .13) and the ToMþ group (F(1,20)¼5.2; p¼ .03; η2¼ .21) showed elevated BOLD signal, incomparison with the TD group. The two ASD groups did not differfrom each other (F(1,20)¼ .48; p¼ .50; η2¼ .02). None of theseeffects differed between regions (p4 .5). Thus, results were simi-lar, even when ROIs were defined from an independent study ofneurotypical participants.
4.3. Did participants with ASD show an elevated BOLD signal acrossall contrasts?
Our fMRI results might be explained by some factor that leadsto a globally elevated BOLD signal in participants with ASD, forexample due to physiological reasons, regardless of the contrast orthe brain regions examined. However, further analysis showedthat this was not the case. An identical analysis to the foregoinganalysis of ToM versus non-ToM stories was conducted. However,for this analysis the contrast of non-mentalizing stories versus rest(i.e. the inter-trial interval) was investigated; in all other respectsthe analysis was identical to the one presented in Fig. 4. Therewere four regions of activation, collapsed across the three groups:(1) bilateral occipital cortex (peak: 24, �97, 1; Zmax¼6.78; 394voxels); (2) right lateral temporal cortex (peak: 51, �31, �2;Zmax¼5.52; 584 voxels); (3) left lateral temporal cortex (peak:�63, �4, �5; Zmax¼6.87; 355 voxels); (4) right posterior frontalcortex (peak: 39, 5, 49; Zmax¼4.01; 82 voxels). Results were
Fig. 5. Unthresholded statistical parametric maps, in each of the groups, showing signal change associated with mentalizing. The white outlines indicate regions of interest,which were defined by comparing ToM vs non-ToM stories collapsed across the three groups. Results are illustrated on sagittal (x¼0) and axial (z¼0) slices of the meanstructural scan.
S.J. White et al. / Neuropsychologia 56 (2014) 17–2522
analysed as above in a 3 (group)�3 (story phase)�4 (ROI)ANOVA. In contrast to the mentalizing-related analysis, thisanalysis revealed no significant effect of group (mean parameterestimates: NT¼ .50, SE¼ .10; ToM�¼ .60, SE¼ .10; ToMþ¼ .35,SE¼ .09; F(2,30)¼1.7, p¼ .20, η2¼ .10). Thus it was not the casethat signal change was elevated in the two autism groups acrossall statistical contrasts, as might be expected if the results shownin Fig. 4 resulted from a global factor that differed between groups.
4.4. Was there sufficient power to detect differences between ToMþand ToM� groups?
Calculation of effect sizes (Cohen0s d) indicated large effectswhen comparing BOLD signal change in each of the ASD groupswith the NT group (ToM�: d¼1.04; ToMþ: d¼1.03). By contrast,the comparison of ToMþ versus ToM� yielded a d of just 0.06.There were also large behavioural differences between the ToMþand ToM� groups in the ADOS and 3Di social scales (d¼1.01 and0.91, respectively). Power calculations (Faul, Erdfelder, Lang, &Buchner, 2007) indicate that had there been correspondingly largeeffects in the BOLD signal comparison between ToMþ and ToM� ,our study would have power ranging from 66 to 78% to detect atleast a marginally significant effect, whereas there was in fact nohint of an effect (p¼ .89). However, it should be noted that post-hoc power analyses of this type are likely to inflate effect sizes(Button et al., 2013).
4.5. Would a Bayesian analysis give similar results?
Rouder, Speckman, Sun, Morey, and Iverson (2009) suggest analternative approach for determining whether a dataset can beconsidered to provide positive support in favour of, or against, anull hypothesis, by calculating Bayes Factors (Kass & Raftery, 1995).Applying the JZS Bayes Factor method suggested by Rouder et al. toour ToMþ versus ToM� BOLD comparison (with default scalefactor 1.0) yields a Bayes Factor of 3.3, i.e. positive support for thenull hypothesis, where a factor in excess of 3.2 is conventionallyconsidered to provide “substantial” evidence (Kass & Raftery,1995).
4.6. Were there differences in functional connectivity betweengroups?
In a final analysis we considered whether the groups may havediffered in functional connectivity between the four ROIs, even inthe absence of overall signal change differences. Functional con-nectivity was calculated in each group, separately for the ToM andnon-ToM stories, averaged across each pair of ROIs. Connectivitywas significantly greater during ToM than non-ToM stories (F(1,30)¼8.3, p¼ .007, η2¼ .22). However, there was no main effectof group nor group� condition interaction (F(2,30)o .95, p4 .39,η2o .06). The measures of functional connectivity did not correlatesignificantly with head motion (i.e. mean framewise displace-ment), either within each group separately or across the whole
sample (|r|o .57; p4 .069). These results are shown in Table 3.Similar results held even when investigating frontal-posterior orposterior-posterior connectivity alone (effect of condition: F(1,30)45.4; po .03; η24 .15; effect of group/group� condition interac-tion: F(2,30)o2.4; p4 .11; η2o .14). Thus, although our measurewas sensitive enough to detect an enhancement of functionalconnectivity during ToM versus non-ToM stories, this measure didnot distinguish the three groups.
5. Discussion
All the individuals in our sample had been clinically diagnosedas autistic in early childhood. When they were first tested withmentalizing tasks they were between 7 and 12 years old. Theirperformance on these tasks varied enormously and allowed us todivide them into two groups (ToMþ and ToM�). The differencesbetween the groups, who were of similar IQ and socioeconomicbackground, were reflected in differences in symptom severity.Thus, poor mentalizing performance was associated with a moresevere pattern of social and communication behaviours. This wasthe case in childhood, when parents were interviewed, and wasstill the case in adolescence when the participants were assessedin the lab through observation with the ADOS. The relationshipwith different assessment instruments at different points in timeare in line with the idea that mentalizing difficulties underlie bothperformance on specific tests and core symptoms that the diag-nostic instruments address.
Our longitudinal design allows us to say something about thepersistence of mentalizing difficulties over time, at least for theToM� group. Here it is likely that even early in life more severedifficulties were evident, since there was greater use of preschoolintervention than in the ToMþ group. Nevertheless, mentalizingtest performance improved markedly from childhood to adoles-cence. Despite this improvement, which brought the ToM� groupmore in line with the ToMþ group, they remained significantlyimpaired relative to the NT group. Furthermore, at the neurophy-siological level both autistic groups showed equally atypicalactivation. We found as clear an answer as possible to the questionof whether the ToMþ group did or did not differ from the ToM�group at the level of neurophysiology at adolescence: ToMþ andToM� groups showed similarly atypical BOLD responses in thementalizing system and both differed from the NT group. Wetherefore suggest that there is a neurophysiological abnormalitythat persists despite improvements over time, despite individualdifferences in performance, and is present even in mildly impairedASD adolescents.
Both ASD groups showed greater activation of the mentalizingnetwork than NT participants. This is consistent with other recentstudies showing over-activation of mentalizing-related brainregions in ASD, both in mentalizing (Gilbert et al., 2009; Mason,Williams, Kana, Minshew, & Just, 2008) and non-mentalizing(Dichter, Felder, & Bodfish, 2009; Gilbert et al., 2008) tasks.However, other previous studies have reported under-activationof the mentalizing network (Castelli, Frith, Happé, & Frith, 2002;Happé et al., 1996; Kana et al., 2012; Lombardo, Chakrabarti,Bullmore, & Baron-Cohen, 2011; Silani et al., 2008; Wang, Lee,Sigman, & Dapretto, 2007) or no differences (Dufour et al., 2013).Thus, it appears that atypical mentalizing-related brain activity inASD can take the form of both under- and over-activation, likely asa result of task-specific factors (Koster-Hale, Saxe, Dungan, &Young, 2013). Koster-Hale et al. (2013) suggest that one task-specific factor potentially influencing under- versus over-activation is the use of implicit versus explicit tasks. In an implicittask, where participants are not explicitly instructed to engagementalizing processes, it is possible that participants with ASD fail
Table 3Functional connectivity within the mentalizing network (mean Fisher-transformedcorrelation coefficient) in each group.
Mean (SD)
NT ToM� ToMþ
Non-ToM stories .527 (.107) .570 (.179) .567 (.190)ToM stories .646 (.206) .637 (.132) .601 (.168)
S.J. White et al. / Neuropsychologia 56 (2014) 17–25 23
to engage these processes and therefore underactivate the menta-lizing network. An example of this type of task might be theanimations task used by Castelli et al. (2002), where participantsare asked to describe the movement of animated shapes. Neuro-typical individuals typically interpret such animations usingmental-state concepts more appropriately than autistic partici-pants (White, Coniston, Rogers, & Frith, 2011). In Castelli et al.0s(2002) study autistic participants under-activated the mentalizingsystem. By contrast, in explicit tasks, participants with autism mayexpend more effort to compensate for mentalizing difficulties,hence over-activating the mentalizing network. The present studywould be an example of an explicit task: the mentalizing storiesare followed by the explicit question to explain a character0sbehaviour in terms of mental state attribution.
A second (but related) interpretation derives from considera-tion of capacity limits in mentalizing. When mentalizing demandsare low, it is possible that autistic participants will engagementalizing processes to a greater degree than neurotypicals inan attempt to compensate for their difficulties with the task.(Whether this compensatory activation actually improves perfor-mance is another matter). By contrast, for very highly demandingtasks that exceed capacity limitations, autistic participants may nolonger engage in mentalizing at all, leading to reduced BOLD signalcompared with neurotypicals. Thus it should not necessarily besurprising if abnormalities of the mentalizing system in autismreveal themselves as increased activation in some studies anddecreased activation in others.
A third possible explanation of our finding of enhancedmentalizing-related activation in ASD is that we studied adoles-cent participants, in contrast to the adult samples more prevalentin previous research. Studies of typically developing adolescentshave revealed increased MPFC activation compared with adultparticipants (Blakemore, 2008). If mentalizing development issubstantially delayed in autism (Happé, 1995), this delay may berecapitulated in neural response, leading to increases rather thandecreases in mentalizing-related brain activity during adolescence,or no difference (see Uddin, Supekar, & Menon, 2013, for a similarargument in relation to the effect of development on atypicalfunctional connectivity).
We are aware of the limitations of our study, in particular, thepower to detect modest effect sizes. However, large effects,sufficient to yield significant results, were obtained when compar-ing the ToMþ and ToM� groups on two measures of socialimpairment, as well as when comparing BOLD signal change ineach group against the NT group. This indicates that the mentaliz-ing battery used at T1 to separate the two groups of ASDparticipants was sufficiently reliable to yield significant differenceseven at T2. The absence of any significant BOLD signal differencesbetween ToMþ and ToM� groups cannot therefore be consideredinevitable given our sample size. Power analyses suggested thatthe power of our study, while far from ideal, was not negligible.Furthermore, a Bayesian analysis suggested positive evidence infavour of the null hypothesis when comparing BOLD signal in thetwo groups, rather than merely an inability to exclude it. Thus,we contend that the present null result is noteworthy, albeitpreliminary.
Our study cannot tell us what caused the better social adapta-tion of the ToMþ group. At this point we have no ROIs outside thestandard mentalizing network to guide the search for a physiolo-gical difference that might support improved social abilities. Whatled this group towards better compensatory learning will have tobe addressed by future research. We suggest that future studiesuse both implicit and explicit measures of mentalizing ability,using techniques such as eye gaze tracking. We also note thatlarger group sizes would allow more sensitive investigations ofbrain regions outside the mentalizing network. Furthermore,
alternative analytic techniques such as multivariate approaches(e.g. Gilbert et al., 2009) might shed light on individual differencesin mentalizing ability and the severity of core symptoms. Ouranalysis of functional connectivity did not yield any significantgroup effects, and recent studies have produced mixed results(Müller et al., 2011; Tyszka, Kennedy, Paul, & Adolphs, 2013).Nevertheless, this approach should also be considered.
We are cautiously optimistic that despite the observed hetero-geneity in autism, there is a similar neurocognitive impairmentthat underlies the core symptoms. Thus, mentalizing-relatedanomalies in brain function may map onto a consistent phenotypethat underlies impairments in reciprocal social communication.This lends credence to clinical intuition that a specific impairmentcan unite very heterogeneous cases, hitherto not captured bydiagnostic, behavioural or biological measures. If confirmed infuture studies, a neuro-cognitive phenotype associated with men-talizing impairment may be useful for elucidating the genetic andneurobiological mechanisms behind autism by uniting otherwiseseemingly heterogeneous cases.
Acknowledgements
SJG is supported by a Royal Society University Research Fellow-ship. SJW is supported by a British Academy Postdoctoral Fellowship.We are grateful to staff at BUCNI, and to the participants in this study.
References
Baird, G., Simonoff, E., Pickles, A., Chandler, S., Loucas, T., Meldrum, D., et al. (2006).Prevalence of disorders of the autism spectrum in a population cohort ofchildren in South Thames: The Special Needs and Autism Project (SNAP).Lancet, 368, 210–215.
Baron-Cohen, S. (1989). The autistic child0s theory of mind: A case of specificdevelopmental delay. Journal of Child Psychology and Psychiatry, 30, 285–297.
Baron-Cohen, S. (1995). Mindblindness: An essay on autism and theory of mind.Learning development and conceptual change. MIT Press.
Baron-Cohen, S., Leslie, A. M., & Frith, U. (1985). Does the autistic child have a“theory of mind”? Cognition, 21, 37–46.
Begeer, S., Bernstein, D. M., van Wijhe, J., Scheeren, A. M., & Koot, H. M. (2012).A continuous false belief task reveals egocentric biases in children andadolescents with autism spectrum disorders. Autism, 16, 357–366.
Blakemore, S.- J. (2008). The social brain in adolescence. Nature Reviews. Neu-roscience, 9, 267–277.
Bowler, D. M. (1992). “Theory of mind” in Asperger0s syndrome. Journal of ChildPsychology and Psychiatry, 33, 877–893.
Brüne, M., & Brüne-Cohrs, U. (2006). Theory of mind—Evolution, ontogeny, brainmechanisms and psychopathology. Neuroscience and Biobehavioral Reviews, 30,437–455.
Burnett, S., Bird, G., Moll, J., Frith, C., & Blakemore, S. -J. (2009). Development duringadolescence of the neural processing of social emotion. Journal of CognitiveNeuroscience, 21, 1736–1750.
Button, K. S., Ioannidis, J. P. A., Mokrysz, C., Nosek, B. A., Flint, J., Robinson, E. S. J.,et al. (2013). Power failure: Why small sample size undermines the reliability ofneuroscience. Nature Reviews Neuroscience, 14(365–76).
Castelli, F., Frith, C., Happé, F., & Frith, U. (2002). Autism, Asperger syndrome andbrain mechanisms for the attribution of mental states to animated shapes.Brain, 125, 1839–1849.
Dichter, G. S., Felder, J. N., & Bodfish, J. W. (2009). Autism is characterized by dorsalanterior cingulate hyperactivation during social target detection. Social Cogni-tive and Affective Neuroscience, 4, 215–226.
Dufour, N., Redcay, E., Young, L., Mavros, P. L., Moran, J. M., Triantafyllou, C., et al.(2013). Similar brain activation during false belief tasks in a large sample ofadults with and without autism. PLoS One, 8, e75468.
Faul, F., Erdfelder, E., Lang, A.-G., & Buchner, A. (2007). GnPower 3: A flexiblestatistical power analysis program for the social, behavioral, and biomedicalsciences.. Behavior Research Methods, 39, 175–191.
Fein, D., Barton, M., Eigsti, I. -M., Kelley, E., Naigles, L., Schultz, R. T., et al. (2013).Optimal outcome in individuals with a history of autism. Journal of ChildPsychology and Psychiatry, 54, 195–205.
Friston, K. J., Buechel, C., Fink, G. R., Morris, J., Rolls, E., & Dolan, R. J. (1997).Psychophysiological and modulatory interactions in neuroimaging. NeuroImage,6, 218–229.
Frith, C. D., & Frith, U. (2012). Mechanisms of social cognition. Annual Review ofPsychology, 63, 287–313.
S.J. White et al. / Neuropsychologia 56 (2014) 17–2524
Frith, U. (2004). Emanuel Miller lecture: Confusions and controversies aboutAsperger syndrome. Journal of Child Psychology and Psychiatry, and AlliedDisciplines, 45, 672–686.
Frith, U. (2012). Why we need cognitive explanations of autism. Quarterly Journal OfExperimental Psychology, 1–38.
Gilbert, S. J., Bird, G., Brindley, R., Frith, C. D., & Burgess, P. W. (2008). Atypicalrecruitment of medial prefrontal cortex in autism spectrum disorders: An fMRIstudy of two executive function tasks. Neuropsychologia, 46, 2281–2291.
Gilbert, S. J., Meuwese, J. D. I., Towgood, K. J., Frith, C. D., & Burgess, P. W. (2009).Abnormal functional specialization within medial prefrontal cortex in high-functioning autism: A multi-voxel similarity analysis. Brain, 132, 869–878.
Gotham, K., Pickles, A., & Lord, C. (2012). Trajectories of autism severity in childrenusing standardized ADOS scores. Pediatrics, 130, e1278–e1284.
Gotts, S. J., Simmons, W. K., Milbury, L. A., Wallace, G. L., Cox, R. W., & Martin, A.(2012). Fractionation of social brain circuits in autism spectrum disorders.Brain, 135, 2711–2725.
Happé, F. (1994). An advanced test of theory of mind: Understanding of storycharacters’ thoughts and feelings by able autistic, mentally handicapped, andnormal children and adults. Journal of Autism and Developmental Disorders, 24,129–154.
Happé, F. (1995). The role of age and verbal ability in the theory of mind taskperformance of subjects with autism. Child Development, 66, 843–855.
Happé, F., Ehlers, S., Fletcher, P., Frith, U., Johansson, M., Gillberg, C., et al. (1996).“Theory of mind” in the brain. Evidence from a PET scan study of Aspergersyndrome. Neuroreport, 8, 197–201.
Kamp-Becker, I., Ghahreman, M., Heinzel-Gutenbrunner, M., Peters, M.,Remschmidt, H., & Becker, K. (2013). Evaluation of the revised algorithm ofAutism Diagnostic Observation Schedule (ADOS) in the diagnostic investigationof high-functioning children and adolescents with autism spectrum disorders.Autism, 17, 87–102.
Kana, R. K., Libero, L. E., Hu, C. P., Deshpande, H. D., & Colburn, J. S. (2012).Functional brain networks and white matter underlying theory-of-mind inAutism. Social Cognitive and Affective Neuroscience
Kass, R. E., & Raftery, A. E. (1995). Bayes factors. Journal of the American StatisticalAssociation, 90, 773–795.
Kennedy, D. P., & Adolphs, R. (2012). The social brain in psychiatric and neurologicaldisorders. Trends in Cognitive Sciences, 16, 559–572.
Koster-Hale, J., Saxe, R., Dungan, J., & Young, L. L. (2013). Decoding moral judgmentsfrom neural representations of intentions. Proceedings of the National Academyof Sciences of the United States of America, 110, 5648–5653.
Kriegeskorte, N., Simmons, W. K., Bellgowan, P. S. F., & Baker, C. I. (2009). Circularanalysis in systems neuroscience: The dangers of double dipping. NatureNeuroscience, 12, 535–540.
Lieberman, M. D. (2007). Social cognitive neuroscience: A review of core processes.Annual Review of Psychology, 58, 259–289.
Lombardo, M. V., Chakrabarti, B., Bullmore, E. T., & Baron-Cohen, S. (2011).Specialization of right temporo-parietal junction for mentalizing and itsrelation to social impairments in autism. NeuroImage, 56, 1832–1838.
Lombardo, M. V., Chakrabarti, B., Bullmore, E. T., Sadek, S. A., Pasco, G., Wheel-wright, S. J., et al. (2010). Atypical neural self-representation in autism. Brain,133, 611–624.
Lord, C., Risi, S., Lambrecht, L. E. H. C., Jr., Leventhal, B. L., DiLavore, P. C., Pickles, A.,et al. (2000). The autism diagnostic observation schedule—generic: A standardmeasure of social and communication deficits associated with the spectrum ofautism. Journal of Autism and Developmental Disorders, 30, 205–223.
Lord, C., Rutter, M., & Le Couteur, A. (1994). Autism diagnostic interview-revised: Arevised version of a diagnostic interview for caregivers of individuals with
possible pervasive developmental disorders. Journal of Autism and Develop-mental Disorders, 24, 659–685.
Luckett, T., Powell, S. D., Messer, D. J., Thornton, M. E., & Schulz, J. (2002). Dochildren with autism who pass false belief tasks understand the mind as activeinterpreter? Journal of Autism and Developmental Disorders, 32, 127–140.
Marsh, L. E., & Hamilton, A. F. D. C. (2011). Dissociation of mirroring and mentalisingsystems in autism. NeuroImage, 56, 1511–1519.
Mason, R. A., Williams, D. L., Kana, R. K., Minshew, N., & Just, M. A. (2008). Theory ofMind disruption and recruitment of the right hemisphere during narrativecomprehension in autism. Neuropsychologia, 46, 269–280.
Mitchell, J. P. (2009). Social psychology as a natural kind. Trends in CognitiveSciences, 13, 246–251.
Moran, J. M., Young, L. L., Saxe, R., Lee, S. M., O’Young, D., Mavros, P. L., et al. (2011).Impaired theory of mind for moral judgment in high-functioning autism.Proceedings of the National Academy of Sciences of the United States of America,108, 2688–2692.
Müller, R.-A., Shih, P., Keehn, B., Deyoe, J. R., Leyden, K. M., & Shukla, D. K. (2011).Underconnected, but how? A survey of functional connectivity MRI studies inautism spectrum disorders. Cerebral Cortex, 21, 2233–2243.
Power, J. D., Barnes, K. A., Snyder, A. Z., Schlaggar, B. L., & Petersen, S. E. (2012).Spurious but systematic correlations in functional connectivity MRI networksarise from subject motion. NeuroImage, 59, 2142–2154.
Rouder, J. N., Speckman, P. L., Sun, D., Morey, R. D., & Iverson, G. (2009). Bayesian ttests for accepting and rejecting the null hypothesis. Psychonomic Bulletin &Review, 16, 225–237.
Senju, A., Southgate, V., White, S., & Frith, U. (2009). Mindblind eyes: An absence ofspontaneous theory of mind in Asperger syndrome. Science, 325, 883–885.
Silani, G., Bird, G., Brindley, R., Singer, T., Frith, C., & Frith, U. (2008). Levels ofemotional awareness and autism: An fMRI study. Social Neuroscience, 3, 97–112.
Skuse, D., Warrington, R., Bishop, D., Chowdhury, U., Lau, J., Mandy, W., et al. (2004).The developmental, dimensional and diagnostic interview (3di): A novelcomputerized assessment for autism spectrum disorders. Journal of the Amer-ican Academy of Child and Adolescent Psychiatry, 43, 548–558.
Spengler, S., Bird, G., & Brass, M. (2010). Hyperimitation of actions is related toreduced understanding of others’ minds in autism spectrum conditions.Biological Psychiatry, 68, 1148–1155.
Tyszka, J. M., Kennedy, D. P., Paul, L. K., & Adolphs, R. (2013). Largely typical patternsof resting-state functional connectivity in high-functioning adults with autism.Cerebral Cortex.
Uddin, L. Q., Supekar, K., & Menon, V. (2013). Reconceptualizing functional brainconnectivity in autism from a developmental perspective. Frontiers in HumanNeuroscience, 7, 458.
Van Overwalle, F. (2009). Social cognition and the brain: A meta-analysis. HumanBrain Mapping, 30, 829–858.
Wang, A. T., Lee, S. S., Sigman, M., & Dapretto, M. (2007). Reading affect in the faceand voice: Neural correlates of interpreting communicative intent in childrenand adolescents with autism spectrum disorders. Archives of General Psychiatry,64, 698–708.
Wellman, H. M., & Liu, D. (2004). Scaling of theory-of-mind tasks. Child Develop-ment, 75, 523–541.
White, S., Coniston, D., Rogers, R., & Frith, U. (2011). Developing the Frith-Happéanimations: A quick and objective test of Theory of Mind for adults withautism. Autism Research, 4, 149–154.
White, S., Hill, E., Happé, F., & Frith, U. (2009). Revisiting the strange stories:Revealing mentalizing impairments in autism. Child Development, 80, 1097–1117.
S.J. White et al. / Neuropsychologia 56 (2014) 17–25 25