auto insurance: the why & what
TRANSCRIPT
Auto Insurance
Table of Contents
1. The What and Why of Auto Insurance
A. What Is Auto Insurance
B. Who Needs Auto Insurance
C. An Example of Auto Insurance at Work D. Who Is Covered by an Auto Insurance Policy
E. What Is Covered by Auto Insurance
2. State Legislation Effecting the Operation of an Automobile
A. Financial Responsibility Laws
B. Compulsory Insurance Laws
C. Vicarious Liability Laws
D. Victim Compensation Laws
E. Assigned Risk Plans. No-fault Laws
F. State Requirements for Auto Insurance Coverage
3. Auto Insurance Coverage
A. Liability—Bodily Injury and Property Damage
1) Definition 2) Limits to Liability Coverage 3) Liability Exclusions 4) Determining the Amount of Liability Coverage Needed
B. Medical Payments
C. Personal Injury Protection (PIP)
D. Uninsured/Underinsured Motorist
E. Collision
1) Definition
2) Limits and Deductibles 3) Determining Need for Collision Coverage
F. Comprehensive
1) Definition 2) Limits and Deductibles 3) Exclusions
G. Car Rental Expense (optional)
H. Death, Dismemberment, Loss of Sight (optional)
I. Total Disability (optional)
J. Loss of Earnings (optional)
K. Towing and Labor (optional)
4. The Policy Itself
A. Declarations Page
B. Insuring Agreement
C. Conditions of the Policy
5. Rates and Premiums
A. Factors Affecting Rates of Auto Insurance
1) Age 2) Sex 3) Marital status 4) Residence 5) Occupation 6) Make and model of car 7) Use of vehicle 8) Driving record 9) Other drivers 10) Merit rating
B. Reducing Rates—Discounts
C. Avoiding Auto Theft and Insurance Fraud

Auto Insurance
Module Overview
This module introduces the topic of auto insurance and answers the following questions:
� What is auto insurance? � Who needs auto insurance? � Who is covered by auto insurance? � What is covered by auto insurance?
No matter what a person's age or circumstances, protection against financial loss is essential. Property and casualty insurance, such as homeowner’s and automobile insurance, is designed to protect against damages and injuries that result from automobile accidents and property losses due to fire and theft.
An insurance policy is a contract between the insured and the insurance company.
The insured pays a premium that is the price of the policy. In return, the insurance company agrees to pay the insured's losses resulting from events that the policy covers. Fire, burglary, or a car collision, are samples of what might be covered under a property and casualty policy such as homeowner’s insurance or automobile insurance.
Unfortunately, if a driver causes an accident and is judged to be at fault, it will not matter how much or little insurance coverage s/he has. If a judgment is levied against him for $100,000, for example, and his policy provides liability coverage of $25,000, he will still be required to pay the full amount of the judgment. People lose their homes, their savings accounts, and everything else because they are under-insured.
Automobile insurance is arguably the most important insurance that most Americans own. Because automobiles and automobile repairs have become increasingly expensive, auto insurance premiums have also risen sharply. As a result, auto insurance is not an inconsequential matter to anyone who owns or drives an automobile.
The What and Why of Auto Insurance
All automobile owners know that their vehicles are subject to damage. In addition the law imposes responsibility upon owners on behalf of the public. There is legal liability for damages for bodily injury or property damage caused to others.
A. What Is Auto Insurance
Auto insurance is protection that pays for:
� damage or injury the insured causes others while driving his car, and � damage to his car or injury to him or others in his car from an auto accident.
As stated above, an auto insurance policy is a contract between the policy holder and an insurance company. The policy holder pays a premium. In exchange for this, the insurance company promises to pay for specific car-related financial losses that s/he may have during the term of the agreement.
B. Who Needs Auto Insurance
Most every car owner needs auto insurance because it's generally a legal requirement. State laws typically say that a driver either must have insurance, or be able to provide evidence of having the financial resources to pay a judgment against himself, if he should cause injury or damage to another person. An insurance policy is the easiest way to document that damages can be paid.
Auto insurance also protects the driver financially. If s/he, or anyone for whom s/he’s responsible, seriously injures another person, s/he can be held liable for the injured person's medical expenses, rehabilitative therapy, and long term nursing care, as well as for lost earnings. For example, if a driver injures a medical student to such an extent that she is prevented from practicing medicine for the rest of her life, that driver could find himself the object of a judgment that could force him into personal bankruptcy. That’s why adequate insurance is essential to economic health.
In summary, buying auto insurance is either:
� Required. In many states, to drive—i.e., get license plates—a person must show proof of insurance. S/he must carry either 1) liability coverage (pays losses s/he causes others) or 2) no-fault coverage (pays the driver and any passengers for medical and related expenses caused by injuries, regardless of fault) or 3) both.
� An economic necessity. Even in states where coverage isn't required, drivers must, by law, be able to pay for losses they may cause others. Having insurance is the simplest way for most people to comply. Coverage for vehicle damage usually is necessary to finance a car. Without insurance, the car owner risks paying the full cost of any harm he causes others or of repairing or replacing his own car if it is stolen or damaged.
C. An Example of Auto Insurance at Work
The following case illustrates how essential auto insurance can be in the event of an accident.
Bob was late for an appointment and the lights were against him. As the last light on his route was turning from yellow to red, he decided to floor it and try to squeeze by. Unfortunately Bob did not make it safely through the intersection. He ran into a car traveling in the other direction. Both cars were damaged and both drivers had to be taken to the hospital. Bob suffered cuts, bruises, and a broken leg. The other driver, Ron, sustained back injuries.
What did Bob’s automobile insurance cover? Since both the police officer at the scene and witnesses determined that Bob was at fault, his insurance had to pay both his own and Ron’s expenses. These included:
� All costs to repair Ron’s vehicle � The cost to return Bob’ car to working condition, minus his Collision deductible. (Bob was lucky that the
damage did not exceed the blue book value of his car. Had his car been totaled, he would only have received a check for the car's value and he might have had to pay more out of his own pocket to purchase a new car.)
� Hospital bills incurred at the emergency room for services like giving Bob stitches and setting his broken leg.
� Fees associated with paying for Ron's lawsuit against Bob. The final award ($87,000) took into consideration the cost of Ron's hospital expenses, back injury treatments, his pain and suffering, and loss of work.
D. Who Is Covered by an Auto Insurance Policy
A policy usually covers the insured, his/her spouse, other relatives who live in their household, and others who have permission to drive one of their covered vehicles.
E. What Is Covered by Auto Insurance
At the very minimum, an auto insurance policy covers injuries or damages the driver causes to someone else. Most state laws require that the car owner carry a minimum amount of liability insurance, which pays for injuries or damages s/he cause to someone else.
Once the legal requirements have been met, here's what an auto policy can cover, above and beyond owner liability:
� The owner’s car: automobiles as listed on the policy, and any additional vehicles bought and registered with the insurer.
� Owner’s cars against collisions, owner’s car is covered against collisions it may have with any other object, no matter who caused the collision.
� Your cars against damage from almost anything else, vandalism, theft, broken glass, storms, and falling objects.
� Driver, passengers, and driver’s car against uninsured or underinsured motorists, if the insured is hit by someone who either doesn’t have insurance, or doesn’t have enough insurance to cover the accident, the loss is covered under the driver’s auto policy.
� Driver and his/her passengers for medical injury payments: reasonable medical (and funeral) expenses incurred as a result of injuries sustained in an accident.
Module Summary
At the completion of this module, the learner should be able to discuss the following topics:
What is auto insurance?
Who needs auto insurance?
Who is covered by auto insurance?
What is covered by auto insurance?
State Legislation Effecting the Operation of an Automobile
Module Overview
The laws and statutes of various states that affect either the operation or the insuring of an automobile fall into several categories. This module covers some of the most common state-specific regulations, specifically:
� Financial responsibility laws � Compulsory insurance laws � Vicarious liability laws � Victim compensation laws � Assigned risk plans � No-fault laws � State requirements for auto insurance coverage
A. Financial Responsibility Laws
These laws state that if the owner or operator of a vehicle fails to pay a judgment that arises from an accident, the registration or driver's license, or both, will be suspended. Persons found guilty of serious traffic violations and persons who failed to satisfy judgments within a certain period, must also demonstrate proof of financial responsibility for future accidents.
One such proof is insurance. Since the other forms of responsibility—a cash deposit or a surety bond—are not practical for most people, insurance becomes all that more important. Of course, insurance cannot be purchased for an accident that has already taken place. The guilty driver must pay damages, lawyer fees, and court costs, and then buy insurance for the future or lose the right to drive until he is able to do so.
B. Compulsory Insurance Laws
Although a number of states have compulsory insurance laws affecting common carriers, as does the Interstate Commerce Commission, very few states have laws affecting personal automobiles. When such laws exists, they generally require a showing of insurance in force with certain minimum coverages before registration is permitted and license plates are issued. Other forms of financial security may be used, such as a bond or cash deposit. There may be a provision in the law that states that if a car is operated without proof of financial security, the registration and driver's license will be revoked for a period of time, such as one year. It may also be a violation of law for an owner to knowingly permit someone else to operate his or her car without financial security.
C. Vicarious Liability Laws
These laws hold the owner of a car responsible for liability arising from the use of the vehicle by another person, so long as the person using it is driving with the permission of the owner. Of course, the person receiving permission from the owner can give further permission to a third person so that liability can be imposed on all three persons if there is an accident as a result of negligence.
D. Victim Compensation Laws
Hit-and-run drivers and drivers without assets or insurance may cause bodily injury and property damage for which the injured party is unable to recover. Also, some victims of crimes suffer financially without being compensated. In some states, victims of crime are being compensated through funds financed from fines and other assessments. Those suffering injuries from drivers and traffic mishaps are also being compensated through fees collected from drivers and assessments from insurance companies. The idea of compensating victims of crime and other mishaps not of their own doing is relatively new, but it promises to increase in importance as time goes by.
E. Assigned Risk Plans
When the law requires that automobile insurance be owned, insurance must be made available to people who would otherwise not qualify for it. A person who has been unable to buy insurance is usually eligible for insurance through an assigned risk plan, although some people are still unable to qualify due to certain physical disabilities, previous offenses, or false statements. Assigned risk plans are in effect in all states.
Assigned risks are distributed among all companies that write insurance in the state, with each company having a quota proportionate to its premium income from automobile risks. A company is not required to provide a type of risk it does not write in the usual course of business. For example, if the company does not ordinarily accept publicly owned vehicles, it does not have to accept them under the assigned risk plan. However, it must make up its quota on types of business it does write. Risks usually have to be carried for three years, unless cancelled for cause. Agents receive reduced commissions on assigned risk business.
F. No-fault Laws

No-fault laws enable the insured to recover financial losses from their own insurance company regardless of who is at fault in the accident. The theory behind no-fault legislation is that by preventing legal actions for negligence, unless and until damages mount at least to a significant amount, costly lawsuits can be curtailed and more insurance benefits will be paid to injured people instead of to lawyers and courts. It is also believed that such a system keeps insurance premiums in check, since it eliminates much of the legal cost associated with proving blame.
In no-fault states, each driver’s own insurance company covers his/her losses. Whoever was at fault must pay for the damages or losses incurred in the accident. But even in no-fault states, a driver may go to court to sue for pain-and-suffering damages, and in such a situation, fault must be proven.
There are several no-fault states, but in them, a wide variety in the accompanying laws concerning the right to sue and compulsory liability. It is beyond the scope of this module to differentiate the states' provisions. But be aware that some states have different versions of no- fault coverage.
If your state has enacted a no-fault policy, it will override any discussion in this module pertaining to those damages covered by it. Consequently it is of the utmost importance that you find out what, if any, no-fault law is in effect in your state.
G. State Requirements for Auto Insurance Coverage
As discussed in subsection 1 above on Financial Responsibility Laws, most states now require proof of financial responsibility (insurance) if a driver is involved in an accident, ticketed, or renewing a license. Most states also require owners of automobiles to carry a minimum amount of bodily injury and property damage liability insurance. (The insurance industry recommends that bodily injury liability limits be $100,000 per person and $300,000 per occurrence.)
In the third column of the table below, the first two figures refer to bodily injury liability limits and the third figure
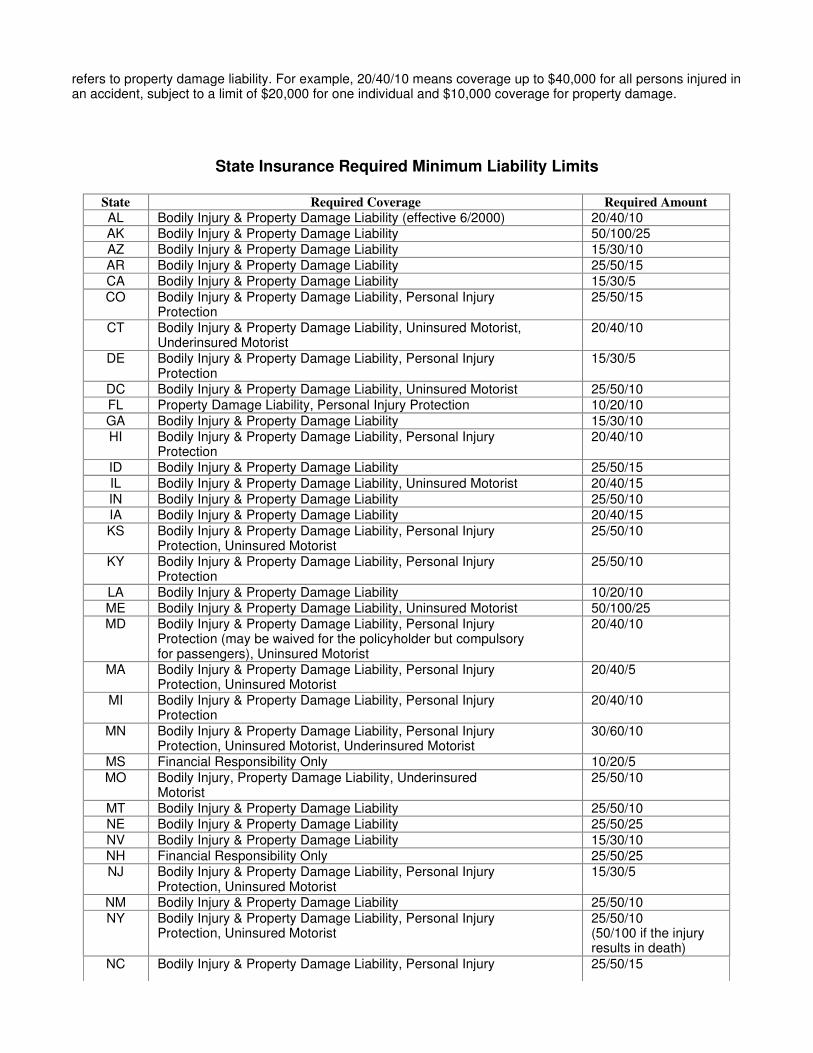
refers to property damage liability. For example, 20/40/10 means coverage up to $40,000 for all persons injured in an accident, subject to a limit of $20,000 for one individual and $10,000 coverage for property damage.
State Insurance Required Minimum Liability Limits
State Required Coverage Required Amount AL Bodily Injury & Property Damage Liability (effective 6/2000) 20/40/10 AK Bodily Injury & Property Damage Liability 50/100/25 AZ Bodily Injury & Property Damage Liability 15/30/10 AR Bodily Injury & Property Damage Liability 25/50/15 CA Bodily Injury & Property Damage Liability 15/30/5 CO Bodily Injury & Property Damage Liability, Personal Injury
Protection 25/50/15
CT Bodily Injury & Property Damage Liability, Uninsured Motorist, Underinsured Motorist
20/40/10
DE Bodily Injury & Property Damage Liability, Personal Injury Protection
15/30/5
DC Bodily Injury & Property Damage Liability, Uninsured Motorist 25/50/10 FL Property Damage Liability, Personal Injury Protection 10/20/10 GA Bodily Injury & Property Damage Liability 15/30/10 HI Bodily Injury & Property Damage Liability, Personal Injury
Protection 20/40/10
ID Bodily Injury & Property Damage Liability 25/50/15 IL Bodily Injury & Property Damage Liability, Uninsured Motorist 20/40/15 IN Bodily Injury & Property Damage Liability 25/50/10 IA Bodily Injury & Property Damage Liability 20/40/15 KS Bodily Injury & Property Damage Liability, Personal Injury
Protection, Uninsured Motorist 25/50/10
KY Bodily Injury & Property Damage Liability, Personal Injury Protection
25/50/10
LA Bodily Injury & Property Damage Liability 10/20/10 ME Bodily Injury & Property Damage Liability, Uninsured Motorist 50/100/25 MD Bodily Injury & Property Damage Liability, Personal Injury
Protection (may be waived for the policyholder but compulsory for passengers), Uninsured Motorist
20/40/10
MA Bodily Injury & Property Damage Liability, Personal Injury Protection, Uninsured Motorist
20/40/5
MI Bodily Injury & Property Damage Liability, Personal Injury Protection
20/40/10
MN Bodily Injury & Property Damage Liability, Personal Injury Protection, Uninsured Motorist, Underinsured Motorist
30/60/10
MS Financial Responsibility Only 10/20/5 MO Bodily Injury, Property Damage Liability, Underinsured
Motorist 25/50/10
MT Bodily Injury & Property Damage Liability 25/50/10 NE Bodily Injury & Property Damage Liability 25/50/25 NV Bodily Injury & Property Damage Liability 15/30/10 NH Financial Responsibility Only 25/50/25 NJ Bodily Injury & Property Damage Liability, Personal Injury
Protection, Uninsured Motorist 15/30/5
NM Bodily Injury & Property Damage Liability 25/50/10 NY Bodily Injury & Property Damage Liability, Personal Injury
Protection, Uninsured Motorist 25/50/10 (50/100 if the injury results in death)
NC Bodily Injury & Property Damage Liability, Personal Injury 25/50/15
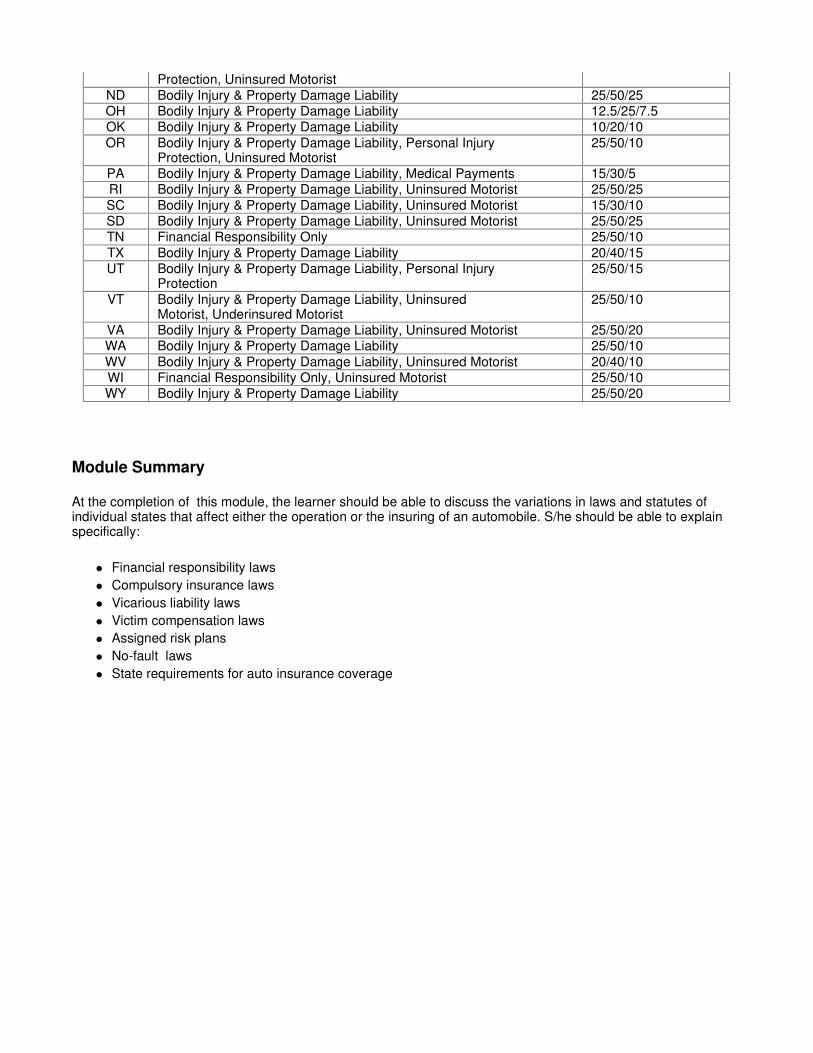
Module Summary
At the completion of this module, the learner should be able to discuss the variations in laws and statutes of individual states that affect either the operation or the insuring of an automobile. S/he should be able to explain specifically:
� Financial responsibility laws � Compulsory insurance laws � Vicarious liability laws � Victim compensation laws � Assigned risk plans � No-fault laws � State requirements for auto insurance coverage
Protection, Uninsured Motorist ND Bodily Injury & Property Damage Liability 25/50/25 OH Bodily Injury & Property Damage Liability 12.5/25/7.5 OK Bodily Injury & Property Damage Liability 10/20/10 OR Bodily Injury & Property Damage Liability, Personal Injury
Protection, Uninsured Motorist 25/50/10
PA Bodily Injury & Property Damage Liability, Medical Payments 15/30/5 RI Bodily Injury & Property Damage Liability, Uninsured Motorist 25/50/25 SC Bodily Injury & Property Damage Liability, Uninsured Motorist 15/30/10 SD Bodily Injury & Property Damage Liability, Uninsured Motorist 25/50/25 TN Financial Responsibility Only 25/50/10 TX Bodily Injury & Property Damage Liability 20/40/15 UT Bodily Injury & Property Damage Liability, Personal Injury
Protection 25/50/15
VT Bodily Injury & Property Damage Liability, Uninsured Motorist, Underinsured Motorist
25/50/10
VA Bodily Injury & Property Damage Liability, Uninsured Motorist 25/50/20 WA Bodily Injury & Property Damage Liability 25/50/10 WV Bodily Injury & Property Damage Liability, Uninsured Motorist 20/40/10 WI Financial Responsibility Only, Uninsured Motorist 25/50/10 WY Bodily Injury & Property Damage Liability 25/50/20

Auto Insurance Coverage
The basic automobile insurance policy applicable to individuals and their families is called the Personal Automobile Policy (PAP). The older title for this coverage was Family Automobile Policy (FAP). This module discusses the basic coverages under PAP, which are grouped into three general categories:
� liability insurance � personal insurance � property insurance.
The section on each of these basic coverages provides the definition of the coverage and the common limits and/or exclusions to that coverage.
A. Liability—Bodily Injury and Property Damage
Liability coverage is probably the most crucial part of any auto insurance policy. It covers the injuries or deaths of other people and damage to their property when the insured is deemed responsible for the loss. It also protects the policyholder’s assets, because without liability protection, he would be forced to liquidate assets in order to pay the costs of a judgment.
1) Definition
Liability coverage, according to its legal definition, provides the following benefits:
� The insurance company pays damages for which the insured becomes legally obligated because negligent acts or omissions resulted in bodily injury and/or property damage to a third party.
� The insurance company defends the insured against liability suits for damages caused to the third party, paying various expenses in this connection.
� Vehicles covered include the insured’s own cars, a newly acquired car, and a temporary substitute car.
In other words, liability coverage protects the insured from damage his car does to others, damage for which he is legally liable. It covers losses incurred by pedestrians, passengers, and other drivers due to the negligence of the
policy owner or those covered under his policy. If there is an accident in which someone is injured or worse, killed, it covers:
� The insured and family members or relatives who live with the insured when they are (1) driving his car or (2) driving someone else’s car with that vehicle owner's permission.
� Other people driving the insured's car with permission.
It also pays those covered by the policy for expenses that result from investigating the accident and settling the claim, including:
� Legal defense costs � Cost of bail bonds � Emergency first-aid to others
It pays other people whom the insured has injured for:
� Property damage (to the other car, of course, but also to fences, buildings, landscaping, gasoline pumps, etc.)
� Loss of services � Bodily injury � Sickness � Medical services � Diseases � Loss of income � Death
2) Limits to Liability Coverage
There are policy limits on liability coverage that place a ceiling on the amount the insurance company is required to pay. (These limits help keep insurance rates affordable.) These limits are listed on the Policy Declarations of the insurance contract, which specify:
� Policy limits chosen � Vehicle being insured � Endorsements, amendments to the base contract, as well as � Certain other information you declare specify as factual on the insurance application
There are two types of liability policies: single-limit policies and split-limit policies. A single-limit policy, the more flexible of the two, simply specifies the maximum amount that the insurance company will pay, in any combination of personal injury and property damage settlements.
A split-limit policy sets specific ceilings on each segment of coverage. For example, split-limit policy limits of 100/300/100 (figures are in thousands of dollars) mean the following:
� The first number is the limit (in this case $100,000) paid per person for bodily injury, including medical bills, loss of earnings, death, and pain- and-suffering awards.
� The second figure is the total paid per accident for bodily injury to two or more persons ($300,000 here). � The third number is the limit paid for property damage ($100,000 total in this scenario).
As discussed in some detail above, many states set minimum auto insurance limits that must be purchased, but in general these limits are unrealistically low, given the current cost of cars and health care. In every state a person can choose higher levels to meet unique situations and needs.

3) Liability Exclusions
Some common liability exclusions are:
� Intentionally inflicted bodily injury or property damage. (It would be bad public policy to allow persons who deliberately cause damage to be protected.)
� Property owned by the insured, rented by the insured, or in the care and custody of the insured, primarily because it ought to be covered elsewhere.
� Business usage of the automobile, including renting the vehicle out for hire or letting it be used by employees for business reasons.
� Bodily injury or property damage which is also covered under a contract of nuclear energy liability insurance issued by the Nuclear Energy Liability Insurance Association or by the Mutual Atomic Energy Liability Underwriters.
� Bodily injuries or property damage arising out of the operation of farm machinery. � Bodily injury to any employee of the insured while working, if benefits are payable by Workers'
Compensation. � Coverage for persons who use the insured’s vehicle without the belief that they were authorized to do so.
In summary, then, the liability portion of the policy is designed to protect the insured against any claims against him for damages either to another person or to their property.
4) Determining the Amount of Liability Coverage Needed
There several considerations to be taken into account when determining the amount of liability coverage needed:
� Protecting one's own assets means buying enough insurance to cover the highest judgments that might be assessed. The wealthier a person is, the more liability coverage is needed. The person who owns substantial property or assets as much more likely to be sued than is a person who has nothing.
� Protecting the injured is not only a legal requirement in some states, but is certainly a social and ethical obligation. When a driver causes injury to another person, he has an obligation to pay for it. That requires an adequate amount of insurance even if the policy owner does not have assets to protect.
B. Medical Payments
Medical payments insurance is coverage that reimburses the insured and her passengers (whether or not they're members of her family) for medical or funeral expenses stemming from an accident, regardless of who was responsible for the accident. Generally this coverage applies to anyone driving the policyholder’s car with permission.
Expenses covered are:
� x-rays � surgery � ambulance � physicians � hospital � funeral expenses
The car does not have to be in motion for this coverage to apply. for example, if a person stumbles and breaks an ankle while getting into the vehicle, this coverage would pay those doctor bills, up to the limits of the policy. Some policies double the amount of coverage available if seat belts were worn at the time of the injury.
Some medical policies will not pay if the policyholder's regular health insurance will cover the cost of medical

treatment. They will, however, fill in the gaps left by any deductibles and co-insurances that apply. If the injured person is on Medicare due to age or disability, Medicare will require the auto insurance to cover the bills. In no-fault states, medical payments are typically a part of the basic auto insurance policy.
C. Personal Injury Protection (PIP)
In no-fault states, personal injury protection is required by law; in other states, it's offered as optional coverage. PIP pays for the medical expenses and other basic expenses of the driver and all passengers that occur as a result of an accident in a covered vehicle. Covered expenses include:
� His/her own medical bills up to a specified limit � Part of lost wages � Funeral expenses � In some states, replacement services, such as housecleaning when the wife is injured, for instance.
D. Uninsured/Underinsured Motorist
Uninsured motorist coverage, required by law in many states, pays for injuries sustained by the insured and his/her passengers and for damage to his/her property, which is caused by an uninsured motorist or a hit-and-run driver.
Underinsured motorist coverage pays when the insured or his/her passengers are injured as a result of negligence by someone with insufficient liability insurance to cover the injury s/he has inflicted. The definition of an underinsured motorist varies from state to state.
This coverage generally handles:
� damages for bodily injury � property damage, when the insured would have been entitled to receive this from the other driver, had s/he
been insured � hit-and-run damage.
Many states allow the insurance buyer to purchase as much insurance to protect against uninsured and underinsured persons as s/he deems necessary.
E. Collision
1) Definition
Collision insurance is automobile insurance coverage that reimburses the insured for damage to his/her own car, when the damage results from overturning his/her car or from colliding with another object. The other object doesn't have to be a car—a run-in with a tree or a brick wall would be covered under the collision provision of a policy. If the driver skids on an icy road, and the car rolls, overturns, and lands in a ditch, repairs to the vehicle are paid for under collision coverage.
Collision insurance is a type of physical damage coverage and also a first-party coverage, because it pays the policy owner. If the driver has injured someone else or damaged their property, third-party coverage pays for their losses. Liability insurance is called third party coverage, because it pays for losses sustained by third parties— i.e., other people. (The second party is the driver’s insurance company.)
Collision coverage pays for repair of the damaged vehicle, up to the actual cash value of the car. Actual cash value takes into account vehicle depreciation: age, use, and wear and tear.
Collision coverage pays for damage to the insured’s car regardless of who is at-fault in the accident. This means
s/he won't have to wait for the other driver to pay for damage to her car before s/he gets it fixed. If the other person were at fault, his/her insurance company will try to recover what it paid him/her from the other person’s insurance company.
2) Limits and Deductibles
The limits of collision coverage are determined by the actual cash value (ACV) of the vehicle covered, with no stated amount of insurance. As with comprehensive coverage, the deductible is specified in the insurance contract.
3) Determining Need for Collision Coverage
When a loan is taken out to purchase an automobile, the lending institution typically requires that collision insurance be carried. The lender wants to be sure that they will receive their money in the event that the car's total. The insurance money would be needed, in that case to repay the loan. Most people want to insure new cars for collision, because it would be a major loss if the vehicle were destroyed.
Collision insurance usually covers the fair market value of the vehicle, determined by the book value, minus the cost of making repairs, minus a charge for unusually high mileage. As a result, many professionals do not recommend carrying collision insurance on old cars. The cost of the insurance often does not warrant it because the vehicle is worth so little.
F. Comprehensive
1) Definition
Comprehensive insurance reimburses the insured for damage to his/her own car from causes other than collision. The comprehensive portion of the policy pays for loss due to perils like the following:
� hail � flood � theft � fire � glass breakage � falling objects � missiles � explosions � earthquakes � windstorms � vandalism or malicious mischief � riot or civil commotion � collision with a bird or an animal
In other words, the comprehensive portion of the policy covers just about everything except for collision and normal wear and tear.
Comprehensive insurance is a physical damage coverage and also a first- party coverage, which means that it pays the policy owner. If the insured has injured someone else or damaged their property, third-party coverage pays for their losses. (The second party is the driver’s insurance company.)
2) Limits and Deductibles

The contract for comprehensive coverage can be written on an actual cash value (ACV) basis of the vehicles insured, or it can specify the limits of the comprehensive coverage, the maximum amount the insurance company must pay.
The policy also specifies the amount of the deductible, the amount the insured has agreed to pay before the insurance company reimburses him/her for damage expenses. The higher the deductible, the lower the policy premium or cost. Deductibles serve to keep insurance rates reasonable and to reduce minor claims, which, if filed, would drive up the general cost of insurance.
3) Exclusions
Comprehensive coverage can have important exclusions or limitations. For example, damage to or theft of a special audio system installed in the car, may not be covered. If it is covered, the policy should state whether it pays for the actual cash value of damaged or stolen property (its current value after depreciation has been subtracted) or the replacement value (the full amount required to replace it today.)
G. Car Rental Expense (optional)
If the insured's car cannot be driven because of damage incurred in an auto accident, the insurance company pays for a car rental up to a daily limit.
H. Death, Dismemberment, Loss of Sight (optional)
If an automobile accident kills the insured or causes him to lose a limb or his eyesight, the insurance company pays either the insured or the beneficiary the specified benefit.
I. Total Disability (optional)
If the insured is injured in a car accident, while occupying a car or being struck by a motor vehicle, the company pays the insured a monthly disability income benefit.
J. Loss of Earnings (optional)
If the insured is injured in an auto accident, while either occupying a car or being struck by a motor vehicle, and cannot work, the insurance company pays the insured a percentage of his loss of monthly earnings.
K. Towing and Labor (optional)
Premium cost for this coverage is generally low, but coverage may be duplicated if the insured is a member of an auto club.
Module Summary

At the completion of this module, the learner should be able to explain the basic coverages provided under PAP:
� liability insurance � personal insurance � property insurance.

The Policy Itself and Auto Safety
Module Overview
This module discusses, in brief, the structure of the typical auto insurance policy, which is generally broken down into three standard parts:
� the declarations page � the insuring agreement � the conditions of the policy.
It also discusses in some depth the latest statistics and information on automobile safety.
A. Declarations Page
The declarations page provides a general overview of the auto policy. It states the name of the policy owner, the policy number, the people and vehicles covered by the policy, the time period of coverage, and the premium amount. A description of the coverage is provided along with the dollar limits for each.
The insurer should, however, review the entire policy in order to fully understand what specific rules, limitations, and exemptions apply to his/her coverage.
B. Insuring Agreement
The insuring agreement is the main part of the policy. Terms (definitions) are stated, benefits are listed, and who is covered under the policy described in more detail. Exclusions, i.e., provisions in the policy that deny coverage for specified perils, persons, properties, or locations, will also be listed.
C. Conditions of the Policy
The third part of an auto policy, the conditions of the policy, describes the policy owner’s responsibilities when a claim occurs: how much time is allowed to report the claim and the types of proof of loss that will be required by the insurance company. This portion of the contract will also generally list the conditions under which the policy may be canceled. The policyholder can cancel coverage at any time, but the insure company must follow specific procedures for canceling. Non-payment of premium is an obvious reason for which the insurance company may cancel the policy. They may also generally cancel the policy if the policyholder deliberately concealed or misrepresented any facts when applying for the coverage. If this were the case, the company could refuse to pay any losses that occurred.
D. Factors Affecting Auto Safety
1) Latest Facts
According to preliminary figures from the U.S. Department of Transportation (DOT), 41,345 Americans were killed in motor vehicle crashes in 1999, down 0.3 percent from 41,471 in 1998; and the fatality rate per 100 million miles traveled fell to 1.5 percent, the lowest on record.
DOT says that in 1999, deaths due to speeding rose to 12,672 from 12,477 a year earlier.
� In Texas, an appeals court unanimously upheld a lower court's ruling that allowed insurers to continue using generic crash parts, as long as those parts met standards for "like kind and quality".
� Motor vehicle crashes are the leading cause of death for young people from age 5 to 29. � One person dies in a traffic crash every 13 minutes. About 114 people die in crashes every day. � Since the first crash death in 1899, 30 million people worldwide have died in traffic crashes. � According to the U.S. Department of Transportation, 41,471 Americans were killed in motor vehicle
crashes in 1998, down 1.3 percent from 42,103 in 1997. The crash death rate—the number of people killed per 100 million vehicle miles traveled—held steady at 1.6.
Crash fatalities have dropped in response to a number of factors. Motor vehicles are becoming safer because of design improvements; airbags and increased use of seat belts are also providing greater crash protection; the driving population is more mature; and states have enacted laws to restrict young drivers, screen elderly drivers, and deter drunk driving. Drivers themselves have also contributed to the reduction in fatalities by increasingly buying vehicles with good safety ratings.
Insurers have long been a major force behind the trend toward safer driving. In the 1980s, they fought for air bags to be required equipment in all vehicles. They established and fund an organization dedicated to auto safety. And they have been major supporters of anti-drunk driving and seat belt usage campaigns.
2) Current Developments
Fatalities
Motor vehicle crash deaths were at an all-time low in 1999. According to preliminary results from the U.S Department of Transportation's Fatal Analysis Reporting System (FARS), 41,345 people died in motor vehicle crashes in 1999, down 0.3 percent from 41,471 in 1998. The fatality rate—measured as deaths per 100 million vehicle miles traveled—fell to 1.5 in 1999, also the lowest on record.
Speed Limits
States were allowed to determine their own speed limits as set out in the 1995 national highway bill. The Insurance Institute for Highway Safety (IIHS) reported in 1999 that the higher speed limits enacted in 24 states from late 1995 through 1996 resulted in an estimated increase in highway deaths of about 15 percent from the

same months in the six years before the speed limits were changed. At the same time, highway deaths did not rise on the roads where the speed limits were not raised, confirming the findings of an earlier IIHS study and a 1998 National Highway Traffic Safety Administration (NHTSA) study. Despite statistics that indicate that higher speeds kill more motorists, by the end of 1998, every state in the Union except for Hawaii had raised its highway speed limits.
NHTSA says speeding was a contributing factor in 30 percent of all fatal crashes in 1998, when 12,477 lives were lost in speed-related crashes. In 1999, lives lost due to speeding rose to 12,672. The odds of dying or being seriously injured in a crash double for every 10 mph a driver speeds over 50 mph, and the ability of seat belts, air bags and child safety seats to protect occupants in a crash diminishes as speed increases.
Attitudes Towards At-Risk Drivers
The Insurance Research Council (IRC) found in a 1999 poll that Americans of all age groups are concerned about driving safety and are in favor of safety measures even when their driving privileges may be affected. Eighty-seven percent of all respondents and 82 percent of people 18 to 24 years old favor enactment of zero-tolerance laws that call for license suspension for under-age drivers when found driving with any measurable amount of alcohol in their blood. A majority of all respondents and 18 - 24 year olds favor implementing graduated drivers licenses (see below), provisional licenses for under-18-year old drivers, including requirements to remain alcohol- and violation-free for a specified period, and restrictions on night driving for drivers under 18.
With regard to older drivers, 89 percent of all respondents and 77 percent of those age 65 and over favor requiring annual vision tests for drivers age 70. The majority of all respondents and those over age 65 favor annual road tests, additional training programs for older drivers, more left-turn signals, installing larger, easier-to-read street signs and requiring annual physical exams for older drivers.
Young Drivers
According to the DOT, young drivers, between 15 and 20 years old accounted for 6.9 percent of all licensed drivers in 1997, (latest data available) but for 14 percent of all drivers in fatal crashes in 1997, and for 16 percent of all drivers in police-reported crashes. The fatality rate for teenage drivers, age 16 to 19, based on estimated annual travel, is about 4 times as high as the rate for drivers 25 to 69 years old. (However, the fatality rate for drivers in the oldest group, 70 years old and older, is 9 times as high.)

States are increasingly adopting graduated driver licenses (GDLs) for young drivers. These laws allow young drivers to improve their skills and driving habits, and restricts night-time driving, when most teenage drivers' accidents occur. Drivers first receive a learner's permit with a minimum holding period. Any alcohol-related or traffic offense results in revocation, and seat belts must be worn, among other provisions. The next stage is a provisional or intermediate license, with the same general restrictions. A standard drivers' license is issued after a specific period of driving with no major offenses and after a road test is passed.
According to the Insurance Institute for Highway Safety, 26 states have three-stage graduated licensing systems. These states are: California, Colorado, Delaware, Florida, Georgia, Illinois, Indiana, Iowa, Louisiana, Maryland, Massachusetts, Michigan, Missouri, New Hampshire, New Jersey, New Mexico, North Carolina, Ohio, Oregon, Pennsylvania, Rhode Island, South Carolina, South Dakota, West Virginia, Wisconsin, and effective July 1, 2001, Washington. A handful of other states have enacted some components of graduated licensing, and legislation is pending in Idaho, Maryland and Tennessee.
Graduated driver's licenses have been implemented by 30 states. GDL programs require young drivers to gain driving experience gradually over time. The GDL laws allow young drivers to improve their driving skills and restrict nighttime driving, when most teenage driving accidents occur.
A driver's license in a typical GDL program can be obtained by the following steps:
� Learner's permit with a minimum holding period. Any alcohol related or traffic offense results in revocation, and seat belts must be worn.
� Provisional or intermediate license. The restrictions are generally the same as the learner's permit. � Standard driver's license. This is usually issued after a specific period of driving with no major offenses and
after a road test is passed.
Although no state has enacted all of the recommended components, Florida's law is considered the standard because it includes a six-month holding period for a learner's permit and night restrictions from 11 p.m. to 6 a.m. for 16-year-olds and 1 a.m. to 5 a.m. for 17-year-olds. These new restrictions may seem unfair to young drivers but there is a good reason for them. In fact, Florida's GDL law is credited with a 26 percent reduction in night crashes among 16-year-old drivers and a reduction of about 30 percent for 17-year-old drivers.
Other state measures aiding in the reduction of teenage driving accidents are changes to the legal blood alcohol content.
According to National Highway Traffic Safety Administration (NHTSA), all 50 states and the District of Columbia have set lower Blood Alcohol Content (BAC) levels for drivers under 21. In fact, all 50 states have also passed zero tolerance laws prohibiting teenagers from drinking and driving. Zero tolerance laws make it illegal for people under 21 to drive with any amount of alcohol in their system, defined as a BAC of .02 or less. The normal BAC level for adults is 0.08.

Several studies show conclusively that zero tolerance laws save lives. For example, Maryland's zero tolerance law produced an 11 percent decrease in the number of crashes involving drinking drivers under age 21. In four other states, the number of late night fatal crashes of young drivers dropped 34 percent after zero tolerance laws.
Nationwide, alcohol-related deaths among teens age 15 to 20 dropped five percent from 2,324 in 1996 to 2,209 in 1997. These decreases are a direct result of the new laws.
Older Drivers
The DOT says that "older drivers" (age 70 and older) have higher rates of fatal crashes than any other group except young drivers. In 1997, 17.7 million or 10 percent of all licensed drivers were over the age of 70. The number of over-70 drivers has grown 45 percent in a decade, while the total number of drivers rose only 13 percent. People over the age of 70 made up 14 percent of all traffic fatalities, 13 percent of all vehicle occupant fatalities, and 18 percent of all pedestrian fatalities. Most fatalities involving older drivers occur during the daytime—82 percent in 1998—and 72 percent happen on weekdays. Older-driver deaths are generally not associated with drinking—they have the lowest rates of intoxication of all adults in fatal crashes.
Most states issue older drivers restricted licenses so that they can retain their mobility and independence. Depending in their ability, older drivers may be limited to driving during daylight hours, or on non-freeway types of roads. Of note, in most states restrictions such as these can be placed on anyone's drivers license, regardless of age, if their medical condition warrants it. Most states (41) require drivers to take a vision test when they renew their license, regardless of age. These tests have been found to be an effective way to lower older drivers' crash risk.
About half of the states require a road test at renewal for any driver who has had a certain number of accidents or traffic infractions, and a smaller number require written tests and medical exams if necessary. At least 14 states mandate more frequent testing for older drivers than for younger drivers at license renewal. For instance, in Illinois, drivers over age 75 must take a road test when they renew their license; in Indiana, road and written tests are required, in addition to vision testing.
Ten states require doctors to report any dangerous medical conditions that can impair a patient’s driving. Although this requirement covers drivers of all ages and a variety of medical conditions, at least one state, California, specifically requires doctors to report a diagnosis of dementia, which is a common symptom of Alzheimer's disease. The urgency of this restriction is highlighted by a recent study of accidents in Sweden and Finland, which found that one third of drivers age 65 to 90 who were killed in crashes had brain lesions commonly found in Alzheimer's patients, and another 20 percent had lesions which may indicate an early form of Alzheimer's disease. In addition to California's law requiring doctors to report dementia, Missouri law provides confidentiality to close family members or doctors who report incompetent drivers to the state agency that licenses drivers.
Aggressive Driving

Aggressive driving, also called “road rage”, covers a range of driving behaviors such as tailgating, speeding, and weaving in and out of traffic, at its mildest. It can also include horn blowing, using obscene gestures, high speed duels and at its worst, gunplay. Observers note that such behaviors were identified as early as 1915 and some say that they are not increasing. NHTSA says that the deaths of nearly 28,000 of the 41,907 people killed in highway crashes in 1996 were associated with road rage. In 1997, NHTSA's administrator blamed road rage on increased congestion on the roads leading to driver frustration. The AAA Foundation for Traffic Safety says that there were over 10,000 aggressive driving incidents (where an angry motorist intentionally injured or killed another motorist or pedestrian in response to a grievance) from 1990 through mid-1996.
In addition to hearings in the House on the federal level, 17 states have considered road rage legislation, according to the National Conference of State Legislators. In 1998, Arizona became the first state to enact a law making aggressive driving a crime. Arizona defines aggressive driving as speeding plus committing two other infractions such as tailgating, failure to yield or erratic lane changes, and being an immediate hazard to another driver punishable by a 30-day license suspension. About 17 states have formed highway patrol groups to combat aggressive driving.
DRUNK DRIVING AND LIQUOR LIABILITY
In 1999, 15,794 people who had some measure of alcohol in their blood (at or below the legal limit) were killed in motor vehicle crashes. Alcohol was present in the blood of 38.4 percent of people who died in crashes in 1998, the lowest level since record keeping began in 1975.
The campaign to deter drunk driving is moving on two fronts. On the federal level, President Clinton signed a bill re-authorizing highway funding that includes incentives for states to lower the blood alcohol level defining drunk driving to 0.08 from 0.10. In the states, legislation is being passed to lower the legal blood alcohol level and to strengthen penalties for drunk driving.
Key Facts
� Alcohol continues to be a major factor in traffic accidents. There is an alcohol-related traffic fatality every 33 minutes. If drunk driving is not significantly reduced, 3 out of every 10 Americans will be involved in an alcohol-related crash during their lifetimes.
� Forty-two states and the District of Columbia have laws that hold liquor servers liable for the damage a drunk driver causes. Forty-three states have liquor liability laws that help curb drunk driving by making sellers and servers of alcohol more careful about how they serve drinks.
� Anti-drunk driving campaigns especially target under-age drivers, alcoholics, and 21 to 34 year olds, who are responsible for more alcohol-related fatal crashes than any other age group. Further, they are the most resistant to changing impaired driving behavior, according to the National Highway Traffic Safety Administration.
� Preliminary data from the U.S. Department of Transportation show that 15,794 people died in alcohol-related crashes in 1999, down 0.9 percent from 15,934 drunk driving fatalities in 1998, and that alcohol was a causal factor in 38 percent of all crashes last year.
� In Oregon, the state Supreme Court has ruled that a person, who drinks with a driver who later has an accident and injures that person, may sue both the driver and the establishments that provided the liquor. This ruling negates state case law that held those who drink to excess are responsible for their own behavior and the injuries that may result from it.
Drunk Driving
Alcohol-related crashes are those where the people involved, either a driver or a non-occupant, such as a pedestrian, had some measure of alcohol in their blood, both below and at the level which defines intoxication. According to preliminary estimates from the U.S. Department of Transportation (DOT), 15,794 people died in alcohol-related crashes in 1999, down 0.9 percent from the 15,934 people killed in these crashes in 1998. Alcohol was involved in 38.4 percent of all crash fatalities in 1999, the lowest level since DOT began keeping records in 1975.
The Bureau of Justice Statistics of the U. S. Justice Department announced in June 1999 that the number of people arrested for drunk driving had dropped to 1.5 million people in 1997, the latest year of available data. There were about 1.8 million arrests in 1986. Of interest, the rate of arrests in 1997 was 809 per 100,000 licensed drivers, compared with 1,124 in 1986. The number of licensed drivers has grown by about 15 percent over the same period. The report cites the increase in age of the driving population and campaigns by private anti-drunk driving groups as factors behind the decrease.
Federal Legislation
Despite the decline in drunk driving fatalities, advocates of stricter laws have warned against complacency and are pushing for Congress to set a BAC level of 0.08 as the definition of drunkenness. The Transportation Equity Act for the 21st Century (TEA21) a highway funding re-authorization bill, contains $700 million in grants to states that lower their BAC to 0.08. A federal government study has shown that if all states had 0.08 BAC and administrative license revocation laws, 925 lives could be saved annually. The Department of Transportation announced a new campaign in December 1999 designed to reach the most at-risk groups with the goal of reducing alcohol-related fatalities by 31 percent to 11,000 per year by 2005.
A 1997 poll conducted by the Insurance Research Council found that 51 percent of respondents believe that drivers were allowed to drink too much under the current legal limit of 0.10. The survey used an average of five or six drinks in a two-hour period as the equivalent of the legal limit. In 1992, only 44 percent of respondents felt that the limit allowed drivers to drink too much.
Of note, according to DOT, in order to reach a blood alcohol content of 0.10, a 170-pound man would have to have 5 drinks (.54 ounces of alcohol, or one shot of distilled spirits, a can of beer, or a glass of wine) in one hour. Under the 0.08 standard, he could have the same amount of alcohol, but would have to spread the drinking over two hours.
State Legislation
According to the National Commission Against Drunk Driving, 39 states plus the District of Columbia permit sobriety checkpoints to help curb drunk driving. Research shows that drivers believe that their chances of being stopped and arrested for drunk driving are increased when they see regular sobriety checkpoints, and they become more cautious as well as less likely to drink and drive. Death caused by drunk driving is a felony in 37 states. High courts in at least six states have upheld murder convictions in cases where it was proven that drunk drivers showed willful disregard for human life.

Twenty states have strengthened the legal definition of drunk driving by changing the standard from .10 BAC to .08 (.07 in New York). Of note, the General Accounting Office, a federal government review agency, has said that passage of these laws alone does not reduce the number or severity of alcohol-related crashes. The agency says that the best way to combat drunk driving is through vigorous enforcement of these laws combined with laws revoking the licenses of violators and public education.
The Administrative License Revocation law (ALR), which allows a driver's license to be seized when his/her BAC is over the specified level that defines driving while intoxicated, or when the driver refuses to take a BAC test, is on the books in 41 states and the District of Columbia. To date, 31 states and the District of Columbia have passed open container laws. Other laws target repeat offenders.
Some states are considering "no pay, no play" laws that prohibit uninsured drivers from filing lawsuits for non-economic damages. California and New Jersey have gone further and now prohibit drunk drivers from filing these lawsuits.
Since February 1999, New York City has been seizing on the spot the vehicles of anyone arrested for drunk driving and arranging for forfeiture if the driver is convicted. Previous law allowed for forfeiture only if the driver was a repeat offender. The program is considered one of the toughest in the nation. Currently, some 22 states have laws allowing for vehicle confiscation for drunk driving but the laws usually apply to repeat or under-age drivers.
Observers note that drivers who test high above the legal limit or have previous convictions and who fight the forfeiture may be subjected to litigation lasting a year and incur legal fees of up to $10,000. The program, backed by the city's administrative law code, had been challenged by a civil liberties group that filed a class action suit with the Manhattan State Supreme Court that challenges the legality and constitutionality of the program. That court held in May 1999 that the policy is legal and a state appeals court upheld the decision in November. From February to November, law enforcers seized about 1,200 vehicles and arrested 2,500 for driving while intoxicated.
Public Attitudes
Surveys show that Americans have become more critical of drunk driving in a relatively short span of time. Fewer drivers now admit to driving under the influence of alcohol, according to a 1997 Insurance Research Council (IRC) poll. In face-to-face interviews, 21 percent of licensed drivers admitted that they had driven in the past year after drinking, the same rate as in 1995. In 1990, 26 percent admitted that they had driven after drinking; in 1985, 37 percent admitted to this behavior.
The IRC poll also found that fewer younger drivers reported drinking and driving in 1997. Eighteen percent of 18 to 24 year olds said they drove after drinking, compared with 29 percent in 1990 and 48 percent in 1985. (See Under-Age Drinking below.) The rate of drinking and driving among 25 to 29 year old drivers was 23 percent in 1997, versus 36 percent in 1990 and 53 percent in 1985.

Under-Age Drinking
NHTSA says that minimum drinking age laws saved an estimated 18,220 lives since 1975 and the laws have reduced traffic fatalities among 18-20 year old drivers by 13 percent. Experts in both government and private groups continue to support the passage of stricter laws aimed at young drinking drivers, especially those including driver license revocation or suspension, known as an effective deterrent for alcohol related driving offenses for young drivers. According to NHTSA, all 50 states and the District of Columbia have set lower BAC levels for under-21 drivers. However, Louisiana's 1997 law is being examined by the state's Supreme Court, which is expected to rule on the law in early 2000.
Legislation to combat underage drinking and driving has been enacted on the federal level. The 1995 National Highway Bill urges states to impose a .02 BAC threshold for drunk driving for under-21 drivers, meaning that under-21 drivers can be convicted of drunk driving if their BAC is .02 or above.
The problem of under-age people purchasing alcohol has not diminished since 1992 when an Insurance Institute for Highway Safety study found that in Washington, D.C., 19 and 20-year-old men successfully purchased beer in 97 out of 100 attempts. A University of Michigan study found in 1996 that young-looking women over the age of 21 were able to buy beer at stores without showing identification in 138 out of 300 attempts. A 1998 study from the American Academy of Pediatrics shows the pervasiveness of teen drinking - over half of those age 16-19 surveyed said that they drank during the past month, but almost two-thirds selected a designated driver. Eighty percent thought that it was alright to drink with friends if there was a designated driver.
Insurer Involvement
Major insurers now sponsor seasonal anti-drunk driving campaigns, and distribute social host guides and media alerts. The campaigns include MADD's July 4th anti-drunk driving campaign and New Year's Eve guidelines. "Prom Promise," where students vow to avoid alcohol at prom time, reached 3,838 high schools in 22 states. The program was organized by Nationwide, a national insurer. Another insurer, Farmers, has developed a program where an agent, young driver and a parent work through a course that examines safety issues and the results of drunk driving. Other insurers have donated passive alcohol sensors and video cameras to law enforcement agencies.
Liquor Liability
A number of factors have combined to create a more favorable market for establishments seeking liquor liability insurance, including:
� the responsibility assumed by owners and operators of eating and drinking establishments � stricter state liquor statutes � the Risk Retention Act of 1986, which makes it easier to form risk retention groups that can provide
insurance coverage outside the traditional market.
However, according to industry observers, the number of wrongful death cases decided against alcohol providers
surged in the early 1990s. The average judgment against alcohol providers had risen by 1990 to $500,000.
Maine was reportedly the first state to rule that a passenger of a vehicle driven by a drunk driver can be tried as an accomplice to that crime. This groundbreaking decision prevents a passenger from escaping liability when aware of the amount of alcohol the driver had consumed. The Colorado Supreme Court expanded liability in drunk driving cases to a person or entity lending a car to a person who is known to have a drinking problem. One justice said that such an action creates an unreasonable risk to the driver and others.
However, a Texas appeals court overturned a ruling in a case where a liquor company was found 35 percent liable for the 1983 death of a college student who died of alcohol poisoning. The court said that the company was not obligated to warn a consumer that she could die from over-consumption of alcohol. Federal warnings on liquor battles were not required until 1987, and the current labels do not say that excessive drinking can cause death.
Social Host Liability
A social host's responsibility for the actions of drunk guests was addressed in a 1984 New Jersey State Supreme Court ruling that a private host serving liquor could be held liable for a drunk guest's subsequent motor vehicle accident. That ruling was tempered by a 1988 law limiting social host liability and may be modified by a 1992 Supreme Court ruling that specifically applies to commercial servers. In at least 21 states, statutory language may be read to include noncommercial servers, sometimes on a limited basis according to the USDOT.
In 10 other states, liability has been established by common law. However, courts in some states have ruled specifically that social hosts are not liable and that this is a matter of public policy which should be decided by the legislature. In at least three states—Missouri, Washington and Colorado—courts have decided that social hosts cannot be treated under the law the same way as people who sell drinks for a living.
Most of the liquor liability cases heard in state appeals courts in the 1990s limited social host liability. In Texas, the Supreme Court ruled in 1993 that the drinker, not the social host, is primarily responsible for the driver's behavior. Supreme courts in only four states have imposed liability on social hosts and in two of those states—California and Iowa— laws were later passed that abolished court-imposed social host liability. In Michigan, social hosts of a party where minors consumed alcohol are not liable for criminal acts of their guests other than alcohol-related automobile accidents. An earlier case held social hosts liable for the actions of minors, but an appellate court said that the earlier ruling was made in the context of alcohol-related automobile accidents.
More recently, in 1999, the Vermont Supreme Court rejected an appeal in a case that sought to make property owners liable for deaths or injuries resulting from unauthorized drinking on their property. The ruling stated that social host liability will not apply if the land owners are neither present nor furnish alcohol.
A Massachusetts Appeals Court decision in late 1995 expanded social host liability in that state. The court said that bar patrons who "pick up the tab" can be held liable if the person for whom they buy drinks injures others by negligently operating a motor vehicle. The case, the only expansion of the state's 1986 social host liability doctrine
and the first appellate decision to uphold it, concerned an uncle who paid for his nephew's drinks at a bar and then allowed him to drive home.
Commercial Server Liability
All but seven states and Puerto Rico have laws or court rulings that impose liability on commercial servers. Some have included provisions that make drinkers more responsible for their actions and to offer some relief to bar and restaurant owners. Many states have enacted measures that limit liability to specific circumstances and provide better definitions of terms such as "apparent intoxication." For example, some require proof that a provider or seller of alcohol knew that the drinker was drunk when served and that the intoxication was the cause of the death or injury resulting in the lawsuit. Others remove liability from servers of alcohol unless they provide liquor illegally. Some states have capped awards assessed against alcohol servers. And some laws, such as Maine's, provide a responsible business practices defense and outline the responsible procedures restaurant and tavern owners should follow.
In 2000, the Oregon Supreme Court ruled, in a landmark case that extends the liability of alcohol servers, that a person who drinks with a driver who later has an accident and injures that person may sue the driver and the establishments that provided the alcohol. This is a contradiction of state case law that held that those who drink to excess are responsible for this behavior and injuries that may result from it. Courts had previously not allowed someone who participated in drinking to seek damages against drivers and liquor providers. The plaintiff was a passenger in a crash involving a vehicle driven by a man with whom he had been drinking.
Occupant Safety
Passive restraints—air bags and automatic seat belts
Passive restraints protect vehicle occupants in a crash by restraining parts of the body that would otherwise hit the steering wheel, dashboard or other hard surfaces. The seriousness of injuries in auto accidents depends to some extent on the part of the vehicle damaged. Frontal crashes, the type of crash for which air bags were designed, are most likely to be fatal. NHTSA says that air bags saved 3,706 lives from 1987 to early 1998, 1,043 in 1998 alone.
NHTSA then reported some injuries from air bags, mostly minor, but some fatal. Most of the fatal injuries stemmed from not using belts properly. However, when viewed in the context of deployments, the risk of injury is very low. Inflating bags can cause injury to, small children in the front seat, small adults who must sit close to the steering wheel to reach the pedals, pregnant women, the elderly and infants in rear-facing safety seats in front seats. However, a 1997 Insurance Research Council survey found that 71 percent of respondents who already have air bags want them on their next vehicle and 72 percent of all respondents are aware of air bag dangers.
NHTSA issued warnings inside vehicles and on child safety seats to shield vulnerable people from air bag injury. It also allowed deactivated air bags when vehicle owners complete a required process and permitted auto makers to "depower" air bags by 25 to 30 percent as an interim solution while smart systems are being developed. The IIHS says that no deaths or injuries have been reported in air bag deployments in 1998 or 1999 model year cars.
NHTSA also issued final rules allowing car makers to install head protection systems, similar to air bags, to provide protection in side impacts which are expected to save 1,200 lives each year and $900 million in economic costs. However, NHTSA says that children seated close to a deployed side air bag may sustain serious injury, and asked manufacturers to deactivate rear side bags before shipping the vehicles. Dealers may activate them after the owner is advised of the problem.
Seat belt use laws are on the books in all states except New Hampshire. However, only 18 states and the District of Columbia have primary enforcement laws, which allow law enforcement officers to stop a car for non-compliance with seat belt laws. The governor of New Jersey signed a primary seat belt law in January to take effect on May 1. In states with weaker secondary enforcement laws, drivers may be stopped only if they are violating other traffic safety laws as well.
Seat belts saved an estimated 11,088 lives in 1998 and are effective in protecting occupants from ejection, one of the most injurious results of a crash. In addition, NHTSA says that in 1995 average hospital costs for unbelted crash victims were 55 percent higher than for belted victims. In 1998, national seat belt usage was 68.7 percent, based on DOT's weighted average of state surveys.
Seat-Belt Usage Laws and Air Bags
Research on the effects of car crashes on the human body was conducted as far back as the 1940s and 1950s, but it was not until the mid-1970s that air bags were offered. About 10 years passed before federal legislators and regulators were convinced that air bags, used with lap and shoulder belts, could save a significant number of lives. In 1981, State Farm Insurance Company petitioned the U.S. Court of Appeals to review the Department of Transportation's decision to rescind the automatic restraint standards opposed by auto manufacturers. The U.S. Supreme Court ruled in 1983 that DOT had erred in delaying the implementation of air bags. By 1984, DOT ordered all 1990 cars to be equipped with automatic restraints.
U.S. auto manufacturers had been long opposed to air bags because of their cost; they also contended that the technology was unproven and that air bags had virtually no effect unless a seat belt also is used. By 1988, fleet use by insurers and government agencies showed the benefits of air bags. By the 1990s, there were reports that air bag deployment caused injuries and deaths. Although some of the deaths resulted from not using seatbelts, or improper use, it was apparent that children, the elderly and people of small stature were vulnerable in air bag deployments.
The first seat-belt use law was enacted by New York in 1984; by 1996, only one state, New Hampshire, did not have a seat belt law. In at least half a dozen states, efforts were made to repeal seat-belt laws on the basis that they are an intrusion into personal freedom. Such repeals were rejected in Iowa and Tennessee, but were successful in Massachusetts, Nebraska and North Dakota. (These states now have seat belt laws.) In an important court test of mandatory seat-belt use laws in Illinois, the state's Supreme Court ruled in October 1986 that the state's seat-belt use law does not violate personal rights and that Illinois justices were wrong in 1969 when they struck down a law requiring motorcyclists to wear helmets. Lower courts had cited that ruling in voiding tickets for seat-belt law violators.
Seat belt use is a behavior that needs to become a habit to be effective. Studies show that usage will decline from initially high levels unless there is continuing publicity and enforcement. Auto safety experts and insurance companies promoted the use of seat belts for every car trip, not just during highway driving.
According to the Alliance of American Insurers, 75 percent of injury-causing traffic accidents occur within 25 miles of home and 80 percent of serious and fatal injuries occur in vehicles traveling less than 40 mph. Some people fail to buckle up because they are afraid of being trapped inside their car by their seat belt. However, the chance of being killed in an auto accident is 25 times greater when a driver or passenger is thrown out of the car.
According to a 1995 NHTSA report, states that have enacted seat belt use laws had about a 12.6 percent decrease in fatalities. States that have primary enforcement of their laws had an additional 5.9 percent drop in fatalities. The study also found that seat belt use is lower in pickups, vans and older vehicles, and lower where alcohol is involved, if the accident occurred at night, and in the rear seats. Seat belt use increases with age, and is higher among women.
Seat-belt laws by themselves are not a total solution to the problem of highway deaths and injuries. In low- to moderate-speed crashes (up to about 25 mph head-on) lap/shoulder belts are effective. But in crashes at higher speeds, even belted occupants may hit steering columns, windshields, and dashboards, especially with their faces and heads, although injuries sustained almost always are less severe than they would be without belts. The combination of an air bag plus a seat belt is a much more effective restraint system than either device alone.
Air Bag Safety
As of February 1, 1998, air bags have saved 2,474 lives, according to the National Highway Traffic Safety Administration (NHTSA). Air bags have reduced deaths in frontal crashes by about 30% among drivers and by about 27% among passengers.
However, as of February 1, 1998, 91 deaths have reportedly been caused by air bags inflating in low severity crashes. These deaths include 36 adult drivers, 4 adult passengers, 39 child passengers and 12 infants in rear-facing child seats. Most of these victims were unbelted or improperly belted. If small children sit unbelted in the front seat, they can be thrown into the path of a deploying air bag, which inflates with great force. This risk also applies to small adults who must sit close to the steering wheel to reach the pedals, pregnant women and the elderly. Infants in rear-facing safety seats on the passenger side can be severely injured because their heads are in the direct path of an inflating air bag.
Solutions
� Drivers should have all children sit in the backseat wearing a safety belt. Infants should be placed in rear-facing car seats and put in the backseat.
� Small adults should move the seat back so that their breastbone is at least 10 inches from the air bag cover.
If these tips cannot be performed, air bag switches can be installed so that the vehicle owner has the option of
turning the bag off or on, depending on the situation. In January 1998, NHTSA allowed auto dealers and repair shops to begin installing air bag cut-off switches.
Before the switch can be installed, vehicle owners must complete a four-step process:
1) Obtain an information brochure and request form from NHTSA, dealerships or repair shops.
2) Return the form to NHTSA.
3) Receive authorization from NHTSA after it reviews the case.
4) Take the vehicle to the service shop along with the authorization from NHTSA which certifies that the owner has read the brochure and met one of the four eligibility classifications:
� rear-facing infant seat must be in the front (necessary if the vehicle has no back-seat) � driver's seat can not be adjusted to keep more than 10 inches between the driver and the steering wheel � putting a child 12 or under in the front seat can not be avoided � having a medical condition that puts them at risk of injury when an air bag deploys
Motorcycle Helmets
Motorcycles accounted for under 2 percent of all registered motor vehicles and only 0.4 percent of vehicle miles traveled in 1997. However, per vehicle mile, motorcycles were about 14 times as likely as car occupants to die in a crash and about 3 times as likely to be injured. In 1998, 2,284 motorcyclists died in crashes, and 46 percent of fatally injured motorcycle drivers and 55 percent of fatally injured passengers were not wearing motorcycle helmets. That year, helmets saved 500 lives, and NHTSA says they would have saved 307 more if all motorcyclists had worn helmets. The average charge for hospital care after a crash for motorcyclists not wearing helmets and who sustain brain injuries is more than twice that of motorcyclists who wear helmets.
Despite the fact that motorcyclists not wearing helmets were over three times as likely to suffer a brain injury than helmeted motorcyclists, only 22 states and the District of Columbia have laws on the books that require all motorcyclists to wear helmets. Motorcyclists' lobbying groups campaign vigorously to oppose helmet laws, citing a preference for personal freedom over the benefits of the helmets.
Sport Utility Vehicles (SUV's)
There are about 4.7 million SUVs and light trucks on the road in the United States, up from about 930,000 in 1990. SUVs generally are larger and heavier than standard passenger cars, have higher horsepower, stiffer frames that do not dissipate the force of an impact, and a high potential for rollover. In addition, they have higher bumpers that do not match those of passenger cars and inflict greater damage to cars in collisions and result in more injuries. While these factors are reflected in physical damage rates, the majority of insurers have not changed liability rates.
In order to alleviate some of the problems with SUVs, at least two motor vehicle manufacturers, Mercedes-Benz and Ford, have made corrections for incompatibilities in their SUV designs. Ford will install energy-absorbing steel bars on front and rear bumpers of its large Expedition SUV and F-150 pickup, two of the nation's best-selling vehicles. On the federal level, the DOT requires a new, more noticeable design for the mandatory rollover warning
sticker that must be placed on SUVs, that includes the words "higher rollover risk".
Generic Crash Parts
Crash parts, the most frequently damaged in crashes, are sheet metal parts that do not affect the operation of a vehicle. Auto repair shops have two sources for these parts: the original equipment manufacturer (OEM) or "competitive" producers of generic parts who are not associated with auto makers. At least 25 state legislatures addressed the issue of using generic crash parts in 1999, usually in response to consumers who believe that the parts are not equal to OEM parts in terms of fit, finish, and corrosion-resistance.
Bills were introduced to limit insurer use of generic parts to cars that are older than two model years, allow policyholders to contest their use, and require policyholders to be informed of the types of parts used to repair their cars. However, according to the Alliance of American Insurers, using generic parts effectively reduces repair costs, as demonstrated by the cost of a 1996 Toyota Camry hood from the original equipment manufacturer of $384, versus $149 for its generic version.
Some people mistakenly believe that the use of generic auto crash parts affects vehicle safety. The Insurance Institute for Highway Safety found that a car's crashworthiness is not influenced by whether or not its cosmetic sheet metal parts are on the car or removed. Therefore, the source of those parts—OEM or competitive producers—has no bearing on a vehicle's crashworthiness.
In October 1999, an Illinois jury found State Farm Mutual Auto Insurance Co. liable for $456 million in damages and an additional $730 million in punitive damages in a class action lawsuit involving its use of generic auto parts. The total award in the case was $1.19 billion. Illinois policyholders claimed that the insurer calculates auto repair estimates using the price of generic crash parts, which are usually less expensive, and that these parts do not restore the vehicle to its original condition. Plaintiff's lawyers argued that the uniformity of State Farm's claims settlement practices merited the inclusion of all policyholders whose vehicles were repaired by State Farm. State Farm appealed the judgement on a fast-track basis directly to the Illinois Supreme Court in December, 1999. The Supreme Court rejected that expedited appeal and State Farm is now appealing through the usual appeals process.
The case included two issues: breach of contract and consumer fraud. State Farm responded to the breach of contract charge by pointing out that the parts used to repair vehicles insured by the company were comparable to OEM parts in terms of fit, finish and safety and that the use of these generic parts saved their policyholders money by holding down the cost of repairs. Moreover, State Farm policyholders have always had the option of complaining directly to the insurer under the auto policy contract which guarantees satisfaction with repairs, but only 0.59 percent of its policyholders who had their vehicles repaired using non-OEM parts were not satisfied with the outcome. (The plaintiffs did not avail themselves of the guarantee.)
The verdict in favor of the plaintiffs will allow auto makers to regain the monopoly they exploited in the past when they were able to charge much higher prices for auto parts. These higher prices are likely to translate into higher insurance costs not only for State Farm which insures about one out of every five vehicles in the United States, but for other insurers who have had similar lawsuits filed against them.
In the wake of the State Farm judgement, a lawsuit seeking class action was filed in November 1999 in Illinois accusing State Farm, CNA, Liberty Mutual, Allstate, Geico, Safeco, and USAA of breach of contract, consumer fraud and conspiracy. Plaintiffs’ attorneys charge that insurers set up the Certified Automotive Parts Association (CAPA) to allow them to use allegedly inferior parts without informing policyholders.
In the case, Hobbs v. State Farm, et al, plaintiff lawyers say that CAPA, which is funded by insurers, concealed the fact that the generic parts were used. CAPA has not been named in the lawsuit. A similar lawsuit was filed against the Hartford Financial Services Group and Travelers Property and Casualty charging that generic parts decrease a repaired vehicle's value and negatively affects its performance and manufacturer warranties. Also as a result of the judgement, State Farm, Nationwide and other leading U.S. auto insurers suspended using generic parts.
Some state courts are rejecting challenges to the use of generic parts. In Arizona, a judge dismissed one of two lawsuits regarding insurer requirements about using generic parts to repair cars. In Texas, an appeals court unanimously upheld a lower court's ruling that allowed insurers to continue using generic crash parts, as long as the parts meet standards for like kind and quality.
Tips for Parents Whose Teenager is Driving
Vehicle choice is particularly important for young drivers. If your teenager has just gotten a driver's license, chances are s/he is looking forward to driving to school this fall. It may be hard to imagine handing them keys to your brand new car, but that may be the smartest vehicle to choose.
While getting a driver's license is an exciting rite of passage for teens, it can be enough to make a parent frantic. The Insurance Institute for Highway Safety (IIHS) and the Insurance Information Institute (III) say there's something worried parents can do to protect their teens—choose a safe vehicle.
Teenagers should drive vehicles that reduce their chances of a crash and offer state-of-the-art protection in case

they do crash. The first years teenagers spend as drivers are very risky. In fact, teen drivers have the highest death rates of any age group. In 1997 alone, more than 5,700 teenagers died in motor vehicle crashes, and many more were left severely and permanently injured by crashes.
Teen drivers not only lack experience, for many of them immature behavior, such as speeding and reckless driving, is common. They may drive cautiously when mom or dad is in the car, but when they're on their own or with other teens, bad driving is of-ten the norm. Keep this in mind when you decide which vehicle your teen will drive and avoid vehicles that encourage reckless driving.
� Avoid choosing vehicles with a performance image. Sports cars and other vehicles with performance features, such as turbo-charging, are likely to encourage speeding. Choosing a vehicle with a more sedate image reduces the chances your teen will be in a speed-related crash.
� Don't let your teen drive an unstable vehicle. Sport utility vehicles, especially the smaller ones, are inherently less stable than cars because of their higher centers of gravity. Abrupt steering maneuvers—the kind that can occur when teens are fooling around or over-correcting a driver error—can cause rollovers in these less stable vehicles. A more stable car would, at worst, skid or spin out. Even if your teenager drives a car with a sedate image, chances are still high that sooner or later he or she will be in a wreck. This is why it’s also important to pick a vehicle that offers good crash protection.
� Don’t let your teen drive a small vehicle. Small vehicles offer much less protection in crashes than larger ones. However, this doesn't mean you should put your child in the largest vehicle you can find. Many mid- and full-size cars offer more than adequate crash protection. Check out the safety ratings for mid-size and larger cars.
� Most of today's cars are better designed for crash protection than cars of 6 to 10 years ago. So avoid older vehicles. For example, a newer mid-size car with airbags would be a better choice than an older, larger car without airbags. Before you make a final choice on the car your teenager will drive, take advantage of the wealth of consumer information available on car safety from the U.S. Department of Transportation, Insurance Institute for Highway Safety, and Insurance Information Institute. Check it out —it just may save your teen's life.
The Insurance Institute for Highway Safety is an independent, nonprofit research and communications organization dedicated to reducing highway crash deaths, injuries, and property damage. The Institute is wholly supported by auto insurance companies. The Insurance Information Institute is a nonprofit communications organization supported by the property-casualty insurance industry. Its central function is to provide accurate and timely information on insurance subjects. Its central function is to provide accurate and timely information on insurance subjects.
Insurer Discounts
In general, auto insurance rates reflect discounts for insuring more than one car with the same insurance company, being a safe driver or having more than one type of policy with the insurer. When cars with air bags were first introduced, drivers received discounts in recognition of the generally lower costs of insuring such cars. By 1998, 78 million cars in the United States were equipped with air bags and the lower costs of insuring these cars is now reflected in general rates for all drivers. In addition, the majority of states mandate discounts for those who have completed approved driver improvement courses, mostly for drivers over the age of 55.
Currently four states still require insurers to give discounts, sometimes specifying the actual percentage, for cars equipped with air bags, and one for other life-saving devices. Florida and New York require insurers to give

discounts for cars equipped with anti-lock brakes, which are designed to improve steering control and stability of handling when the car is brought to a stop. Some insurers have nationwide discounts in place, although research on the effectiveness of anti-lock brakes has been inconclusive.
Dangers to Auto Safety
Cellular Phones
There are 77 million cell phones in use in the United States, according to the Cellular Telecommunications Industry Association. Drivers using cell phones increase their risk of having an accident four-fold, according to a study in the New England Journal of Medicine published in early 1997. Using a hands-free phone did not appear to improve crash risk. A January 1999 NHTSA study confirms previous findings that driver inattention is a primary factor in about half of all crashes in the United States.
A 1997 IRC survey found that 61 percent of those who own cell phones use them while driving at least some of the time, and 30 percent report using their phones frequently. Britain, Brazil, Spain, Switzerland, Israel, parts of Australia, and Japan ban cell phone use while driving. In the United States, similar legislation has been proposed in at least 23 states, according to the National Council of State Legislatures. Driving while phoning has been banned in a Cleveland suburb, for cab drivers in New York, and is restricted or regulated on a very limited basis in California, Florida, and Massachusetts.
Red Light Running
The NHTSA says that drivers who run red lights are involved in 89,000 crashes a year, inflict more than 80,000 injuries and nearly 1,000 deaths. Further, the number of fatal crashes at intersections increased by 16 percent in 1998 from 1992, while all fatal crashes rose by only 5 percent at the same time. Two out of every three Americans see other drivers run red lights every day, and almost all of those polled (96 percent) fear they will be struck at an intersection by a red light runner. One in every three respondents say they personally know someone who was killed or injured in a red light-running crash—about the same amount of people who know someone who was involved in a drunk driving crash.
Red light cameras—which automatically photograph offenders—have been installed in about 50 localities in 10 states in which they are permitted, and in the District of Columbia. An IIHS study of a California location showed that red light running dropped 42 percent after the cameras were used at 9 intersections; in Alexandria, Virginia about 7,500 red light runners were caught by police in less than six months.
Module Summary
At the completion of this module, the learner should be able to discuss the structure of a typical auto insurance policy and to explain what function each part—the declarations page, the insuring agreement, and the conditions of the policy—serves.

Rates and Premiums
Module Overview
The premium is the total cost of the auto insurance policy. As with all insurance policies, premiums are calculated by combining expectation of loss, expense, and profit loadings. This module discusses the following:
� Factors affecting rates of auto insurance � How the buyer can reduce auto insurance rates � How to avoid auto theft and insurance fraud
A. Factors Affecting Rates of Auto Insurance
Auto insurance policies providing the same coverage will be priced differently for different individuals. Insurance companies determine their rates according to statistics that have been collected and analyzed. Those individuals that fall into groups with statistically higher accident rates pay more for their insurance than do those who fall into groups with a lower incidence of accidents. The following factors determine the cost of an auto insurance policy.
1) Age
Single persons under the age of 25 often pay higher rates since, statistically, less experienced drivers have more accidents and tend to get more tickets. Under-25 drivers are involved in more than 1/3 of all auto accidents and traffic fatalities. Sometimes the rate can be lowered if the younger driver is put on a policy with his/her parents.
2) Sex
Young females have fewer accidents than young males. In fact, statistically, women of all ages have fewer accidents than men do.
3) Marital status
Marriage seems to be a factor in safety. Married persons have fewer accidents than single persons. Some companies put widowed and divorced persons into higher-risk groups, which does mean higher insurance rates.
4) Residence
Location affects safety. In general, city-dwellers have more accidents than those who live in the suburbs or rural areas. Even within the same city, however, different zip codes may result in different rates. And people who live in
smaller cities are generally charged less than those who live in larger cities. Insuring a car in Chicago, IL may cost twice as much as insuring the same car in Pierre, SD.
5) Occupation
Though there is disagreement on whether one’s occupation has a statistically demonstrable bearing on a safety record, some insurance companies do consider occupation a factor in determining rates.
6) Make and model of car
The kind of car being driven makes a difference in the rates, since some cars cost more to insure. Higher-priced cars generally cost more to insure than lower-priced card, because they cost more to repair or replace. Some models are more likely to be stolen and certain models are more likely to be involved in an accident.
7) Use of vehicle
A car used for personal purposes, called a pleasure vehicle, will generally cost less to insure because it is less likely to be involved in an accident than one that is driven back and forth from work. Higher use means higher exposure to other drivers and traffic conditions.
8) Driving record
Safe drivers get better rates than unsafe driver. If a driver has a history of *at fault* accidents or moving traffic violations, his premiums will be significantly higher because statistically he is more likely to have future accidents.

9) Other drivers
Although the policy holder may have a good safety record, other drivers on the policy may not (teen-age children, for example), and rates may be higher as a result.
10) Merit rating
A few states, such as Hawaii, have a system called merit rating, based not on groupings like age and sex, but directly on the driver’s personal performance and demonstrated responsibility. Because merit rating does not penalize the good driver who happens to be in a high-risk group, it may be more equitable way to determine premiums. However, if the driver is involved in an accident, rates can go up sharply.
B. Reducing Rates—Discounts
Given the information above, there are several things an individual can do to reduce insurance rates.
� Choose a car that’s less expensive to insure. When shopping for a car, check out safety and theft ratings. Low-profile cars are charged lower rates.
� Increase the deductibles, especially for property damage. � Request low mileage discounts. The fewer miles driven, the less chance for an accident. � Ask about seatbelt, air-bag, anti-lock brake, and anti-theft device discounts. � Consider dropping collision coverage for an older car. � Take a driver’s safety class. � Contest any tickets for moving violations. Fees for fighting tickets usually add up to far less than the costs
of having the ticket on your driving record. � Drive safely to keep a driving record free of moving violations and accidents.
C. Avoiding Auto Theft and Insurance Fraud
Auto theft and insurance fraud cost consumers billions of dollars each year. Policy holders should be encouraged to use the following effective anti-theft devices and tips to protect their cars.
Devices:
� Steering wheel � Car alarms � Kill switches, a hidden switch that prevents the flow of electricity or fuel � Electronic tracking devices, an electronic transmitter hidden in the vehicle � Electronic keys, pre-installed anti-theft systems that allow the vehicle to operate only with a correctly coded
key � Steering column armored caller, an installed mechanism that prevents the breaking of the steering column � Tire locks similar to the boots used by police and traffic organizations

Actions:
� Never leave a wallet or driver's license in the car � When parking in a garage or lot, give the attendant only the ignition key � Never place the vehicle's key on the same ring as a house key � Etch the vehicle identification number (VIN) in several hard-to-find places using an electric etcher � Keep the VIN and tag number on file in home or office to give to police if car is stolen
Insurance fraud is a crime that costs insurers, and ultimately their customers, an estimated 18 billion dollars per year, or $200 per insured person. Some insurance companies give special fraud-detection training to their claims personnel.
Following is a list of possibly suspicious behavior that may signal insurance fraud:
� Person involved in accident is excessively eager to accept blame for an accident or is overly push or demanding of a quick settlement.
� Person involved in accident is unusually familiar with insurance terms and procedures or medical or vehicle repair terminology.
� Person in accident lists a post office box or hotel as an address. � All transactions are conducted in person. The use of telephone and mail is avoided. � Person involved in accident threatens to go to an attorney or a physician if the claim is not quickly settled.
D. More Vital Information Regarding Auto Theft
Source: The Insurance Information Institute, updated April 2000
Motor vehicle thefts were down in 1998 for the seventh year running. In 1998, 1,240,754 motor vehicles worth $7.5 billion were stolen in the United States, dropping 8.4 percent from 1997 to the lowest level since 1986.
Insurance for theft is included in the comprehensive part of an auto insurance policy, a voluntary coverage, which also covers fire, vandalism and weather-related damage. Comprehensive premiums may be dropping in high theft areas but they may not be going down at the same rate as auto thefts. Premiums are affected by the number of insured cars stolen and their cost. The number of theft claims is declining but the dollar size of claims has gone up, reflecting the higher value of new cars on the road. In addition, the theft rate does not include the theft of car parts such as air bags—a problem where the cost of replacement includes both parts and labor.
Latest Facts
� For the third year running, Toyota and Honda car models were the most popular with car thieves in the United States, according to CCC Information Services. Every 25 seconds, a motor vehicle is stolen in the United States. The odds of a vehicle being stolen were 1 in 171 in 1998. The odds are highest in urban areas.
� Few car thieves are caught—only 14 percent of thefts were cleared by arrests in 1998.
� Carjacking—forcibly stealing cars—has become problem, especially in urban areas. However, carjackings account for only 3.5 percent of all motor vehicle thefts nationwide.
� The U.S. average comprehensive insurance premium rose 9.8 percent from 1993 to 1997, the most recent data available, slower than the 12.8 percent rise in consumer prices for used cars and trucks.
1998 Theft Statistics
1) Motor Vehicles Stolen
According to the FBI's Uniform Crime Reports, 1,240,754 motor vehicles were stolen in the United States in 1998, down 8.4 percent from 1,354,189 in 1997. The decline in 1998 was the seventh consecutive annual drop, bringing the number of motor vehicles stolen to the lowest level since 1986.
The odds of a motor vehicle being stolen in the United States were one in 171 registered vehicles in 1998, down from one in 153 registered vehicles in 1997.
2) Regional Differences in Theft Rate
Motor vehicle theft fell in all four regions of the United States: the greatest decline, 11 percent, occurred in the Northeast; the Western states reported a drop of 10 percent, while motor vehicle theft declined 8 percent and 6 percent in the Midwest and South respectively. The South accounted for the most thefts in 1998, with 36 percent of the volume, followed by the Western states with 28 percent and the Midwestern states with 20 percent. The Northern states had the lowest volume of thefts, at 16 percent.
The 1998 motor vehicle theft rate per 100,000 people was 459, down 9 percent from 1997 and down 27 percent from 1989 rate. The highest rate was reported in the Western States, where 581 vehicles were stolen per 100,000 people, followed by 470 in the Southern states, 396 in the Midwestern states, and lowest in the Northeastern states at 373 per 100,000 people. The FBI notes that these rates declined in all regions.
3) Urban vs. Rural Theft Rates
Rates continue to be highest in urban areas—the motor vehicle theft rate was 1,000 for every 100,000 people in cities with over 250,000 inhabitants. There were 243 thefts per 100,000 people in the smallest cities, those with less than 10,000 inhabitants, and 533 in cities of all sizes. In contrast, cities outside metropolitan areas had a theft rate of 223 and rural counties had a theft rate of 129. In terms of actual thefts, motor vehicle thefts fell 10 percent in cities, compared with 8 percent for the total United States. In cities with half a million to one million inhabitants, thefts fell 13 percent, and 4 percent in cites of fewer than 10,000 people. Suburban counties had a decline of 8 percent, and rural counties experienced a 2 percent decrease.

4) Stolen Vehicle Value
The FBI reported the estimated value of motor vehicles stolen in the United States in 1998 was about $7.5 billion, compared to $7.3 billion in 1997. The average value of each motor vehicle stolen in 1998 was $6,030, up 11 percent from $5,416 in 1997. Law enforcement agencies apprehend only a small percentage of auto thieves—14 percent in 1998, a rate that has remained constant for a decade. Young people account for most of these arrests—67 percent of all persons arrested for motor vehicle theft were under 25 years old. People under 18 accounted for 36 percent of all motor vehicle theft arrests. The FBI notes that arrests of people under the age of 18 were down 15 percent from 1997.
5) Cities with Most Vehicle Thefts
Miami, Jersey City and Fresno, California had the highest vehicle theft rates in 1997, ranked by metropolitan statistical areas, according to latest data from the National Insurance Crime Bureau (NICB). Memphis and New York City completed the top five cities, followed by Tucson and Phoenix-Mesa, Albuquerque, Sacramento, and New Orleans. NICB uses theft data from the FBI and other agencies, and determines the rate by dividing registered vehicles by the number of thefts. It noted that nearly half of the top 25 areas are ports or have easy access to borders.
6) Chances of Recovering Stolen Vehicles
The NICB says that in 1997, only 68 percent of drivers would ever see their cars again once they had been stolen. Most of the unrecovered vehicles are shipped overseas or driven over borders. About 200,000 vehicles were illegally exported in 1997, mostly newer, expensive cars and sports utility vehicles.
Law enforcement agencies say that recoveries of shipments of stolen vehicles are difficult because most of their information is obtained through tips. Different agencies impacted by increases in the export of stolen vehicles are joining forces to combat the problem. The FBI, United States Customs Office, the NICB, several major insurance companies and state and local law enforcement agencies formed the North American Export Committee. The NAEC promotes the use of task forces, electronic data reporting and gamma ray (x-ray) machines to scan containers at ports. In its first three months of use at the port of Miami the $280,000 x-ray machine scanned almost 8,000 containers and recovered $217,000 in stolen vehicles.
7) Theft by Model
For the third year running, Japanese imports were the most popular cars among thieves in the U.S., according to the technology-based services provider for auto claims, CCC Information Services. Also noteworthy is the entry of a U.S. pickup truck into the top 10 most stolen vehicles. CCC's annual survey of the most frequently stolen vehicles (which counts total losses—stolen or completely totaled—of each particular model) found that the 1989, 1990, and 1991 Toyota Camrys were the most popular with thieves in 1999, followed by the 1998 Toyota Camry. New to the top 10, Ford's 1997 F150 4x2 truck was the fifth of the top 10 most stolen vehicles. The 1994 and 1995 Honda Accord EX were the next on the list, followed by more Honda Accords—the 1996 LX, the 1990 EX and in the 10th spot—the 1994 LX. The 1994 Chevrolet C1500 4x2, another pickup, scored eleventh.
8) Carjacking
The Department of Justice (DOJ) defines carjacking as the attempted or completed robbery of a motor vehicle by a stranger that includes the use or threat of use of force. According to a DOJ report released in March 1999, between 1992 and 1996 there were an average of 49,000 carjackings each year, up from earlier estimates of about 35,000 each year during the period 1987 to 1992.
Earlier reports put carjacking at about 2 percent of all motor vehicle thefts. The latest report shows that carjackings grew from 3 percent of all motor vehicle thefts in 1992 to 3.5 percent in 1996. From 1992 to 1996, in about half of all carjackings the motor vehicle was stolen.
In about 90 percent of completed carjackings, weapons were used and in about 70 percent of those carjackings the weapon was a firearm. However, most carjackings did not result in injuries to the victim—only 23 percent of completed carjackings and 10 percent of attempts resulted in injuries. The great majority (92 percent) of all carjacking incidents involved a lone victim; men were more likely to be the victim of carjackings; and urban residents were more likely than suburban or rural residents to be carjacked.
Thirty-five percent of completed carjackings were reported to insurers. The DOJ says that most of the carjacking victims said they either had no theft coverage or did not report the theft to their insurers. Further, completed carjackings were less likely than thefts to be reported to insurance companies. A study by the Illinois State Police covering 1994 to 1996 found that most of the 45 carjackings it studied were gang-related. Sixty percent of those involved had known gang affiliations. Their primary motivation appeared to be a need for short-term transportation.
9) Component Theft
Reports from around the country cite increases in the theft of small auto components. Radio thefts have long been a problem, but insurers now see increased thefts of air bags and electronic control modules (ECMs), laptop-sized computers that control various functions. Air bags, now included in virtually all cars sold, are easy to remove and about 60,000 were stolen in 1996. NICB says that air bag theft costs insurers about $50 million a year. A large national insurer said that the theft of air bags from its policyholders tripled from one out of every 10,000 in 1993 to three per 10,000 in 1996. Stolen airbags are sold to unscrupulous auto repair shops, who use them to replace air bags that have deployed and, not surprisingly, airbags that have been stolen.
To thwart thieves, steering wheel covers used with a steel bar steering wheel lock are available. New York combats air bag theft by requiring accident reports to note airbag deployment, and specifies procedures for auto repair shops to follow when replacing stolen or deployed air bags. These procedures include identifying salvaged air bags to discourage the use of stolen air bags.
Federal Anti-Theft Legislation
Federal intervention against car thieves began in 1919, with passage of the Dyer Act, making interstate transportation of stolen vehicles a federal crime. In 1966, the Federal government stepped in again, this time to require identification numbering of vehicles and a warning buzzer on ignition locks to remind drivers to remove their keys before leaving their vehicles.
In 1984, the Motor Vehicle Theft Law Enforcement Act became law. The intent of the new law was to deal a death blow to professional car thieves and chop shops by making it more difficult to sell stolen vehicles and parts, both on the domestic used-parts markets and overseas. The law added new teeth to penalties by bringing interstate trafficking in stolen vehicles and parts under federal racketeering statutes and by imposing heavy fines and prison terms for export violations. It sought to dry up the illegal used-parts market by requiring manufacturers to stamp identifying numbers on major car components, making it easier to trace parts taken from vehicles stolen for dismantling.
The law also required that vehicles be made available for inspection prior to export and expanded U.S. Customs officials' powers of inspection and arrest. This provision responded to the growing international nature of motor vehicle theft. It is not unusual for cars and parts of cars stolen in the U.S. to wind up on overseas markets or for vehicles stolen overseas to be imported. Insurers or their designated agents are required to inform the Secretary of Transportation of vehicle theft and recovery and rating data used to set insurance premiums for motor vehicles. However, although the Act was signed into law in 1984, the Secretary of the Treasury still has not promulgated regulations.
In 1984, the National Highway Traffic Safety Administration (NHTSA) held public hearings on the new Motor Vehicle Theft Law Enforcement Act. However, the proposal was opposed by "gray market" importers of foreign cars and by the Department of Justice. Gray market autos, manufactured abroad and rarely in compliance with U.S. standards, would have been barred from entering the U.S. under the NHTSA proposal because only original manufacturers, not dealers or importers, could certify compliance with the parts identification regulation. The Justice Department, championing a free market, said the proposed rule "has the potential to produce harm to U.S. consumers that far outweighs the benefits of any incremental increase in theft prevention."
By 1985, the Department of Transportation had issued rules for selecting high-theft models, and for theft prevention standards. The rule required that 14 major parts of vehicles, beginning with 1987 model year cars, be inscribed with a 17-digit vehicle identification number. As for imported vehicles and the gray market issue, the rule stipulated that high-theft models be marked before they enter the United States but did not require the markings to be inscribed by the manufacturer, an apparent compromise in favor of the Justice Department's viewpoint.
Another 1984 federal law seeks to prevent professional criminals from using counterfeit documents to dispose of stolen vehicles on the legitimate market. A provision in the Comprehensive Crime Control Act of 1984 makes it a
federal offense to counterfeit or forge motor vehicle title certificates. The Act states: "Whoever makes, utters or possesses a counterfeited security of a State or whoever makes, utters or possesses a forged security of a State...with intent to deceive another ... shall be fined not more than $250,000 or imprisoned for not more than 10 years, or both." This law represents an expansion of federal jurisdiction over non-federal securities that are counterfeited and forged.
The Anti-Car Theft Act, designed to reduce the number of car thefts nationwide and make armed auto theft ("carjacking") a federal crime, became law in 1992. In 1994, the passage of the Violent Crime Control and Law Enforcement Act made carjacking where death results a federal crime punishable by death. Other provisions of the 1992 law extend the current program to require marking 14 major parts of all cars.
The Act specifies the following:
� Repair shops that sell or install marked used parts must check VINS against the FBI’s stolen car database through a national clearing house or risk fines.
� Start-up funding is provided to link all state motor vehicle departments to ensure access to titles. � States are required to check VINs of out-of-state cars before issuing a title to a new owner. � Customs offices must perform spot checks of cars and containers leaving the country, and begin a pilot
program of x-raying containers to prevent the export of stolen vehicles. � Insurers are required to certify that the salvaged or junked vehicles they sell are not stolen � A grant program is established for state and local anti-car theft committees funded by car taxes or fees.
In 1996, President Clinton signed the Anti-Car Theft Improvements Act that amends legislation enacted in 1992. The Act upgrades state motor vehicle department databases containing title information to facilitate their use by federal and state law enforcement officials. The responsibility for implementing the electronic system, which will enable users to instantly determine if a motor vehicle is stolen, was transferred to the Justice Department. The Act grants limited immunity from civil liability to the providers of titling information.
Other Federal Measures To Combat Auto Theft
The National Insurance Crime Bureau (NICB) combats auto theft by investigating cases referred to it by insurers and through its on-line data bases. The data bases allow member insurance companies to search its files by driver identification data, and also by license plate numbers, vehicle identification numbers (VIN) and component vehicle part and type numbers. Information leading to the identification of the vehicle used in the World Trade Center bombing of 1993 was obtained through one of NICB's data bases, which allows the user to enter a partial VIN. The system then reconstructed the VIN and matched it to a van stolen from a truck rental company on the day of the bombing.
State Anti-Theft Legislation
Key state laws that can effectively deter auto theft are described below. These laws combat both auto fraud and theft and are "model" bills that were compiled by the Coalition to Reduce Auto Theft and Fraud (CRAFT). This group represents a group of insurance organizations, insurers and the National Insurance Crime Bureau. These laws are widely endorsed by insurers and other industry experts.
� Vehicle Chop Shop, Stolen and Altered Property Act: This law is aimed at combating organized theft rings—groups that steal cars and strip them of their valuable components. It imposes criminal sanctions on persons involved with chop shops—garages or lots where stolen vehicles are brought to be stripped. It provides for forfeiture of tools and equipment involved in chop shops and allows for civil remedies, including treble damages and injunctive relief, for those aggrieved by chop shop operations. At least seven states have passed this law.
� Salvage Certificate Junk Vehicle Act: This law helps to standardize salvage vehicle documents. It regulates all salvage or junk vehicle documents whether the vehicle is insured or not. It also provides an effective procedure for the de-titling of non-repairable junk vehicles and mandates surrender of a junk or salvage vehicle's title; ends the title chain of a junk vehicle; and establishes a paper trail to detect and prevent fraud and theft.
� Vehicle Owner Fraud Act: This legislation combats owner give-ups—where the vehicle owner is in collusion with others to file a fraudulent claim. Knowingly making, or assisting in making a false claim for theft, destruction or damage, or illegally obtaining vehicle ownership by making false statements are classified as felonies.
� The False Police Reports Act: This law makes it a crime to knowingly make, or assist with, a false report of theft, destruction or damage of any property to a law enforcement agency. Generally, the first offense is a misdemeanor, and subsequent offenses are felonies.
It should be noted that each state must pass the laws individually. Although some states develop laws based on model legislation, the provisions in some state laws may be stronger, or better defined, than others.
Other State Measures To Combat Auto Theft
Beginning in the mid-1980s, states and regions experiencing high auto thefts began to form Anti-Car Theft (ACT) groups. These were funded by voluntary grants from coalitions of law enforcement groups, state funds, insurers, and consumers to promote public awareness of vehicle theft and lobby for the passage of state legislation aimed at combating thefts. At least 10 states have enacted Automobile Theft Prevention Authorities (ATPAs), mostly funded by a small surcharge on driver's licenses or registration fees, or on auto insurance policies sold in the state.
Michigan pioneered the ATPA concept in 1986, allocating $1 from each auto insurance policy and channeling the funds toward combating auto theft. Michigan's program, called Help Eliminate Auto Theft (HEAT) includes a toll-free hotline for residents to report thefts and chop shop operations. By mid-1997, 5,028 confidential hot-line tips led to the recovery of $25 million worth of stolen vehicles and parts. In Illinois, auto thefts have fallen more than 26 percent since a similar program was instituted in 1991. The program has resulted in the recovery of about 21,000 vehicles valued at $113 million from 1991 to 1998.
ATPAs and other states that have formed ACT groups use a wide range of programs to fight auto theft in addition to the HEAT hotline programs. Combat Auto Theft (CAT) programs involve auto owners who voluntarily put stickers on their windshields that alert police that the vehicle is rarely driven at night. Thus if the car is spotted during late night hours, the driver will be stopped and asked for evidence of ownership.
In Texas, title certificates are being issued that are difficult to alter or counterfeit. The certificates are printed in erasure-sensitive inks on brightly colored paper with special tinting. The information on the certificates now includes odometer readings.
Another state that has taken a strong position against auto theft is Massachusetts, where auto insurers have contributed almost half a million dollars directly to the Lawrence police department to fight auto theft. The grant, made in late 1990, enables the town—which then had the second highest city theft rate in the nation—to allow more law enforcement officers to concentrate on auto theft.
High-theft metropolitan areas have instituted task forces to combat auto theft. Newark's seven-year-old task force helped reduce the city's theft rate from the highest in the U.S. in 1991 to sixteenth by 1996. The task force made 2,200 arrests and recovered 2,400 stolen vehicles over the 7-year period.
How the Motorist Can Protect His/Her Car
Auto experts recommend that vehicle owners adopt a "layered" approach to protecting their vehicles from thieves and adapt it to their vehicle and geographic location:
� The first step is to use good judgment—park the car in a well-lit area, remove the keys, and lock the doors. � The second layer uses visual and audible warning devices that a thief will recognize immediately. Using
anti-theft devices like steering wheel locks and ignition collars may stop a casual thief or slow a more experienced one. In addition, alarms with sirens and flashing lights help deter thieves by calling attention to them.
� The next layer involves immobilizing devices such as ignition cutoffs, and starter and fuel system disablers. Depending on their circumstances, motorists may also consider using sophisticated electronic tracking devices.
Electronic Protection Devices: Consumers will spend about $360 million by the end of 1999 for electronic devices to protect their vehicles from theft, according to the Consumer Electronics Manufacturers Association, compared with $161 million five years ago. One example, electronic ignition keys containing a computer chip, have been successful in deterring theft because cars will start only with the owner’s specially coded key.
Even more complex are electronic tracking devices such as LoJack, which uses a hidden transmitter to allow police, who have been alerted to the theft, to track the vehicle using a special computer. Besides the 95 percent recovery rate claimed by LoJack, the device leads police directly to chop shops. In Los Angeles, 53 chop shops were closed following the recovery of vehicles equipped with LoJack. The system is currently in use in 15 states and 20 major metropolitan areas.
A National Bureau of Research study found that if an area has LoJack installed in 2 percent of cars, theft losses can be reduced by 40 percent in central cities and 13 percent in LoJack's entire range. This benefit stems from the fact that recidivism is rampant in auto theft—the same thieves can steal many cars so that apprehending a small number of thieves greatly reduces an area's thefts.
Insurer Discounts
Twelve states (Florida, Illinois, Kentucky, Louisiana, Massachusetts, Minnesota, New Mexico, New York,
Pennsylvania, Rhode Island, Texas, and Washington) require insurers to give car owners discounts on their comprehensive insurance for anti-theft devices. Passive devices such as ignition cutoffs, some types of alarms, and electronic auto recovery systems which are automatically activated when the car is locked and do not depend on the driver to remember to activate them may qualify for up to a 30 percent discount. Massachusetts residents are eligible for a minimum 25 percent discount if they have both an anti-theft device and an auto recovery system.
In New Jersey and Georgia, the Insurance Commissioner may order discounts and encourage insurers to provide discounts. Insurance companies in states that do not mandate discounts have also encouraged car owners to install anti-theft devices by providing discounts. Generally, insurers favor passive devices. Other deterrents qualify drivers for insurance discounts, which vary by state and insurer.
Module Summary
At the completion of this module, the learner should be able to discuss the factors that determine auto insurance premiums, as well as the following:
� Factors affecting rates of auto insurance � How the buyer can reduce auto insurance rates � How to avoid auto theft and insurance fraud