autohgpec: automated prediction of novel disease-gene and ... · 1 autohgpec: automated prediction...
TRANSCRIPT
1
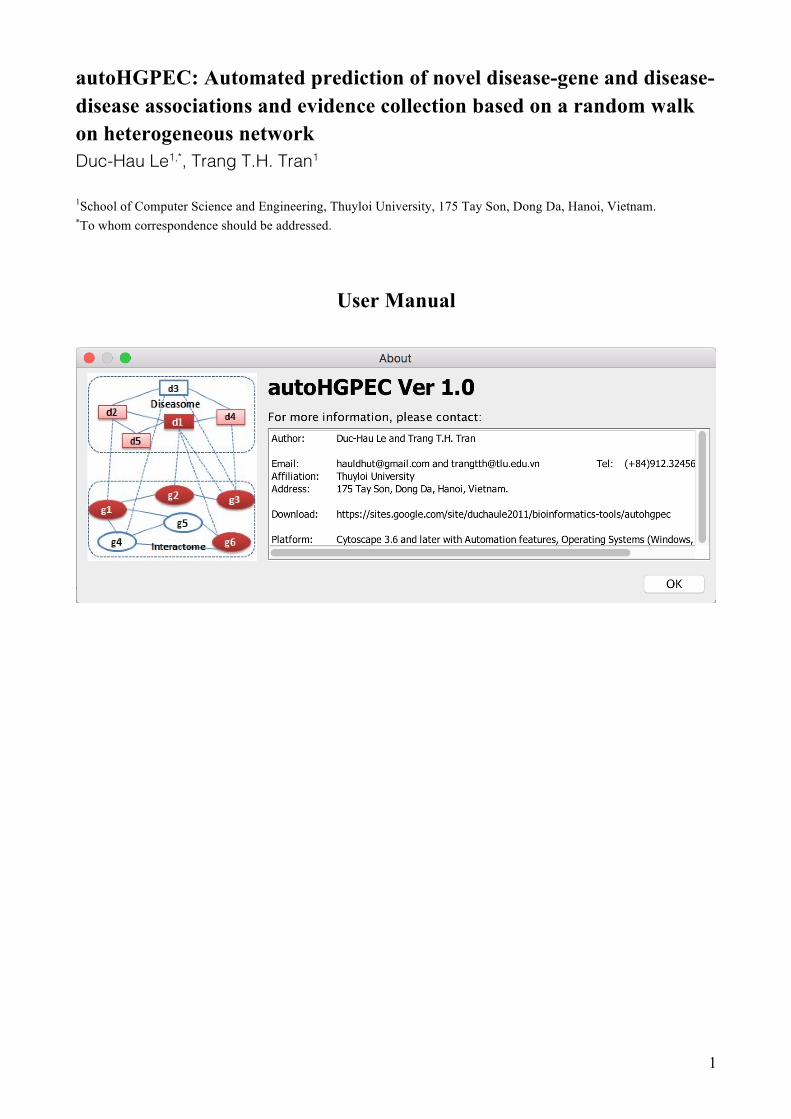
autoHGPEC: Automated prediction of novel disease-gene and disease-disease associations and evidence collection based on a random walk on heterogeneous network Duc-Hau Le1,*, Trang T.H. Tran1 1School of Computer Science and Engineering, Thuyloi University, 175 Tay Son, Dong Da, Hanoi, Vietnam. *To whom correspondence should be addressed.
User Manual

2
Table of Contents I. Setup ............................................................................................................................................ 3II. Overview of autoHGPEC ............................................................................................................ 4III. Case study: Prediction of novel breast cancer-associated genes and diseases ............................. 5
1. Run autoHGPEC in Cytoscape ................................................................................................ 5Step 1: Construct a heterogeneous network ................................................................................. 5Step 2: Select a disease of interest ............................................................................................... 5Step 3: Select candidate sets ........................................................................................................ 6Step 4: Prioritize .......................................................................................................................... 6Step 5: Examine ranked genes and diseases ................................................................................ 7
Visualization ............................................................................................................................ 7Search Evidences ................................................................................................................... 10
2. Automate autoHGPEC using CyREST Command API......................................................... 11Step 1: Construct a heterogeneous network ............................................................................... 11Step 2: Select a disease of interest ............................................................................................. 12Step 3: Select candidate sets ...................................................................................................... 15Step 4: Prioritize ........................................................................................................................ 17Step 5: Examine ranked genes and diseases .............................................................................. 19
Visualize ................................................................................................................................ 19Search Evidences ................................................................................................................... 20
3. Automate autoHGPEC from R .............................................................................................. 20Step 1: Construct a heterogeneous network ............................................................................... 21Step 2: Select a disease of interest ............................................................................................. 21Step 3: Select candidate sets ...................................................................................................... 21Step 4: Prioritize ........................................................................................................................ 22Step 5: Examine ranked genes and diseases .............................................................................. 23
Visualize ................................................................................................................................ 23Search Evidences ................................................................................................................... 23
IV. Reference ................................................................................................................................... 24
3
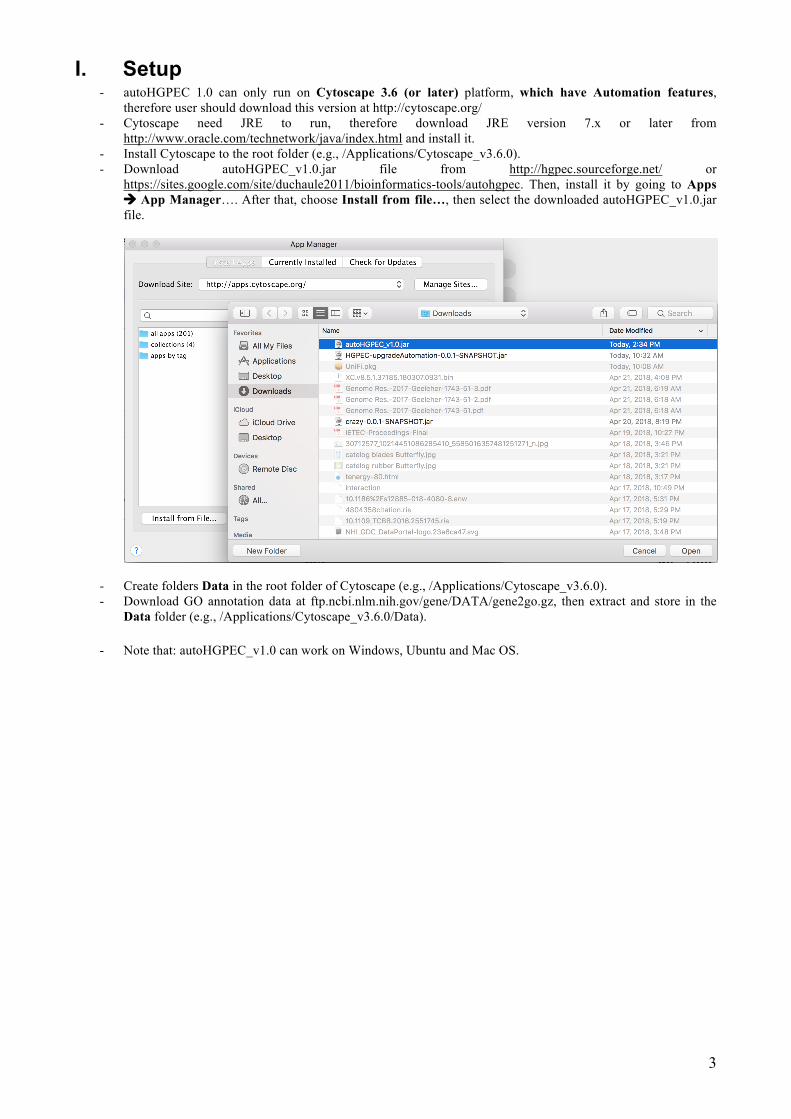
I. Setup - autoHGPEC 1.0 can only run on Cytoscape 3.6 (or later) platform, which have Automation features,
therefore user should download this version at http://cytoscape.org/ - Cytoscape need JRE to run, therefore download JRE version 7.x or later from
http://www.oracle.com/technetwork/java/index.html and install it. - Install Cytoscape to the root folder (e.g., /Applications/Cytoscape_v3.6.0). - Download autoHGPEC_v1.0.jar file from http://hgpec.sourceforge.net/ or
https://sites.google.com/site/duchaule2011/bioinformatics-tools/autohgpec. Then, install it by going to Apps à App Manager…. After that, choose Install from file…, then select the downloaded autoHGPEC_v1.0.jar file.
- Create folders Data in the root folder of Cytoscape (e.g., /Applications/Cytoscape_v3.6.0). - Download GO annotation data at ftp.ncbi.nlm.nih.gov/gene/DATA/gene2go.gz, then extract and store in the
Data folder (e.g., /Applications/Cytoscape_v3.6.0/Data).
- Note that: autoHGPEC_v1.0 can work on Windows, Ubuntu and Mac OS.

4
II. Overview of autoHGPEC After installing, autoHGPEC will be automatically loaded in the App menu of Cytoscape
The main tasks (Prediction of Genes and Diseases, and Evidence Collection) of autoHGPEC are completed after five steps:
- Step 1: Construct a Heterogeneous network - Step 2: Select a disease of interest (including 2 sub steps)
o 1. Select a disease o 2. Create training list
- Step 3: Provide Candidate Gene Set (including 4 options) o All remaining genes in the Gene network o Neighbors of training genes in Chromosome o Neighbors of training genes in Gene network o Susceptible Chromosome Regions/Bands
- Step 4: Prioritize (candidate genes and diseases) - Step 5: Examine Ranked Genes and Diseases
o Search Evidences o Visualize
These five steps can be performed
- In Cytoscape like HGPEC (Le and Pham, 2017) - Using CyREST Command API - From R statistics (https://www.r-project.org)
5
III. Case study: Prediction of novel breast cancer-associated genes and diseases
In the following section, we show the ability of autoHPEC in identifying novel breast cancer-associated genes and diseases.
1. Run autoHGPEC in Cytoscape Step 1: Construct a heterogeneous network
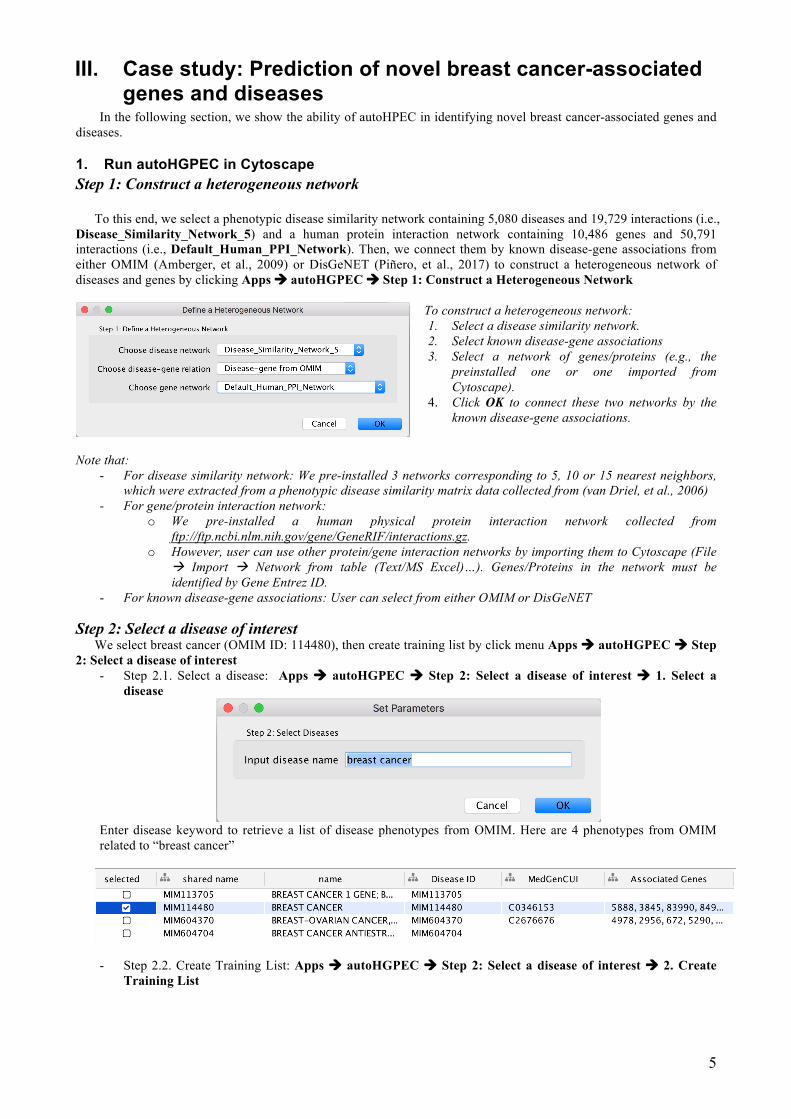
To this end, we select a phenotypic disease similarity network containing 5,080 diseases and 19,729 interactions (i.e., Disease_Similarity_Network_5) and a human protein interaction network containing 10,486 genes and 50,791 interactions (i.e., Default_Human_PPI_Network). Then, we connect them by known disease-gene associations from either OMIM (Amberger, et al., 2009) or DisGeNET (Piñero, et al., 2017) to construct a heterogeneous network of diseases and genes by clicking Apps à autoHGPEC à Step 1: Construct a Heterogeneous Network
To construct a heterogeneous network: 1. Select a disease similarity network. 2. Select known disease-gene associations 3. Select a network of genes/proteins (e.g., the
preinstalled one or one imported from Cytoscape).
4. Click OK to connect these two networks by the known disease-gene associations.
Note that:
- For disease similarity network: We pre-installed 3 networks corresponding to 5, 10 or 15 nearest neighbors, which were extracted from a phenotypic disease similarity matrix data collected from (van Driel, et al., 2006)
- For gene/protein interaction network: o We pre-installed a human physical protein interaction network collected from
ftp://ftp.ncbi.nlm.nih.gov/gene/GeneRIF/interactions.gz. o However, user can use other protein/gene interaction networks by importing them to Cytoscape (File
à Import à Network from table (Text/MS Excel)…). Genes/Proteins in the network must be identified by Gene Entrez ID.
- For known disease-gene associations: User can select from either OMIM or DisGeNET
Step 2: Select a disease of interest We select breast cancer (OMIM ID: 114480), then create training list by click menu Apps à autoHGPEC à Step
2: Select a disease of interest - Step 2.1. Select a disease: Apps à autoHGPEC à Step 2: Select a disease of interest à 1. Select a
disease
Enter disease keyword to retrieve a list of disease phenotypes from OMIM. Here are 4 phenotypes from OMIM related to “breast cancer”
- Step 2.2. Create Training List: Apps à autoHGPEC à Step 2: Select a disease of interest à 2. Create Training List
6
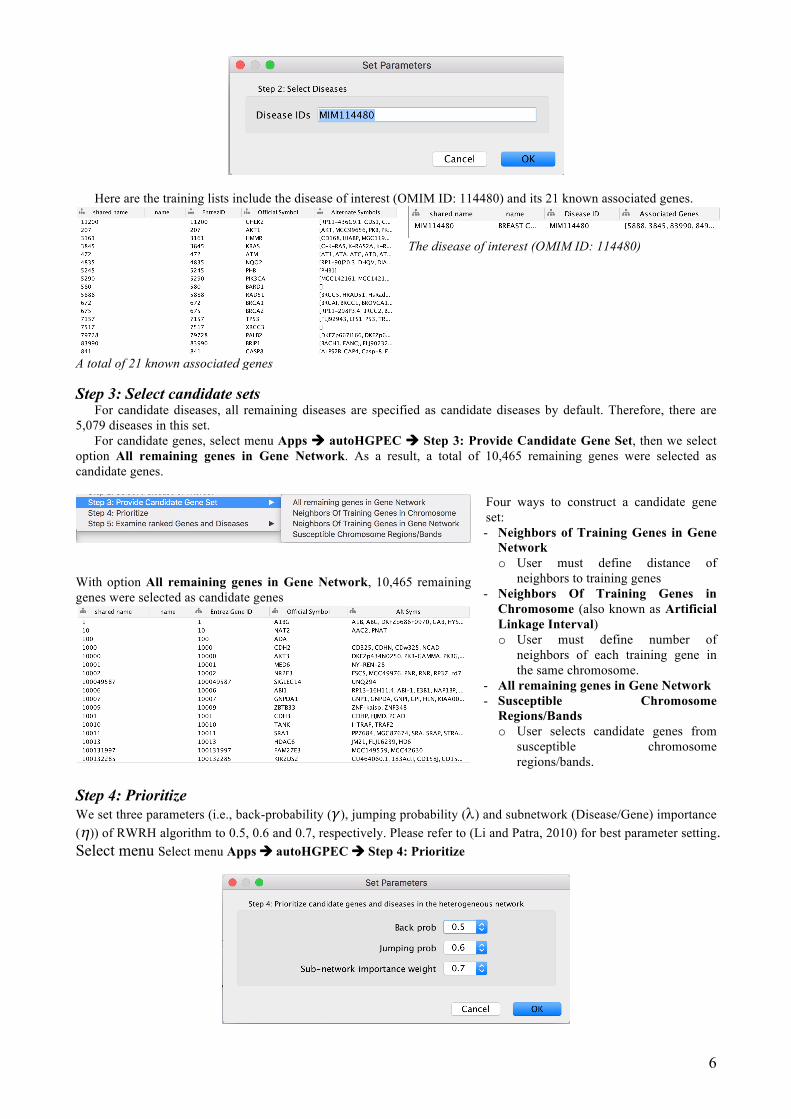
Here are the training lists include the disease of interest (OMIM ID: 114480) and its 21 known associated genes.
A total of 21 known associated genes
The disease of interest (OMIM ID: 114480)
Step 3: Select candidate sets
For candidate diseases, all remaining diseases are specified as candidate diseases by default. Therefore, there are 5,079 diseases in this set.
For candidate genes, select menu Apps à autoHGPEC à Step 3: Provide Candidate Gene Set, then we select option All remaining genes in Gene Network. As a result, a total of 10,465 remaining genes were selected as candidate genes.
With option All remaining genes in Gene Network, 10,465 remaining genes were selected as candidate genes
Four ways to construct a candidate gene set: - Neighbors of Training Genes in Gene
Network o User must define distance of
neighbors to training genes - Neighbors Of Training Genes in
Chromosome (also known as Artificial Linkage Interval) o User must define number of
neighbors of each training gene in the same chromosome.
- All remaining genes in Gene Network - Susceptible Chromosome
Regions/Bands o User selects candidate genes from
susceptible chromosome regions/bands.
Step 4: Prioritize We set three parameters (i.e., back-probability (𝛾), jumping probability (l) and subnetwork (Disease/Gene) importance (h)) of RWRH algorithm to 0.5, 0.6 and 0.7, respectively. Please refer to (Li and Patra, 2010) for best parameter setting. Select menu Select menu Apps à autoHGPEC à Step 4: Prioritize
7
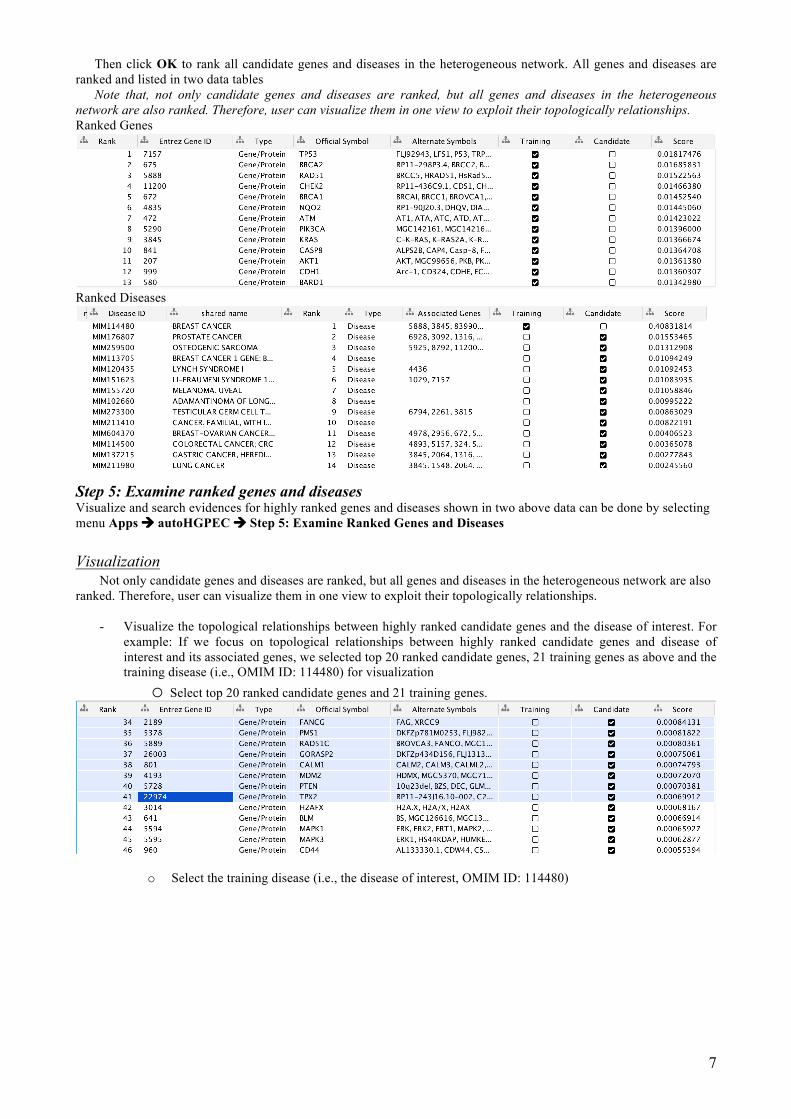
Then click OK to rank all candidate genes and diseases in the heterogeneous network. All genes and diseases are ranked and listed in two data tables
Note that, not only candidate genes and diseases are ranked, but all genes and diseases in the heterogeneous network are also ranked. Therefore, user can visualize them in one view to exploit their topologically relationships. Ranked Genes
Ranked Diseases
Step 5: Examine ranked genes and diseases Visualize and search evidences for highly ranked genes and diseases shown in two above data can be done by selecting menu Apps à autoHGPEC à Step 5: Examine Ranked Genes and Diseases Visualization
Not only candidate genes and diseases are ranked, but all genes and diseases in the heterogeneous network are also ranked. Therefore, user can visualize them in one view to exploit their topologically relationships.
- Visualize the topological relationships between highly ranked candidate genes and the disease of interest. For
example: If we focus on topological relationships between highly ranked candidate genes and disease of interest and its associated genes, we selected top 20 ranked candidate genes, 21 training genes as above and the training disease (i.e., OMIM ID: 114480) for visualization
o Select top 20 ranked candidate genes and 21 training genes.
o Select the training disease (i.e., the disease of interest, OMIM ID: 114480)
8
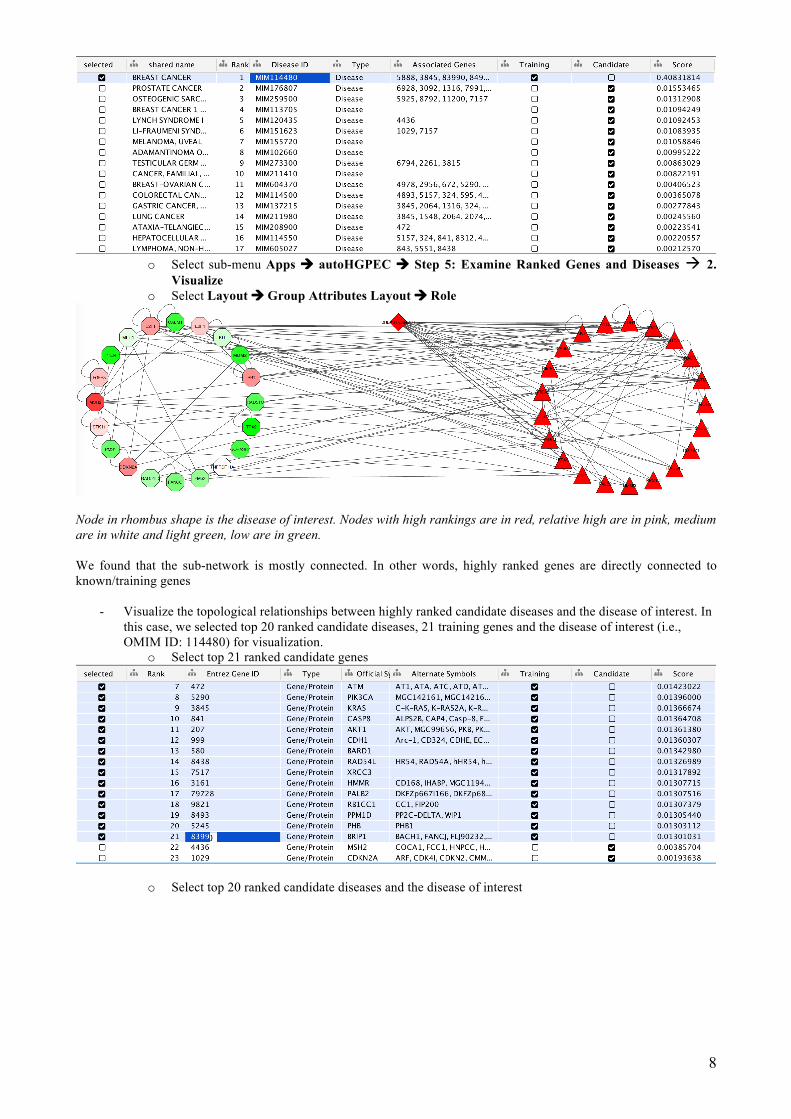
o Select sub-menu Apps à autoHGPEC à Step 5: Examine Ranked Genes and Diseases à 2.
Visualize o Select Layout à Group Attributes Layout à Role
Node in rhombus shape is the disease of interest. Nodes with high rankings are in red, relative high are in pink, medium are in white and light green, low are in green. We found that the sub-network is mostly connected. In other words, highly ranked genes are directly connected to known/training genes
- Visualize the topological relationships between highly ranked candidate diseases and the disease of interest. In
this case, we selected top 20 ranked candidate diseases, 21 training genes and the disease of interest (i.e., OMIM ID: 114480) for visualization.
o Select top 21 ranked candidate genes
o Select top 20 ranked candidate diseases and the disease of interest
9
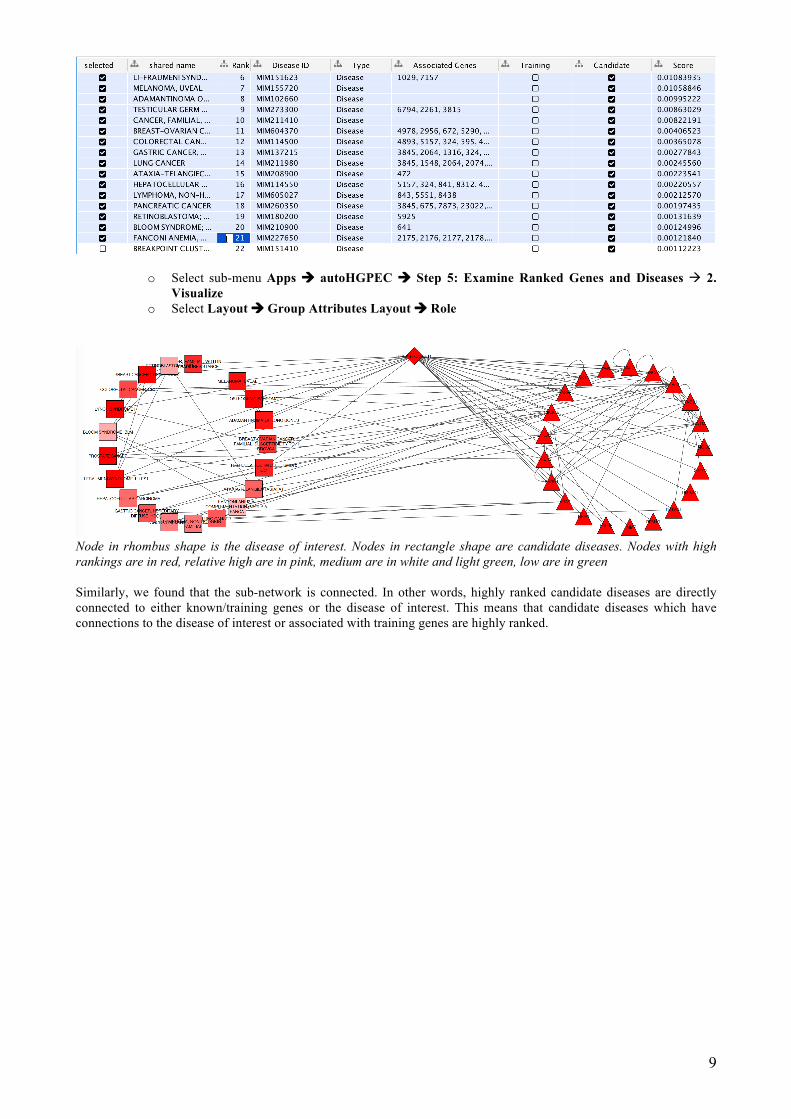
o Select sub-menu Apps à autoHGPEC à Step 5: Examine Ranked Genes and Diseases à 2. Visualize
o Select Layout à Group Attributes Layout à Role
Node in rhombus shape is the disease of interest. Nodes in rectangle shape are candidate diseases. Nodes with high rankings are in red, relative high are in pink, medium are in white and light green, low are in green Similarly, we found that the sub-network is connected. In other words, highly ranked candidate diseases are directly connected to either known/training genes or the disease of interest. This means that candidate diseases which have connections to the disease of interest or associated with training genes are highly ranked.
10
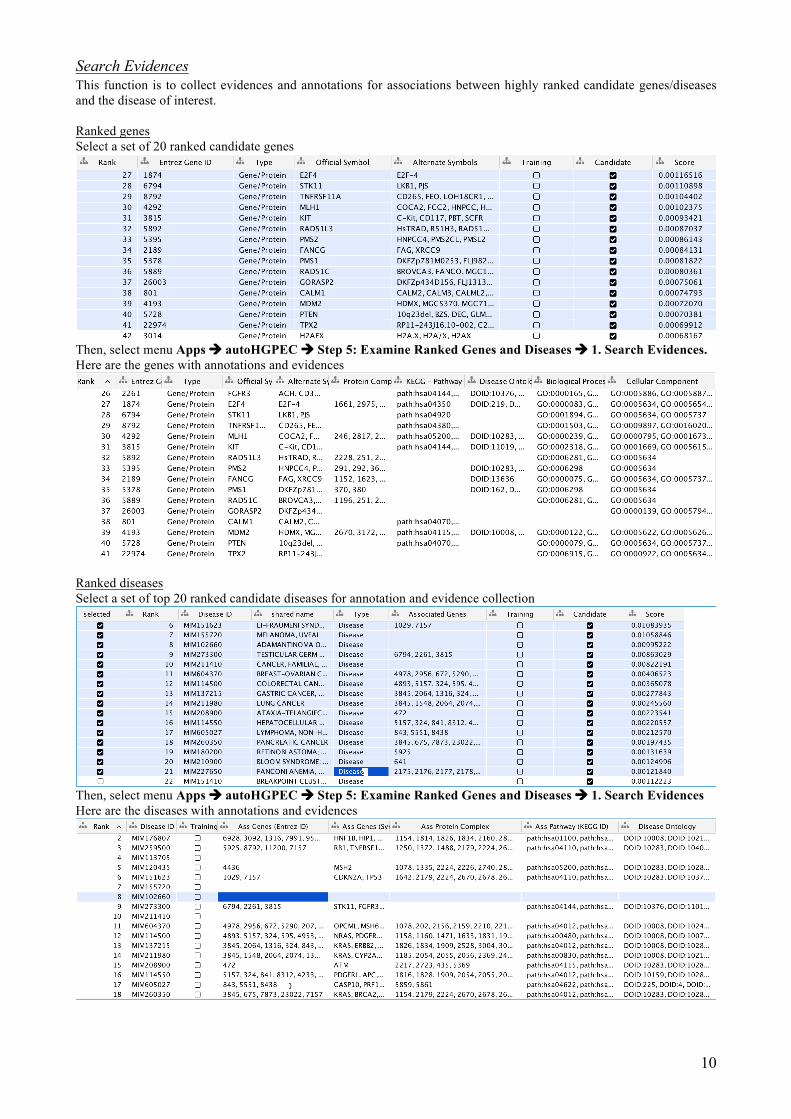
Search Evidences This function is to collect evidences and annotations for associations between highly ranked candidate genes/diseases and the disease of interest. Ranked genes Select a set of 20 ranked candidate genes
Then, select menu Apps à autoHGPEC à Step 5: Examine Ranked Genes and Diseases à 1. Search Evidences. Here are the genes with annotations and evidences
Ranked diseases Select a set of top 20 ranked candidate diseases for annotation and evidence collection
Then, select menu Apps à autoHGPEC à Step 5: Examine Ranked Genes and Diseases à 1. Search Evidences Here are the diseases with annotations and evidences
11
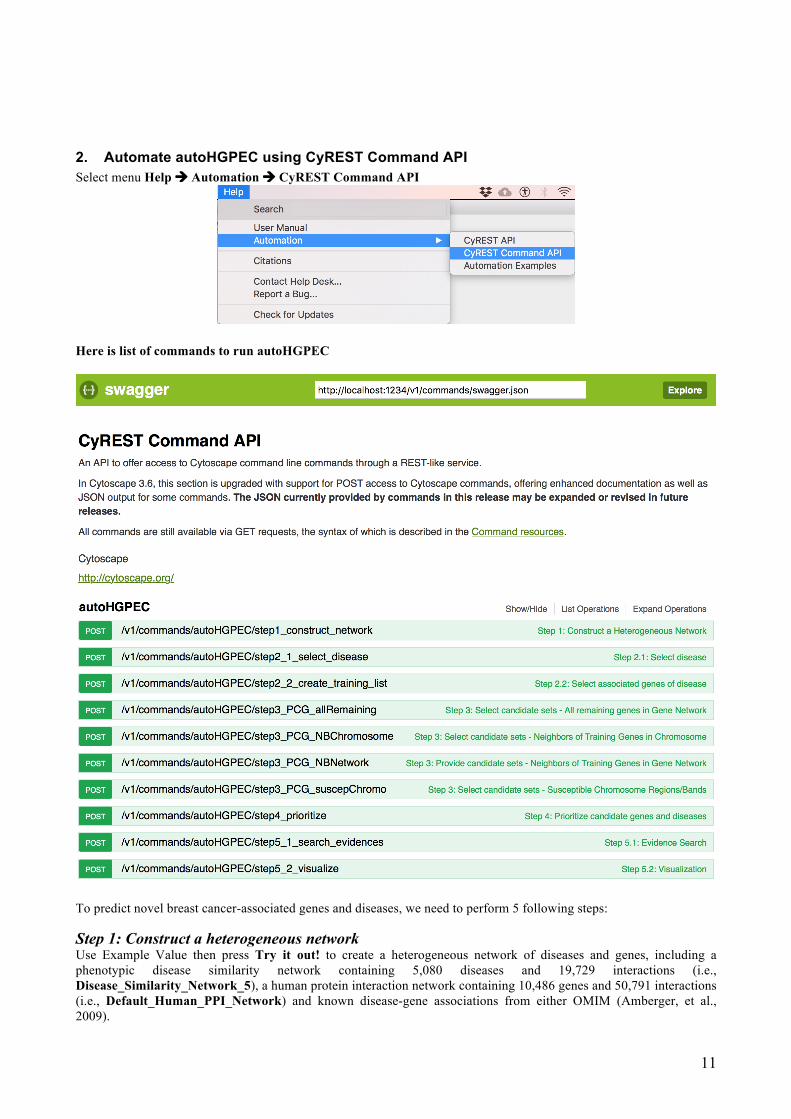
2. Automate autoHGPEC using CyREST Command API Select menu Help à Automation à CyREST Command API
Here is list of commands to run autoHGPEC
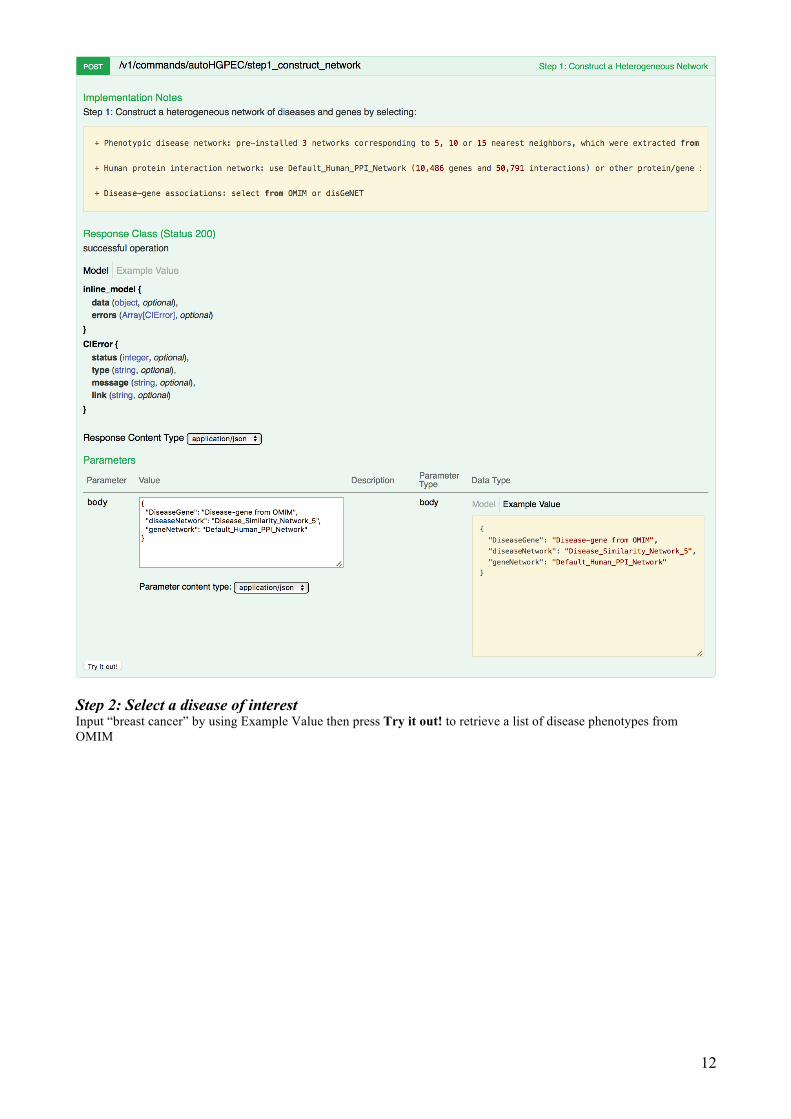
To predict novel breast cancer-associated genes and diseases, we need to perform 5 following steps: Step 1: Construct a heterogeneous network Use Example Value then press Try it out! to create a heterogeneous network of diseases and genes, including a phenotypic disease similarity network containing 5,080 diseases and 19,729 interactions (i.e., Disease_Similarity_Network_5), a human protein interaction network containing 10,486 genes and 50,791 interactions (i.e., Default_Human_PPI_Network) and known disease-gene associations from either OMIM (Amberger, et al., 2009).
12
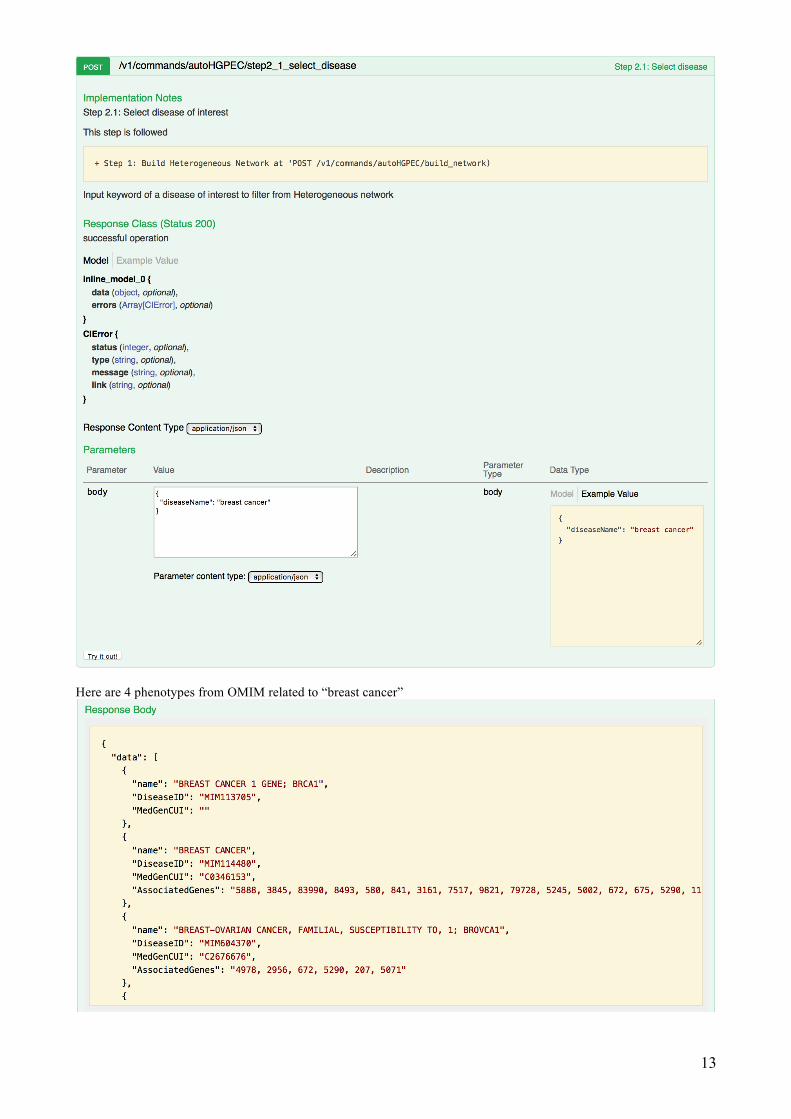
Step 2: Select a disease of interest Input “breast cancer” by using Example Value then press Try it out! to retrieve a list of disease phenotypes from OMIM
13
Here are 4 phenotypes from OMIM related to “breast cancer”
14
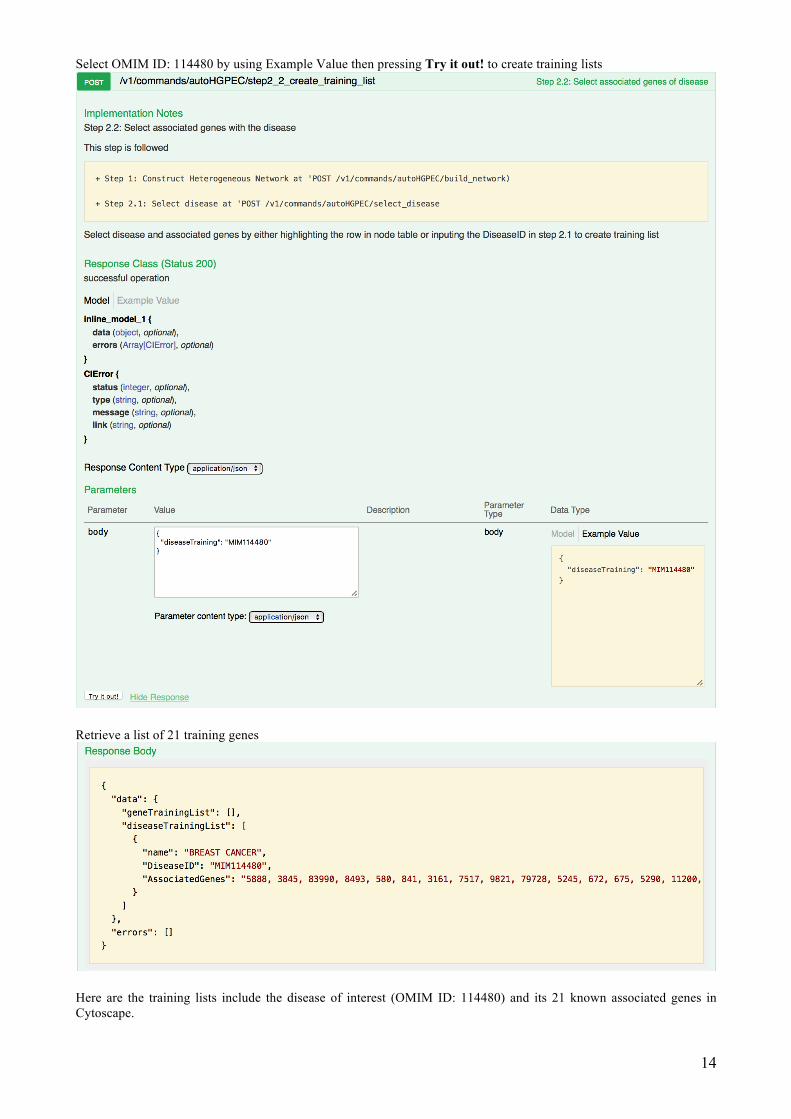
Select OMIM ID: 114480 by using Example Value then pressing Try it out! to create training lists
Retrieve a list of 21 training genes
Here are the training lists include the disease of interest (OMIM ID: 114480) and its 21 known associated genes in Cytoscape.
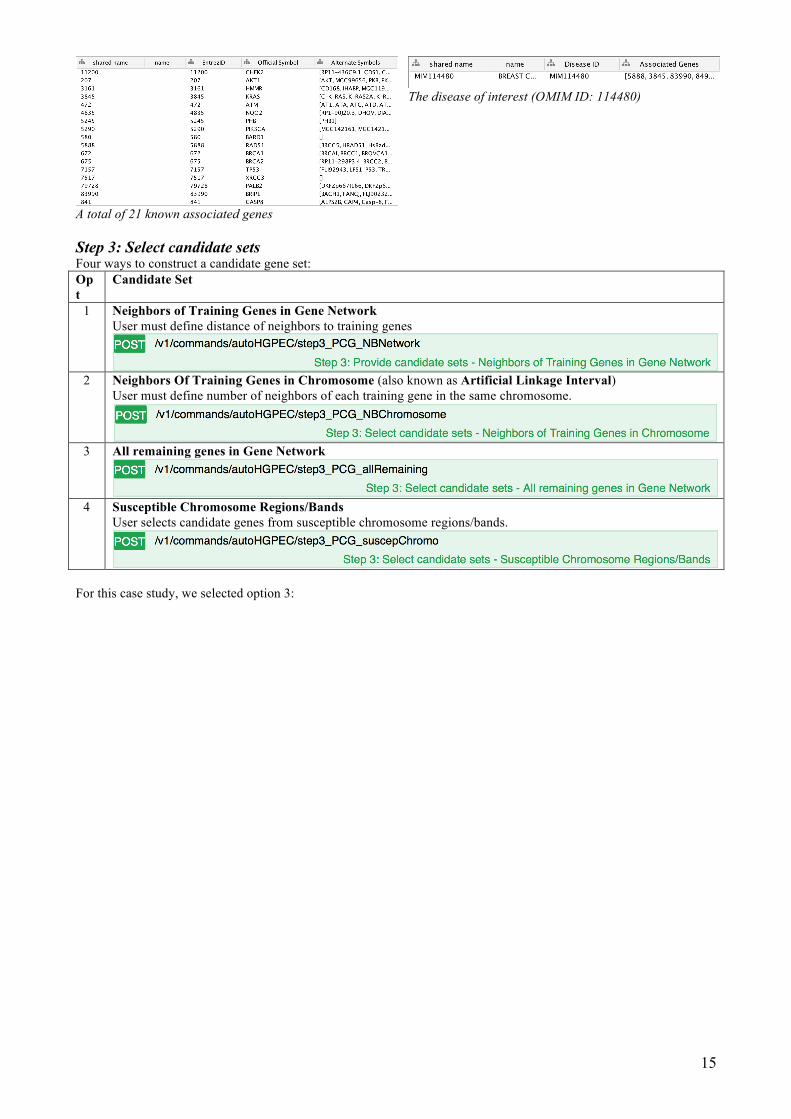
15
A total of 21 known associated genes
The disease of interest (OMIM ID: 114480)
Step 3: Select candidate sets Four ways to construct a candidate gene set: Opt
Candidate Set
1 Neighbors of Training Genes in Gene Network User must define distance of neighbors to training genes
2 Neighbors Of Training Genes in Chromosome (also known as Artificial Linkage Interval)
User must define number of neighbors of each training gene in the same chromosome.
3 All remaining genes in Gene Network
4 Susceptible Chromosome Regions/Bands
User selects candidate genes from susceptible chromosome regions/bands.
For this case study, we selected option 3:
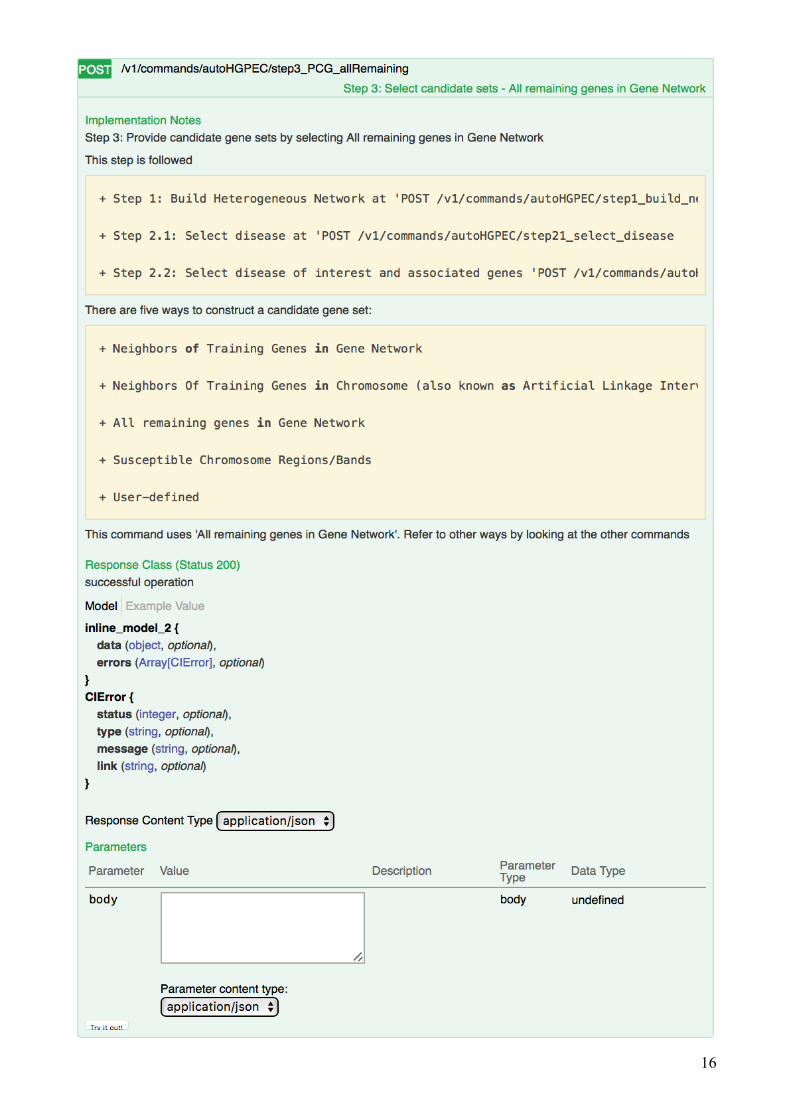
16
17
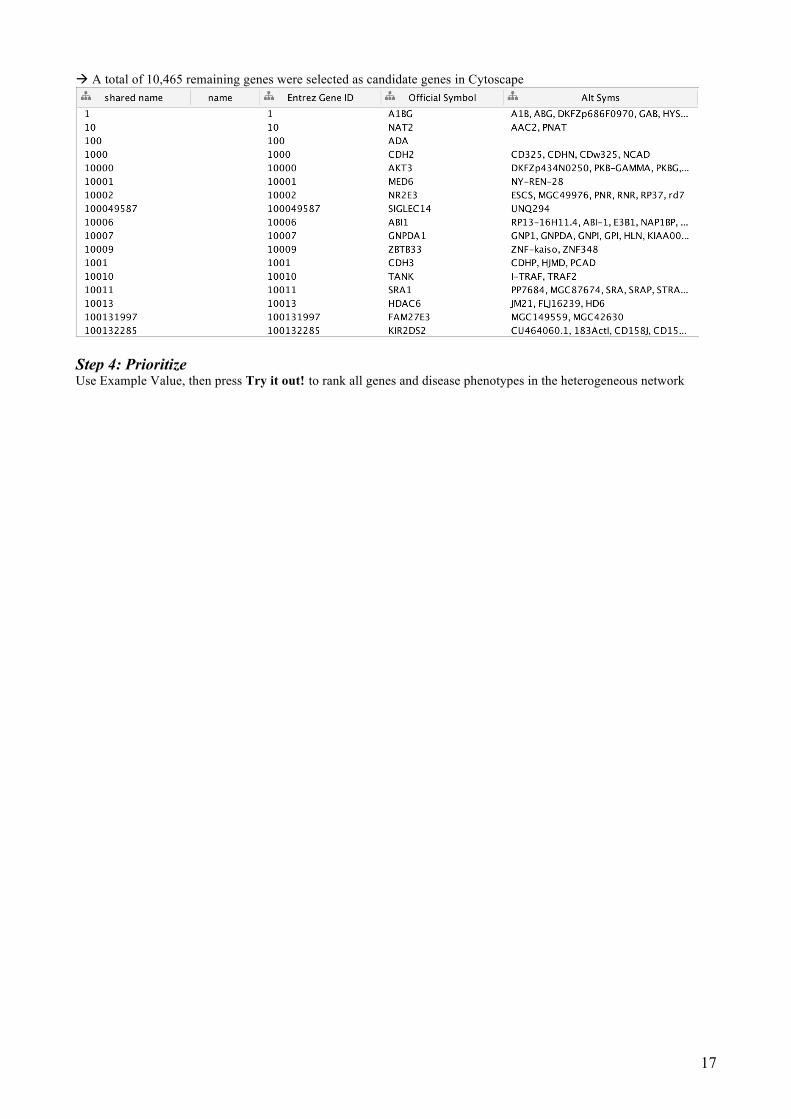
à A total of 10,465 remaining genes were selected as candidate genes in Cytoscape
Step 4: Prioritize Use Example Value, then press Try it out! to rank all genes and disease phenotypes in the heterogeneous network
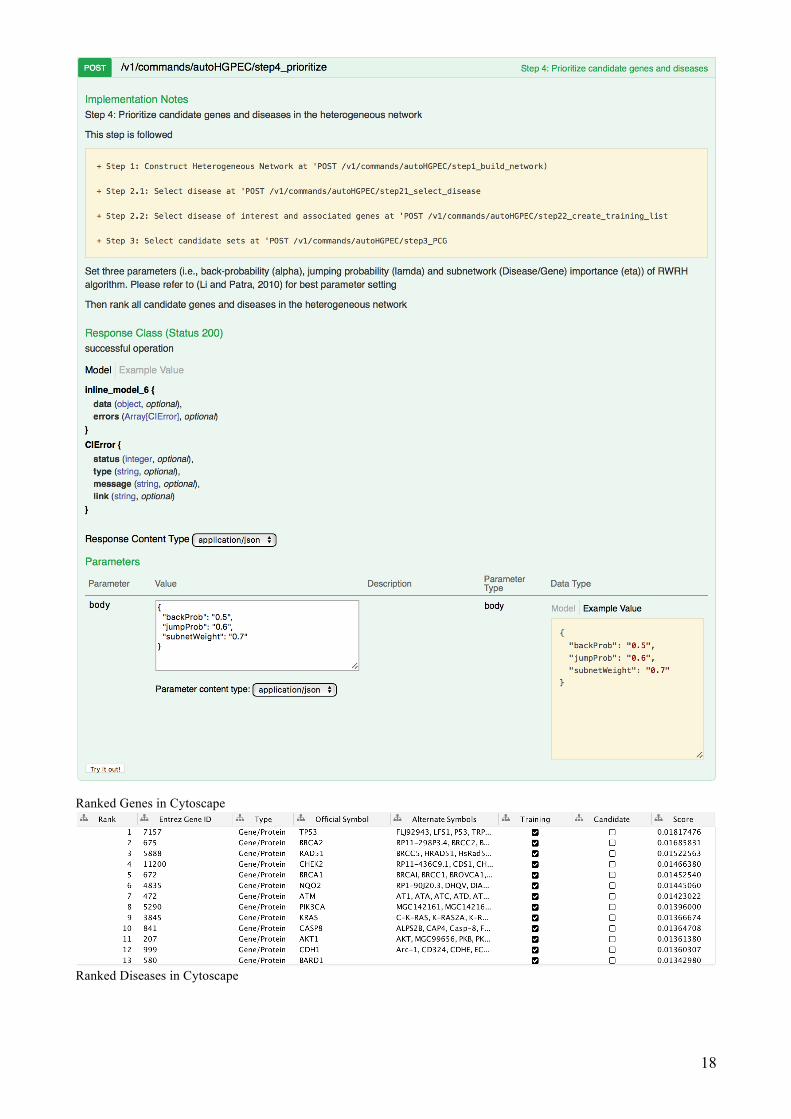
18
Ranked Genes in Cytoscape
Ranked Diseases in Cytoscape
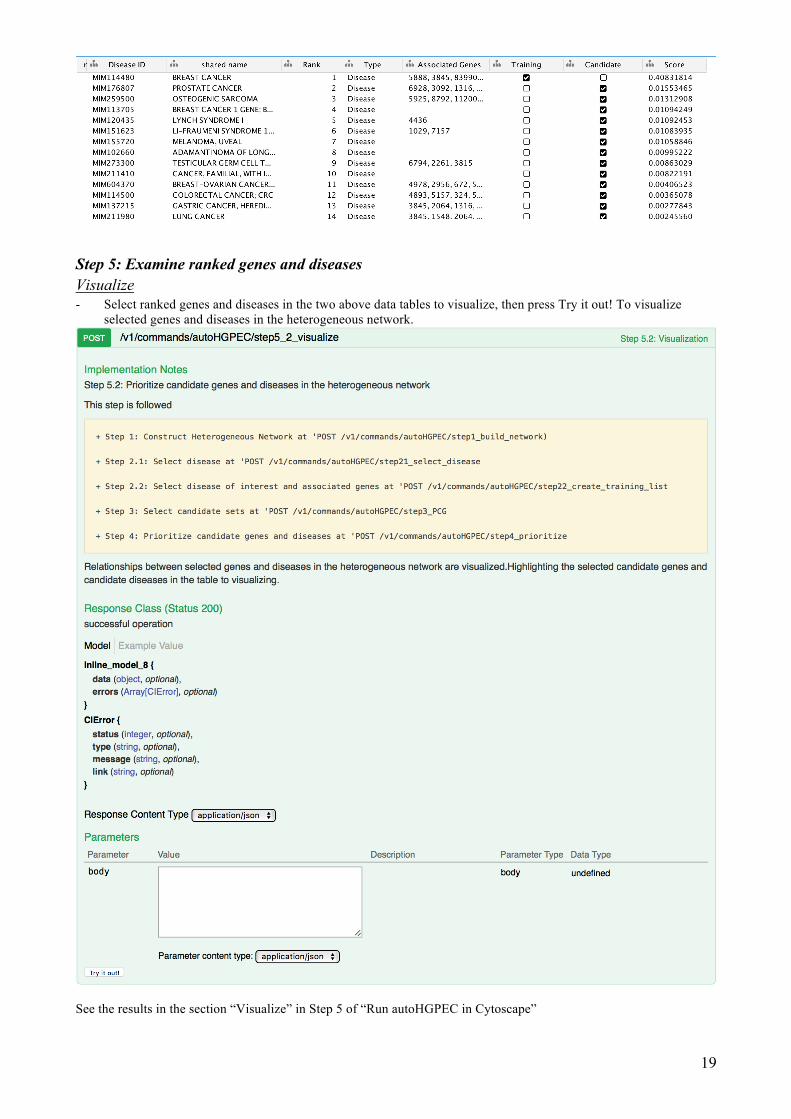
19
Step 5: Examine ranked genes and diseases Visualize - Select ranked genes and diseases in the two above data tables to visualize, then press Try it out! To visualize
selected genes and diseases in the heterogeneous network.
See the results in the section “Visualize” in Step 5 of “Run autoHGPEC in Cytoscape”
20
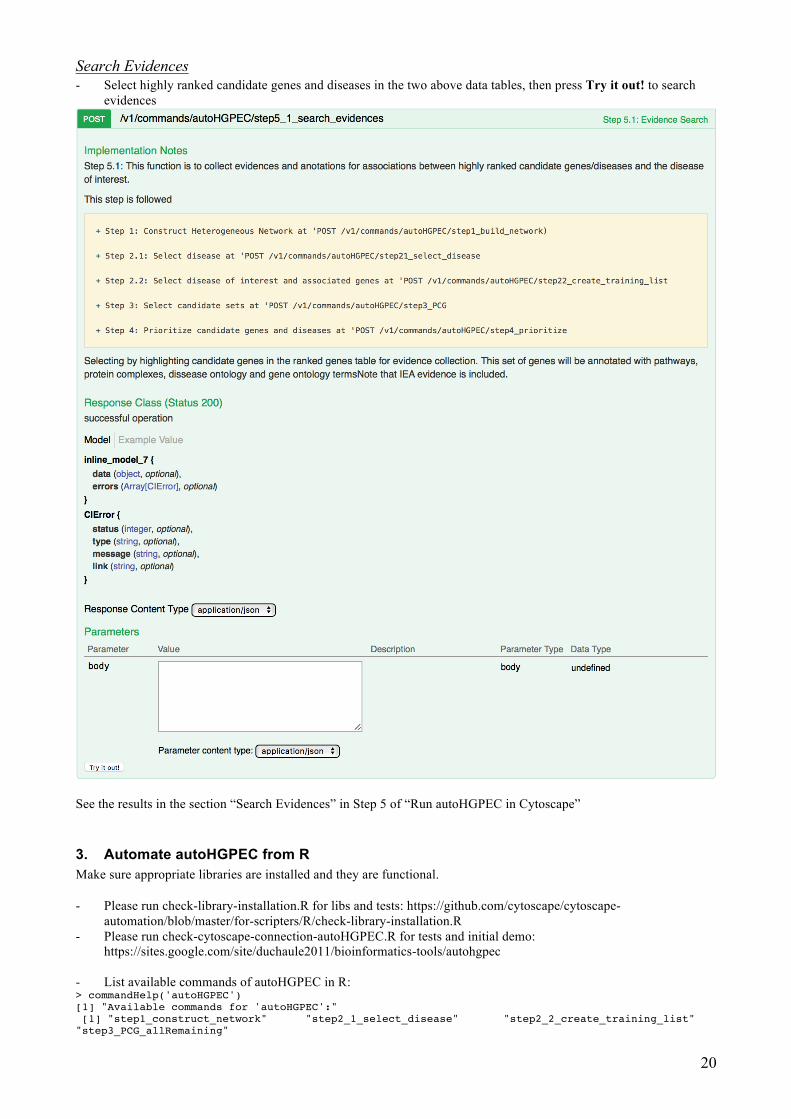
Search Evidences - Select highly ranked candidate genes and diseases in the two above data tables, then press Try it out! to search
evidences
See the results in the section “Search Evidences” in Step 5 of “Run autoHGPEC in Cytoscape”
3. Automate autoHGPEC from R Make sure appropriate libraries are installed and they are functional.
- Please run check-library-installation.R for libs and tests: https://github.com/cytoscape/cytoscape-automation/blob/master/for-scripters/R/check-library-installation.R
- Please run check-cytoscape-connection-autoHGPEC.R for tests and initial demo: https://sites.google.com/site/duchaule2011/bioinformatics-tools/autohgpec
- List available commands of autoHGPEC in R: > commandHelp('autoHGPEC') [1] "Available commands for 'autoHGPEC':" [1] "step1_construct_network" "step2_1_select_disease" "step2_2_create_training_list" "step3_PCG_allRemaining"

21
[5] "step3_PCG_NBChromosome" "step3_PCG_NBNetwork" "step3_PCG_suscepChromo" "step4_prioritize" [9] "step5_1_search_evidences" "step5_2_visualize"
To predict novel breast cancer-associated genes and diseases, we need to perform 5 following steps in R: Step 1: Construct a heterogeneous network Use command step1_construct_network to create a heterogeneous network of diseases and genes, including a phenotypic disease similarity network containing 5,080 diseases and 19,729 interactions (i.e., Disease_Similarity_Network_5), a human protein interaction network containing 10,486 genes and 50,791 interactions (i.e., Default_Human_PPI_Network) and known disease-gene associations from either OMIM (Amberger, et al., 2009). - List available arguments of command step1_construct_network of autoHGPEC in R > commandHelp('autoHGPEC step1_construct_network') [1] "Available arguments for 'autoHGPEC step1_construct_network':" [1] "DiseaseGene" "diseaseNetwork" "geneNetwork" - Run the command to build a heterogeneous network > commandRun('autoHGPEC step1_construct_network DiseaseGene="Disease-gene from OMIM" diseaseNetwork="Disease_Similarity_Network_5" geneNetwork="Default_Human_PPI_Network"') [1] "Build Heterogeneous Network successfully"
Step 2: Select a disease of interest Step 2.1: Select a disease Use command step2_1_select_disease - List available arguments of command step2_1_select_disease of autoHGPEC in R > commandHelp('autoHGPEC step2_1_select_disease') [1] "Available arguments for 'autoHGPEC step2_1_select_disease':" [1] "diseaseName" - Run the command to retrieve a list of disease phenotypes from OMIM. It will return 4 phenotypes from OMIM
related to “breast cancer” > commandRun('autoHGPEC step2_1_select_disease diseaseName="breast cancer"') Step 2.2: Create training lists Use command step2_2_create_training_list - List available arguments of command step2_2_create_training_list of autoHGPEC in R > commandHelp('autoHGPEC step2_2_create_training_list') [1] "Available arguments for 'autoHGPEC step2_2_create_training_list':" [1] "diseaseTraining"
- Run the command to retrieve a list of training genes and disease phenotypes (OMIM ID: 114480) > commandRun('autoHGPEC step2_2_create_training_list diseaseTraining="MIM114480"')
Here are the training lists include the disease of interest (OMIM ID: 114480) and its 21 known associated genes.
A total of 21 known associated genes
The disease of interest (OMIM ID: 114480)
Step 3: Select candidate sets Four ways to construct a candidate gene set: Opt Candidate Set R Commands
1 Neighbors of Training Genes in Gene Network
> commandHelp('autoHGPEC step3_PCG_NBNetwork') [1] "Available arguments for 'autoHGPEC

22
User must define distance of neighbors to training genes
step3_PCG_NBNetwork':" [1] "distance" > commandRun('autoHGPEC step3_PCG_NBNetwork distance=1')
2 Neighbors Of Training Genes in Chromosome (also known as Artificial Linkage Interval) User must define number of neighbors of each training gene in the same chromosome.
> commandHelp('autoHGPEC step3_PCG_NBChromosome') [1] "Available arguments for 'autoHGPEC step3_PCG_NBChromosome':" [1] "distance" "seedGene" > commandRun('autoHGPEC step3_PCG_NBChromosome distance=99 seedGene="All')
3 All remaining genes in Gene Network
> commandHelp('autoHGPEC step3_PCG_allRemaining') > commandRun('autoHGPEC step3_PCG_allRemaining')
4 Susceptible Chromosome Regions/Bands User selects candidate genes from susceptible chromosome regions/bands.
> commandHelp('autoHGPEC step3_PCG_suscepChromo') > commandRun('autoHGPEC step3_PCG_suscepChromo')
For this case study, we selected option 3: > commandRun('autoHGPEC step3_PCG_allRemaining') à A total of 10,465 remaining genes were selected as candidate genes
Step 4: Prioritize Use command step4_prioritize - List available arguments of command step4_prioritize of autoHGPEC in R > commandHelp('autoHGPEC step4_prioritize') [1] "Available arguments for 'autoHGPEC step4_prioritize':" [1] "backProb" "jumpProb" "subnetWeight" - Run the command with parameters to rank all genes and disease phenotypes in the heterogeneous network > commandRun('autoHGPEC step4_prioritize backProb=0.5 jumpProb=0.6 subnetWeight=0.7') Ranked Genes
Ranked Diseases

23
Step 5: Examine ranked genes and diseases Visualize - Select ranked candidate genes and diseases in the two above data tables to visualize, then use command
step5_2_visualize > commandRun('autoHGPEC step5_2_visualize') See the results in the section “Visualize” in Step 5 of “Run autoHGPEC in Cytoscape” Search Evidences - Select highly ranked candidate genes and diseases in the two above data tables to search evidences, then use
command step5_1_search_evidences > commandRun('autoHGPEC step5_1_search_evidences') See the results in the section “Search Evidences” in Step 5 of “Run autoHGPEC in Cytoscape”

24
IV. Reference Amberger, J., et al. McKusick's Online Mendelian Inheritance in Man (OMIM®). Nucleic Acids Research
2009;37(suppl 1):D793-D796. Le, D.-H. and Pham, V.-H. HGPEC: a Cytoscape app for prediction of novel disease-gene and disease-disease
associations and evidence collection based on a random walk on heterogeneous network. BMC Systems Biology 2017;11(1):61.
Li, Y. and Patra, J.C. Genome-wide inferring gene-phenotype relationship by walking on the heterogeneous network. Bioinformatics 2010;26(9):1219-1224.
Piñero, J., et al. DisGeNET: a comprehensive platform integrating information on human disease-associated genes and variants. Nucleic Acids Research 2017;45(D1):D833-D839.
van Driel, M.A., et al. A text-mining analysis of the human phenome. Eur J Hum Genet 2006;14(5):535-542.