automated assessment of computer science competencies …
TRANSCRIPT
Automated Assessment of Computer Science Competencies from Student Programs with Gaussian Process Regression
ABSTRACT Recent years have seen a growing interest in learning analytics for computer science education. The significant growth of computer science enrollments coupled with the labor-intensive nature of human assessment has fueled the demand for automated assessment of student programs. Effective automated assessment tools can bridge the gap between the demand for support and restricted instructional resources by providing adaptive formative and summative feedback. Following an evidence-centered assessment design approach, we have devised an automated assessment framework for middle grades computational thinking. We report on an evaluation comparing regression models including ridge, lasso, support vector, and Gaussian process regression models utilizing a structural n-gram feature set to infer scores for students’ programs. The results show that Gaussian process regression outperforms other regression models with respect to mean squared error and adjusted coefficient of determination. They also show that the framework provides a promising approach with regard to dealing robustly with noise to effectively model student computer science competencies.
Keywords Competency Modeling, Automated Program Assessment, Computer Science Education
1. INTRODUCTION Computer science (CS) has become a foundational skill for students to thrive in a digital economy [14, 28]. To prepare students for future studies and science and technology professions, it is essential to ensure that they acquire robust CS competencies. A key strategy for developing CS competencies is through programming. However, learning how to program is challenging for novices [12, 13]. Hence, novice programmers need significant scaffolding to support understanding and effective use of CS concepts. Effective assessment of students’ understanding of essential CS concepts is an important step in providing students with appropriate scaffolding and feedback [11, 17]. Because the growth in demand for CS education has outstripped the supply of qualified teachers, providing every student with individualized, high-quality, and
timely support and feedback is challenging. Effective automated assessment can guide adaptive formative and summative feedback to support effective CS education.
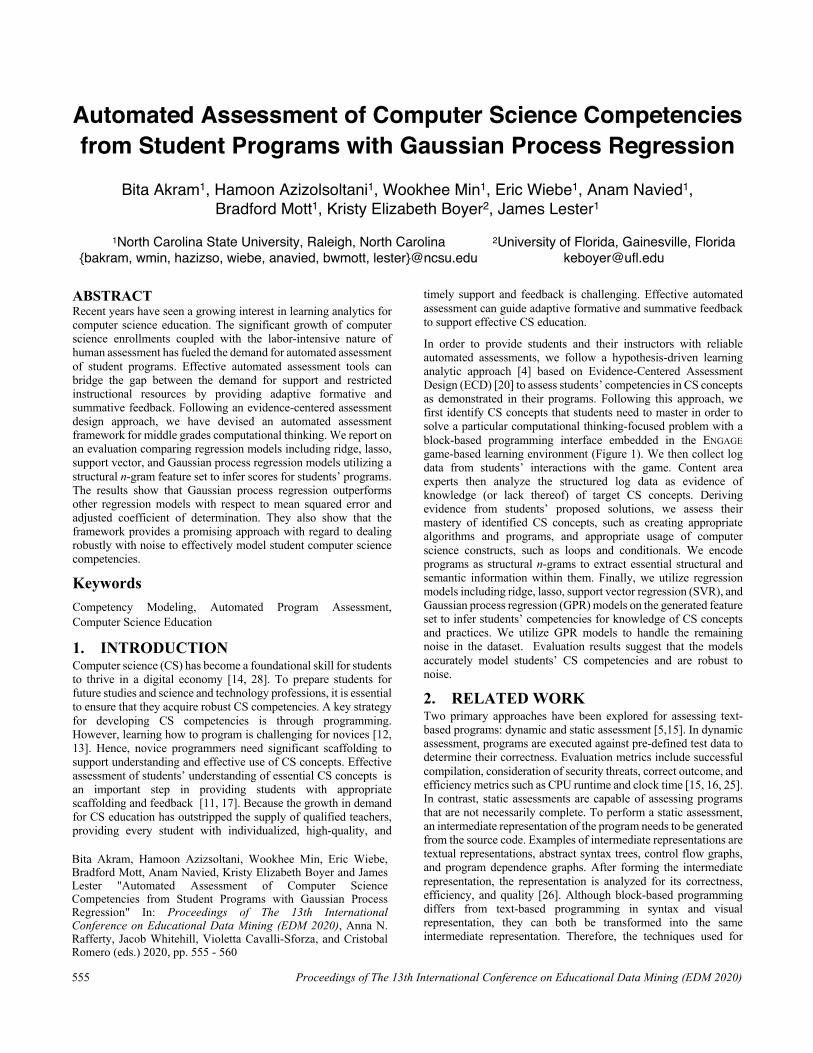
In order to provide students and their instructors with reliable automated assessments, we follow a hypothesis-driven learning analytic approach [4] based on Evidence-Centered Assessment Design (ECD) [20] to assess students’ competencies in CS concepts as demonstrated in their programs. Following this approach, we first identify CS concepts that students need to master in order to solve a particular computational thinking-focused problem with a block-based programming interface embedded in the ENGAGE game-based learning environment (Figure 1). We then collect log data from students’ interactions with the game. Content area experts then analyze the structured log data as evidence of knowledge (or lack thereof) of target CS concepts. Deriving evidence from students’ proposed solutions, we assess their mastery of identified CS concepts, such as creating appropriate algorithms and programs, and appropriate usage of computer science constructs, such as loops and conditionals. We encode programs as structural n-grams to extract essential structural and semantic information within them. Finally, we utilize regression models including ridge, lasso, support vector regression (SVR), and Gaussian process regression (GPR) models on the generated feature set to infer students’ competencies for knowledge of CS concepts and practices. We utilize GPR models to handle the remaining noise in the dataset. Evaluation results suggest that the models accurately model students’ CS competencies and are robust to noise.
2. RELATED WORK Two primary approaches have been explored for assessing text-based programs: dynamic and static assessment [5,15]. In dynamic assessment, programs are executed against pre-defined test data to determine their correctness. Evaluation metrics include successful compilation, consideration of security threats, correct outcome, and efficiency metrics such as CPU runtime and clock time [15, 16, 25]. In contrast, static assessments are capable of assessing programs that are not necessarily complete. To perform a static assessment, an intermediate representation of the program needs to be generated from the source code. Examples of intermediate representations are textual representations, abstract syntax trees, control flow graphs, and program dependence graphs. After forming the intermediate representation, the representation is analyzed for its correctness, efficiency, and quality [26]. Although block-based programming differs from text-based programming in syntax and visual representation, they can both be transformed into the same intermediate representation. Therefore, the techniques used for
Bita Akram1, Hamoon Azizolsoltani1, Wookhee Min1, Eric Wiebe1, Anam Navied1, Bradford Mott1, Kristy Elizabeth Boyer2, James Lester1
1North Carolina State University, Raleigh, North Carolina {bakram, wmin, hazizso, wiebe, anavied, bwmott, lester}@ncsu.edu
2University of Florida, Gainesville, Florida [email protected]
Bita Akram, Hamoon Azizsoltani, Wookhee Min, Eric Wiebe,Bradford Mott, Anam Navied, Kristy Elizabeth Boyer and JamesLester "Automated Assessment of Computer ScienceCompetencies from Student Programs with Gaussian ProcessRegression" In: Proceedings of The 13th InternationalConference on Educational Data Mining (EDM 2020), Anna N.Rafferty, Jacob Whitehill, Violetta Cavalli-Sforza, and CristobalRomero (eds.) 2020, pp. 555 - 560
555 Proceedings of The 13th International Conference on Educational Data Mining (EDM 2020)

assessing one type of programming from this representation can be readily adapted to assess the other type of programming [9, 10].
Limited previous work has focused on assessing students’ understanding of underlying CS concepts from their programs. In this paper, we propose an automated assessment framework designed following a hypothesis-driven learning analytics approach to assess students’ programs based on their mastery of underlying CS concepts for the particular problem at hand. We use the underlying CS concepts to label students’ programs with their grades. We then transform students’ programs to a feature set containing salient features that can serve as evidence for students’ proficiency of this underlying CS concepts. Utilizing the labeled data and the extracted feature set predictive models can identify students’ mastery of CS concepts.
3. ENGAGE LEARNING ENVIRONMENT To collect data on middle grade students’ programming trajectories, we conducted a study with a game-based learning environment, ENGAGE, that is designed to teach CS to middle school students [2, 18]. The game features a rich, immersive 3D storyworld (Figure 1), in which students play the role of a specialist who is sent to investigate an underwater research facility that has lost communication with the outside world through suspicious activities of a rogue scientist. In the learning environment, students navigate through a series of interconnected rooms by solving a set of computational challenges. Each of the challenges can be solved either by programming devices within the room or interacting with devices in reference to their pre-written programs. Students program the devices with a visual block-based programming language interface (Figure 1, Right) [1, 19].
In this work, we focus on students’ problem-solving approaches within a specific level of the game where students write a bubble sort algorithm to order a set of containers (Figure 1). This room has two devices: a containment device that holds six randomly positioned containers and a lock device that opens only when the containers are sorted in the increasing order. The player can exit the room through a door by correctly implementing bubble sort and executing the lock program when the containers are sorted. The lock has a pre-written program that will check the positions of containers and opens if they are in the correct position. The containment device provides students with the necessary blocks for implementing a bubble sort algorithm using a small robotic cart inside the device’s protective housing. Students can choose from 6
types of readily available blocks to write their program. A sample correct solution for this challenge is shown in Figure 1 (right). Students need to test the correctness of their program in two steps. First, they need to run the bubble sort device to sort the containers. Second, they need to run the open lock program which checks if the containers are sorted and opens the door accordingly.
4. METHODOLOGY We utilize supervised learning to assess students’ programs. The supervised learning approach consists of three primary steps. First, we label the training dataset in accordance with a rubric designed based on essential CS constructs. Second, we extract features from students’ submitted program snapshots that represent their understanding of CS constructs. This is accomplished with a novel approach that encodes students’ programs in terms of structural n-grams. Third, we create models induced from the structural n-gram-based feature set to infer students’ scores. In this study, we utilize a variety of regression models including linear, ridge, lasso, SVR, and GPR models to predict students’ programs’ scores.
4.1 Data Annotation We use evidence-centered assessment design (ECD) to create a rubric for labeling students’ programs [22]. Following an ECD approach, we identify explicit learning outcomes and measures to inform our rubric [7]. The relevant CS concepts are identified and used to develop the specifications of a rubric to assess students’ proficiency of identified CS concepts. Student actions during the learning task are used as evidence for predicting mastery of the identified CS concepts [24]. Following this approach, we design a rubric that utilizes evidence rules specific to the bubble sort challenge in the ENGAGE game-based learning environment. We use this rubric to manually label students’ programs [3, 4].
As students interacted with the learning environment, all of their interactions with the game were logged. For this study, we collected data from five classrooms across three schools in the United States. We collected data from 69 students’ interactions with the bubble sort challenge in the game-based learning environment, for a total of 1,570 programs that we used as the training dataset. In this rubric, the range of possible scores is between 0 to 22. To validate the labeling process, two human annotators with a computer science background separately labeled 20% of the entire submissions, achieving an inter-rater agreement of 0.856 using Cohen’s kappa [8]. Before tagging the remainder of the corpus, all instances that were tagged differently were discussed. Afterwards,
Figure 1. ENGAGE game-based learning environment. (Left) The bubble sort task in the game-based learning environment. (Right) Program for the bubble sort task: the read-only code for opening the door and an example of a correct implementation of the bubble sort written by a student.
Proceedings of The 13th International Conference on Educational Data Mining (EDM 2020) 556

one annotator tagged the remainder of the dataset. The annotated dataset is used as the corpus for our prediction task where the assigned scores serve as the ground-truth for our data corpus.
4.2 Feature Engineering In order to infer students’ scores based on their submitted programs, we extract structural features that are representative of the semantic information in students’ code. To extract features that capture essential structural and semantic information stored within the programs, we perform a structural n-gram encoding of the programs’ abstract syntax trees (ASTs). Since the programs are stored as programming snapshots, we first apply an intermediate transformation from programming snapshots to their corresponding ASTs [23]. We then encode the generated ASTs into their corresponding structural n-grams. After generating the ASTs from their corresponding programs, we use a structural n-gram encoding to capture essential structural information characterized within the programs. Two important structural information types in ASTs are hierarchical and ordinal. The hierarchical information encodes what blocks are nested under another (i.e., a vertical relationship in AST), and the ordinal information encodes the placement order of blocks (i.e., horizontal relationship in AST) that are nested under the same parent node. We extract n-grams with varying lengths of n to capture the most fine-grained structural information present in an AST. We repeat the n-gram encoding process separately for hierarchical feature extraction and ordinal feature extraction. We then merge the two feature sets together to build the final feature set containing both hierarchical and ordinal n-gram encodings corresponding to each program keeping only one copy of the generated unigrams. The occurrence of similar n-grams for n values more than one (unigrams) in both hierarchical and vertical encodings demonstrate presence of different structures in in the AST and thus, both will be preserved.
Figure 2 shows an AST generated from a sample program along with its partial hierarchical (left) and ordinal (right) n-gram encoding. In Figure 2 (left), each colored circle shows the hierarchical (top to bottom) n-gram encoding of a specific n. In this example, we have hierarchical encoding of n-grams of size one (green ovals), two (blue ovals) and three (the purple ovals). The frequency values for each n-gram encoded feature are shown beside the AST. All of the other n-gram feature values are zero since they are not in this AST. Figure 2 (right) shows the same sample AST with its ordinal (left to right) n-gram encoding. In this example, we
have an ordinal encoding of n-grams of size one (pink ovals), two (purple ovals) and three (the green ovals). Similar to Figure 2 (left), the frequency values for each n-gram feature is shown besides its corresponding AST in Figure 2 (right).
4.3 Inferring Program Scores We trained a variety of regression models on the structural n-gram-encoded features to infer the scores of students’ programs. In particular, we used linear regression as the baseline regression model, and four additional regression models: ridge, lasso, support SVR, GPR models. Ridge and lasso regressions are characterized by their utilization of L1 and L2 regularization, respectively, which address overfitting and variance issues in comparison to linear regression. We use SVR and GPR models since their utilization of kernels makes them a suitable candidate for datasets similar to ours where the number of features is relatively high compared to the number of data points. Finally, we utilize GPR to handle the noise resulting from the subjective nature of human grading [6, 27]. To infer students’ program grades using the n-gram encoded feature set (we set the maximum n to 4 for hierarchical n-grams and 3 for ordinal n-grams in this work), we use a 5-fold cross-validation approach to tune the hyperparameters of ridge, lasso, and SVR regressions, and to identify the appropriate kernel for the GPR. After the hyperparameter optimization process is complete, we use 10-fold cross-validation to train and evaluate each regression model.
4.3.1 Linear Regression Linear regression is a simple regression approach that works under the assumption that there is a linear relationship between features and the predicted value. The results of applying a 10-fold cross-validation evaluation on the n-gram encoded feature set resulted in a Mean Squared Error (MSE) of 3.03E+24 and an R-squared of 1.19E-23. The high MSE value reported by the linear model trained with our feature set is understandable since the high number of features in our dataset dramatically increases the complexity of the model, which in turn causes overfitting of linear regression-based predictive models to the training data.
4.3.2 Ridge Regression To reduce the variance error, ridge regression includes a penalty term in the optimization. We used the set [0.05, 0.1, 0.5, 1.0, 10] to tune the value for l, the penalty coefficient, and found l=10 to be
Figure 2: AST generated from a sample program submitted for the bubble sort challenge and its hierarchical and ordinal n-gram encoding. (Left) An AST and its partial hierarchical unigrams, bigrams, and 3-grams marked by green, blue and purple ovals respectively on the left and the partial feature set generated from hierarchical n-gram encoding of the AST along with feature-level frequencies on the right. (Right) An AST and its ordinal unigrams, bigrams, and 3-grams marked by green, blue and purple ovals respectively on the left and the partial feature set generated from partial ordinal n-gram encoding of the AST along with feature-level frequencies on the right.
557 Proceedings of The 13th International Conference on Educational Data Mining (EDM 2020)

the best value for our regression task. Applying ridge regression on our dataset resulted in an MSE of 5.24 and an R-squared of 0.81. We can see that ridge regression considerably outperformed standard linear regression with respect to both MSE and R-squared.
4.3.3 Lasso Regression Unlike ridge regression, lasso regression includes a penalty term that allows the optimization process to shrink weights to zero if necessary. As a result, lasso regression can reduce overfitting as well as perform feature selection. We used the set [0.05, 0.1, 0.5, 1.0, 10] as in ridge regression to tune the value for l and found l=0.05 to be the best value for l. Utilizing lasso regression resulted in an MSE of 6.30 and an R-squared of 0.77, which also outperformed standard linear regression models with respect to both MSE and R-squared.
4.3.4 Support Vector Regression Support vector regression (SVR) use kernels to transform data from a non-linearly separable space to a linearly separable space. For our regression task, we explored with linear, polynomial, and radial basis function (RBF) kernels. For each kernel, we tuned the hyperparameters of penalty parameter (C), epsilon, and kernel coefficient (gamma). For polynomial kernels, we also tuned the parameter of the kernel projection (coef0) and degree hyperparameters. Utilizing 5-fold cross-validation, we found the polynomial kernel with a degree of four to be the best kernel for our dataset. Also, the grid search identified C=100, coef0=1, degree= 4, epsilon=1, and gamma= 0.001 as the best parameters for this kernel. Incorporating the SVR model resulted in an MSE of 5.09 and an R-squared of 0.82. SVR performed better than both ridge and lasso regressions in terms of MSE and R-squared. This could be due to the fact that kernel methods perform effectively on datasets with a feature set that is relatively large compared to the size of the dataset.
4.3.5 Gaussian Process Regression GPRs provide an analytically tractable solution for regression problems with an infinite or uncountable set of considered basis functions [21]. We hypothesize that the GPR will outperform other regression techniques due to its capability of handling noise and its propriety for our dataset. To search the optimal kernel for GPR models, we cross-validated the model for radial basis functions (RBF), rational quadratic, and Matern kernels, and we found RBF to perform the best on our dataset. To find the optimal set of hyperparameters and prior parameters of the GPR, we follow the process of maximizing the probability of observing data given hyperparameters of the process (i.e., marginal likelihood). In this work, we use a limited-memory BFGS optimization technique to maximize the log marginal likelihood conditioned on the length vectors and the noise level of the kernels.
Applying GPR resulted in an MSE of 1.71, and an R-squared of 0.94. GPR performed significantly better than other regression models. Not only is GPR a kernel-based model similar to SVR, but by adding an additional noise kernel it can also account for the potential noise in our dataset. As a result, it is expected that the GPR model outperformed other models in our prediction task. Results of applying each of the regression models on the structural n-gram encoded feature set is shown in Table 1.
Table 1. Average predictive performance of regression models trained with the structural n-gram feature set
Regression MSE R2
Linear 3.03E+24 1.19E-23
Ridge 5.24 0.81
Lasso 6.30 0.77
SVR 5.09 0.82
GPR 1.71 0.94
5. CONCLUSION Rapidly growing interest in computer science education and students’ need for guided practice of CS concepts have created a significant need for accurate and effective automated assessment. In this work, we proposed a novel structural n-gram encoding scheme to extract important structural and semantic information from students’ programs. The n-gram encoding approach, coupled with data labeled using the ECD-based rubric enables our assessment framework to model evidence from programs that are representative of students’ mastery of identified CS. We apply a variety of regression models on the n-gram encoded feature set to infer students’ program scores. The results of our prediction demonstrate the effectiveness of the n-gram encoded feature set in capturing important semantic and structural information in students’ programs. All regression models performed better than the baseline model, linear regression. Furthermore, GPR outperformed other models in terms of both mean squared and R-Squared errors. This confirms expectations since GPR models can handle noisy data and are particularly efficient for datasets in which the number of features is particularly high relative to the number of data points. Our automated CS competency assessment framework can be generalized to assess any well-structured programs in learning environments that present students with well-structured programming assignments. Furthermore, the ECD approach can facilitate rubric design and assessment for non-expert CS teachers while providing them with automated assessment of students’ programs.
Several directions for future work are promising. First, it will be important to expand the assessment framework to accommodate more open-ended programming assignments. Second, information from successive submission of students can be extracted to analyze students’ patterns of developing CS competencies.
6. ACKNOWLEDGMENTS This research was supported by the National Science Foundation under Grants DRL-1640141. Any opinions, findings, and conclusions expressed in this material are those of the authors and do not necessarily reflect the views of the National Science Foundation.
Proceedings of The 13th International Conference on Educational Data Mining (EDM 2020) 558

7. REFERENCES [1] Akram, B. 2019. Assessment of Students’ Computer
Science Focal Knowledge, Skills, and Abilities in Game-Based Learning Environments. Ph.D. Dissertation. North Carolina State University, Raleigh, NC.
[2] Akram, B., Min, W., Wiebe, E., Mott, B., Boyer, K., and Lester, J. 2018. Improving Stealth Assessment in Game-based Learning with LSTM-based Analytics. In Proceedings of the 11th International Conference on Educational Data Mining, 208–218.
[3] Akram, B., Min, W., Wiebe, E., Mott, B., Boyer, K., and Lester, J. 2019. Assessing Middle School Students’ Computational Thinking Through Programming Trajectory Analysis. In Proceedings of the 50th ACM Technical Symposium on Computer Science Education, 1269–1269.
[4] Akram, B., Min, W., Wiebe, E., Navied, A., Mott, B., Boyer, K., and Lester, J. 2020. A conceptual assessment framework for k-12 computer science rubric design. In Proceedings of the 51th ACM Technical Symposium on Computer Science Education, 1328.
[5] Ala-Mutka, K. 2005. A Survey of Automated Assessment Approaches for Programming Assignments. Computer Science Education 15, 2, 83–102.
[6] Amershi, S. and Conati, C. 2009. Combining Unsupervised and Supervised Classification to Build User Models for Exploratory Learning Environments. Journal of Educational Data Mining, Article 1, 1, 18–71.
[7] Brennan, K., and Resnick, M. 2012. New frameworks for studying and assessing the development of computational thinking. Annual American Educational Research Association meeting, Vancouver, BC, Canada, 1–25.
[8] Cohen, J. 1960. A Coefficient of Agreement for Nominal Scales. Educational and Psychological Measurement 20, 1, 37–46.
[9] Emerson, A., Rodríguez, F., Mott, B., Smith, A., Min, W., Boyer, K., Smith. C., Wiebe, E., and Lester, J. 2019. Predicting Early and Often: Predictive Student Modeling for Block-Based Programming Environments. In Proceedings of the 12th Conference on Educational Data Mining, 39–48.
[10] Emerson, A., Smith, A., Rodriguez, F., Wiebe, E., Mott, B., Boyer, K., and Lester, C. 2020. Cluster-based analysis of novice coding misconceptions in block-based programming. In Proceedings of the 51st ACM Technical Symposium on Computer Science Education, 825–831.
[11] Fields, D., Giang, M., and Kafai, Y. 2014. Programming in the wild: trends in youth computational participation in the online scratch community. In Proceedings of the 9th workshop in primary and secondary computing education, ACM, 2–11.
[12] Grover, S., and Basu, S. 2017. Measuring Student Learning in Introductory Block-Based Programming. In Proceedings of the 48th ACM SIGCSE Technical Symposium on Computer Science Education, 267–272.
[13] Grover, S., Basu, S., Bienkowski, M., Eagle, M., Diana, N., and Stamper, J. 2017. A Framework for Using Hypothesis-Driven Approaches to Support Data-Driven Learning Analytics in Measuring Computational Thinking in Block-Based Programming Environments.
ACM Transactions on Computing Education 17, 3, 14. [14] Hansen, A., Dwyer, H., Iveland, A., Talesfore, M.,
Wright, L., Harlow, D., and Franklin, D. 2017. Assessing Children’s Understanding of the Work of Computer Scientists: The Draw-a-Computer-Scientist Test. In Proceedings of the 48th ACM SIGCSE technical symposium on computer science education, 279–284.
[15] Ihantola, P., Ahoniemi, T., Karavirta, V., and Seppälä, O. 2010. Review of Recent Systems for Automatic Assessment of Programming Assignments. In Proceedings of the 10th Koli calling international conference on computing education research, 86–93.
[16] Lajis, A., Baharudin, S., Kadir, D., Ralim, N., Nasir, H., and Aziz, N. 2018. A Review of Techniques in Automatic Programming Assessment for Practical Skill Test. Journal of Telecommunication, Electronic and Computer Engineering 10, 2, 109–113.
[17] Meerbaum-Salant, O., Armoni, M., and Ben-Ario, M. 2013. Learning computer science concepts with scratch. Computer Science Education 23, 3, 239–364.
[18] Min, W., Frankosky, M., Mott, B., Rowe, J., Wiebe, E., Boyer, K., and Lester, J. 2015. DeepStealth: Leveraging Deep Learning Models for Stealth Assessment in Game-based Learning Environments. In Proceedings of the 17th International Conference on Artificial Intelligence in Education, 277–286.
[19] Min, W., Frankosky, M., Mott, B., Wiebe, E., Boyer, K., and Lester, J. 2017. Inducing Stealth Assessors from Game Interaction Data. In Proceedings of the 19th International Conference on Artificial Intelligence in Education, 212–223.
[20] Mislevy, R., Haertel, G., Riconscente, M., Rutstein, D., and Ziker, C. 2017. Evidence-Centered Assessment Design. In Assessing Model-Based Reasoning using Evidence- Centered Design. SpringerBriefs in Statistics, 19–24.
[21] Rasmussen, C.. 2004. Gaussian Processes in machine learning. Lecture Notes in Computer Science (including subseries Lecture Notes in Artificial Intelligence and Lecture Notes in Bioinformatics), 63–71.
[22] Rupp, A, Pearson, K., Sweet, S., Crawford, A., Levy, I., Fay, D., Kunze, K., Cisco, M., Mislevy, R., and Pearson, J. 2012. Putting ECD into Practice: The Interplay of Theory and Data in Evidence Models within a Digital Learning Environment. Journal of Educational Data Mining 4, 1 , 49–110.
[23] Shamsi, F., and Elnagar, A. 2012. An Intelligent Assessment Tool for Students’ Java Submissions in Introductory Programming Courses. Journal of Intelligent Learning Systems and Applications 04, 01 , 59–69.
[24] Snow, E., Haertel, G., Fulkerson, D. and Feng, M. 2010. Leveraging evidence-centered assessment design in large-scale and formative assessment practices. In Proceedings of the 2010 Annual Meeting of the National Council on Measurement in Education (NCME).
[25] Taherkhani, A., and Malmi, L. 2013. Beacon- and Schema-Based Method for Recognizing Algorithms from Students’ Source Code. Journal of Educational Data Mining 5, 2, 69–101.
[26] Wang, T., Su, X., Wang, Y., and Ma, P. 2007. Semantic
559 Proceedings of The 13th International Conference on Educational Data Mining (EDM 2020)

similarity-based grading of student programs. Information and Software Technology 49, 2, 99–107.
[27] Zen, K., Iskandar, D,. and Linang O. 2011. Using Latent Semantic Analysis for automated grading programming assignments. In International Conference on Semantic Technology and Information Retrieval, 82–88.
[28] 2016. K-12 Computer Science Framework. Retrieved August 25, 2018 from http://www.k12cs.org.
Proceedings of The 13th International Conference on Educational Data Mining (EDM 2020) 560