automated classification of causes of mortality
TRANSCRIPT
Automated Classification of Causes of Mortality
Francisco Ribeiro Duarte
Thesis to obtain the Master of Science Degree in
Biomedical Engineering
Supervisor(s): Prof. Mário Jorge Costa Gaspar da SilvaProf. Bruno Emanuel da Graça Martins
Examination Committee
Chairperson: Prof. Maria Margarida Campos da SilveiraSupervisor: Prof. Bruno Emanuel da Graça Martins
Member of the Committee: Prof. Arlindo Manuel Limede de Oliveira
October 2017

ii

Acknowledgments
First of all, I would like to express my sincere gratitude to Professor Bruno Martins and Professor Mario
Silva for the countless hours of meetings and e-mails exchanged. Also, I would like to thank Dra. Catia
Sousa Pinto, for the constant follow-ups and help throughout every stage of this work. I learned a lot in
the past months thanks to their vast knowledge and willingness to mentor my work.
I also express my thanks to INESC-ID and to the Direccao-Geral da Saude, specially the Division
of Epidemiology and Surveillance for how warmly I was welcomed, I would like to thank Paula Vicencio
and Lurdes Morgado for their never-ending kindness and readiness to help.
Every ship needs a captain and I would like to thank mine. Margarida was the best support I could
ask for with her superhuman ability to pass on strength, serenity and something to laugh about.
Every ship also needs a port and I would like to thank my family for always being present whenever
I needed, and so understanding every time I was late for dinner. I am very grateful for being surrounded
by nothing but positivism and an overwhelming affection.
Finally, every ship needs a crew, and I would like to thank my friends, who have the amazing capability
of turning even the most stressful moment into something we can now remember with joy. I strongly
believe that you were involved in every single achievement of the past years.
iii

iv
Resumo
Neste trabalho, e abordada a atribuicao automatica de codigos CID-10 para causas de morte atraves
da analise de descricoes em texto-livre de certificados de obito, relatorios de autopsia e boletins de
informacao clınica da Direcao-Geral da Saude. A atribuicao e feita atraves de uma rede neuronal artifi-
cial que combina word embeddings, unidades recorrentes e atencao neuronal como mecanismos para
gerar as representacoes intermedias dos conteudos textuais. A rede neuronal proposta explora ainda
a natureza hierarquica dos dados utilizados, ao criar representacoes das sequencias de palavras den-
tro de cada campo dos certificados para posteriormente as combinar de acordo com a sequencia de
campos que constituem os dados. Alem disso, sao explorados mecanismos inovadores para inicializar
os pesos das unidades neuronais finais da rede, potenciando a informacao de coocorrencias entre
classes e a estrutura hierarquica do sistema de classificacao CID-10. Os resultados experimentais con-
firmam o contributo dos diferentes componentes da rede neuronal. O melhor modelo atinge valores de
exatidao de 89%, 81% e 76% para os capıtulos, blocos e codigos de quatro dıgitos da CID-10, respeti-
vamente. Atraves de exemplos, e tambem demonstrado como o metodo proposto produz resultados
interpretaveis, uteis para aplicacao em vigilancia de saude publica.
Palavras-chave: Codificacao CID automatica, Prospeccao de Texto, Aprendizagem com
Redes Profundas, Processamento de Linguagem Natural, Inteligencia Artifical na Medicina
v

vi

Abstract
This work addresses the automatic assignment of ICD-10 codes for causes of death by analyzing free-
text descriptions in death certificates, together with the associated autopsy reports and clinical bulletins,
from the Portuguese Ministry of Health. The proposed method leverages a deep neural network that
combines word embeddings, recurrent units, and neural attention as mechanisms for the generation of
intermediate representations of the textual contents. The neural network also explores the hierarchical
nature of the input data, by building representations from the sequences of words within individual fields,
which are then combined according to the sequences of fields that compose the input. Moreover, inno-
vative mechanisms for initializing the weights of the final nodes of the network are explored, leveraging
co-occurrences between classes together with the hierarchical structure of ICD-10. Experimental results
attest to the contribution of the different neural network components. The best model achieves accuracy
scores over 89%, 81%, and 76%, respectively for ICD-10 chapters, blocks, and full-codes. Through ex-
amples, this document also shows that the proposed method can produce interpretable results, useful
for public health surveillance.
Keywords: Automated ICD Coding, Clinical Text Mining, Deep Learning, Natural Language
Processing, Artificial Intelligence in Medicine
vii

viii

Contents
Acknowledgments . . . . . . . . . . . . . . . . . . . . . . . . . . . . . . . . . . . . . . . . . . . iii
Resumo . . . . . . . . . . . . . . . . . . . . . . . . . . . . . . . . . . . . . . . . . . . . . . . . . v
Abstract . . . . . . . . . . . . . . . . . . . . . . . . . . . . . . . . . . . . . . . . . . . . . . . . . vii
List of Tables . . . . . . . . . . . . . . . . . . . . . . . . . . . . . . . . . . . . . . . . . . . . . . xi
List of Figures . . . . . . . . . . . . . . . . . . . . . . . . . . . . . . . . . . . . . . . . . . . . . xiii
1 Introduction 1
1.1 Objectives . . . . . . . . . . . . . . . . . . . . . . . . . . . . . . . . . . . . . . . . . . . . . 3
1.2 Methodology . . . . . . . . . . . . . . . . . . . . . . . . . . . . . . . . . . . . . . . . . . . 3
1.3 Results and Contributions . . . . . . . . . . . . . . . . . . . . . . . . . . . . . . . . . . . . 5
1.4 Thesis Outline . . . . . . . . . . . . . . . . . . . . . . . . . . . . . . . . . . . . . . . . . . 6
2 Concepts and Related Work 9
2.1 Public Health Surveillance . . . . . . . . . . . . . . . . . . . . . . . . . . . . . . . . . . . . 9
2.2 Mortality Surveillance within DGS with the SICO/eVM Systems . . . . . . . . . . . . . . . 10
2.3 The ICD-10 Classification System . . . . . . . . . . . . . . . . . . . . . . . . . . . . . . . 12
2.4 Artificial Neural Networks . . . . . . . . . . . . . . . . . . . . . . . . . . . . . . . . . . . . 14
2.5 Automatic Classification of General Clinical Text . . . . . . . . . . . . . . . . . . . . . . . . 16
2.6 Automatic Classification of Death Certificates . . . . . . . . . . . . . . . . . . . . . . . . . 18
2.7 Overview . . . . . . . . . . . . . . . . . . . . . . . . . . . . . . . . . . . . . . . . . . . . . 21
3 The Deep Neural Model for ICD-10 Coding 23
3.1 A Hierarchical Attention Model Combined with the Average of the Embeddings . . . . . . 24
3.2 Initializing the Weights of the Output Nodes through Label Co-Occurrence . . . . . . . . . 26
3.3 Integration of the Classifier with SICO . . . . . . . . . . . . . . . . . . . . . . . . . . . . . 27
3.4 Summary . . . . . . . . . . . . . . . . . . . . . . . . . . . . . . . . . . . . . . . . . . . . . 29
4 Experimental Evaluation 31
4.1 Dataset and Experimental Methodology . . . . . . . . . . . . . . . . . . . . . . . . . . . . 31
4.2 Experimental Results using a Test Sample from 2013-2015 . . . . . . . . . . . . . . . . . 34
4.3 Experimental Results using 2016 Data . . . . . . . . . . . . . . . . . . . . . . . . . . . . . 40
4.4 Interpreting Results by Visualizing the Attention Weights . . . . . . . . . . . . . . . . . . . 42
ix

4.5 Analysis of the Integration with SICO . . . . . . . . . . . . . . . . . . . . . . . . . . . . . . 43
4.6 Summary . . . . . . . . . . . . . . . . . . . . . . . . . . . . . . . . . . . . . . . . . . . . . 46
5 Conclusions 49
5.1 Contributions . . . . . . . . . . . . . . . . . . . . . . . . . . . . . . . . . . . . . . . . . . . 49
5.2 Future Work . . . . . . . . . . . . . . . . . . . . . . . . . . . . . . . . . . . . . . . . . . . . 50
Bibliography 53
x

List of Tables
2.1 Titles of the ICD-10 chapters and corresponding range of blocks. . . . . . . . . . . . . . . 13
2.2 Summary of the related work using general clinical text . . . . . . . . . . . . . . . . . . . 19
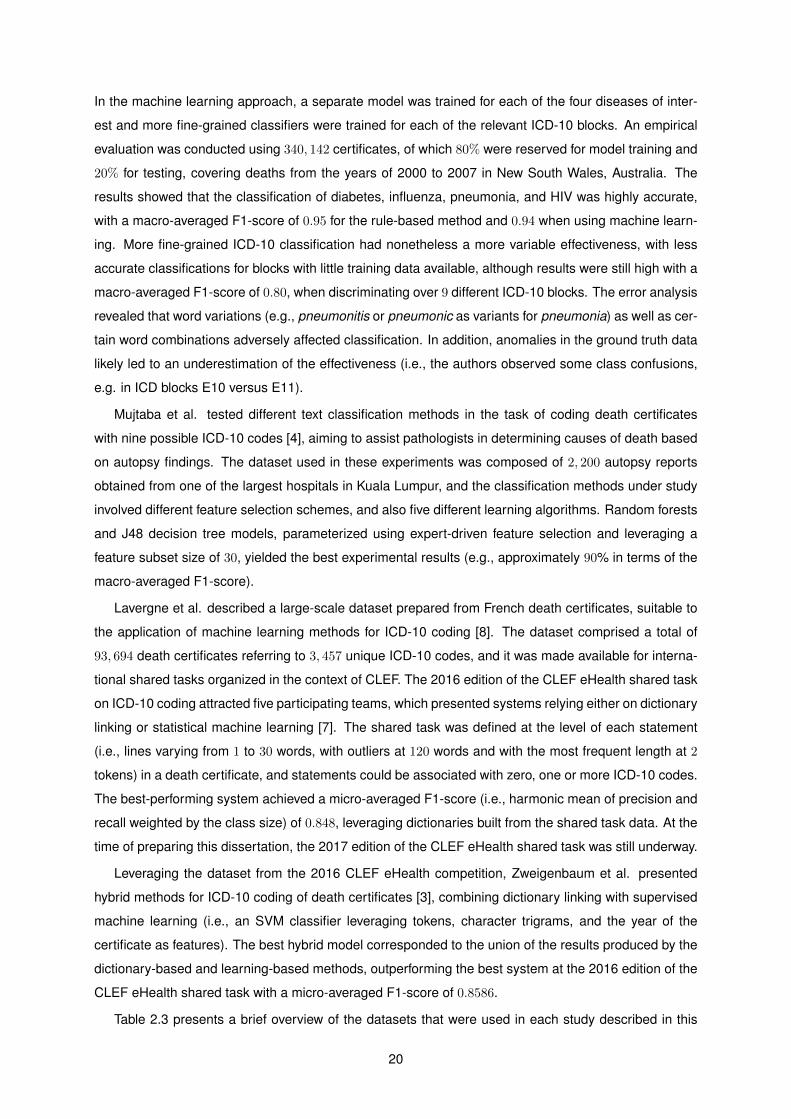
2.3 Summary of the related work using death certificates or autopsy reports. . . . . . . . . . 21
4.1 Statistical characterization of the main dataset used in the experiments. . . . . . . . . . . 32
4.2 Performance metrics for different variants of the neural model. . . . . . . . . . . . . . . . 35
4.3 Number of instances and obtained results for each of the ICD-10 chapters. . . . . . . . . 36
4.4 Results for blocks and full-codes within ICD-10 Chapters II and IX. . . . . . . . . . . . . . 36
4.5 Results for the 10 most common ICD-10 codes in the dataset. . . . . . . . . . . . . . . . . 37
4.6 Performance metrics for test instances associated with an autopsy report. . . . . . . . . . 38
4.7 Performance metrics over the 2016 dataset. . . . . . . . . . . . . . . . . . . . . . . . . . . 40
4.8 Performance of the integration between the SICO database and the model. . . . . . . . . 45
xi

xii
List of Figures
1.1 The form used in Portugal for death certificates registration and for entering ICD-10 codes. 2
2.1 Layout of the eVM Daily Mortality Surveillance tab . . . . . . . . . . . . . . . . . . . . . . 11
3.1 The proposed neural network architecture. . . . . . . . . . . . . . . . . . . . . . . . . . . 24
3.2 Workflow between the SICO Database and two Python Scripts. . . . . . . . . . . . . . . . 28
4.1 Number of occurrences of the 50 most common ICD-10 codes in the dataset. . . . . . . . 33
4.2 Micro and Macro Averaged ROC Curve for Blocks of Chapter IX . . . . . . . . . . . . . . 39
4.3 Micro and Macro Averaged ROC Curve for Blocks of Chapter X . . . . . . . . . . . . . . . 39
4.4 Percentage of weekly deaths in 2016 for ICD-10 blocks I20-I25. . . . . . . . . . . . . . . . 41
4.5 Percentage of weekly deaths in 2016 for ICD-10 blocks I60-I69. . . . . . . . . . . . . . . . 41
4.6 Percentage of weekly deaths in 2016 for ICD-10 blocks J09-J18. . . . . . . . . . . . . . . 41
4.7 Percentage of weekly deaths in 2016 for ICD-10 blocks J95-J99. . . . . . . . . . . . . . . 42
4.8 Percentage of weekly deaths in 2016 for ICD-10 blocks C00-C97. . . . . . . . . . . . . . . 42
4.9 Distribution of attention weights given to different sentences and tokens in two instances. 43
4.10 Distribution of attention weights given to tokens AVC, demencia, neoplasia and pneumonia. 44
4.11 Layout of the eVM for Daily Mortality Surveillance per Cause tab . . . . . . . . . . . . . . 46
4.12 Layout detail of the eVM for Daily Mortality Surveillance per Cause tab . . . . . . . . . . . 46
4.13 Layout of the eVM integrated with a method of automated cause of death classification. . 47
xiii

xiv

Chapter 1
Introduction
The systematic collection of high-quality mortality data is essential for monitoring a population’s health,
and is also a basis for a number of health and epidemiologic studies. For these and other purposes,
namely legal, doctors have to write death certificates, i.e. reports containing personal data of the de-
ceased and textual descriptions for the causes of death, as well as any contributing conditions or injuries.
The analysis of causes of death also involves classifying the death certificates according to the 10th
revision of the International Statistical Classification of Diseases and Related Health Problems (ICD1),
which is maintained and reviewed by the World Health Organization. ICD defines diseases, and other
health conditions, in a comprehensive, hierarchical structure.
In Portugal, doctors have been submitting death certificates in electronic format to the Death Certifi-
cate Information System (SICO), an online software for data registry and collection [1]. Despite having
all the data centrally in digital form, the assignment of ICD-10 codes to the free-text descriptions pro-
vided by doctors is made manually by mortality coders with specific expertise, after the registry of the
death certificates in SICO.
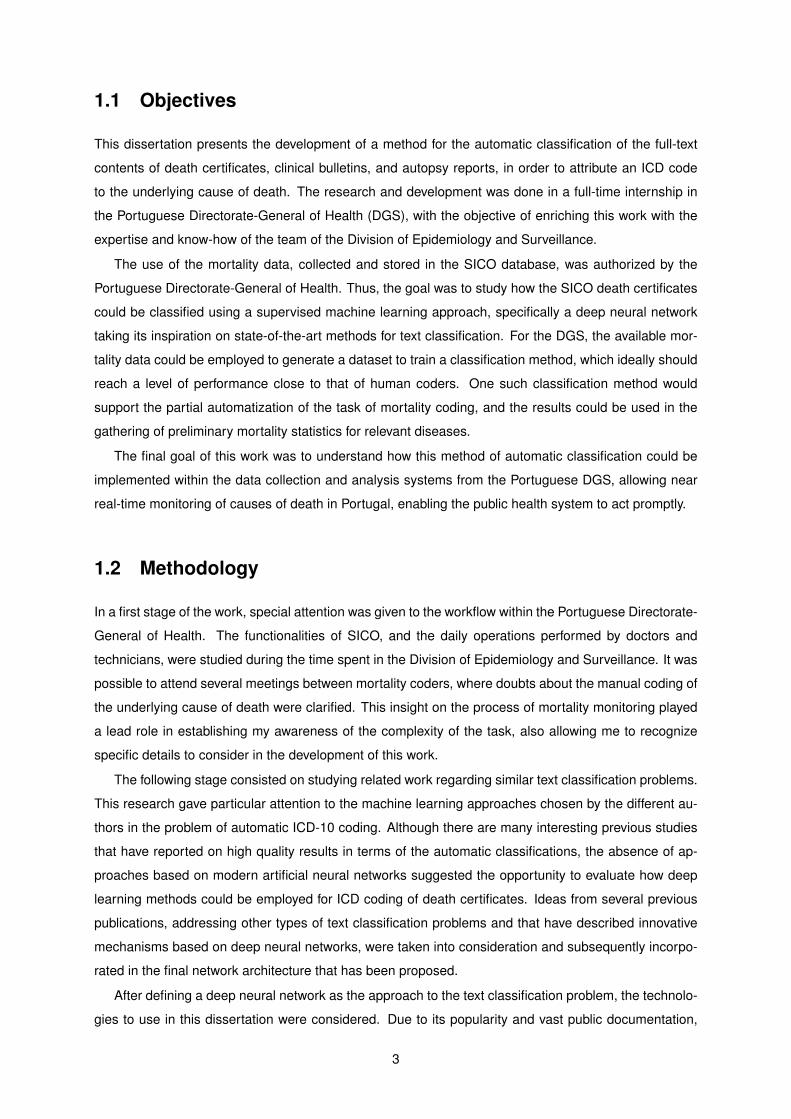
Figure 1.1 presents a screenshot of the online form within SICO for the registry of Portuguese death
certificates. The cause of death field has two parts: Part I comprises up to four fields of text for reporting
a chain of events leading directly to death, where the underlying cause of death should be given in
the lowest line and the immediate cause in the first one. Part II is optional and it is used for reporting
other significant diseases, conditions, or injuries that contributed to death, but are not part of the main
causal sequence leading to death. In complement to the death certificate, a clinical information bulletin
is also filled by the doctor before the death certificate itself, describing relevant clinical information of the
patient. The clinical bulletin is mandatory in certain situations (i.e., in cases of violent death or in the
case of an unknown cause for a death that occurred within an health center), but doctors often do not
associate the clinical bulletin to the death certificate. In these situations, an autopsy report can also be
requested by the Public Ministry. Both these auxiliary reports can be accessed from the death certificate
form within SICO. After a manual review of all the data, the mortality coder should assign the ICD-10
code corresponding to the underlying cause of death.
1http://www.who.int/classifications/icd/
1
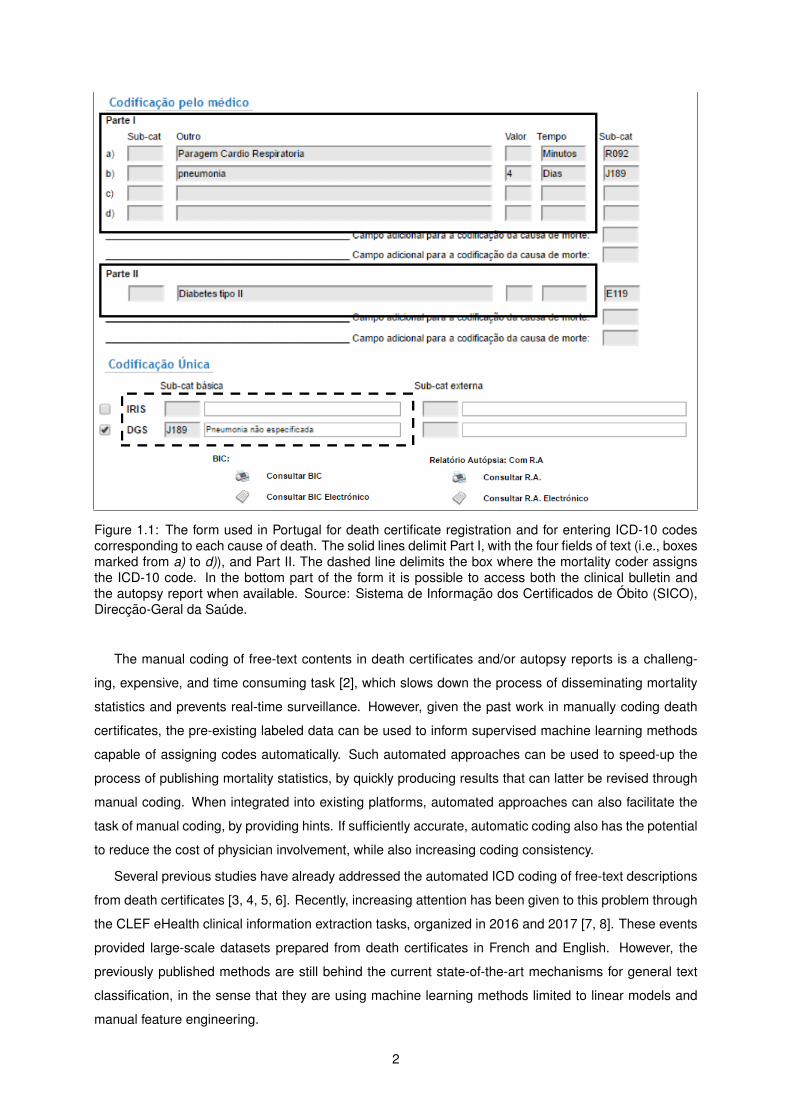
Figure 1.1: The form used in Portugal for death certificate registration and for entering ICD-10 codescorresponding to each cause of death. The solid lines delimit Part I, with the four fields of text (i.e., boxesmarked from a) to d)), and Part II. The dashed line delimits the box where the mortality coder assignsthe ICD-10 code. In the bottom part of the form it is possible to access both the clinical bulletin andthe autopsy report when available. Source: Sistema de Informacao dos Certificados de Obito (SICO),Direccao-Geral da Saude.
The manual coding of free-text contents in death certificates and/or autopsy reports is a challeng-
ing, expensive, and time consuming task [2], which slows down the process of disseminating mortality
statistics and prevents real-time surveillance. However, given the past work in manually coding death
certificates, the pre-existing labeled data can be used to inform supervised machine learning methods
capable of assigning codes automatically. Such automated approaches can be used to speed-up the
process of publishing mortality statistics, by quickly producing results that can latter be revised through
manual coding. When integrated into existing platforms, automated approaches can also facilitate the
task of manual coding, by providing hints. If sufficiently accurate, automatic coding also has the potential
to reduce the cost of physician involvement, while also increasing coding consistency.
Several previous studies have already addressed the automated ICD coding of free-text descriptions
from death certificates [3, 4, 5, 6]. Recently, increasing attention has been given to this problem through
the CLEF eHealth clinical information extraction tasks, organized in 2016 and 2017 [7, 8]. These events
provided large-scale datasets prepared from death certificates in French and English. However, the
previously published methods are still behind the current state-of-the-art mechanisms for general text
classification, in the sense that they are using machine learning methods limited to linear models and
manual feature engineering.
2
1.1 Objectives
This dissertation presents the development of a method for the automatic classification of the full-text
contents of death certificates, clinical bulletins, and autopsy reports, in order to attribute an ICD code
to the underlying cause of death. The research and development was done in a full-time internship in
the Portuguese Directorate-General of Health (DGS), with the objective of enriching this work with the
expertise and know-how of the team of the Division of Epidemiology and Surveillance.
The use of the mortality data, collected and stored in the SICO database, was authorized by the
Portuguese Directorate-General of Health. Thus, the goal was to study how the SICO death certificates
could be classified using a supervised machine learning approach, specifically a deep neural network
taking its inspiration on state-of-the-art methods for text classification. For the DGS, the available mor-
tality data could be employed to generate a dataset to train a classification method, which ideally should
reach a level of performance close to that of human coders. One such classification method would
support the partial automatization of the task of mortality coding, and the results could be used in the
gathering of preliminary mortality statistics for relevant diseases.
The final goal of this work was to understand how this method of automatic classification could be
implemented within the data collection and analysis systems from the Portuguese DGS, allowing near
real-time monitoring of causes of death in Portugal, enabling the public health system to act promptly.
1.2 Methodology
In a first stage of the work, special attention was given to the workflow within the Portuguese Directorate-
General of Health. The functionalities of SICO, and the daily operations performed by doctors and
technicians, were studied during the time spent in the Division of Epidemiology and Surveillance. It was
possible to attend several meetings between mortality coders, where doubts about the manual coding of
the underlying cause of death were clarified. This insight on the process of mortality monitoring played
a lead role in establishing my awareness of the complexity of the task, also allowing me to recognize
specific details to consider in the development of this work.
The following stage consisted on studying related work regarding similar text classification problems.
This research gave particular attention to the machine learning approaches chosen by the different au-
thors in the problem of automatic ICD-10 coding. Although there are many interesting previous studies
that have reported on high quality results in terms of the automatic classifications, the absence of ap-
proaches based on modern artificial neural networks suggested the opportunity to evaluate how deep
learning methods could be employed for ICD coding of death certificates. Ideas from several previous
publications, addressing other types of text classification problems and that have described innovative
mechanisms based on deep neural networks, were taken into consideration and subsequently incorpo-
rated in the final network architecture that has been proposed.
After defining a deep neural network as the approach to the text classification problem, the technolo-
gies to use in this dissertation were considered. Due to its popularity and vast public documentation,
3
Python was the selected programming language to develop the project. Also, the decision of using
Python enabled the implementation of the deep neural network to rely on keras2, a deep learning library
that uses either theano3 or TensorFlow4 as the computational backend.
In order to train the deep neural network, the mortality data collected by the Portuguese Directorate-
General of Health was considered. High-quality information was systematically collected since 2013
in submissions to the SICO platform, and thus, it provided enough data to create a dataset to use for
training and as ground truth. A script was computed to export the data from the database and process
the ICD-10 codes associated with the free-text components of the death certificates, clinical bulletins,
and autopsy reports. The main experiments that are reported on this dissertation have used a dataset
comprising 121, 536 death certificates, excluding neonatal and perinatal mortality, from years 2013 to
2015. In this dataset, 114, 228 instances are associated with a death certificate only and 1, 348 instances
have also a clinical bulletin and an autopsy report. The available data was randomly split into two
subsets (i.e., 75% for model training and 25% for testing) considering a balanced class distribution for
the instances in both subsets.
The experiments involved several different neural network architectures (i.e., experiments with the
main architecture that is proposed in this dissertation, plus ablation tests in which some of the compo-
nents have been removed), in order to assess the relative importance of different model components.
The predictive capability of the models was measured in terms of classification accuracy, as well as
macro-averaged precision, recall, and F1-scores. Given the hierarchical organization of ICD-10 (i.e.,
the codes are organized hierarchically into chapters, blocks and full-codes), results were also measured
according to different levels of code specification.
Experiments with a second dataset were also conducted, referring to the year of 2016 and still un-
dergoing the process of manual coding at the time of preparing this dissertation (i.e., manual coding in
the Portuguese Directorate-General of Health takes approximately nine months to process one year of
data, and while some of the months from 2016 have more than 95% of the corresponding death certifi-
cates already coded, for some of the other months only approximately 50% of coded data is available).
Leveraging the full-model (i.e., the best performing neural network architecture from the first round of
tests), trained with 75% of the data from years 2013 to 2015, the predictive accuracy of the proposed
method was again measured over the data from 2016, in an attempt to see if the model could generalize
across time periods. Results were also analyzed through time-series plots showing the weekly evolution
of the percentage of deaths associated to specific causes relevant from a public health perspective (e.g.,
ischaemic heart diseases or cerebrovascular diseases).
The final stage of this project consisted on integrating the proposed classification method into the
SICO system. This implementation took in consideration the technologies used in SICO and in eVM
(electronic Mortality Surveillance)5, a client application for electronic mortality surveillance. Two com-
plementary scripts were developed as interfaces between the SICO database and the keras library and,
2http://keras.io3http://deeplearning.net/software/theano/4http://www.tensorflow.org5http://evm.min-saude.pt
4
thus, the neural network can predict the ICD-10 code for the underlying cause of death of new death
certificates in real-time.
1.3 Results and Contributions
The proposed neural network architecture is the main contribution resulting from this research project.
The network was trained end-to-end from a set of manually coded instances and it combined different
mechanisms for generating intermediate representations, including two levels of Gated Recurrent Units
(GRUs) for modeling sequential data within and between the textual fields that compose the input [9,
10], averages of word embeddings according to the proposal by Joulin et al. [11], and neural attention
mechanisms for highlighting relevant parts of the inputs [12, 10].
Three output nodes are also considered on the model, in an attempt to leverage relations between
ICD-10 classes (e.g., the underlying hierarchical class structure) to further improve results. These cor-
respond to (i) a softmax node that outputs an ICD-10 full-code, (ii) a softmax node that outputs the
ICD-10 block, and (iii) a sigmoid activation node that outputs all ICD-10 codes associated to auxiliary
and contributing conditions present in the death certificate (e.g., through the SICO platform, the manual
coding provides ICD-10 codes for the contributing conditions or injuries mentioned in the textual con-
tents). Moreover, in an attempt to also leverage frequent co-occurrences between ICD-10 codes, two
different strategies for initializing the weights of the final nodes in the neural network were considered.
The best model achieved an accuracy of 89.2%, 81.2%, and 75.9%, respectively when considering
ICD-10 chapters (i.e., a total of 19 distinct classes appearing in the dataset), blocks (611 distinct classes)
and full-codes (1, 418 distinct classes). The full model also achieved F1-scores of 96.4% and 92.8%,
respectively in terms of correctly identifying causes of mortality related to ICD-10 Chapters II (i.e., neo-
plasms) and IX (i.e., diseases of the circulatory system), that together represent 56.6% of the death
causes in the dataset. One can therefore argue that the obtained results indicate that automatic ap-
proaches leveraging supervised machine learning can indeed contribute to a faster processing of death
certificates, with a satisfactory margin of error. Moreover, the experiments showed that the implemented
neural attention mechanisms led to an increased performance. Also, these methods can offer much
needed model interpretability, by allowing us to see which parts of the input are attended to when mak-
ing predictions, resulting in interpretable classifications.
Similar results were obtained between both datasets that were considered in the texts (i.e., the
main dataset with data of 2013-2015 and the secondary dataset of 2016 data) and, through time-series
plots showing the weekly evolution of the percentage of deaths associated to specific causes (e.g.,
ischaemic heart diseases or cerebrovascular diseases), my work also illustrated the usefulness of the
proposed method for real-time public health surveillance. Automated ICD-10 coding is indeed capable
of approximating the results of manual coding with a high accuracy, and it can significantly accelerate
the publication of provisional mortality statistics, for public health surveillance.
The integration of the proposed model in the SICO database can automatically assign in near real-
time the ICD-10 code for the underlying cause of death of each new deceased individual in the Por-
5
tuguese territory. In a near future, the proposed model can also can be integrated with eVM, in order to
make the near real-time cause of death surveillance information publicly available. This implementation
is currently taking place.
During the development of this research project, two articles were produced at two different stages:
• A first paper, entitled “A Deep Learning Method for ICD-10 Coding of Free-Text Death Certifi-
cates” [13], was presented in the 18th edition of EPIA, the Portuguese Conference on Artificial
Intelligence. This paper was produced at a preliminary stage, and the method that is described in
the paper is simpler than the one that is reported on this dissertation (e.g., the method does not
consider model initialization with basis on label co-occurrences, neither does it consider taking the
average of the word embeddings).
• A second paper, entitled “Deep Neural Models for ICD-10 Coding of Death Certificates and Au-
topsy Reports in Free-Text,” summarizes the contents of this dissertation. This article was submit-
ted to the Elsevier Journal on Biomedical Informatics, where E. H. Shortliffe is the editor-in-chief,
and it is currently undergoing the revision process.
The source code corresponding to the implementation of the proposed neural network architecture
has also been made available on GitHub 6.
1.4 Thesis Outline
This dissertation is organized as follows:
• Chapter 2 surveys important concepts and previous related work. First, an overview of relevant
topics (e.g., public health surveillance or the ICD-10 classification system) is made in Sections 2.1
and 2.3, followed by a summarized description on artificial neural networks. Then, a review of the
approaches and techniques used in similar classification tasks is presented. The related work is
divided in two categories: studies that use general clinical text and, finally, studies that focus on
the analysis of death certificates, as the present work.
• Chapter 3 details the proposed approach, presenting the architecture of the deep neural network
that was considered for addressing ICD-10 coding as a supervised classification task. Also, Sec-
tion 3.3 describes the integration of the neural network model with the SICO system.
• Chapter 4 presents the experimental evaluation of the proposed method. The chapter starts by
presenting the datasets used in the experiments, together with the experimental methodology
and evaluation metrics. Next, the chapter gives a detailed analysis of the results obtained in the
experiments with six different neural network models. Then, the chapter presents the results of
a separate test, using the best performing model to predict the underlying causes of death over
unseen data from 2016. The final sections within Chapter 4 discuss the interpretation of the
6https://github.com/ciscorduarte/mortality_coding_dnn
6

results through the visualization of the weights in the neural attention layer, and the integration of
the classification model with the SICO system.
• Finally, Chapter 5 outlines the main conclusions of this work, and it also presents possible devel-
opments for future work.
7

8
Chapter 2
Concepts and Related Work
This chapter describes fundamental concepts and previous studies that addressed the automatic assign-
ment of ICD codes to clinical text. Section 2.1 presents fundamental concepts related to public health
surveillance, which is the overarching goal of this work. Section 2.2 details the workflow associated to
how death certificates are encoded in Portugal according to ICD-10. Section 2.3 presents a succinct
overview of the structure behind the ICD-10 classification system. Section 2.4 briefly introduces artificial
neural networks. Then, Section 2.5 reviews previous work concerned with the task of automatic clas-
sification of general clinical text (i.e., medical reports from examinations, patient discharge summaries,
etc.). Section 2.6 presents an overview of previous work focusing on death certificates and derived doc-
uments, such as autopsy reports. Finally, a summary of the related work presented in this chapter can
be seen in Section 2.7.
2.1 Public Health Surveillance
Public health differs from clinical medicine since it goes beyond the treatment of a patient, focusing
on entire populations and on preventing diseases. Taking measures for disease prevention and health
promotion demand acting over social, biological, and environmental determinants that influence the
overall health status of the population.
Given a set of public health objectives, knowledge from a broad range of fields is needed to attain the
common goal of preventing particular diseases and promoting health. The interdisciplinary approaches
involved in addressing these issues require mastery of knowledge from epidemiology and biostatistics,
to health services, environmental health, health economics, and even informatics.
An efficient public health surveillance system is crucial to act promptly since it is an early warning
system for impeding public health emergencies. Moreover, such systems can be useful to accurately
document and study the impact of an intervention, or track progress of specific goals. Finally, these
systems also deliver methods to monitor the epidemiology of health problems, helping professionals to
define priorities and create new public health strategies and policies.
Public health practice demands systematic data collection and processing that appeals to a data
9

science approach, concerned with optimizing the retrieval from very large record databases, and seeking
for possible patterns in them. The integration of surveillance systems is also challenging since it relies
on dynamic processes and, with the on-going development of information technology, systems change
and suffer updates. Nevertheless, surveillance systems allow a better insight on emerging or existing
problems and support decision making and intervention.
Concerning the specific topic of the work presented in this dissertation, and from the point-of-view of
public health, one of the main indicators of general health and a cornerstone of public health surveillance
is mortality and the corresponding causes of death, as these are fairly simple to measure. The mortality
rate is a clear quantity that enables a critical comparison of health quality between different populations
and in the same population along the temporal dimension.
2.2 Mortality Surveillance within DGS with the SICO/eVM Systems
Since January 2014, it is mandatory by law for deaths occurring in the Portuguese territory to be regis-
tered online on the SICO platform. The death certificates are filled and submitted in electronic format by
the doctor that confirmed the moment of death, with the demographic data of the deceased and relevant
medical information for the cause of death. The SICO database is paired with eVM, a client application
for electronic mortality surveillance. These systems were deployed by DGS (Direcao Geral da Saude
- Directorate-General of Health) together with SPMS (Servicos Partilhados do Ministerio da Saude -
Shared Services of the Ministry of Health) to focus on the needs for the analysis of national mortality
and associated causes of death.
After the emission of each death certificate, a team of mortality coders from DGS is in charge of its
manual review and, given the information in the free-text fields, classify the underlying cause of death
according to specific and detailed classification rules from the International Statistical Classification of
Diseases and Related Health Problems (ICD). Using the SICO layout shown in Figure 1.1, the mortality
coder submits the underlying cause of death for each death certificate, also registering it in the database.
Associated with each death certificate, there are two auxiliary documents that can complement the
clinical information relevant for cause of death coding, and also for statistical purposes: a clinical infor-
mation bulletin (BIC - Boletim de Informacao Clınica) and an autopsy report.
The clinical information bulletin is mandatory in cases of violent death and unknown causes of death.
It is usually filled when a patient arrives to an health center. The clinical information bulletin comprises six
free-text fields: circumstances of admission, clinical situation, clinical evolution, complementary exams,
clinical background and diagnosis. Doctors are responsible for associating each clinical bulletin to the
respective death certificate but often this is not executed, leading to many death certificates without any
auxiliary document.
The autopsy report is an optional document that can be requested by the public prosecution service if
the cause of death needs further investigation or is unclear. As the death certificate and clinical bulletin,
this is also a free-text document, although in this case is composed by a single field.
Both the clinical bulletin and the autopsy report are associated with their corresponding death cer-
10
tificate and are stored in the SICO database. Mortality coders can access these complementary docu-
ments in the SICO platform, as seen in the lower part of Figure 1.1. The auxiliary documents are often
examined when available, specially the autopsy report, as the death certificates that require one are
usually uninformative by themselves.
Ideally, the statistics regarding causes of death should also be available in near real-time, allowing the
public health professionals to understand emerging or existing health problems. Given the actual death
rate, it is impossible to encode in a short amount of time every death certificate, due to the complex and
time consuming task of manual coding the underlying cause of death.
Currently, the DGS workflow ensures the coding of every death certificate with a maximum delay of
one year (i.e., at the end of a given year, the deaths of past year are, by that time, fully encoded and
validated). The statistical processing of causes of death is done yearly by DGS and sent to INE (Instituto
Nacional de Estatıstica - National Statistics Institute) for further dissemination.
The DGS workflow relies on a simplified platform within SICO, on which doctors, health technicians,
and mortality coders can log in with personal credentials, within different levels of permission. Currently,
eVM processes mortality data in the SICO database in near real-time (i.e., every ten minutes), already
making this system unique at a worldwide level. The eVM interface delivers multiple graphs, maps, and
data tables to the general public, to internal users of the DGS, and to other health authorities.
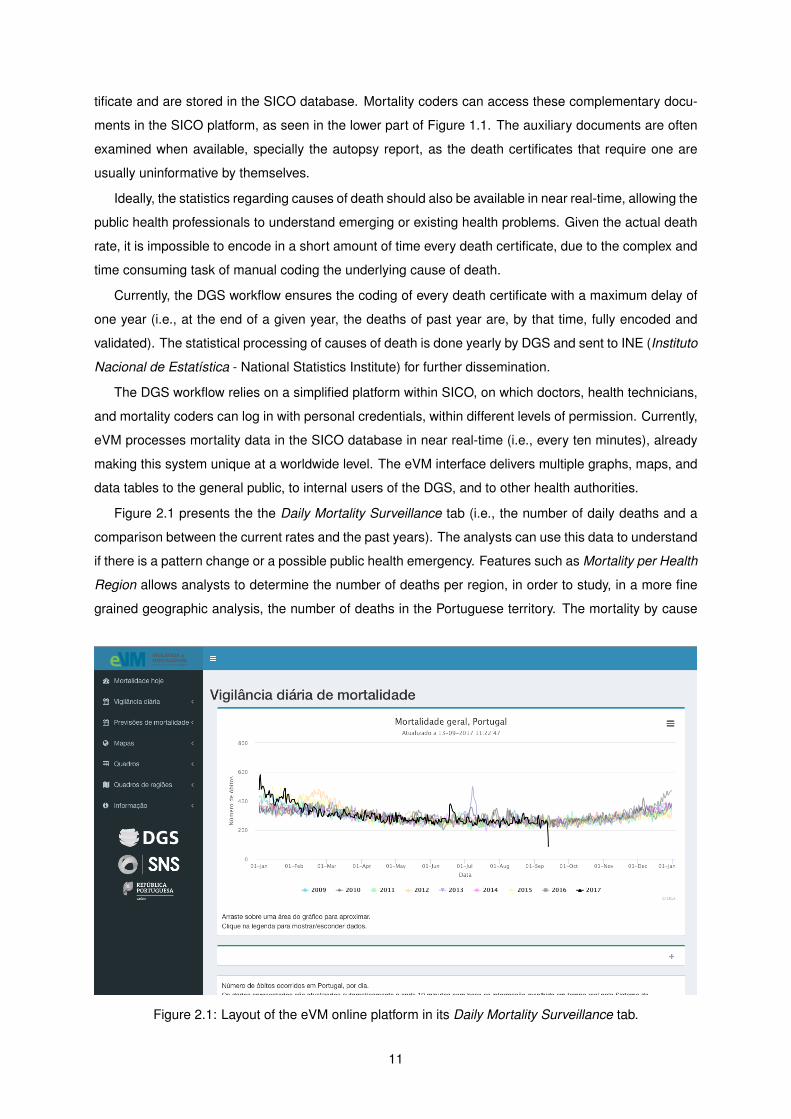
Figure 2.1 presents the the Daily Mortality Surveillance tab (i.e., the number of daily deaths and a
comparison between the current rates and the past years). The analysts can use this data to understand
if there is a pattern change or a possible public health emergency. Features such as Mortality per Health
Region allows analysts to determine the number of deaths per region, in order to study, in a more fine
grained geographic analysis, the number of deaths in the Portuguese territory. The mortality by cause
Figure 2.1: Layout of the eVM online platform in its Daily Mortality Surveillance tab.
11
of death is also available from a specific tab, albeit using only three categories: natural cause, external
cause and under investigation.
2.3 The ICD-10 Classification System
The World Health Organization is responsible for the development and review of the International Statis-
tical Classification of Diseases and Related Health Problems (ICD) standard, which is the global health
information standard for mortality and morbidity statistics. This classification system is organized into
standard groups of diseases and related health problems, allowing [14]:
• Easy storage, retrieval and analysis of health information for evidenced-based decision-making;
• Sharing and comparing health information between hospitals, regions, settings and countries;
• Data comparisons in the same location across different time periods.
Along with the classification system, the ICD also provides guidelines for coding and recording death
causes and the underlying cause of death. These guidelines are essential to maintain an information
standard, as they determine how to proceed in specific scenarios such as when two or more interrelated
conditions are potentially meeting the definition for principal diagnosis.
Periodically, the ICD classification system is revised and, currently, the version that is used in most
organizations is the tenth. This version comprises more than 14, 400 different codes (i.e., codes can
be expanded using optional sub-classifications to over 16, 000 codes), organized in three levels of spe-
cialization: chapters, blocks (i.e., three-character codes) and four-character codes. Each full-code is
composed by four characters: a letter and three numbers, corresponding to a unique classification.
The first hierarchical level is composed by 22 distinct chapters – see Table 2.1. To arrange the
diseases and health problems in this first level, a specific pattern can be noticed where the diseases are
grouped in the following way [15]:
• Epidemic diseases;
• Constitutional or general diseases;
• Local diseases arranged by site;
• Developmental diseases;
• Injuries.
Within each chapter, the groups of blocks have a specific range and they can specify either the
transmission mode or a broad group of infecting organisms as shown in Table 2.1. Setting the first three
characters of the ICD-10 code leads to the codification of a single condition or a group of diseases
with common characteristics. The highest level of specification is given by the fourth and last numeric
character of the ICD-10 code, supporting the sub-division of each three-character category in up to 10
12

Table 2.1: Titles of the ICD-10 chapters and corresponding range of blocks.
Chapter Blocks Title
I A00 – B99 Certain infectious and parasitic diseases
II C00 – D48 Neoplasms
III D50 – D89 Diseases of the blood and blood-forming organs and certain disordersinvolving the immune mechanism
IV E00 – E90 Endocrine, nutritional and metabolic diseases
V F00 – F99 Mental and behavioural disorders
VI G00 – G99 Diseases of the nervous system
VII H00 – H59 Diseases of the eye and adnexa
VIII H60 – H95 Diseases of the ear and mastoid process
IX I00 – I99 Diseases of the circulatory system
X J00 – J99 Diseases of the respiratory system
XI K00 – K93 Diseases of the digestive system
XII L00 – L99 Diseases of the skin and subcutaneous tissue
XIII M00 – M99 Diseases of the musculoskeletal system and connective tissue
XIV N00 – N99 Diseases of the genitourinary system
XV O00 – O99 Pregnancy, childbirth and the puerperium
XVI P00 – P96 Certain conditions originating in the perinatal period
XVII Q00 – Q99 Congenital malformations, deformations and chromosomalabnormalities
XVIII R00 – R99 Symptoms, signs and abnormal clinical and laboratory findings, notelsewhere classified
XIX S00 – T98 Injury, poisoning and certain other consequences of external causes
XX V01 – Y98 External causes of morbidity and mortality
XXI Z00 – Z99 Factors influencing health status and contact with health services
XXII U00 – U99 Codes for special purposes
subcategories. Although this level of specification is not mandatory, it can either further specify a single
disease or select, within a group with common characteristics, a distinct disease.
For instance, Chapter X comprises codes from J00 – J99 (i.e., diseases of the respiratory system).
Within Chapter X, codes from J09 – J18 (i.e., influenza and pneumonia) will determine the range of
13
blocks for a single condition. The three-character code J18 specifies “pneumonia, organism unspecified”
and in the following level of specification, five four-character categories can be selected: J18.0, J18.1,
J18.2, J18.8 and J18.9. These five codes define the highest level of specification where, for instance,
J18.2 defines “hypostatic pneumonia, unspecified”.
2.4 Artificial Neural Networks
The human nervous system has a biological neural network that consists on a very large number of
interconnected neurons, capable of receiving input signals and, if these exceed a specific threshold,
transmit them to the following neurons. These interconnections are made through an electro-chemical
phenomenon called synapse. A synapse is able to modify itself based on the input received and, thus, it
is able to learn from its past activity through the strengthening or weakening of the existing connections.
Artificial neural networks (ANNs) attempt to replicate several features of a biological neural network:
the interconnections between neurons, the learning process of the synapses, and the formation of new
synapses between nearby neurons. In brief, ANNs can be seen as computational artifacts that channel
information through a series of mathematical operations, with the general purpose of accurately classi-
fying inputs [16]. Mathematically, neural networks can be seen as nested composite functions, whose
parameters can be trained directly to minimize a given loss function computed over the outputs and
the expected results. This is achieved through a training procedure known as back-propagation [17], in
combination with gradient descent optimization of the parameters [16, 18].
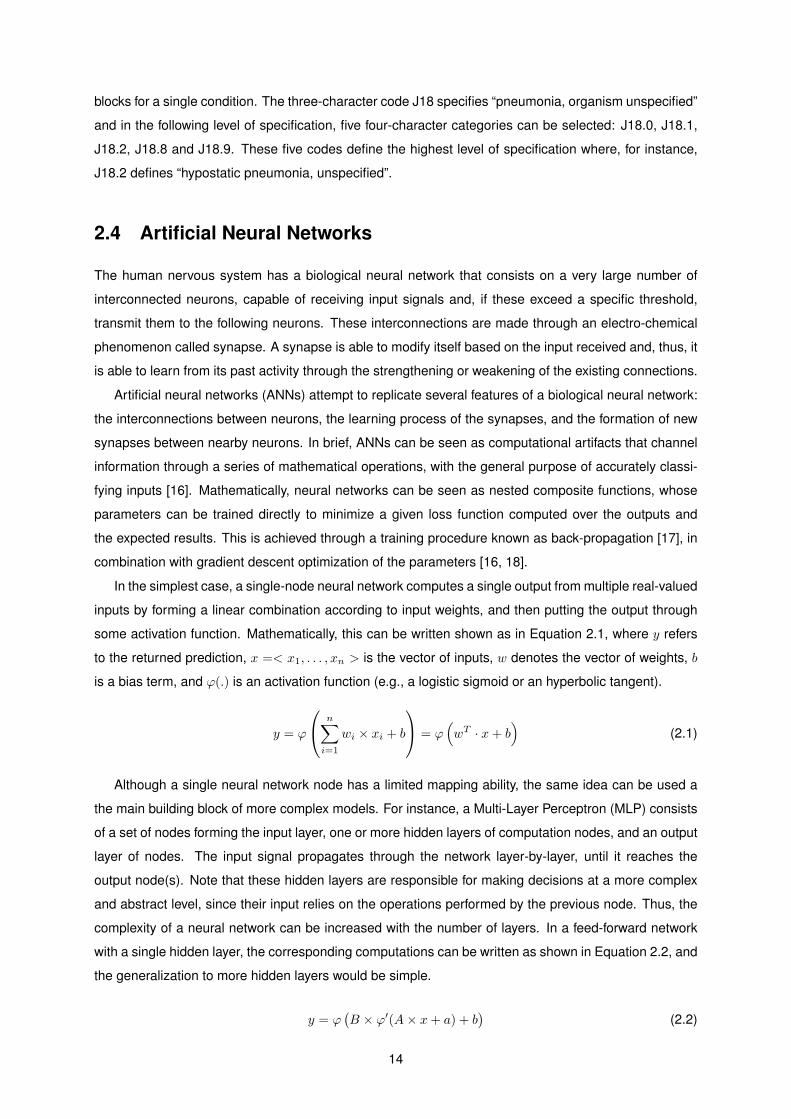
In the simplest case, a single-node neural network computes a single output from multiple real-valued
inputs by forming a linear combination according to input weights, and then putting the output through
some activation function. Mathematically, this can be written shown as in Equation 2.1, where y refers
to the returned prediction, x =< x1, . . . , xn > is the vector of inputs, w denotes the vector of weights, b
is a bias term, and ϕ(.) is an activation function (e.g., a logistic sigmoid or an hyperbolic tangent).
y = ϕ
n∑i=1
wi × xi + b
= ϕ(wT · x+ b
)(2.1)
Although a single neural network node has a limited mapping ability, the same idea can be used a
the main building block of more complex models. For instance, a Multi-Layer Perceptron (MLP) consists
of a set of nodes forming the input layer, one or more hidden layers of computation nodes, and an output
layer of nodes. The input signal propagates through the network layer-by-layer, until it reaches the
output node(s). Note that these hidden layers are responsible for making decisions at a more complex
and abstract level, since their input relies on the operations performed by the previous node. Thus, the
complexity of a neural network can be increased with the number of layers. In a feed-forward network
with a single hidden layer, the corresponding computations can be written as shown in Equation 2.2, and
the generalization to more hidden layers would be simple.
y = ϕ(B × ϕ′(A× x+ a) + b
)(2.2)
14
In the previous equation, x is a vector of inputs and y a vector of outputs. The matrix A represents the
weights of the first layer and a is the bias vector of the first layer, while B and b are, respectively, the
weight matrix and the bias vector of the second layer. The functions ϕ′ and ϕ both denote an element-
wise non-linearity, i.e. the activation functions respectively associated to nodes in the hidden layer, and
in the output layer.
Training the neural network corresponds to adapting all the weights and biases (e.g., the parameters
A, B, a and b, in the case of the feed-forward network expressed in the previous equation) to their optimal
values, given a training set of inputs x together with the corresponding outputs y. This problem can be
solved with the back-propagation algorithm, which consists of two steps. In a forward pass, the predicted
outputs corresponding to the given inputs are evaluated. In a backward pass, partial derivatives (i.e., the
relationships between rates of change) of a given loss function with respect to the different parameters
are propagated back through the network. In other words, back-propagation in neural networks moves
backward from the final error through the outputs, weights and inputs of each layer, assigning those
weights responsibility for a portion of the error, by calculating their partial derivatives.
The chain rule of differentiation can be used to compute the derivatives associated to nested com-
posite functions. Those derivatives are used by a gradient-based optimization algorithm to adjust the
weights and biases up or down, whichever direction decreases error over the training instances, as mea-
sured through a loss function. An optimization procedure that has been frequently used to train deep
neural networks is the Adaptive Moment Estimation (Adam) algorithm [18]. Adam computes parameter
updates leveraging an exponentially decaying average of past gradients, together with adaptive learning
rates for each parameter. In practice, it performs larger updates for infrequent parameters, and smaller
updates for frequent parameters.
Recurrent neural networks (RNNs) are a class of ANNs that attempt to make use of sequential
information (i.e., they do not consider all inputs and outputs as independent of each other, as in a
traditional neural network). RNNs are becoming popular models due to their ability of handling variable-
length inputs (i.e., they were designed to recognize patterns in sequences of data, such as textual
strings, and hence are commonly used in text classification tasks). This particular feature involves
computing an hidden state whose activation at each time step is dependent on that of the previous time
step. As RNNs share the same parameters across all steps, the total number of parameters to learn is
notably reduced. Whereas in classic feed-forward networks the examples are fed to an input layer and
straightly transformed into an output, never performing computations over a given node twice, in RNNs
we take not just the current input instance (e.g., the representation for a given word within a string) but
also what was perceived one step back in time (e.g., the previous word in the sequence). More formally,
given a sequence X = (x1, x2, . . . , xT ), an RNN updates its recurrent hidden state ht by sequentially
processing the input sequence and computing:
ht = ϕ (W × xt + U × ht−1) (2.3)
In brief, we have that the hidden state ht at time step t is a function of the input at the same time step xt,
15
modified by a weight matrix W . This result is added to the hidden state of the previous time step ht−1,
multiplied by its own hidden-state-to-hidden-state matrix U . The weight matrices are essentially filters
that determine how much importance should be given to both the present input and the past hidden
state. Previous research has noted that standard RNNs have difficulties in modeling long sequences,
and extensions have been proposed to handle this problem. A well-known example are Gated Recurrent
Units (GRUs), originally proposed by Cho et al. [9] and detailed further ahead in this dissertation.
The successful use of deep neural networks, particularly RNNs, in tasks related to Natural Language
Processing (NLP) suggested the use of a similar approach to the problem addressed in this work.
2.5 Automatic Classification of General Clinical Text
Various previous studies have addressed the automatic assignment of ICD codes to clinical text from
various different application sub-domains. Different methods were for instance presented at the 2007
Computational Medicine Challenge (CMC), which involved about 50 participants [19]. The goal was to
create computational intelligence algorithms to automate the assignment of ICD-9 codes to free-text
radiology reports, with basis on a training set of 978 documents and a test set of 976 documents. The
top-performing system corresponded to an ensemble of multiple models that achieved a micro-averaged
F1-score of 0.89, while the mean F1-score among all participants was of 0.77. The inter-annotator
agreement, measured as the F1-score of individual annotators against an aggregated score obtained
through majority voting, was also found to be comparable to those of the best automatic systems.
The CMC dataset remains, to this day, a frequently used resource by researchers working on ICD
code assignment. In a recent study leveraging this dataset, Zhang et al. [20] proposed to leverage
PubMed to alleviate the problem of working with the sparse and highly imbalanced CMC dataset, specif-
ically by gathering titles and abstracts from articles about diseases corresponding to rare ICD-9 codes,
in order to create new training instances. The authors concluded that supplementary training data can
boost the macro averaged performance in a small dataset such as that from the CMC, although this
technique has no significant effect when enough training data is available.
Perotte et al. stressed how the current volume of health care data can be used to support the auto-
mated assignment of ICD codes to clinical text [21]. The authors used the publicly available Multiparam-
eter Intelligent Monitoring in Intensive Care II (MIMIC II) repository of records for patients in Intensive
Care Units (ICUs), to assess the performance of standard text classification methods for automatically
coding patient discharge summaries. The MIMIC II dataset comprises records collected between the
years of 2001 and 2008 from a variety of ICUs (i.e., medical, surgical, coronary care, and neonatal),
consisting of multiple fields (e.g., discharge summaries, nursing progress notes, and reports for cardiac
catheterization, ECGs, radiology and echo tests). A total of 22, 815 non-empty discharge summaries,
with a mean length of 1, 083 words, were used in this study. The documents were represented as sparse
vectors encoding individual words, considering TF-IDF (i.e., term frequency times inverse document fre-
quency) term weights and using the top 10, 000 terms with the highest TF-IDF scores across the entire
collection. A total of 5, 030 distinct ICD-9 codes were considered within a multi-label classification frame-
16

work (i.e., one or more labels can be assigned to a given document). Two different classification methods
were tested, namely a flat classifier based on Support Vector Machines (SVMs), with one binary SVM
per ICD-9 class, and a method based on a tree with 8 levels of SVM models, leveraging the hierarchical
structure of ICD-9 (i.e., a method where the classifier associated with a given code in the hierarchy is
applied only if its parent code has been classified as positive). Both strategies were compared through
a variety of metrics adapted for hierarchical multi-label classification (e.g., in the definitions of precision
and recall, true positives were considered to be predicted codes that were ancestors, descendants, or
identical to a gold-standard code), leveraging 90% of the available data for model training and 10% for
testing. Perotte et al. showed that the hierarchical method outperformed the simpler approach that
treated each ICD-9 code independently.
Boytcheva presented an approach for assigning ICD-10 codes to diagnoses extracted from patient
discharge letters written in Bulgarian [22]. The proposed method leverages one-versus-all multi-class
SVMs, with basis on binary sparse vector representations for word occurrence in the diagnose sections
of the discharge letters. In his work, Boycheva gave particular attention to the development of pre-
processing techniques for improving the input representations (e.g., for expanding abbreviations, translit-
erating between the Cyrillic and Latin alphabets, handling synonyms, hyponyms, processing negations,
or normalizing words).
Yan et al. [23] and Wang et al. [24] have both proposed methods for automated ICD coding of data
within electronic health records, combining linear discriminative classifiers (i.e., logistic regression mod-
els or SVMs) with model regularization procedures that explore inter-code relationships (e.g., label co-
occurrences over the training data, or other available prior knowledge) for improving multi-label classifi-
cation. For instance Wang et al. compared different multi-label classification methods for ICD-9 coding,
also using the MIMIC II dataset. The inputs for classification considered both structured (e.g., patients’
raw health conditions collected from medical devices) and unstructured (i.e., free-text descriptions) data,
associated to chart events and medical note fields within MIMIC II. The chart and the note information
were each represented as dense vectors with 500 dimensions, leveraging a data pre-processing pipeline
that combines multiple operations (e.g., TF-IDF term weighting, a probabilistic topic model for repre-
senting note features as distributions over latent topics, and a bag-of-words model encoding occurrence
counts of a vocabulary of 500 clustering-based features). The most innovative aspect in the work from
Wang et al. relates to the proposal of a novel classification method based on logistic regression (i.e., the
authors used a logistic loss combined with a `2,1-norm for inducing sparsity in the parameters), which
incorporates a graph structure that reflects the correlations between diseases (i.e., the regularization
term of the model combines the feature weights with a class affinity matrix where each cell corresponds
to the cosine similarity between a pair of classes, with basis on the class associations to individual train-
ing instances). The novel method was compared against previous approaches specifically designed
for multi-label classification, using metrics that are also specific for multi-label problems (i.e., the Ham-
ming loss and the ranking loss). The method leveraging disease correlations outperformed 6 alternative
approaches and, in most cases, the note features had better results than the chart features.
Despite the fact that modern text mining methods, in many different domains, often leverage word em-
17
beddings (i.e., dense real-valued vector representations of words capturing similarities between them)
together with deep neural networks, these techniques are still rarely seen on clinical and/or biomedical
text mining studies. Some authors have nonetheless reported on preliminary studies concerning with the
usage of pre-trained word embeddings [25, 26], including on tasks related to text classification [27, 28].
For instance Karimi et al. described a deep learning method for ICD-9 coding [27], reporting on tests
over the aforementioned CMC dataset of radiology reports [19]. The authors proposed to use a simple
Convolutional Neural Network (CNN) architecture (i.e., one convolutional layer using multiple filters and
filter sizes, followed by a max pooling and a fully-connected layer to assign the ICD code), attempting to
quantify the impact of using pre-trained word embeddings for model initialization, together with different
hyper-parameters. The subset of data used in the experiments corresponds to a total of 894 documents
with 16 unique ICD-9 codes, with each code appearing in at least 15 documents. The best CNN model
outperformed baseline classifiers (i.e., SVM, random forest, and logistic regression models leveraging
TF-IDF feature vectors) on stratified 10-fold cross-validation tests, with an overall accuracy of 83.84 and
a macro-averaged F1 score of 81.55. The CNN model appears to be comparable to the best-performing
systems over the CMC dataset, although not clearly outperforming them.
Table 2.2 presents a brief overview of the datasets that were used, and the results that were reported
in each study described in this section.
2.6 Automatic Classification of Death Certificates
Specifically on what regards death certificates, Koopman et al. described the use of SVM classifiers
for identifying cancer related causes of death in natural language descriptions [5]. The textual contents
were encoded as sparse binary feature vectors (i.e., term n-grams, vectors encoding the presence of
terms, and SNOMED CT concepts recognized by a clinical natural language processing system named
Medtex), and these representations were used as features to train a two-level hierarchy of SVM models:
the first level was a binary classifier for identifying the presence of cancer, and the second level consisted
of a set of classifiers (i.e., one for each cancer type) for identifying the type of cancer using the ICD-10
classification system (i.e., according to 85 different ICD-10 blocks, of which 20 instances corresponded to
85% of all cases). The system was highly effective at identifying cancer as the underlying cause of death,
having obtained a macro-averaged F1-score of 0.94 for the first level classifier. It was also effective at
determining the type of common cancers (macro-averaged F1-score of 0.7). However, rare cancers
for which there was little training data available were difficult to classify accurately (macro-averaged
F1-score of 0.12). The principal factors influencing performance were the amount of training data and
certain ambiguous cases, such as cancers in the stomach region.
In a separate study, Koopman et al. described machine learning and rule-based methods to automat-
ically classify death certificates according to four high impact diseases of interest: diabetes, influenza,
pneumonia, and HIV [6]. The rule-based method leveraged sets of keyword-matching rules, while the
machine learning method was again based on SVM classifiers, using binary feature vectors (i.e., pres-
ence of terms, term n-grams, and SNOMED CT concepts recognized by Medtex) for encoding the texts.
18
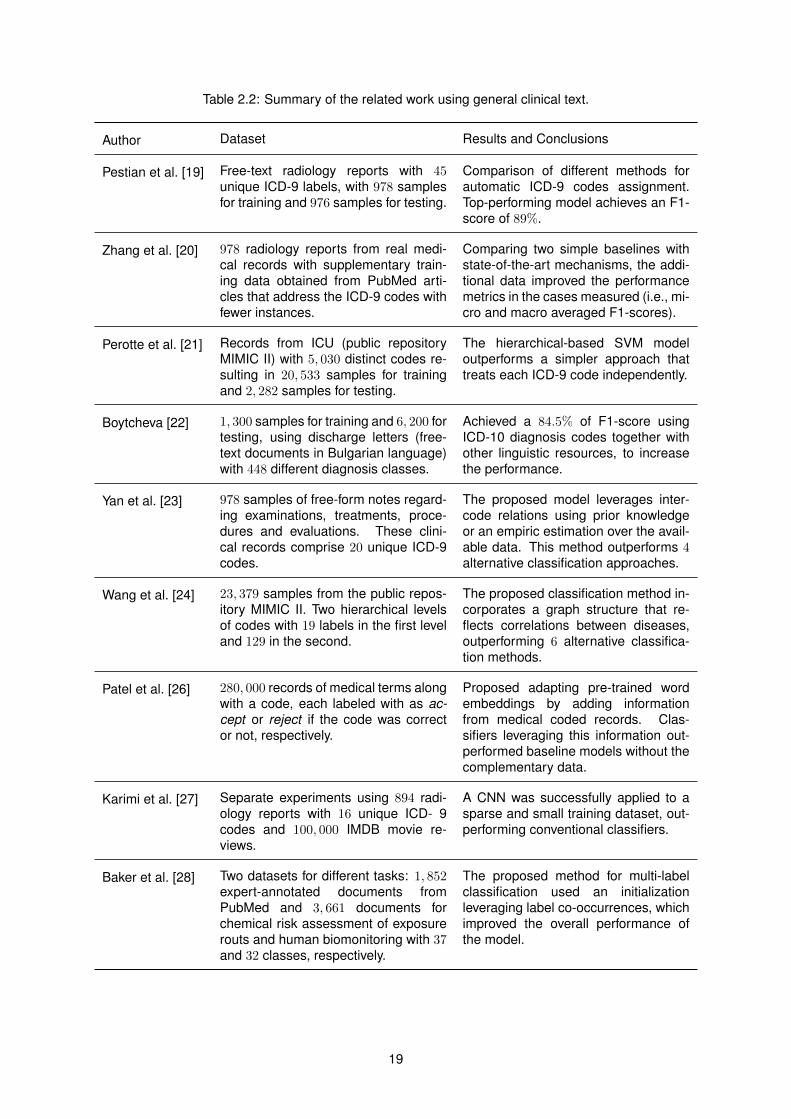
Table 2.2: Summary of the related work using general clinical text.
Author Dataset Results and Conclusions
Pestian et al. [19] Free-text radiology reports with 45unique ICD-9 labels, with 978 samplesfor training and 976 samples for testing.
Comparison of different methods forautomatic ICD-9 codes assignment.Top-performing model achieves an F1-score of 89%.
Zhang et al. [20] 978 radiology reports from real medi-cal records with supplementary train-ing data obtained from PubMed arti-cles that address the ICD-9 codes withfewer instances.
Comparing two simple baselines withstate-of-the-art mechanisms, the addi-tional data improved the performancemetrics in the cases measured (i.e., mi-cro and macro averaged F1-scores).
Perotte et al. [21] Records from ICU (public repositoryMIMIC II) with 5, 030 distinct codes re-sulting in 20, 533 samples for trainingand 2, 282 samples for testing.
The hierarchical-based SVM modeloutperforms a simpler approach thattreats each ICD-9 code independently.
Boytcheva [22] 1, 300 samples for training and 6, 200 fortesting, using discharge letters (free-text documents in Bulgarian language)with 448 different diagnosis classes.
Achieved a 84.5% of F1-score usingICD-10 diagnosis codes together withother linguistic resources, to increasethe performance.
Yan et al. [23] 978 samples of free-form notes regard-ing examinations, treatments, proce-dures and evaluations. These clini-cal records comprise 20 unique ICD-9codes.
The proposed model leverages inter-code relations using prior knowledgeor an empiric estimation over the avail-able data. This method outperforms 4alternative classification approaches.
Wang et al. [24] 23, 379 samples from the public repos-itory MIMIC II. Two hierarchical levelsof codes with 19 labels in the first leveland 129 in the second.
The proposed classification method in-corporates a graph structure that re-flects correlations between diseases,outperforming 6 alternative classifica-tion methods.
Patel et al. [26] 280, 000 records of medical terms alongwith a code, each labeled with as ac-cept or reject if the code was corrector not, respectively.
Proposed adapting pre-trained wordembeddings by adding informationfrom medical coded records. Clas-sifiers leveraging this information out-performed baseline models without thecomplementary data.
Karimi et al. [27] Separate experiments using 894 radi-ology reports with 16 unique ICD- 9codes and 100, 000 IMDB movie re-views.
A CNN was successfully applied to asparse and small training dataset, out-performing conventional classifiers.
Baker et al. [28] Two datasets for different tasks: 1, 852expert-annotated documents fromPubMed and 3, 661 documents forchemical risk assessment of exposurerouts and human biomonitoring with 37and 32 classes, respectively.
The proposed method for multi-labelclassification used an initializationleveraging label co-occurrences, whichimproved the overall performance ofthe model.
19
In the machine learning approach, a separate model was trained for each of the four diseases of inter-
est and more fine-grained classifiers were trained for each of the relevant ICD-10 blocks. An empirical
evaluation was conducted using 340, 142 certificates, of which 80% were reserved for model training and
20% for testing, covering deaths from the years of 2000 to 2007 in New South Wales, Australia. The
results showed that the classification of diabetes, influenza, pneumonia, and HIV was highly accurate,
with a macro-averaged F1-score of 0.95 for the rule-based method and 0.94 when using machine learn-
ing. More fine-grained ICD-10 classification had nonetheless a more variable effectiveness, with less
accurate classifications for blocks with little training data available, although results were still high with a
macro-averaged F1-score of 0.80, when discriminating over 9 different ICD-10 blocks. The error analysis
revealed that word variations (e.g., pneumonitis or pneumonic as variants for pneumonia) as well as cer-
tain word combinations adversely affected classification. In addition, anomalies in the ground truth data
likely led to an underestimation of the effectiveness (i.e., the authors observed some class confusions,
e.g. in ICD blocks E10 versus E11).
Mujtaba et al. tested different text classification methods in the task of coding death certificates
with nine possible ICD-10 codes [4], aiming to assist pathologists in determining causes of death based
on autopsy findings. The dataset used in these experiments was composed of 2, 200 autopsy reports
obtained from one of the largest hospitals in Kuala Lumpur, and the classification methods under study
involved different feature selection schemes, and also five different learning algorithms. Random forests
and J48 decision tree models, parameterized using expert-driven feature selection and leveraging a
feature subset size of 30, yielded the best experimental results (e.g., approximately 90% in terms of the
macro-averaged F1-score).
Lavergne et al. described a large-scale dataset prepared from French death certificates, suitable to
the application of machine learning methods for ICD-10 coding [8]. The dataset comprised a total of
93, 694 death certificates referring to 3, 457 unique ICD-10 codes, and it was made available for interna-
tional shared tasks organized in the context of CLEF. The 2016 edition of the CLEF eHealth shared task
on ICD-10 coding attracted five participating teams, which presented systems relying either on dictionary
linking or statistical machine learning [7]. The shared task was defined at the level of each statement
(i.e., lines varying from 1 to 30 words, with outliers at 120 words and with the most frequent length at 2
tokens) in a death certificate, and statements could be associated with zero, one or more ICD-10 codes.
The best-performing system achieved a micro-averaged F1-score (i.e., harmonic mean of precision and
recall weighted by the class size) of 0.848, leveraging dictionaries built from the shared task data. At the
time of preparing this dissertation, the 2017 edition of the CLEF eHealth shared task was still underway.
Leveraging the dataset from the 2016 CLEF eHealth competition, Zweigenbaum et al. presented
hybrid methods for ICD-10 coding of death certificates [3], combining dictionary linking with supervised
machine learning (i.e., an SVM classifier leveraging tokens, character trigrams, and the year of the
certificate as features). The best hybrid model corresponded to the union of the results produced by the
dictionary-based and learning-based methods, outperforming the best system at the 2016 edition of the
CLEF eHealth shared task with a micro-averaged F1-score of 0.8586.
Table 2.3 presents a brief overview of the datasets that were used in each study described in this
20
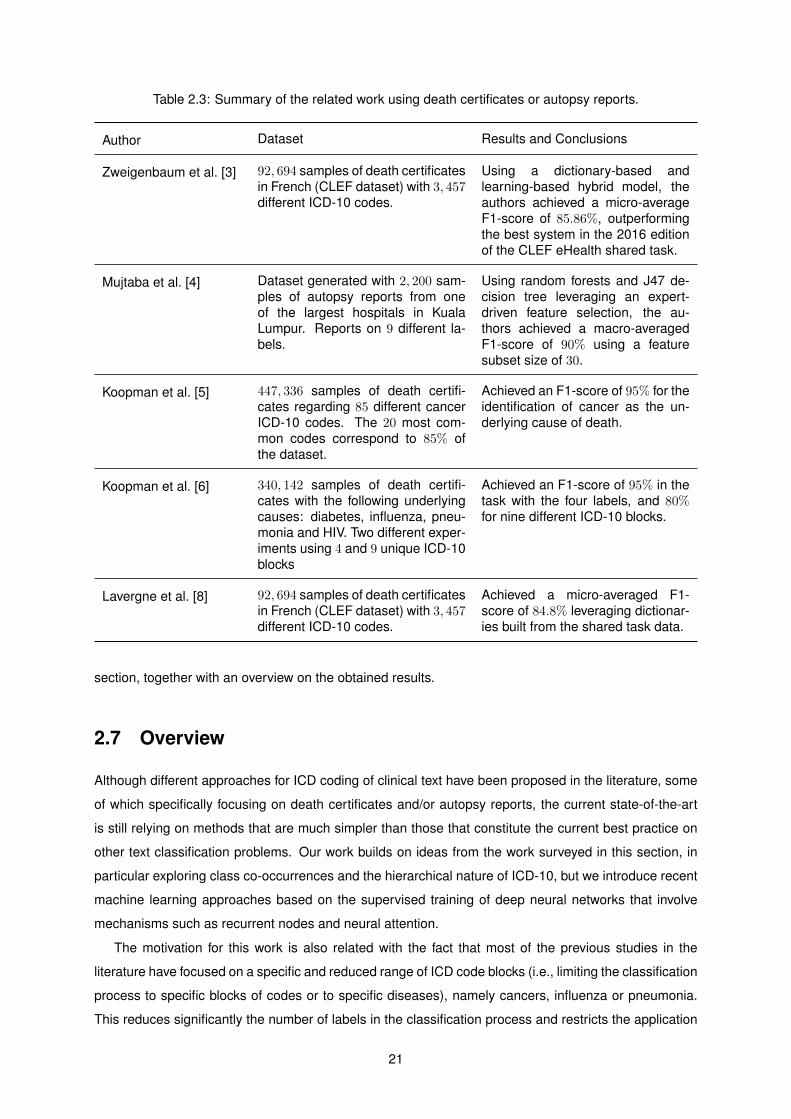
Table 2.3: Summary of the related work using death certificates or autopsy reports.
Author Dataset Results and Conclusions
Zweigenbaum et al. [3] 92, 694 samples of death certificatesin French (CLEF dataset) with 3, 457different ICD-10 codes.
Using a dictionary-based andlearning-based hybrid model, theauthors achieved a micro-averageF1-score of 85.86%, outperformingthe best system in the 2016 editionof the CLEF eHealth shared task.
Mujtaba et al. [4] Dataset generated with 2, 200 sam-ples of autopsy reports from oneof the largest hospitals in KualaLumpur. Reports on 9 different la-bels.
Using random forests and J47 de-cision tree leveraging an expert-driven feature selection, the au-thors achieved a macro-averagedF1-score of 90% using a featuresubset size of 30.
Koopman et al. [5] 447, 336 samples of death certifi-cates regarding 85 different cancerICD-10 codes. The 20 most com-mon codes correspond to 85% ofthe dataset.
Achieved an F1-score of 95% for theidentification of cancer as the un-derlying cause of death.
Koopman et al. [6] 340, 142 samples of death certifi-cates with the following underlyingcauses: diabetes, influenza, pneu-monia and HIV. Two different exper-iments using 4 and 9 unique ICD-10blocks
Achieved an F1-score of 95% in thetask with the four labels, and 80%for nine different ICD-10 blocks.
Lavergne et al. [8] 92, 694 samples of death certificatesin French (CLEF dataset) with 3, 457different ICD-10 codes.
Achieved a micro-averaged F1-score of 84.8% leveraging dictionar-ies built from the shared task data.
section, together with an overview on the obtained results.
2.7 Overview
Although different approaches for ICD coding of clinical text have been proposed in the literature, some
of which specifically focusing on death certificates and/or autopsy reports, the current state-of-the-art
is still relying on methods that are much simpler than those that constitute the current best practice on
other text classification problems. Our work builds on ideas from the work surveyed in this section, in
particular exploring class co-occurrences and the hierarchical nature of ICD-10, but we introduce recent
machine learning approaches based on the supervised training of deep neural networks that involve
mechanisms such as recurrent nodes and neural attention.
The motivation for this work is also related with the fact that most of the previous studies in the
literature have focused on a specific and reduced range of ICD code blocks (i.e., limiting the classification
process to specific blocks of codes or to specific diseases), namely cancers, influenza or pneumonia.
This reduces significantly the number of labels in the classification process and restricts the application
21

of a model to other, more general, scenarios. Also, the usage of autopsy reports and death certificates is
independent in the related literature since most datasets used in previous experiments rely only on one
of these types of inputs. Given the opportunity of accessing available data to combine the information
on these different documents, we believe that this can further improve results.
22

Chapter 3
The Deep Neural Model for ICD-10
Coding
This work presents a deep neural network for assigning ICD-10 codes to underlying causes of death,
by analysis of the free-text contents from death certificates, each associated with the respective clinical
bulletin and autopsy report, taking inspiration on previous work by Yang et al. [10]. Considering the
SICO platform from the Portuguese Ministry of Health’s Directorate-General of Health (DGS), illustrated
on Figure 1.1, the coding task was modeled as follows: given different strings encoding events leading
to death, our model outputs the ICD-10 code of the underlying cause of death.
Figure 3.1 presents the proposed neural network, which is detailed in the next sections. The network
explores a combination of different mechanisms to generate intermediate representations for the textual
contents, such as word embeddings, a hierarchical arrangement of recurrent units, and neural attention.
It also considers multiple outputs in an attempt to further improve classification results (i.e., given the
hierarchical class structure of ICD-10 and since most of the full-codes are only sparsely used in the
training data, using ICD-10 blocks as a secondary classification target can further assist the model train-
ing procedure). Moreover, this work also explores innovative mechanisms for initializing the weights of
the final nodes of the network, leveraging co-occurrences between classes in the training data, together
with the hierarchical structure of ICD-10.
The entire model is trained end-to-end from a set of coded death certificates, leveraging the back-
propagation algorithm [17] in conjunction with the Adam optimization method [18]. At the output nodes
of the network, the model training procedure combines loss functions computed from the ICD-10 full-
code and the ICD-10 block for the main cause of death (i.e., categorical cross-entropy in the two softmax
nodes shown in Figure 3.1), and from the ICD-10 codes encoding auxiliary and contributing conditions
(i.e. a binary cross-entropy in the sigmoid node from the bottom of Figure 3.1, taking inspiration on a
suggestion from Nam et al. [29]), respectively with weights 0.8, 0.85 and 0.75. The implementation of
the model relied mostly on the keras1 deep learning library, although the scikit-learn2 machine learning
1http://keras.io2http://scikit-learn.org
23
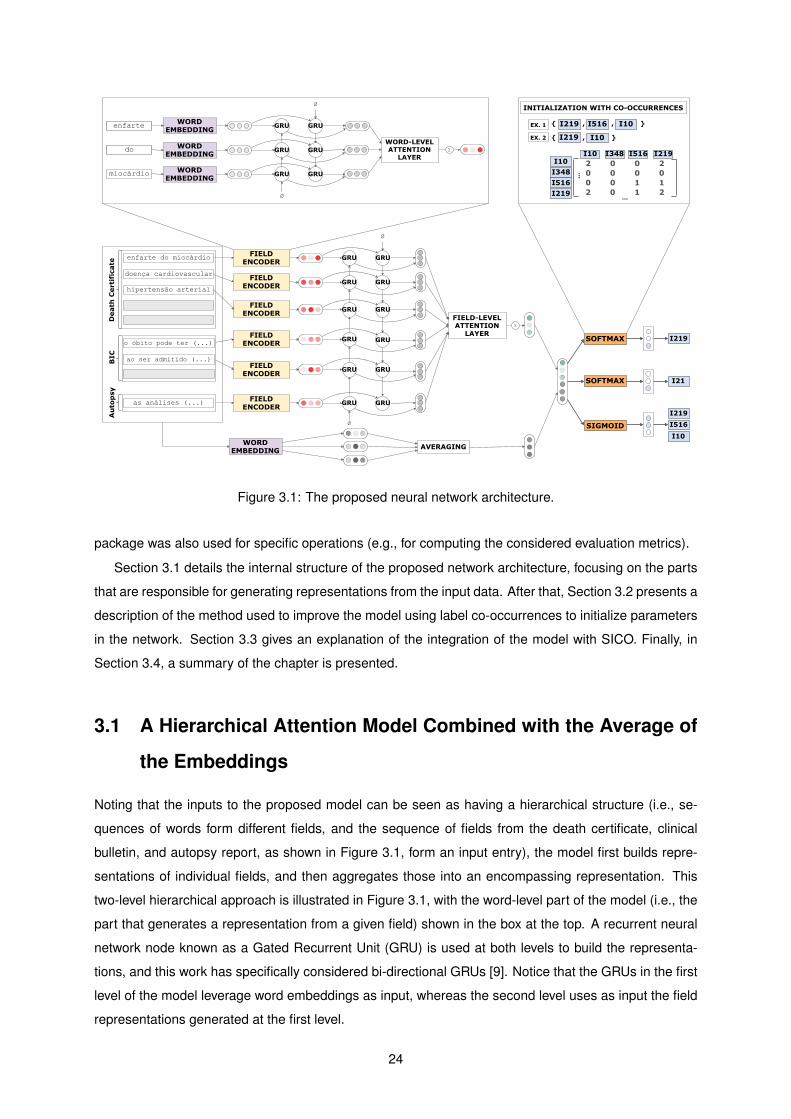
Figure 3.1: The proposed neural network architecture.
package was also used for specific operations (e.g., for computing the considered evaluation metrics).
Section 3.1 details the internal structure of the proposed network architecture, focusing on the parts
that are responsible for generating representations from the input data. After that, Section 3.2 presents a
description of the method used to improve the model using label co-occurrences to initialize parameters
in the network. Section 3.3 gives an explanation of the integration of the model with SICO. Finally, in
Section 3.4, a summary of the chapter is presented.
3.1 A Hierarchical Attention Model Combined with the Average of
the Embeddings
Noting that the inputs to the proposed model can be seen as having a hierarchical structure (i.e., se-
quences of words form different fields, and the sequence of fields from the death certificate, clinical
bulletin, and autopsy report, as shown in Figure 3.1, form an input entry), the model first builds repre-
sentations of individual fields, and then aggregates those into an encompassing representation. This
two-level hierarchical approach is illustrated in Figure 3.1, with the word-level part of the model (i.e., the
part that generates a representation from a given field) shown in the box at the top. A recurrent neural
network node known as a Gated Recurrent Unit (GRU) is used at both levels to build the representa-
tions, and this work has specifically considered bi-directional GRUs [9]. Notice that the GRUs in the first
level of the model leverage word embeddings as input, whereas the second level uses as input the field
representations generated at the first level.
24
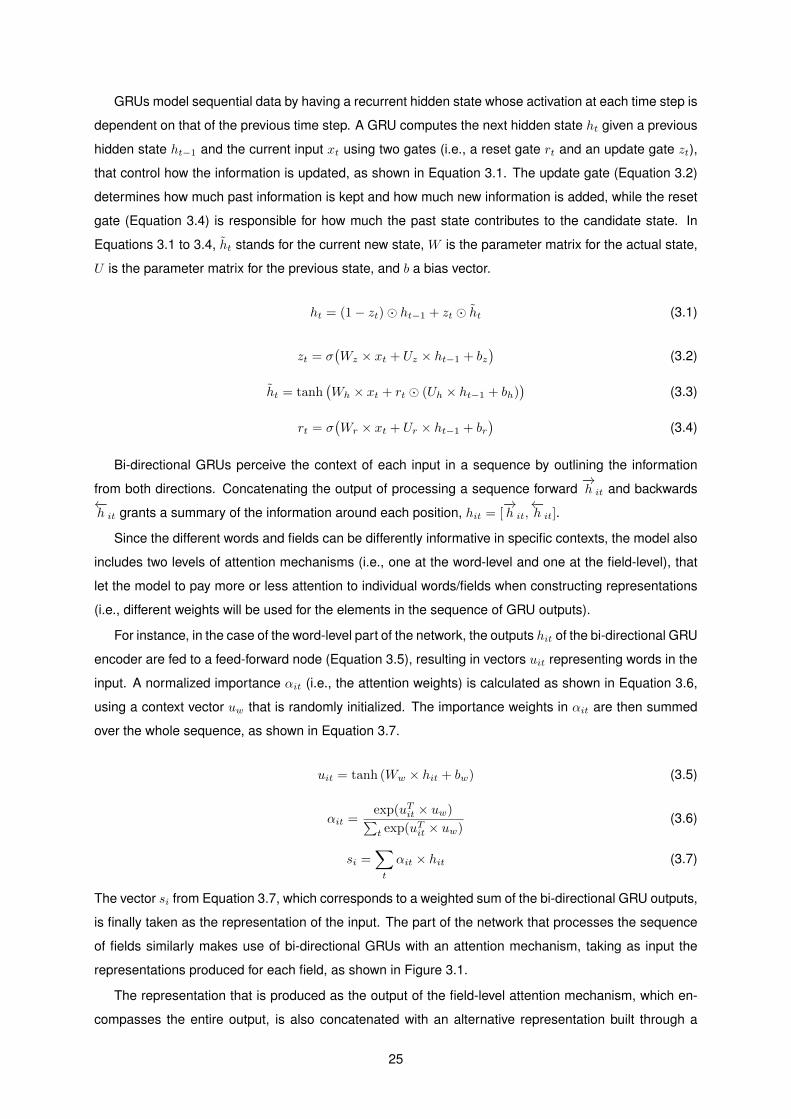
GRUs model sequential data by having a recurrent hidden state whose activation at each time step is
dependent on that of the previous time step. A GRU computes the next hidden state ht given a previous
hidden state ht−1 and the current input xt using two gates (i.e., a reset gate rt and an update gate zt),
that control how the information is updated, as shown in Equation 3.1. The update gate (Equation 3.2)
determines how much past information is kept and how much new information is added, while the reset
gate (Equation 3.4) is responsible for how much the past state contributes to the candidate state. In
Equations 3.1 to 3.4, ht stands for the current new state, W is the parameter matrix for the actual state,
U is the parameter matrix for the previous state, and b a bias vector.
ht = (1− zt)� ht−1 + zt � ht (3.1)
zt = σ(Wz × xt + Uz × ht−1 + bz
)(3.2)
ht = tanh(Wh × xt + rt � (Uh × ht−1 + bh)
)(3.3)
rt = σ(Wr × xt + Ur × ht−1 + br
)(3.4)
Bi-directional GRUs perceive the context of each input in a sequence by outlining the information
from both directions. Concatenating the output of processing a sequence forward−→h it and backwards
←−h it grants a summary of the information around each position, hit = [
−→h it,←−h it].
Since the different words and fields can be differently informative in specific contexts, the model also
includes two levels of attention mechanisms (i.e., one at the word-level and one at the field-level), that
let the model to pay more or less attention to individual words/fields when constructing representations
(i.e., different weights will be used for the elements in the sequence of GRU outputs).
For instance, in the case of the word-level part of the network, the outputs hit of the bi-directional GRU
encoder are fed to a feed-forward node (Equation 3.5), resulting in vectors uit representing words in the
input. A normalized importance αit (i.e., the attention weights) is calculated as shown in Equation 3.6,
using a context vector uw that is randomly initialized. The importance weights in αit are then summed
over the whole sequence, as shown in Equation 3.7.
uit = tanh (Ww × hit + bw) (3.5)
αit =exp(uTit × uw)∑t exp(u
Tit × uw)
(3.6)
si =∑t
αit × hit (3.7)
The vector si from Equation 3.7, which corresponds to a weighted sum of the bi-directional GRU outputs,
is finally taken as the representation of the input. The part of the network that processes the sequence
of fields similarly makes use of bi-directional GRUs with an attention mechanism, taking as input the
representations produced for each field, as shown in Figure 3.1.
The representation that is produced as the output of the field-level attention mechanism, which en-
compasses the entire output, is also concatenated with an alternative representation built through a
25

simpler mechanism which, taking inspiration on the good results reported by Joulin et al. [11], computes
the average of the embeddings for all words in the input fields. The word embeddings are randomly
initialized and adjusted during model training. They are also shared by the hierarchical attention and
the averaging mechanisms, and thus while one part of the model uses multiple parameters to compute
representations for the inputs, the other part of the model can more directly propagate errors back into
the embeddings, so that they can be updated.
3.2 Initializing the Weights of the Output Nodes through Label Co-
Occurrence
In the neural architecture illustrated on Figure 3.1, the representations resulting from the different fields
are finally passed to feed-forward output nodes. Three separate outputs are considered in the model,
namely (i) a softmax node that outputs the ICD-10 full-code of the underlying cause of death, (ii) another
softmax node that outputs the ICD-10 block of the underlying cause of death, and (iii) a sigmoid node
that outputs multiple ICD-10 codes, corresponding to all contributing and auxiliary conditions, together
with the cause of death.
Following the suggestion of Nam et al. [29], the proposed model relies on the sigmoid activation
function and the binary cross-entropy loss function in the case of the node with the model outputs corre-
sponding to multiple ICD-10 codes, given its superior performance in handling multi-label classification
problems. In the training data, the target labels for this node are represented as a binary vector in which
the possible ICD-10 codes are set to one. The two softmax nodes are associated to categorical cross-
entropy loss functions, and the combined loss function from all three outputs corresponds to a weighted
average with weights 0.8, 0.85, and 0.75.
All three output nodes of the model can be initialized with weights that, given the list of auxiliary
codes associated to each instance in the training set, try to capture the co-occurrences between ICD-
10 codes. We tested two different approaches to compute the weight matrices of the output nodes.
One of these approaches is based on the method advanced by Kurata et al. [30], which has also been
previously tested in biomedical text classification [28], leveraging the the Apriori algorithm [31] to find the
most significant and frequent label co-occurrence patterns. The second approach uses a non-negative
matrix factorization [32, 33] over a label co-occurrence matrix, considering a number of components
for the decomposition that is equal to the dimensionality of the combined input representation (i.e., the
dimensionality of the outputs for the node that is located immediately before the output nodes – see the
model architecture in Figure 3.1).
In the first strategy, the initial part of the Apriori algorithm is used for finding the sets ICD-10 codes
that frequently appear together in the training data (i.e., the frequent itemsets). These sets of auxiliary
codes are used to initialize the weight matrices for the output nodes, following the method proposed
by Kurata et al. [30]. For each output node, a matrix Xn,m, where n stands for the dimensionality of
the hidden node immediately before the output node, and where m stands for the dimensionality of the
26

output node, is initialized with the n most common sets of co-occurring ICD-10 labels. Each row in X
represents a label co-occurrence pattern and, in the columns corresponding to the labels occurring in
the pattern, an initialization value v =√f ×
√6√
n+mis attributed [30, 28]. In the previous equation, f
stands for the itemset frequency (i.e., the number of times the co-occurrence pattern appears in the
training data), while n and m respectively correspond to the dimensionality of the hidden and output
nodes. The Apriori algorithm was originally proposed by Agrawal and Srikant [31], leveraging the idea
that if an itemset is infrequent then all its subsets must also be infrequent, in order to reduce the number
of itemsets that need to be analyzed when consolidating the list of frequent itemsets. We start with
itemsets containing just a single label, and then determine their support (i.e., the proportion of instances
in which the itemset appears). We keep the itemsets that meet a minimum support threshold (i.e., 0.001
of the instances), and use them to generate all the possible itemset configurations. These steps are
repeated until there are no more new itemsets. We finally select the n itemsets involving more ICD-10
labels, using support to break ties.
The second technique that was considered for initializing the weights of the output nodes leverages
the components of the decomposition that results from a non-negative matrix factorization (NMF), ap-
plied to a matrix that encodes label co-occurrences in the training data. A square matrix Xm,m, where
m stands for the dimensionality of the output node, is first built from the training data with basis on
label co-occurrence information (i.e., each matrix cell corresponds to the number of co-occurrences of
a pair of ICD-10 labels, and the values at the diagonal simply reflect the frequency of the label in the
training data). To reduce the impact of the most common labels and their prevalence in co-occurrence
information, the Xm,m matrix is scaled with a binary logarithm (i.e., log2 (1 + xi,j) for each matrix entry
xi,j). The NMF is then used to decompose the Xm,m matrix into a product of two matrices, namely
Xm,m ≈ Wm,n × Hn,m, where n stands for the dimensionality of the hidden node that captures the
representation of the input. The matrix Hn,m is finally used as the initialization.
The problem of finding two non-negative matrices W and H whose product is approximately equal to
the original non-negative matrixX relies on minimizing the following objective function with an alternating
minimization of W and H:
argminW,H
1
2‖X −W ×H‖2Frobenius =
1
2
∑i,j
(Xij ×W ×Hij)2 (3.8)
3.3 Integration of the Classifier with SICO
A second stage of this work consisted in the deployment of the proposed automatic classification model
in the workflow of the Portuguese Ministry of Health’s Directorate-General of Health (DGS), envisioning
near real-time cause of death surveillance. This integration allows the automatic classification module
to communicate with the SICO database in order to retrieve data to process as the input, and write data
in the database (i.e., the predicted ICD-10 code for the underlying cause of death).
A Python script was developed to act as an interface between the database and the classification
model. Overall, the software architecture involved in the integration uses five specific Python packages
27
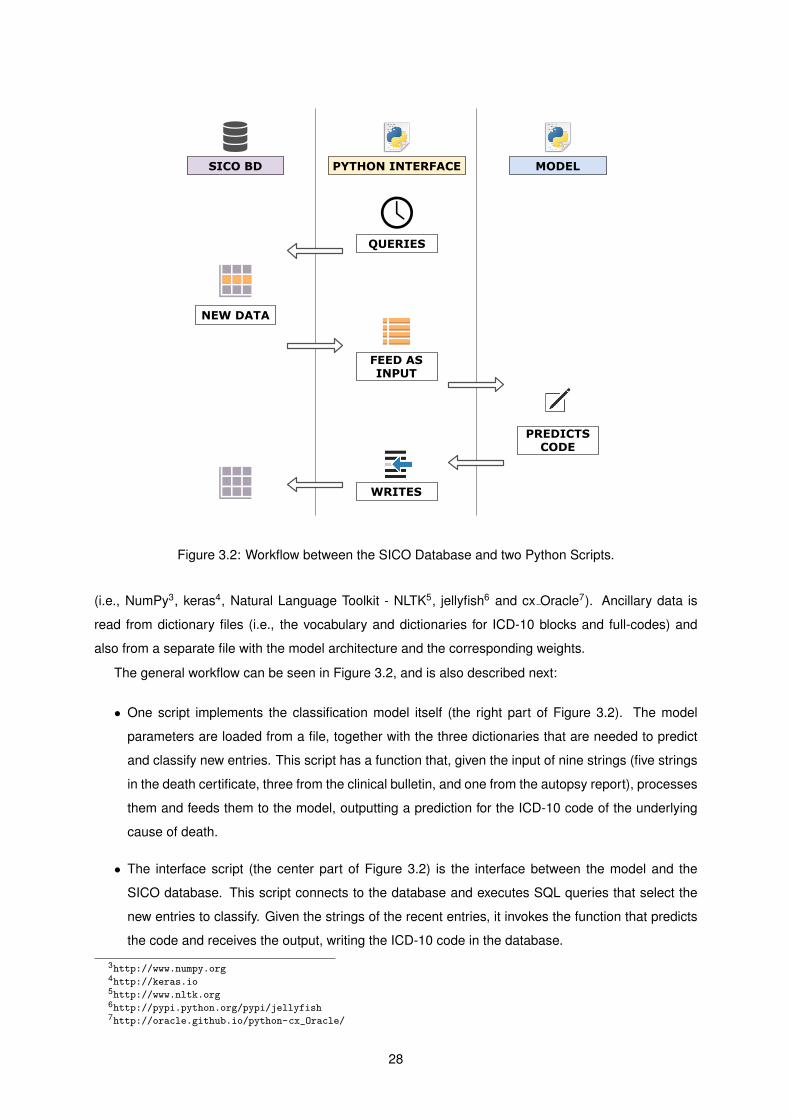
Figure 3.2: Workflow between the SICO Database and two Python Scripts.
(i.e., NumPy3, keras4, Natural Language Toolkit - NLTK5, jellyfish6 and cx Oracle7). Ancillary data is
read from dictionary files (i.e., the vocabulary and dictionaries for ICD-10 blocks and full-codes) and
also from a separate file with the model architecture and the corresponding weights.
The general workflow can be seen in Figure 3.2, and is also described next:
• One script implements the classification model itself (the right part of Figure 3.2). The model
parameters are loaded from a file, together with the three dictionaries that are needed to predict
and classify new entries. This script has a function that, given the input of nine strings (five strings
in the death certificate, three from the clinical bulletin, and one from the autopsy report), processes
them and feeds them to the model, outputting a prediction for the ICD-10 code of the underlying
cause of death.
• The interface script (the center part of Figure 3.2) is the interface between the model and the
SICO database. This script connects to the database and executes SQL queries that select the
new entries to classify. Given the strings of the recent entries, it invokes the function that predicts
the code and receives the output, writing the ICD-10 code in the database.
3http://www.numpy.org4http://keras.io5http://www.nltk.org6http://pypi.python.org/pypi/jellyfish7http://oracle.github.io/python-cx_Oracle/
28

In a pilot test, the scripts ran on a static mirror database, and several experiments were performed
to measure the performance of the model when integrated in a real-time or near real-time surveillance
scenario. Given the rate at which death certificates are emitted in Portugal, the model can be easily
invoked in intervals of 10 minutes (i.e., similarly to the time window currently used in eVM), where the
queries select the new death certificates (or alterations in previously classified entries) that were emitted
in that window of time, so that they can be classified.
3.4 Summary
This chapter detailed the architecture of the proposed neural network model. Section 3.1 discussed
the hierarchical nature of the neural network, the bi-directional GRUs used for building representations,
and the attention mechanism that was used. The average word embedding segment of the model was
also detailed, which attempts to improve the model performance. The hierarchical structure of both
the ICD-10 classification system and of the documents (i.e., different fields form each document and
different words form each field) is explored. The usage of bi-directional GRUs ensures that the context
of each word in a field is captured as well as the context of a field in the input record itself. The attention
mechanism provides a way of giving more or less importance to each word and field, allowing the model
to focus on those that matter the most to the classification of each instance. The concatenation of the
representations that are produced as the output of the field-level attention mechanism with the alternative
representation built through the simpler average word embedding mechanism, was experimented as a
complementary source to improve the error propagation to the embeddings, and to contribute to the
model learning ability.
Section 3.2 presented the approaches used to initialize the model parameters, in order to capture
information regarding label co-occurrence, using both the Apriori algorithm and non-negative matrix
factorization. This initialization takes advantage of the natural relation between labels.
Finally, Section 3.3 presented the implementation requirements from the Portuguese Ministry of
Health (DGS) together with a description of the script implemented to act as the interface between the
proposed automatic classification model and the SICO database, supporting near real-time surveillance
in the future.
29

30

Chapter 4
Experimental Evaluation
This chapter describes the experimental evaluation of the proposed method. Section 4.1 presents a sta-
tistical characterization of the datasets that supported the tests, together with the considered experimen-
tal methodology. Section 4.2 presents and discusses the obtained results over the main the test set with
data from 2013–2015. Section 4.3 presents the results on a set of experiments on data from 2016, that
attempted to assess the generalization capabilities of the model. Section 4.4 focuses on the attention
mechanism, illustrating its advantages in terms of the interpretability of the results. Section 4.5 details
the initial experiments regarding the performance of the interface between the classification model and
SICO. Finally, Section 4.6 gives an overview of the results that were obtained.
4.1 Dataset and Experimental Methodology
The main dataset used in the experiments consists of the death certificates in SICO for the years 2013 to
2015, excluding neonatal and perinatal mortality. All supplemental clinical bulletin and autopsy reports
were included, although these cases mostly corresponded to deaths associated to accidents, suicides,
or homicides. A simple statistical profile of the dataset is given in Table 4.1.
For each death certificate, the textual contents of the SICO fields labeled from a) to d) in Part I,
as well as the contents from Part II were used as inputs to the model, in each case concatenating the
strings labeled as Outro, Valor and Tempo – see Figure 1.1. The fields Valor and Tempo can be used to
encode the approximated interval between the onset of the respective condition and the date of death,
which can be relevant in cases like a stroke that occurred much before the time of death. Hence, we
decided to also include this information in the textual contents that are analyzed by the model, together
with the string labeled as Outro.
Notice that the clinical bulletins and autopsy reports are small free-text documents that can be asso-
ciated with a death certificate. A clinical bulletin contains additional information or the clinical situation of
the deceased. It is filled by the doctor before the death certificate, being mandatory in cases of violent
deaths or unknown causes of death. A clinical bulletin comprises six fields: circumstances of admission,
clinical situation, clinical evolution, complementary exams, clinical background, and diagnosis. Only the
31
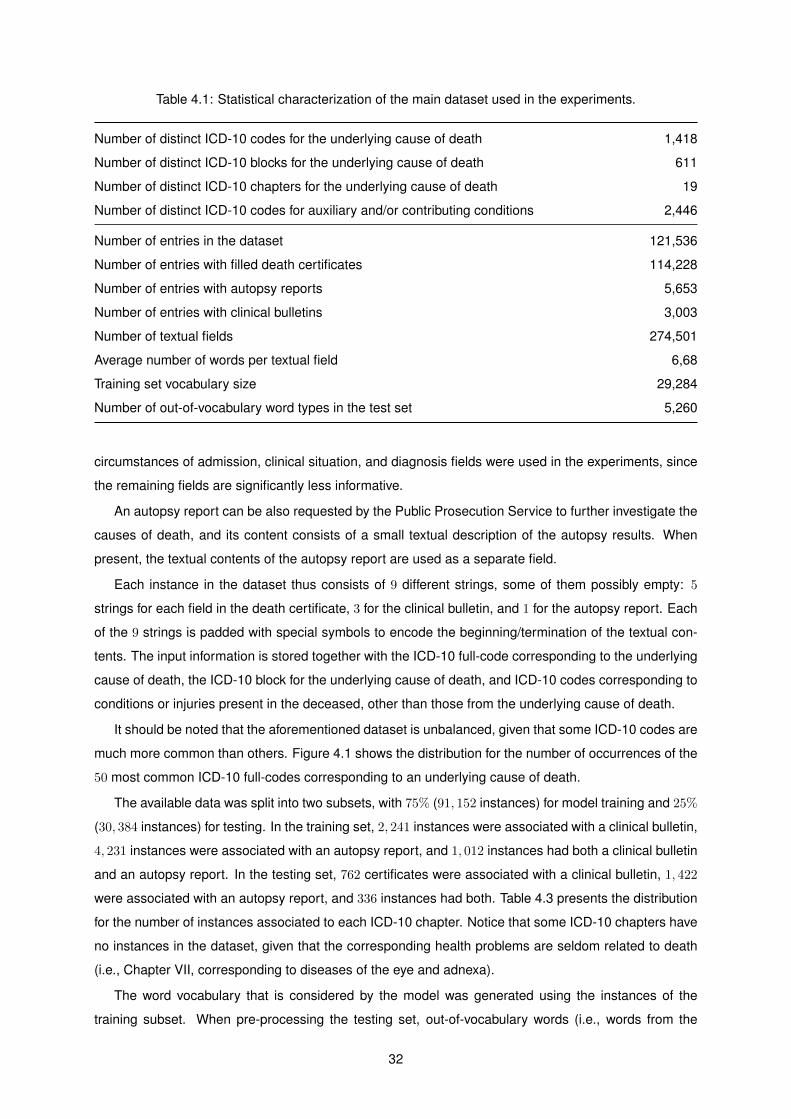
Table 4.1: Statistical characterization of the main dataset used in the experiments.
Number of distinct ICD-10 codes for the underlying cause of death 1,418
Number of distinct ICD-10 blocks for the underlying cause of death 611
Number of distinct ICD-10 chapters for the underlying cause of death 19
Number of distinct ICD-10 codes for auxiliary and/or contributing conditions 2,446
Number of entries in the dataset 121,536
Number of entries with filled death certificates 114,228
Number of entries with autopsy reports 5,653
Number of entries with clinical bulletins 3,003
Number of textual fields 274,501
Average number of words per textual field 6,68
Training set vocabulary size 29,284
Number of out-of-vocabulary word types in the test set 5,260
circumstances of admission, clinical situation, and diagnosis fields were used in the experiments, since
the remaining fields are significantly less informative.
An autopsy report can be also requested by the Public Prosecution Service to further investigate the
causes of death, and its content consists of a small textual description of the autopsy results. When
present, the textual contents of the autopsy report are used as a separate field.
Each instance in the dataset thus consists of 9 different strings, some of them possibly empty: 5
strings for each field in the death certificate, 3 for the clinical bulletin, and 1 for the autopsy report. Each
of the 9 strings is padded with special symbols to encode the beginning/termination of the textual con-
tents. The input information is stored together with the ICD-10 full-code corresponding to the underlying
cause of death, the ICD-10 block for the underlying cause of death, and ICD-10 codes corresponding to
conditions or injuries present in the deceased, other than those from the underlying cause of death.
It should be noted that the aforementioned dataset is unbalanced, given that some ICD-10 codes are
much more common than others. Figure 4.1 shows the distribution for the number of occurrences of the
50 most common ICD-10 full-codes corresponding to an underlying cause of death.
The available data was split into two subsets, with 75% (91, 152 instances) for model training and 25%
(30, 384 instances) for testing. In the training set, 2, 241 instances were associated with a clinical bulletin,
4, 231 instances were associated with an autopsy report, and 1, 012 instances had both a clinical bulletin
and an autopsy report. In the testing set, 762 certificates were associated with a clinical bulletin, 1, 422
were associated with an autopsy report, and 336 instances had both. Table 4.3 presents the distribution
for the number of instances associated to each ICD-10 chapter. Notice that some ICD-10 chapters have
no instances in the dataset, given that the corresponding health problems are seldom related to death
(i.e., Chapter VII, corresponding to diseases of the eye and adnexa).
The word vocabulary that is considered by the model was generated using the instances of the
training subset. When pre-processing the testing set, out-of-vocabulary words (i.e., words from the
32
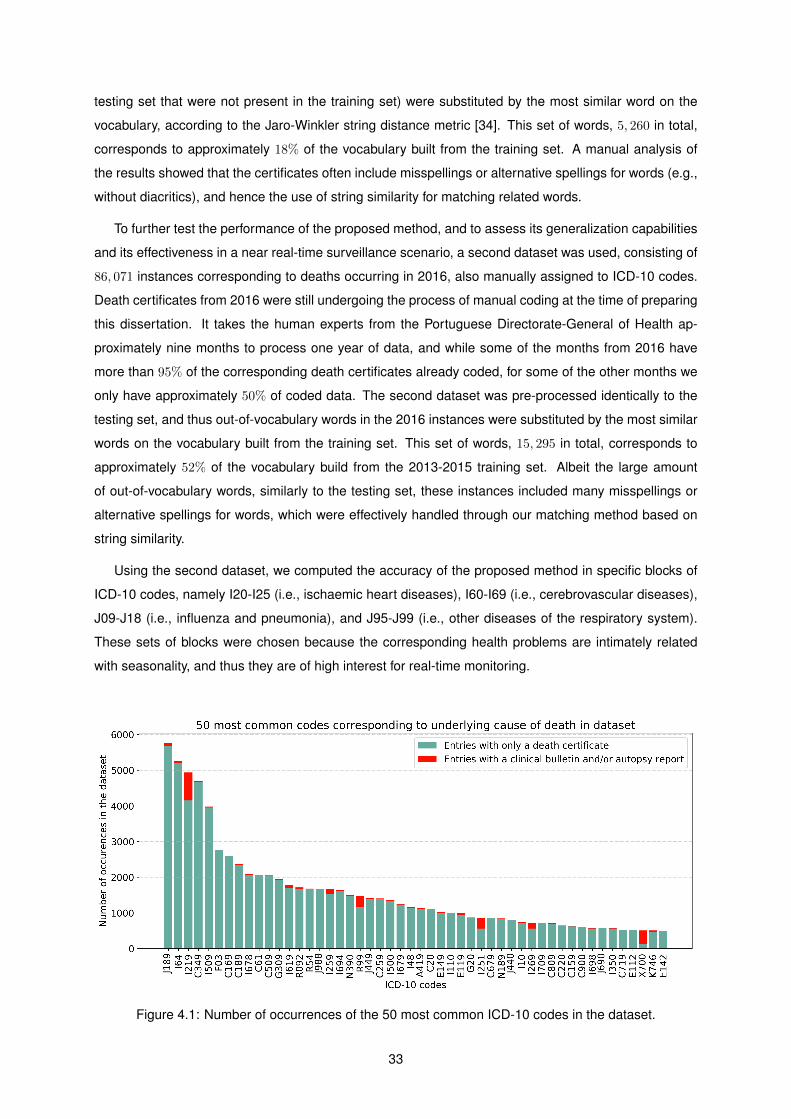
testing set that were not present in the training set) were substituted by the most similar word on the
vocabulary, according to the Jaro-Winkler string distance metric [34]. This set of words, 5, 260 in total,
corresponds to approximately 18% of the vocabulary built from the training set. A manual analysis of
the results showed that the certificates often include misspellings or alternative spellings for words (e.g.,
without diacritics), and hence the use of string similarity for matching related words.
To further test the performance of the proposed method, and to assess its generalization capabilities
and its effectiveness in a near real-time surveillance scenario, a second dataset was used, consisting of
86, 071 instances corresponding to deaths occurring in 2016, also manually assigned to ICD-10 codes.
Death certificates from 2016 were still undergoing the process of manual coding at the time of preparing
this dissertation. It takes the human experts from the Portuguese Directorate-General of Health ap-
proximately nine months to process one year of data, and while some of the months from 2016 have
more than 95% of the corresponding death certificates already coded, for some of the other months we
only have approximately 50% of coded data. The second dataset was pre-processed identically to the
testing set, and thus out-of-vocabulary words in the 2016 instances were substituted by the most similar
words on the vocabulary built from the training set. This set of words, 15, 295 in total, corresponds to
approximately 52% of the vocabulary build from the 2013-2015 training set. Albeit the large amount
of out-of-vocabulary words, similarly to the testing set, these instances included many misspellings or
alternative spellings for words, which were effectively handled through our matching method based on
string similarity.
Using the second dataset, we computed the accuracy of the proposed method in specific blocks of
ICD-10 codes, namely I20-I25 (i.e., ischaemic heart diseases), I60-I69 (i.e., cerebrovascular diseases),
J09-J18 (i.e., influenza and pneumonia), and J95-J99 (i.e., other diseases of the respiratory system).
These sets of blocks were chosen because the corresponding health problems are intimately related
with seasonality, and thus they are of high interest for real-time monitoring.
Figure 4.1: Number of occurrences of the 50 most common ICD-10 codes in the dataset.
33
All experiments relied on the keras1 deep learning library, and the tests involving non-negative matrix
factorization relied on an implementation from the scikit-learn library2. The word embedding layer in the
first level of the model considered a dimensionality of 175, and the output of the GRUs had a dimension-
ality of 175 as well. Model training was made in batches of 32 instances, using the Adam optimization
algorithm [18] with default parameters. Model training also considered a stopping criteria based on the
combined training loss, finishing when the difference between epochs was less than 0.3.
For assessing the quality of the model predictions, the classification accuracy over the test split was
measured, as well as the macro-averaged precision, recall and F1-scores (i.e., macro-averages assign
an equal importance to each class, thus providing useful information in the case of datasets with a
highly unbalanced class distribution and when the system is required to perform consistently across all
classes, regardless of how densely populated these are). Given the hierarchical organization of ICD-10,
results according to different levels of specialization for ICD-10 terms were also measured, considering
chapters, blocks, and full-codes. Similar measurements were also taken with the dataset of instances
from 2016, e.g. for assessing the generalization capability of the model.
4.2 Experimental Results using a Test Sample from 2013-2015
The first set of experiments compared six different neural network architectures, in an attempt to assess
the contribution of the different mechanisms that were considered in the full model. These are as follows:
1. A model that only uses the average word embedding mechanism;
2. A hierarchical model with two levels of GRUs but without the attention mechanisms, thus using the
hidden states at the edges of the sequences in order to build the intermediate representations;
3. A hierarchical model with two levels of GRUs and with the attention mechanisms at each level,
inspired on the proposal from Yang et al. [10];
4. A model that combines the previous hierarchical attention approach with the average word embed-
ding mechanism;
5. The full model combining hierarchical attention and average word embeddings, as described in
Chapter 3, with 3 output nodes and initializing the weights of the output nodes by exploring frequent
co-occurrence patterns;
6. The full model, as described in Chapter 3, leveraging non-negative matrix factorization for initializ-
ing the weights of the output nodes.
Table 4.2 presents the results obtained by each model, and Table 4.3 further details the results
obtained with Model 6 (i.e., the one that achieved the best results when assigning full-codes, for most
of the metrics and particularly for the macro-averaged F1-score), showing evaluation scores for each
1http://keras.io2http://scikit-learn.org
34
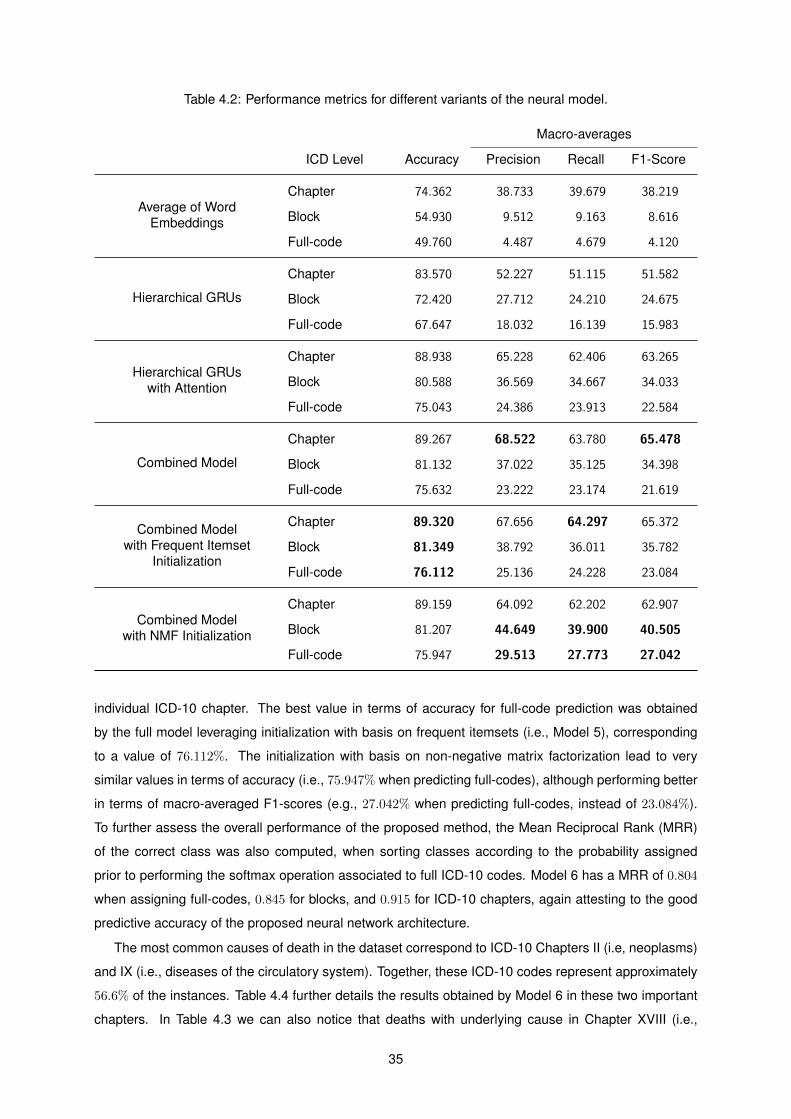
Table 4.2: Performance metrics for different variants of the neural model.
Macro-averages
ICD Level Accuracy Precision Recall F1-Score
Average of WordEmbeddings
Chapter 74.362 38.733 39.679 38.219
Block 54.930 9.512 9.163 8.616
Full-code 49.760 4.487 4.679 4.120
Hierarchical GRUs
Chapter 83.570 52.227 51.115 51.582
Block 72.420 27.712 24.210 24.675
Full-code 67.647 18.032 16.139 15.983
Hierarchical GRUswith Attention
Chapter 88.938 65.228 62.406 63.265
Block 80.588 36.569 34.667 34.033
Full-code 75.043 24.386 23.913 22.584
Combined Model
Chapter 89.267 68.522 63.780 65.478
Block 81.132 37.022 35.125 34.398
Full-code 75.632 23.222 23.174 21.619
Combined Modelwith Frequent Itemset
Initialization
Chapter 89.320 67.656 64.297 65.372
Block 81.349 38.792 36.011 35.782
Full-code 76.112 25.136 24.228 23.084
Combined Modelwith NMF Initialization
Chapter 89.159 64.092 62.202 62.907
Block 81.207 44.649 39.900 40.505
Full-code 75.947 29.513 27.773 27.042
individual ICD-10 chapter. The best value in terms of accuracy for full-code prediction was obtained
by the full model leveraging initialization with basis on frequent itemsets (i.e., Model 5), corresponding
to a value of 76.112%. The initialization with basis on non-negative matrix factorization lead to very
similar values in terms of accuracy (i.e., 75.947% when predicting full-codes), although performing better
in terms of macro-averaged F1-scores (e.g., 27.042% when predicting full-codes, instead of 23.084%).
To further assess the overall performance of the proposed method, the Mean Reciprocal Rank (MRR)
of the correct class was also computed, when sorting classes according to the probability assigned
prior to performing the softmax operation associated to full ICD-10 codes. Model 6 has a MRR of 0.804
when assigning full-codes, 0.845 for blocks, and 0.915 for ICD-10 chapters, again attesting to the good
predictive accuracy of the proposed neural network architecture.
The most common causes of death in the dataset correspond to ICD-10 Chapters II (i.e, neoplasms)
and IX (i.e., diseases of the circulatory system). Together, these ICD-10 codes represent approximately
56.6% of the instances. Table 4.4 further details the results obtained by Model 6 in these two important
chapters. In Table 4.3 we can also notice that deaths with underlying cause in Chapter XVIII (i.e.,
35
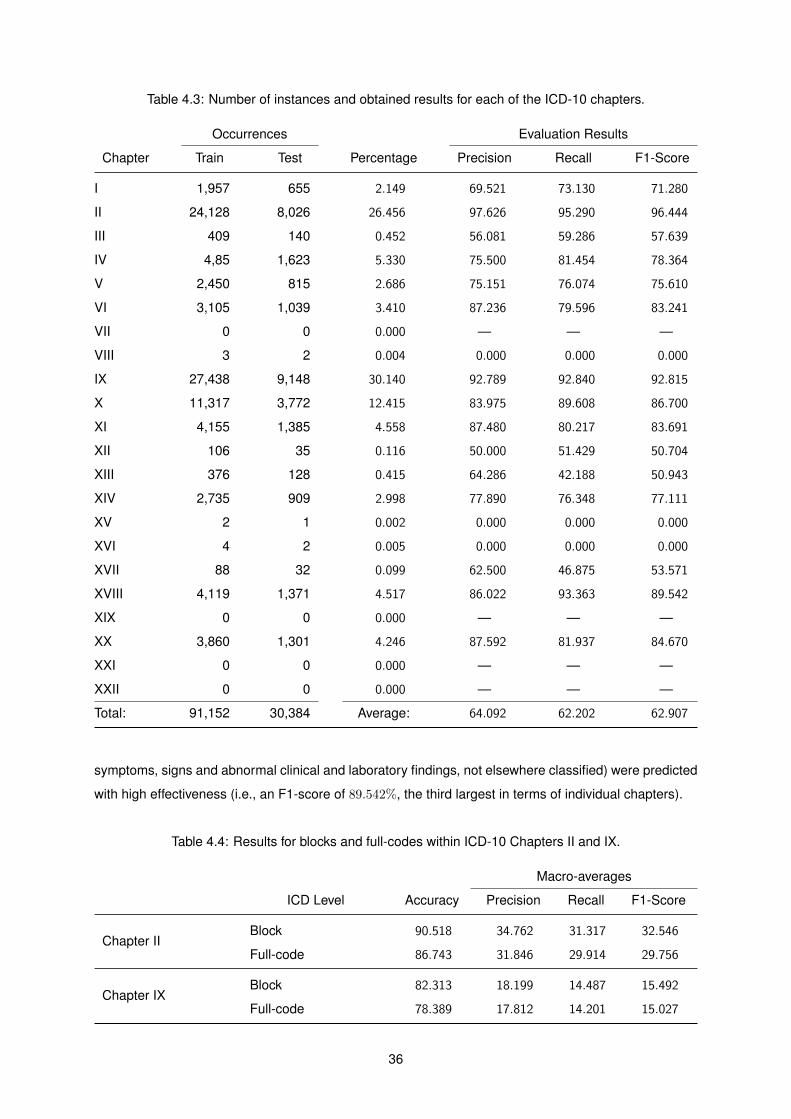
Table 4.3: Number of instances and obtained results for each of the ICD-10 chapters.
Occurrences Evaluation Results
Chapter Train Test Percentage Precision Recall F1-Score
I 1,957 655 2.149 69.521 73.130 71.280
II 24,128 8,026 26.456 97.626 95.290 96.444
III 409 140 0.452 56.081 59.286 57.639
IV 4,85 1,623 5.330 75.500 81.454 78.364
V 2,450 815 2.686 75.151 76.074 75.610
VI 3,105 1,039 3.410 87.236 79.596 83.241
VII 0 0 0.000 — — —
VIII 3 2 0.004 0.000 0.000 0.000
IX 27,438 9,148 30.140 92.789 92.840 92.815
X 11,317 3,772 12.415 83.975 89.608 86.700
XI 4,155 1,385 4.558 87.480 80.217 83.691
XII 106 35 0.116 50.000 51.429 50.704
XIII 376 128 0.415 64.286 42.188 50.943
XIV 2,735 909 2.998 77.890 76.348 77.111
XV 2 1 0.002 0.000 0.000 0.000
XVI 4 2 0.005 0.000 0.000 0.000
XVII 88 32 0.099 62.500 46.875 53.571
XVIII 4,119 1,371 4.517 86.022 93.363 89.542
XIX 0 0 0.000 — — —
XX 3,860 1,301 4.246 87.592 81.937 84.670
XXI 0 0 0.000 — — —
XXII 0 0 0.000 — — —
Total: 91,152 30,384 Average: 64.092 62.202 62.907
symptoms, signs and abnormal clinical and laboratory findings, not elsewhere classified) were predicted
with high effectiveness (i.e., an F1-score of 89.542%, the third largest in terms of individual chapters).
Table 4.4: Results for blocks and full-codes within ICD-10 Chapters II and IX.
Macro-averages
ICD Level Accuracy Precision Recall F1-Score
Chapter IIBlock 90.518 34.762 31.317 32.546
Full-code 86.743 31.846 29.914 29.756
Chapter IXBlock 82.313 18.199 14.487 15.492
Full-code 78.389 17.812 14.201 15.027
36

Table 4.5: Results for the 10 most common ICD-10 codes in the dataset.
ICD-10 Description Precision Recall F1-Score
J189 Pneumonia, unspecified 83.398 89.652 86.412
I64 Stroke, not specified as haemorrhage or infarction 88.996 91.635 90.296
I219 Acute myocardial infarction, unspecified 90.134 92.545 91.324
C349 Malignant neoplasm of bronchus and lung,unspecified
94.658 96.347 95.495
I509 Heart failure, unspecified 87.132 89.146 88.127
F03 Unspecified dementia 74.894 76.191 75.537
C169 Malignant neoplasm of stomach, unspecified 95.699 95.699 95.699
C189 Malignant neoplasm of colon, unspecified 96.232 95.093 95.660
I678 Other specified cerebrovascular diseases 77.453 86.042 81.522
C61 Malignant neoplasm of prostate 91.477 93.424 92.440
Average: 88.007 90.577 89.251
Some of the previous studies addressing the automatic coding death certificates have focused on
deaths related to cancer [5]. When considering the 20 most common ICD cancer blocks in the test
split of the data, Model 6 achieves a macro-averaged F1-score of 92.254%. Noticing that the dataset is
unbalanced, the 50 most common ICD-10 full-codes in the dataset were also considered (i.e., the codes
shown in Figure 4.1) and Model 6 achieves a macro-averaged F1-score of 80.573%.
When considering the 10 most common ICD-10 full-codes, Table 4.5 presents the detailed perfor-
mance measures per code, using Model 6 over instances from the testing set. The model obtained a
mean precision of 88.007, recall of 90.577 and F1-score of 89.251.
To assess the impact of the information in the autopsy reports over model predictions, a separate
experiment was conducted using the 1, 422 test instances that are associated with an autopsy report.
Approximately 51% of those instances have an underlying cause of death from Chapter XX (i.e., external
causes of morbidity and mortality, namely, accidents, intentional self-harm, assault and others), and
approximately 32% are associated to ICD-10 codes from Chapter IX (i.e., diseases of the circulatory
system). Table 4.6 presents the obtained results, using Model 6 with parameters inferred from the
complete training dataset, comparing the use of the complete input data against (a) using only the
autopsy reports, or (b) using only the death certificates and the clinical bulletins, when available. The
results confirm the importance of using the descriptions in the autopsy reports. A manual analysis of
the data also showed that, for deaths associated to ICD-10 Chapter XX, the death certificates are often
incomplete and the underlying cause is only described in the autopsy report.
To further evaluate the performance of the model, another experiment was conducted, giving special
attention to the following four ICD-10 blocks of diseases:
37
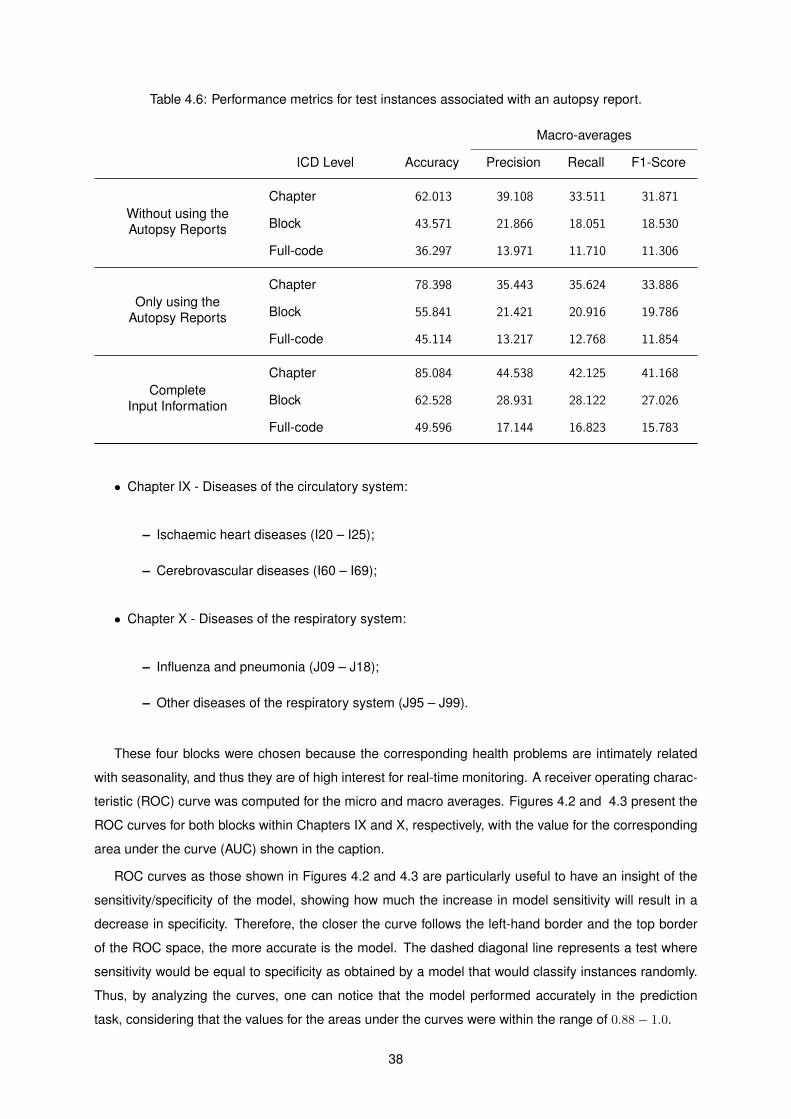
Table 4.6: Performance metrics for test instances associated with an autopsy report.
Macro-averages
ICD Level Accuracy Precision Recall F1-Score
Without using theAutopsy Reports
Chapter 62.013 39.108 33.511 31.871
Block 43.571 21.866 18.051 18.530
Full-code 36.297 13.971 11.710 11.306
Only using theAutopsy Reports
Chapter 78.398 35.443 35.624 33.886
Block 55.841 21.421 20.916 19.786
Full-code 45.114 13.217 12.768 11.854
CompleteInput Information
Chapter 85.084 44.538 42.125 41.168
Block 62.528 28.931 28.122 27.026
Full-code 49.596 17.144 16.823 15.783
• Chapter IX - Diseases of the circulatory system:
– Ischaemic heart diseases (I20 – I25);
– Cerebrovascular diseases (I60 – I69);
• Chapter X - Diseases of the respiratory system:
– Influenza and pneumonia (J09 – J18);
– Other diseases of the respiratory system (J95 – J99).
These four blocks were chosen because the corresponding health problems are intimately related
with seasonality, and thus they are of high interest for real-time monitoring. A receiver operating charac-
teristic (ROC) curve was computed for the micro and macro averages. Figures 4.2 and 4.3 present the
ROC curves for both blocks within Chapters IX and X, respectively, with the value for the corresponding
area under the curve (AUC) shown in the caption.
ROC curves as those shown in Figures 4.2 and 4.3 are particularly useful to have an insight of the
sensitivity/specificity of the model, showing how much the increase in model sensitivity will result in a
decrease in specificity. Therefore, the closer the curve follows the left-hand border and the top border
of the ROC space, the more accurate is the model. The dashed diagonal line represents a test where
sensitivity would be equal to specificity as obtained by a model that would classify instances randomly.
Thus, by analyzing the curves, one can notice that the model performed accurately in the prediction
task, considering that the values for the areas under the curves were within the range of 0.88− 1.0.
38
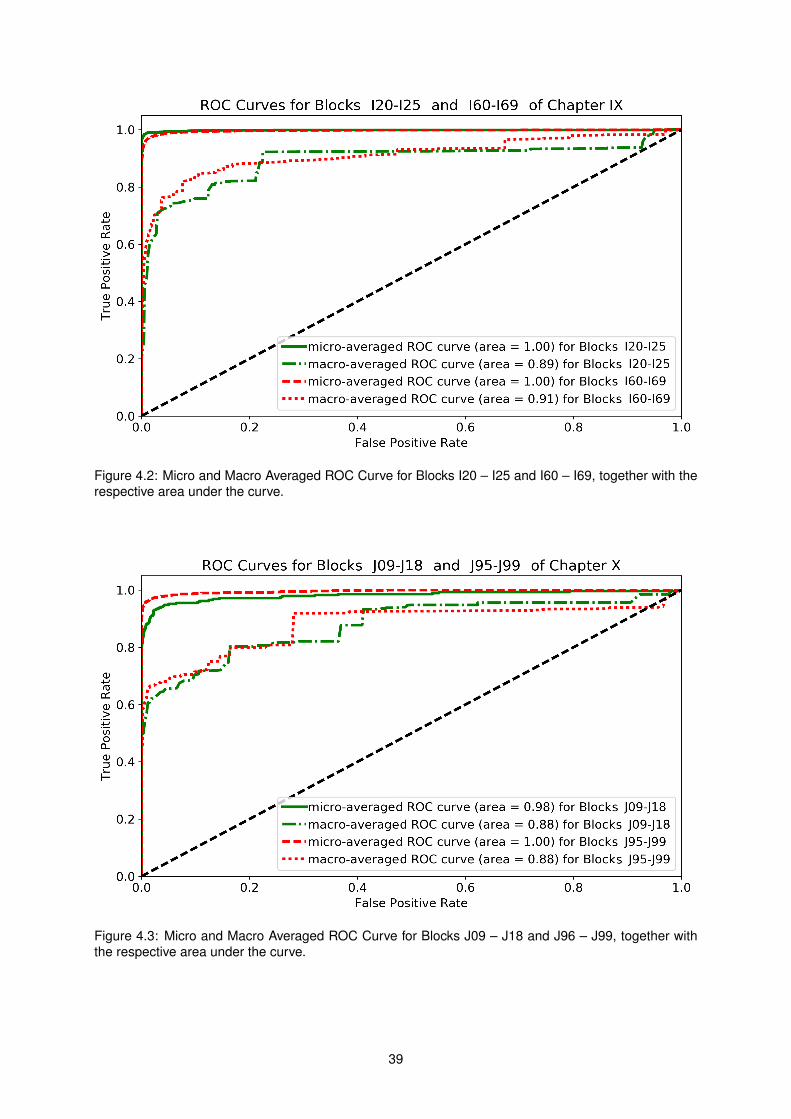
Figure 4.2: Micro and Macro Averaged ROC Curve for Blocks I20 – I25 and I60 – I69, together with therespective area under the curve.
Figure 4.3: Micro and Macro Averaged ROC Curve for Blocks J09 – J18 and J96 – J99, together withthe respective area under the curve.
39

4.3 Experimental Results using 2016 Data
In 2016 there were a total of 111, 279 deaths in Portugal and, by July of 2017, a fraction of 77.3% of
these cases, corresponding to 86, 071 death certificates, had already been manually reviewed and coded
according to ICD-10. A second round of experiments attempted to classify these 86,071 instances from
2016, leveraging Model 6 from the previous experiments, trained with data from 2013-2015. The number
of instances for each of the ICD-10 chapters in the 2016 dataset is similar to the one in Table 4.3, and the
performance metrics for ICD-10 chapters, blocks and full-codes can be seen in Table 4.7. The accuracy
values are very similar to those obtained from the test subset (i.e., an accuracy of 75.901% for full-codes,
80.615% for blocks, and 89.129% for chapters), confirming that the proposed approach can generalize
across different time periods. For comparison, Table 4.7 also presents results for ICD-10 Chapters II
and IX, although in this case showing worse results than those reported on Table 4.4.
Given the motivation of using automatic classification to monitor the prevalence of specific causes
of death in near real-time, weekly time-series of deaths occurring on 2016 were used to compare the
assignments of the DGS mortality coders against the assignments produced by the proposed neural net-
work architecture. Figures 4.4 to 4.7 show the percentage of weekly occurrences for specific groups of
ICD-10 codes. The black solid line corresponds to the percentage of occurrences per week, as assigned
by the human coders, whereas the black dashed line corresponds to the percentage of occurrences es-
timated by the proposed model (i.e., the true positives plus the false positives). The true positives of the
model are shown in the green lines, and the false positives are shown in red.
Figures 4.4 and 4.5 illustrate the results for two blocks of ICD-10 codes from Chapter IX, respec-
tively ischaemic heart diseases, and cerebrovascular diseases. In both cases, the model made zero
false positive predictions, only slightly under-estimating the number of diseased individuals. The mean
absolute differences between the manually-assigned codes and the model predictions was 0.578% for
ischaemic heart diseases (Figure 4.4) and 0.873% for cerebrovascular diseases (Figure 4.5), with maxi-
mum differences between the number of occurrences respectively at 1.003% and 1.852%.
In turn, Figures 4.6 and 4.7 illustrate the results for two blocks of ICD-10 codes from Chapter X,
Table 4.7: Performance metrics over the 2016 dataset.
Macro-averages
ICD Level Accuracy Precision Recall F1-Score
All Chapters
Chapter 89.129 59.994 52.748 54.510
Block 80.615 34.938 29.525 30.363
Full-code 75.901 21.349 19.343 18.832
Chapter IIBlock 89.991 27.142 24.210 25.203
Full-code 86.367 24.495 22.085 22.197
Chapter IXBlock 80.811 14.874 10.432 11.687
Full-code 77.107 13.939 10.761 11.353
40
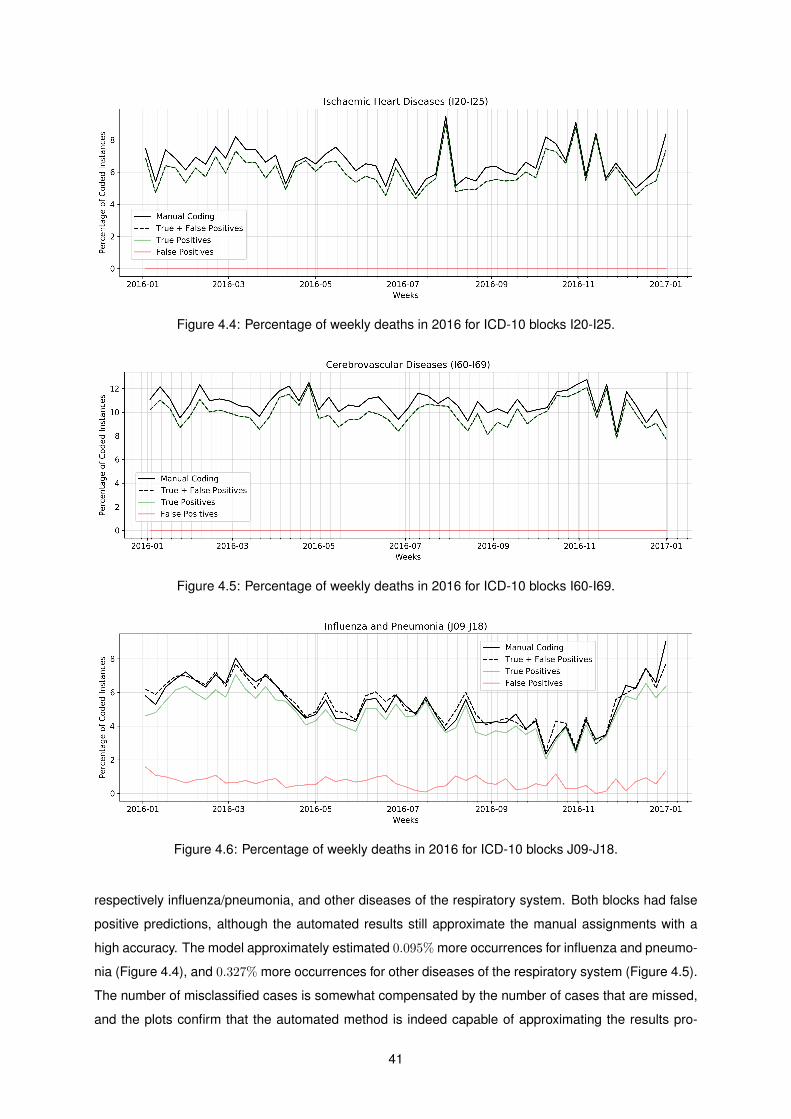
Figure 4.4: Percentage of weekly deaths in 2016 for ICD-10 blocks I20-I25.
Figure 4.5: Percentage of weekly deaths in 2016 for ICD-10 blocks I60-I69.
Figure 4.6: Percentage of weekly deaths in 2016 for ICD-10 blocks J09-J18.
respectively influenza/pneumonia, and other diseases of the respiratory system. Both blocks had false
positive predictions, although the automated results still approximate the manual assignments with a
high accuracy. The model approximately estimated 0.095% more occurrences for influenza and pneumo-
nia (Figure 4.4), and 0.327% more occurrences for other diseases of the respiratory system (Figure 4.5).
The number of misclassified cases is somewhat compensated by the number of cases that are missed,
and the plots confirm that the automated method is indeed capable of approximating the results pro-
41
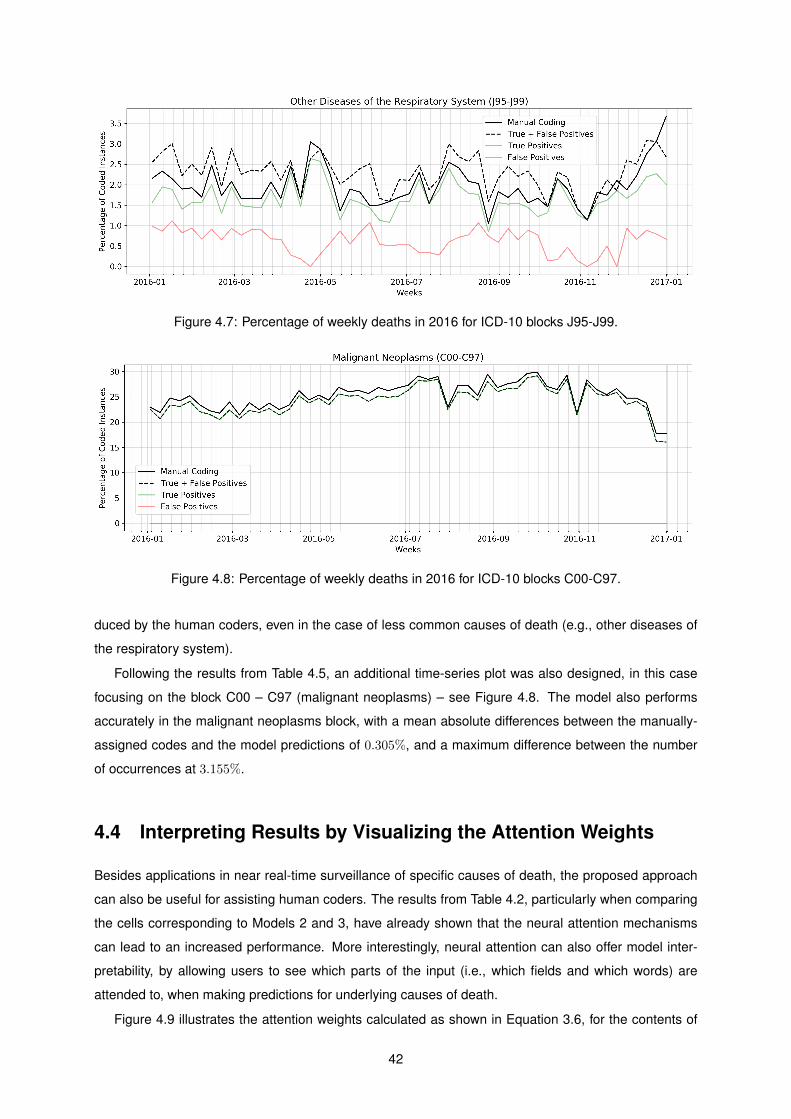
Figure 4.7: Percentage of weekly deaths in 2016 for ICD-10 blocks J95-J99.
Figure 4.8: Percentage of weekly deaths in 2016 for ICD-10 blocks C00-C97.
duced by the human coders, even in the case of less common causes of death (e.g., other diseases of
the respiratory system).
Following the results from Table 4.5, an additional time-series plot was also designed, in this case
focusing on the block C00 – C97 (malignant neoplasms) – see Figure 4.8. The model also performs
accurately in the malignant neoplasms block, with a mean absolute differences between the manually-
assigned codes and the model predictions of 0.305%, and a maximum difference between the number
of occurrences at 3.155%.
4.4 Interpreting Results by Visualizing the Attention Weights
Besides applications in near real-time surveillance of specific causes of death, the proposed approach
can also be useful for assisting human coders. The results from Table 4.2, particularly when comparing
the cells corresponding to Models 2 and 3, have already shown that the neural attention mechanisms
can lead to an increased performance. More interestingly, neural attention can also offer model inter-
pretability, by allowing users to see which parts of the input (i.e., which fields and which words) are
attended to, when making predictions for underlying causes of death.
Figure 4.9 illustrates the attention weights calculated as shown in Equation 3.6, for the contents of
42
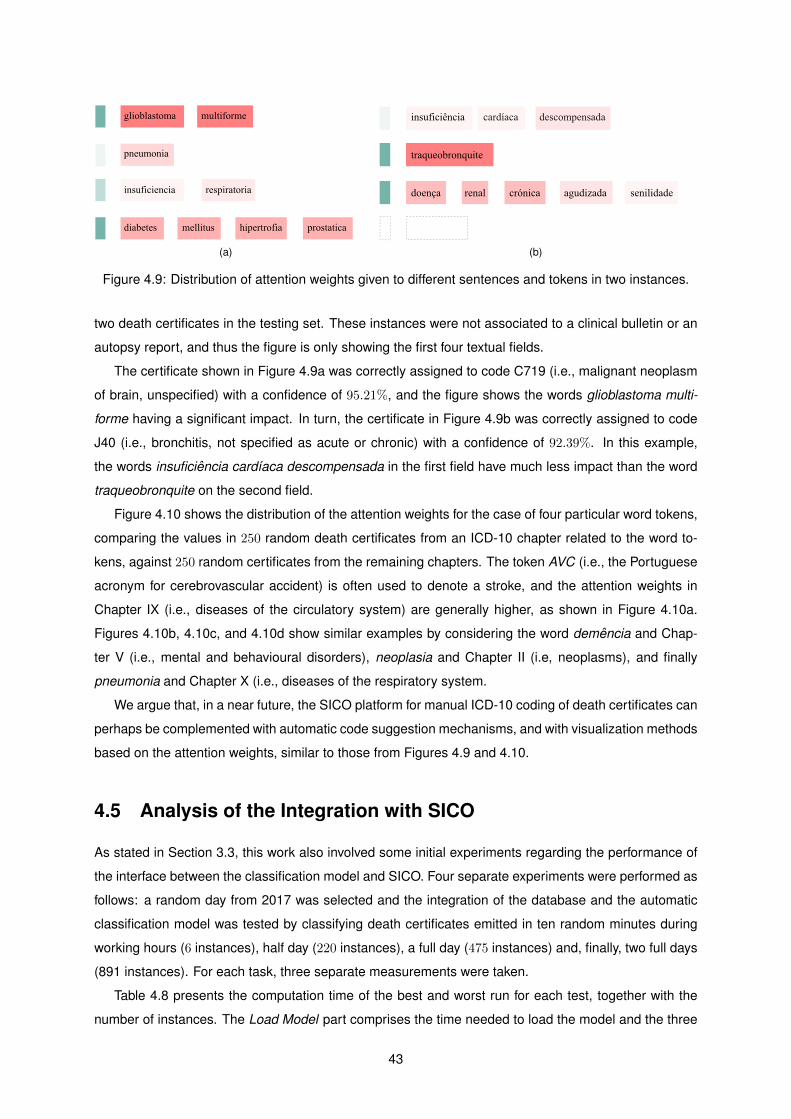
(a) (b)
Figure 4.9: Distribution of attention weights given to different sentences and tokens in two instances.
two death certificates in the testing set. These instances were not associated to a clinical bulletin or an
autopsy report, and thus the figure is only showing the first four textual fields.
The certificate shown in Figure 4.9a was correctly assigned to code C719 (i.e., malignant neoplasm
of brain, unspecified) with a confidence of 95.21%, and the figure shows the words glioblastoma multi-
forme having a significant impact. In turn, the certificate in Figure 4.9b was correctly assigned to code
J40 (i.e., bronchitis, not specified as acute or chronic) with a confidence of 92.39%. In this example,
the words insuficiencia cardıaca descompensada in the first field have much less impact than the word
traqueobronquite on the second field.
Figure 4.10 shows the distribution of the attention weights for the case of four particular word tokens,
comparing the values in 250 random death certificates from an ICD-10 chapter related to the word to-
kens, against 250 random certificates from the remaining chapters. The token AVC (i.e., the Portuguese
acronym for cerebrovascular accident) is often used to denote a stroke, and the attention weights in
Chapter IX (i.e., diseases of the circulatory system) are generally higher, as shown in Figure 4.10a.
Figures 4.10b, 4.10c, and 4.10d show similar examples by considering the word demencia and Chap-
ter V (i.e., mental and behavioural disorders), neoplasia and Chapter II (i.e, neoplasms), and finally
pneumonia and Chapter X (i.e., diseases of the respiratory system.
We argue that, in a near future, the SICO platform for manual ICD-10 coding of death certificates can
perhaps be complemented with automatic code suggestion mechanisms, and with visualization methods
based on the attention weights, similar to those from Figures 4.9 and 4.10.
4.5 Analysis of the Integration with SICO
As stated in Section 3.3, this work also involved some initial experiments regarding the performance of
the interface between the classification model and SICO. Four separate experiments were performed as
follows: a random day from 2017 was selected and the integration of the database and the automatic
classification model was tested by classifying death certificates emitted in ten random minutes during
working hours (6 instances), half day (220 instances), a full day (475 instances) and, finally, two full days
(891 instances). For each task, three separate measurements were taken.
Table 4.8 presents the computation time of the best and worst run for each test, together with the
number of instances. The Load Model part comprises the time needed to load the model and the three
43
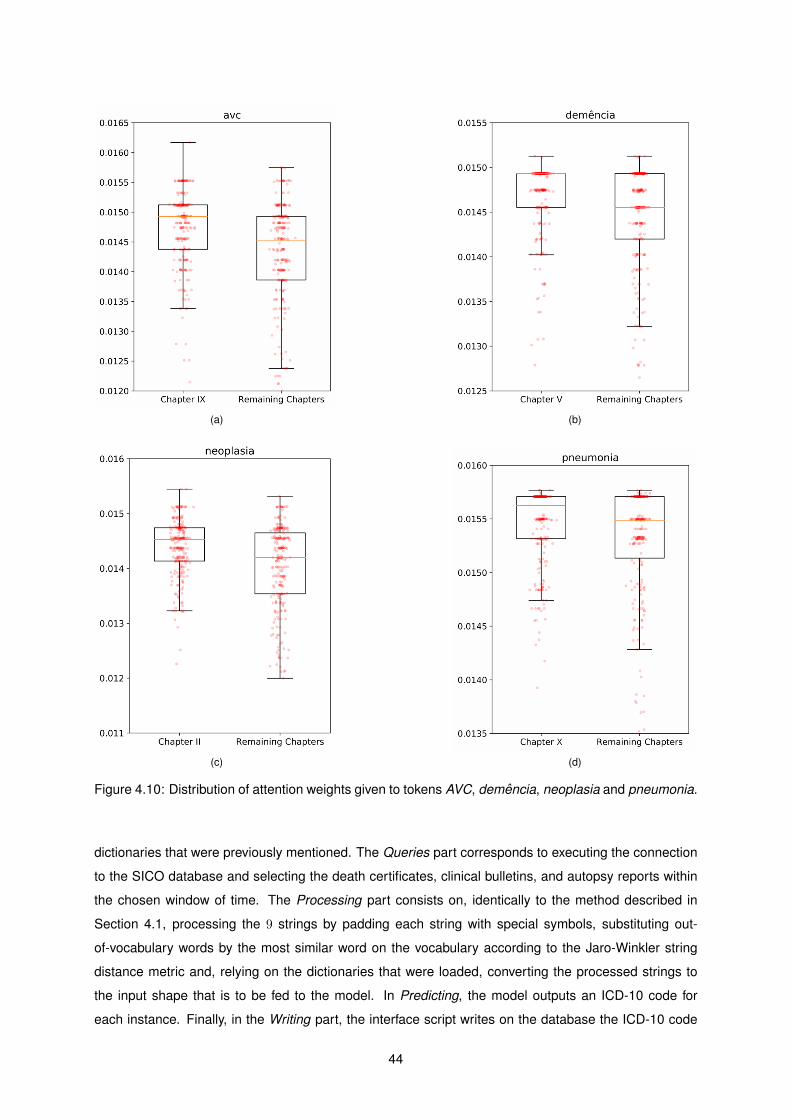
(a) (b)
(c) (d)
Figure 4.10: Distribution of attention weights given to tokens AVC, demencia, neoplasia and pneumonia.
dictionaries that were previously mentioned. The Queries part corresponds to executing the connection
to the SICO database and selecting the death certificates, clinical bulletins, and autopsy reports within
the chosen window of time. The Processing part consists on, identically to the method described in
Section 4.1, processing the 9 strings by padding each string with special symbols, substituting out-
of-vocabulary words by the most similar word on the vocabulary according to the Jaro-Winkler string
distance metric and, relying on the dictionaries that were loaded, converting the processed strings to
the input shape that is to be fed to the model. In Predicting, the model outputs an ICD-10 code for
each instance. Finally, in the Writing part, the interface script writes on the database the ICD-10 code
44

Table 4.8: Performance of the integration between the SICO database and the model, for four differenttime windows, showing the best and worst runs out of 3 attempts.
Load Model Queries Processing Predicting Writing Total
10 minWorst (s) 30.2772 8.3536 0.0003 4.6452 0.0024 43.2787
Best (s) 28.3671 7.7882 0.0003 4.4634 0.0008 40.6198
12hWorst (s) 28.8372 7.7784 0.0112 34.8343 0.0031 71.4642
Best (s) 29.2534 7.9778 0.0122 34.7351 0.0021 71.9806
24hWorst (s) 29.3634 8.0281 0.0702 81.9533 0.0052 119.4202
Best (s) 27.5182 7.9141 0.0442 82.1914 0.0061 117.6740
48hWorst (s) 27.8215 7.7532 0.1512 143.3781 0.0093 179.1133
Best (s) 27.4216 7.9842 0.1621 141.3073 0.0092 176.8844
predicted by the model, associated to each instance.
Although computational performance and efficiency were never prioritized in this work, the results
from Table 4.8 are relevant to argue how this implementation allows near real-time mortality surveillance.
Focusing on the first experiment (i.e., the time window of 10 minutes), more than half the time that the
script is running corresponds to loading the model. This is the most time consuming part in a relatively
small range of death certificates to predict and, in a different implementation, the model loading can be
performed only once, in an initialization stage.
Currently, the eVM application reports in near real-time the number of deaths that occurred in the
Portuguese territory, with a vast range of visualization options (namely per age group or per region,
besides other options). In the daily surveillance tab, shown in Figure 4.11, the user has information on
the number of death per day, detailed according to 3 types: natural death (blue line), external cause
(black line) and subject to investigation (green line). The separation in the three types of death causes
is done with the information of each death certificate that enters the SICO database. Users can select a
range of days to zoom in a specific window of time, as seen in Figure 4.12.
The integration of the automatic classification model enables this platform to show more fine grained
statistics regarding causes of death, namely groups of diseases that are prone to be affected by sea-
sonality, allowing public health stakeholders to react timely. For illustration purposes, Figure 4.13 was
computed to show the information that the eVM will be providing to users in a near future, when the
automatic classification model is fully integrated with the actual platform.
Figure 4.13 shows the potential of doing an early automatic classification of each new death certifi-
cate, since this would allow analysts to have a perception in near real-time of the pattern of deaths with
a specific disease as the underlying cause. In this example, three major ICD-10 blocks are considered:
gripe e pneumonia - influenza and pneumonia (red line), doencas arteriais coronarias - ischaemic heart
diseases (yellow line) and doencas cerebrovasculares - cerebrovascular diseases (grey line).
45

Figure 4.11: Layout of the eVM online platform for Daily Mortality Surveillance per Cause tab.
Figure 4.12: Layout of the eVM online platform for Daily Mortality Surveillance per Cause tab, specificallyshowing a small range of days.
4.6 Summary
This chapter presented the evaluation of the proposed approach, according to different aspects. First,
Section 4.1 described the datasets used to for supporting the experiments, detailing the steps taken to
process the data, and presenting also a statistical characterization for the resulting entries. The main
46

Figure 4.13: Layout of the eVM online platform for daily mortality surveillance per cause, specificallyshowing the number of deaths per specific cause.
resulting dataset was found to be highly unbalanced in all levels of the ICD-10 classification system
(chapters, block and full-code), increasing the complexity of the task.
Section 4.2 presented the main set of experiments used to evaluate the proposed model, starting
with a set of ablation tests that assessed the contribution of the different components involved in the
neural network architecture. The combined model with NMF initialization achieved the best overall per-
formance, and thus this model was used for further tests, e.g. focusing on specific ICD-10 blocks.
Section 4.3 reports on the results from experiments with a second dataset generated with the death
certificates from 2016. These experiments tried to test the generalization capabilities of the model, and
also its suitability for near real-time surveillance scenarios. The results show that the main observable
patterns in the percentage of occurrences for particular causes of death is identical when using manual
or automatically assigned ICD-10 codes.
Section 4.4 presents examples of how the attention mechanism can help to interpret and visualize
the classification results. The attention mechanisms allow analysts to understand which words and fields
are more meaningful in each prediction.
Finally, Section 4.5 presented initial experiments regarding the integration of the model with the SICO
database, illustrating the practical applications of the proposed approach.
47

48

Chapter 5
Conclusions
This dissertation presented a deep learning method for coding the free-text descriptions included in
death certificates, clinical bulletins and autopsy reports obtained from the Portuguese Ministry of Health’s
Directorate-General of Health, according to the underlying cause of death and following ICD-10 classi-
fication system. This chapter overviews the main contributions, and highlights possible directions for
future work.
5.1 Contributions
Results show that although ICD coding is a difficult task, due to the large number of classes that are
sparsely used, the method obtained an accuracy that is the line with the values that are reported in the
related work, perhaps even surpassing them. The classification task that was conducted in this work
uses more labels than the proposed methods by other authors, and the proposed model also relies on
more advanced classification methods. Given the results, it is possible to argue that this approach can
indeed contribute to a faster processing of death certificates, allowing real-time surveillance of relevant
ICD-10 blocks, or it can help in the task of manual coding.
During the development of this work it was possible to work together with people from the Division of
Epidemiology and Surveillance of the Portuguese Directorate-General of Health, improving the overall
quality of this work by virtue of the constant feedback and input along every stage of the project. This
regular criticism was crucial to understanding the special concerns in the development of automatic
classification methods. The data was successfully processed to devise how the SICO database (i.e.,
the collected manually coded death certificates, clinical bulletins, and autopsy reports) could assist the
development of a method to automatically classify new data. The related work was favorably considered,
providing ideas and inspirations that proved themselves extremely useful.
The attention mechanism implemented in the neural network allows the proposed model to attribute
different attention weights at two different levels (i.e., at the word level and the field level). These attention
weights let the model pay more or less attention to individual words/fields when constructing represen-
tations, at the same time offering opportunity to interpret the classification results by the visualization of
49

the different values assigned to the input.
Results also provide interesting insights into how the lexicon used in instances associated to some
chapters can be more well defined than others, leading to an increased performance (namely for Chap-
ters II and IX). Another aspect that may contribute to the divergence between the performance of the
proposed model in different chapters relates to the fact that in some cases we have less co-occurrences,
emphasizing the correct chapter. For instance, the underlying cause of death pneumonia, unspecified
(i.e., the most common cause in the dataset), is often related with many codes, leading to a more com-
plex classification task. Although this cause is associated to the ICD-10 full-code with the highest number
of instances, this is not the code with the best performance. In contrast, the full-codes from Chapter II
are associated to high scores, which may be related to how these instances are more independent and
less likely to have ambiguity in the code assignments.
Regarding the practical application of this method within the workflow of Portuguese Ministry of
Health’s Directorate-General of Health, the model seems to be a valid approach to address the automatic
classification of the underlying cause of death. As the volume of death certificates outnumbers the
capability of the mortality coders to immediately associate to each the ICD-10 code of the underlying
cause of death, this work proposes an automatic classification method that offers preliminary mortality
data of specific diseases that are particularly relevant to monitor in real-time. Also, the development of
the interface between the SICO database and the classification model was a major step towards the
deployment of an automatic classification method in the DGS workflow.
5.2 Future Work
Regarding the practical application of this work, the deployment of the proposed neural network in the
Portuguese Directorate-General of Health is currently ongoing. Since the SICO database is managed
by the Shared Services of the Ministry of Health, the integration is currently undergoing the process of
pilot tests to assess if the implementation meets the technological requirements of the platform. After
the deployment and real-time classification of the new death certificates stored in the database, the
integration of this data in the eVM platform shall take place in order to deliver to the health stakeholders
and general public the available mortality monitoring data.
In terms of the classification accuracy, despite the already interesting results, there are also many
open possibilities for future work. Although other previous studies have advanced methods for ICD
coding of death certificates, their results are not directly comparable ours, given the focus on different
languages and different formulations of the task. Some of these studies considered a single textual field
as input, and the prediction tasks also differed in the number of classes and/or in accepting multiple
codes as output. To comparatively assess our approach, a possible experiment would involve testing an
adapted version of our neural architecture over the French and English datasets from the CLEF eHealth
shared task [8].
Our model leverages GRUs to encode sequences, but other types of recurrent nodes have also
been recently been proposed. For instance, the Minimal Gated Unit approach [35, 36] relies on a
50
simplified model with just a single gate. Having less parameters to train can contribute to improving
the model effectiveness. In contrast, Multi-Function Recurrent Units (Mu-FuRUs) adopt an elaborate
gating mechanism that allows for additional differentiable functions as composition operations, leading
to models that can better capture the nuances involved in encoding sequences [37]. Other alternatives
include Long Short-Term Memory (LSTM) networks with coupled gates [38], Structurally Constrained
Recurrent Networks [39], IRNNs [40], and many other LSTM or GRU variants [38, 41].
Besides different types of recurrent nodes, many other options can also be considered for improv-
ing the neural architecture. For instance, to better handle out-of-vocabulary words (e.g., the names
of particular conditions with slightly different spellings, that often appear in the death certificates) we
can consider alternative mechanisms for exploring context in the generation of the word embeddings,
or replacing/enriching the embeddings with mechanisms that generate representations from individual
characters or character n-grams [42, 43]. Another idea for improving the embeddings layer, at the same
time also allowing us to explore knowledge encoded in ICD-10, would be to share a subset of the weights
between the embeddings of words that belong to the same semantic group(s), as recently proposed by
Zhang et al. [44].
Another idea worth exploring relates to the use of sparse modeling methods as an approach to im-
prove the predictions at the output nodes [45], e.g. by using sparsemax instead of the softmax and
sigmoid activations at the model outputs [46]. Sparse modelling methods could also be used as an
approach to improve the interpretability of the attention mechanisms [47] (i.e., standard attention tends
to produce dense outputs, in the sense that all elements in the input always make at least a small con-
tribution to the decision, while sparse alternatives can better encourage parsimony and interpretability).
Our empirical results have also evidenced problems in handling the highly skewed class distribution,
with much worse results for infrequent ICD-10 codes. To further improve results, we can consider batch
training procedures that, based on the SMOTE technique [48], over-sample the minority classes and
introduce minor perturbations on these training instances. Another possibility relates to exploring previ-
ously proposed ideas for one-shot or few-shot learning [49, 50, 51, 52], e.g. using neural architectures
augmented with memory capacities, including using an external memory to encode training instances,
and an attention mechanism to retrieve similar instances, which would enable making accurate predic-
tions even if seeing only a few samples.
Besides real-time surveillance, the ideas advanced in this dissertation could also be used in the con-
text of methods for disease and/or mortality forecasting. In fact, several previous studies have reported
on the use of information from death certificates to predict the future incidence of particular health prob-
lems [53], for instance by leveraging auto-regressive time-series models (e.g., ARIMA models in which
the value for a variable at a particular period depends on its value in the previous period(s)). For future
work, it would be interesting to compare the performance of forecasting models leveraging manually
coded information, versus models leveraging the automatic coding of the death causes (i.e., it might be
the case that disease forecasting models leveraging the automatically coded data are equally or even
more informative). In the context of surveillance applications interested in the analysis of time-series
for particular causes of death (e.g., in cases like those illustrated in Figures 4.4 to 4.7), one can also
51

consider the usage of auto-regressive models to improve the predictions given by the model that is
described in this dissertation, using information from the recent past to try to correct the number of
occurrences that is estimated at each time-step.
52

Bibliography
[1] C. S. Pinto, R. N. Anderson, C. Marques, C. Maia, H. Martins, and M. do Carmo Borralho. Improving
the mortality information system in Portugal. Eurohealth, 22(2), 2016.
[2] H. Dalianis. Clinical text retrieval-an overview of basic building blocks and applications. Professional
Search in the Modern World, 8830, 2014.
[3] P. Zweigenbaum and T. Lavergne. Hybrid methods for ICD-10 coding of death certificates. In
Proceedings of International Workshop on Health Text Mining and Information Analysis, 2016.
[4] G. Mujtaba, L. Shuib, R. G. Raj, R. Rajandram, K. Shaikh, and M. A. Al-Garadi. Automatic ICD-
10 multi-class classification of cause of death from plaintext autopsy reports through expert-driven
feature selection. PLOS ONE, 12(2), 2017.
[5] B. Koopman, G. Zuccon, A. Nguyen, A. Bergheim, and N. Grayson. Automatic ICD-10 classification
of cancers from free-text death certificates. International Journal of Medical Informatics, 84(11),
2015.
[6] B. Koopman, S. Karimi, A. Nguyen, R. McGuire, D. Muscatello, M. Kemp, D. Truran, M. Zhang,
and S. Thackway. Automatic classification of diseases from free-text death certificates for real-time
surveillance. BioMed Central Medical Informatics and Decision Making, 15(1), 2015.
[7] L. Kelly, L. Goeuriot, H. Suominen, A. Neveol, J. Palotti, and G. Zuccon. Overview of the CLEF
eHealth Evaluation Lab 2016. In Proceedings of the International Conference of the Cross-
Language Evaluation Forum for European Languages, 2016.
[8] T. Lavergne, A. Neveol, A. Robert, C. Grouin, G. Rey, and P. Zweigenbaum. A dataset for ICD-10
coding of death certificates: Creation and usage. In Proceedings of the Workshop on Building and
Evaluating Resources for Biomedical Text Mining, 2016.
[9] K. Cho, B. van Merrienboer, D. Bahdanau, and Y. Bengio. On the properties of neural machine
translation: Encoder-decoder approaches. In Proceedings of the Workshop on Synthax, Semantics
and Structure in Statistical Translation, 2014.
[10] Z. Yang, D. Yang, C. Dyer, X. He, A. Smola, and E. Hovy. Hierarchical attention networks for
document classification. In Proceedings of the Conference of the North American Chapter of the
Association for Computational Linguistics, 2016.
53

[11] A. Joulin, E. Grave, P. Bojanowski, and T. Mikolov. Bag of tricks for efficient text classification.
In Proceedings of the Conference of the European Chapter of the Association for Computational
Linguistics, 2017.
[12] D. Bahdanau, K. Cho, and Y. Bengio. Neural machine translation by jointly learning to align and
translate. In Proceedings of the International Conference on Learning Representations, 2015.
[13] F. Duarte, B. Martins, C. S. Pinto, and M. J. Silva. A Deep Learning Method for ICD-10 Coding
of Free-Text Death Certificates. In Proceedings of the EPIA Conference on Artificial Intelligence,
2017.
[14] W. H. Organization. International Classification of Diseases (ICD) Information Sheet, Accessed
July 13, 2017. URL http://www.who.int/classifications/icd/factsheet/en/.
[15] W. H. Organization. ICD-10: International Statistical Classification of Diseases and Related Health
Problems: Tenth Revision. 2004.
[16] Y. Goldberg. A primer on neural network models for natural language processing. Journal of
Artificial Intelligence Research, 57, 2016.
[17] D. E. Rumelhart, G. E. Hinton, and R. J. Williams. Learning representations by back-propagating
errors. Cognitive modeling, 5(3), 1988.
[18] D. Kingma and J. Ba. Adam: A method for stochastic optimization. In Proceedings of the Interna-
tional Conference for Learning Representations, 2015.
[19] J. P. Pestian, C. Brew, P. Matykiewicz, D. J. Hovermale, N. Johnson, K. B. Cohen, and W. Duch. A
shared task involving multi-label classification of clinical free text. In Proceedings of the Workshop
on Biological, Translational, and Clinical Language Processing, 2007.
[20] D. Zhang, D. He, S. Zhao, and L. Li. Enhancing automatic ICD-9-CM code assignment for med-
ical texts with PubMed. In Proceedings of the ACL SIGBioMed Workshop on Biomedical Natural
Language Processing, 2017.
[21] A. Perotte, R. Pivovarov, K. Natarajan, N. Weiskopf, F. Wood, and N. Elhadad. Diagnosis code as-
signment: models and evaluation metrics. Journal of the American Medical Informatics Association,
21(2), 2013.
[22] S. Boytcheva. Automatic matching of ICD-10 codes to diagnoses in discharge letters. In Proceed-
ings of the ACL SIGBioMed Workshop on Biomedical Natural Language Processing, 2011.
[23] Y. Yan, G. Fung, J. G. Dy, and R. Rosales. Medical coding classification by leveraging inter-code re-
lationships. In Proceedings of the ACM SIGKDD International Conference on Knowledge Discovery
and Data Mining, 2010.
54
[24] S. Wang, X. Chang, X. Li, G. Long, L. Yao, and Q. Z. Sheng. Diagnosis code assignment using
sparsity-based disease correlation embedding. IEEE Transactions on Knowledge and Data Engi-
neering, 28(12), 2016.
[25] S. Pyysalo, F. Ginter, H. Moen, T. Salakoski, and S. Ananiadou. Distributional semantics resources
for biomedical text processing. In Proceedings of the International Symposium on Languages in
Biology and Medicine, 2013.
[26] K. Patel, D. Patel, M. Golakiya, P. Bhattacharyya, and N. Birari. Adapting pre-trained word embed-
dings for use in medical coding. In Proceedings of the ACL SIGBioMed Workshop on Biomedical
Natural Language Processing, 2017.
[27] S. Karimi, X. Dai, H. Hassanzadeh, and A. Nguyen. Automatic diagnosis coding of radiology re-
ports: A comparison of deep learning and conventional classification methods. In Proceedings of
the ACL SIGBioMed Workshop on Biomedical Natural Language Processing, 2017.
[28] S. Baker and A. Korhonen. Initializing neural networks for hierarchical multi-label text classification.
In Proceedings of the ACL SIGBioMed Workshop on Biomedical Natural Language Processing,
2017.
[29] J. Nam, J. Kim, I. Gurevych, and J. Furnkranz. Large-scale multi-label text classification - revisiting
neural networks. In Proceedings of the European Conference on Machine Learning and Principles
and Practice of Knowledge Discovery in Databases, 2017.
[30] G. Kurata, B. Xiang, and B. Zhou. Improved neural network-based multi-label classification with
better initialization leveraging label co-occurrence. In Proceedings of the Annual Conference of the
North American Chapter of the Association for Computational Linguistics, 2016.
[31] R. Agrawal, R. Srikant, et al. Fast algorithms for mining association rules. In Proceedings of the
International Conference on Very Large Data Bases, 1994.
[32] D. D. Lee and H. S. Seung. Learning the parts of objects by non-negative matrix factorization.
Nature, 401(6755), 1999.
[33] C.-J. Lin. Projected gradient methods for nonnegative matrix factorization. Neural computation, 19
(10), 2007.
[34] W. E. Winkler. The state of record linkage and current research problems. Technical report, Statis-
tical Research Division, U.S. Census Bureau, RR99/04. 1999.
[35] G.-B. Zhou, J. Wu, C.-L. Zhang, and Z.-H. Zhou. Minimal gated unit for recurrent neural networks.
International Journal of Automation and Computing, 13(3), 2016.
[36] J. Heck and F. M. Salem. Simplified minimal gated unit variations for recurrent neural networks.
CoRR, abs/1701.03452, 2017. URL https://arxiv.org/abs/1701.03452.
55

[37] D. Weissenborn and T. Rocktaschel. MuFuRU: The multi-function recurrent unit. In Proceedings
of the Association for Computational Linguistics Workshop on Representation Learning for Natural
Language Processing, 2016.
[38] K. Greff, R. K. Srivastava, J. Koutnık, B. R. Steunebrink, and J. Schmidhuber. LSTM: A search
space odyssey. IEEE Transactions on Neural Networks and Learning Systems, 99(10), 2016.
[39] T. Mikolov, A. Joulin, S. Chopra, M. Mathieu, and M. Ranzato. Learning longer memory in recurrent
neural networks. CoRR, abs/1412.7753, 2014. URL http://arxiv.org/abs/1412.7753.
[40] Q. V. Le, N. Jaitly, and G. E. Hinton. A simple way to initialize recurrent networks of rectified linear
units. CoRR, abs/1504.00941, 2015. URL http://arxiv.org/abs/1504.00941.
[41] R. Jozefowicz, W. Zaremba, and I. Sutskever. An empirical exploration of recurrent network archi-
tectures. In Proceedings of the International Conference on Machine Learning, 2015.
[42] P. Bojanowski, E. Grave, A. Joulin, and T. Mikolov. Enriching word vectors with subword information.
Transactions of the Association for Computational Linguistics, 5, 2017.
[43] F. Horn. Context encoders as a simple but powerful extension of word2vec. In Proceedings of
the Association for Computational Linguistics Workshop on Representation Learning for Natural
Language Processing, 2017.
[44] Y. Zhang, M. Lease, and B. C. Wallace. Exploiting domain knowledge via grouped weight shar-
ing with application to text categorization. In Proceedings of the Association for Computational
Linguistics, 2017.
[45] J. Yoon and S. J. Hwang. Combined group and exclusive sparsity for deep neural networks. In
Proceedings of the International Conference on Machine Learning, 2017.
[46] A. F. T. Martins and R. F. Astudillo. From softmax to sparsemax: A sparse model of attention and
multi-label classification. In Proceedings of the International Conference on Machine Learning,
2016.
[47] V. Niculae and M. Blondel. A Regularized Framework for Sparse and Structured Neural Attention.
In Proceedings of the Annual Conference on Neural Information Processing Systems, 2017.
[48] N. V. Chawla, K. W. Bowyer, L. O. Hall, and W. P. Kegelmeyer. SMOTE: Synthetic minority over-
sampling technique. Journal of artificial intelligence research, 16(1), 2002.
[49] L. Kaiser, O. Nachum, A. Roy, and S. Bengio. Learning to remember rare events. In Proceedings
of the International Conference on Learning Representations, 2017.
[50] A. Santoro, S. Bartunov, M. Botvinick, D. Wierstra, and T. Lillicrap. One-shot learning with memory-
augmented neural networks. CoRR, abs/1605.06065, 2016. URL http://arxiv.org/abs/1605.
06065.
56

[51] G. Koch, R. Zemel, and R. Salakhutdinov. Siamese neural networks for one-shot image recogni-
tion. In Proceedings of the Deep Learning Workshop at the International Conference on Machine
Learning, 2015.
[52] O. Vinyals, C. Blundell, T. Lillicrap, K. Kavukcuoglu, and D. Wierstra. Matching networks for one
shot learning. In Proceedings of the Conference on Neural Information Processing Systems, 2016.
[53] R. McNown and A. Rogers. Forecasting cause-specific mortality using time series methods. Inter-
national Journal of Forecasting, 8(3), 1992.
57

58