automated, computational approaches to kinetic model and
TRANSCRIPT

Automated computational approaches to kinetic model and
parameter determination
Connor Jack Taylor
Submitted in accordance with the requirements for the degree of
Doctor of Philosophy
The University of Leeds
School of Chemical and Process Engineering
December 2020
1
The candidate confirms that the work submitted is his own except where
work which has formed part of jointly authored publications has been included
The contribution of the candidate and the other authors to this work has been
explicitly indicated below The candidate confirms that appropriate credit has
been given within the thesis where reference has been made to the work of
others
Chapters 2 - 3 are based on work from a jointly authored publication
bull Connor J Taylor Megan Booth Jamie A Manson Mark J Willis
Graeme Clemens Brian A Taylor Thomas W Chamberlain and Richard
A Bourne Rapid Automated Determination of Reaction Models and
Kinetic Parameters Chemical Engineering Journal (2020) 127017
The work contained within this publication that is directly attributable to myself
is all experimentation coding of the relevant methodology and preparation of the
manuscript Megan Booth assisted in the setting up and running of some
experimentation (notably the phenyl acetate and paracetamol case studies)
Jamie A Manson assisted in the preparation of the manuscript (notably the
reactor engineering section) Mark J Willis assisted in the direction of the coding
of the relevant methodology Graeme Clemens assisted in the setting up of some
experimentation (notably the metoprolol case study) and general supervision
Brian A Taylor assisted in the direction of the approach and general supervision
Thomas W Chamberlain and Richard A Bourne both assisted in the direction of
the approach general supervision and preparation of the manuscript
This copy has been supplied on the understanding that it is copyright material
and that no quotation from the thesis may be published without proper
acknowledgement
The right of Connor Jack Taylor to be identified as Author of this work has
been asserted by Connor Jack Taylor in accordance with the Copyright Designs
and Patents Act 1988
2
Acknowledgements
This project could not have been completed without the ongoing help of
several individuals who have helped guide the project into the finished thesis and
publications Firstly Irsquod like to thank Dr Richard Bourne for his continued support
advice and brilliance in assisting with the project wherever possible in both
running experiments and preparing project directions Your supervision style of
treating a PhD student as an academic partner is well appreciated and has
undoubtedly led to an excellent postgraduate experience
Dr Thomas Chamberlain thank you also for your ongoing support and
contributions to my supervision Although yoursquore busy it does not go unnoticed
that you are always willing to go the extra mile in proofreading posterspapers
and even just transfer report chapters - your sharp wit means that you can sell
my science better than anyone can including myself
To Brian and Graeme thank you also for your support in the direction of
my project and sourcing opportunities for me to present and develop myself as
a researcher I really appreciate it Thank you also to Mark Willis Ian Ashworth
Rob Cox and the rest of the CPUT team at AZ for your invaluable thoughts and
discussions
To Adam Jamie and Calum thank you for all of your nonsense talks and
debates particularly in the control room that helped keep me sane - even the
consistent whinging was funny More recently Ollie and Holly have been helping
with that also Ricardo thank you for all of your advice as well as your nonsense
talking too (but only after you shut off your lsquowork personarsquo after 6pm) Brendan
thank you for being a consistent source of hyperactive entertainment donrsquot let
Luke try to calm your ideas Rosie and Sam thank you for all of the tea breaks
at AZ that also managed to keep us all sane Mary thank you for your help in
running the lab and similarly thank you to everyone in the iPRD for your help
and support over the years John Bao Nando Ilias Claudio Micaela Nisha
Alison Christiane James Pia and the ones that have moved on Alastair Will
Mike Becky Chris Horb Chris Hone Alvaro and not forgetting Fanfu
To Rhiann and my encouraging parents thank you for always being there
and motivating me to be my best and inspiring me to go further
3
Abstract
A major bottleneck in the transition from chemistry research at lab scale
to process development is a lack of quantitative chemical synthesis information
Critical aspects of this information include knowing the correct reaction model
and precise kinetic parameters If this information is available classical reaction
engineering principles may be utilised to shorten process development times and
lower costs
Identifying the correct reaction model for a particular process however
can be challenging and time-consuming particularly for physical-organic
chemists and kinetics experts that may be busy with other aspects of process
development The work presented herein describes computational approaches
that automatically determine the most likely kinetic model and associated
parameters based on the experimental data supplied without expert chemical
intuition
The concept for these methodologies involves a comprehensive model
evaluation tool The experimental data and the species involved in the process
are inputted Based on mass balance all mass-balance-allowed transformations
between these species are identified All possible models are then compiled from
this list of transformations featuring unique combinations of these model terms
Every model is then evaluated using ordinary differential equation (ODE) solvers
and optimisation algorithms to maximise the convergence of simulated reaction
progression with the experimental data thereby identifying the kinetic
parameters Each model is then statistically evaluated to determine which model
is the most likely to be correct
Using these methodologies allows any chemist to automatically determine
a reaction model and kinetic constants for a particular system by performing all
kinetic analysis autonomously Their most expensive resource time can then be
focussed on other tasks that cannot be automated
4
Table of Contents
Acknowledgements 2
Abstract 3
Table of Contents 4
List of Schemes 7
List of Figures 9
List of Tables 14
List of Abbreviations 17
Chapter 1 Introduction 19
11 Continuous flow chemistry 19
111 Batch and flow reactions 19
112 Reactions in flow 24
113 Reaction analysis 33
114 Continuous flow chemistry summary 40
12 Kinetic methodologies 40
121 Conventional methodologies 41
122 Visual kinetic analysis 49
123 Kinetic methodologies summary 56
13 Optimisation 56
131 Local algorithms 59
132 Global 63
133 Optimisation summary 68
14 Research aim 69
Chapter 2 Development of the computational approach to kinetic model determination 70
21 Introduction 70
22 Development of the approach 73
221 Kinetic model generation 74
222 Kinetic model fitting 79
223 Statistical analysis 85
224 Other considerations 86
225 Overview 87
23 Simulated verification of the approach 89
231 Case study Benzoic acid alkylation 90
232 Case study Nitrile hydrolysis 93
5
233 Case study SNAr kinetics 97
24 Conclusion 102
Chapter 3 Experimental applications of the computational approach to kinetic model and parameter determination 103
31 Introduction 103
32 Experimental setup 112
33 Case study Phenyl acetate 115
34 Case study Paracetamol 118
35 Case study Metoprolol 121
36 Conclusion 125
Chapter 4 The development of an improved computational approach to kinetic model determination 126
41 Introduction 126
42 Methodology advancement 127
421 Capabilities 127
422 Rules 131
423 Overview 136
43 Simulated verifications of the approach 138
431 Case study SNAr kinetics 138
432 Case study Pentyne kinetics 145
433 Case study Ytterbium catalysis 149
44 Conclusion 152
Chapter 5 Experimental applications of the new approach 153
51 Introduction 153
52 Case study SNAr kinetics 154
53 Case study PfBr 157
54 Case study Maleic acid 162
55 Conclusion 166
Chapter 6 Conclusion amp future work 167
Chapter 7 Appendix 168
71 Chapter 1 168
72 Chapter 2 168
721 Generated data set for case study benzoic acid alkylation 169
722 Generated data set for case study nitrile hydrolysis 170
723 Generated data set for the case study SNAr kinetics 171
73 Chapter 3 173
6
731 Phenyl acetate 173
732 Paracetamol 178
733 Metoprolol 187
74 Chapter 4 193
741 Generated data set for the case study SNAr kinetics 193
742 Generated data set for the case study Pentyne 195
743 Generated data set for the case study Ytterbium catalysis 197
75 Chapter 5 198
751 SNAr kinetics 198
752 PfBr 206
753 Maleic acid 211
76 Computational setup 214
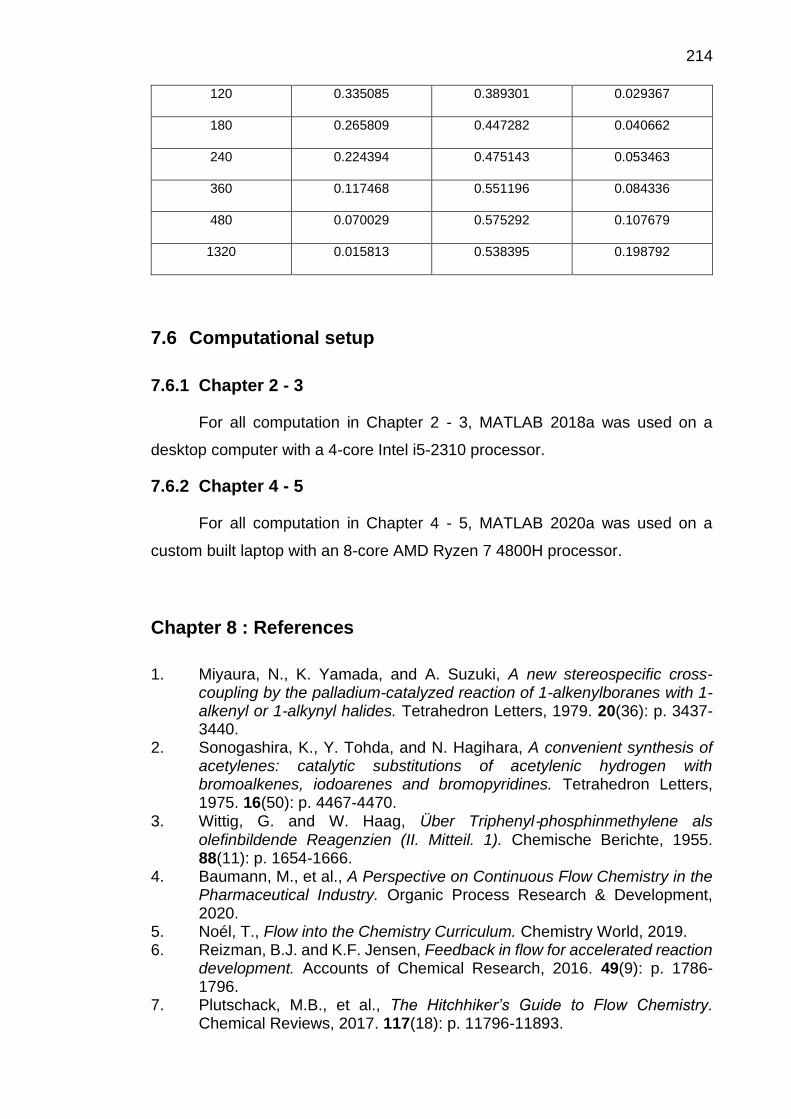
761 Chapter 2 - 3 214
762 Chapter 4 - 5 214
Chapter 8 References 214
7
List of Schemes
Chapter 1
Scheme 11 The conversion of hexanol 11 to hexene 12 in a continuous flow setup[19]
21
Scheme 12 The flow synthesis of the adduct 15 via a Michael addition between the
dicarbonyl 13 and the alkyne 14[20] 22
Scheme 13 The multistep continuous flow synthesis of ibuprofen 18 23
Scheme 14 The temperature-accelerated SNAr reaction of 19 with 110 to form 111 in
THF (boiling point 66 degC) under flow conditions[51] 26
Scheme 15 The Fischer Indole synthesis of 114 from the hydrazine 112 and
dihydrofuran 113 in methanol (boiling point 65 degC) using a flow setup[52] 26
Scheme 16 The hydrogenation of isophorone 115 to TMCH 116[65] 27
Scheme 17 The [2 + 2] photocycloaddition of malemide 117 with 1-hexyne to produce
the cyclic product 118[74] 29
Scheme 18 An electrochemical facilitated nucleophilic substitution reaction to afford the
product 121[78] 29
Scheme 19 An enzyme catalysed continuous cyanohydrin formation forming 123[84] 30
Scheme 110 Multiple enzymatic catalysed continuous process to form UDP galactose
125[85] Individual enzymes stated 30
Scheme 111 The multi-step flow synthesis of 127 from coupling o-dibromobenzene 126
with varying electrophiles via sequential halogen-lithium exchange reactions[87] 31
Scheme 112 A multi-step flow synthesis of ibuprofen 18 involving an in-line purification
step[89] 33
Scheme 113 A reaction scheme showing the formation of benzyne 132 which was
followed by analysis via mass spectrometry[108] 35
Scheme 114 A reaction scheme showing the thermal isomerization of 133a to 133b
which was followed by analysis via HPLC[111] 36
Scheme 115 A reaction scheme showing a fluorination reaction yielding 136 which was
followed by analysis via in-line IR[112] 37
Scheme 116 The Grignard reaction that was tracked by on-line NMR[123] 38
Scheme 117 A Heck coupling of an aryl bromide 140 with 141 to form the adduct 142
This case study showed no indication of product inhibition or catalyst deactivation 50
Scheme 118 The epoxide opening of 143 to form 144 using a catalytic system This case
study indicates some product inhibition or catalyst deactivation 51
Scheme 119 A nickel-catalysed alkylation reaction of chalcone 145 with Et2Zn 146 to
form the adduct 147 53
Chapter 2
Scheme 21 An example esterification reaction 75
Scheme 22 The reaction of benzoic acid with iodomethane to form methyl benzoate
Modelled as a second order reaction 91
8
Scheme 23 The reaction of a nitrile with hydroxide to form the corresponding amide which
is susceptible to further hydrolysis to form the carboxylic acid Modelled as sequential
second order reactions 94
Scheme 24 The reaction of 24-dichloropyrimidine 210 with morpholine 211 to form the
4-substituted product 212 and the 2-substituted product 213 and the subsequent
bis-substituted product 214 98
Chapter 3
Scheme 31 The base catalysed Knoevenagel condensation between benzaldehyde and
ethyl cyanoacetate to form 34 109
Scheme 32 The Paal-Knorr reaction of 25-hexanedione 35 and ethanolamine 36 to
yield 37 to show how the kinetics of a process can be observed by using a controlled
ramp technique 111
Scheme 33 The reaction of phenol 38 with acetyl chloride 39 to form phenyl acetate
310 and hydrochloric acid 311 115
Scheme 34 The reaction of 4-aminophenol with acetic anhydride to form paracetamol in
step one followed by a further reaction with acetic anhydride to form diacetamate in
step two 118
Scheme 35 The reaction of the epoxide starting material with isopropylamine to form
metoprolol as well as the overreaction to form the bis-substituted product 122
Chapter 4
Scheme 41 The self-catalysed reaction of maleic acid 41 and methanol 42 to form the
mono-product 43 and the di-product 44[237] 132
Scheme 42 The reaction of 24-difluoronitrobenzene 45 with pyrrolidine 46 to form the
ortho-substituted product 47 and the para-substituted product 48 Consecutive
reactions then occur to form the bis-substituted product 49 In each reaction
hydrofluoric acid 410 is formed[222] 139
Scheme 43 The reaction of the starting material 411 with the spirodiene 412 to form
the product 413 and LiBr 414[238] 146
Scheme 44 The reaction of the starting material 415 with diphenylphosphine 416 in the
presence of the ytterbium catalyst 417 to form the product 418 where [Yb] Yb(η2-
Ph2CNPh)(hmpa)3[239] 149
Chapter 5
Scheme 51 The reaction of 246-trichloropyrimidine (SM) 51 with ethyl 4-
aminobutanoate 52 to form the major 2-substituted SNAr product 53 and the minor
4-substituted SNAr product 54 154
Scheme 52 The reaction of alanine methyl ester (Al-Me) 56 with PfBr 57 to form the
protected amino acid 58 Hydrobromic acid 59 is also generated as a side product
158
Scheme 53 The retrosynthetic methodology of the transformation of L-alanine to (S)-
eleagnine via the Pf-protected alanine methyl ester (Pf-Al-Me)[244] 158
Scheme 54 The synthetic route from cheap starting materials bromobenzene 510 and
fluorene 511 to the intermediate PfOH 512 and finally the desired PfBr material
58 159
9
Scheme 55 The reaction of maleic acid 513 and methanol 514 to form the mono-
product 515 and the di-product 516 163
List of Figures
Chapter 1
Figure 11 An annotated picture of an in-line liquid-liquid separator developed by Zaiput
Flow Technologies 33
Figure 12 The response surface showing temperature and residence time effects on the
thermal isomerisation of 133a[108] Reproduced with permission 36
Figure 13 An IR absorption showing the detailed rise of the C-F bond peak over time
indicating the extent of reaction completion[109] Reproduced with permission 37
Figure 1 4 The on-line NMR analysis in the aromatic region of the Grignard reaction
shown in Scheme 116 at different time intervals[120] Reproduced with permission 38
Figure 15 A graphical representation of generated time-series data for a first order
reaction shown in eqn 11 The data is log-transformed to give a linear fit where the
gradient is equal to the rate constant multiplied by -1 42
Figure 16 A graphical representation of generated time-series data for a zero order
reaction shown in eqn 11 This data does not need to be transformed as the linear fit
is equal to the rate constant multiplied by -1 43
Figure 17 A graphical representation of generated time-series data for a second order
reaction shown in eqn 11 This data is plotted as the reciprocal of the concentration
vs time and the gradient of the linear fit to this data is the rate constant 43
Figure 18 A graphical representation of generated time-series data for a second order
reaction shown in eqn 18 where [A] = [B] = This data is plotted as a log-
transformed concentration fraction vs time The gradient of the linear fit to this data is
the rate constant multiplied by the initial concentration of B minus the initial
concentration of A 45
Figure 19 A representation of Michaelis-Menten kinetics where the initial reaction rate of
individual experiments with differing substrate concentrations x is plotted This plot is
then used to determine the kinetic parameters Vmax and KM 48
Figure 110 A representation of the Lineweaver-Burk equation where the inverse of the
initial reaction rate of individual experiments with differing substrate concentrations x
is plotted This plot is then used to determine the kinetic parameters Vmax and KM 49
Figure 111 An overlay of two experimental datasets with the same lsquoexcessrsquo of reactant
concentration for the reaction shown in Scheme 117 This overlap indicates no
product inhibition or catalyst deactivation Reproduced with permission 51
Figure 112 As there is no overlay in the two experimental datasets with the same lsquoexcessrsquo
of reactant concentration in the reaction system shown in Scheme 118 this indicates
some product inhibition or catalyst deactivation A further experiment is necessary to
determine what is occurring Reproduced with permission 52
10
Figure 113 Graphical rate equations for the alkylation reaction shown in Scheme 119 a)
Standard graphical rate equation b) Using the RPKA methodology to observe any
overlap in the lsquodifferent excessrsquo reaction curves This overlap indicates that the
reaction order of Et2Zn is 1 Reproduced with permission 53
Figure 114 A time shift of the profiles of two reactions to observe overlaying plots This
allows the comparison of two profiles with the same starting material concentrations
but different product concentrations therefore identifying signs of product inhibition or
catalyst deactivation Reproduced with permission 54
Figure 115 A summary of the use of RPKA and VTNA a) catalyst deactivation or product
inhibition b) catalyst order c) reagent order d) catalyst deactivation or product
inhibition e) catalyst order f) reagent order Reproduced with permission 56
Figure 116 Some different classes of optimisation problem where variable n is an input
variable and the function evaluation is a measure of how the function is minimised
with the changing variable a) Linear optimisation problem b) Convex optimisation
problem c) Non-linear optimisation problem 59
Figure 117 A representation of a steepest-descent algorithm minimising a 2-dimensional
contoured parameter space where о indicates a measurement Where red areas are
function maxima and blue areas are function minima 60
Figure 118 A representation of a simplex optimisation for a 2-dimensional contoured
parameter space where the numbered vertices of each polyhedron indicate a
measurement Where red areas are function maxima and blue areas are function
minima 61
Figure 119 The different geometric transformations of the Nelder-Mead simplex inside
contraction (XIC) multiple contraction (MC) outside contraction (XOC) reflection (XR)
and expansion (XE) 62
Figure 120 A 1-dimensional optimisation using an interior-point method The approximate
objective function is minimised for the starting trust region t0 63
Figure 121 A 1-dimensional optimisation using an interior-point method The approximate
objective function is minimised for the sequential trust regions until the overall function
is minimised The path that the algorithm can take can be described as the algorithm
path or the central path towards the optimum 63
Figure 122 A depiction of the flow of a simple genetic algorithm 64
Figure 123 A depiction of one iteration of a simple genetic algorithm Figure adapted from
works reported by Boyd amp Vandenberghe[155] 65
Figure 124 The Bayesian optimisation of f(x) where (i) - (viii) represent the sequential
iterations of the minimisation The acquisition function is shown in red measurements
are shown as red dots and the current estimated surrogate model is shown in blue
with its corresponding 95 confidence interval The maximum of the acquisition
function indicates the next measurement to be taken 67
Figure 125 A graphical method to solving ILP problems where C1 - 4 indicate the linear
constraints the green area indicates the feasible region f shows the objective
function red dots represent the integer values of the inputs and P1 and P2 indicate
two feasible potential maxima to the problem Figure adapted from works reported by
Boyd amp Vandenberghe[155] 68
Chapter 2
11
Figure 21 The Mass Matrix inputted into the approach assigning mass to each of the
species 75
Figure 22 The stoichiometric matrices for the reaction model shown in Scheme 21 as
well as the overall stoichiometry matrix S 76
Figure 23 The ILP optimisation identifying a feasible solution to the objective function
hence identifying a mass-balance-allowed reaction Where X1 = A X2 = B X3 = C X4
= D 76
Figure 24 A visual representation of all of the possible reaction models when given five
mass-balance-allowed sample reactions each shown as a different coloured block
When i = 1 each reaction is in itself a model and when i gt 1 each reaction behaves
as a model fragment These fragments when combined in different ways provide full
and unique reaction models each of which are to be assessed for their validity with
respect to experimental data 78
Figure 25 A schematic summarising how the model generation stage of the approach
progresses Where the participating species are inputted and sorted ODE functions
that describe all possible mass-balance-allowed reactions are outputted 79
Figure 26 The iterations of an optimisation algorithm with respect to the convergence of
simulated ODEs with sample data - this occurs via the minimisation of the SSE
output 81
Figure 27 An outline of the stages of the computational approach 88
Figure 28 An example showing the generation of a simulated data set from the literature
a) An ODE is simulated for a particular model with a set of kinetic parameters in this
case A rarr B where mdash = A mdash = B b) Particular time points are taken from this ODE
to represent individual measurements where x = A x = B c) Up to 5 relative
random error is added to these measurements to more closely resemble real
experimental data 90
Figure 29 The fit of the identified model and kinetic parameters to the generated
experimental data with starting concentrations of 01 M benzoic acid and 011 M
iodomethane Where x = benzoic acid x = iodomethane x = methyl benzoate mdash =
benzoic acid (ODE) mdash = iodomethane (ODE) mdash = methyl benzoate (ODE) 93
Figure 210 The fit of the identified model and kinetic parameters to the generated
experimental data with starting concentrations of 1 M nitrile and 2 M hydroxide at 90
degC Where x = nitrile x = amide x = carboxylic acid mdash = nitrile (ODE) mdash = amide
(ODE) mdash = carboxylic acid (ODE) 97
Figure 211 The fit of the identified model and kinetic parameters to the generated
experimental data with starting concentrations of 1 M 24-dichloropyrimidine and 22
M morpholine at 90 degC Where x = 24-dichloropyrimidine x = 4-substituted product x
= 2-substituted product x = bis-substituted product mdash = 24-dichloropyrimidine
(ODE) mdash = 4-substituted product (ODE) mdash = 2-substituted product (ODE) mdash = bis-
substituted product Graph is only shown to 260 minutes to show curvature of the
initial data points 102
Chapter 3
Figure 31 A diagram to show the direction and flows within a flow regime where a)
laminar flow b) turbulent flow 104
12
Figure 32 A plug flow reactor model where there is perfect mixing in the radial direction
but no forward or backward mixing in the axial direction Plugs 1 and 2 are examples
of the infinitely short plugs existing within this reactor model 105
Figure 33 A depiction of how a kinetic experiment can be run utilising a step change in
flow rates between two steady-states (I and II) allowing time-series data to be plotted
from transient data Figure adapted from Mozharov et al[93] 107
Figure 34 A kinetic profile generated from the Knoevenagel condensation shown in
Scheme 31 where kinetic information was obtained by measuring conversation at
given residence times at steady-state at two temperatures Steady-state markers x
are shown as part of the lsquoA Modelrsquo Reproduced with permission 109
Figure 35 A kinetic profile generated from the Knoevenagel condensation shown in
Scheme 31 where kinetic information was obtained using a flow rate step-change at
two temperatures Steady-state markers x are shown as part of the lsquoA Modelrsquo where
step-change markers o are shown as part of the lsquoB Modelrsquo Reproduced with
permission 110
Figure 36 A depiction of how a continuous flow reactor may be described as a series of
sequential pseudo-batch reactors where the colour represents the extent of
conversion from low (green) to high (red) Q represents the total flow rate ti
represents the initial time of each pseudo-batch reactor entering the reactor tf
represents the final time tm is the time at which the concentration is actually
measured by the IR probe Reproduced with permission 110
Figure 37 A combination of the kinetic models for the reaction yielding 37 in Scheme 32
where the differing colours represent different values of S where S is a corrective
residence time multiplier to show the reproducibility of the controlled flow ramp
methodology S = 14 (blue) S = 13 (red) S = 12 (green) S= 23 (orange) steady-
state experiments = x Reproduced with permission 111
Figure 38 A photograph of the automated continuous flow reactor used for this work 113
Figure 39 A mathematically correct representation of how linear gradient flow ramps can
be utilised to sample with a high data density on the initial curvature of the kinetic plot
Where diams = data point Tn = experiment temperature Q = total flow rate Time = time
the reaction has been running τ = residence time that the reaction mixture
experiences 114
Figure 310 Kinetic profiles for two flow ramp experiments at 65 degC and 75 degC where x =
phenol x = phenyl acetate mdash = phenol (ODE) mdash = phenyl acetate (ODE) 117
Figure 311 Graphs showing the agreement between steady-state and flow ramp
measurements for the reaction of phenol with acetyl chloride where curves are fitted
to the steady-state data Where = phenol (steady-state) x = phenol (flow ramp) =
phenyl acetate (steady-state) x = phenyl acetate (flow ramp) 118
Figure 312 Kinetic profiles for four flow ramp experiments at 30 degC 60 degC 160 degC and 180
degC where x = 4-aminophenol x = paracetamol x = diacetamate mdash = 4-aminophenol
(ODE) mdash = paracetamol (ODE) mdash = diacetamate (ODE) See Chapter 732 for full
experimental conditions and raw data 120
Figure 313 Kinetic profiles for the flow ramp experiments at 130 degC 150 degC 190 degC and
210 degC where x = starting material x = Metoprolol x = bis-substituted product mdash =
starting material (ODE) mdash = Metoprolol (ODE) mdash = bis-substituted product (ODE)
See Chapter 733 for full experimental conditions and raw data 123
13
Chapter 4
Figure 41 An illustration of how the lsquoinflationrsquo step takes all mass-balance-allowed
transformations sequentially then deduces all allowed integer and non-integer orders
and generates corresponding rate laws for these transformations If catalytic reactions
are to be explored also rate laws for these catalytic dependencies are also
generated These transformations are all then saved from which full reaction models
can be constructed 130
Figure 42 An overview of the updated computational approach to kinetic model and
parameter determination 137
Figure 43 The fit of the identified model and kinetic parameters to the generated
experimental data with starting concentrations of 12 M 24-difluoronitrobenzene and 3
M pyrrolidine at 30 degC Where x = 24-difluoronitrobenzene x = ortho-substituted
product x = para-substituted product x = bis-substituted product mdash = 24-
difluoronitrobenzene (ODE) mdash = ortho-substituted product (ODE) mdash = para-
substituted product (ODE) mdash = bis-substituted product Plot only shown to 500
minutes to the show curvature of the initial data points 145
Figure 44 The fit of the identified model and kinetic parameters to the generated
experimental data with starting concentrations of 1 M starting material and 08 M
spirodiene at -78 degC Where x = starting material x = spirodiene x = product mdash =
starting material (ODE) mdash = spirodiene (ODE) mdash = product (ODE) 149
Figure 45 The fit of the identified model and kinetic parameters to the generated
experimental data with starting concentrations of 15 M starting material 2 M
diphenylphosphine and 01 M ytterbium catalyst at 22 degC Where x = starting
material x = diphenylphosphine x = product mdash = starting material (ODE) mdash =
diphenylphosphine (ODE) mdash = product (ODE) 152
Chapter 5
Figure 51 The distinctive proton peaks shown in red that are monitored via NMR as time
progresses in the SNAr case study 155
Figure 52 Kinetic profiles for four kinetic experiments at -25 degC 0 degC 25 degC and 50 degC
where = starting material = 2-substituted product = 4-substituted product mdash =
starting material (ODE) mdash = 2-substituted product (ODE) mdash = 4-substituted product
(ODE) See Chapter 751 for full experimental conditions and raw data 156
Figure 53 The batch setup for experimentation in the PfBr case study where the
temperature probe is submerged in the reaction medium that is heated via a heater
stirrer 160
Figure 54 Kinetic profiles for three kinetic experiments at 30 degC 35 degC and 40 degC where
red plots indicate PfBr concentrations and blue plots indicate Pf-Al-Me concentrations
At 30 degC = experimental data mdash = ODE At 35 degC = experimental data - - - =
ODE At 40 degC = experimental data = ODE See Chapter 752 for full
experimental conditions and raw data 161
Figure 55 Kinetic profiles for two kinetic experiments at 50 degC with the initial concentration
of maleic acid at 04 M and 08 M At 04 M = maleic acid mdash = maleic acid (ODE)
= mono-product mdash = mono-product (ODE) = di-product mdash = di-product (ODE)
At 08 M = maleic acid - - - = maleic acid (ODE) = mono-product - - - = mono-
product (ODE) = di-product - - - = di-product (ODE) See Chapter 753 for full
experimental conditions and raw data 165
14
Chapter 73
Figure 731 The flow reactor setup for the phenyl acetate case study experiments 174
Figure 732 An example HPLC chromatogram in the phenyl acetate case study at 254 nm
175
Figure 733 The reactor setup for the paracetamol flow ramp experiment at 30 degC 179
Figure 734 The reactor setup for the paracetamol flow ramp experiment at 60 degC 180
Figure 735 The reactor setup for the paracetamol flow ramp experiment at 160 degC 180
Figure 736 The reactor setup for the paracetamol flow ramp experiment at 180 degC 180
Figure 737 An example HPLC chromatogram from the paracetamol case study showing
the separation of all reaction components at 254 nm 181
Figure 738 A photograph of the automated flow system at AstraZeneca 188
Figure 739 The reactor setup for the metoprolol flow ramp experiments at 190210 degC in
Leeds 189
Figure 7310 The reactor setup for the metoprolol flow ramp experiments at 130150 degC at
AstraZeneca 190
Figure 7311 An example HPLC chromatogram during a kinetic experiment in the
metoprolol case study at 220 nm 190
Chapter 75
Figure 751 The dedicated NMR spectrometer used for kinetic experiments in the SNAr
kinetics case study 199
Figure 752 lsquoStackedrsquo NMR spectrum showing several NMR spectra over time in the 25 degC
experiment 200
Figure 753 A 13C NMR confirming the presence of the PfBr material compared to
literature values to identify the material[246] 207
Figure 754 IR analysis of the PfBr material showing the absence of a hydroxy peak from
any residual PfOH 208
Figure 755 HPLC analysis of the PfBr material at 254 nm indicating that a pure product is
present 208
Figure 756 An example HPLC chromatogram at 230 nm during a kinetic experiment in the
PfBr case study 210
Figure 757 An example NMR spectrum from the maleic acid case study 212
List of Tables
Chapter 1
Table 11 A table summarising reaction analysis techniques in flow systems adapted from
Houben and Lapkin[121] 39
Chapter 2
15
Table 21 A table showing the optimised k values for the identified models in the benzoic
acid alkylation case study alongside each modelrsquos SSE and AICC 92
Table 22 A table showing the top three ranked models for the nitrile hydrolysis case study
The kinetic parameters for each reaction within the model is shown as well as the
SSE and AICC evaluation 95
Table 23 A table showing the top three ranked models for the SNAr case study The kinetic
parameters for each reaction within the model is shown as well as the SSE and AICC
evaluation 100
Chapter 3
Table 31 Evaluation of the feasibility of each reaction model for the phenyl acetate study
116
Table 32 Evaluation of the feasibility of each reaction model for the paracetamol study 120
Table 33 Evaluation of the feasibility of each reaction model for the metoprolol study 124
Chapter 4
Table 41 A table showing examples of allowed and disallowed models according to Rule
4 134
Table 42 A table showing the top five ranked models for the SNAr case study as identified
by the old approach The kinetic parameters for each reaction within the model are
shown as well as the SSE and AICC evaluation 142
Table 43 A table showing the top five ranked models for the SNAr case study as identified
by the new approach The kinetic parameters for each reaction within the model are
shown as well as the SSE and AICC evaluation α denotes a variable molar
dependence within the kinetic parameter units depending on the rate law 143
Table 44 A table showing the top five ranked models for the pentyne case study as
identified by the new approach The kinetic parameters for each reaction within the
model are shown as well as the SSE and AICC evaluation α denotes a variable molar
dependence within the kinetic parameter units depending on the rate law 147
Table 45 A table showing the top five ranked models for the ytterbium catalysis case study
as identified by the new approach The kinetic parameters for each reaction within the
model are shown as well as the SSE and AICC evaluation α denotes a variable molar
dependence within the kinetic parameter units depending on the rate law 150
Chapter 5
Table 51 Evaluation of the feasibility of each reaction model for the SNAr case study
where α is variable for each model depending on the overall model order 156
Table 52 Evaluation of the feasibility of each reaction model for the PfBr case study where
α is variable for each model depending on the overall model order 161
Table 53 Evaluation of the feasibility of each reaction model for the maleic acid case
study where α is variable for each model depending on the overall model order 165
16
17
List of Abbreviations
A Pre-exponential factor
Ac Acetyl
AIC Akaikes information criterion
AICC Corrected Akaikes information criterion
API Active pharmaceutical ingredient
Aq Aqueous
Bn Benzyl
bp Boiling point
Bu Butyl
cm Centimetre
CSTR Continuous stirred tank reactor
CRN Chemical reaction network
DCM Dichloromethane
Ea Activation energy
Equiv Equivalents
Et Ethyl
g Gram
GA Genetic algorithm
GC Gas chromatography
h Hour
HPLC High performance liquid chromatography
Hz Hertz
ID Inner diameter
ILP Integer linear programming
IR Infrared
k Rate constant
K Kelvin
kref Reference rate constant
18
L Litre
m Metre
M Molar
Me Methyl
MILP Mixed integer linear programming
min Minute
mL Millilitre
MM Mass matrix
mmol Millimole
mol Mole
MS Mass spectrometry
NMR Nuclear magnetic resonance
OD Outer diameter
ODE Ordinary differential equation
PFR Plug flow reactor
Ph Phenyl
R Ideal gas constant
Re Reynolds number
S Stoichiometry
SNAr Nucleophilic aromatic substitution
SSE Sum of squared error
T Temperature
TFA Target factor analysis
tR Residence time
Tref Reference temperature
tRes Residence time
V Volume
19
Chapter 1 Introduction
The main aim of this project is to develop and advance methodologies for
kinetic model determination and parameter estimation The acquisition of the
experimental data necessary for these studies is flexible and can be obtained by
any means However given the numerous advantages of continuous flow
chemistry and the availability of a flow chemistry platform many chemistries
were performed using this regime For this reason continuous flow chemistry is
broadly covered in this introduction as well as a comprehensive look at methods
of obtaining kinetic data in Chapter 31
Current methodologies of obtaining kinetic information are herein broadly
covered and critically analysed However in-depth discussions about the
relevant literature to the kinetic methodologies developed during this project are
highlighted in Chapter 21 Furthermore as these kinetic methodologies feature
significant use of optimisation algorithms discussions regarding optimisation
problems and common algorithms are also found in this introductory chapter
This coverage depicts the general relevancy of different types of algorithm to
particular circumstances with specific kinetic fitting algorithm discussions
featured in Chapter 2222
11 Continuous flow chemistry
Continuous flow chemistry is rapidly becoming the optimum way to conduct
a wide variety of different chemical reactions This section introduces the concept
of flow chemistry featuring a discussion of the advantages and disadvantages
as well as when to adopt this methodology This broad introduction also covers
different reports from the literature pertaining to different classes of reaction in
flow as well as how these reactions can be analysed and optimised either on-
line or off-line
111 Batch and flow reactions
To discuss flow chemistry it is first important to understand the
differences between this methodology and traditional batch chemistry Batch
reactions are still the lsquonormalrsquo bench practice today after being standardised 200
years ago in the time of Friedrich Wӧhler as there are still advantages to
20
conducting synthesis this way This batch reaction approach to synthesis
whereby the chemistry is conducted essentially in a vessel is historically the
most fruitful and rewarding approach in terms of discoveries Suzuki couplings[1]
Sonogashira couplings[2] and the Wittig reaction[3] among hundreds of other
ground breaking mechanisms were all discovered via batch reactions A flow
chemistry regime differs in that there is no bulk reaction medium in a vessel By
using pumps tubing and differing flow reactors small volumes of reaction
medium are constantly flowing and reacting to provide a continuous outlet stream
of reacted material Although this flow methodology has been known for a
relatively long time the historic uptake in synthetic laboratories has been low[4]
However as flow technology improves and becomes easier to adopt in the
laboratory[5] it is increasingly important to evaluate whether a particular chemical
process would be most efficient in batch or flow regimes in terms of product
output or otherwise
For example when considering exploratory synthesis in contrast to batch
using flow chemistry consisting of tubing and microreactors to attempt to
discover new syntheses by exploring discrete options is not typically a good
application[6 7] This is because the main strengths of flow processes come
mainly from already existing reaction pathways where optimising product output
is the focus and to construct a flow system to conduct a purely exploratory
reaction is a traditionally inefficient use of time whereas batch can be
implemented much faster In recent years however high throughput flow
systems have been developed for automated discovery[8 9] Unfortunately
though as the equipment for this type of discovery is specialist and can be
expensive it can still be argued that simple exploratory benchtop batch reactions
are still much more efficient in terms of time and cost
There are other general instances where batch is often still favourable for
chemical transformations for example when precipitation drives reaction
completion[7] In batch this isnrsquot an issue however when using a flow setup this
will frequently result in channel mixer or pressure regulator clogging - this is also
true when using high viscous liquids[10] As a general rule precipitation
suspensions and other instances where solids are used can lead to
complications in the process - this can be mitigated through reaction dilution but
may then suffer from low productivity The introduction however of standardised
21
laboratory equipment (such as miniaturised CSTRs Freactors) for continuous
flow can then facilitate such multiphase processes to allow maintained
efficiency[11 12]
Despite some of these limitations there are significant benefits to
continuous flow processes which have become apparent alongside the
tremendous practical advances in recent years many of which have been
utilised in actually transferring batch processes into flow as more and more
batch procedures are superseded[13-15] Reduction of reaction times[16 17] and
increases in conversion and selectivity may be observed by transferring to flow
processes[18] This may be for a number of reasons but is likely due to the
increased mass transfer that can be expected from flow systems as well as the
ability to increase the temperature of the reaction medium further past the boiling
point of the solvent which is discussed further in Chapter 1121 This will lead
to an overall increase in both the reaction rate and productivity Two examples
are shown herein where increased conversion was observed Scheme 11
reports the synthesis of hexene from hexanol in flow by Wilson and McCreedy[19]
with a conversion of around 90 whereas in conventional batch reactors this
reaction conversion does not exceed 60 Most notably there was no
degradation of the performance after three days of continuous use which may
be expected from a fixed bed catalyst Scheme 12 shows another direct
comparison of conversion in flow and batch by Wiles et al[20] where the Michael
addition is completed in 20 minutes with 100 conversion in flow compared to
the reaction completion in 24 hours with 89 conversion in batch
Scheme 11 The conversion of hexanol 11 to hexene 12 in a continuous flow setup[19]
22
Scheme 12 The flow synthesis of the adduct 15 via a Michael addition between the
dicarbonyl 13 and the alkyne 14[20]
A main advantage to using flow chemistry setups to perform reactions
arises from the equipment featured within the setups themselves - namely the
pumps Pump flow rates can be set to very precise flows which can very
accurately deliver particular ratios of reagents at given points along the flow
setup[21-23] This ensures that the correct stoichiometry of the reagents is present
in the reaction and these exact stoichiometries can be delivered continuously
and with minimal error[21 24] This allows for optimisation and kinetics studies with
precise reagent additions that would otherwise be troublesome for an
experimenter to consistently and dependably deliver These same flow rates also
ensure that the residence time is exact and consistent meaning sampling points
are reliably accurate in sampling the reaction medium after a specific reaction
time[25 26] This point however is highly dependent on the mixing regime present
which is discussed further in Chapter 31
Another noteworthy advantage to flow processes is that a large number
of reactions can be executed and hence a large amount of data can be obtained
using only minimal quantities of a reagent in flow This is because much less
reagent is required for reaction and subsequent on-line analysis in a microreactor
compared to bench scale batch setups This is a particularly desirable attribute
of a system if you have an expensive material or a material that is synthesised
by a time consuming process where you need to be conservative with its use
but still obtain lots of experimental data[24]
One example of a reaction that has been successfully transferred from
batch to flow is a multi-step synthesis of ibuprofen 18 conducted by Bogdan et
al[27] This synthesis demonstrates that even flow processes with multiple steps
can be achieved without intermediate purification steps in a streamlined and
efficient manner This is provided as long as care in the reaction chronology has
been undertaken ensuring excess reagents and byproducts from previous steps
are compatible with downstream processes shown in Scheme 13 This
efficiency is important when creating complex molecules because although the
stepwise batch reactor processes are effective they are also very wasteful
particularly when they involve consecutive work-up procedures An example of
this is in the pharmaceutical industry where in general 25 - 100 kg of waste is
23
produced for every 1 kg of complex molecule[28] However to facilitate reaction
compatibility expensive or atom-inefficient transformations may be necessary
such as the use of phenyl-iodine(III) diacetate and TMOF to incur a chemical
rearrangement in the reported ibuprofen synthesis below This may require a
careful balance to achieve green metrics in product manufacturing Further
discussion on reaction telescoping is provided in Chapter 1126
Scheme 13 The multistep continuous flow synthesis of ibuprofen 18
In large scale batch reactor design used in industry the most significant
problems to be overcome are the heating and agitation of the system and it has
even been reported that processes cannot be scaled up further due to
temperature and mixing gradients[29] This problem relates to the fact that it is
difficult to effectively heat and agitate a large mass completely uniformly which
can lead to different reactivities present at different points within the vessel - this
can result in decreased product yield due to an increased rate of side reactions
or more seriously a runaway reaction when exothermic processes are
involved[30 31]
By contrast mesoscale flow systems (channel diameter 1 - 10 mm) and
in particular miniaturised flow reactors (channel diameter 50 - 1000 microm) are
excellent at efficiently heating and mixing reactants[32] Rapid heating of reaction
microchannels through the walls of a preheated reactor ensures the reaction
mixture is thoroughly and uniformly heated and mixed which is attributed to the
24
large surface area to volume ratios of the microchannels[18 33] This heating can
be achieved by oil baths conventional ovens or even microwave heating all of
which achieve the same goal which is precise temperature control with
increased safety[34-36] The high molecular diffusion across the relatively narrow
microchannels allows assumptions of perfect cross-sectional mixing in a lsquoplug
flowrsquo regime[37] (see Chapter 31) and mass transfer can further be improved
through the use of static mixers[38] or CSTRs[39]
This increased safety in flow reactors is attributed to only a small amount
of reaction material present in the reactor at any one time enclosed within a
tubular vessel Therefore although the chemical exposure is the same during
reservoir preparation the experimenter is not exposed to any harmful material
during experimentation as long as all inlets and waste streams are properly
contained The is advantageous especially in processes where there are highly
exothermic steps alongside even the possibility of scale-up of formerly non-
scalable reactions[36 40] This scalability can be achieved simply by running one
flow reactor for a long period of time or several identical flow reactors in parallel
in a process called lsquonumberingrsquo - any number of flow reactors can be lsquonumbered
uprsquo to achieve the required throughput[41-43]
112 Reactions in flow
Alongside the aforementioned general advantages that flow processes
have over batch there are several distinct reaction niches which have specific
facets whereby translation to flow has distinct benefits There are many different
areas where continuous processes have helped to transform research as well
as industrial processes that may branch from them This literature review will
focus only on the most common types of reaction in flow in which most reactions
are likely to encompassed Also refer to flow chemistry reviews on polymer
chemistry[44] the use of extreme temperature[45] and slurry reactors[46]
1121 Temperature-accelerated reactions
Temperature-accelerated reactions are the most basic and most common
use of flow setups whereby reactants are fed into a heated microreactor to
perform a chemical transformation The use of flow enables access to higher
temperatures in a system with excellent safety which means that reactions can
be performed which would otherwise be too slow or unobtainable in other
25
systems Temperature-accelerated reactions in a traditional batch setup are
often limited by the laboratory equipment and the boiling point of the solvent and
having to switch to different higher-boiling solvents can lead to complications in
both the reaction and the purification[47 48] High-pressure batch vessels can be
used to facilitate these higher temperature reactions (such as Parr reactors or
autoclaves)[49] but additional equipment and safety considerations must be
made in these cases
However in flow setups there is no need to give significant consideration
to changing the solvent as the boiling of the solvent can be suppressed in most
cases by the use of a back-pressure regulator[50] Therefore when conducting
these reactions where higher temperatures can be accessed in flow setups the
reaction rates are also generally higher[14] This alongside the aforementioned
increased associated safety in using flow setups can make flow a desirable and
convenient option for temperature-accelerated reactions Scheme 14 and
Scheme 15 show examples of temperature-accelerated reactions that have
been conducted in flow where in both cases the temperature of the reaction was
conducted at a higher temperature than the boiling point of the solvent leading
to decreased reaction times [51 52] It is also worth noting that unless explicitly
stated a back pressure regulator will have been used in all schemes in this
literature review if the temperature of the reaction exceeds the boiling point of
the solvent used
26
Scheme 14 The temperature-accelerated SNAr reaction of 19 with 110 to form 111 in THF
(boiling point 66 degC) under flow conditions[51]
Scheme 15 The Fischer Indole synthesis of 114 from the hydrazine 112 and dihydrofuran
113 in methanol (boiling point 65 degC) using a flow setup[52]
1122 Supercritical fluid
The use of supercritical fluids (SCFs) as solvents in flow processes have
attracted attention in the past 30 years mainly motivated by the prospect of
replacing toxic industrial solvents[53] For example the environmental interest of
using supercritical CO2 or H2O ushers in opportunities for greener chemical
processes by replacing some of the more harmful solvent systems[54-56] This is
an admirable objective for process chemists and can lead to cleaner and more
sustainable reactions[57]
Whilst the green aspects of using SCFs are attractive perhaps the
greatest quality they possess are their physiochemical ldquohybridrdquo properties an
intermediary between liquids and gases whereby properties can be finely tuned
by marginal variations in temperature and pressure As a result SCFs exhibit
gas-like viscosities as well as no surface tension which are objectively
advantageous in processes involving interface and surface chemistry[58-60]
Furthermore the liquid-like densities allow for substantial dissolution of
precursors within the SCF and diffusion coefficients are generally at least 100
times greater in SCFs than in liquids All of these factors contribute towards
processes whereby the reaction conversion is significantly improved as a direct
effect of using SCFs[53 61-63] However the compatibility of these supercritical
solvents must still be tested with the process of interest (as with any solvent) as
there may be solubility or reactivity issues
27
Supercritical CO2 (scCO2) is a common solvent in the realm of SCFs
because of its easily obtained critical parameters at bench scale it is also
extracted easily with high purity as a byproduct from many processes as well as
being non-toxic and non-flammable[64] One of the most notable industrial scale
applications using scCO2 is the hydrogenation of isophorone 115 shown in
Scheme 16 which obtains 116 in a sufficiently pure state without any
downstream purification[65] Another common process developed from the use of
scCO2 by taking advantage of the non-toxicity of the solvent is the
decaffeination of coffee beans which has since become one of the most popular
decaffeination methods[66 67]
Scheme 16 The hydrogenation of isophorone 115 to TMCH 116[65]
One major problem with using scCO2 in flow processes however is its
incompatibility with primary and secondary amines due to carbamate formation
which can precipitate out of solution and therefore block any microchannels in
the system[68] Other supercritical solvents can be used in these cases such as
scNH3 although this presents a problem in itself that it cannot be used with
aqueous solutions because of ammonium hydroxide formation - nonetheless
supercritical ethane and propane have been used as direct replacements for
scCO2 due to similar critical parameters[69]
Using continuous reactors for SCFs have the advantage over batch
reactors that they do not require depressurisation to add further material to the
process or recover products Also a predominant advantage to using continuous
reactors is that reaction parameters such as temperature flow rate and pressure
can all be changed almost independently of each other In context this ability
allows the properties of the SCF to be altered in real time when optimising
reactions which cannot be done easily in batch reactors - this versatility of
continuous reactors makes it the favourable choice when working with SCFs[70]
1123 Photochemical reactions
28
The use of photons at given wavelengths to provide sufficient energy to
overcome activation energy barriers is the basis of photochemical reactions
complex molecular structures can be achieved via these unique reaction
pathways that are otherwise unobtainable via thermochemical or electrochemical
methods[71 72] Implementing photochemical reactions is also beneficial as a
photon is a ldquogreenrdquo reagent which is traceless and thus doesnrsquot require
removalrecycling in the same way many other reagents do
Photochemistry is not regarded only as a unique and novel pathway to
molecules with exotic structures however - one example of where
photochemistry is used extensively in industry is in the Toray process to attain
caprolactam which is used to manufacture Nylon 6[73] Photochemical reactions
have also been found to benefit from continuous flow systems where large-scale
photochemical synthesis is significantly more effective when compared to their
corresponding batch approaches[74] This is due to problems regarding
penetration into the bulk reaction medium which is an important boundary that
has to be overcome Most of the photochemical synthesis occurs within a short
radius of the lamp meaning the reaction conversion is scale dependant The
small tubular diameters in flow systems take advantage of this by exposing the
entire reaction medium to the light source as it passes through the reactor[75]
One example where a photochemical reaction has been implemented into
a flow process is reported in the continuous [2 + 2] photocycloaddition producing
the cyclic product 118 shown in Scheme 17 [74] In this reaction the conversion
is quoted at 83 and because the reaction conversion is scale independent the
continuous process can be run indefinitely to produce over 500 g per 24 hour
period This process can then be scaled up further as in any continuous flow
process by numbering up
29
Scheme 17 The [2 + 2] photocycloaddition of malemide 117 with 1-hexyne to produce the
cyclic product 118[74]
1124 Electrochemical reactions
Electrochemistry is another clean and efficient reaction method in the
realm of organic synthesis where the electricity supplied to the reaction system
induces the formation of the reactive intermediates from neutral substrates This
method of reaction has significant advantages to conventional batch processes
one of which being that harmful oxidising and reducing agents can be substituted
using electrochemistry By applying precisely controlled current between two
electrodes reactions can be achieved by using milder reagents This method
allows milder reagents as electrons can be addedremoved without the need for
chemical reducingoxidising agents which could complicate the reaction
especially in flow systems where downstream processes can be highly affected
by excess chemical reagents[76] Also as the electrons are the ldquoreagentrdquo in these
reactions as well as being widely and readily available electrochemical reaction
pathways become cheaper and less labour-intensive as alternative costly
reagents donrsquot need to be used[77]
One example of where electrochemical synthesis in flow has been
observed is in the anodic substitution reaction by Horii et al [78] shown in scheme
18 with yields of up to 74 In flow processes such as this the laminar flow
regime is used as an advantage - two inlets of separate flows join together in the
reaction vessel where their respective microchannel sidewalls are anodic and
cathodic opposite to one another This ensures the dominant oxidation of the
substrate 119 to form a cationic intermediate whilst the nucleophile 120
diffuses across the tubular diameter to react to afford 121 [79] Laminar flow and
other mixing regimes are discussed further in Chapter 31
Scheme 18 An electrochemical facilitated nucleophilic substitution reaction to afford the
product 121[78]
1125 Enzymatic reactions
30
Biocatalytic processes are also an area in which research is continuously
progressing in order to develop alternative process routes to the synthesis of fine
chemicals The main issues however arise from enzymes only being able to
operate efficiently in narrow pH and temperature ranges with many organic
substrates having poor solubility in water However implementation of enzymes
whilst using non-aqueous solvents can dramatically improve their applicability[80
81] Within biochemical processes this niche can be important in achieving
reaction optimisation despite given limitations with using biocatalysts
The use of immobilised active enzymes in the column of a flow system is
very attractive and there are many reports in the literature of applied
processes[82 83] An example of this is the continuous process of chiral
cyanohydrin formation shown in Scheme 19 where a column is packed with
defatted almond meal[84] There are also examples where multiple columns with
different immobilised enzymes are used as a multistep continuous process in
order to reach the desired product - one example is reported where 7 separate
columns with differing enzymes achieve the synthesis of UDP-galactose from
inexpensive starting materials[85] This is shown in Scheme 110 as a simplified
one column synthesis with multiple enzymes This also shows how
advantageous immobilised biocatalysis can be in multistep synthesis as there
are no catalysts or harmful reagents that can affect downstream processes
Scheme 19 An enzyme catalysed continuous cyanohydrin formation forming 123[84]
Scheme 110 Multiple enzymatic catalysed continuous process to form UDP galactose
125[85] Individual enzymes stated
1126 Telescoped reactions
31
When considering a total synthesis for a pharmaceutical ingredient or
otherwise it would be ideal to limit the number of steps and hence the amount
of waste time and resources This can be achieved in one way by reaction
telescoping[24] Reaction telescoping is essentially performing multiple chemical
transformations to a molecule sequentially without the need for the purification
of intermediates or removal of waste for example the lsquoone-potrsquo synthesis of
pyridine and quinoline derivatives in batch reported by Kobayashi et al[86]
There are further advantages however to reaction telescoping in flow
that are not observed in batch Using a flow system allows the introduction of
reagents in exact stoichiometries at specific points in the reaction cycle simply
by addition via inlets further down the line within the system Pairing these
additions with differing fixed-temperature reaction vessels also allow for isolated
reaction optimisation for each step along the flow setup in a multi-step synthesis
An example of a multi-step reaction where the success of the synthesis is
attributed to the effective residence time and temperature control of each step is
shown in Scheme 111 in the synthesis of 127[87]
Scheme 111 The multi-step flow synthesis of 127 from coupling o-dibromobenzene 126
with varying electrophiles via sequential halogen-lithium exchange reactions[87]
The main drawback of reaction telescoping is that downstream
transformations have to be compatible with side products and waste from
upstream reactions as any incompatibility leads to a lesser conversion of any
intermediates This serves as a hindrance to the other transformations down the
line hence leading to poor conversion for the overall process Therefore when
considering reaction telescoping great care must be taken into account for
reagent compatibility and reaction chronology
A further advantage to using a flow system however is the opportunity of
in-line purification which can solve reagent compatibility issues - this gives
32
greater accessibility to a variety of different reactions that can all be
accomplished in a single process This in-line purification is made possible by an
in-line liquid-liquid separator such as the separator reported by Zaiput Flow
Technologies that allows immiscible liquids to be separated into two streams
one organic and one aqueous via filtration using a hydrophobic membrane[88]
This separator is shown in Figure 11 An example where a membrane
separation has been used shown in Scheme 112 is in an ibuprofen multi-step
synthesis where Snead and Jamison improved on previous work aforementioned
by Bogdan et al[27 89] This in-line separation avoided the need for triflic acid and
increased the yield to 98 by incorporating this aspect within the process
Flow in
Two separated flows out
33
Figure 11 An annotated picture of an in-line liquid-liquid separator developed by Zaiput Flow
Technologies
Scheme 112 A multi-step flow synthesis of ibuprofen 18 involving an in-line purification
step[89]
There are also several other methods of in-line purification that can be
considered alongside or instead of liquid-liquid separation Gas-liquid
separation[90] micro-distillation[91] solid-supported scavenging[50] and gravity-
based separation[92] have all been reported in the literature but have not be
covered in detail as these methods are not well established
113 Reaction analysis
Reaction analysis in benchtop batch processes are relatively time-
consuming and labour-intensive as samples must often be removed by hand
from the reaction mixture to determine reagent conversion product composition
etc Therefore the elimination of these practices and adoption of their respective
flow processes has many potential cost benefits particularly in fine chemical and
pharmaceutical production[93]
On the other hand for these same methods of analysis the sampling
process can be fully automated by the use of sampling valves A sample valve
34
is a device attached to the line of a flow system where the reaction mixture
passes through undisturbed as if it was an extension of the tubing however there
is a lsquoswitchingrsquo mechanism whereby the flow is diverged from its path into a
separate flow system instantaneously then the original flow is restored
milliseconds later This diverted flow then leads to an analytical system (HPLC
mass spectrometer etc) and has much thinner tubing with a constant mobile
phase flowing ready to carry the injected sample to the analytical equipment
This sampling is termed lsquoon-linersquo as the flow is rerouted from the flow along the
reactor lsquoIn-linersquo therefore refers to sampling without the need to divert reaction
material and is typically non-destructive In all cases great care must be taken
in calibrating the machine to chemistries of interest as quantitative analysis can
often only be performed by calibrating the response of the equipment to known
standard concentrations of each chemical species
This section will report on reaction analysis in flow by the use of well-
established and common techniques such as mass spectrometry and high-
performance liquid chromatography (HPLC) as well as fast developing and high
interest areas such as NMR and IR In each case the system is assumed to be
at lsquosteady-statersquo in which the flow output is consistent - this is explained in detail
in Chapter 31 Also refer to specific papers covering onin-line analysis by UV[94
95] Raman[96] fluorescence[97] GC[98 99] XAFS[100] and NIR[101-103]
1131 Mass spectrometry
The use of mass spectrometry in reaction analysis is a common technique
and when coupled with flow systems on-line mass analysis can be employed to
qualitatively and quantitatively monitor reactions for the identification of products
and intermediates as well as analysis of relative composition[104-106] All of this
can be performed in real-time due to the short method times and is ideal in the
context of reaction monitoring as lots of information can be gained from the mass
spectrometer with little need for data manipulation[107]
An example where mass spectrometry has been used for on-line analysis
in order to monitor reactive intermediates in flow is in the formation of benzyne
132 shown in Scheme 113[108] This experiment was conducted to show how
mass spectrometers are ideally suited to on-line analysis applications although
35
they are rarely used in this way as traditional mass spectrometry instruments are
too large and bulky to be conveniently coupled to flow systems
Scheme 113 A reaction scheme showing the formation of benzyne 132 which was followed
by analysis via mass spectrometry[108]
1132 HPLC
HPLC can also give very good qualitative and quantitative analysis of a
reaction mixture - however the advantage that HPLC has over mass
spectrometry is that it is typically easier to quantify the individual components of
a mixture[109] This is a particularly useful characteristic for modelling the kinetics
of a reaction as the relative abundancies of products from a reaction can be
measured precisely by their peak areas in the chromatograph at different
times[110] as well the ability to differentiate molecules with the same mass and
even different isomers of the same mass
An example where the kinetics of a reaction were studied using the coupling
of a flow system with on-line HPLC is in the thermal isomerization of the endo
molecule 133a to its exo counterpart 133b shown in Scheme 114[111] This
example shows how combining on-line HPLC with an automated flow system
with varying pump flow rates and temperature can lead to an understanding of
the factors influencing yield and purity of a process with the ability to provide
useful data to be utilised for generating response surfaces shown in Figure 12
36
Scheme 114 A reaction scheme showing the thermal isomerization of 133a to 133b which
was followed by analysis via HPLC[111]
Figure 12 The response surface showing temperature and residence time effects on the
thermal isomerisation of 133a[111] Reproduced with permission
1133 IR
The use of in-line IR analysis in flow systems is different as it is not
quantitative in the same respect as mass spectrometry or HPLC IR rather
detects the relative abundancies of particular species by monitoring individual
peak signals The advantage to in-line IR is that key identifiable peaks from
functional groups in an IR spectrum (O-H bonds C=O bonds etc) can be
tracked over time as disappearance or appearance of peaks can serve as an
indicator of reaction completion[112-114] IR analysis is fundamentally non-
destructive which in the context of a flow system means that in-line IR analysis
has been developed and integrated into systems which do not require samples
to be removed from the flow a truly continuous non-interrupted stream but still
continuously analysed by IR[115-117]
An example of where in-line IR analysis has been used to monitor the
completion of a reaction is in the fluorination reaction to yield 136 shown in
Scheme 115[112] The in-line probe brand used was the ReactIR In this reaction
the region where C-F bonds are expected to absorb was monitored during the
reaction in order to establish a reaction completion trend based on the intensity
of the peak produced - this is shown in Figure 13
37
Scheme 115 A reaction scheme showing a fluorination reaction yielding 136 which was
followed by analysis via in-line IR[112]
Figure 13 An IR absorption showing the detailed rise of the C-F bond peak over time
indicating the extent of reaction completion[112] Reproduced with permission
1134 NMR
The use of on-line NMR is also a good quantitative option for flow system
analytics The potential to incorporate high resolution NMR systems into a flow
system to show both structural and conformational changes in chemical
transformations is a desirable potential analytical technique At current generally
only small low-field systems have been developed to be conveniently coupled
with flow systems However this technique thus far has led to the increased
value of using NMR spectroscopy as a non-invasive method as more process
development applications are available[118] Although there are some reports of
using high resolution on-line NMR[119 120] most cases generally utilise low field
NMR systems The low resolution analytical technique is unlike traditional NMR
analysis in a high resolution system (gt 300 MHz) as low-field systems tend to
38
analyse the relaxation times and relaxation weighted signals to identify product
[121]
The main downside to this technique is that as the resolution is often too
low for accurate interpretation of NMR spectra because of small differences in
chemical shifts therefore it is difficult to use for multi-component reaction
analysis[122] However there are examples where this technique has been useful
In a report by Goldbach et al[123] low field on-line NMR was used to monitor the
reagent and product concentrations of the Grignard reaction shown in Scheme
116 This reaction conversion was monitored by peak areas in the aromatic
region over time shown in Figure 14 where over 90 conversion was reported
by the examination of peak appearance and disappearance
Scheme 116 The Grignard reaction that was tracked by on-line NMR[123]
Figure 1 4 The on-line NMR analysis in the aromatic region of the Grignard reaction shown in
Scheme 116 at different time intervals[123] Reproduced with permission
1135 Summary
There is no best method of flow reaction analysis as each individual case
would benefit from an independent examination of the necessary results to be
generated This is because different reactions and outcomes would be more
suited to different analytical systems A table summarising these main analytical
methods as well as other methods with their respective sensitivities acquisition
speeds and limitations are shown in Table 11[124]
39
Table 11 A table summarising reaction analysis techniques in flow systems adapted from
Houben and Lapkin[124]
Technique Type of
information
Sensitivity
mol
Typical
speed of
acquisition
s
Limitations
Mid-IR
Chemical
identity
concentration
~10-1 ~1
Steps have to be
taken to tolerate
water within the
system
Near-IR
Chemical
identity
concentration
~10-1 ~1 Less information
than Mid-IR
Raman
Chemical
identity
concentration
crystal structure
~10-1 ~1-100
Fluorescence
masking Raman
signal
UV-vis
Chemical
identity
concentration
~10-4 lt1 Limited number of
species
NMR
Molecular
structure
concentration
~10-3 ~10
Flow method is
currently limited in
sensitivity and
resolution
GC Concentration ~10-6 10-1500
Typically slow
cannot identify
unknown compounds
HPLC Concentration ~10-6 200-1500
Long method times
must be combined
with mass spec for
proof of molecular
identity
Mass spec
Chemical
identity
concentration
~10-8 ~5-20
Requires
chemoinformatics
expertise
40
114 Continuous flow chemistry summary
Flow chemistry is a powerful methodology that can be employed to obtain
enhanced reaction control over similar batch processes increased heat and
mass transfer accurate residence times and precise continuous addition of
reagents These advantages alongside automated sampling procedures mean
that this regime is an ideal methodology for generating time-series data for the
purposes of this project As kinetic studies benefit from this additional control as
well as further hardware-manipulation techniques discussed in Chapter 31 that
are not possible in batch continuous flow will be used when possible However
not all of the identified niches of flow will be exploited for this project such as
SCF usage electrochemistry etc and have been covered as a holistic overview
of the field
Flow chemistry is not the answer to every case study and itrsquos likely that
there will be instances where chemistry is better suited to batch conditions
however Each chemistry must be evaluated to see if the study would more
appropriate for a flow or a batch regime For totally homogenous systems or for
very fast reactions it is likely that a flow system would be used for the generation
of kinetic data For experimental case studies that require sampling of a
suspension in a reaction medium it is likely that a batch system would be more
appropriate In any case the availability of an automated flow system is very
useful (Chapter 32) and unlocks powerful reaction control that can be difficult to
obtain in batch but batch systems must be employed if the chemistry requires it
12 Kinetic methodologies
The kinetic methodologies applied in this project are computational which
utilise ordinary differential equations (ODEs) to describe kinetic models as well
as optimisation algorithms to maximise the convergence of these ODE curves to
the experimental data - this is described in detail in Chapter 222 This differs
from traditional analytical techniques used more generally in chemistry as well
as specific applied methods in determining reaction order described herein
These methods although useful are difficult to scale as they require user input
and at times qualitative analysis which are not suitable for automatic kinetic
information determination Furthermore these methods may struggle with
41
complex reaction systems or systems with loss of mass balance For these
reasons these methods are covered to describe common kinetic analysis
techniques but are not utilised in this project
121 Conventional methodologies
There are several conventional but considered outdated methodologies
to determining kinetic information that are still employed The most basic
analytical solutions for simple reactions can still be powerful in identifying
reaction order and rate constants[125 126] Consider the first order reaction of
species A reacting to form species B shown in eqn 11 The change in the
concentration of A as time progresses can be described as a differential
equation eqn 12 which can then be integrated to give the integrated rate
equation eqn 13 This integrated rate equation can then be used to determine
the concentration of A at any reaction time and a plot of ln[A] vs time allows the
determination of the rate constant as shown in Figure 15 This method also
allows qualitative confirmation of the reaction order as the experimental data
points should fit to a linear line
Where
bull A = starting material
bull B = product
bull k = rate constant
bull [A] = concentration of A
bull t = time
bull [A]t = concentration of A at time t
bull [A]0 = initial concentration of A at t = 0
119860119896rarr119861 eqn 11
119889[119860]
119889119905= minus119896[119860] eqn 12
ln[119860]119905 = minus119896119905 + ln[119860]0 eqn 13
42
Figure 15 A graphical representation of generated time-series data for a first order reaction
shown in eqn 11 The data is log-transformed to give a linear fit where the gradient is
equal to the rate constant multiplied by -1
If the plot of ln[A] vs time does not produce a linear fit then it is likely that
the reaction order is not 1 with respect to A and may be zero order second order
or even another non-integer order To deduce if the reaction is zero order the
reaction can still be viewed as eqn 11 but the rate of change of A must be
described differently as the zero order reaction is not dependant on the
concentration of A at any time Therefore this differential equation can be
described as eqn 14 which can then be integrated to give the integrated rate
equation eqn 15 A simple plot of [A] vs time deduces if the reaction is zero
order as a linear fit indicates this where the rate constant can also be identified
as shown in Figure 16
119889[119860]
119889119905= minus119896 eqn 14
[119860]119905 = minus119896119905 + [119860]0 eqn 15
43
Figure 16 A graphical representation of generated time-series data for a zero order reaction
shown in eqn 11 This data does not need to be transformed as the linear fit is equal to
the rate constant multiplied by -1
If the reaction is second order with respect to A the rate of change of A
must be described as in eqn 16 which when integrated gives the integrated
rate equation shown in eqn 17 A plot of 1[A] vs time then allows the chemist
to deduce that the reaction is second order if a linear fit is obtained The gradient
of this linear fit can then be ascribed as the rate constant as shown in Figure
17
Figure 17 A graphical representation of generated time-series data for a second order
reaction shown in eqn 11 This data is plotted as the reciprocal of the concentration vs
time and the gradient of the linear fit to this data is the rate constant
If the reaction is more complex and features bimolecular reactions of
different species such as the reaction shown in eqn 18 then there are two
possible scenarios that may be considered to determine the rate constant and
confirm the reaction order The first scenario is where the initial concentrations
of species A and species B are the same In this case the rate of change of A
can be written as eqn 19 However at any time [A] = [B] meaning that the
scenario mimics the second order reaction illustrated in eqn 16 and kinetic
information can be identified by using the corresponding aforementioned
methodology
119889[119860]
119889119905= minus119896[119860]2 eqn 16
1
[119860]119905
= 119896119905 +1
[119860]0
eqn 17
44
The second possible scenario is where the initial concentrations of A and
B are not equal In this case it is useful to define a term x where this relates to
the concentration of each of the species that have reacted at a particular time t
The expression of the rate law then becomes eqn 110 which can be rearranged
to eqn 111
If eqn 111 is then integrated between time zero and t the time of interest
Then integrating by using the method of partial fractions eqn 112 becomes
Substituting [A] for [A]0 - x and [B] for [B]0 - x eqn 113 simplifies to
Therefore resulting in the overall integrated rate equation
Which can be rearranged to obtain
This obtained integrated rate equation shown as eqn 116 can then be
used to determine the rate constant A plot of ln[119861][119860]0
[119860][119861]0 vs time confirms a first
order dependence on both species in the bimolecular reaction if a linear fit is
119860 + 119861 119896rarr 119862 eqn 18
119889[119860]
119889119905= minus119896[119860][119861] = minus119896[119860]2 eqn 19
minus119889119909
119889119905= minus119896([119860]0 minus 119909)([119861]0 minus 119909) eqn 110
119889119909
([119860]0 minus 119909)([119861]0 minus 119909)= 119896 119889119905 eqn 111
int119889119909
([119860]0 minus 119909)([119861]0 minus 119909)
119909
0
= 119896 int 119889119905119905
0
eqn 112
int119889119909
([119860]0 minus 119909)([119861]0 minus 119909)
119909
0
=1
[119861]0 minus [119860]0(ln
[119860]0[119860]0 minus 119909
minus ln[119861]0
[119861]0 minus 119909) eqn 113
int119889119909
([119860]0 minus 119909)([119861]0 minus 119909)
119909
0
=1
[119861]0 minus [119860]0(ln[119861][119860]0[119860][119861]0
) eqn 114
1
[119861]0 minus [119860]0(ln[119861][119860]0[119860][119861]0
) = 119896119905 eqn 115
ln[119861][119860]0[119860][119861]0
= 119896([119861]0 minus [119860]0)119905 eqn 116
45
observed as shown in Figure 18 where the gradient can be used to calculate
the rate constant If a bimolecular reaction is known to occur but this graphing
indicates curvature then itrsquos possible that one or more of the species may have
a reaction order not equal to one Under these circumstances other techniques
must be used to confirm reaction order such as computational approaches to
fitting differential equations which is further described in Chapter 222
Figure 18 A graphical representation of generated time-series data for a second order
reaction shown in eqn 18 where [A] = [B] = This data is plotted as a log-
transformed concentration fraction vs time The gradient of the linear fit to this data is the
rate constant multiplied by the initial concentration of B minus the initial concentration of
A
For kinetic studies involving either biological (enzymatic) or chemical
catalysts the reaction system can still be described by elementary reaction steps
and their respective differential equations If we look at one of the simplest
catalytic systems where an enzyme E binds with a substrate S This is a
reversible binding step where the forward reaction step is k1 and the backward
reaction step is k-1 in which the enzyme-substrate complex ES is formed This
complex can then react to form the product P as well as regenerating the
enzyme catalyst E This reaction is shown in eqn 117 and as before the
differential equations with respect to each of these species are described in eqn
118 - 121
119864 + 119878 1198961119896minus1
119864119878 1198962rarr 119864 + 119875 eqn 117
119889[119878]
119889119905= minus1198961[119864][119878] + 119896minus1[119864119878] eqn 118
46
However although this system can be described in this way it is more
commonly described as approximated models as simple assumptions can
derive a model known as Michaelis-Menten kinetics[127 128] This provides a more
simplistic method of catalytic modelling and prediction by relating the catalyst
concentration to the rate enhancement of a reaction in a different way Michaelis-
Menten kinetics employ the steady-state approximation with respect to the
enzyme-substrate complex ES This means that it is assumed that this complex
will rapidly approach a state where it is generated at the same rate that is
consumed This means that the overall rate of change as described in eqn 122
is zero - this allows a new relationship to be derived between the enzyme
substrate and complex as shown in eqn 123
In order to describe the system as an overall equation relating to the rate
of the reaction we must be able to determine the rate of product formation
shown in eqn 120 However as it is unknown what the free enzyme
concentration is at any point after the reaction has progressed it is more
appropriate to describe the free enzyme E as the total concentration of all
enzyme ET minus the complex concentration [E] = [ET] - [ES] This substitution
into the steady-state approximation derived equation eqn 123 allows the
complex concentration to be described by other concentrations
Followed by expansion
Then rearrangement and factorisation
119889[119864]
119889119905= minus1198961[119864][119878] + 119896minus1[119864119878] + 1198962[119864119878] eqn 119
119889[119875]
119889119905= 1198962[119864119878] eqn 120
119889[119864119878]
119889119905= 1198961[119864][119878] minus 119896minus1[119864119878] minus 1198962[119864119878] eqn 121
119889[119864119878]
119889119905= 1198961[119864][119878] minus (119896minus1 + 1198962)[119864119878] = 0 eqn 122
1198961[119864][119878] = (119896minus1 + 1198962)[119864119878] eqn 123
1198961([119864119879] minus [119864119878])[119878] = (119896minus1 + 1198962)[119864119878] eqn 124
1198961[119864119879][119878] minus 1198961[119864119878][119878] = (119896minus1 + 1198962)[119864119878] eqn 125
47
Then a final rearrangement allows the overall relationship to be described as
Therefore substitution of this relationship into the product formation step in eqn
120 where v is the rate of the reaction relates the overall rate with only the total
enzyme concentration substrate concentration and kinetic rate constants
shown as eqn 129
To now arrive at the familiar form of the Michaelis-Menten equation final
substitutions are made for Vmax and KM shown in eqn 130 producing the overall
equation shown in eqn 131
These terms used in the Michaelis-Menten equation Vmax and KM are
different indicators to what are typically found in other areas of kinetics Vmax
relates to the maximum velocity of the reaction which is independent of substrate
concentration KM is a ratio measure of the breakdown of the enzyme-substrate
complex with relation to the its corresponding formation Different enzymes have
different KM values and can be affected by a range of conditions such as pH and
temperature This equation and other variations when the reaction model differs
(such as enzyme catalysed bimolecular reactions) are commonly used when
studying catalytic kinetics to predict how a system will behave upon changing
concentrations
This model is also useful as the apparent reaction order of the system can
be easily described When the concentration of substrate [S] is very low in
comparison to KM this means that the substrate concentration is deemed to be
1198961[119864119879][119878] = (119896minus1 + 1198962)[119864119878] + 1198961[119864119878][119878] eqn 126
1198961[119864119879][119878] = [119864119878]((119896minus1 + 1198962) + 1198961[119878]) eqn 127
[119864119878] =1198961[119864119879][119878]
(119896minus1 + 1198962) + 1198961[119878]=
[119864119879][119878]
(119896minus1 + 11989621198961
) + [119878]
eqn 128
119907 = 1198962[119864119878] =1198962[119864119879][119878]
(119896minus1 + 11989621198961
) + [119878]
eqn 129
119881119898119886119909 = 1198962[119864119879] 119870119872 =119896minus1 + 11989621198961
eqn 130
119907 =119881119898119886119909[119878]
119870119872 + [119878] eqn 131
48
negligible leading to a direct proportionality between the rate and [S] This
means the reaction appropriates first order kinetics as shown in eqn 132 When
[S] is very large in comparison to KM this means that KM is deemed to be
negligible meaning that the equation cancels any occurrence of [S] leading to
overall zero order kinetics This is shown in eqn 133
Vmax and KM can be determined experimentally by measuring the initial
rates of reaction at varying substrate concentrations After these rates are
determined the graph of reaction rate vs substrate concentration can be plotted
where Vmax is the reaction rate that the curve tends to KM is found via plotting
the relationship of reaction rate to substrate concentration indicated by a curve
whereby KM is equal to the substrate concentration (x axis) when the reaction
rate is half of Vmax (y axis) The experimental determination of these constants is
shown in Figure 19
Figure 19 A representation of Michaelis-Menten kinetics where the initial reaction rate of
individual experiments with differing substrate concentrations x is plotted This plot is
then used to determine the kinetic parameters Vmax and KM
Further development in these Michaelis-Menten kinetic plots then
linearised and simplified this technique leading to a simpler interpretation of the
kinetics as well as easier adoption in determining kinetic parameters This form
of the Michaelis-Menten equation known as the Lineweaver-Burk equation
shown in eqn 134 is simply the double-reciprocal form of eqn 131[129] This
119907 =119881119898119886119909[119878]
119870119872 eqn 132
119907 = 119881119898119886119909 eqn 133
49
allows less complex plotting methods to determine Vmax and KM as shown in
Figure 110
Figure 110 A representation of the Lineweaver-Burk equation where the inverse of the initial
reaction rate of individual experiments with differing substrate concentrations x is
plotted This plot is then used to determine the kinetic parameters Vmax and KM
122 Visual kinetic analysis
In order to identify catalytic reaction behaviour and the order of the
species in these processes different methodologies with the theme of visual
qualitative analysis were developed to allow many scientists to easily extract
kinetic information from their reactions Although the root of these analyses are
still highly mathematical visual kinetic analyses depend on the subjective
analysis of the scientist Therefore precise kinetic parameters cannot be
elucidated however the plots required are simple to construct and easy to
interpret allowing easy determination of the order of the catalystreagents or of
product inhibitioncatalyst deactivation[130]
Reaction progress kinetic analysis (RPKA) employs a checklist to visually
determine this kinetic information efficiently with very few reactions[131] These
reactions which feature in situ measurements are combined with mathematical
manipulations to construct graphical rate equations where kinetic information can
be identified This methodology comprises three different analyses for three sets
of experiments These experiments identify product inhibitioncatalyst
deactivation the order in the catalyst and the order in any of the other
components of the reaction
50
For a product inhibitioncatalyst deactivation probing study curves of
reaction rate vs substrate concentration are compared for reactions that are
started at different points - one with higher concentrations (reaction 1) and one
with lower (reaction 2) This means that although the initial starting material
concentrations are different both reactions at some point will have the same
concentration of all of the starting materials as the other reaction This is true as
long as both experiments have the same difference in the concentration of
reactants referred to as lsquosame excessrsquo experiments Consequently at these
points in the reaction where there are the same concentrations of starting
materials the reaction with the greater initial concentrations (reaction 1) will have
a greater concentration of product as well as a greater number of catalytic
turnovers This means that there are two sets of experimental data where the
reaction profiles should overlay to indicate the lack of product inhibition and
catalyst deactivation A case study where there was shown to be no indication of
inhibitiondeactivation is shown in Scheme 117 and Figure 111[132]
Scheme 117 A Heck coupling of an aryl bromide 140 with 141 to form the adduct 142
This case study showed no indication of product inhibition or catalyst deactivation
51
Figure 111 An overlay of two experimental datasets with the same lsquoexcessrsquo of reactant
concentration for the reaction shown in Scheme 117 This overlap indicates no product
inhibition or catalyst deactivation Reproduced with permission
If these curves donrsquot overlay it can be inferred that product inhibition or
catalyst deactivation is occurring An example of this is shown in Scheme 118
and Figure 112[133] To discern between these two possibilities a third
experiment is required where there is more product added This experiment
should feature the same initial concentrations as the experiment initiated at lower
concentrations (reaction 2) but the reaction should also feature the same
product concentration as generated by the other reaction until this point This
results in two reactions that are identical in stoichiometric composition but vary
in the number of turnovers completed by the catalyst Therefore overlay of these
two reaction profiles indicate product inhibition whilst no overlay indicates
catalyst deactivation
Scheme 118 The epoxide opening of 143 to form 144 using a catalytic system This case
study indicates some product inhibition or catalyst deactivation
52
Figure 112 As there is no overlay in the two experimental datasets with the same lsquoexcessrsquo of
reactant concentration in the reaction system shown in Scheme 118 this indicates
some product inhibition or catalyst deactivation A further experiment is necessary to
determine what is occurring Reproduced with permission
To then use RPKA to elucidate the order in catalyst the datasets of
different reactions run with different catalyst concentrations are plotted as
rate[cat]γ vs substrate concentration The value of γ is changed until all of the
curves overlay - this value is then the correct order in the catalyst Similarly for
determining the order in a given reactant ldquoBrdquo the datasets of lsquodifferent excessrsquo
reactions are obtained ie where all concentrations are constant apart from the
specific substrate of interest in this case reactant B The profiles are plotted as
rate[B]β vs [A] and the value of β is altered until the curves overlay This value
of β then indicates the correct order for reactant B A reported example of an
alkylation reaction shown in Scheme 119 was analysed in this manner to
determine the order with respect to Et2Zn 146 by performing lsquodifferent excessrsquo
experiments as shown in Figure 113a This data was then plotted using this
methodology in Figure 113b to confirm the reaction order of this species to be
1[131]
53
Scheme 119 A nickel-catalysed alkylation reaction of chalcone 145 with Et2Zn 146 to form
the adduct 147
Figure 113 Graphical rate equations for the alkylation reaction shown in Scheme 119 a)
Standard graphical rate equation b) Using the RPKA methodology to observe any
overlap in the lsquodifferent excessrsquo reaction curves This overlap indicates that the reaction
order of Et2Zn is 1 Reproduced with permission
Another form of visual kinetic analysis Variable Time Normalisation
Analysis (VTNA) has also been reported to determine this same information by
utilising exclusively concentration-time reaction profiles[134 135] This technique
may be preferential to RPKA as this data is typically more readily available from
54
the use of almost any reaction monitoring technique when compared to the data
handling necessary to extract rate information
To identify product inhibition or catalyst deactivation the reaction profiles
of two or more reactions are examined where the reactions have different
starting concentrations - these datasets are both plotted together The profile of
the reaction with the lower initial concentration of starting materials is then shifted
on the time axis until the first data point overlaps with the second (higher initial
concentrations of starting materials) reaction profile If there is an overlay of the
two concentration profiles at this point this suggests that there is no product
inhibition or catalyst deactivation present in the system This procedure is
highlighted in Figure 114[130] However a lack of overlay indicates that one of
these scenarios is present and a third experiment must be conducted to
determine the cause of this lack of overlay This third experiment must contain
added product in the same way as previously mentioned for the RPKA
methodology where an overlay of this new curve with existing data indicates
product inhibition and the converse outcome indicates catalyst deactivation
Figure 114 A time shift of the profiles of two reactions to observe overlaying plots This allows
the comparison of two profiles with the same starting material concentrations but
different product concentrations therefore identifying signs of product inhibition or
catalyst deactivation Reproduced with permission
To then elucidate the order in any of the species present two reactions or
more are run with different initial concentrations of this species S but with the
same initial concentrations of all other species The time scale of these reactions
are then replaced with Σ[S]γΔt - this expression is shown in eqn 134[136 137] A
plot of concentration of S vs Σ[S]γΔt is then graphed where the value of γ that
produces an overlay of the reaction profiles is the order in species S in a similar
55
manner to RPKA plotting methods This plotting method can be used for
identifying both the order in catalysts and reactants in a chemical system
Where
bull n = number of experiments
bull i = current experiment
bull γ = order of reaction
bull t = time of measurement
These visual kinetic analysis methods may be used in different
circumstances for the simple determination of reactantcatalyst orders as well
as to identify any occurrences of product inhibition or catalyst deactivation
Where reaction rate information is available RPKA may be used and where
concentration-time data is available VTNA can be used There are many
applications reported by academic and industrial research groups in a wide
range of catalytic reactions using both RPKA[138-140] and VTNA[141-143] Figure
115 shows a summary of the analysis of these techniques with the information
that each technique provides given the particular experimental protocol[130]
sum([119878]119894 + [119878]119894minus1
2)
120574
(119905119894 minus 119905119894minus1)
119899
119894=1
eqn 134
56
Figure 115 A summary of the use of RPKA and VTNA a) catalyst deactivation or product
inhibition b) catalyst order c) reagent order d) catalyst deactivation or product
inhibition e) catalyst order f) reagent order Reproduced with permission
123 Kinetic methodologies summary
Herein reported are several methodologies to determine kinetic
information all of which have become convention to varying degrees and
adopted by many experts and non-experts alike It is because of the large
adoption of these techniques that is why these particular methods have been
covered in this introduction although the usage of them within the context of this
project will be minimal There are many other more complex methodologies
peripheral to this project that although are very powerful in particular
circumstances are not widely adopted by research groups For this reason the
concepts of these methodologies are not introduced but for further reading there
are reports to be found on model-based design of experiments (mbDoE)[144-146]
hybrid modelling[147] and soft modelling[148-150] as well as other more niche
techniques that can be found in the literature[151-153]
These introduced methodologies are unlikely to be used in the context of
this project as many require qualitative assessments or data manipulation by a
user that is difficult to automate Furthermore the analysis of complex reaction
models may become more and more difficult with increasing model terms
meaning that precise kinetic parameters may also be more difficult to determine
These factors produce tough challenges in the context of the main aims of the
project (described further in Chapter 14) as the identification of kinetic models
and parameters cannot be scaled effectively or automated Therefore other
procedures are utilised in answering the challenge of creating a fully autonomous
kinetic model and parameter determination methodology which are introduced
in detail in Chapter 22
13 Optimisation
When searching for the optimum solution(s) to a particular optimisation
problem the best approach in gaining the most amount of information possible
would be to simply measure the response of the optimisation function at every
combination of input parameters at infinitesimally small variations This would
give a complete and perfect insight into the impact of the input parameters on
57
the response meaning that it would be easy for a user to even qualitatively
identify the optimum However as function evaluations can be expensive
(computationally and otherwise) performing this resource- and time-intensive
optimisation is not feasible[154 155] Approximations of this approach can be
performed in some circumstances by applying grid search methodology[156] but
for many applications the number of function evaluations necessary to explore
such a large number of parameter combinations means that this approach is not
viable Due to the fixed-space exploration of these approaches parameter
estimations may also be imprecise
For both efficient and accurate determination of optimum parameter inputs
for a given function it is often appropriate to use an optimisation algorithm These
algorithms heavily vary in their approaches to identifying optimised outputs but
a major criteria that they attempt to fulfil is to obtain this information in an efficient
manner - specifically saving computational time and memory The choice of
algorithm can then depend on the nature of the problem specifically the type of
optimisation (local or global) as well as the nature of the optimisation problem
An algorithm can still generally achieve optimality in many circumstances
however specific algorithms have been found to perform more efficiently in
different situations [157]
Many algorithms can be broadly described as either a local or a global
optimiser Local optimisers are fast can handle large-scale problems and are
widely applicable to many scenarios For this reason they are employed
extensively in a variety of circumstances However in local optimisation the
compromise is to accept that the identified optimum may only be locally optimal
which does not guarantee a result that is globally optimal ie a better function
evaluation than all other feasible points[158] These optimisers also require a
starting point which is a critical difference between local and global optimisers
as this can affect the objective value of the local solution that is found
In global optimisation by contrast the true global optimum of the system is
found The compromise however is often efficiency Global optimisation
algorithms are commonly used where the computational cost of the function
evaluations is not critical This is because the number of function evaluations is
traditionally very high which can also lead to very large computational times[158]
Therefore the choice to use a global optimisation algorithm may be made in
58
circumstances where the value of certifying the true global optimum outweighs
the computational cost to arrive at this identification Careful considerations must
therefore be made in selecting the optimal algorithm based on what is desired in
each scenario
The nature of the optimisation problem itself can also be a large factor in
the choice of algorithm used as some algorithms can identify optima more
efficiently based on the type of problem present[159] Some common optimisation
problems are highlighted in Figure 116 Specific classes of algorithms can then
be utilised in different scenarios Some classes of these algorithms include
linear programming (LP)[160] mixed integer linear programming (MILP)[161]
nonlinear programming (NLP)[162] convex programming (CP)[163] quadratic
programming (QP)[164] and more[158] These algorithm classes can then also be
further separated into discrete and continuous algorithms then further still in
many ways
59
Figure 116 Some different classes of optimisation problem where variable n is an input
variable and the function evaluation is a measure of how the function is minimised with
the changing variable a) Linear optimisation problem b) Convex optimisation problem
c) Non-linear optimisation problem
As it is beyond the scope of this project to compare and discuss classes of
optimisation algorithms classifications are made only on their localglobal
nature Commonly utilised local and global algorithms are qualitatively reported
with reference to further reading for mathematical proofs As this project also
involves heavy use of specific optimisation algorithms (in a black box manner)
those utilised are also introduced qualitatively
131 Local algorithms
Many local optimisation algorithms typically iterate towards an optimum
by using gradients in the response or approximating the local response surface
around the measurements One of the most intuitive and simplest form of
gradient-based algorithm is the steepest descent algorithm that iterates by
performing measurements along the trajectory of lsquosteepest-descentrsquo towards the
minimum[165] An example steepest-descent representation is shown in Figure
117 Shown are two variables on the x and y axes respectively X1 and X2 where
the blue contoured area represents a minimum in the response and the red area
represents a maximum in the response A steepest-descent algorithm initially
takes a guess of the inputs to measure the response The algorithm then runs
exploratory measurements in each direction from the initial guess and calculates
the change in the response for each direction The most favourable direction in
n-dimensional space is identified and measurements continue along this
trajectory towards the minimum until a decrease in the response is observed
The most favourable direction is then identified again until the measurements
can no longer observe a favourable change in the output This terminates the
algorithm as it has converged on a local minimum[166]
60
Figure 117 A representation of a steepest-descent algorithm minimising a 2-dimensional
contoured parameter space where о indicates a measurement Where red areas are
function maxima and blue areas are function minima
Another intuitive gradient-based optimisation algorithm is the simplex
algorithm[167] This method uses convex polyhedra formed of n + 1 vertices
(where n is the number of variables) - an individual polyhedron is referred to as
a simplex The algorithm begins by conducting either user-defined or random
measurements of the response function at particular inputs as shown in Figure
118 in 2-dimensional space where each vertex of the initial simplex represents
a function evaluation measurement The worst performing vertex is then
replaced upon each iteration of the algorithm via a reflection resulting in a new
simplex that explores a new area of parameter space This approach locates
areas with a more optimal response and hence successive simplex iteration
converge on a local optima at point
61
Figure 118 A representation of a simplex optimisation for a 2-dimensional contoured
parameter space where the numbered vertices of each polyhedron indicate a
measurement Where red areas are function maxima and blue areas are function
minima
As shown in Figure 118 the initial simplex comprising of the
measurements 1 - 3 is evaluated via the response function at each vertex The
worst vertex measurement 2 is then replaced via reflection to evaluate the
response function at measurement 4 Similarly measurement 3 is then replaced
by measurement 5 in a further simplex iteration The optimisation typically stops
when a better response function evaluation cannot be found indicating that a
local optimum has been identified - this is illustrated by measurement 11 Further
modifications have also been adapted from this methodology notably the
Nelder-Mead simplex algorithm[168] that allows further geometric transformations
as well as just reflections These transformations are highlighted in Figure 119
Because of the efficient and intuitive nature of these simplex algorithms
particularly the adapted Nelder-Mead variation their use in applications in the
literature are vast the original Nelder-Mead report has over 30000 citations
62
Figure 119 The different geometric transformations of the Nelder-Mead simplex inside
contraction (XIC) multiple contraction (MC) outside contraction (XOC) reflection (XR) and
expansion (XE)
Another notable form of local optimisation methodology is the interior-
point method The interior-point method is a class of algorithm that is very
effective at solving both nonlinear and convex problems by approximating local
regions around measurements as a lsquotrust regionrsquo[157] An initial trust region t0 is
identified around the starting point shown as x0 in Figure XY where the trust
region has an approximated objective function to minimise The gradient of the
trust region determines both how the region is approximated as either linear or
quadratic and also the steps necessary in minimising the approximated
objective function This optimisation is shown as a 1-dimensional minimisation in
Figure 120 where the x-axis is the magnitude of the variable and the y-axis is
the measure of the approximated objective function
63
Figure 120 A 1-dimensional optimisation using an interior-point method The approximate
objective function is minimised for the starting trust region t0
When this initial trust region objective function is minimised a new trust
region around this minimum is then approximated shown as t1 in Figure 121
This new approximated objective function is then also minimised The algorithm
continues to iterate via trust regions along what can be described holistically as
the lsquocentral pathrsquo towards the optimum for the true objective function where no
further improvements can be made This central path can be viewed as an
averaged direction based on the actual algorithm path taken In this example
the is objective function was minimised in the fourth trust region t3 finding the
optimum xbest More detailed algorithmic and mathematical discussions of this
optimisation technique can be found in some of the more relatively recent
reports[169 170]
Figure 121 A 1-dimensional optimisation using an interior-point method The approximate
objective function is minimised for the sequential trust regions until the overall function is
minimised The path that the algorithm can take can be described as the algorithm path
or the central path towards the optimum
132 Global
There is much variation in the methodologies applied by global
optimisation algorithms but one of the most common techniques relates to what
can broadly be described as a genetic algorithm[171] Genetics algorithms perform
computations to search for a global optimum utilising techniques inspired by
64
Darwinian evolutionary biology Although there are many forms of genetic
algorithms the methodology of a simple genetic algorithm (SGA) is qualitatively
introduced herein The six stages of SGA can be categorised as initialisation
evaluation selection crossover mutation and replacement After initialisation
the other stages of SGA are repeatedly iterated until the optimum has been
found which leads to termination of the algorithm The optimum is typically
assumed to be found if the evaluation stage does not produce a better function
evaluation (fitness value) for the given objective function (fitness function)[158]
The workflow of the algorithm is depicted in Figure 122
Figure 122 A depiction of the flow of a simple genetic algorithm
The selection stage aims to find the best parents from the current
population to generate the next population where a population is a collection of
all of the sets of inputs for the given variables and a parent is one potential set
of inputs from this population The parents are often selected simply based on
their fitness value In the crossover stage each individual variable input value
(chromosome) from each parent has a probability of 05 to exist in the resulting
children set Each of the children in the following population then have another
given probability of a random chromosome mutating in the mutation stage This
stage prevents a genetic algorithm from becoming stuck in a local minima After
this cycle has occurred this represents one iteration of the algorithm which then
successively occurs until the optimum has been reached This SGA methodology
is highlighted in the adapted simple example shown in Figure 123 whereby a
fitness function (the sum of all inputs) is maximised by the input of integer
chromosomes[158] The ability of genetic algorithms to obtain an optimised result
65
for a given function is very desirable even with a very large number of input
variables Despite the high computational expenditure to this methodology
requires itrsquos reliability has resulted in high adoption in the general literature for
many applications
Figure 123 A depiction of one iteration of a simple genetic algorithm Figure adapted from
works reported by Boyd amp Vandenberghe[158]
Bayesian optimisation is another category of global optimisation methods
that generally proceed in a more efficient manner than genetic algorithms by
utilising approximated (surrogate) models to optimise expensive-to-evaluate
objective functions[166] Random evaluated data points are initially conducted
then a surrogate model is built to fit these data points as well as a corresponding
acquisition function Bayesian optimisation methods obtain their efficiency from
their use of these acquisition functions which balance exploration of the
parameter space and exploitation of already known high-performing regions of
parameter space[172] This acquisition function is maximised after each iteration
of the algorithm to determine the optimum measurement point to evaluate next
in order to explore parameter space but also attempt to gain a better evaluation
Iterations of a Bayesian optimisation for the minimisation of an arbitrary
function f(x) with respect to the 1-dimensional optimisation of variable x is
shown in Figure 124[166] Two initial measurements are inputted shown as red
dots in the first iteration (i) The surrogate model is fitted in blue where the blue
area indicates the uncertainty in the model The acquisition function is shown in
red with a vertical red line indicating the next parameter measurement to be
evaluated - this evaluation is shown specifically in (i) as another red dot From
the second iteration (ii) there is now enough data to fit 95 confidence intervals
to the surrogate model indicating the regions of highest uncertainty The
66
maximum of the acquisition function again determines the next parameter
measurement As aforementioned this parameter measurement is made based
on the compromise of exploring known regions of high performance and regions
where these confidence intervals are the largest As further measurements are
made in the iterations thereafter (iii) - (viii) the confidence intervals shrink
around areas richer with measurements and the surrogate model gains
confidence in its predictions Therefore as the algorithm gains confidence in the
model this means that the algorithm also gains confidence that it has achieved
the global optimum for the particular function
67
Figure 124 The Bayesian optimisation of f(x) where (i) - (viii) represent the sequential
iterations of the minimisation The acquisition function is shown in red measurements
are shown as red dots and the current estimated surrogate model is shown in blue with
its corresponding 95 confidence interval The maximum of the acquisition function
indicates the next measurement to be taken
Integer linear programming (ILP) is a class of methodologies that are
concerned with variables that can only take the form of integers and although is
not classically a type of global optimisation algorithm is still a mathematical
optimisation that is useful in specific cases and is utilised in this project An ILP
problem is in general very difficult to solve and many solvers have attempted to
simplify the procedure by utilising a much simpler linear programming (LP)
approach then rounding down the values to the nearest integer - this is known
as LP relaxation but may not always be effective in identifying the optimum
solution so other techniques must be used[158] In ILP optimisations it is also
common to have multiple linear constraints which define a feasible region that
the optimum can be found
Although ILP algorithms may proceed using different methodologies the
most intuitive introduction would be a 2-dimensional problem with a graphical
method The function to be maximised f shown as eqn 135 is bound by 4
linear constraints C1 - 4 shown as eqn 136 - 139
As the problem consists of two variables x and y it can be illustrated by a 2-
dimensional graphical plane where each linear constraint is a straight line
forming a closed feasible region - this is indicated in Figure 125[158] Therefore
all feasible solutions to this problem must be an integer in x and y within the
bounds of this feasible region The objective function f is represented as a
straight line with given inputs of x and y that indicates its current position This
function however can be viewed as a dynamic line that moves in parallel with
respect to different values of x and y Therefore in order to obtain the maximum
feasible evaluation of f the line is moved from its current location in the figure
119891 = 12119909 + 7119910 eqn 135
1198621 = 2119909 minus 3119910 le 6 eqn 136
1198622 = 7119909 + 4119910 le 28 eqn 137
1198623 = minus119909 + 119910 le 2 eqn 138
1198624 = minus2119909 minus 119910 le 2 eqn 139
68
until it intersects with the allowed two integer-valued inputs within the feasible
region for the first time All integer-valued input combinations within the feasible
region are marked with a red dot where the first intersecting point would be either
point 1 (23) or point 2 (31) indicated as P1 and P2 respectively These points
can be evaluated mathematically by the objective function to determinine the true
maximum where P1 = 43 and P2 = 45 Although this specific example is 2-
dimensional and this intuitive graphical method cannot be easily performed in 3-
dimensions and is impossible in further dimensions many computational ILP
algorithms proceed using this generalised concept to identify optimum inputs for
a given function
Figure 125 A graphical method to solving ILP problems where C1 - 4 indicate the linear
constraints the green area indicates the feasible region f shows the objective function
red dots represent the integer values of the inputs and P1 and P2 indicate two feasible
potential maxima to the problem Figure adapted from works reported by Boyd amp
Vandenberghe[158]
133 Optimisation summary
There are many methodologies that optimisation algorithms utilise
meaning that there are several classes of algorithm that are available and then
69
multiple subclasses thereafter There are specific cases where a particular
algorithm class is necessary to solve a problem but also cases where many
algorithms may be suitable it is then necessary to decide which algorithm to use
in this instance based on other factors such as computational efficiency In this
project these decisions will be explored as optimisation algorithms must be used
in multiple unique scenarios This is because other methodologies such as grid
search are too inefficient and imprecise especially as many input variables (for
example kinetic parameters to be optimised) must be determined in an
appropriate length of time and with high precision
14 Research aim
The aim of this project is to develop and advance an automated methodology
to kinetic model and parameter determination The basis of this project arises
from a methodology reported by Tsu et al[173] that provides a framework to a
technique that achieves this by evaluating all possible reaction models This
reported framework however has limited simulated examples and no real
experimental examples that prove its efficiency This methodology can represent
a positive change in the laboratory where physical-organic chemists can make
use of their human resource on other tasks instead of determining a reaction
model and kinetic parameters which can be assigned to a computer This is the
advantage to exploring this automated methodology that this project is
predicated on which leads the specific project goals herein described
bull To build this automated computational approach to kinetic model and
parameter determination based on the framework aforementioned as
well as to test the effectiveness of the approach in simulatedliterature
case studies (Chapter 2)
bull To prove the effectiveness of the approach in real experimental case
studies This approach will be coupled with automated kinetic profile
generation by flow rate manipulation in a continuous flow chemistry
experimental setup (Chapter 3)
Although methodology described is very powerful for many chemical
scenarios there are also instances where this technique does not work
Specifically this approach is not designed for applications where the reaction
70
order can be a non-integer or where particular species may be catalytic in
nature Therefore further specific project goals are described
bull To further develop this automated approach to kinetic model and
parameter determination to include chemistries that may proceed via a
catalytic route or have non-integer orders with respect to one or more
species in the reaction model The effectiveness of this new approach
must also be proven in a simulatedliterature case study(s) (Chapter 4)
bull To prove the effectiveness of this new approach in real experimental case
studies to achieve kinetic information (Chapter 5)
This project will ultimately lead to a tool that any chemist can utilise by
plugging time-series data and chemical species into the automated approach
then observing the output in the form of the most likely kinetic model and
associated parameters Without kinetic expertise any chemist will be able to use
this approach and interpret the output in order to obtain scalable process
understanding
Chapter 2 Development of the computational approach to
kinetic model determination
21 Introduction
A chemical system can be seen as a cascading dynamic reaction
scheme where molecules can orientate themselves in a particular way and with
a particular energy to allow a reaction to occur This reaction of course will follow
a particular reaction mechanism These mechanisms can give a deep
understanding of the underlying chemistry that we merely observe as a
transformation and can give real-world benefits as it then becomes clearer and
easier to control and understand chemical reactivity[174 175]
For the development of a chemical process however one of the greater
concerns is to mathematically characterise the transformation from the starting
materials to products - this can be complex and occur over many reaction steps
and involve many measurable and immeasurable intermediates This allows
quantitative information to be gained regarding the chemical synthesis allowing
71
for classical reaction engineering principles to be applied to shorten process
development times and lower costs[173] Therefore the objective is to develop
stoichiometric and kinetic descriptions of the individual transformations rather
than detailed mechanistic insights and rationales[176] Where stoichiometry refers
to the stoichiometric coefficient of a particular species in a reaction and kinetic
descriptions refer to the kinetic parameters involved in the rate equations for a
process For a system with multiple reactions this is referred to as a chemical
reaction network (CRN)
The basis for many stoichiometric and kinetic modelling studies with the
specific aim of CRN determination is the data-driven work reported by Aris and
Mah[177] This work is an early example of using computation to evaluate aspects
of a CRN specifically how many independent reactions can be shown to account
for changes in experimental data providing that all chemical species are
measured Bonvin and Rippin[178] later reported tar
get factor analysis (TFA) which was shown to derive approximate stoichiometric
models for complex systems as well as to test user-inputted stoichiometries for
their suitability to experimental (simulated) data TFA has been used and
advanced to verify proposed reaction stoichiometry in a select few reported
works[179 180]
TFA was then used as the basis for further work reported by Brendel et
al[181] and Bhatt et al[182] whereby an incremental identification method was
proposed This is a step-wise method where the stoichiometry is initially verified
using TFA then other model identification strategies are utilised to identify the
structure and parameters of the rate laws within the ODE models However TFA
initially requires a CRN to be at least postulated by a user before it can be used
This requires a high degree of chemical intuition but may also be incorrect as
there are many possible forms in which the CRN can exist especially when
dealing with a system with a large number of chemical species
An alternative step-wise method was also reported by Burnham et al[183]
in which a global ODE model structure was generated which is capable of
representing an entire set of possible chemical reactions As this global ODE
model structure represents an over-trained model model terms are sequentially
removed using statistical measures until all insignificant terms are removed
72
giving the final CRN As this features several optimisations of models with many
kinetic parameters in order to identify insignificant terms this optimisation can be
very slow and also suffer from local optima This is also the case with the
determination of insignificant terms as the identified optimum model itself may
be non-global
Willis and von Stosch[176] then reported the use of mixed integer linear
programming (MILP) to determine the model structure as well as its associated
kinetic parameters This was because previously reported step-wise
identification approaches fail to consistently predict the underlying network
structure[184-186] In this work a global CRN structure was reported but MILP was
used to dismiss all non-mass-balancing reactions from the structure
Decomposition of the global structure then occurs by statistical means and
although the global structure is now much smaller in this work termination at
local optima may still be an issue
Tsu et al[173] then reported an improvement upon this method where ILP
initially identifies all mass-balancing reactions then builds every possible
reaction model It is this approach that will be focussed on in this chapter and
further description and discussion is provided in Chapter 22 Every model is then
fitted and statistically evaluated which avoids the potential pitfall of local optima
when determining the correct model However this can be computationally
demanding as there are many more models to evaluate than in any previously
reported work
Other works in the literature include more algorithmic approaches to CRN
identification Differential evolution[187] genetic programming[188] and multi-
objective genetic algorithms[189] have all been used as global optimisers to
attempt to determine the CRN These specific global optimisers which focus on
mimicking real-life Darwinian evolution are attractive as the CRN is identified
with minimal human interaction or expertise However this optimisation method
can still encounter problems due to local optima and take a very long time to
compute due to the number of iterations necessary for convergence upon the
optimum
The main assumption that is universal among these approaches to CRN
determination is that all reaction kinetics follow the law of mass action This
73
states that the rate of reaction of an elementary reaction is directly proportional
to the product of the concentrations of the reactants raised to the power of their
stoichiometric coefficients[190] For the reaction shown in eqn 1 based on the
law of mass action the reaction rate can be described by eqn 2 and therefore
eqn 3 The kinetic rate constant k therefore determines the speed of the
reaction as well as the reactant concentrations
Where
bull α β γ = stoichiometric coefficients
bull x1-3 = chemical species
bull k = kinetic rate constant
bull rate = rate of reaction
The law of mass action is applicable in most cases however there are
particular cases where it is not accurate to describe a process using mass action
kinetics where these approaches are not applicable Such processes typically
occur when concentrations of particular substrates are very low[191]
22 Development of the approach
The computational approach was developed using MATLAB by loosely
following the approach outlined by Tsu et al[173] The approach contains two main
sequential stages kinetic model generation and kinetic model fitting Firstly all
mass-balance-allowed reactions are identified from the inputted species (starting
materials intermediates and products) Then all of the feasible reaction models
ie all possible combinations of these allowed reactions are compiled and stored
in a model database
After the model database has been generated for the particular process
the kinetic model fitting stage then evaluates the fit of the ordinary differential
equations (ODEs) for that particular model to the experimental data provided
The MATLAB ODE solvers can be used to in such a way to allow an assessment
1205721199091 + 1205731199092119896rarr 1205741199093 eqn 21
119903119886119905119890 prop [1199091]120572[1199092]
120573 eqn 22
119903119886119905119890 = 119896[1199091]120572[1199092]
120573 eqn 23
74
of how the concentration of a species changes over time when given particular k
values Therefore optimising the k values for a given reaction model by
maximising the convergence of the ODEs with the experimental data provides
an indirect route to their identification The convergence metric which is the sum
of squared error (SSE) between the simulated ODEs and the data as well as the
k values for each model are then stored
Statistical analysis is then applied to each of the models Corrected
Akaikersquos Information Criterion (AICC) is used as a measure to identify the models
that best balance model simplicity and convergence to the data and hence
identify the most valid models When these models have been identified it is
then possible to run Monte Carlo simulations if the error of the experimental data
is known These simulations assume that the error is normally distributed around
the data point and compile both the error in experimental data and error in the
kinetic fitting of the ODE to obtain an uncertainty prediction in the identified k
values for the process
221 Kinetic model generation
In order to generate the kinetic models for evaluation the first step is to
input all of the known species of a chemical process into the system The species
can be identified by any means typically by experimentation where all starting
materials intermediates and products are identified These species are inputted
based on their respective number of differing atoms ie number of carbon
atoms number of oxygen atoms etc which is known as a Mass Matrix (MM)
For example if you take the known reaction model of A + B C + D
shown in Scheme 21 you could visualise initially inputting these four species
into a mass matrix shown in Figure 21
75
Scheme 21 An example esterification reaction
Figure 21 The Mass Matrix inputted into the approach assigning mass to each of the
species
It is also possible to describe the reactions (forward and backward) shown
in Scheme 21 in terms of the stoichiometry of reactants used (SR) and the
products formed (SP) as a set of matrices in Figure 22 When describing these
matrices a 0 represents that the species does not participate a 1 represents
that the species does participate with a kinetic order of 1 and 2 represents that
the species participates with a reaction order of 2 For example in the forward
reaction both species A and B participate as a reactant with reaction order 1
meaning that they are represented by lsquo1rsquo whereas C and D do not participate as
reactants so are represented by lsquo0rsquo These stoichiometric matrices are then
combined to form an overall stoichiometry S where S = SP - SR This overall
stoichiometry for an unknown model would otherwise be identified using an
Integer Linear Programming (ILP) optimisation and is necessary to identify all
feasible mass-balanced reactions
76
Figure 22 The stoichiometric matrices for the reaction model shown in Scheme 21 as well
as the overall stoichiometry matrix S
The ILP optimisation proceeds by finding every feasible stoichiometry that
satisfies the objective function of MMmiddotS = 0 where S is the transposed vector of
a single reaction with values for each of the species present Therefore as there
are four species in the esterification process shown in Scheme 21 the ILP
optimisation will proceed using the known Mass Matrix to identify the values of
X1-4 that satisfy the objective function shown in Figure 23 The optimised
solution is then the resulting stoichiometric vector which relates to a particular
feasible reaction The upper bound for the number of reactants in a stoichiometric
vector is 2 as it is very rare to encounter third order reactions as a single reaction
step When an optimised solution is found the solution is saved then successive
constraints are added to the ILP optimisation to guarantee that the same
combination of binary variables (and hence stoichiometry) are not obtained when
the optimisation problem is solved again The optimisation then ceases when
there are no more solutions to be found and hence all feasible mass-balance-
allowed transformations are identified
Figure 23 The ILP optimisation identifying a feasible solution to the objective function hence
identifying a mass-balance-allowed reaction Where X1 = A X2 = B X3 = C X4 = D
After all feasible reactions are identified these standalone reactions are
themselves potential models There are also other possibilites for reaction
models where there are any combinations of two of the possible reactions or
any combinations of three of the reactions etc The total number of possible
models (η) is equal to the sum of the binomial coefficients (or all combinations)
77
for every number of reactions in the model up to the total number of possible
identified reactions (δ) - this is shown in eqn 24 All of these combinations are
then generated and saved to a model database which will be accessed in the
next stage of the approach For example if the ILP optimisation identifies 5
possible reactions (δ = 5) the summation of all combinations gives η equal to
31 This example can be shown in a model representation in Figure 24 where
this could be any appropriate reaction where SM = starting material Int1 =
intermediate 1 Int2 = intermediate 2 P = product and Imp = impurity It should
also be noted that as all of these forward reactions are mass-balanced all
backward reactions would also be plausible but are omitted from the
representation for concisiveness
Where
bull η = total number of models
bull δ = number of possible reactions
bull i = iterative number of reactions considered for the model
120578 = sum 120575
119894 (120575 minus 119894)
120575
119894=123hellip120575
eqn 24
78
Figure 24 A visual representation of all of the possible reaction models when given five mass-
balance-allowed sample reactions each shown as a different coloured block When i = 1
each reaction is in itself a model and when i gt 1 each reaction behaves as a model
fragment These fragments when combined in different ways provide full and unique
reaction models each of which are to be assessed for their validity with respect to
experimental data
After every possible model has been saved into the model database each
of these models are then automatically transformed into their respective ODEs
which is a form that can be readily used in the kinetic model fitting stage of the
approach The individual stoichiometric reactions that make up each model are
compiled into a set of differential equations for each model where each of the
participating species have their own differential equation to show how their
concentration changes over time Figure 25 summarises the model generation
section of the approach by using the esterification reaction as an example This
shows how the initial input of the species is first used to identify the feasible
mass-balance-allowed reactions then how these reactions can be ordered into
every possible reaction model then subsequently how these models are
transformed into sets of differential equations for use in the kinetic model fitting
stage of the approach
79
Figure 25 A schematic summarising how the model generation stage of the approach
progresses Where the participating species are inputted and sorted ODE functions that
describe all possible mass-balance-allowed reactions are outputted
222 Kinetic model fitting
After the model generation stage of the approach is completed and there
is a sorted database with all possible models compiled with their respective ODE
functions the next stage of the approach can begin kinetic model fitting This
80
stage proceeds by sequentially loading individual models from the database
then attempting to optimise the kinetic constants for each of the reactions within
the model These optimisations progress based on the simulated ODE resultsrsquo
convergence with experimental data where more suitable models exhibit a
favourable change in ODE convergence based on the kinetic constants provided
by the optimiser Where models do not accurately describe the chemistry taking
place in the experimental dataset the optimiser typically ceases very quickly as
there is no way to incur a favourable change in the ODE results as it iterates
After the fitting of a particular model is complete the kinetic constants (optimised
results) as well as the minimised error metric of the ODE convergence (sum of
squared error or SSE) are assigned to the model and saved for statistical
analysis
2221 The objective function
When a model is initially selected for kinetic fitting the objective is to use
an optimisation algorithm to minimise the SSE between the simulated ODE
results and the experimental results This is shown in Figure 26 with a set of
time-series data showing a first-order decrease in the concentration of A The
first iteration of the algorithm is shown where a guess of k = 04 is applied to the
ODE solver The lsquodifferencersquo between the experimental result of data point Ex
and the simulated ODE of data point Sx is shown as Dx This value is squared
to make the value positive and summed with all other differences to give one
SSE value this is shown mathematically in eqn 25
119878119878119864 = sum (119864119909 minus 119878119909)2
119909=123hellip
eqn 25
Where
bull SSE = sum of squared error
bull Ex = experimental data point
bull Sx = simulated ODE data point
As the algorithm iterates the aim is to decrease the SSE output by varying
the input k values In this example optimisation shown in Figure 26 the optimiser
(and hence SSE) reaches a minimum at iteration 11 as the ODE converges very
well with the experimental data This method serves as an indirect route to
81
identifying kinetic constants as in this case the k values are the optimised inputs
for the optimisation algorithm
Figure 26 The iterations of an optimisation algorithm with respect to the convergence of
simulated ODEs with sample data - this occurs via the minimisation of the SSE output
For each iteration of the algorithm the inputted k values are used
alongside the ODE equations for the current model The ODE solver simulates
how each of the specified initial speciesrsquo concentrations change over time given
82
the reaction rate calculated from the k values the species concentration at that
moment and the reaction model The ODE solver used for this approach is the
MATLAB solver lsquoode15srsquo This is a stiff ODE solver meaning that it can be used
to solve lsquostiffrsquo ODEs An ODE is stiff when the integration must be completed in
unreasonably small increments by typical solvers that could require millions of
evaluations leading to a solver failure As there are many reaction models that
are to be evaluated it isnrsquot clear which ODEs would present themselves as stiff
problems Therefore ode15s was used which can approach curve solutions for
both stiff and non-stiff ODEs as opposed to a non-stiff solver which would be
able to solve non-stiff ODEs faster but fail when stiff ODEs were to be evaluated
Depending on the nature of the experimental data different inputs for the
optimisation algorithm may also be used If there is only one data set or all data
sets are at the same temperature then k values can be optimised If there are
multiple data sets at different temperatures however it is often better to optimise
directly for the activation energy and reference k value This is because there are
fewer variables for the algorithm to optimise meaning there is a greater chance
of convergence on a global optimum and not a local one this is discussed further
in Chapter 2222
The reference k value is at a particular reference temperature typically
the midpoint of the temperatures explored experimentally This is to ensure that
there are no weightings in the fittings of parameters towards the extremes of the
temperatures explored This reference k value and activation energy value for
each of the transformations are optimised as these inputs generate the k values
for each transformation using the re-parameterised Arrhenius equation shown
as eqn 26 where the general Arrhenius equation is shown as eqn 27
119896 = 119896119903119890119891119890[minus119864119886119877(1119879minus1119879119903119890119891
)] eqn 26
119896 = 119860 119890minus119864119886119877119879 eqn 27
Where
bull k = rate constant
bull kref = reference rate constant at a particular temperature
bull Ea = activation energy kJ mol-1
bull A = pre-exponential factor
83
bull T = temperature of reaction K
bull Tref = reference temperature for the reference rate constant K
bull R = ideal gas constant J mol-1 K-1
The re-parameterised Arrhenius equation is used for kinetic fitting as there
is only one optimum for the reference k and activation energy values regardless
of the kinetic model This means that the output of the algorithm can be assumed
to be at a discrete optimised point This is not the case if optimising for set of
values for a pre-exponential factor and activation energy due to the high
correlation between these values[192 193] This means that there are several sets
of values that can all combine to obtain the same rate constant which can be
avoided when using the re-parameterised equation to fit kinetic parameters to
data sets that include multiple temperatures
The final consideration when compiling the objective function is the
method of measuring the convergence of the simulated ODEs to the
experimental data For all simulated and experimental case studies herein
reported the SSE metric has provided good convergence to time-series data for
all species This could present a problem however in cases where particular
species occur in only small quantities and SSE does not provide a good fit to the
data This is because the SSE metric reduces the overall error hence giving a
biased fit to species that are present in larger concentrations This could be
prevented by using a different error metric - such as a weighted sum of squared
error (WSE) or a relative sum of squared error (RSE) Both of these error metrics
serve to normalise the errors in convergence between species present in higher
and lower concentrations and can be used in this approach if the experimental
data suggests that it would be appropriate
2222 The optimisation algorithm
When fitting kinetics using this approach the algorithm used to minimise
the error metric described in Chapter 2221 and hence maximise the
convergence of the simulated ODE with experimental data is the MATLAB
function fmincon fmincon utilises an interior point algorithm which is described
in detail in Chapter 131 This function has been reported extensively in the
literature for the nonlinear optimisation of dynamic models including
considerable uses in the fitting of kinetic parameters to reaction models[194-196]
84
fmincon is a local optimisation tool that leads to fast and accurate
convergence on local optima As the given error metric SSE reports a value
based on the residuals that is correlated to the magnitude of the concentrations
involved it is not clear based on this value whether true convergence has
occurred However due to the nature of the problem it is simple to plot the
experimental data and simulated ODE after kinetic fitting to visually confirm that
convergence has occurred Based on the convergence to the experimental data
it can then be assumed that the optimum found is the global optimum for that
model If non-convergence occurs then it is either because the given model does
not accurately represent the chemistry in the system or the algorithm became
trapped in a local optimum The likelihood of these scenarios depends on the
non-linearity of the data and the number of variables to be optimised
Generally speaking in these scenarios it is assumed that when non-
convergence occurs it is because the model does not accurately represent the
chemistry This is because of two reasons The first is that most kinetic data does
not feature sharp inflexions or cliff-edges in which concentration-time data
deviates from an otherwise smoothed curvature It is this curvature in the data
that makes local solvers such as fmincon very effective at identifying kinetic
parameters as large aspects of their methodologies involve gradient-based
calculations Therefore the path that the optimiser takes towards the optimum
typically iteratively improves as the optimiser progresses and with a smoothed
parameter space this means that the iterative improvement is unlikely to reach a
local optimum The second reason is that when fitting kinetics typically the
number of variables to be optimised is low as many models feature chemistry
that has fewer than 10 model terms This means that it is unlikely that fmincon
will encounter local optima when optimising and will only find the globally
optimum solution
There is not a discrete reported number of variables to be optimised that
means that fmincon will start to encounter local optima issues Kinetic studies
are reported routinely where ~15 or more parameters are optimised using
fmincon both isothermally and across different temperatures without issues[197
198] However it cannot be assumed a priori with certainty that these issues will
not occur Therefore in cases where there are more than 10 model terms to be
optimised a form of global optimisation called multi-start fmincon (ms-fmincon)
85
will be used This methodology employs fmincon but with multiple starting points
from which the optimisation starts Using ms-fmincon with 5 randomised starting
points means that from those 5 optimisations the global optimum is very likely
to be found when more than 10 parameters are to be optimised This approach
utilises ms-fmincon because it has been proven to be effective in optimising even
large scale systems A recent example of this was reported where 383
parameters were optimised accurately for a large kinetic model[199]
223 Statistical analysis
After the kinetic parameters are optimised for each model and the error
metric (SSE) recorded statistical analysis can then be performed to determine
the most likely model that describes the experimental data Akaikersquos Information
Criterion (AIC) eqn 28 provides a relative evaluation of a model for a particular
set of data[200]
119860119868119862 = 119899 ln (119878119878119864
119899) + 2119896 eqn 28
Where
bull AIC = Akaikersquos Information Criterion
bull n = number of observations
bull SSE = sum of squared error
bull k = number of model terms
This calculation provides a relative evaluation of balancing the goodness-
of-fit of the model to the experimental data with having as few model terms as
possible where a minimised value is optimal Therefore models are more
favourable if they only contain terms that have a significant effect on the fit to the
data inputted This means that the optimum model that AIC selects is less likely
to be over-trained as all model terms contribute a significant amount towards
the fit of the data
In the context of this approach an AIC evaluation can inform the
experimenter which reaction model is the most likely to be correct in relation to
other models considered This model should only contain reactions that
significantly contribute towards the convergence of the simulated ODEs with
experimental data points As AIC assumes that the amount of data is sufficiently
large in relation to the number of model parameters it is also beneficial for the
86
purposes of this approach to use a corrected AIC value to compensate for the
reduced sample sizes
The Corrected Akaikersquos Information Criterion (AICC) eqn 29 both
converges to AIC for large sample sizes but gives a more accurate answer for
smaller sample sizes as a greater weighting is placed on the number of model
terms[201] Reported data suggests that an uncorrected AIC value is appropriate
only when the ratio of nk is greater than 40 otherwise an AICC evaluation should
be used[202] However as the model penalisation aspect of AICC is favourable to
differentiate models with similar SSE values and many of the lsquoobservationsrsquo in
the context of a kinetic profile can be highly correlated if the ratio of nk is less
than 40 then the number of observations should be the number of individual
experiments rather than individual data points This is also true where several
experiments are used in fitting to contribute towards one SSE value where each
experiment has a vastly different number of measurements within them
119860119868119862119862 = 119860119868119862 + 2119896(119896 + 1)
119899 minus 119896 minus 2+ 119899 ∙ ln(2120587) + 119899
eqn 29
Where
bull AIC = Akaikersquos Information Criterion
bull AICC = Corrected Akaikersquos Information Criterion
bull n = number of observations
bull k = number of model terms
224 Other considerations
There may be some instances where there are intermediates or products
formed that cannot be identified This occurrence can be chemistry-dependant
but it is common that the quantitative analysis of a process can show total mass
balance losses as a reaction progresses This can indicate that either the species
calibrations are inaccurate or there is a real loss of massconcentration that is
unaccounted for If calibrations are correct with certainty and there is still a loss
of mass that is unaccounted for it can also be beneficial to input an additional
species into the system This will force the approach to identify a new pathway
to an unknown species which can be assigned the total mass loss of the process
as the time-series data progresses Due to the nature of the AICC evaluation it
can then be determined statistically if this loss of mass contributes significantly
87
enough towards the fitting of the data to suggest that there is a chemical pathway
occurring that is not described by the userrsquos inputted species This pathway will
be a grouped reaction description with an observed rate constant kobs This is
because if another pathway is shown to occur then it is not possible to know
how many routes that mass is lost by Chemical considerations must then be
undertaken to identify missing species and the approach must be re-run
When running the approach the model generation aspect is very fast
whilst the kinetic fitting stage is significantly slower due to the many optimisations
that must be conducted The kinetic fitting stage is considerably accelerated by
utilising parallel computing This means that each optimisation operation is
conducted on a single computer core meaning that separate tasks can be sent
to separate cores within the computer This means that optimisations are
conducted in parallel as the process speed scales directly with the amount of
computer cores available The time taken for each optimisation is heavily
dependent on the model it is fitting and the number of ODE evaluations to be
conducted A typical range for a single optimisation can take from 10 - 120
seconds on a standard Intel i5-2310 processor however many optimisations
take less than 1 second if the model does not describe the experimental data
accurately
225 Overview
This computational approach to kinetic model selection and parameter
identification was developed in MATLAB by loosely following the methodology
reported by Tsu et al[173] The approach first identifies all possible reactions that
can happen based on mass balance alone from the species inputted by the user
All plausible models are then compiled by taking every combination of these
reactions and sequentially optimising the kinetic parameters for each of these
models Each model is then statistically evaluated and ranked highlighting the
most likely model based on the experimental data supplied The approach outline
is summarised in Figure 27
88
Figure 27 An outline of the stages of the computational approach
This method serves as a comprehensive model evaluator where chemical
intuition is removed thereby removing a chemistrsquos bias and considering a
number of possible models that may otherwise not have been considered It is
however not the role of this approach to remove all necessity for a physical-
organic chemist to supervise the discovery of a kinetic model This approach is
to be used as a complementary tool whereby all models are evaluated without
human effort or interaction but final considerations are still made by the chemist
when the ranked model list is generated This is because there may be reactions
present in the most likely model that describe chemistry that is unlikely or unable
to occur but still give a good fit to the experimental data It may also be possible
that many models give very similar AICC evaluations so many models may be
competing
The benefits to this tool are clear All models are generated based on
logical transformations of the species inputted and every possibility is
comprehensively evaluated without the need for a chemistrsquos or statisticianrsquos most
important resource time Typically a chemist would evaluate a select few models
based on chemical intuition and remove certain chemical possibilities a priori
then further refine the model until it is satisfactory When all possibilities are
considered by an approach that automatically evaluates them this allows the
chemist to work on other projects including more important aspects of laboratory
work or theory that cannot be assigned to a machine However although
89
powerful this tool ultimately is data-driven and must be used in conjunction with
real chemical intuition by an end user to determine that the models identified as
most likely are accurate and consistent with the science
23 Simulated verification of the approach
Before any real experimentation takes place it is important to first verify
that the approach works as a means of identifying the correct reaction model and
kinetic parameters Therefore several simulated case studies were conducted
with varying goals to show the adaptability of the approach to different
circumstances These simulated case studies feature reactions from the
literature where the model and kinetic parameters are already identified
Simulated experimental data is generated from this information and used as the
basis for verifying the approach
To simulate the data first the true model and kinetic parameters reported
in a given literature source are inputted into MATLAB The experiment is then
simulated at a particular temperature and set of initial concentrations by using
an ODE solver to evaluate the change in species concentrations over a given
experimental timeframe Individual data points from this timeframe are then
extracted which serve as the experimental data points for the particular
simulated case study To then make the case study more robust up to 5
relative error in each measurement is added to approximate this simulated data
more closely to real experimental data This generation of simulated data is
summarised in Figure 28
90
Figure 28 An example showing the generation of a simulated data set from the literature a)
An ODE is simulated for a particular model with a set of kinetic parameters in this case A
rarr B where mdash = A mdash = B b) Particular time points are taken from this ODE to
represent individual measurements where x = A x = B c) Up to 5 relative random
error is added to these measurements to more closely resemble real experimental data
231 Case study Benzoic acid alkylation
The first simulated case study was a very basic system where there are
only three species to be considered[203] The reaction system was benzoic acid
21 reacting with iodomethane 22 in the presence of the base 18-bis-
(tetramethylguanidino)naphthalene (TMGN) to form the methyl benzoate
product 23 and hydroiodic acid 24 This reaction is shown in Scheme 22
TMGN was present at one equivalent with respect to benzoic acid and was
assumed to deprotonate the benzoic acid so that all of the starting material is in
the carboxylate form There were no rates reported by the authors for this
deprotonation but they indicated that modelling this system as a simple second
order reaction under these conditions yielded accurate results
91
Scheme 22 The reaction of benzoic acid with iodomethane to form methyl benzoate
Modelled as a second order reaction
2311 Data acquisition
The second order reaction model reported by Gholamipour-Shirazi[203]
was used to generate the ODEs shown in eqn 210 - 213 Three isothermal
simulated data sets were generated using these ODEs with the k value of 057
M-1 s-1 with the following initial concentrations
bull 01 M benzoic acid 21 008 M iodomethane 22 0 M methyl benzoate
23 0 M hydroiodic acid 24
bull 01 M benzoic acid 21 011 M iodomethane 22 0 M methyl benzoate
23 0 M hydroiodic acid 24
bull 01 M benzoic acid 21 015 M iodomethane 22 0 M methyl benzoate
23 0 M hydroiodic acid 24
119889[120784 120783]
119889119905= minus119896 [120784 120783][120784 120784] eqn 210
119889[120784 120784]
119889119905= minus119896 [120784 120783][120784 120784] eqn 211
119889[120784 120785]
119889119905= 119896 [120784 120783][120784 120784] eqn 212
119889[120784 120786]
119889119905= 119896 [120784 120783][120784 120784] eqn 213
5 relative error was then added to these simulated data sets then used
as the inputted experimental data for the computational approach These data
sets can be found in Chapter 721
2312 Results and discussion
Based on the inputs of the molecular weights for this system there were
two mass-balance-allowed reactions shown in eqn 214 and eqn 215 which
are two of the three possible models that can be generated The third model
92
shown in eqn 216 is the combination of these two allowed reactions resulting
in an equilibrium reaction model
Forward 21 + 22 rarr 23 + 24 eqn 214
Backward 23 + 24 rarr 21 + 22 eqn 215
Equilibrium 21 + 22 23 + 24 eqn 216
These three models were then each evaluated based on how well the
simulated ODE curves converge to the experimental data inputted The kinetic
parameters kx were optimised for each model and the SSE was recorded
These results are tabulated in Table 21 The concentrations of HI were assumed
to not be measured during the kinetic fitting and were instead inferred
Table 21 A table showing the optimised k values for the identified models in the benzoic acid
alkylation case study alongside each modelrsquos SSE and AICC
The computational approach reveals that the reaction model containing
solely the forward reaction gives the minimum overall error and the best (lowest)
AICC evaluation when assessing the experimental data indicating that this is the
most likely reaction model For the backward reaction the minimisation algorithm
could not optimise a k value to give a better fit than the initial guess of 1 x 10⁻³
M-1 s-1 indicating that the reaction model is in complete disagreement with the
experimental data For the equilibrium model the error is as low as the forward
reaction model alone as the optimiser assigns a small k value to the reverse
reaction to attempt to fit to the noise of the system Although this model fits the
data equally well there is the added complexity of a second model term as this
term adds no value in terms of lowering the SSE it is an unfavourable addition
in terms of an AICC evaluation which prefers simplistic models and is therefore
considered a less appropriate model than the forward reaction term alone
This case study has shown that it is possible to use this computational
approach to identify the correct model and kinetic parameters for a simple
Reaction kx M-1 s-1 SSE M AICC
Forward 05807 08101 -655
Backward - 10185 -174
Equilibrium 05817 00009 08101 -410
93
system by simply inputting the participating species and their respective
changes in time-series data The k value identified is very similar to the one used
for the generation of the simulated data and varies only because of the 5
noise added to the system The fit of the identified model and k value for the data
supplied is shown in Figure 29 where the data set shown is the middle
experiment where the starting concentrations were 01 M benzoic acid and 011
M iodomethane
Figure 29 The fit of the identified model and kinetic parameters to the generated experimental
data with starting concentrations of 01 M benzoic acid and 011 M iodomethane Where
x = benzoic acid x = iodomethane x = methyl benzoate mdash = benzoic acid (ODE) mdash =
iodomethane (ODE) mdash = methyl benzoate (ODE)
232 Case study Nitrile hydrolysis
This case study features a slightly larger system where there are 5
species to consider in the hydrolysis of a nitrile[204] The nitrile of interest 25 is
hydrolysed by hydroxide 26 to form the amide 27 This amide is then further
hydrolysed to form the carboxylic acid 28 and ammonia 29 This reaction is
shown in Scheme 23 As in many acidbase reactions there are a lot of fast
proton transfer steps the mass of species 26 is therefore added to the system
94
as water H2O rather than hydroxide OH- in order to preserve mass balance
This allows appropriate reaction models to be generated
Scheme 23 The reaction of a nitrile with hydroxide to form the corresponding amide which is
susceptible to further hydrolysis to form the carboxylic acid Modelled as sequential
second order reactions
2321 Data acquisition
The sequential second order reaction model reported by Niemeier et
al[204] was used to generate the ODEs shown in eqn 217 - 221 The reported
kinetic constants for the two steps were
bull Step one k75 degc = 927 x 10-3 M-1 s-1 Ea = 871 kJ mol-1
bull Step two k75 degc = 363 x 10-5 M-1 s-1 Ea = 745 kJ mol-1
Four simulated data sets were generated at four separate temperatures by using
eqn 26 to calculate k values with the following initial concentrations
bull 08 M nitrile 25 18 M hydroxide 26 0 M amide 27 0 M carboxylic
acid 28 0 M ammonia 29 60 degC
bull 08 M nitrile 25 18 M hydroxide 26 0 M amide 27 0 M carboxylic
acid 28 0 M ammonia 29 70 degC
bull 1 M nitrile 25 2 M hydroxide 26 0 M amide 27 0 M carboxylic acid
28 0 M ammonia 29 80 degC
bull 1 M nitrile 25 2 M hydroxide 26 0 M amide 27 0 M carboxylic acid
28 0 M ammonia 29 90 degC
119889[120784 120787]
119889119905= minus1198961[120784 120787][120784 120788] eqn 217
95
119889[120784 120788]
119889119905= minus1198961[120784 120787][120784 120788] minus 1198962[120784 120789][120784 120788] eqn 218
119889[120784 120789]
119889119905= 1198961[120784 120787][120784 120788] minus 1198962[120784 120789][120784 120788] eqn 219
119889[120784 120790]
119889119905= 1198962[120784 120789][120784 120788] eqn 220
119889[120784 120791]
119889119905= 1198962[120784 120789][120784 120788] eqn 221
5 relative error was then added to these simulated data sets then used
as the inputted experimental data for the computational approach These data
sets can be found in Chapter 722
2322 Results and discussion
Based on the inputs of the molecular weights for this system there were
four mass-balance-allowed reactions shown in eqn 222 - 225 All possible
models were then compiled subject to eqn 24 resulting in 15 models
25 + 26 rarr 27 eqn 222
27 rarr 25 + 26 eqn 223
26 + 27 rarr 28 + 29 eqn 224
28 + 29 rarr 26 + 27 eqn 225
All 15 models were evaluated sequentially then ranked based on their
AICC It was found that the highest ranked model was the correct model with
kinetic parameters optimised to be very close to the real values As artificial error
was added to the results this optimisation is assumed to be correct as the
relative error in the kinetic parameters is negligible The top three performing
models are shown in Table 22 where the reference k values at 75 degC are shown
as well as the activation energy SSE and AICC
Table 22 A table showing the top three ranked models for the nitrile hydrolysis case study
The kinetic parameters for each reaction within the model is shown as well as the SSE
and AICC evaluation
Model
rank Model
kx75 degC M-1 s-1
or s-1
Ea kJ
mol-1 SSE M AICC
1 25 + 26 rarr 27 923 x 10-3 867 00179 -1623
96
26 + 27 rarr 28 + 29 449 x 10-5 716
2
25 + 26 rarr 27
26 + 27 rarr 28 + 29
28 + 29 rarr 26 + 27
928 x 10-3
430 x 10-5
194 x 10-4
867
755
263
00179 -1567
3
25 + 26 rarr 27
27 rarr 25 + 26
26 + 27 rarr 28 + 29
932 x 10-3
363 x 10-5
420 x 10-5
865
373
748
00180 -1566
This case study has shown that it is possible to identify the correct model
and kinetic parameters for a multistep chemical system using the computational
approach Interestingly this study has shown again that the overall error is very
similar in the top-ranked competing models meaning that the deciding factor
then becomes the number of model terms due to the AICC evaluation The data
inputted was at different temperatures and the kinetic parameter optimisation
proceeded smoothly when optimising reference k values and activation energies
directly An example kinetic plot showing the fit of the identified model to the
experimental data is shown in Figure 210 - this is the fourth experiment where
the starting concentrations were 1 M nitrile and 2 M hydroxide at 90 degC
97
Figure 210 The fit of the identified model and kinetic parameters to the generated
experimental data with starting concentrations of 1 M nitrile and 2 M hydroxide at 90 degC
Where x = nitrile x = amide x = carboxylic acid mdash = nitrile (ODE) mdash = amide (ODE) mdash
= carboxylic acid (ODE)
233 Case study SNAr kinetics
The final simulated case study involves a larger scale multistep system
where there are 6 species in a SNAr chemical setting 24-dichloropyrimidine
(starting material SM) 210 reacts with morpholine 211 to form either the 4-
substituted product 212 or the 2-substituted product 213 These products can
then further react with another equivalent of morpholine to produce the bis-
substituted product 214 Each of these reactions form hydrochloric acid 215
as a byproduct that is neutralised by an excess of base This system is shown in
Scheme 24
98
Scheme 24 The reaction of 24-dichloropyrimidine 210 with morpholine 211 to form the 4-
substituted product 212 and the 2-substituted product 213 and the subsequent bis-
substituted product 214
2331 Data acquisition
The multistep SNAr reaction model reported by Reizman and Jensen consists
of 4 second-order reactions These reactions were used to generate the ODEs
shown in eqn 226 - 231 The reported kinetic constants for these three steps
were
bull Step one log(A) = 34 M-1 s-1 Ea = 270 kJ mol-1
bull Step two log(A) = 35 M-1 s-1 Ea = 321 kJ mol-1
bull Step three log(A) = 49 M-1 s-1 Ea = 600 kJ mol-1
bull Step four log(A) = 30 M-1 s-1 Ea = 450 kJ mol-1
Three simulated data sets were generated at 90 degC by using eqn 27 to calculate
k values with the following initial concentrations
bull 1 M SM 210 22 M morpholine 211 0 M 4-substituted product 212 0
M 2-substituted product 213 0 M bis-substituted product 214 and 0 M
hydrochloric acid 215
bull 12 M SM 210 28 M morpholine 211 0 M 4-substituted product 212
0 M 2-substituted product 213 0 M bis-substituted product 214 and 0
M hydrochloric acid 215
bull 09 M SM 210 32 M morpholine 211 0 M 4-substituted product 212
0 M 2-substituted product 213 0 M bis-substituted product 214 and 0
M hydrochloric acid 215
99
119889[120784 120783120782]
119889119905= minus1198961[120784 120783120782][120784 120783120783] minus 1198962[120784 120783120782][120784 120783120783] eqn 226
119889[120784 120783120783]
119889119905= minus1198961[120784 120783120782][120784 120783120783] minus 1198962[120784 120783120782][120784 120783120783]
minus 1198963[120784 120783120784][120784 120783120783] minus 1198964[120784 120783120785][120784 120783120783]
eqn 227
119889[120784 120783120784]
119889119905= 1198961[120784 120783120782][120784 120783120783] minus 1198963[120784 120783120784][120784 120783120783] eqn 228
119889[120784 120783120785]
119889119905= 1198962[120784 120783120782][120784 120783120783] minus 1198964[120784 120783120785][120784 120783120783] eqn 229
119889[120784 120783120786]
119889119905= 1198963[120784 120783120784][120784 120783120783] + 1198964[120784 120783120785][120784 120783120783] eqn 230
119889[120784 120783120787]
119889119905= 1198961[120784 120783120782][120784 120783120783] + 1198962[120784 120783120782][120784 120783120783]
+1198963[120784 120783120784][120784 120783120783] + 1198964[120784 120783120785][120784 120783120783]
eqn 231
2 relative error was then added to these simulated data sets then used
as the inputted experimental data for the computational approach These data
sets can be found in Chapter 723
2332 Results and discussion
From these 6 species there are 16 mass-balance-allowed reactions that can
be identified shown in eqn 232 - 247 All possible reaction models were
generated subject to eqn 24 which resulted in 65535 unique models to be
evaluated by the approach
213 rarr 212 eqn 232
212 rarr 213 eqn 233
210 + 211 rarr 212 + 215 eqn 234
212 + 215 rarr 210 + 211 eqn 235
210 + 214 rarr 212 + 212 eqn 236
210 + 211 rarr 213 + 215 eqn 237
211 + 212 rarr 214 + 215 eqn 238
100
212 + 212 rarr 210 + 214 eqn 239
214 + 215 rarr 211 + 213 eqn 240
213 + 215 rarr 210 + 211 eqn 241
211 + 213 rarr 214 + 215 eqn 242
210 + 214 rarr 212 + 213 eqn 243
210 + 214 rarr 213 + 213 eqn 244
214 + 215 rarr 211 + 212 eqn 245
212 + 213 rarr 210 + 214 eqn 246
213 + 213 rarr 210 + 214 eqn 247
All 65535 models were evaluated by the computational approach which
incurred a computation time of 52 hours (see Chapter 761 for details on
computer specifications) Each of these models were ranked based on their
AICC and it was found that the highest ranked model was also the correct model
with kinetic parameters optimised to values that were very close to the generated
values As in the nitrile hydrolysis case study Chapter 232 this optimisation is
assumed to be correct as the error in the fitted parameters is negligible
considering that artificial error was added to the dataset The top three
performing models are shown in Table 23 where the optimised k values are
shown as well as their corresponding SSE and AICC values
Table 23 A table showing the top three ranked models for the SNAr case study The kinetic
parameters for each reaction within the model is shown as well as the SSE and AICC
evaluation
Model
rank Model kx M-1 s-1 SSE M AICC
1
210 + 211 rarr 212 + 215
210 + 211 rarr 213 + 215
211+ 212 rarr 214 + 215
211 + 213 rarr 214 + 215
032945
007686
000018
000037
00024 -2112
2
210 + 211 rarr 212 + 215
210 + 211 rarr 213 + 215
211+ 212 rarr 214 + 215
032948
007679
000018
00024 -2086
101
211 + 213 rarr 214 + 215
213 + 215 rarr 210 + 211
000033
000004
3
210 + 211 rarr 212 + 215
210 + 211 rarr 213 + 215
211+ 212 rarr 214 + 215
211 + 213 rarr 214 + 215
210 + 214 rarr 213 + 213
032949
007672
000018
000036
015890
00024 -2085
This final simulated case study has shown that it is still possible to identify
the correct reaction model and kinetic parameters for a more complicated
multistep chemical system even when there are several thousand models to
consider Many of these models are very similar and the top-ranked competing
models contain the four model terms that are appropriate as well as typically
one other model These models are top-ranking because the additional terms
are optimised by the algorithms to either have a negligible effect on the output
or to minimise the error in the kinetic fitting to a certain extent It is then the role
of the AICC evaluation to determine whether these additional model terms are
producing a significant effect in order for their consideration in the correct
reaction model In this case the SSE value was unchanged among the top-
ranked competing models meaning that the deciding factor then became the
number of model terms An example kinetic plot showing the fit of the identified
model to the experimental data is shown in Figure 211 - this is the first
experiment where the starting concentrations were 1 M 24-dichloropyrimidine
and 22 M morpholine at 90 degC
102
Figure 211 The fit of the identified model and kinetic parameters to the generated
experimental data with starting concentrations of 1 M 24-dichloropyrimidine and 22 M
morpholine at 90 degC Where x = 24-dichloropyrimidine x = 4-substituted product x = 2-
substituted product x = bis-substituted product mdash = 24-dichloropyrimidine (ODE) mdash =
4-substituted product (ODE) mdash = 2-substituted product (ODE) mdash = bis-substituted
product Graph is only shown to 260 minutes to show curvature of the initial data points
24 Conclusion
It has been shown that a computational approach to kinetic modelling
loosely based on work by Tsu et al can be programmed in MATLAB This
approach takes chemical species information as well as experimental datasets
to identify both the correct reaction model and kinetic parameters for the
chemical process by utilising optimisation algorithms and statistical analysis
This approach has been proven to work successfully for three simulated case
studies of varying optimisation difficulty with different sets of experimental data
inputs with varying artificial errors The success shown from these studies
inspires confidence that the approach can be implemented with real
experimental data and be used as an effective tool in process development to
automatically identify the correct model and kinetic parameters of various
103
chemical systems The next step is to prove the efficiency of this approach
alongside real experimentation
Chapter 3 Experimental applications of the computational
approach to kinetic model and parameter determination
31 Introduction
With the development of the computational approach completed and
verified with multiple simulated case studies the viability of the approach on real
experimental data must also be tested This experimental application can utilise
data from any source to determine the most likely reaction model and kinetic
parameters but for reasons that shall be discussed further all experimentation
for this chapter was conducted using an automated continuous flow reactor
platform
There is a long history of conducting and analysing chemical and enzymatic
kinetics using flow techniques with the first reported case published around 100
years ago by Hartridge et al as a means to study very fast reactions[205] During
this time many different processes analytical methods and experimental setups
have been reported here citing only a few[206-209] A widely regarded essential
requirement for kinetic experiments however is for the reaction system to
operate in a turbulent flow regime[210] Turbulent flow leads to fast continuous
mixing and can be predicted by calculating the Reynolds number Re in eqn
31
Where
bull Re = Reynolds number
bull ν = average flow velocity
bull d = tube diameter
bull ρ = fluid density
bull η = fluid viscosity
119877119890 = 120584119889120588
120578 eqn 31
104
Using the unitless Reynolds number the flow regime can be predicted to be
turbulent[210] when Re exceeds 2000 or laminar[211] when Re is less than 2000
These regimes are illustrated in Figure 31a and 31b respectively Under laminar
flow conditions there is a parabolic velocity profile - meaning that the flow
velocity at the centre of the tube is double the average velocity due to friction on
the walls of the tubing known as dispersion This dispersion was originally
thought to blur the time axis leading to a substantial distortion of the observed
kinetics and hence meaningful kinetic experiments under these conditions might
be impossible[212]
Figure 31 A diagram to show the direction and flows within a flow regime where a) laminar
flow b) turbulent flow
Interestingly these assumptions remained untested until a number of
reported kinetics works from the Douglas group showed that accurate kinetic
experiments could be conducted under laminar flow conditions[213-215] The
Reynolds numbers for the experiments conducted ranged between 28 and 85
implying laminar flow However the kinetics monitored in these systems agreed
very well with results obtained conventionally by stopped-flow methods Further
work suggests that molecular diffusion has a very significant role and under
certain circumstances it can be a good approximation to neglect the effects of
laminar flow ie for particular flow velocities with given internal diameters[212 216]
With this approximation the kinetics can then be analysed as if the tubular flow
was homogeneous which can lead to accurate kinetic studies even in laminar
flow regimes
105
In many continuous flow settings for micro- or meso-flow volumes it is
typically simpler to adopt an idealised plug flow reactor model This model states
that each infinitely thin section of flow known as a plug travels in the axial
direction of the reactor and is perfectly mixed in the radial direction only where
a uniform distribution of the reactor concentrations occurs This means that the
residence time of the plug is a direct function of the length of the tubular reactor
and the velocity of the fluid This is shown in Figure 32 This model is commonly
employed to simplify tubular mixing and remains an accurate approximation for
kinetic measurements[37] All kinetic experiments by other authors covered in this
introduction employ this model and further experimentation as part of this project
also utilises this model - this is discussed further in Chapter 32
Figure 32 A plug flow reactor model where there is perfect mixing in the radial direction but
no forward or backward mixing in the axial direction Plugs 1 and 2 are examples of the
infinitely short plugs existing within this reactor model
Many of the advantages of continuous flow chemistry as previously
stated in Chapter 11 are also particularly attractive for running kinetic
experiments Increased heat and mass transfer[217 218] ensures that the reaction
is well controlled meaning that it can be asserted with confidence that the
experimental conditions applied to it are truly experienced by the reaction
medium Precise reagent control arises out of utilising flow chemistry as specific
flow rates allow accurate addition of chemicals at various points within the reactor
system[22 23 35] - this is very important when deducing the order of the species
106
within a system as reagent stoichiometry is present in exact quantities Coupling
of flow reactor platforms with quantitative analysis such as UV HPLC or GC
also unlocks automation capabilities[6 219] where multiple experiments can be
queued for the system to run autonomously The increased safety[220] the
efficiency of operating at reaction temperatures above the boiling point of the
solvent[221 222] and the ability to run and analyse extremely fast reactions[223 224]
means that flow experiments can be run that would otherwise be very difficult or
impossible to run in a batch system For these reasons it is more desirable in
particular circumstances to run kinetic experiments in flow rather than more
traditional batch kinetic experiments whereby sampling occurs throughout the
progression of a single reaction These advantages will be exploited throughout
these experimental acquisitions of data
The main disadvantage to kinetic modelling in flow systems however is
the necessity of the system to reach lsquosteady-statersquo Steady-state simply refers to
the state in which the reactor is in where the responses from the system are a
direct consequence of the conditions applied to it This is an important distinction
because as the reaction parameters are changed a certain amount of time is
then required for those reaction parameters to be applied to the system to
achieve a consistent output[225] This can be very wasteful as a system typically
needs approximately 15 - 3 reactor volumes of reagent in the acclimation to
steady-state prior to each measurement[226] This wastes a lot of precious
reaction material as well as time as the time taken to reach steady-state is in
direct relation to the residence time required ie a 15 minute residence time
results in up to a 45 minute wait for steady-state
Kinetic experiments in flow have been performed in this way for a long
time as the advantageous properties of continuous flow chemistry were worth
the wastage from the steady-state measurements However in recent years
deviations from these conventional techniques have become more popular that
take advantage of the transitionary period between two steady-state
measurements This is because during this period transient reaction information
is available but is otherwise lost because of traditional sampling methods
However if the pump flow rates are manipulated to structure this transient data
in a way that can be translated to regular time-series data an entire reaction
profile can be mapped very quickly and efficiently This then negates the need
107
for multiple steady-state measurements and rectifies this flow chemistry
disadvantage as kinetic profiles can be obtained with minimal material
The first transient flow method reported by Mozharov et al[96] is an
instantaneous step change in the flow rates where the reaction initially takes
place at a low flow rate F1 and then the flow rate is increased by an order or
magnitude to F2 This high flow rate then pushes out the transient data profile of
the reaction medium whilst the liquid is monitored by an in-line analysis
technique sensitive enough to detect a change in product concentration for
example Raman spectroscopy as reported by the authors Using this in-line
technique many measurements are taken in short time intervals to generate a
reaction profile from which kinetic information can be derived This is possible
as the magnitude of F2 the experimental times of the analytical measurements
(tn) and the dimensions of the flow path in the system are known therefore the
reaction profile along the microreactor capillary can be recreated and plotted
This concept is depicted in Figure 33 with the corresponding equation shown in
eqn 32 to convert the species concentration in experimental time to the species
concentration in residence time This conversion then maps the kinetic profile of
the chemical process between the calculated residence times
Figure 33 A depiction of how a kinetic experiment can be run utilising a step change in flow
rates between two steady-states (I and II) allowing time-series data to be plotted from
transient data Figure adapted from Mozharov et al[96]
120591 = 119905211986521198651minus 1199051198652 minus 11986511198651
eqn 32
108
Where
bull τ = residence time of the reaction medium
bull t = experimental time experienced by the reactor
bull t2 = experimental time taken to reach steady-state
bull F1 = initial flow rate
bull F2 = higher flow rate that the pumps are instantaneously changed to
This concept was also used experimentally as a means to test the
accuracy of the technique in relation to conventional steady-state
measurements The base catalysed Knoevenagel condensation between
benzaldehyde 31 and ethyl cyanoacetate 32 alongside the base 33 to form
the corresponding adduct 34 is shown in Scheme 31 The corresponding
kinetic profiles were generated by conventional sequential steady-state
measurements in Figure 34 and by the described step-change methodology in
Figure 35 where the reaction proceeded at a low flow rate before a sudden step
change to a higher flow rate It is shown that the two sets of time-series data are
very comparable however the step-change methodology has many
advantages This technique can determine a kinetic profile from only one
experiment with a much lower consumption of reagents and significantly
reduced experimental time
109
Scheme 31 The base catalysed Knoevenagel condensation between benzaldehyde and ethyl
cyanoacetate to form 34
Figure 34 A kinetic profile generated from the Knoevenagel condensation shown in Scheme
31 where kinetic information was obtained by measuring conversation at given
residence times at steady-state at two temperatures Steady-state markers x are
shown as part of the lsquoA Modelrsquo Reproduced with permission
110
Figure 35 A kinetic profile generated from the Knoevenagel condensation shown in Scheme
31 where kinetic information was obtained using a flow rate step-change at two
temperatures Steady-state markers x are shown as part of the lsquoA Modelrsquo where step-
change markers o are shown as part of the lsquoB Modelrsquo Reproduced with permission
The main critique of this technique as stated in the original publication is
that the step increase in flow rate is never perfect as the system always needs
time to speed up to the higher flow rate therefore the exact function F(τ) during
this transitional period is uncertain[96] This non-ideality is caused by several
experimental factors such as non-rigidity of the tubing walls and the syringe
preventing an immediate change in both the flow rates and the pressure profile
throughout the system[227]
Moore and Jensen[227] then reported a new concept that involves a
controlled ramp instead of a step change which leads to less uncertainty in the
determination of the residence times leading to greater accuracy in the time-
series data This therefore also leads to greater accuracy in the kinetic
parameters obtained from the experiment This report introduced the concept of
ldquopseudo-batchrdquo reactors referring to each fluid element passing through the flow
reactor in a time that is unique which can be thought of as many successive
pseudo-batch reactions This concept is shown in Figure 36
Figure 36 A depiction of how a continuous flow reactor may be described as a series of
sequential pseudo-batch reactors where the colour represents the extent of conversion
from low (green) to high (red) Q represents the total flow rate ti represents the initial
time of each pseudo-batch reactor entering the reactor tf represents the final time tm is
the time at which the concentration is actually measured by the IR probe Reproduced
with permission
This controlled ramp method results in a more predictable and accurate
residence time profile when compared to the step change method as the
residence time uncertainty decreases as well as a greater sampling rate with a
data density 10-fold higher than previously reported in Mozharov et alrsquos
technique This was shown experimentally in Scheme 32 in the Paal-Knorr
reaction of 25-hexanedione 35 and ethanolamine 36 generating 37 whilst
constantly monitored by an in-line IR probe This greater data density also
reduces the error within the kinetic profiles generated whilst still agreeing with
111
kinetic profiles generated purely from steady-state measurements as shown in
Figure 37 where these datasets are shown to be very precise and reproducible
Scheme 32 The Paal-Knorr reaction of 25-hexanedione 35 and ethanolamine 36 to yield
37 to show how the kinetics of a process can be observed by using a controlled ramp
technique
Figure 37 A combination of the kinetic models for the reaction yielding 37 in Scheme 32
where the differing colours represent different values of S where S is a corrective
residence time multiplier to show the reproducibility of the controlled flow ramp
methodology S = 14 (blue) S = 13 (red) S = 12 (green) S= 23 (orange) steady-state
experiments = x Reproduced with permission
Controlled ramps have now been reported many times because of the
experimental advantages that they possess[225 228] They feature all of the
advantages of conventional flow chemistry as reported earlier in this
introduction without the disadvantages that arise from typical steady-state
sampling This allows users to generate accurate data-rich kinetic information
from a process whilst using minimal material and time This methodology will
112
feature heavily in the data acquisition portions of this chapter as we opted to use
controlled ramps for all of our experimentation to exploit these advantages
More recently further efficiency has also been realised by the
combination of temperature gradients[229] with controlled flow ramps[146 230-232]
This allows for the fitting of kinetic parameters including activation energies to
a non-isothermal dataset obtained from one flow experiment This methodology
therefore results in even less material and time consumption as all kinetic
parameters can be determined from one flow experiment Although this relatively
new technique has only been reported for very simple systems it represents an
advancement in performing exceptionally efficient kinetic experiments using
continuous flow
32 Experimental setup
All flow experiments were conducted using a tubular reaction vessel built
in-house consisting of a 116rdquo OD (132rdquo ID) stainless steel tubing coiled around
a cylindrical aluminium heated block Reagents were pumped using JASCO
PU980 dual piston HPLC pumps and flow streams were mixed using Swagelok
SS-100-3 tee-pieces Sampling was conducted by using a VICI Valco EUDA-
CI4W5 sample loop with a 05 microL aliquot volume This results in small aliquots
of reaction mixture automatically transferring to the HPLC for on-line analysis
The reaction system was maintained under a fixed back pressure using an
Upchurch Scientific 1000 PSI back pressure regulator Quantitative analysis was
performed using an Agilent 1100 series HPLC instrument fitted with a Sigma
Ascentis Express C18 reverse phase column (5cm x 46mm 27 microm) In all
experiments biphenyl was added to one reservoir as an internal standard This
experimental setup is shown in Figure 38
113
Figure 38 A photograph of the automated continuous flow reactor used for this work
Previous work using this experimental setup has shown that transient flow
experiments show an error of less than 4 in the observed rate constants due
to dispersion whilst steady-state experiments show an absolute error of 05
and a relative error of 024 [233 234] Therefore when considering the kinetic
simulations in these studies a plug flow model was adopted If we consider the
general axial dispersion plug flow reactor model[235] in eqn 33
Erstwhile studies by Hone[225] on our reactor platform and similar investigations
by Jensen[230 236 237] using a comparable system have found that dispersion only
introduces a small deviation from plug flow Given this eqn 33 can be simplified
to ignore the second order term to give eqn 34 - 36 This plug flow reactor
design equation can be utilised to model each species in the reaction with
respect to residence time
Where
bull DR = axial dispersion coefficient
11986311987711988921198621198941198891199112
minus 119906119889119862119894119889119911+ 119903119894 = 0 eqn 33
119906119889119862119894119889119911= 119903119894 eqn 34
120591 =119911
119906 eqn 35
119889119862119894119889120591= 119903119894 eqn 36
114
bull Ci = molar concentration of species i
bull z = the length along the reactor
bull u = superficial velocity
bull ri = rate of reaction of species i
For each chemical process concentration-time data is collected by using
linear flow ramp gradients with on-line HPLC analysis Steady-state is initially
achieved within the system then sampling begins during the controlled ramping
to the next steady-state condition capturing the transitory information This is
shown in Figure 39 At least two flow ramp experiments at different temperatures
are conducted with HPLC sampling every 2 - 4 minutes depending on the length
of the HPLC method The residence time is then calculated for each sampling
point using eqn 37 to translate this transient data to a time-series dataset
Figure 39 A mathematically correct representation of how linear gradient flow ramps can be
utilised to sample with a high data density on the initial curvature of the kinetic plot
Where diams = data point Tn = experiment temperature Q = total flow rate Time = time the
reaction has been running τ = residence time that the reaction mixture experiences
Where
bull τ = residence time
bull α = deceleration of flow rate
120591 = 119886 ∙ 119905 minus 1205830 +radic(1205830 minus 119886 ∙ 119905)2 + 2 ∙ 119871 ∙ 119886
119886 eqn 37
115
bull μ0 = initial flow rate
bull t = experiment time
bull L = reactor volume
33 Case study Phenyl acetate
The first reaction system explored using the computational approach was
the presupposed model of the reaction of phenol 38 with acetyl chloride 39
to form phenyl acetate 310 and hydrochloric acid 311 shown in Scheme 33
This first experimental verification of the approach was a final validation of the
approach by selecting a simple example with few chemical species The goal of
this study was to confirm the presupposed model shown in Scheme 33 as well
as identify the kinetic parameters for this process The validity of the controlled
ramp method would also be determined based on comparisons of the
experimental data with steady-state measurements Full experimental details
including the preparation of the feed solutions experimental setup flow ramping
rates HPLC analysis and raw data can be found in Chapter 731
Scheme 33 The reaction of phenol 38 with acetyl chloride 39 to form phenyl acetate 310
and hydrochloric acid 311
The kinetic data was obtained using the controlled ramp methodology at
two temperatures 65 degC and 75 degC and the four participating species were
inputted into the computational approach Based on these four species only two
reactions were calculated to be possible based on mass balance - these are
shown as the forward reaction eqn 38 and the backward reaction eqn 39
which are two of the three possible models that were generated The third model
shown as eqn 310 is the combination of these two allowed reactions resulting
in an equilibrium reaction model
Forward 38 + 39 rarr 310 + 311 eqn 38
116
Backward 310 + 311 rarr 38 + 39 eqn 39
Equilibrium 38 + 39 310 + 311 eqn 310
These three models were then each evaluated automatically by the
approach based on how well the simulated ODE curves converge to the time-
series data obtained from the controlled ramps The k values SSE error metric
and the AICC evaluation for each of the models is shown in Table 31 This data
represents a similar scenario to the simulated benzoic acid esterification case
study shown in Chapter 231 where the identified most likely model has a similar
error to another model but with more model terms The forward reaction model
fits both temperature datasets very well whilst the backward reaction model
does not fit to the experimental data at all as there is no direction in the
parameter space from the initial guess that the optimisation algorithm can travel
to make a favourable change in the convergence to the data The equilibrium
model fits the data equally as well as the forward model as it sets the backward
rate constant to be negligible leading to a low SSE However as this second
term adds no value in further lowering the SSE it is an unfavourable addition in
terms of the AICC evaluation which prefers more simplistic models and is
therefore considered a less appropriate model than the forward reaction term
alone
Table 31 Evaluation of the feasibility of each reaction model for the phenyl acetate study
By only inputting the species involved in the reaction then running two
controlled flow ramps with the automated computational approach described the
intuitive reaction model was confirmed and the kinetic parameters were
determined as k75 degC = 1045 x 10-3 plusmn 042 x 10-3 M-1 s-1 Ea = 693 plusmn 78 kJ mol-1
This combination of the correct reaction model and kinetic parameters allowed a
Reaction Model
k Values x 10-3 M-1 s-1
SSE M AICC Evaluation
65 degC 75 degC
Forward 515 1045 0019 136
Backward - - 0532 803
Forward +
Backward
515
0
1045
0 0019 1636
117
fit to the experimental data with an average residual of less than 3 x 10⁻³ M and
is shown in Figure 310 where the colours of the data and fitted ODEs mimic the
colours shown in Scheme 33 This study has shown that the transition from
simulated to real experimental data does not affect the accuracy of the approach
and that the approach can be applied to experimental data with confidence that
the correct reaction model is to be identified
Figure 310 Kinetic profiles for two flow ramp experiments at 65 degC and 75 degC where x =
phenol x = phenyl acetate mdash = phenol (ODE) mdash = phenyl acetate (ODE)
The equivalent temperature and residence time kinetic profiles were also
mapped by performing a series of conventional steady-state experiments to
ensure that a transient-flow regime remained accurate in model and parameter
determination Results showed excellent agreement in plotted curvature and
confirmed the same reaction model to be the most likely whilst identifying very
comparable kinetic constants Figure 311 shows a comparison of the two
sampling methodologies for this particular reaction See Chapter 7315 for
further details
118
Figure 311 Graphs showing the agreement between steady-state and flow ramp
measurements for the reaction of phenol with acetyl chloride where curves are fitted to
the steady-state data Where = phenol (steady-state) x = phenol (flow ramp) =
phenyl acetate (steady-state) x = phenyl acetate (flow ramp)
34 Case study Paracetamol
The next reaction system that was explored was the chemical system
producing paracetamol whereby 4-aminophenol 312 reacts with acetic
anhydride 313 to form paracetamol 314 and the over-reacted diacetamate
impurity 315 shown in Scheme 34 as the intuitive sequential reaction This
reaction system serves as the first real experimental multistep reaction that is
studied by this approach in order to determine the correct reaction model and
kinetic parameters However as there is a large disparity between the reaction
kinetics of step one and two quantitative kinetic analysis of both processes
simultaneously ie during a single ramp was not possible Therefore two sets
of differing temperature ramps were performed to investigate independently the
formation of paracetamol and diacetamate at 3060 degC and 160180 degC
respectively Each of these ramps differ in reactor size and hence residence
times as well as starting concentrations of acetic anhydride This was performed
to illustrate the capability of the approach to handle data from a variety of sources
whilst still accurately determining the kinetic properties of a process
Scheme 34 The reaction of 4-aminophenol with acetic anhydride to form paracetamol in step
one followed by a further reaction with acetic anhydride to form diacetamate in step two
Based on the five species identified including the acetic acid 316
formed with each reaction of acetic anhydride there were six reactions that were
calculated to be possible based on mass balance These reactions are shown
as eqn 311 - 316
312 + 313 rarr 314 + 316 eqn 311
119
314 + 316 rarr 312 + 313 eqn 312
314 + 313 rarr 315 + 316 eqn 313
315 + 316 rarr 314 + 313 eqn 314
312 + 315 rarr 314 + 314 eqn 315
314 + 314 rarr 312 + 315 eqn 316
Interestingly some of the mass-balance-allowed reactions identified by
the ILP optimisation seem very unlikely to happen based on chemical intuition
The reaction of 4-aminophenol with diacetamate shown in eqn 315 for
example suggests that it is possible for this starting material to react with the
over-reacted product to form two equivalents of the desired product We know
from intuition that the ester bond is too strong to break and react without a
chemical stimulus so we may have initial speculations on the feasibility of this
reaction However it can never be stated with certainty that this reaction cannot
happen until its feasibility is studied and therefore all possible models are still
generated to be evaluated This is a major advantage of this approach that
reactions and models that may otherwise be discarded due to chemical bias are
automatically evaluated without a chemistrsquos input This could lead to unexpected
(but statistically and chemically accurate) models that describe time-series data
which can lead to better process efficiency and even discover new reactions
63 potential models were identified from the five reactions and the
reaction model shown in Scheme 34 was determined to be the most likely
representation of the system by AICC The approach also determined the kinetic
parameters of step one k60 degC = 645 plusmn 026 M-1 s-1 Ea = 32 plusmn 12 kJ mol-1 and
step two k180 degC = 427 x 10-2 plusmn 017 x 10-2 M-1 s-1 Ea = 979 plusmn 65 kJ mol-1 by
fitting k values to each dataset in the kinetic fitting stage of the approach These
values us to assert that step one will likely be very fast at a wide range of
temperature ranges and that step two has a higher sensitivity to changes in
temperature when the energy of the system increases This identified model
alongside the identified kinetic parameters fits to the experimental data very
accurately with an average residual of less than 1 x 10⁻⁴ M and is shown in
Figure 312 The top 5 ranked models are shown in Table 32 with their
respective SSE error metric and AICC evaluation
120
Figure 312 Kinetic profiles for four flow ramp experiments at 30 degC 60 degC 160 degC and 180
degC where x = 4-aminophenol x = paracetamol x = diacetamate mdash = 4-aminophenol
(ODE) mdash = paracetamol (ODE) mdash = diacetamate (ODE) See Chapter 732 for full
experimental conditions and raw data
Table 32 Evaluation of the feasibility of each reaction model for the paracetamol study
Rank Reaction Model
k values s-1 or M-1 s-1 SSE
x103 M
AICC
Evaluation 30 degC 60 degC 160 degC 180 degC
1 312 + 313 rarr 314 + 316
314 + 313 rarr 315 + 316
59082
-
64471
-
-
00129
-
00427 0295 1292
2
314 + 316 rarr 312 + 313
312 + 313 rarr 314 + 316
314 + 313 rarr 315 + 316
01599
59509
-
09120
67519
-
-
-
00125
-
-
00427
0293 3690
3
312 + 313 rarr 314 + 316
312 + 315 rarr 314 + 314
314 + 313 rarr 315 + 316
59067
38065
-
64348
35719
-
-
-
00129
-
-
00428
0295 3692
4
315 + 316 rarr 314 + 313
312 + 313 rarr 314 + 316
314 + 313 rarr 315 + 316
23783
59188
-
27076
64641
-
00210
-
00130
00022
-
00430
0295 3692
121
5
314 + 314 rarr 312 + 315
312 + 313 rarr 314 + 316
314 + 313 rarr 315 + 316
00799
59258
-
02270
64833
-
-
-
00127
-
-
00425
0295 3692
Interestingly there are many reaction models that were found to have a
lower SSE error metric than the identified most likely model This is again where
the AICC ranking metric is used to great effect to balance the convergence to
experimental data as well as the simplicity of the model It is in these cases that
models that contain transformations discussed previously as very unlikely such
as in the rank 3 model that the terms are likely being used by the optimisation
algorithm to fit experimental noise For this reason this approach cannot be
completely autonomous and must require evaluation by a chemist when
observing the top rated models to be certain that the quality of the data assures
correct model determination - this was discussed in Chapter 225
This paracetamol study has shown that the approach can correctly identify
the reaction model and kinetic parameters for a multistep reaction using real
experimental data from different temperature flow ramps by inputted only the
observed species and time-series data As a side note - interestingly contrary to
common undergraduate laboratory experiment scripts[238] the over-reacted
diacetamate will not form in any measurable quantities in a conventional
undergraduate experiment Assuming that the reaction is similar in water to
acetonitrile the reaction doesnrsquot need refluxing and will go to full conversion of
paracetamol within seconds at room temperature Furthermore using the kinetic
parameters in this study and the recommended reflux temperature of common
laboratory manuals 100 degC and a typical 02 M reaction mixture of paracetamol
and acetic anhydride it would take approximately 12 years for the reaction to
achieve complete conversion to diacetamate
35 Case study Metoprolol
The final experimental case study that was explored was the chemical
system producing metoprolol whereby the epoxide starting material 317 reacts
with isopropylamine 318 to form metoprolol 319 which can further react to
form the bis-substituted impurity 320 shown in Scheme 35 Metoprolol is a
122
cardioselective beta-blocker commonly used for the treatment of hypertension
for which kinetic information would help in the process development stage of
manufacture at AstraZeneca This reaction system serves as the first real
experimental multistep reaction that is studied by this approach where parallel
reactions occur in tandem leading to a more difficult system for which to optimise
kinetic parameters and identify the correct reaction model
Scheme 35 The reaction of the epoxide starting material with isopropylamine to form
metoprolol as well as the overreaction to form the bis-substituted product
Two sets of two-temperature flow ramps were run on parallelised flow
reactor platforms one set in our lab in Leeds (190210 degC) and one set at
AstraZenecarsquos lab in Macclesfield (130150 degC) The two reactor platforms differ
in equipment specification and reactor volume and the two experimental sets
differ in temperatures and starting concentrations This parallelisation of
experiments on different systems was performed to further confirm the
reproducibility of this flow ramp methodology as corroborating data can be
achieved by an operator on separate reactor systems in different locations The
experimental results were then combined and the computational approach was
applied Full details of experimentation can be found in Chapter 7331
Based on the four species identified there were six reactions that were
calculated to be possible based on mass balance These reactions are shown
as eqn 317 - 322
317 + 318 rarr 319 eqn 317
319 rarr 317 + 318 eqn 318
319 + 317 rarr 320 eqn 319
320 rarr 319 + 317 eqn 320
123
319 + 319 rarr 318 + 320 eqn 321
318 + 320 rarr 319 + 319 eqn 322
63 reaction models were generated which correspond to every possible
combination of these allowed reactions and each of them were evaluated
sequentially by the approach The reaction model shown in Scheme 35 was
identified as the most likely representation of the system by AICC and the kinetic
parameters for the formation of metoprolol were found to be k170 degC = 0286 plusmn
0012 M-1 min-1 Ea = 724 plusmn 29 kJ mol-1 and for the formation of the bis-
substituted product k170 degC = 0019 plusmn 0001 M-1 min-1 Ea = 750 plusmn 30 kJ mol-1
This identified model alongside the kinetic parameters fit to the experimental data
very accurately with an average residual of less than 2 x 10⁻³ M and is shown
in Figure 313 The top 5 ranked models are shown in Table 33 with their
respective SSE error metric and AICC evaluation
Figure 313 Kinetic profiles for the flow ramp experiments at 130 degC 150 degC 190 degC and 210
degC where x = starting material x = Metoprolol x = bis-substituted product mdash = starting
material (ODE) mdash = Metoprolol (ODE) mdash = bis-substituted product (ODE) See Chapter
733 for full experimental conditions and raw data
124
Table 33 Evaluation of the feasibility of each reaction model for the metoprolol study
Rank Reaction Model
Kinetic parameters SSE
x10 M
AICC
Evaluation k170 degC min-1 or
M-1 min-1 Ea kJ mol-1
1 317 + 318 rarr 319
319 + 317 rarr 320
02857
00191
7242
7500
01212 -31145
2 317 + 318 rarr 319
319 rarr 318 + 320
03065
00260
7569
6552
01252 -30961
3
317 + 318 rarr 319
319 rarr 317 + 318
317 + 319 rarr 320
03008
00043
00188
7463
5379
7557
01188 -30768
4
317 + 318 rarr 319
319 + 317 rarr 320
320 rarr 319 + 317
02858
00202
00158
7245
8216
4920
01209 -30669
5
317 + 318 rarr 319
319 + 317 rarr 320
318 + 320 rarr 319 + 319
02857
00191
00003
7242
7508
4898
01212 -30653
The reference k values and activation energies were fitted directly in the
kinetic fitting stage of the approach and the experimental dataset was adjusted
to incorporate an artificial-zero time point which is a common practice when
fitting kinetics in order to assert an experimental lsquostart timersquo when concentrations
are known This can fix any fitting discrepancies that may occur as the first
measured time point may not be accurate - it is assumed however that all time
points following this first measurement are correct with respect to the first
measurement This is assumed only for the fitting of the kinetic parameters as
the parameters are likely to be more accurate In the case of this experiment
small deviations in asserting the time of the initial measurement may occur from
thermal expansion of the solvent because of the very high temperatures or from
pump flow rate errors
It has been shown in this study that it is possible to deconvolute reaction
pathways that are happening simultaneously using this computational approach
Differing-temperature experimental datasets were collected from different
125
experimental systems and collated to show that the correct model could be
identified even with data from different sources Kinetic parameters are also
identified from this approach that gives an excellent fit to the experimental data
This kinetic information can then be used to optimise this process between
given limits for temperature chemical equivalents and reaction time Using
current pricing for the starting material used in this work[239] other standard
industrial optimisation techniques would have been significantly more expensive
to implement When comparing this kinetic approach to other optimisation
methods steady-state kinetic measurements would have cost 24 more in
terms of material consumption and a screening and full factorial design of
experiments (DoE) optimisation would have cost 106 more - see Chapter
7336 for more details Then of course factoring in the cost of the time of the
chemist running the experiments (which hereby would be automated) and the
time for interpretation of the data and kinetics (which the approach elucidates)
this results in a significant reduction in labour time and overall cost which also
results in a more comprehensive overview of the possible kinetic models at play
36 Conclusion
It has been shown in this work that when real experimental time-series data
for a chemical process is available total process understanding can be achieved
without the need for high-level chemical intuition or human interference When
participating species are known or inferred complete sets of kinetic information
can be obtained via construction of all possible reaction models and identification
of their respective kinetic parameters This was undertaken by coupling an
automated flow reactor platform with a computational approach to deduce and
evaluate each kinetic model utilising optimisation algorithms After post-reaction
statistical analysis indicates which models are the most likely to be true based
on the experimental data provided which can be from batch or flow this
information can then be interpreted by a trained chemist to further differentiate
reaction pathways based on what should and should not be chemically possible
This approach has been proven to be powerful in determining the reaction
model and kinetic parameters in a variety of experimental circumstances The
approach will be particularly powerful in situations where the reaction model is
126
not completely understood for example when there are competing reaction
pathways The approach can be computationally expensive depending on the
number of possible reaction models although all of the optimisations carried out
by the approach on the work described was evaluated in less than 5 minutes on
a standard 4-core Intel i5-2310 processor However the added computational
cost is minimal compared to the reduction of time and experimental cost with
regards to kinetic evaluation Furthermore this approach can be run
automatically as bench scientists use their human resource for more challenging
tasks that cannot be automated
This work is the first implementation of the approach on experimental
time-series data and has been proven to efficiently interpret kinetic information
using minimal amounts of material to generate sufficient experimental data to
enable accurate model determination Using this methodology can considerably
outweigh the cost of further experimentation to discriminate speculated kinetic
models and can greatly reduce the time and cost barriers to full process
understanding
Chapter 4 The development of an improved computational
approach to kinetic model determination
41 Introduction
The aforementioned computational approach to kinetic model and
parameter determination as described in Chapter 2 and Chapter 3 is a powerful
tool for many experimental applications However there are two major limitations
to this tool The first limitation is in the reaction orders of the particular species
that are available - these orders are constrained to two integer orders 1 and 2
There are instances however where reactions can feature zero order reactions
or even have non-integer orders for which this approach currently cannot
facilitate and identify The second limitation is the inability of the approach to
model catalytic reactions and hence determine the reaction order of species
within a catalytic reaction As catalytic reactions are common in research
manufacturing and process development there are many applications where this
approach could ideally be utilised but is not currently applicable
127
Further development of the computational approach to rectify these
limitations can therefore increase its applicability greatly which further increases
the scope of the tool for chemical applications As the comprehensive model
evaluation aspect of this methodology has been proven to be effective for
determining correct reaction models the skeleton of the approach remains
unchanged This includes the two major steps of the approach model generation
and kinetic parameter fitting as well as the statistical measurements involved ie
AICC However although the basis for the approach remains the same many
structural changes of the programmed tool are necessary for the incorporation
of these new applications non-integer order models and catalytic models The
advancement of the approach to incorporate these changes makes it applicable
in almost all chemical processes which is the final step in answering the overall
research aim of the project to build an automated methodology to kinetic model
discrimination and parameter determination
42 Methodology advancement
421 Capabilities
When mass-balance-allowed reactions are identified by the approach
these reactions can then be compiled into a number of models that feature them
as discussed in Chapter 22 However there is a difference between an allowed
reaction based on the mass balance of the reactants and products and the rate
laws that govern the way that these species react All models are currently
compiled in a way that assumes a first order dependence on all species that are
featured Therefore for the mass-balance-allowed transformation of A to B as
shown in eqn 41 the rate law for the change in B is shown in eqn 42
A fundamental change to this methodology explores the same
transformation but using different reactivities by also investigating different
orders of the reacting species To explore different reaction orders including
non-integer reaction orders the rate law of the elementary reaction can be
described with differing powers of α shown in eqn 43 where α = 0 05 or 1
119860119896rarr119861 eqn 41
119889[119861]
119889119905= 119896[119860] eqn 42
128
This allows multiple chemical pathways to be explored that describe the
chemistry in different ways which were not available previously using this
methodology Each of the newly identified reactions are then treated as
lsquoavailablersquo reactions from which reaction models can be constructed in the same
way as described in Chapter 22 Therefore for each mass-balance-allowed
reaction identified by the approach that is lsquounimolecularrsquo there are 3
corresponding reaction orders possible and therefore 3 reactions that are added
to the pool of available reactions for kinetic model generation In the context of
this approach the transformation of a single mass-balance-allowed reaction to
every variant of its corresponding rate law is termed lsquoinflationrsquo
For lsquobimolecularrsquo reactions identified by the approach as mass-balancing
similar chemical descriptions can be written as with the lsquounimolecularrsquo reactions
For the reaction of A and B to form C there are multiple potential combinations
of the species orders α and β in the potential rate laws shown in eqn 44 and
45
These values of α and β can take the form of 0 05 1 as before However it is
extremely rare for two chemical species to react with a zero order dependence
on both species Therefore in an effort to lower the number of lsquoavailablersquo
reactions and hence lower the number of kinetic model evaluations necessary
these particular reactions are seen as unfeasible and are therefore not included
in the model generation stage This is also true of a zero order05 order
bimolecular reaction Therefore for every lsquobimolecularrsquo mass-balance-allowed
transformation identified by the approach there are 5 corresponding reactions
that are added to the pool of available reactions for kinetic model generation
This approach has also been modified to include catalytic reactions in the
model generation if the user selects the option to do so The user can select to
either include catalytic reactions or exclusively look at catalytic reactions (ie no
reactions can occur without a catalyst) As before all mass-balance-allowed
119889[119861]
119889119905= 119896[119860]120572 eqn 43
119860 + 119861119896rarr 119862 eqn 44
119889[119862]
119889119905= 119896[119860]120572[119861]120573 120572 + 120573 ge 1 120572 = 120573 ne 05 120572 120573 isin 0 05 1 eqn 45
129
transformations are identified then for the reaction of A and B to form C all
combinations of integer and non-integer catalytic reactions are generated within
the inflation step At this point the species that is user-selected to behave
catalytically is then incorporated into the rate laws For each mass-balance-
allowed (inflated) transformation the catalytic species can take the order of 05
1 or 2 and each of these rate law variations are constructed and added to the
pool of available reactions for kinetic model generation Note also that in these
catalytic reactions the dependence of the orders become empirical to a greater
extent whereby individual species are used and regenerated as opposed to
referring specifically to molecularity (ie number of species reacting together at
once) When catalytic reactions are included in model generation with the
selected catalytic species lsquoCatrsquo eqn 44 becomes eqn 46 and the general rate
law shown in eqn 45 becomes eqn 47 where γ = order of catalyst
All combinations of catalytic and non-catalytic reactions are generated For each
mass-balance-allowed lsquobimolecularrsquo reaction where catalytic variants are also
generated there are 15 possible corresponding reactions that are added to the
pool of available reactions for kinetic model generation This inflation step is
summarised qualitatively in Figure 41 showing how individual mass-balance-
allowed reactions can generate multiple transformations that are dependent on
different rate laws
119860 + 119861 + 119862119886119905119896rarr 119862 + 119862119886119905 eqn 46
119889[119862]
119889119905= 119896[119860]120572[119861]120573[119862119886119905]120574 120572 + 120573 ge 1 120572 = 120573 ne 05 120572 120573
isin 0 05 1 120574 isin 0512
eqn 47
130
Figure 41 An illustration of how the lsquoinflationrsquo step takes all mass-balance-allowed
transformations sequentially then deduces all allowed integer and non-integer orders
and generates corresponding rate laws for these transformations If catalytic reactions
are to be explored also rate laws for these catalytic dependencies are also generated
These transformations are all then saved from which full reaction models can be
constructed
These new capabilities incorporated into the overall computational
approach allow kinetic model determination for more complex chemical systems
for catalyticnon-catalytic processes with integer or non-integer orders This
approach can then be used as before whereby the chemical species and
experimental datasets are uploaded and the program runs an extensive kinetic
model evaluation loop followed by statistical analysis to determine the most
likely model However the major disadvantage to evaluating all possible models
generated after the newly incorporated inflation step is the huge computational
cost As the pool of available reactions is expanded greatly from simple mass-
balance-allowed reactions to all rate laws possibly governing these reactions
the number of possible models to be generated from these reactions grows
131
exponentially It is therefore not feasible with current technology to evaluate
every possible model However many of these possible models are also
unfeasible due to their inability to occur anyway Upon generation of a reaction
model the fitness of the model can be determined by employing simple and
appropriate logical and chemical constraints or rules These rules ensure that
generated models with an infeasibility to occur are identified and discarded
without the need for further evaluation and consumption of computational
resources
422 Rules
In order to evaluate only the models that are feasible a priori logical and
chemical rules must be applied to the available models to discard large numbers
of them as many models may feature redundant or impossible model terms
within them To postulate such rules requires logical yet simplistic
rationalisations of how reactions occur - rationalisations that seem obvious upon
realisation but are seldom taught or reported in the literature
To show the importance of these rules when running this approach
Scheme 41 shows a model reaction of maleic acid 41 reacting with methanol
42 to form the mono-product 43 and the di-product 44 which can be used
to show the number of models to be evaluated[240] In this reaction the maleic
acid is self-catalytic so this species behaves as both a starting material and a
catalyst Using these 5 species there are 6 possible mass-balance-allowed
reactions From these 6 reactions after inflation steps to look at all integer and
non-integer species dependencies and all catalytic and non-catalytic reactions
the total number of models to evaluate is gt1854900872 A specific number
cannot be quoted as just compiling this number of reaction models takes over
110 GB of memory and so an accurate estimate cannot be achieved with the
equipment available The evaluation of this number of models would likely take
several years to complete even when using high-performance computing
clusters It is therefore imperative that these rules drastically reduce the number
of models to evaluate to enable this methodology as a practical process
development application
132
Scheme 41 The self-catalysed reaction of maleic acid 41 and methanol 42 to form the
mono-product 43 and the di-product 44[240]
Rule 1 One variant of each reaction
There are many variations of the same elementary transformations to be
considered when building models for evaluation Examples of these variations
could be
bull A + B rarr C
bull A + B0 rarr C
bull A05 + B rarr C
bull etc
It is very unlikely however that the same reactants will undergo the same
chemical transformation to products with many different rate laws It would not
be expected that an elementary step would proceed in numerous ways in both
an overall second order and an overall first order manner to result in the same
product for example Therefore when compiling reaction models for evaluation
only one variant of each elementary reaction can be present in a single model
This also reduces the maximum number of model terms in a single model to the
total number of elementary reactions which in this example is 6 When this rule
is enforced during model generation for the model chemical system the total
number of models for evaluation is 8156735
Rule 2 Iterative model evaluations
Although it cannot be known what the lsquoaveragersquo number of model terms
in a lsquogeneralrsquo model is the assumption can be made that the user is investigating
a single synthetic step in a chemical process With a single synthetic step there
may be consecutive reactions and impurities formed but it would undoubtedly
be regarded as unlikely if any model was proposed with 30 model terms for
example In accepting this postulation it must therefore also be true that there is
a continuum of likelihood whereby a model will contain a certain number of model
133
terms especially when evaluated by AICC Therefore there must also exist a
limit of model terms that once reached it can be regarded that the corresponding
model is too unlikely to occur to be treated as a serious model candidate Without
a vast literature study it is not possible to know what this number should be and
this prospective study extends past the scope of this project - this discussion is
highlighted to simply introduce the concept of the existence of this upper limit of
model terms
Although this upper limit is unknown it is possible to start at a prospective
number of model terms then the user can decide if this number should be
increased based on the responses observed From chemical intuition based on
the findings of AICC values thus far in the project much of the data can be fitted
effectively with le 4 model terms and adding further model terms in general leads
to diminishing model evaluations This is of course a biased generalisation
based on the chemical systems that have been studied within the project
However using an initial upper limit of 4 model terms in the model generation
stage may be generally appropriate for single-step chemical systems - if this limit
does not give a satisfactory model that fits the supplied experimental data it can
be iteratively increased to 5 model terms then 6 etc As there are many models
that would require computationally expensive evaluations with over 4 model
terms this rule allows the user to determine if further evaluations with larger
models are necessary which could otherwise potentially waste computational
resources and more importantly time When this rule is enforced during model
generation in the model chemical system as well as the previous Rule 1 the
total number of models for evaluation is 668735
Rule 3 Catalytic reactions considered only
In order to reduce the number of available reactions from which to build
models and hence reduce the number of unnecessary model evaluations it is
assumed from the userrsquos input of a catalytic species that all mass-balance-
allowed reactions present will proceed only with a catalyst This is assumed due
to the available lower energy pathways in the presence of the catalyst This can
then be changed by user input if a suitable model is not found where the model
generation is re-run to incorporate reactions that both do and do not proceed
using the specified catalyst When this rule is enforced during model generation
134
as well as each previous rule the total number of models for evaluation in the
model chemical system is 173711
Rule 4 There must be at least one reaction from starting materials to products
As the starting concentrations are initially inputted into the system it can
be deduced which of the species are lsquostarting materialsrsquo In some instances there
may be species that are considered by the user to be the products of the reaction
at the first time point but in the context of this rule are also considered to be a
starting material For clarity this definition of lsquostarting materialrsquo refers only to
species that have mass in the initial concentrations The rule states that there
must be at least one term in the model that describes a decrease in the
concentration of one of the identified starting materials This logic-based rule
ensures with certainty that the models that are evaluated feature terms that
exhibit a change in concentrations Although seemingly obvious this rule is
necessary to remove these commonly occurring models that would only lead to
wasted computational resources
For example if there are four species in a chemical system (A B C D)
and their initial concentrations are 1 M 0 M 0 M and 0 M respectively the only
starting material identified is A Many models that are feasible according to mass
balance may not be feasible according to this rule as they may not exhibit a
change in concentration Table 41 shows some examples of allowed models
based on these starting concentrations that will progress onto the kinetic fitting
stage of the approach as well as disallowed models that will be discarded As
shown entries 3 and 4 will both feature a change in concentrations whereas
entries 1 and 2 will not and are hence discarded When this rule is enforced as
well as each previous rule the total number of models for evaluation in the model
chemical system is 121836
Table 41 A table showing examples of allowed and disallowed models according to Rule 4
Entry 1 2 3 4
Model B rarr C
B + B rarr D
B + B rarr D
D rarr A
A rarr D
B rarr C
A rarr B + B
B rarr C
Allowed
135
Rule 5 New lsquostarting materialsrsquo available from products
As an extension of Rule 4 relating to identifying lsquostarting materialsrsquo from
initial concentrations further starting materials can also be identified from the
products of these earlier reactions For example in entry 4 in Table 41 B is not
initially identified as a starting material However as A is a starting material
forming B as a product there is certain to be some concentration of B as time
progresses meaning that B can also be viewed as a starting material at some
point Therefore as starting materials in entry 4 are A and B both reactions in
this model are allowed because they both feature a change in concentration from
a starting material to another species
Under Rule 5 models that feature model terms incurring a decrease in
concentration from these newly identified starting materials only can be allowed
Therefore entry 4 will be a model that is progressed onto the model evaluation
stage However in entry 3 in Table 41 it can be noted that the initially identified
starting material (A) forms D as a product meaning that the starting materials in
this model are A and D The second model term features a reaction of B to form
C but this logic-based rule highlights that there is no possible scenario where B
will be formed in order to further react If this model were to progress onto model
evaluation it would certainly be an over-trained model and would rank lowly
according to an AICC evaluation as the second model term will not provide a
benefit to the model over just having the first model term alone Therefore under
Rule 5 entry 3 would be disallowed and not progress onto the model evaluation
stage thereby saving computational resources on this redundant model When
all rules are enforced including Rule 5 the total number of evaluations for the
model system is 98725
Final considerations for model generation
Other considerations were also made when compiling models in the
model generation stage specifically referring to the allowed orders of particular
species For catalytic species the allowed orders were determined to be 05 1
and 2 This is because the order in a catalytic species of a system being greater
than gt2 or =15 are too rare to warrant serious consideration and would incur a
significantly greater computational expense to evaluate all of the generated
models
136
Much thought was exercised as to whether a zero-order dependence on
a catalyst is possible as this discussion is missing from the literature and general
teaching It can be postulated that since the presence of a catalyst allows a more
favourable lower energy pathway there must therefore be some dependence on
the concentration of the catalyst for this lower energy pathway to progress This
rationalisation infers that it is not possible for a zero-order dependence of
catalyst but there may always be selected cases where this can be empirically
true In any case if a zero-order dependence of catalyst is possible it is too
unlikely to warrant serious consideration as this would generate many more
models to be evaluated
For non-catalytic systems this approach attempts to build reaction
models from base-level elementary reactions (where the both the stoichiometry
and order of participating species are 1 for each occurrence of the species in
the reaction scheme) However there are two notable exceptions 0 and 05
orders which are inherently more empirical in nature A zero-order dependence
on a particular species in this approach will still have a stoichiometry of 1
whereby one molecule of this species is consumed in the reaction but the
reaction rate does not depend upon its concentration A 05 order dependence
will have both a stoichiometry of 05 and an order of 05 There are many other
integer and non-integer empirical dependencies of varying stoichiometry and
order that are possible in complex chemical reaction networks (CRNs) However
these dependencies are very rare and not common enough to warrant serious
consideration for this computational approach as this would generate many more
models to proceed into model evaluation resulting in a much higher
computational expense Therefore reactions are only considered for model
generation with species that have orders in the rate laws of 0 05 or 1
423 Overview
This updated computational approach to kinetic model selection and
parameter identification was developed in MATLAB by adjusting the previously
developed tool reported in Chapter 2 and Chapter 3 Firstly the user inputs
experimental data and the participating species into the system The approach
identifies all possible reactions that can happen based on mass balance then
generates all conceivable rate laws subject to basic chemical intuition in the
inflation step (and subject to the user defining a catalytic species) Every
137
combination of these rate laws are then compiled into different reaction models
followed by logical rule enforcements to remove vast numbers of redundant or
wasteful models All remaining models are sequentially loaded then kinetic
parameters are optimised to increase convergence of ordinary differential
equation (ODE) curves to the experimental data Finally each model is then
statistically evaluated and ranked highlighting the most likely model based on
the experimental data supplied The approach overview is highlighted in Figure
42
Figure 42 An overview of the updated computational approach to kinetic model and
parameter determination
This updated methodology represents a significantly improved automatic
tool for process development by comprehensively evaluating every possible
model without the need for chemical intuition or more importantly chemistsrsquo
time This approach has been upgraded to allow both catalytic reactions and
reactions with non-integer orders to be identified therefore vastly expanding its
scope However it is still important to note that although this tool is powerful it
is ultimately data-driven and subsequently must only be used as a
complementary tool Therefore after all model evaluations the tool must still be
138
used in conjunction with real chemical intuition by an end user to determine that
the models identified as most likely are accurate and consistent with the science
43 Simulated verifications of the approach
In the same manner as the previous methodology it is first important to
verify that the approach identifies the correct models and kinetic parameters
before conducting any real experimentation Several simulated case studies
were conducted that feature different true kinetic models showing how this
methodology has been adapted to identify catalytic speciesrsquo orders as well as
non-integer and zero order species dependencies in chemical systems These
case studies feature reactions from the literature whereby simulated
experimental data is generated from known models and kinetic parameters
To simulate the experimental data as shown in Chapter 23 the true
model and kinetic parameters reported in the literature source are inputted into
MATLAB The experiments are then simulated at particular temperatures and
initial sets of concentrations by using an ODE solver to evaluate the change in
species concentrations over a given experimental timeframe Individual data
points are then extracted from this timeframe which then represent experimental
data points for the simulated case study Up to plusmn 2 relative error is then added
to each measurement to approximate this simulated data more closely to real
experimental data
431 Case study SNAr kinetics
The first simulated case study was the SNAr reaction described in Scheme
42 where 24-difluoronitrobenzene (starting material SM) 45 reacts with
pyrrolidine 46 to form either the ortho-substituted product 47 or the para-
substituted product 48 - both of which can then react further with pyrrolidine to
form the bis-substituted product 49 and form hydrofluoric acid 410 as a
byproduct in each step[225] This case study features lsquosimplersquo elementary
reactions in the true model as there are no non-integer or zero order
dependencies However this scenario is still important to study as the new
approach must still be able to correctly identify model structures and kinetic
parameters of systems that feature only these elementary reactions In this case
both the old approach and the new approach were run in order to determine if
139
they both arrive at the same identified model as they should This should confirm
that even in a multicomponent process the new approach will still identify the
correct elementary reactions instead of substituting non-integer or zero order
rate laws
Scheme 42 The reaction of 24-difluoronitrobenzene 45 with pyrrolidine 46 to form the
ortho-substituted product 47 and the para-substituted product 48 Consecutive
reactions then occur to form the bis-substituted product 49 In each reaction
hydrofluoric acid 410 is formed[225]
4311 Data acquisition
The multistep SNAr reaction model reported by Hone et al consists of 4
second-order reactions These reactions were used to generate the ODEs
shown in eqn 41 - 46 The reported kinetic constants for these three steps
were
bull Step one k90 degC = 0579 M-1 s-1 Ea = 333 kJ mol-1
bull Step two k90 degC = 0027 M-1 s-1 Ea = 353 kJ mol-1
bull Step three k90 degC = 0009 M-1 s-1 Ea = 389 kJ mol-1
bull Step four k90 degC = 0016 M-1 s-1 Ea = 448 kJ mol-1
Five simulated data sets were generated at 30 degC by using eqn 27 to calculate
k values with the following initial concentrations
bull 1 M SM 45 11 M pyrrolidine 46 0 M ortho-substituted product 47 0
M para-substituted product 48 0 M bis-substituted product 49 and 0 M
hydrofluoric acid 410
140
bull 08 M SM 45 15 M pyrrolidine 46 0 M ortho-substituted product 47
0 M para-substituted product 48 0 M bis-substituted product 49 and 0
M hydrofluoric acid 410
bull 1 M SM 45 2 M pyrrolidine 46 0 M ortho-substituted product 47 0 M
para-substituted product 48 0 M bis-substituted product 49 and 0 M
hydrofluoric acid 410
bull 1 M SM 45 25 M pyrrolidine 46 0 M ortho-substituted product 47 0
M para-substituted product 48 0 M bis-substituted product 49 and 0 M
hydrofluoric acid 410
bull 12 M SM 45 3 M pyrrolidine 46 0 M ortho-substituted product 47 0
M para-substituted product 48 0 M bis-substituted product 49 and 0 M
hydrofluoric acid 410
119889[120786 120787]
119889119905= minus1198961[120786 120787][120786 120788] minus 1198962[120786 120787][120786 120788] eqn 41
119889[120786 120788]
119889119905= minus1198961[120786 120787][120786 120788] minus 1198962[120786 120787][120786 120788] minus 1198963[120786 120789][120786 120788]
minus 1198964[120786 120790][120786 120788]
eqn 42
119889[120786 120789]
119889119905= 1198961[120786 120787][120786 120788] minus 1198963[120786 120789][120786 120788] eqn 43
119889[120786 120790]
119889119905= 1198962[120786 120787][120786 120788] minus 1198964[120786 120790][120786 120788] eqn 44
119889[120786 120791]
119889119905= 1198963[120786 120789][120786 120788] + 1198964[120786 120790][120786 120788] eqn 45
119889[120786 120783120782]
119889119905= 1198961[120786 120787][120786 120788] + 1198962[120786 120787][120786 120788]
+1198963[120786 120789][120786 120788] + 1198964[120786 120790][120786 120788]
eqn 46
2 relative error was then added to each data point in these simulated
data sets then used as the inputted experimental data for both the old and new
computational approach These data sets can be found in Chapter 741
4312 Results and discussion
As the initial ILP optimisation proceeds in the same manner for both the
old and new approaches the mass-balance-allowed reactions identified in each
case are the same It is only the subsequent rate laws and models that differ in
141
the model generation steps between the old and new approaches From the 6
species inputted there are 16 mass-balance-allowed reactions that were
identified shown in eqn 47 - 422
48 rarr 47 eqn 47
47 rarr 48 eqn 48
45 + 46 rarr 47 + 410 eqn 49
47 + 410 rarr 45 + 46 eqn 410
45 + 49 rarr 47 + 47 eqn 411
45 + 46 rarr 48 + 410 eqn 412
46 + 47 rarr 49 + 410 eqn 413
47 + 47 rarr 45 + 49 eqn 414
49 + 410 rarr 46 + 48 eqn 415
48 + 410 rarr 45 + 46 eqn 416
46 + 48 rarr 49 + 410 eqn 417
45 + 49 rarr 47 + 48 eqn 418
45 + 49 rarr 48 + 48 eqn 419
49 + 410 rarr 46 + 47 eqn 420
47 + 48 rarr 45 + 49 eqn 421
48 + 48 rarr 45 + 49 eqn 422
Old approach
When running the old approach every combination of the 16 identified
mass-balance-allowed transformations was constructed resulting in 65535
unique models to be evaluated All of these resulting models were evaluated by
the approach which incurred a computation time of 13 hours (see Chapter 762
for details on computer specifications)
Each of these models were ranked based on their AICC evaluation and it
was found that the highest ranked model was also the correct model with kinetic
parameters optimised to values that were very close to the literature values used
to generate the data As with previous simulations described in Chapter 23 the
142
optimisation is assumed to be correct as the error in the fitted parameters is
negligible considering that artificial error was added to the data set The top five
performing models are shown in Table 42 where the optimised k values are
shown as well as their corresponding SSE and AICC values
Table 42 A table showing the top five ranked models for the SNAr case study as identified by
the old approach The kinetic parameters for each reaction within the model are shown
as well as the SSE and AICC evaluation
Model
rank Model kx M-1 min-1 SSE M AICC
1
45 + 46 rarr 47 + 410
45 + 46 rarr 48 + 410
47 + 46 rarr 49 + 410
48 + 46 rarr 49 + 410
00656
00026
00007
00008
00040 -30627
2
45 + 46 rarr 47 + 410
45 + 46 rarr 48 + 410
47 + 46 rarr 49 + 410
48 + 46 rarr 49 + 410
45 + 49 rarr 47 + 48
49 + 410 rarr 46 + 48
00657
00026
00007
00010
00065
lt00001
00039 -30125
3
45 + 46 rarr 47 + 410
45 + 46 rarr 48 + 410
47 + 46 rarr 49 + 410
48 + 48 rarr 49 + 45
00657
00027
00007
00174
00044 -30097
4
45 + 46 rarr 47 + 410
45 + 46 rarr 48 + 410
47 + 46 rarr 49 + 410
48 + 46 rarr 49 + 410
45 + 49 rarr 47 + 48
00663
00028
00007
00010
00026
00042 -30053
5
45 + 46 rarr 47 + 410
45 + 46 rarr 48 + 410
47 + 46 rarr 49 + 410
48 + 46 rarr 49 + 410
00655
00026
00007
00009
00041 -29946
143
45 + 49 rarr 47 + 47
45 + 49 rarr 48 + 48
00143
00065
New approach
When running the new approach all allowed combinations of the mass-
balance-allowed reactions and corresponding non-integer and zero order rate
laws were compiled subject to the rules described earlier in Chapter 422 This
model generation resulted in 141505 unique models to be evaluated by the
approach which incurred a 28 hour computation time (see Chapter 762 for
details on computer specifications)
Each of these models were ranked based on their AICC and it was found
that the highest ranked model was also the correct model with kinetic
parameters optimised to values that were very close to the literature values that
were used to generate the data As highlighted in the old approach section the
optimisation is assumed to be correct as the error in the fitted parameters is
negligible considering that artificial error was added to the dataset The top five
performing models from this new approach are shown in Table 43 where the
optimised k values are shown as well as their corresponding SSE and AICC
values
Table 43 A table showing the top five ranked models for the SNAr case study as identified by
the new approach The kinetic parameters for each reaction within the model are shown
as well as the SSE and AICC evaluation α denotes a variable molar dependence within
the kinetic parameter units depending on the rate law
Model
rank Model kx Mα min-1 SSE M AICC
1
45 + 46 rarr 47 + 410
45 + 46 rarr 48 + 410
47 + 46 rarr 49 + 410
48 + 46 rarr 49 + 410
00656
00026
00007
00008
00040 -30627
2
45 + 46 rarr 47 + 410
46 + 47 rarr 49 + 410
480 rarr 47
47 rarr 48
00680
00007
00501
00394
00042 -30333
144
3
45 + 46 rarr 47 + 410
45 + 46 rarr 48 + 410
47 + 46 rarr 49 + 410
48 + 48 rarr 49 + 45
00657
00027
00007
00174
00044 -30097
4
45 + 46 rarr 47 + 410
45 + 46 rarr 48 + 410
47 + 46 rarr 49 + 410
48 + 41005 rarr 45 + 46
00640
00024
00007
00008
00061 -28521
5
45 + 46 rarr 47 + 410
47 + 46 rarr 49 + 410
47 rarr 48
48 rarr 47
00670
00007
00041
00997
00065 -28276
Discussion
This initial simulated case study has shown that it is still possible to identify
the correct reaction model and kinetic parameters with this new approach for a
lsquosimplersquo reaction system featuring a first-order dependencies on all species The
most-likely identified model and corresponding SSEAICC values were the
same in this instance for both the old and new approach which is to be expected
if the new approach is functioning correctly As shown in the old approach there
are models that have a greater convergence to the experimental data (and hence
a lower SSE) but the statistical analysis correctly assigns these models an
unfavourable AICC based on their extra (insignificant) model terms However as
the initial limit of 4 terms in a model is enforced in the new approach it can be
determined by the user that compiling and evaluating the 5-term-models is not
required based on the marginal possible SSE benefits These small benefits are
very unlikely to warrant extra terms based on AICC evaluation as the
convergence to experimental data is already excellent meaning that the model
identified is very likely to be correct An example kinetic plot showing the fit of
the identified model to the experimental data is shown in Figure 43 - this is the
fifth simulated experiment where the starting concentrations were 12 M 24-
difluoronitrobenzene and 3 M pyrrolidine at 30 degC
145
Figure 43 The fit of the identified model and kinetic parameters to the generated experimental
data with starting concentrations of 12 M 24-difluoronitrobenzene and 3 M pyrrolidine at
30 degC Where x = 24-difluoronitrobenzene x = ortho-substituted product x = para-
substituted product x = bis-substituted product mdash = 24-difluoronitrobenzene (ODE) mdash
= ortho-substituted product (ODE) mdash = para-substituted product (ODE) mdash = bis-
substituted product Plot only shown to 500 minutes to the show curvature of the initial
data points
It has been shown that the new approach can identify the correct model
and kinetic parameters for a multistep process with first-order dependencies on
all species with the same accuracy as expected from the old approach
Therefore it is now possible to confidently move on to simulated case studies
where rate laws are more complex featuring catalytic reactions and orders that
are non-integer or zero
432 Case study Pentyne kinetics
This simulated case study features a chemical system that reacts with a zero-
order dependence on one of the species[241] The starting material 411 reacts
with the spirodiene 412 to form the product 413 and LiBr 414 as shown in
Scheme 43 The true rate law however shows a first-order dependence on the
starting material and a zero-order dependence on the spirodiene Interestingly
this reaction order has been used as evidence for the existence of a pentyne
species as this order suggests an initial reaction of the starting material to form
146
a much more reactive species leading to the zero-order dependence on the
spirodiene
Scheme 43 The reaction of the starting material 411 with the spirodiene 412 to form the
product 413 and LiBr 414[241]
4321 Data acquisition
The overall first-order reaction model reported by Gilbert et al[241] was used
to generate the ODEs shown in eqn 423 - 426 Three isothermal simulated
data sets were generated using these ODEs with the k value of 000846 min-1 at
-78 degC with the following initial concentrations
bull 1 M 2-bromocyclopentenyl lithium (starting material) 411 08 M
spirodiene 412 0 M product 413 0 M LiBr 414
bull 12 M 2-bromocyclopentenyl lithium (starting material) 411 15 M
spirodiene 412 0 M product 413 0 M LiBr 414
bull 1 M 2-bromocyclopentenyl lithium (starting material) 411 1 M
spirodiene 412 0 M product 413 0 M LiBr 414
119889[120786 120783120783]
119889119905= minus1198961[120786 120783120783] eqn 423
119889[120786 120783120784]
119889119905= minus1198961[120786 120783120783] eqn 424
119889[120786 120783120785]
119889119905= 1198961[120786 120783120783] eqn 425
119889[120786 120783120786]
119889119905= 1198961[120786 120783120783] eqn 426
2 relative error was then added to these simulated data sets then used
as the inputted experimental data for the computational approach These data
sets can be found in Chapter 742
4322 Results and discussion
147
From these 3 species there are 2 mass-balance-allowed reactions that
can be identified shown in eqn 427 and eqn 428 From these two reactions
the corresponding rate laws were generated and all models were compiled
subject to the rules defined in Chapter 422 - this resulted in 30 unique models
to be evaluated by the approach
411 + 412 rarr 413 + 414 eqn 427
413 + 414 rarr 411 + 412 eqn 428
All 30 models were evaluated by the computational approach incurring a
computation time of around lt1 minute (see Chapter 761 for details on computer
specifications) Each of these models were ranked based on their AICC and it
was found that the highest ranked model was also the correct model with kinetic
parameters optimised to values that were very close to the generated values
The top five performing models are shown in Table 44 where the optimised k
values are shown as well as their corresponding SSE and AICC values
Table 44 A table showing the top five ranked models for the pentyne case study as identified
by the new approach The kinetic parameters for each reaction within the model are
shown as well as the SSE and AICC evaluation α denotes a variable molar dependence
within the kinetic parameter units depending on the rate law
Model
rank Model kx Mα min-1 SSE M AICC
1 411 + 4120 rarr 413 + 414 00085 00046 -134903
2 411 + 4120 rarr 413 + 414
413 + 414 rarr 411 + 412
00085
lt00001 00046 -132515
3 411 + 4120 rarr 413 + 414
413 + 41405 rarr 411 + 412
00085
lt00001 00046 -132515
4 411 + 4120 rarr 413 + 414
4130 + 414 rarr 411 + 412
00085
lt00001 00046 -132514
5 411 + 4120 rarr 413 + 414
413 + 4140 rarr 411 + 412
00085
lt00001 00046 -132514
Interestingly all five of these top-ranked models all have the same SSE
values and ranks 2 - 5 all have very similar AICC evaluations It is clear from
these models that the primary reason that they score highly is due to the
148
presence of the true model term 411 + 4120 rarr 413 + 414 One extra model
term is present that is rendered negligible but as the algorithm is forced to fit it
it is fitted with a value lt00001 In the old approach these negligible reactions
could be found but not repeated whereas in the new approach every variation
of the rate law of a particular negligible reaction can be repeated and score highly
according to AICC
Nonetheless the highest ranked model according to the approach is the
true kinetic model and the corresponding k value was also identified correctly
This case study shows that it is possible for the approach to identify models that
feature reactions that do not have typical species order dependencies of 1
therefore also that it can be used for real experimentation featuring zero or non-
integer order model terms An example kinetic plot showing the fit of the identified
model to the simulated experimental data is shown in Figure 44 - this is the first
experiment where the starting concentrations were 1 M starting material and 08
M spirodiene at -78 degC
149
Figure 44 The fit of the identified model and kinetic parameters to the generated experimental
data with starting concentrations of 1 M starting material and 08 M spirodiene at -78 degC
Where x = starting material x = spirodiene x = product mdash = starting material (ODE) mdash
= spirodiene (ODE) mdash = product (ODE)
433 Case study Ytterbium catalysis
The final simulated case study involves a ytterbium catalysed reaction
with lsquonon-normalrsquo empirical rate laws[242] 1-Phenyl-2-trimethylsilylacetylene
(starting material) 415 reacts with diphenylphosphine 416 in the presence of
a ytterbium catalyst ([Yb(η2-Ph2CNPh)(hmpa)3]) 417 to form the product 418
as shown in Scheme 44
Scheme 44 The reaction of the starting material 415 with diphenylphosphine 416 in the
presence of the ytterbium catalyst 417 to form the product 418 where [Yb] Yb(η2-
Ph2CNPh)(hmpa)3[242]
4331 Data acquisition
The complex order dependencies for the reaction model reported by Takaki
et al[242] consists of 1 reaction that was used to generate the ODEs shown in
eqn 429 - 432 In the true empirical rate law the order in the starting material
is 1 the order in diphenylphosphine is 0 and the order of the ytterbium catalyst
is 2 Four isothermal simulated data sets were generated at 25 degC using these
ODEs with the k value of 9324 M2 h-1 with the following initial concentrations
bull 2 M starting material 415 2 M diphenylphosphine 416 02 M ytterbium
catalyst 417 0 M product 418
bull 15 M starting material 415 2 M diphenylphosphine 416 01 M
ytterbium catalyst 417 0 M product 418
bull 14 M starting material 415 18 M diphenylphosphine 416 03 M
ytterbium catalyst 417 0 M product 418
bull 22 M starting material 415 16 M diphenylphosphine 416 025 M
ytterbium catalyst 417 0 M product 418
119889[120786 120783120787]
119889119905= minus119896 [120786 120783120787][120786 120783120789]2 eqn 429
150
119889[120786 120783120788]
119889119905= minus119896 [120786 120783120787][120786 120783120789]2 eqn 430
119889[120786 120783120789]
119889119905= minus2119896 [120786 120783120787][120786 120783120789]2 + 2119896 [120786 120783120787][120786 120783120789]2 eqn 431
119889[120786 120783120790]
119889119905= 119896 [120786 120783120787][120786 120783120789]2 eqn 432
2 relative error was then added to these simulated data sets then
used as the inputted experimental data for the computational approach These
data sets can be found in Chapter 721
4332 Results and discussion
Based on the inputs of the molecular weights for this system there are
two mass-balance-allowed reactions However as it is known that this is a
catalytic system these two reactions must be facilitated by the user-defined
ytterbium catalyst 417 shown in eqn 433 and 434 It is then the role of the
approach to identify all combinations of allowed reactions and rate laws to
determine which is the most likely model
415 + 416 120786120783120789rarr 418 eqn 433
415 + 416 120786120783120789rarr 418 eqn 434
After the model generation stage 105 models were identified and
evaluated by the computational approach incurring a time of around 1 minute
(see Chapter 762 for details on computer specifications) Each of these models
were ranked based on their AICC and it was found that the highest ranked model
was also the correct model with the k value optimised to a value that was very
close to the value used for data generation The top five performing models are
shown in Table 45 where the optimised k values are shown as well as their
corresponding SSE and AICC values
Table 45 A table showing the top five ranked models for the ytterbium catalysis case study as
identified by the new approach The kinetic parameters for each reaction within the
model are shown as well as the SSE and AICC evaluation α denotes a variable molar
dependence within the kinetic parameter units depending on the rate law
Model
rank Model kx Mα h-1 SSE M AICC
1 415 + 4160 4172
rarr 418 93191 928 x 10-4 -24138
151
2
415 + 4160 4172
rarr 418
418 41705
rarr 415 + 416
93191
lt00001 928 x 10-4 -23910
3
415 + 4160 4172
rarr 418
418 4171
rarr 415 + 416
93191
lt00001 928 x 10-4 -23910
4
415 + 4160 4172
rarr 418
418 4172
rarr 415 + 416
93191
lt00001 928 x 10-4 -23910
5 415 + 416 4172
rarr 418 80784 11549 -1335
As in the previous pentyne case study four of these top-ranked models
all have the same SSE values and ranks 2 - 4 all have very similar AICC
evaluations The reasoning for this appears to be the same as previously
discussed where the primary reason that they score highly is due to the
presence of the true model term 415 + 4160 4172
rarr 418 One extra model term
is present in ranks 2 - 4 that the algorithm is forced to fit although it does not
provide any significance to the model hence it is fitted with a value lt00001
Nonetheless the highest ranked model according to the approach is the
true kinetic model and the corresponding k value was also identified correctly
This case study shows not only that it is possible to identify models that feature
catalytic species but also that the orders of the catalytic and non-catalytic
species can be identified As a lsquotypicalrsquo catalytic example is more likely to be first-
order with respect to all species the ability that the approach has shown to
identify non-normal order dependencies in the rate law for multiple species
inspires confidence that the approach will be successful in its use in real
experimentation An example kinetic plot showing the fit of the identified model
to the simulated experimental data is shown in Figure 45 - this is the second
experiment where the starting concentrations were 15 M starting material 2 M
diphenylphosphine and 01 M ytterbium catalyst at 22 degC
152
Figure 45 The fit of the identified model and kinetic parameters to the generated experimental
data with starting concentrations of 15 M starting material 2 M diphenylphosphine and
01 M ytterbium catalyst at 22 degC Where x = starting material x = diphenylphosphine x
= product mdash = starting material (ODE) mdash = diphenylphosphine (ODE) mdash = product
(ODE)
44 Conclusion
It has been shown that the previously built computational approach to
kinetic modelling can be adapted to catalytic systems and rate laws with non-
normal order dependencies This new approach has been proven to work
successfully for three simulated case studies featuring different modelling
criteria with sets of experimental data inputs with artificial errors The success
shown from these studies inspires confidence that the approach can be
implemented with real experimental data
The scope of the approach has increased substantially following the
improvements in this work and can now be used for many more chemical
applications However due to the comprehensive nature of the approach the
computational expense has also increased as there are many more reactions
that must be considered when building reaction models This computational
stress as before can be reduced by replacing existing computer hardware with
more computer logical cores - this is because the code is highly parallelised and
153
the speed of the approach is directly proportional to the number of computer
cores available Although the approach is very powerful this computational
expense may still be cumbersome for desktop computers depending on the
number of species involved in a particular chemical system However as time
passes processing technology consistently improves and there will undoubtedly
be a time where millions of models can be evaluated at a desk in a matter of
hours via comprehensive methodologies such as this
This comprehensive approach to kinetic model and parameter
determination has been shown to be successful in simulated case studies - the
next step is to prove the efficiency of this methodology with real experimental
case studies The aim of these case studies is to show that this approach can
correctly identify models of various-complexity chemical processes thereby
realising the main aim of this project in developing an automated kinetic analysis
tool with a wide scope for process development
Chapter 5 Experimental applications of the new approach
51 Introduction
With the development of the new computational approach complete and
verified with multiple simulated case studies the viability of the approach for real
experimental data must also be tested Real experimental case studies are to be
conducted to measure the ability of this new and final computational approach
As the scope of this new approach has been broadened to include
catalytic reactions and species order dependencies of zero or 05 it is important
to study chemical systems that may exhibit these properties to prove that the
new approach can identify these models It is also important that the approach
can continue to identify more lsquosimplersquo models that have species order
dependencies of 1 as well as utilise kinetic data from any means This is
because the kinetic motifs often cannot be determined a priori and the beneficial
feature of this methodology is that models are identified and ranked according to
statistical measures This removes bias and therefore considers all rate laws for
every possible model meaning that the approach does not know initially if a
154
model is supposed to contain a zero order term or not for example and will only
determine this after the comprehensive model evaluations
Experimental case studies from any reaction process (batch flow etc)
and analytical technique (HPLC NMR etc) will be used in these final
experimental verifications These case studies will prove that the approach can
identify models including lsquonormalrsquo zero or 05 species order dependencies for
both catalytic and non-catalytic processes The research project aim will thereby
be realised by ultimately developing a powerful automated methodology to be
used in process development for the modelling of real chemical systems
52 Case study SNAr kinetics
The first reaction system explored using the new computational approach
was the presupposed model of the reaction of 246-trichloropyrimidine (SM) 51
with ethyl 4-aminobutanoate 52 to form the major 2-substituted SNAr product
53 and the minor 4-substituted SNAr product 54 as shown in Scheme 51 As
the ethyl 4-aminobutanoate is present in its hydrochloride salt the hydrochloric
acid present (and generated from subsequent SNAr reactions as 55) is
neutralised by an excess of triethylamine
Scheme 51 The reaction of 246-trichloropyrimidine (SM) 51 with ethyl 4-aminobutanoate
52 to form the major 2-substituted SNAr product 53 and the minor 4-substituted SNAr
product 54
As the desired major product from this reaction can be further reacted to
synthesise bioactive derivatives of pharmaceuticals[243 244] this initial
transformation is of interest in the process development of these molecules A
collaborator in the Spring group at Cambridge University Hikaru Seki has a
particular interest in these bioactive molecules for his research project and
155
wanted to maximise the synthetic yield of the 2-substituted SNAr product 53 by
obtaining kinetic understanding of the system Therefore all practical
experimental work in this case study was conducted by Hikaru Seki at Cambridge
University then the results were forwarded to Leeds for kinetic analysis
Four kinetic experiments were conducted at -25 degC 0 degC 25 degC and 50
degC with three replicate experiments at 25 degC Each experiment was conducted
in batch in an NMR tube within a 500 MHz NMR spectrometer which allowed
continuous NMR acquisition at a rate of approximately one sample per 80
seconds This continuous reaction monitoring generates a large data density for
the subsequent kinetic analysis using the new computational approach by
monitoring the proton peaks of the individual species shown in Figure 51 Full
experimental details can be found in Chapter 751
Figure 51 The distinctive proton peaks shown in red that are monitored via NMR as time
progresses in the SNAr case study
Based on the five species identified there were six reactions that were
calculated to be possible based on mass balance - these reactions are shown
as eqn 51 - 56 From these reactions all corresponding rate laws were
generated and all models were compiled subject to the rules defined in Chapter
422 This resulted in 3320 unique models to be evaluated by the approach
53 rarr 54 eqn 51
54 rarr 53 eqn 52
51 + 52 rarr 53 + 55 eqn 53
53 + 55 rarr 51 + 52 eqn 54
51 + 52 rarr 54 + 55 eqn 55
54 + 55 rarr 51 + 52 eqn 56
All 3320 models were evaluated by the computational approach incurring
a computation time of around 9 hours (see Chapter 761 for details on computer
156
specifications) Each of these models were then ranked based on their AICC
evaluation and it was found that the most likely representation of the system is
the model shown in Scheme 51 with lsquotypicalrsquo first-order species dependencies
in the rate laws The approach also determined the kinetic parameters of the
transformation to the major product k25 degC = 0499 plusmn 0006 M-1 min-1 Ea = 4419
plusmn 057 kJ mol-1 and to the minor product k25 degC = 0384 plusmn 0009 M-1 min-1 Ea =
3657 plusmn 088 kJ mol-1 This model and the corresponding kinetic parameters
allowed a fit to the experimental data with an average residual of less than 26 x
10-4 M and is shown in Figure 52 The top 5 ranked models are shown in Table
51 with their respective SSE error metric and AICC evaluation
Figure 52 Kinetic profiles for four kinetic experiments at -25 degC 0 degC 25 degC and 50 degC where
= starting material = 2-substituted product = 4-substituted product mdash = starting
material (ODE) mdash = 2-substituted product (ODE) mdash = 4-substituted product (ODE) See
Chapter 751 for full experimental conditions and raw data
Table 51 Evaluation of the feasibility of each reaction model for the SNAr case study where α
is variable for each model depending on the overall model order
Rank Reaction Model
Kinetic parameters
SSE
103 M AICC k25 degC Mα
min-1 Ea kJ mol-1
1 51 + 52 rarr 53 + 55 0499 4419 1614 -5191
157
51 + 52 rarr 54 + 55 0384 3657
2 51 + 52 rarr 53 + 55
51 + 5205 rarr 54 + 55
0407
0073
4061
3101 3723 -4857
3 51 + 52 rarr 53 + 55
510 + 52 rarr 54 + 55
0466
0017
4225
2756 3777 -4851
4 51 + 52 rarr 53 + 55
51 + 520 rarr 54 + 55
0466
0017
4225
2756 3777 -4729
5 51 + 5205 rarr 53 + 55
51 + 52 rarr 54 + 55
0092
0298
3806
3227 5127 -4664
It is clear from the kinetic plots that the fit of the ODEs to the experimental
data do not result in normally-distributed residuals This could be for one of many
reasons but is most likely due to either errors in producing the correct
concentration of amine 52 or NMR integrations errors or evaporation of solvent
(CD3OD) into the headspace at higher temperatures This must be considered
by a trained chemist upon completion of the computational approach and this is
an example showing that this methodology must be used in conjunction with
chemical expertise to confirm the approach output In this case however the
residuals are only a small consideration and it can be observed that the model
still fits the experimental data well so the identified model is still valid
This first experimental case study has shown that the new approach can
correctly identify the reaction model and kinetic parameters even when
considering a multitude of differing rate laws In this case it was found that each
the rate laws featured first-order dependencies on each of the species which is
common in chemical processes This kinetic information can then be used to
optimise this process for the highest yields of the 2-substituted (major) product
53 for our collaboratorrsquos research project which can then be used as a building
block for bioactive materials
53 Case study PfBr
The next case study that was explored was a chemical system featuring
a protection of an amino acid for further functionalisation where alanine methyl
158
ester (Al-Me) 56 reacts with 9-bromo-9-phenylfluorene (PfBr) 57 to form the
protected amino acid (Pf-Al-Me) 58 and hydrobromic acid 59 as a side-
product as shown in Scheme 52 The alanine methyl ester is present in its
hydrochloride salt form so this hydrochloric acid and the formation of
hydrobromic acid are both neutralised by an excess of suspended potassium
phosphate
Scheme 52 The reaction of alanine methyl ester (Al-Me) 56 with PfBr 57 to form the
protected amino acid 58 Hydrobromic acid 59 is also generated as a side product
PfBr is the reagent to introduce the 9-phenylfluorene (Pf) protecting group
in a synthesis Pf is a pharmaceutically relevant and bulky protecting group that
can be introduced as a more acid stable alternative to the more commonly used
trityl protecting group[245 246] The chemical system of interest is the protection
step in the total synthesis of (S)-eleagnine from L-alanine as shown in Scheme
53 as a retrosynthetic methodology[247] Understanding this transformation by
performing kinetic analysis would therefore accelerate process development
when scaling up this process
Scheme 53 The retrosynthetic methodology of the transformation of L-alanine to (S)-
eleagnine via the Pf-protected alanine methyl ester (Pf-Al-Me)[247]
Due to the high cost of PfBr as a starting material (pound137 for 5 g)[248] PfBr
was synthesised from cheaper materials as it was unknown how much would be
necessary for kinetic analysis Bromobenzene 510 was initially treated with
magnesium then reacted with fluorenone 511 to make the intermediate PfOH
512 PfOH was then isolated and reacted with hydrobromic acid to form the
desired PfBr product as shown in Scheme 54[249] The most expensive material
159
in the synthesis of this PfBr product is fluorenone costing pound76 for 500 g resulting
in a much cheaper method to obtaining this desired material[250] This reaction
was carried out on a 40 g scale and full experimental details can be found in
Chapter 7521 As there was an absence of an OH peak from the IR spectrum
of PfBr the PfBr material was analysed by HPLC and the purity was determined
to be gt99 With pure PfBr as a starting material the kinetic case study was
then possible to begin
Scheme 54 The synthetic route from cheap starting materials bromobenzene 510 and
fluorene 511 to the intermediate PfOH 512 and finally the desired PfBr material 58
Three experiments were conducted in a three-neck round bottomed flask
at 30 degC 35 degC and 40 degC Samples (05 mL) were extracted manually from the
bulk reaction medium with a syringe followed by syringing approximately 03 mL
of water and shaking the syringe - this dissolves the suspended potassium
phosphate and allows injection into the sample loop for analysis via HPLC The
batch setup for experimentation is shown in Figure 53
160
Figure 53 The batch setup for experimentation in the PfBr case study where the temperature
probe is submerged in the reaction medium that is heated via a heater stirrer
After all experiments were run the experimental data and the identified
species were inputted into the new approach Based on these four species there
were two feasible reactions calculated - these reactions are shown as eqn 57
and eqn 58 From these reactions all corresponding rate laws were generated
and all models were compiled subject to the rules defined in Chapter 422 This
resulted in 30 unique models to be evaluated by the approach
56 + 57 rarr 58 + 59 eqn 57
58 + 59 rarr 56 + 57 eqn 58
All 30 models were evaluated by the new computational approach
incurring a computation time of less than 2 minutes (see Chapter 761 for details
on computer specifications) Each of these models were then ranked based on
their AICC evaluation and it was found that the most likely representation of the
system is the model shown in Scheme 52 but with a zero-order dependence on
the alanine methyl ester in the rate law This makes sense chemically as the
bulky aromatic rings would stabilise the cation formed if the reaction were to
proceed via a traditional SN1 mechanism this means that the rate-determining-
161
step is likely to be the loss of the bromide ion followed by a fast reaction with the
alanine methyl ester The approach also determined the kinetic parameters of
this transformation as k35 degC = 106 x 10-2 plusmn 001 x 10-2 min-1 Ea = 6291 plusmn 023
kJ mol-1 This model and the corresponding kinetic parameters allowed a fit to
the experimental data with an average residual of 26 x 10-4 M and is shown in
Figure 54 in a combined plot The top 5 ranked models are shown in Table 52
with their respective SSE error metrics and AICC evaluations
Figure 54 Kinetic profiles for three kinetic experiments at 30 degC 35 degC and 40 degC where red
plots indicate PfBr concentrations and blue plots indicate Pf-Al-Me concentrations At 30
degC = experimental data mdash = ODE At 35 degC = experimental data - - - = ODE At
40 degC = experimental data = ODE See Chapter 752 for full experimental
conditions and raw data
Table 52 Evaluation of the feasibility of each reaction model for the PfBr case study where α
is variable for each model depending on the overall model order
Rank Reaction Model
Kinetic parameters
SSE
10-5 M AICC k35 degC Mα min-
1
Ea kJ mol-
1
1 560 + 57 rarr 58 + 59 00106 6291 351 -23815
2 560 + 57 rarr 58 + 59
58 + 5905 rarr 56 + 57
00115
00144
6709
7000 276 -23805
3 560 + 57 rarr 58 + 59
58 + 590 rarr 56 + 57
00129
00034
6527
7000 276 -23804
4 560 + 57 rarr 58 + 59 00128 6571 281 -23764
162
580 + 59 rarr 56 + 57 00057 7000
5 560 + 57 rarr 58 + 59
5805 + 59 rarr 56 + 57
00112
00167
6606
7000 295 -23654
Interestingly the top 5 ranked models all feature the main lsquoimportantrsquo
model term of 560 + 57 rarr 58 + 59 with models 2 - 5 also featuring some
variant of the reversible reaction This is a similar outcome to the simulated
pentyne kinetics case study in Chapter 432 In this experimental case however
the reversible reaction should be very unlikely as the hydrobromic acid is
removed by the excess potassium phosphate present It can be concluded
therefore that these extra model terms are just fitting to the experimental noise
especially as the magnitude of the SSE metrics are so low
It has been shown in this case study that the new computational approach
can correctly identify the reaction model and kinetic parameters of a system
where there is a zero-order dependency on one of the species This is the first
instance of an identified model featuring non-first-order rate laws in a real
chemical process and further proves the broadened applicability of the new
approach as a kinetic analysis tool This kinetic information can then be used to
shorten process development times and lower costs if (S)-eleagnine was
synthesised using this route
54 Case study Maleic acid
The final experimental case study that was explored was the chemical
system involving maleic acid 513 reacting with methanol 514 to form the
monomethylated maleic acid ester (mono-product) 515 and the dimethylated
maleic acid ester (di-product) 516 shown in Scheme 55 Each reaction also
liberates a molecule of water 517
163
Scheme 55 The reaction of maleic acid 513 and methanol 514 to form the mono-product
515 and the di-product 516
Our collaborators at AstraZeneca were interested in this reaction following
the contamination of a batch of an API maleate salt with the corresponding
monomethyl maleate salt as this contamination could be mitigated if the impurity
formation was well understood Kinetic experiments were run and the findings
were published as it was found that the reaction forming the mono-product was
autocatalytic[240] In this case the reaction was found to be catalytic with an order
of 05 meaning that the overall order with respect to the maleic acid was 15 in
forming the mono-product The consecutive reaction forming the di-product is
also catalytic with respect to the maleic acid with a 05 order dependence
Although this information is now known and reported it took several months for
physical-organic chemists at AstraZeneca to decipher this reaction model as this
model is not immediately intuitive Therefore this case study was run to
retrospectively show the efficiency of this approach in elucidating non-intuitive
reaction models and how this methodology can serve as a viable substitute for
many hours spent on a project by experts that could be working on other aspects
of process development
All experimental data was obtained from our collaborators at AstraZeneca
and was collected using batch experimentation and 1H NMR sampling Five
experiments were conducted at differing starting concentrations and
temperatures in the range of 40 - 60 degC This experimental data was inputted into
the computational approach as well as the identified species Based on these
five species there were six feasible reactions identified - these reactions are
shown as eqn 59 - 514
513 + 514 rarr 515 + 517 eqn 59
515 + 517 rarr 513 + 514 eqn 510
515 + 514 rarr 516 + 517 eqn 511
516 + 517 rarr 515 + 514 eqn 512
515 + 515 rarr 513 + 516 eqn 513
513 + 516 rarr 515 + 515 eqn 514
As the experiments were ran with methanol as a solvent this exhibits an
effective methanol concentration of ~24 M which is far greater than the maleic
164
acid concentration that had a maximum concentration of 08 M As the methanol
is in such a high concentration its concentration remains effectively unchanged
throughout the reaction meaning that the rate law would approximate pseudo-
first-order kinetics Therefore after all rate laws were compiled using these
mass-balance-allowed reactions all rate laws pertaining to non-zero-order with
respect to methanol concentration were removed As the methanol concentration
would be effectively unchanged it would be very difficult to differentiate between
models with differing order dependencies on the methanol - this would likely lead
to many models tied for lsquomost likelyrsquo with exactly equivalent SSE values
After the subsequent rate laws were compiled the models were
generated subject to the rules defined in Chapter 422 and with the maleic acid
defined as a catalyst This resulted in 5086 unique models to be evaluated by
the approach which incurred a computation time around 17 hours (see Chapter
761 for details on computer specifications) Each of these models were then
ranked based on their AICC evaluation and it was found that the most likely
representation of the system is the reaction model shown in Scheme 55 but
each step is catalysed by maleic acid with a species order dependence of 05 -
these are the same findings that our collaborators made during their kinetic
analysis The approach also determined the kinetic parameters of this
transformation to be kmono 50 degC = 385 x 10-3 plusmn 001 x 10-3 M-05 min-1 Ea = 7261
plusmn 012 kJ mol-1 and kdi 50 degC = 466 x 10-4 plusmn 001 x 10-4 M-05 min-1 Ea = 6974 plusmn
010 kJ mol-1 These parameters were again very similar to those obtained by
our collaborators although our collaborators reported the kinetic parameters as
Arrhenius constants and activation energies This model and the corresponding
kinetic parameters allowed a fit to the experimental data with an average residual
of 11 x 10-3 M and two experimental fittings at 50 degC (with initial concentrations
of 08 M and 04 M) are shown in Figure 55 The top 5 ranked models are shown
in Table 53 with their respective SSE error metrics and AICC evaluations
165
Figure 55 Kinetic profiles for two kinetic experiments at 50 degC with the initial concentration of
maleic acid at 04 M and 08 M At 04 M = maleic acid mdash = maleic acid (ODE) =
mono-product mdash = mono-product (ODE) = di-product mdash = di-product (ODE) At 08
M = maleic acid - - - = maleic acid (ODE) = mono-product - - - = mono-product
(ODE) = di-product - - - = di-product (ODE) See Chapter 753 for full experimental
conditions and raw data
Table 53 Evaluation of the feasibility of each reaction model for the maleic acid case study
where α is variable for each model depending on the overall model order
Rank Reaction Model
Kinetic parameters
SSE
10-2 M AICC k50 degC 10-3 Mα
min-1 Ea kJ mol-1
1
51315 + 5140 rarr 515
+ 51305 + 517
51305 + 515 + 5140
rarr 516 + 51305 + 517
385
047
7261
6974 028 -4968
2
51315 + 5140 rarr 515
+ 51305 + 517
513 + 5152 rarr 5132 +
516
408
192
7832
7977 033 -4908
3
51315 + 5140 rarr 515
+ 51305 + 517
513 + 515 + 5140 rarr
516 + 513 + 517
391
103
7419
7995 033 -4902
166
4
51315 + 5140 rarr 515
+ 51305 + 517
51305 + 5152 rarr
51315 + 516
397
076
7652
7306 042 -4806
5
5132 + 5140 rarr 515 +
513 + 517
513 + 515 + 5140 rarr
516 + 513 + 517
560
078
7998
7936 053 -4715
As in previous case studies the top ranked models all feature the main
lsquoimportantrsquo model term that describes the convergence to experimental data in
the best way with models 1 - 4 featuring this term 51315 + 5140 rarr 515 +
51305 + 517 This is because the SSE metric is a measure of the total error in
the fit to the data and as this model term features the transformation of 513 to
515 which are the species present in the highest concentrations this model
term therefore has the highest impact on minimising the SSE
It has been shown in this case study that the new computational approach
can correctly identify the reaction model and kinetic parameters of a real
chemical system where there are both catalytic species and species with non-
integer order dependencies This is the first instance of an identified model
featuring a catalytic species and non-integer-order rate laws using real
experimental data As the model was already identified by our collaborators this
methodology has corroborated their findings and shown that process
understanding can be accelerated using this approach This approach
automatically identified the correct reaction model in ~17 hours whereas our
collaborators using more traditional lsquotrial and errorrsquo approaches arrived at the
correct model in months Retrospectively this would have allowed faster
implementation of measures to reduce the amount of monomethyl maleate salt
impurity in their API maleate salt thereby proceeding with process development
and cutting costs
55 Conclusion
167
It has been shown that using this new computational approach total
process understanding can be automatically achieved without the need for high-
level chemical intuition The widened scope of this new approach has been
proven to be effective in three experimental case studies each with differing rate
laws and kinetic structural motifs The approach has been proven to be effective
and applicable for lsquonormalrsquo kinetic models where each species has a first-order
dependence for zero-order and non-integer rate laws and for catalytic species
of variable integer- and non-integer-order
It has also been shown from these case studies that using this
methodology can greatly accelerate process development and reduce the
workload of kinetic analysis for the physical-organic chemists After
experimentation all kinetic analysis can be automated whilst experts focus on
other aspects of process development Then after the computational approach
has finished running they can work in conjunction with the approach to identify
which models are the most likely to be both statistically and scientifically correct
Chapter 6 Conclusion amp future work
The project aim to develop and advance an automated methodology to
kinetic model and parameter determination has been answered in the thesis
chapters herein The computational approach should be used in conjunction with
experts to automate the comprehensive kinetic analysis that is otherwise not
feasible using traditional means The approach takes experimental data and the
identified species then identifies every possible mass-balance-allowed
transformation between these species Each of these reactions are then
compiled into every possible unique reaction model with each feasible
corresponding rate law These models are then evaluated based on their fit to
experimental data by combining the use of ordinary differential equation (ODE)
solvers and optimisation algorithms The models are then statistically ranked
based on their convergence to experimental data and the number of model terms
in the model thereby identifying the most likely model and its corresponding
kinetic parameters
168
The original structure of this comprehensive methodology was originally
reported by Tsu et al[173] which was then replicated improved and utilised for
real experimentation in Chapters 2 - 3 The approach was used in tandem with
an automated flow reactor platform by exploiting flow rate manipulations to
obtain full reaction profiles followed by implementation of the approach The
methodology was then further improved and the scope was widened in Chapter
4 as catalytic systems and differing-non-integer order species dependencies in
the rate laws were also explored This improved methodology was then proven
to be effective in real experimental systems in Chapter 5 as batch
experimentation ran at Leeds and by collaborators showed the wide applicability
of the approach to different types of reactions This approach can be used as a
tool for process development by anyone as expert chemical intuition is removed
from the kinetic analysis Therefore the project aim has been answered in the
work described herein as any chemist can use this approach and interpret the
output in order to obtain total process understanding
Further work on the use and development of this approach for metal-
catalysed processes would be beneficial Metal-catalysed processes are very
important in industry but catalytic cycles can be complex meaning that it is not
immediately obvious how to automate a tool to explore these potential models
In some cases it may be sufficient to describe a reaction based on empirical rate
laws and this can currently be implemented using the approach developed
However another research project on the development of a tool to identify these
kinetic models and catalytic cycles may be warranted As a suggestion this could
be performed by inputting many known catalytic cycles into a training set then
using machine learning techniques to build a neural network to identify trends in
experimental data to attribute particular catalytic cycles to chemical processes
Chapter 7 Appendix
71 Chapter 1
No appendix data for Chapter 1
72 Chapter 2
169
721 Generated data set for case study benzoic acid alkylation
Experiment 1
Time s 21 M 22 M 23 M
0 01 08 0
475 0081361 0060964 0017126
1024 0069511 004901 0031805
2015 0054394 003336 0044477
295 0044695 0027749 0051252
432 0038039 0019903 0062653
60 0032285 0013536 0065719
Experiment 2
Time s 21 M 22 M 23 M
0 01 011 0
468 007631 0084741 0023482
1027 0057707 0069104 0040456
20 004138 0054662 0056759
302 0034101 004059 0067659
476 0023686 0031161 0075772
60 0018377 0027305 0083761
Experiment 3
Time s 21 M 22 M 23 M
0 1 015 0
5 0069767 0121755 0032513
105 0047199 0098611 005277
2163 0027758 0077627 0072909
3054 0019626 0069013 0079639
4578 0011357 0059865 0091724
170
60 0006574 005691 0093444
722 Generated data set for case study nitrile hydrolysis
Experiment 1 60 degC
Time s 25 M 27 M 28 M
0 08 0 0
5235363 0814005 001713 100E-06
3247861 067236 0106334 339E-05
6719836 0634071 0199701 0000124
1456155 0463323 034173 0000516
2899323 027438 0528037 0001536
3687175 0220788 0551639 000212
4868495 0162216 0630518 0003131
600 0124203 0705371 0004112
Experiment 2 70 degC
Time s 25 M 27 M 28 M
0 08 0 0
6133417 0761239 0049487 683E-06
2689 0588801 0199668 115E-04
6870925 0426543 0363734 0000585
1501538 021105 0573179 000192
297041 0079934 0705184 0004502
3564911 005351 0757795 0005854
4867485 0024103 0789235 0008408
600 0013094 0752509 0010127
Experiment 3 80 degC
Time s 25 M 27 M 28 M
171
0 1 0 0
5817383 0852929 015263 428E-05
2471834 0568389 0476974 589E-04
714048 0218624 0778816 0002633
1543583 0060192 089969 0006685
3038829 0006754 0944201 0014173
3720244 0002737 09556 001819
4765104 0000608 1009417 0023157
600 0000113 09467 0028902
Experiment 4 90 degC
Time s 25 M 27 M 28 M
0 1 0 0
5910759 0711158 0281532 172E-04
2420962 030002 070196 171E-03
6878985 0060896 0961462 0006075
1425421 0005202 1023471 0013823
2881599 555E-05 0935542 0027497
3644764 521E-06 0970668 0036328
4780807 143E-07 095015 0045819
600 179E-07 089561 0059331
723 Generated data set for the case study SNAr kinetics
Experiment 1
Time 210 M 212 M 213 M 214 M
0 1 0 0 0
0114724 0916317 0078593 0018182 249E-06
103049 0464119 0448791 0104213 0000125
2141533 0226584 0624128 0146157 0000376
3643057 0102715 0737636 0171082 0000744
172
7743801 0012971 0788209 0187458 0001768
1216477 0001476 0805589 018666 0002965
4403067 0 0816998 0186517 0010796
1072065 0 0801824 0178389 0026607
2551342 0 078187 0172065 0061291
4351342 0 0744149 0156488 0102055
600 0 0702123 0148841 0135997
Experiment 2
Time 210 M 212 M 213 M 214 M
0 12 0 0 0
0088864 1073662 0091451 00213 294E-06
0254455 0913278 0236597 0053222 217E-05
1152788 0407456 0638051 0147144 0000266
3171611 0093893 0900254 02064 0001032
939048 0001601 0959144 0228044 0003623
4041694 0 097195 021939 0016209
195366 0 0911133 0206891 0075681
3112192 0 0891022 0190707 0118451
4312192 0 0869047 0184739 015486
4912192 0 0861757 0175374 0176878
600 0 0839806 0165531 0209888
Experiment 3
Time 210 M 212 M 213 M 214 M
0 09 0 0 0
0091037 0797548 0079495 0018563 313E-06
0259823 0653654 0198581 0046012 219E-05
1158987 0239387 0538734 0122398 0000279
173
4175397 0013188 0712848 0169522 0001555
6793661 0001174 0728233 0166388 0002729
9757783 0 0717645 0170752 0003931
4449079 0 0719684 0164371 0019044
1956282 0 0666457 014927 0080022
3156282 0 0644589 0131672 0126933
4956282 0 0600784 0117343 0185606
600 0 0578163 0107537 0221849
73 Chapter 3
731 Phenyl acetate
7311 Preparation of feed solutions
Three feeds were used for this work and desired reservoir solutions were
prepared by dissolving the desired reagents in acetonitrile under stirring at
ambient conditions The first feed consisted of phenol (132 mL 015 mol 05
mol dm-3) and biphenyl (115 g 75 mmol 0025 mol dm-3) in acetonitrile (300
mL) the second feed contained acetyl chloride (225 mL 032 mol 105 mol dm-
3) the third feed was a 11 mixture of acetonitrile and water for dilution
7312 Flow ramp experiments
Linear gradient flow ramps allowed the generation of a complete reaction
profile from a single transient experiment To obtain transient data each of the
three pumps were initially set at the maximum flow rate to be investigated 175
mL min-1 Steady-state was established in the 35 mL reactor and the flow rate
for each pump decreased at a constant rate of 00181 mL min-1 for 92 minutes
Samples of reactor effluent were injected for HPLC analysis at 2 minute intervals
thus achieving a large data density The reactor setup schematic is shown in
Figure 731
174
Figure 731 The flow reactor setup for the phenyl acetate case study experiments
7313 HPLC Analysis
All HPLC analysis was conducted using an Agilent 1100 series HPLC
instrument fitted with a Sigma Ascentis Express C18 reverse phase column (5cm
x 46mm 27 microm) Biphenyl was used as an internal standard The column
temperature was 70 degC and the HPLC method is shown
Time min A (water 01
TFA)
B (acetonitrile
01 TFA) Flow rate mL min-1
000 50 50 2
150 20 80 2
151 50 50 2
An example HPLC chromatogram during a kinetic experiment is shown in
Figure 732
175
Figure 732 An example HPLC chromatogram in the phenyl acetate case study at 254 nm
7314 Validation with steady-state measurements
Steady-state measurements were taken at 1 3 5 7 9 11 13 and 15
minutes at both 65 degC and 75 degC Using the identified most likely reaction model
from the flow ramps the k values for the steady-state experiments were found to
be kSS-65 degC = 472 x 10-3 plusmn 001 x 10-3 M-1 s-1 kSS-75 degC = 929 x 10-3 plusmn 003 x 10-3
M-1 s-1 These k values give the steady-state kinetic parameters as kSS-65 degC =
472 x 10-3 plusmn 001 x 10-3 M-1 s-1 Ea-SS = 663 plusmn 05 kJ mol-1 which are very
comparable to the flow ramp evaluation of the kinetic parameters kR-65 degC =
00052 plusmn 00002 M-1 s-1 Ea-R = 693 plusmn 78 kJ mol-1 As the steady-state
measurements were taken without a dilution pump the concentrations are
different to that of the ramps hence the steady-state time-series concentration
data was normalised to match the concentrations from the ramps to show the
agreement in their nature in Figure 311
7315 Raw data
Flow ramp experiments
Flow ramp
measurements 65 degC 75 degC
τ min 38 M 310 M 38 M 310 M
102 01493 00072 01346 00262
104 01461 00095 01297 00269
106 01436 00104 01284 00260
108 01459 00119 01300 00262
111 01433 00121 01268 00287
114 01394 00128 01244 00304
116 01398 00135 01251 00310
119 01428 00144 01200 00322
122 01410 00150 01176 00340
125 01397 00142 01249 00304
129 01358 00140 01204 00334
132 01388 00168 01188 00369
176
136 01382 00166 01190 00405
140 01365 00170 01204 00315
144 01358 00182 01174 00408
149 01324 00173 01142 00392
153 01338 00188 01170 00383
158 01360 00194 01148 00395
164 01334 00204 01134 00426
170 01320 00213 01132 00406
176 01333 00223 01113 00430
182 01315 00232 01121 00456
189 01319 00220 01095 00445
197 01278 00228 01029 00523
205 01285 00260 01072 00501
214 01280 00334 01021 00554
224 01267 00287 01065 00524
235 01248 00305 00996 00603
247 01253 00309 00984 00566
260 01214 00338 00974 00575
274 01217 00297 00914 00661
290 01195 00360 00914 00620
308 01196 00379 00900 00654
328 01162 00408 00830 00762
351 01111 00444 00790 00774
377 01114 00452 00848 00739
406 01017 00527 00737 00722
441 01033 00536 00705 00843
481 00986 00559 00618 00981
528 00955 00598 00564 00962
583 00908 00678 00599 00985
649 00807 00704 00576 01039
177
729 00781 00770 00488 01150
824 00705 00835 00421 01160
940 00662 00921 00360 01223
1079 00587 00981 00249 01358
Steady state experiments
Steady-state
measurements 65 degC 75 degC
τ min 38 M 310 M 38 M 310 M
102 01771 00177 01591 00387
308 01461 00470 01183 00824
481 01214 00736 00858 01123
649 01050 00940 00625 01370
900 00844 01155 00419 01567
1101 00717 01263 00297 01715
1301 00559 01384 00218 01822
1502 00512 01488 00177 01886
Normalised steady state experiments
Steady-state
measurements
(normalised)
65 degC 75 degC
τ min 38 M 310 M 38 M 310 M
102 01417 00142 01273 00310
308 01169 00377 00947 00660
481 00971 00590 00686 00898
649 00840 00753 00500 01096
900 00675 00926 00335 01253
1101 00573 01012 00238 01372
178
1301 00447 01109 00174 01458
1502 00409 01192 00142 01509
732 Paracetamol
7321 Preparation of feed solutions
For the work at the temperature of 30 degC two feeds were used and
desired reservoir solutions were prepared by dissolving the desired reagents in
acetonitrile under stirring at ambient conditions The first feed consisted of 4-
aminophenol (058 mL 6 mmol 002 mol dm-3) and biphenyl (115 g 75 mmol
0025 mol dm-3) in acetonitrile (300 mL) the second feed contained acetic
anhydride (085 mL 9 mmol 003 mol dm-3) in acetonitrile (300 mL)
For the work at the temperature of 60 degC two feeds were used and
desired reservoir solutions were prepared by dissolving the desired reagents in
acetonitrile under stirring at ambient conditions The first feed consisted of 4-
aminophenol (044 mL 45 mmol 0015 mol dm-3) and biphenyl (115 g 75
mmol 0025 mol dm-3) in acetonitrile (300 mL) the second feed contained acetic
anhydride (085 mL 9 mmol 003 mol dm-3) in acetonitrile (300 mL)
For the work at the temperature of 160 degC two feeds were used and
desired reservoir solutions were prepared by dissolving the desired reagents in
acetonitrile under stirring at ambient conditions The first feed consisted of 4-
aminophenol (101 mL 105 mmol 0035 mol dm-3) and biphenyl (115 g 75
mmol 0025 mol dm-3) in acetonitrile (300 mL) the second feed contained acetic
anhydride (298 mL 315 mmol 0105 mol dm-3) in acetonitrile (300 mL)
For the work at the temperature of 180 degC two feeds were used and
desired reservoir solutions were prepared by dissolving the desired reagents in
acetonitrile under stirring at ambient conditions The first feed consisted of 4-
aminophenol (261 mL 27 mmol 009 mol dm-3) and biphenyl (115 g 75 mmol
0025 mol dm-3) in acetonitrile (300 mL) the second feed contained acetic
anhydride (533 mL 564 mmol 019 mol dm-3) in acetonitrile (300 mL)
7322 Flow ramp experiments
For the work at the temperature of 30 degC a 025 mL reactor was used
For the work at the temperature of 60 degC a 05 mL reactor was used For the
179
work at the temperatures of 160 degC and 180 degC a 35 mL reactor was used
Linear gradient flow ramps allowed the generation of complete reaction profiles
from a single transient experiment To obtain transient data each of the two
pumps were initially set at the maximum flow rate to be investigated 175 mL
min-1 Steady-state was established and the flow rate for each pump decreased
at a constant rate of 00181 mL min-1 for 92 minutes Samples of reactor effluent
were injected for HPLC analysis at 2 minute intervals thus achieving a large data
density The reactor setups for each of these 4 reactions are shown in Figures
733 - 736 For the higher temperature reactions 160 degC and 180 degC 4-
aminophenol is used and assumed to react instantaneously to form paracetamol
based on the kinetics observed at lower temperatures
Figure 733 The reactor setup for the paracetamol flow ramp experiment at 30 degC
180
Figure 734 The reactor setup for the paracetamol flow ramp experiment at 60 degC
Figure 735 The reactor setup for the paracetamol flow ramp experiment at 160 degC
Figure 736 The reactor setup for the paracetamol flow ramp experiment at 180 degC
7323 HPLC analysis
All HPLC analysis was conducted using an Agilent 1100 series HPLC
instrument fitted with a Sigma Ascentis Express C18 reverse phase column (5cm
x 46mm 27 microm) Biphenyl was used as an internal standard The column
temperature was 70 degC and the HPLC method is shown
Time min A (water 01
TFA)
B (acetonitrile
01 TFA) Flow rate mL min-1
000 50 50 2
150 20 80 2
151 50 50 2
An example HPLC chromatogram showing the separation and analysis of
all components at once - these species were each added to the same solution
for method development
181
Figure 737 An example HPLC chromatogram from the paracetamol case study showing the
separation of all reaction components at 254 nm
7324 Raw data
Flow ramp experiment 1 30 degC
τ s 312 M 314 M 315 M
428 000698 000267 0
437 000722 000266 0
447 000766 000284 0
457 000716 000287 0
467 000688 000278 0
478 000749 000306 0
489 000717 000299 0
501 000715 000317 0
513 000685 000273 0
526 000727 000320 0
540 000622 000296 0
555 000635 000337 0
570 000643 000374 0
586 000639 000446 0
603 000623 000401 0
182
621 000643 000391 0
640 000600 000385 0
645 000654 000378 0
683 000613 000368 0
706 000519 000376 0
731 000592 000455 0
758 000585 000481 0
787 000554 000410 0
818 000564 000432 0
851 000503 000429 0
888 000568 000493 0
927 000441 000444 0
971 000444 000506 0
1019 000416 000513 0
1071 000446 000556 0
1129 000413 000575 0
1194 000440 000546 0
1267 000483 000566 0
1349 000452 000564 0
1443 000353 000601 0
1550 000276 000588 0
1675 000370 000654 0
1820 000325 000720 0
1994 000229 000676 0
2202 000214 000686 0
2459 000239 000770 0
2781 000178 000878 0
3197 000221 000826 0
3900 000171 000848 0
4518 000145 000871 0
183
Flow ramp experiment 2 60 degC
τ s 312 M 314 M 315 M
875 0003048 0004234 0
894 0003702 0003846 0
913 0003852 0003772 0
955 0003402 0003918 0
978 0003071 0003860 0
1002 0002944 0004318 0
1027 0003195 0004243 0
1053 0003084 0004111 0
1080 0003046 0004262 0
1109 0003112 0004330 0
1140 0002925 0004253 0
1172 0002919 0004464 0
1206 0002921 0004562 0
1243 0002741 0004796 0
1281 0002612 0004906 0
1290 0002480 0004399 0
1366 0002481 0004597 0
1412 0002545 0004952 0
1462 0002325 0004951 0
1516 0002416 0004964 0
1573 0002407 0005149 0
1635 0002401 0005027 0
1702 0002710 0004966 0
1775 0002157 0005196 0
1855 0002382 0005121 0
1942 0002037 0005228 0
184
2037 0002221 0005387 0
2142 0001760 0005411 0
2259 0001446 0005728 0
2389 0001541 0005809 0
2534 0001507 0005924 0
2699 0001471 0005553 0
2886 0001147 0005686 0
3100 0001304 0006117 0
3349 0001168 0005719 0
3641 0001018 0006181 0
3987 0000916 0006444 0
4405 0000976 0006104 0
4918 0001025 0006840 0
Flow ramp experiment 3 160 degC
τ min 312 M 314 M 315 M
125 0 001766 000056
129 0 001737 000054
132 0 001786 000038
136 0 001789 000042
140 0 001722 000061
144 0 001738 000055
149 0 001779 000059
153 0 001807 000068
158 0 001794 000064
164 0 001722 000067
170 0 001734 000072
176 0 001792 000077
185
182 0 001738 000076
189 0 001755 000081
197 0 001738 000074
205 0 001785 000102
214 0 001762 000086
224 0 001801 000105
235 0 001753 000111
247 0 001793 000102
260 0 001763 000123
274 0 001672 000118
308 0 001736 000124
328 0 001728 000160
351 0 001635 000153
377 0 001696 000174
406 0 001670 000199
441 0 001536 000187
481 0 001590 000222
528 0 001614 000263
583 0 001482 000258
649 0 001454 000317
729 0 001474 000331
824 0 001407 000355
940 0 001315 000386
1079 0 001292 000412
Flow ramp experiment 4 180 degC
τ min 312 M 314 M 315 M
104 0 003703 000456
186
106 0 003829 000519
108 0 003746 000652
111 0 003910 000557
114 0 003812 000656
116 0 003894 000592
119 0 003622 000877
122 0 003941 000625
125 0 003733 000754
129 0 003798 000713
132 0 003861 000717
136 0 003606 000930
140 0 003615 000890
144 0 003655 000870
149 0 003584 000854
153 0 003765 000893
158 0 003480 001017
164 0 003459 001078
170 0 003522 001035
176 0 003357 001114
182 0 003407 001127
189 0 003598 000927
197 0 003491 000963
205 0 003546 001197
214 0 003307 001152
224 0 003586 001004
235 0 003600 001103
247 0 003364 001246
260 0 003717 000943
187
274 0 003256 001202
290 0 003278 001151
308 0 003298 001160
328 0 003304 001311
351 0 003179 001295
377 0 003002 001227
406 0 003024 001543
441 0 003117 001338
481 0 003076 001426
528 0 002431 001748
583 0 002326 001784
649 0 002665 001973
729 0 002265 001803
824 0 001960 002426
940 0 001780 002347
1079 0 001594 002903
733 Metoprolol
7331 AstraZeneca experimental setup
All AstraZeneca experiments were conducted using a tubular reaction vessel
(Polar Bear Plus) using PTFE tubing (1 mm ID) Reagents were pumped using
JASCO PU-4180 dual piston HPLC pumps and flow streams were mixed using
Swagelok SS-100-3 tee-pieces Sampling was conducted by using a VICI Valco
EUDA-CI4W5 sample loop with a 006 microL aliquot volume The reaction system
was maintained under a fixed back pressure using an Upchurch Scientific 150
psi back pressure regulator Quantitative analysis was performed using an
Agilent 1100 series HPLC instrument fitted with an Acquity C18 reverse phase
column (3 cm x 46 mm 17 microm) This setup is shown in Figure 638 In all
experiments biphenyl was added to one reservoir as an internal standard
188
Figure 738 A photograph of the automated flow system at AstraZeneca
7332 Preparation of feed solutions
For the Leeds experiments two feeds were used for the flow ramps and
desired reservoir solutions were prepared by dissolving the desired reagents in
acetonitrile under stirring at ambient conditions The first feed consisted of 2-((4-
(2-methoxyethyl)phenoxy)methyl)oxirane (SM) (5676 mL 03 mol 1 mol dm-3)
and biphenyl (115 g 75 mmol 0025 mol dm-3) in acetonitrile (300 mL) the
second feed contained isopropylamine (1546 mL 018 mol 06 mol dm-3) in
acetonitrile (300 mL)
For the AstraZeneca experiments two feeds were used for the flow
ramps and desired reservoir solutions were prepared by dissolving the desired
reagents in acetonitrile under stirring at ambient conditions The first feed
consisted of 2-((4-(2-methoxyethyl)phenoxy)methyl)oxirane (SM) (5676 mL 03
mol 1 mol dm-3) and biphenyl (115 g 75 mmol 0025 mol dm-3) in acetonitrile
(300 mL) the second feed contained isopropylamine (5153 mL 09 mol 3 mol
dm-3) in acetonitrile (300 mL)
7333 Flow ramp experiments
189
For the Leeds experiments a 35 mL reactor was used Linear gradient
flow ramps allowed the generation of complete reaction profiles from a single
transient experiment To obtain transient data each of the two pumps were
initially set at the maximum flow rate to be investigated 175 mL min-1 Steady-
state was established and the flow rate for each pump decreased at a constant
rate of 00181 mL min-1 for 92 minutes Samples of reactor effluent were injected
for HPLC analysis at 4 minute intervals thus achieving a large data density This
reactor setup is shown in Figure 739
Figure 739 The reactor setup for the metoprolol flow ramp experiments at 190210 degC in
Leeds
For the AstraZeneca experiments a 5 mL reactor was used Linear gradient flow
ramps allowed the generation of complete reaction profiles from a single
transient experiment To obtain transient data each of the two pumps were
initially set at the maximum flow rate to be investigated 125 mL min-1 Steady-
state was established and the flow rate for each pump decreased at a constant
rate of 00125 mL min-1 for 96 minutes Samples of reactor effluent were injected
for HPLC analysis at 6 minute intervals thus achieving a large data density This
reactor setup is shown in Figure 7310
190
Figure 7310 The reactor setup for the metoprolol flow ramp experiments at 130150 degC at
AstraZeneca
7334 HPLC analysis
All HPLC analysis was conducted using an Agilent 1100 series HPLC
instrument fitted with a Sigma Ascentis Express C18 reverse phase column (5cm
x 46mm 27 microm) Biphenyl was used as an internal standard The column
temperature was 40 degC and the HPLC method is shown
Time min A (water 01
TFA)
B (acetonitrile
01 TFA) Flow rate mL min-1
000 77 23 2
300 10 90 2
400 10 90 2
410 77 23 2
An example HPLC chromatogram during a kinetic experiment is shown in
Figure 7311
Figure 7311 An example HPLC chromatogram during a kinetic experiment in the metoprolol
case study at 220 nm
7335 Cost evaluation
Using the Leeds experimental setup outlined in Chapter 32 and current
pricing for the starting material used in the Metoprolol work (pound80725 g)[239] it has
been shown that this kinetic approach used less material and was cheaper to
implement than other standard industrial optimisation techniques
As the starting material is the most expensive reaction component by a
large margin this was the only factor taken into consideration - other costs were
not considered eg solvent isopropylamine energy etc It is assumed that a 1
M solution of starting material is used and so the cost associated for every 1 mL
of this solution used (0208 g 1 mmol) is pound671 It is also assumed that 2 reactor
volumes are consumed prior to all steady-state reactions and all reactions were
191
conducted using a 35 mL reactor The addition of skilled labour and time have
not been considered but would incur significantly higher costs for these other
techniques as this technique only requires the initial setup of the reservoirs and
reactor because everything else is automated
Technique What is required Solution
usage mL Cost pound
Flow ramps
4 x linearly decreasing flow ramps from
175 mL min-1 decreasing at a rate of
00181 mL min-1 for 92 minutes
340 pound2281
Steady-state
kinetics 4 sets of 16 steady-state experiments 420 pound2818
Design of
Experiments
study
One screening design (19 steady-state
experiments) and one optimisation design
(81 steady-state experiments) to consider
the factors of temperature residence time
starting material equivalents and
isopropylamine equivalents
700 pound4697
7336 Raw data
Flow ramp experiment 1 130 degC
τ min 317 M 319 M 320 M
210 0435 0053 0000
224 0427 0056 0000
240 0423 0060 0000
258 0417 0064 0000
371 0381 0102 0000
416 0397 0088 0000
472 0383 0099 0000
545 0369 0110 0000
641 0362 0123 0000
773 0347 0146 0001
961 0286 0206 0002
Flow ramp experiment 2 150 degC
192
τ min 317 M 319 M 320 M
200 0358 0116 0000
210 0357 0125 0000
224 0350 0135 0001
240 0347 0144 0001
258 0340 0153 0001
280 0333 0166 0001
305 0311 0178 0002
335 0299 0193 0002
371 0269 0207 0002
416 0259 0234 0003
472 0233 0251 0003
545 0208 0287 0004
641 0169 0284 0005
773 0144 0327 0006
Flow ramp experiment 3 190 degC
τ min 317 M 319 M 320 M
255 0340 0117 0004
269 0328 0121 0005
284 0321 0126 0006
302 0320 0132 0006
321 0309 0138 0007
343 0307 0137 0007
368 0305 0150 0008
397 0299 0152 0009
430 0294 0161 0010
470 0284 0171 0012
517 0270 0176 0014
573 0261 0183 0016
643 0254 0186 0018
730 0246 0190 0021
842 0232 0211 0025
986 0213 0217 0028
Flow ramp experiment 4 210 degC
τ min 317 M 319 M 320 M
250 0305 0166 0012
193
263 0299 0165 0013
278 0294 0172 0014
295 0294 0172 0015
314 0282 0182 0017
335 0279 0186 0019
360 0269 0190 0021
388 0272 0201 0023
421 0247 0221 0030
460 0236 0218 0028
506 0230 0219 0032
562 0218 0222 0038
630 0231 0211 0042
716 0201 0235 0045
825 0188 0235 0051
968 0182 0239 0058
74 Chapter 4
741 Generated data set for the case study SNAr kinetics
Experiment 1
Time s 45 M 47 M 48 M 49 M
0 1 0 0 0
104232 0912548 0068648 0002878 279E-05
5078096 0715174 0266199 0011023 0000485
1475526 0464384 0521723 0020875 0002315
3331443 0269972 0708549 002876 0006042
5628294 0168854 080687 0031878 0009439
9017797 0099139 0856211 003494 0013887
2108206 0032979 088963 0036126 0024236
3328275 0015074 0929082 0036808 003211
4382468 0008534 0933212 0036452 0037487
600 0004209 0921486 0036363 0043389
194
Experiment 2
Time s 45 M 47 M 48 M 49 M
0 08 0 0 0
1302612 0703325 0092533 0003854 627E-05
5712155 0478466 0312694 0012573 0000883
1084263 0329335 044882 0018183 0002403
2064908 0176938 0596415 0023908 0005922
6941793 0014924 0723646 0029388 0023796
1516461 0000354 0725866 0029244 0051839
3009398 380E-07 066851 0026369 0099546
5153318 0 0621532 0024249 0155196
9253113 0 0545081 0019839 0239656
1200 0 0506326 0018372 0288136
Experiment 3
Time s 45 M 47 M 48 M 49 M
0 1 0 0 0
0962483 0873362 0112646 0004695 780E-05
1002158 0342803 0632465 0025508 0004215
2106925 0138132 0817645 0033569 001147
6078714 0008667 0899281 0037403 0036358
1010498 0000643 0895452 003658 0061674
1727609 714E-06 0851082 0034174 0101391
3082939 0 0806696 0030438 017491
5621972 0 069294 0025835 0270209
9040341 0 0598858 0021781 0384583
1600 0 0457229 0015241 0527733
Experiment 4
Time s 45 M 47 M 48 M 49 M
195
0 1 0 0 0
1044725 0854673 0149213 0006087 0000139
509551 0460925 0515756 0020548 0002257
2132233 0072138 0877848 0035074 0017175
4714859 0005208 0917717 0036551 0041614
6931167 00006 0887854 0035809 0061604
1280495 225E-06 086418 0033593 0115427
2886839 0 0741762 002754 0232766
7368751 0 0519088 0018297 0455041
1222483 0 0381306 0012248 060453
1800 0 0274267 0007936 0705143
Experiment 5
Time s 45 M 47 M 48 M 49 M
0 12 0 0 0
0849478 0999855 0175423 0007178 0000158
5548213 0466871 0712408 0028769 0004137
1181201 0191904 0969199 0039345 0012093
3500272 0010569 110712 0045047 0044862
911267 147E-05 1038677 0040673 0119288
1237999 690E-07 1005138 0040148 0158185
1953324 0 0920941 003614 0234604
4831808 0 0709117 0024989 0478645
632278 0 0609582 0021143 0562277
900 0 0502989 0016122 0680497
742 Generated data set for the case study Pentyne
Experiment 1
Time min 411 M 412 M 413 M
0 1 08 0
196
1293971 0973192 0803545 0011085
3972297 0958388 0766506 0033251
1843854 0857109 0663378 0141812
3290479 0770748 054892 0246498
5690479 0629294 0416498 0388829
9290479 0449379 025987 0548273
120 0369111 0164188 0644284
Experiment 2
Time min 411 M 412 M 413 M
0 12 15 0
1205027 1199383 1460822 0012139
3721389 1157799 1439238 0037013
1802628 1036602 1347405 0171608
5033117 077347 1092225 0421136
8633117 0582851 0871663 0614124
1403312 0359291 0678145 0833511
180 0259447 0551321 0936175
Experiment 3
Time min 411 M 412 M 413 M
0 1 1 0
1293971 0994904 0974041 0010778
3972297 0975053 0966892 0033053
1843854 086422 0871237 0145646
3290479 0750116 0752064 0246904
8090479 0508082 0506177 0504648
1529048 0276204 0271468 072687
240 0129659 0132753 0856012
197
743 Generated data set for the case study Ytterbium catalysis
Experiment 1
Time h 415 M 416 M 418 M
0 2 2 0
0054397 1950736 1962883 0040294
0386129 1737689 1725949 026888
0701874 1545843 1542334 0459994
1901874 0986091 0979723 1020241
3101874 0631223 0628196 136402
4301874 040357 0400764 1596431
6 0213539 0212908 1784115
Experiment 2
Time h 415 M 416 M 418 M
0 15 2 0
0029722 1499822 2000933 0004169
02413 1470961 1962226 0033316
0911826 1373396 1881085 0122394
1511826 1302576 1805505 0196746
2711826 1164105 1659122 0336104
3911826 1042952 1535555 0457449
6 085898 1357163 0642853
Experiment 3
Time h 415 M 416 M 418 M
0 14 18 0
0027487 1370804 1774104 003184
0106977 1284762 1675632 012038
0249912 114023 1539842 0264912
198
092138 0646932 1043942 0752256
152138 0389843 0794653 1012081
212138 0235788 0635663 1164374
3 0112972 0511689 1287393
Experiment 4
Time h 415 M 416 M 418 M
0 22 16 0
0043551 2153819 153798 005486
0241672 1906782 1311278 0288655
0439793 1706777 1105476 049592
0839793 1351856 0751683 0854071
1239793 1066839 0466383 1129747
1639793 0846621 0246217 1354339
2 0682943 0085826 1509085
75 Chapter 5
751 SNAr kinetics
7511 Experimental equipment
All experiments were run in an NMR tube using a dedicated 500 MHz
NMR spectrometer at The University of Cambridge as shown in Figure 751
199
Figure 751 The dedicated NMR spectrometer used for kinetic experiments in the SNAr
kinetics case study
7512 Kinetic experiments
In each experiment 246-trichloropyrimidine (700 microL 200 mM in CD3OD)
was warmedcooled to the required temperature in the 500 MHz NMR
spectrometer The NMR was then locked onto the solvent then the probe was
tuned and matched to the 1H nuclei then shimming ensued The spectrum of the
200 mM solution of 246-trichloropyrimidine was acquired
To this NMR tube a pre-cooledwarmed solution of CD3OD containing
200 mM ethyl 4-aminobutyrate hydrochloride and 600 mM Et3N (700 microL) was
added and mixed thoroughly by shaking the NMR tube This gave the desired
reaction concentration of 100 mM pyrimidine 100 mM amine and 300 mM Et3N
Spectra were acquired every ~80 seconds The software was used in each case
to obtain absolute integrals for each peak which were then converted to
200
concentrations based on the 246-trichloropyrimidine solution of known
concentration
7513 Example NMR spectra
An example lsquostackedrsquo NMR spectrum is shown in Figure 752 showing
the appearancedisappearance of peaks over time in the 25 degC experiment
Where the peak at 780 ppm corresponds to 246-trichloropyrimidine 666 ppm
corresponds to the 2-substituted product and 641 corresponds to the 4-substited
product
Figure 752 lsquoStackedrsquo NMR spectrum showing several NMR spectra over time in the 25 degC
experiment
7514 Raw data
Experiment 1 -25 degC
Time min 51 M 53 M 54 M
1455 0088818 0004156 0004562
1591667 0088538 0004229 0004611
1726667 0088465 0004295 0004727
1863333 0088063 0004362 0004842
1998333 008805 0004577 0004908
201
2133333 0087811 0004609 0004962
227 0087412 0004713 0005096
2405 0087133 0004827 0005202
2541667 0086922 0004901 0005268
2676667 008667 0004993 0005345
2813333 0086501 0005049 0005407
2948333 0086142 0005142 0005518
3083333 0085983 0005268 0005704
322 0085639 0005412 0005803
3355 0085286 0005468 0005826
3491667 0085108 0005589 000596
3626667 0084887 0005646 0005947
3763333 0084482 0005781 0006102
3898333 0084308 0005902 0006179
4035 0083927 0005914 000626
417 0083758 0006021 000639
4306667 0083386 0006157 0006496
4441667 0083205 0006154 0006574
4576667 0083093 0006298 0006627
4713333 008282 0006377 0006689
4848333 0082663 0006475 0006751
4985 0082501 0006492 0006786
512 0082273 000655 0006939
5256667 008206 0006658 0006902
5391667 008186 0006786 0007038
5526667 0081225 0006729 0007105
Experiment 2 0 degC
Time min 51 M 53 M 54 M
202
7333333 0072103 0007607 0008513
88 0070344 0008018 0008965
1016667 0068594 0008452 0009462
1151667 0068423 0008887 0009854
1288333 0066803 0009266 001028
1423333 0065829 0009635 0010682
156 0064594 0010002 0011061
1695 0063823 0010341 0011471
1831667 0062319 0010702 0011804
1966667 0061394 0010984 0012177
2101667 0060906 0011342 0012486
2238333 0059741 0011585 0012806
2373333 0058765 001182 0013095
251 0058315 0012151 0013445
2645 0057463 001241 0013671
278 0056496 0012685 0013978
2916667 0056066 00129 0014287
3051667 0055037 0013136 001449
3188333 0054482 0013382 0014789
3323333 0053852 0013629 0015023
3458333 0053151 0013804 0015225
3595 0052684 0014054 001548
373 0052192 0014261 0015707
3866667 005156 0014409 001589
4001667 0051008 0014613 0016133
4136667 0050399 0014842 0016311
4273333 0049812 0015017 0016498
4408333 0049557 0015136 0016666
4545 0048743 0015301 0016861
468 0048366 0015482 0017042
203
4816667 0047763 0015635 001723
4951667 0047326 0015831 0017433
5086667 0046947 0015973 0017573
5223333 0046384 0016088 0017747
5358333 0045991 0016243 0017903
5495 0045672 0016393 0018043
563 0045107 0016496 0018225
5766667 0044674 0016691 0018395
5901667 0044423 0016839 0018509
6036667 0044113 0016972 0018683
6173333 0043619 0017086 001884
Experiment 3 25 degC
Time min 51 M 53 M 54 M
3366667 0064314 0009652 0009883
48 0057052 0012118 0012863
615 0051792 0013813 0014922
75 0047939 0015186 0016476
8866667 0044748 0016215 0017819
1021667 0041922 0017079 0018798
1158333 0039664 0017878 0019678
1293333 0037598 0018491 0020463
1428333 0035777 0019052 0021122
1565 0034195 0019558 0021718
17 0032928 0019875 0022181
1836667 0031709 0020362 0022676
1971667 0030632 0020622 0023126
2106667 0029623 0020886 0023404
2243333 0028668 002128 0023818
204
2378333 0027704 0021452 002409
2515 0026937 0021641 0024389
265 0026303 0021884 0024635
2786667 0025572 0022112 0024925
2921667 0024988 0022265 0025126
3056667 0024358 0022417 0025261
3193333 0023747 0022601 0025533
3328333 0023156 0022788 0025713
3463333 0022678 0022896 0025943
36 0022158 0022984 0026042
3735 0021731 0023193 0026254
3871667 0021252 0023299 0026356
4006667 0020811 0023542 0026561
4143333 0020451 0023635 0026706
4278333 0019954 0023675 0026824
4413333 001972 0023743 0026953
455 0019374 0023807 0027033
4685 0019129 0023925 0027167
4821667 0018686 0024057 0027249
4956667 0018359 0024079 0027301
5093333 0018011 0024171 0027439
5228333 0017894 0024265 0027549
5363333 0017535 0024319 0027649
55 0017377 0024477 0027784
5635 001712 0024351 0027716
5771667 0016878 0024502 0027857
Experiment 4 50 degC
Time min 51 M 53 M 54 M
205
335 0044859 0017049 0028158
5066667 0033058 0020402 0034142
6416667 0028533 0021812 0036713
7766667 0025543 0022842 0038521
9133333 0022916 00235 0039813
105 0021041 0024107 004121
1185 0019498 0024602 0041829
132 0018156 0025096 0042681
1456667 0016918 0025264 0043145
1591667 0015895 0025503 0043496
1728333 0015031 0025778 0043978
1863333 0014386 0025935 0044504
20 0013754 0026166 0044669
2135 0013006 0026135 0045027
227 0012731 002645 004525
2406667 0012071 0026529 0045439
2541667 0011723 0026593 0045892
2678333 0011273 0026724 0046128
2813333 001075 0026737 004605
295 0010443 0026863 0046276
3085 0010126 0026964 0046178
3221667 0009967 0027158 0046613
3356667 0009483 00272 0046695
3493333 0009351 0027183 0047223
3628333 0009066 0027134 0047014
3763333 0008787 0027312 0047229
39 0008496 0027291 0047245
4035 000833 0027346 0047363
4171667 000802 0027313 0047267
4306667 0007943 0027459 0047585
206
4443333 0007797 0027504 0047612
4578333 0007612 0027442 0047469
4713333 0007363 0027731 0047777
485 0007162 0027549 0047689
4985 0007122 0027588 0047921
512 0006956 0027672 0048034
5256667 0006869 0027621 0047948
5391667 0006654 002781 0048184
5528333 0006511 0027703 0048181
5663333 0006367 0027739 0048193
5798333 0006367 0027751 0048241
752 PfBr
7521 Synthesis of PfBr material
To synthesise the PfBr material the synthesis reported by Tian and
Menard was approximately followed[249] To a suspension of magnesium turnings
(92 g 382 mmol) in anhydrous THF (5 mL) in a nitrogen atmosphere was added
05 mL of bromobenzene at room temperature to initiate the reaction The
reaction vessel was cooled to 0 degC using an ice bath and a solution of
bromobenzene in THF (12 M 270 mL) was added dropwise at 0 degC The reaction
medium was allowed to reach room temperature and stirred vigorously for 2
hours To this solution was added 9-fluorenone (301 g 186 mmol) in small
portions left to stir at room temperature for 1 hour The reaction was quenched
with dropwise addition of hydrochloric acid (1 M 100 mL) at 0 degC The solution
was extracted with Et2O (3 x 150 mL) and the combined organic layer was
washed with brine dried over MgSO4 filtered and concentrated under reduced
pressure to yield PfOH (426 g 89 ) NMR IR and mass spectroscopy analysis
confirmed the identity of the material
To prepare PfBr PfOH (361 g 140 mmol) was dissolved in toluene (150
mL) and aqueous HBr (48 ww 50 mL) was added at room temperature This
suspension was stirred vigorously at room temperature for 48 hours with the
vessel wrapped in foil to reduce light The mixture was extracted with toluene (3
207
x 100 mL) then the combined organic layer was washed with brine dried over
MgSO4 filtered and concentrated under reduced pressure to afford the crude
product The product was then recrystallised with hexane to afford PfBr (39 g 87
) 13C NMR IR and HPLC analysis confirmed the identity and purity of the
material as shown in Figure 753 Figure 754 and Figure 755 respectively
Figure 753 A 13C NMR confirming the presence of the PfBr material compared to literature
values to identify the material[249]
208
Figure 754 IR analysis of the PfBr material showing the absence of a hydroxy peak from any
residual PfOH
Figure 755 HPLC analysis of the PfBr material at 254 nm indicating that a pure product is
present
7522 Kinetic experiments
Three kinetic experiments were run at different temperatures 30 degC 35
degC and 40 degC For the first experiment at 30 degC alanine methyl ester
hydrochloride (0940 g 0007 mol) biphenyl (0195 g 0001 mol) and potassium
phosphate (35 g 0017 mol) were added to 5050 acetonitriledichloromethane
(375 mL) in a vessel A solution was then prepared of PfBr (0958 g 0003 mol)
in 5050 acetonitriledichloromethane (375 mL) and added to the reaction
vessel A sample was then immediately taken via HPLC then the stopwatch was
started to track the time of each injection This first HPLC serves as the artificial
209
zero time point then each subsequent HPLC injection followed every ~10
minutes thereafter
For the second experiment at 35 degC alanine methyl ester hydrochloride
(0977 g 0007 mol) biphenyl (0199 g 0001 mol) and potassium phosphate
(35 g 0017 mol) were added to 5050 acetonitriledichloromethane (375 mL)
in a vessel A solution was then prepared of PfBr (1017 g 0003 mol) in 5050
acetonitriledichloromethane (375 mL) and added to the reaction vessel A
sample was then immediately taken via HPLC then the stopwatch was started
to track the time of each injection This first HPLC serves as the artificial zero
time point then each subsequent HPLC injection followed every ~10 minutes
thereafter
For the third experiment at 40 degC alanine methyl ester hydrochloride
(0841 g 0006 mol) biphenyl (0219 g 0001 mol) and potassium phosphate
(35 g 0017 mol) were added to 5050 acetonitriledichloromethane (375 mL)
in a vessel A solution was then prepared of PfBr (1064 g 0003 mol) in 5050
acetonitriledichloromethane (375 mL) and added to the reaction vessel A
sample was then immediately taken via HPLC then the stopwatch was started
to track the time of each injection This first HPLC serves as the artificial zero
time point then each subsequent HPLC injection followed every ~10 minutes
thereafter
7523 HPLC analysis
All HPLC analysis was conducted using an Agilent 1100 series HPLC
instrument fitted with a Sigma Ascentis Express C18 reverse phase column (5cm
x 46mm 27 microm) Biphenyl was used as an internal standard The column
temperature was 40 degC and the HPLC method is shown
Time min A (water 01
TFA)
B (acetonitrile
01 TFA) Flow rate mL min-1
000 80 20 1
700 15 85 1
800 15 85 1
810 80 20 1
210
An example HPLC chromatogram during a kinetic experiment is shown in
Figure 756
Figure 756 An example HPLC chromatogram at 230 nm during a kinetic experiment in the
PfBr case study
7524 Raw data
Experiment 1 30 degC
Time min 57 M 58 M
0 0029401 0009756
95 0028029 0011516
195 0026429 0013131
29 0024664 0014922
40 0022779 0016856
50 0021252 0019153
605 0019363 0020372
71 0017813 0022065
83 001612 0023823
Experiment 2 35 degC
Time min 57 M 58 M
0 0036314 0006684
95 0030494 0011469
20 0028083 001372
315 0025271 0016536
41 0023355 0018562
211
51 0021259 0020741
625 0017572 0023705
Experiment 3 40 degC
Time min 57 M 58 M
0 0037032 0005772
105 0029931 0013994
205 0026302 0017446
305 0022947 002101
40 0020038 0023665
505 0017687 0025741
605 0016003 0027979
753 Maleic acid
7531 Example NMR
An example NMR spectrum is shown in Figure 754 where the peaks of
each species are highlighted
212
Figure 757 An example NMR spectrum from the maleic acid case study
7532 Raw data
Experiment 1 40 degC
Time min 513 M 515 M 516 M
0 0761 0 0
120 066207 0097408 0002283
240 0554769 0201665 0004947
360 0485518 0265589 0009893
Experiment 2 50 degC
Time min 513 M 515 M 516 M
0 0404344 0003268 0
325 0364451 0037657 186E-05
605 0346181 0071026 0000373
875 0319523 0095447 0001659
1225 0299017 0113343 0003225
2175 0234143 01661 0006264
2885 0204502 0198537 0009507
4175 015883 0230601 0015846
6875 0107378 0276833 0028336
13425 0052198 0313931 0053689
17825 0033649 0310389 0063196
28375 001799 0307033 0083516
Experiment 3 50 degC
Time min 513 M 515 M 516 M
0 0787537 0007088 0
28 0706604 0088537 565E-04
60 0625073 0164707 0002563
213
95 0556919 0226165 0006126
118 0530477 0271021 0007904
148 0480567 0308812 0011678
178 0426661 0316753 001425
208 0405376 035592 0020026
242 0384453 0382377 0021991
298 0344452 0431289 0029072
358 0299951 0456885 0034314
613 0205957 0541791 0061416
1306 0092916 0582232 0105274
1549 0076529 0596801 0119691
1768 0063259 0597105 0130915
Experiment 4 55 degC
Time min 513 M 515 M 516 M
0 0687045 0103644 0000811
30 0597449 019108 297E-03
60 0531145 0252908 0007448
90 0479052 0301502 0010947
168 0365378 0402913 0023209
228 031788 0443385 0030235
283 028467 0469404 0037426
348 0221288 0520375 0049837
408 0200913 0533579 0057007
Experiment 4 60 degC
Time min 513 M 515 M 516 M
0 0738693 0014307 0
60 0442764 0296682 136E-02
214
120 0335085 0389301 0029367
180 0265809 0447282 0040662
240 0224394 0475143 0053463
360 0117468 0551196 0084336
480 0070029 0575292 0107679
1320 0015813 0538395 0198792
76 Computational setup
761 Chapter 2 - 3
For all computation in Chapter 2 - 3 MATLAB 2018a was used on a
desktop computer with a 4-core Intel i5-2310 processor
762 Chapter 4 - 5
For all computation in Chapter 4 - 5 MATLAB 2020a was used on a
custom built laptop with an 8-core AMD Ryzen 7 4800H processor
Chapter 8 References
1 Miyaura N K Yamada and A Suzuki A new stereospecific cross-coupling by the palladium-catalyzed reaction of 1-alkenylboranes with 1-alkenyl or 1-alkynyl halides Tetrahedron Letters 1979 20(36) p 3437-3440
2 Sonogashira K Y Tohda and N Hagihara A convenient synthesis of acetylenes catalytic substitutions of acetylenic hydrogen with bromoalkenes iodoarenes and bromopyridines Tetrahedron Letters 1975 16(50) p 4467-4470
3 Wittig G and W Haag Uumlber Triphenyl‐phosphinmethylene als olefinbildende Reagenzien (II Mitteil 1) Chemische Berichte 1955 88(11) p 1654-1666
4 Baumann M et al A Perspective on Continuous Flow Chemistry in the Pharmaceutical Industry Organic Process Research amp Development 2020
5 Noeacutel T Flow into the Chemistry Curriculum Chemistry World 2019 6 Reizman BJ and KF Jensen Feedback in flow for accelerated reaction
development Accounts of Chemical Research 2016 49(9) p 1786-1796
7 Plutschack MB et al The Hitchhikerrsquos Guide to Flow Chemistry Chemical Reviews 2017 117(18) p 11796-11893
215
8 Granda JM et al Controlling an organic synthesis robot with machine learning to search for new reactivity Nature 2018 559(7714) p 377-381
9 Peela NR IC Lee and DG Vlachos Design and fabrication of a high-throughput microreactor and its evaluation for highly exothermic reactions Industrial amp Engineering Chemistry Research 2012 51(50) p 16270-16277
10 Rivera NR et al Investigation of a Flow Step Clogging Incident A Precautionary Note on the Use of THF in Commercial-Scale Continuous Process Organic Process Research amp Development 2019 23(11) p 2556-2561
11 Chapman MR et al Simple and versatile laboratory scale CSTR for multiphasic continuous-flow chemistry and long residence times Organic Process Research amp Development 2017 21(9) p 1294-1301
12 Guan F et al A universal reactor platform for batch and flow application to homogeneous and heterogeneous hydrogenation Reaction Chemistry amp Engineering 2020 5(10) p 1903-1908
13 Muumlller G et al Continuous chemistry in microreaction systems for practical use Chimia International Journal for Chemistry 2006 60(9) p 618-622
14 Pennemann H et al Benchmarking of microreactor applications Organic Process Research amp Development 2004 8(3) p 422-439
15 Schwalbe T V Autze and G Wille Chemical synthesis in microreactors Chimia-Zurich 2002 56(11) p 636-646
16 Fletcher PD et al Micro reactors principles and applications in organic synthesis Tetrahedron 2002 58(24) p 4735-4757
17 Haswell SJ and P Watts Green chemistry synthesis in micro reactors Green Chemistry 2003 5(2) p 240-249
18 Hessel V and H Loumlwe Organic synthesis with microstructured reactors Chemical Engineering Technology Industrial Chemistry‐Plant Equipment‐Process Engineering‐Biotechnology 2005 28(3) p 267-284
19 Wilson NG and T McCreedy On-chip catalysis using a lithographically fabricated glass microreactormdashthe dehydration of alcohols using sulfated zirconia Chemical Communications 2000(9) p 733-734
20 Wiles C et al 1 4-Addition of enolates to α β-unsaturated ketones within a micro reactor Lab on a Chip 2002 2(2) p 62-64
21 Wegner J S Ceylan and A Kirschning Flow chemistryndasha key enabling technology for (multistep) organic synthesis Advanced Synthesis Catalysis 2012 354(1) p 17-57
22 Nagaki A et al Lithiation of 1 2‐Dichloroethene in Flow Microreactors
Versatile Synthesis of Alkenes and Alkynes by Precise Residence‐Time Control Angewandte Chemie International Edition 2012 51(13) p 3245-3248
23 Mason BP et al Greener approaches to organic synthesis using microreactor technology Chemical Reviews 2007 107(6) p 2300-2318
24 Newman SG and KF Jensen The role of flow in green chemistry and engineering Green Chemistry 2013 15(6) p 1456-1472
25 Riva E et al Reaction of Grignard reagents with carbonyl compounds under continuous flow conditions Tetrahedron 2010 66(17) p 3242-3247
216
26 Baumann M and IR Baxendale The synthesis of active pharmaceutical ingredients (APIs) using continuous flow chemistry Beilstein Journal of Organic Chemistry 2015 11(1) p 1194-1219
27 Bogdan AR et al The continuous‐flow synthesis of ibuprofen Angewandte Chemie International Edition 2009 48(45) p 8547-8550
28 Sheldon RA Catalysis the key to waste minimization Journal of Chemical Technology amp Biotechnology International Research in Process Environmental amp Clean Technology 1997 68(4) p 381-388
29 Kummer A T Varga and L Nagy Semi-batch reactor control with NMPC avoiding thermal runaway Computers and Chemical Engineering 2020 134 p 106694
30 Kao C-S and K-H Hu Acrylic reactor runaway and explosion accident analysis Journal of Loss Prevention in the Process Industries 2002 15(3) p 213-222
31 Fabiano B et al A perspective on Seveso accident based on cause-consequences analysis by three different methods Journal of Loss Prevention in the Process Industries 2017 49 p 18-35
32 Malet-Sanz L and F Susanne Continuous flow synthesis A pharma perspective Journal of Medicinal Chemistry 2012 55(9) p 4062-4098
33 Kunz U and T Turek Flow through reactors for organic chemistry directly electrically heated tubular mini reactors as an enabling technology for organic synthesis Beilstein Journal of Organic Chemistry 2009 5(1) p 70
34 Kappe CO Controlled microwave heating in modern organic synthesis Angewandte Chemie International Edition 2004 43(46) p 6250-6284
35 Yoshida Ji A Nagaki and T Yamada Flash chemistry fast chemical synthesis by using microreactors Chemistry - A European Journal 2008 14(25) p 7450-7459
36 van der Linden JJ et al Investigation of the Moffattminus Swern oxidation in a continuous flow microreactor system Organic Process Research amp Development 2008 12(5) p 911-920
37 Cutler AH MJ Antal Jr and M Jones Jr A critical evaluation of the plug-flow idealization of tubular-flow reactor data Industrial amp Engineering Chemistry Research 1988 27(4) p 691-697
38 Lebl R et al Scalable continuous flow hydrogenations using PdAl2O3-coated rectangular cross-section 3D-printed static mixers Catalysis Today 2020
39 Jolley KE MR Chapman and AJ Blacker A general and atom-efficient continuous-flow approach to prepare amines amides and imines via reactive N-chloramines Beilstein Journal of Organic Chemistry 2018 14(1) p 2220-2228
40 Hessel V Novel process windowsndashgate to maximizing process intensification via flow chemistry Chemical Engineering Technology Industrial Chemistry-Plant Equipment-Process Engineering-Biotechnology 2009 32(11) p 1655-1681
41 Bogdan AR and NW Sach The Use of Copper Flow Reactor Technology for the Continuous Synthesis of 1 4‐Disubstituted 1 2 3‐Triazoles Advanced Synthesis Catalysis 2009 351(6) p 849-854
42 Hornung CH et al A microcapillary flow disc reactor for organic synthesis Organic Process Research amp Development 2007 11(3) p 399-405
217
43 Acke DR and CV Stevens Study of the Baylisminus Hillman reaction in a microreactor environment first continuous production of Baylisminus Hillman adducts Organic Process Research amp Development 2006 10(3) p 417-422
44 McQuade DT and PH Seeberger Applying flow chemistry Methods materials and multistep synthesis J Org Chem 2013 78(13) p 6384-6389
45 Razzaq T and CO Kappe Continuous Flow Organic Synthesis under High‐TemperaturePressure Conditions ChemistryndashAn Asian Journal 2010 5(6) p 1274-1289
46 Hartman RL Managing solids in microreactors for the upstream continuous processing of fine chemicals Organic Process Research amp Development 2012 16(5) p 870-887
47 Reichardt C Solvent effects in organic chemistry 1979 Verlag Chemie 48 Reichardt C and T Welton Solvents and solvent effects in organic
chemistry 2011 John Wiley amp Sons 49 Singh D and PL Dhepe An efficient catalytic transfer hydrogenation-
hydrodeoxygenation of lignin derived monomers Investigating catalyst properties-activity correlation Catalysis Communications 2021 149 p 106220
50 Baxendale IR et al Multistep synthesis using modular flow reactors BestmannndashOhira reagent for the formation of alkynes and triazoles Angewandte Chemie 2009 121(22) p 4077-4081
51 Alam MP et al C O bond formation in a microfluidic reactor high yield S N Ar substitution of heteroaryl chlorides Tetrahedron letters 2016 57(19) p 2059-2062
52 Gutmann B et al On the Fischer Indole Synthesis of 7-Ethyltryptophol Mechanistic and Process Intensification Studies under Continuous Flow Conditions Organic Process Research amp Development 2013 17(2) p 294-302
53 Marre S Y Roig and C Aymonier Supercritical microfluidics Opportunities in flow-through chemistry and materials science The Journal of Supercritical Fluids 2012 66 p 251-264
54 Savage PE Organic chemical reactions in supercritical water Chemical reviews 1999 99(2) p 603-622
55 Adschiri T et al Green materials synthesis with supercritical water Green Chemistry 2011 13(6) p 1380-1390
56 Munshi P and S Bhaduri Supercritical CO 2 a twenty-first century solvent for the chemical industry Current Science (00113891) 2009 97(1)
57 Eckert CA et al Sustainable reactions in tunable solvents The Journal of Physical Chemistry B 2004 108(47) p 18108-18118
58 ONeil A and JJ Watkins Fabrication of device nanostructures using supercritical fluids MRS bulletin 2005 30(12) p 967-975
59 Romang AH and JJ Watkins Supercritical fluids for the fabrication of semiconductor devices emerging or missed opportunities Chemical reviews 2010 110(1) p 459
60 Marre S F Cansell and C Aymonier Tailor-made surface properties of particles with a hydrophilic or hydrophobic polymer shell mediated by supercritical CO2 Langmuir 2008 24(1) p 252
218
61 Cansell F and C Aymonier Design of functional nanostructured materials using supercritical fluids The Journal of Supercritical Fluids 2009 47(3) p 508-516
62 Chamberlain TW et al Catalytic nanoreactors in continuous flow hydrogenation inside single-walled carbon nanotubes using supercritical CO 2 Chemical Communications 2014 50(40) p 5200-5202
63 Devetta L et al Kinetic experiments and modeling of a three-phase catalytic hydrogenation reaction in supercritical CO 2 Catalysis Today 1999 48(1) p 337-345
64 Han X and M Poliakoff Continuous reactions in supercritical carbon dioxide problems solutions and possible ways forward Chemical Society Reviews 2012 41(4) p 1428-1436
65 Licence P et al Chemical reactions in supercritical carbon dioxide from laboratory to commercial plant Green Chemistry 2003 5(2) p 99-104
66 Leitner W Supercritical carbon dioxide as a green reaction medium for catalysis Accounts of chemical research 2002 35(9) p 746-756
67 McHugh M and V Krukonis Supercritical fluid extraction principles and practice 2013 Elsevier
68 Hitzler MG et al Selective catalytic hydrogenation of organic compounds in supercritical fluids as a continuous process Organic Process Research amp Development 1998 2(3) p 137-146
69 Cason JP and CB Roberts Metallic copper nanoparticle synthesis in AOT reverse micelles in compressed propane and supercritical ethane solutions The Journal of Physical Chemistry B 2000 104(6) p 1217-1221
70 Hyde JR et al Continuous catalytic reactions in supercritical fluids Applied Catalysis A General 2001 222(1) p 119-131
71 Hoffmann N Photochemical reactions of aromatic compounds and the concept of the photon as a traceless reagent Photochemical amp Photobiological Sciences 2012 11(11) p 1613-1641
72 Hoffmann N Photochemical reactions as key steps in organic synthesis Chemical Reviews 2008 108(3) p 1052
73 Knowles JP LD Elliott and KI Booker-Milburn Flow photochemistry Old light through new windows Beilstein journal of organic chemistry 2012 8 p 2025
74 Hook BD et al A practical flow reactor for continuous organic photochemistry The Journal of organic chemistry 2005 70(19) p 7558-7564
75 Schuster EM and P Wipf Photochemical flow reactions Israel Journal of Chemistry 2014 54(4) p 361-370
76 Yoshida J-i et al Modern strategies in electroorganic synthesis Chemical reviews 2008 108(7) p 2265-2299
77 Watts K A Baker and T Wirth Electrochemical synthesis in microreactors Journal of Flow Chemistry 2014 4(1) p 2-11
78 Horii D T Fuchigami and M Atobe A new approach to anodic substitution reaction using parallel laminar flow in a micro-flow reactor Journal of the American Chemical Society 2007 129(38) p 11692-11693
79 Horii D et al A novel electrosynthetic system for anodic substitution reactions by using parallel laminar flow in a microflow reactor Chemistry-A European Journal 2008 14(33) p 10382-10387
219
80 ZNIDARŠIC-PLAZL P Enzymatic microreactors utilizing non-aqueous media Chimica Oggi-Chemistry Today 2014 32 p 1
81 Rao NN et al Continuous biocatalytic processes Organic Process Research amp Development 2009 13(3) p 607-616
82 Babich L et al Continuous‐Flow Reactor‐Based Enzymatic Synthesis
of Phosphorylated Compounds on a Large Scale Chemistry-A European Journal 2012 18(21) p 6604-6609
83 Jas G and A Kirschning Continuous flow techniques in organic synthesis Chemistry-A European Journal 2003 9(23) p 5708-5723
84 Chen P et al A practical high through-put continuous process for the synthesis of chiral cyanohydrins The Journal of organic chemistry 2002 67(23) p 8251-8253
85 Liu Z et al Combined biosynthetic pathway for de novo production of UDP‐galactose catalysis with multiple enzymes immobilized on agarose
beads ChemBioChem 2002 3(4) p 348-355 86 Kobayashi S H Ishitani and S Nagayama Lanthanide triflate catalyzed
imino Diels-Alder reactions convenient syntheses of pyridine and quinoline derivatives Synthesis 1995 1995(09) p 1195-1202
87 Usutani H et al Generation and reactions of o-bromophenyllithium without benzyne formation using a microreactor Journal of the American Chemical Society 2007 129(11) p 3046-3047
88 Britton J and CL Raston Multi-step continuous-flow synthesis Chemical Society Reviews 2017 46(5) p 1250-1271
89 Snead DR and TF Jamison A three‐minute synthesis and purification
of ibuprofen Pushing the limits of continuous‐flow processing Angewandte Chemie International Edition 2015 54(3) p 983-987
90 Sahoo HR JG Kralj and KF Jensen Multistep Continuous‐Flow Microchemical Synthesis Involving Multiple Reactions and Separations Angewandte Chemie 2007 119(30) p 5806-5810
91 Hartman RL et al Multistep microchemical synthesis enabled by microfluidic distillation Angewandte Chemie International Edition 2010 49(5) p 899-903
92 Gloumlckner S et al The rapid synthesis of oxazolines and their heterogeneous oxidation to oxazoles under flow conditions Organic amp biomolecular chemistry 2015 13(1) p 207-214
93 Roberge DM et al Microreactor technology a revolution for the fine chemical and pharmaceutical industries Chemical engineering amp technology 2005 28(3) p 318-323
94 Exarchou V et al LC-UV-solid-phase extraction-NMR-MS combined with a cryogenic flow probe and its application to the identification of compounds present in Greek oregano Analytical Chemistry 2003 75(22) p 6288-6294
95 Benito-Lopez F et al Optical fiber-based on-line UVVis spectroscopic monitoring of chemical reaction kinetics under high pressure in a capillary microreactor Chemical Communications 2005(22) p 2857-2859
96 Mozharov S et al Improved method for kinetic studies in microreactors using flow manipulation and noninvasive Raman spectrometry Journal of the American Chemical Society 2011 133(10) p 3601-3608
97 Song H and RF Ismagilov Millisecond kinetics on a microfluidic chip using nanoliters of reagents Journal of the American Chemical Society 2003 125(47) p 14613-14619
220
98 Martinuzzi I et al Reaction mechanism for glycerol dehydration in the gas phase over a solid acid catalyst determined with on-line gas chromatography Chemical Engineering Science 2014 116 p 118-127
99 Moret S et al Microwave assisted saponification (MAS) followed by on-line liquid chromatography (LC)ndashgas chromatography (GC) for high-throughput and high-sensitivity determination of mineral oil in different cereal-based foodstuffs Food chemistry 2016 196 p 50-57
100 Grunwaldt J-D and BS Clausen Combining XRD and EXAFS with on-line catalytic studies for in situ characterization of catalysts Topics in Catalysis 2002 18(1) p 37-43
101 De Beer T et al In‐line and real‐time process monitoring of a freeze drying process using Raman and NIR spectroscopy as complementary process analytical technology (PAT) tools Journal of pharmaceutical sciences 2009 98(9) p 3430-3446
102 Ward H and FE Sistare On-line determination and control of the water content in a continuous conversion reactor using NIR spectroscopy Analytica chimica acta 2007 595(1) p 319-322
103 Cervera-Padrell AE et al Monitoring and control of a continuous Grignard reaction for the synthesis of an active pharmaceutical ingredient intermediate using inline NIR spectroscopy Organic Process Research amp Development 2012 16(5) p 901-914
104 Bristow TW et al On-line monitoring of continuous flow chemical synthesis using a portable small footprint mass spectrometer Journal of The American Society for Mass Spectrometry 2014 25(10) p 1794-1802
105 Roscioli KM et al Real time pharmaceutical reaction monitoring by electrospray ion mobility-mass spectrometry International Journal of Mass Spectrometry 2013 336 p 27-36
106 Mathieson JS et al Continuous parallel ESI-MS analysis of reactions carried out in a bespoke 3D printed device Beilstein journal of nanotechnology 2013 4 p 285
107 Robert J and A JohnaacuteBlacker Online quantitative mass spectrometry for the rapid adaptive optimisation of automated flow reactors Reaction Chemistry amp Engineering 2016 1(1) p 96-100
108 Browne DL et al Continuous flow reaction monitoring using an on‐line miniature mass spectrometer Rapid Communications in Mass Spectrometry 2012 26(17) p 1999-2010
109 Zhang J et al Design and scaling up of microchemical systems a review Annual review of chemical and biomolecular engineering 2017 8 p 285-305
110 Rasheed M and T Wirth Fast optimisation of a Diels-Alder reaction in a flow microreactor by in-line HPLC analysis Chemistry Today 2011 29(3) p 56
111 Welch CJ et al Online analysis of flowing streams using microflow HPLC Organic Process Research amp Development 2009 13(5) p 1022-1025
112 Carter CF et al ReactIR flow cell a new analytical tool for continuous flow chemical processing Organic Process Research amp Development 2010 14(2) p 393-404
113 Malet-Sanz L et al Preparation of arylsulfonyl chlorides by chlorosulfonylation of in situ generated diazonium salts using a
221
continuous flow reactor Organic amp biomolecular chemistry 2010 8(23) p 5324-5332
114 Carter CF et al The continuous flow synthesis of butane-2 3-diacetal protected building blocks using microreactors Organic amp biomolecular chemistry 2010 8(7) p 1588-1595
115 Smith CJ et al A fully automated multistep flow synthesis of 5-amino-4-cyano-1 2 3-triazoles Organic amp biomolecular chemistry 2011 9(6) p 1938-1947
116 Floyd TM MA Schmidt and KF Jensen Silicon micromixers with infrared detection for studies of liquid-phase reactions Industrial amp engineering chemistry research 2005 44(8) p 2351-2358
117 Carter CF et al Synthesis of acetal protected building blocks using flow chemistry with flow IR analysis preparation of butane-2 3-diacetal tartrates Organic amp biomolecular chemistry 2009 7(22) p 4594-4597
118 Sans V et al A self optimizing synthetic organic reactor system using real-time in-line NMR spectroscopy Chemical science 2015 6(2) p 1258-1264
119 Maiwald M et al Quantitative high-resolution on-line NMR spectroscopy in reaction and process monitoring Journal of Magnetic Resonance 2004 166(2) p 135-146
120 Maiwald M et al Quantitative on-line high-resolution NMR spectroscopy in process engineering applications Analytical and bioanalytical chemistry 2003 375(8) p 1111-1115
121 Dalitz F et al Process and reaction monitoring by low-field NMR spectroscopy Progress in nuclear magnetic resonance spectroscopy 2012 60 p 52-70
122 Silva Elipe MV and RR Milburn Monitoring chemical reactions by low‐field benchtop NMR at 45 MHz pros and cons Magnetic Resonance in Chemistry 2016 54(6) p 437-443
123 Goldbach M et al Preparation of Grignard reagents from magnesium metal under continuous flow conditions and on-line monitoring by NMR spectroscopy Tetrahedron Letters 2016 57(1) p 122-125
124 Houben C and AA Lapkin Automatic discovery and optimization of chemical processes Current Opinion in Chemical Engineering 2015 9 p 1-7
125 Cox BG Modern liquid phase kinetics 1994 Oxford University Press 126 Perrin CL Linear or nonlinear least-squares analysis of kinetic data
Journal of Chemical Education 2017 94(6) p 669-672 127 Michaelis L and ML Menten Die kinetik der invertinwirkung 2007
Universitaumltsbibliothek Johann Christian Senckenberg 128 Johnson KA A century of enzyme kinetic analysis 1913 to 2013 FEBS
Letters 2013 587(17) p 2753-2766 129 Lineweaver H and D Burk The determination of enzyme dissociation
constants Journal of the American Chemical Society 1934 56(3) p 658-666
130 Nielsen CD-T and J Bureacutes Visual kinetic analysis Chemical Science 2019 10(2) p 348-353
131 Blackmond DG Reaction progress kinetic analysis a powerful methodology for mechanistic studies of complex catalytic reactions Angewandte Chemie International Edition 2005 44(28) p 4302-4320
222
132 Rosner T et al Kinetic studies of Heck coupling reactions using palladacycle catalysts experimental and kinetic modeling of the role of dimer species Journal of the American Chemical Society 2001 123(9) p 1848-1855
133 Nielsen LP et al Mechanistic investigation leads to a synthetic improvement in the hydrolytic kinetic resolution of terminal epoxides Journal of the American Chemical Society 2004 126(5) p 1360-1362
134 Baxter RD et al Mechanistic rationalization of unusual kinetics in Pd-catalyzed CndashH olefination Journal of the American Chemical Society 2012 134(10) p 4600-4606
135 Blackmond DG Kinetic profiling of catalytic organic reactions as a mechanistic tool Journal of the American Chemical Society 2015 137(34) p 10852-10866
136 Bureacutes J A simple graphical method to determine the order in catalyst Angewandte Chemie International Edition 2016 55(6) p 2028-2031
137 Bureacutes J Variable time normalization analysis General graphical elucidation of reaction orders from concentration profiles Angewandte Chemie International Edition 2016 55(52) p 16084-16087
138 Mathew JS et al Investigations of Pd-catalyzed ArX coupling reactions informed by reaction progress kinetic analysis The Journal of Organic Chemistry 2006 71(13) p 4711-4722
139 Streuff J et al Mechanism of the tiIII-catalyzed acyloin-type umpolung a catalyst-controlled radical reaction Journal of the American Chemical Society 2015 137(45) p 14396-14405
140 Lin S and EN Jacobsen Thiourea-catalysed ring opening of episulfonium ions with indole derivatives by means of stabilizing non-covalent interactions Nature Chemistry 2012 4(10) p 817
141 Noda H et al Catalytic asymmetric synthesis of CF 3-substituted tertiary propargylic alcohols via direct aldol reaction of α-N 3 amide Chemical Science 2017 8(4) p 3260-3269
142 Lundberg H et al Mechanistic elucidation of zirconium-catalyzed direct amidation Journal of the American Chemical Society 2017 139(6) p 2286-2295
143 Vasilenko V CK Blasius and LH Gade One-Pot Sequential Kinetic Profiling of a Highly Reactive Manganese Catalyst for Ketone Hydroboration Leveraging σ-Bond Metathesis via Alkoxide Exchange Steps Journal of the American Chemical Society 2018 140(29) p 9244-9254
144 Franceschini G and S Macchietto Model-based design of experiments for parameter precision State of the art Chemical Engineering Science 2008 63(19) p 4846-4872
145 Galvanin F S Macchietto and F Bezzo Model-based design of parallel experiments Industrial amp Engineering Chemistry Research 2007 46(3) p 871-882
146 Waldron C et al Model-based design of transient flow experiments for the identification of kinetic parameters Reaction Chemistry amp Engineering 2020 5(1) p 112-123
147 Von Stosch M et al Hybrid semi-parametric modeling in process systems engineering Past present and future Computers and Chemical Engineering 2014 60 p 86-101
223
148 de Juan A et al Combining hard-and soft-modelling to solve kinetic problems Chemometrics Intelligent Laboratory Systems 2000 54(2) p 123-141
149 de Carvalho AR et al Comparison of PLS and kinetic models for a second-order reaction as monitored using ultraviolet visible and mid-infrared spectroscopy Talanta 2006 68(4) p 1190-1200
150 Fath V et al Efficient Kinetic Data Acquisition and Model Prediction Continuous Flow Microreactors Inline FT-IR Spectroscopy and Self-modeling Curve Resolution Organic Process Research amp Development 2020
151 Toch K JW Thybaut and GB Marin A systematic methodology for kinetic modeling of chemical reactions applied to n‐hexane hydroisomerization AIChE Journal 2015 61(3) p 880-892
152 Yang S-T X Liu and Y Zhang Metabolic engineeringndashapplications methods and challenges in Bioprocessing for Value-Added Products from Renewable Resources 2007 Elsevier p 73-118
153 Vasquez E and T Eldredge Process modeling for hydrocarbon fuel conversion in Advances in Clean Hydrocarbon Fuel Processing 2011 Elsevier p 509-545
154 Paul S V Kurin and S Whiteson Fast Efficient Hyperparameter Tuning for Policy Gradient Methods in Advances in Neural Information Processing Systems 2019
155 Wistuba M N Schilling and L Schmidt-Thieme Scalable gaussian process-based transfer surrogates for hyperparameter optimization Machine Learning 2018 107(1) p 43-78
156 Lerman P Fitting segmented regression models by grid search Journal of the Royal Statistical Society Series C 1980 29(1) p 77-84
157 Huang C-YR C-Y Lai and K-TT Cheng Fundamentals of algorithms in Electronic Design Automation 2009 Elsevier p 173-234
158 Boyd SP and L Vandenberghe Convex optimization 2004 Cambridge university press p 1-16
159 Vasiljević D Comparison of optimization algorithms in Classical and Evolutionary Algorithms in the Optimization of Optical Systems 2002 Springer p 83-88
160 Inuiguchi M and J Ramık Possibilistic linear programming a brief review of fuzzy mathematical programming and a comparison with stochastic programming in portfolio selection problem Fuzzy Sets amp Systems 2000 111(1) p 3-28
161 Beacutenichou M et al Experiments in mixed-integer linear programming Mathematical Programming 1971 1(1) p 76-94
162 Kuhn HW and AW Tucker Nonlinear programming in Traces and emergence of nonlinear programming 2014 Springer p 247-258
163 Bregman LM The relaxation method of finding the common point of convex sets and its application to the solution of problems in convex programming USSR Computational Mathetmatics and Mathematical Physics 1967 7(3) p 200-217
164 Frank M and P Wolfe An algorithm for quadratic programming Naval Research Logistics Quarterly 1956 3(1‐2) p 95-110
165 Drummond LG and BF Svaiter A steepest descent method for vector optimization Journal of Computational amp Applied Mathematics 2005 175(2) p 395-414
224
166 Clayton AD et al Algorithms for the self-optimisation of chemical reactions Reaction Chemistry amp Engineering 2019 4(9) p 1545-1554
167 Spendley W GR Hext and FR Himsworth Sequential application of simplex designs in optimisation and evolutionary operation Technometrics 1962 4(4) p 441-461
168 Nelder JA and R Mead A simplex method for function minimization The Computer Journal 1965 7(4) p 308-313
169 Byrd RH JC Gilbert and J Nocedal A trust region method based on interior point techniques for nonlinear programming Mathematical Programming 2000 89(1) p 149-185
170 Waltz RA et al An interior algorithm for nonlinear optimization that combines line search and trust region steps Mathematical Programming 2006 107(3) p 391-408
171 Whitley D A genetic algorithm tutorial Statistics amp Computing 1994 4(2) p 65-85
172 Brochu E VM Cora and N De Freitas A tutorial on Bayesian optimization of expensive cost functions with application to active user modeling and hierarchical reinforcement learning preprint arXiv10122599 2010
173 Tsu J VHG Diacuteaz and MJ Willis Computational approaches to kinetic model selection Computers and Chemical Engineering 2019 121 p 618-632
174 de la Mare PBD Reaction Mechanism Encyclopaeligdia Britannica 2008 [cited 2020 April 13] Available from httpswwwbritannicacomsciencereaction-mechanism
175 Carey FA and RJ Sundberg Study and Description of Organic Reaction Mechanisms Advanced Organic Chemistry Part A Structure amp Mechanisms 2000 p 187-261
176 Willis MJ and M von Stosch Inference of chemical reaction networks using mixed integer linear programming Computers and Chemical Engineering 2016 90 p 31-43
177 Aris R and R Mah Independence of chemical reactions Industrial Engineering Chemistry Fundamentals 1963 2(2) p 90-94
178 Bonvin D and D Rippin Target factor analysis for the identification of stoichiometric models Chemical Engineering Science 1990 45(12) p 3417-3426
179 Amrhein M B Srinivasan and D Bonvin Target factor analysis of reaction data Use of data pre-treatment and reaction-invariant relationships Chemical Engineering Science 1999 54(5) p 579-591
180 Georgakis C and R Lin Stoichiometric Modeling of Complex Pharmaceutical Reactions in Proceedings of the Annual AIChE meeting in Cincinnati OH November 2005
181 Brendel M D Bonvin and W Marquardt Incremental identification of kinetic models for homogeneous reaction systems Chemical Engineering Science 2006 61(16) p 5404-5420
182 Bhatt N et al Incremental identification of reaction systemsmdashA comparison between rate-based and extent-based approaches Chemical Engineering Science 2012 83 p 24-38
183 Burnham SC et al Inference of chemical reaction networks Chemical Engineering Science 2008 63(4) p 862-873
225
184 Crampin EJ S Schnell and PE McSharry Mathematical and computational techniques to deduce complex biochemical reaction mechanisms Progress in Biophysics amp Molecular Biology 2004 86(1) p 77-112
185 Searson DP et al Inference of chemical reaction networks using hybrid s-system models Chemical Product amp Process Modelling 2007 2(1)
186 Srividhya J et al Reconstructing biochemical pathways from time course data Proteomics 2007 7(6) p 828-838
187 Searson DP MJ Willis and A Wright Reverse Engineering Chemical Reaction Networks from Time Series Data Statistical Modelling of Molecular Descriptors in QSARQSPR 2014 2(12)
188 Koza JR et al Automatic computational discovery of chemical reaction networks using genetic programming in Computational Discovery of Scientific Knowledge 2007 Springer p 205-227
189 Hii CJ AR Wright and MJ Willis Utilizing a genetic algorithm to elucidate chemical reaction networks An experimental case study International Journal of Chemical Engineering Applications 2014 5(6) p 516
190 Chellaboina V et al Modeling and analysis of mass-action kinetics IEEE Control Systems Magazine 2009 29(4) p 60-78
191 Sayikli C and EZ Bagci Limitations of using mass action kinetics method in modeling biochemical systems illustration for a second order reaction in International Conference on Computational Science and Its Applications 2011 Springer
192 Furusjouml E O Svensson and L-G Danielsson Estimation of kinetic parameters from non-isothermal batch experiments monitored by in situ vibrational spectroscopy Chemometrics Intelligent Laboratory Systems 2003 66(1) p 1-14
193 Pagano RL et al Cure kinetic parameter estimation of thermosetting resins with isothermal data by using particle swarm optimization European Polymer Journal 2008 44(8) p 2678-2686
194 Zhang Y-Y and J-H Liu Kinetic study of enantioselective hydrolysis of (R S)-ketoprofen ethyl ester using immobilized T laibacchii lipase Biochemical Engineering Journal 2011 54(1) p 40-46
195 VanBuren V L Cassimeris and DJ Odde Mechanochemical model of microtubule structure and self-assembly kinetics Biophysical Journal 2005 89(5) p 2911-2926
196 Gao D Y Xiao and A Varma Guaiacol hydrodeoxygenation over platinum catalyst reaction pathways and kinetics Industrial Engineering Chemistry Research 2015 54(43) p 10638-10644
197 Changi S TM Brown and PE Savage Reaction kinetics and pathways for phytol in high-temperature water Chemical Engineering Journal 2012 189 p 336-345
198 Zhang Y et al One-pot Enzymatic Synthesis of Enantiopure 1 3-oxathiolane by Trichosporon Laibachii Lipase and Kinetic Model Organic Process Research amp Development 2020
199 Villaverde AF et al Benchmarking optimization methods for parameter estimation in large kinetic models Bioinformatics 2019 35(5) p 830-838
200 Akaike H Fitting autoregressive models for prediction Annals of the Institute of Statistical Mathematics 1969 21(1) p 243-247
226
201 Hurvich CM and C-L Tsai Regression and time series model selection in small samples Biometrika 1989 76(2) p 297-307
202 Burnham KP and DR Anderson A practical information-theoretic approach Model Selection and Multimodel Inference Vol 2 49-96 2002 New York Springer
203 Gholamipour-Shirazi A and C Rolando Alkylation of substituted benzoic acids in a continuous flow microfluidic microreactor kinetics and linear free energy relationships Organic Process Research amp Development 2012 16(5) p 811-818
204 Niemeier JK et al Application of kinetic modeling and competitive solvent hydrolysis in the development of a highly selective hydrolysis of a nitrile to an amide Organic Process Research amp Development 2014 18(3) p 410-416
205 Hartridge H and FJW Roughton A method of measuring the velocity of very rapid chemical reactions Proceedings of the Royal Society of London Series A Containing Papers of a Mathematical Physical Character 1923 104(726) p 376-394
206 Gibson QH Rapid mixing Stopped flow Methods in Enzymology 1969 16 p 187-228
207 Seong GH J Heo and RM Crooks Measurement of enzyme kinetics using a continuous-flow microfluidic system Analytical Chemistry 2003 75(13) p 3161-3167
208 Rozich AF and DJ Castens Inhibition kinetics of nitrification in continuous-flow reactors Water Pollution Control Federation 1986 p 220-226
209 Christensen M et al Development of an automated kinetic profiling system with online HPLC for reaction optimization Reaction Chemistry amp Engineering 2019 4(9) p 1555-1558
210 Johnson KA Rapid quench kinetic analysis of polymerases adenosinetriphosphatases and enzyme intermediates Contemporary Enzyme Kinetics Mechanism Reliable Lab Solutions 2009 p 407
211 Probstein RF Physicochemical hydrodynamics an introduction 2005 John Wiley amp Sons
212 Konermann L Monitoring reaction kinetics in solution by continuous-flow methods the effects of convection and molecular diffusion under laminar flow conditions Journal of Physical Chemistry A 1999 103(36) p 7210-7216
213 Konermann L et al Acid-induced denaturation of myoglobin studied by time-resolved electrospray ionization mass spectrometry Biochemistry 1997 36(21) p 6448-6454
214 Konermann L B Collings and D Douglas Cytochrome c folding kinetics studied by time-resolved electrospray ionization mass spectrometry Biochemistry 1997 36(18) p 5554-5559
215 Zechel DL et al Pre-steady state kinetic analysis of an enzymatic reaction monitored by time-resolved electrospray ionization mass spectrometry Biochemistry 1998 37(21) p 7664-7669
216 Zhou X R Medhekar and MD Toney A continuous-flow system for high-precision kinetics using small volumes Analytical Chemistry 2003 75(15) p 3681-3687
217 Jensen KF BJ Reizman and SG Newman Tools for chemical synthesis in microsystems Lab on a Chip 2014 14(17) p 3206-3212
227
218 Hartman RL JP McMullen and KF Jensen Deciding whether to go with the flow evaluating the merits of flow reactors for synthesis Angewandte Chemie International Edition 2011 50(33) p 7502-7519
219 Baxendale IR L Brocken and CJ Mallia Flow chemistry approaches directed at improving chemical synthesis Green Processing Synthesis 2013 2(3) p 211-230
220 Gutmann B D Cantillo and CO Kappe Continuous‐flow technologymdasha tool for the safe manufacturing of active pharmaceutical ingredients Angewandte Chemie International Edition 2015 54(23) p 6688-6728
221 Bedore MW et al Aminolysis of epoxides in a microreactor system a continuous flow approach to β-amino alcohols Organic Process Research amp Development 2010 14(2) p 432-440
222 Zaborenko N et al Kinetic and scale-up investigations of epoxide aminolysis in microreactors at high temperatures and pressures Organic Process Research amp Development 2011 15(1) p 131-139
223 Monteiro JL et al Continuous Flow Homolytic Aromatic Substitution with Electrophilic Radicals A Fast and Scalable Protocol for Trifluoromethylation Chemistry - A European Journal 2017 23(1) p 176-186
224 Nagaki A D Ichinari and J-i Yoshida Three-component coupling based on flash chemistry Carbolithiation of benzyne with functionalized aryllithiums followed by reactions with electrophiles Journal of the American Chemical Society 2014 136(35) p 12245-12248
225 Hone CA et al Rapid multistep kinetic model generation from transient flow data Reaction Chemistry amp Engineering 2017 2(2) p 103-108
226 Valera FE et al The Flowrsquos the Thinghellip Or Is It Assessing the Merits of Homogeneous Reactions in Flask and Flow Angewandte Chemie International Edition 2010 49(14) p 2478-2485
227 Moore JS and KF Jensen ldquoBatchrdquo kinetics in flow online IR analysis and continuous control Angewandte Chemie International Edition 2014 53(2) p 470-473
228 Haas CP et al Automated generation of photochemical reaction data by transient flow experiments coupled with online HPLC analysis Reaction Chemistry amp Engineering 2020
229 Schaber SD et al Design execution and analysis of time-varying experiments for model discrimination and parameter estimation in microreactors Organic Process Research amp Development 2014 18(11) p 1461-1467
230 Aroh KC and KF Jensen Efficient kinetic experiments in continuous flow microreactors Reaction Chemistry amp Engineering 2018 3(1) p 94-101
231 Gomez MV et al Determination of kinetic parameters within a single nonisothermal on-flow experiment by nanoliter NMR spectroscopy Analytical Chemistry 2015 87(20) p 10547-10555
232 Waldron C et al An autonomous microreactor platform for the rapid identification of kinetic models Reaction Chemistry amp Engineering 2019 4(9) p 1623-1636
233 Hone CA et al Definitive screening designs for multistep kinetic models in flow Reaction Chemistry amp Engineering 2019 4(9) p 1565-1570
228
234 Holmes N et al Online quantitative mass spectrometry for the rapid adaptive optimisation of automated flow reactors Reaction Chemistry amp Engineering 2016 1(1) p 96-100
235 Levenspiel O Chemical reaction engineering Industrial amp Engineering Chemistry Research 1999 38(11) p 4140-4143
236 McMullen JP and KF Jensen Rapid determination of reaction kinetics with an automated microfluidic system Organic Process Research amp Development 2011 15(2) p 398-407
237 Nagy KD et al Mixing and dispersion in small-scale flow systems Organic Process Research amp Development 2012 16(5) p 976-981
238 Afonso CA et al Comprehensive Organic Chemistry Experiments for the Laboratory Classroom 2016 Royal Society of Chemistry
239 Fluorochem 2019 27062019] Available from httpwwwfluorochemcoukProductsProductcode=303261
240 Ashworth IW et al Where has my acid gone Understanding the self-catalyzed esterification of maleic acid in methanol during salt formation Organic Process Research amp Development 2012 16(10) p 1646-1651
241 Gilbert JC EG McKinley and D-R Hou The nature of cyclopentyne from different precursors Tetrahedron 1997 53(29) p 9891-9902
242 Takaki K et al Intermolecular hydrophosphination of alkynes and related carbonminus carbon multiple bonds catalyzed by organoytterbiums The Journal of Organic Chemistry 2003 68(17) p 6554-6565
243 Berthelot DJ-C et al Heterocyclic amides as modulators of TRPA1 2013 Google Patents
244 Binch H et al Aminopyridine derivatives having aurora a selective inhibitory action 2013 Google Patents
245 Lood CS et al Synthesis of Chiral (Indol-2-yl) methanamines and Insight into the Stereochemistry Protecting Effects of the 9-Phenyl-9-fluorenyl Protecting Group European Journal of Organic Chemistry 2015 3793 p 3805
246 Poisson J-F A Orellana and AE Greene Stereocontrolled synthesis of (minus)-kainic acid from trans-4-hydroxy-L-proline The Journal of Organic Chemistry 2005 70(26) p 10860-10863
247 Lood C M Nieger and A Koskinen Enantiospecific gram scale synthesis of (S)-eleagnine Tetrahedron 2015 71(30) p 5019-5024
248 9-Bromo-9-phenylfluorene Sigma Aldrich Available from httpswwwsigmaaldrichcomcatalogproductaldrich368873 [27092020]
249 Tian Z and F Menard Synthesis of Kainoids and C4 Derivatives The Journal of Organic Chemistry 2018 83(11) p 6162-6170
250 9-Fluorenone Sigma Aldrich Available from httpswwwsigmaaldrichcomcatalogproductaldrichf1506 [27092020]

1
The candidate confirms that the work submitted is his own except where
work which has formed part of jointly authored publications has been included
The contribution of the candidate and the other authors to this work has been
explicitly indicated below The candidate confirms that appropriate credit has
been given within the thesis where reference has been made to the work of
others
Chapters 2 - 3 are based on work from a jointly authored publication
bull Connor J Taylor Megan Booth Jamie A Manson Mark J Willis
Graeme Clemens Brian A Taylor Thomas W Chamberlain and Richard
A Bourne Rapid Automated Determination of Reaction Models and
Kinetic Parameters Chemical Engineering Journal (2020) 127017
The work contained within this publication that is directly attributable to myself
is all experimentation coding of the relevant methodology and preparation of the
manuscript Megan Booth assisted in the setting up and running of some
experimentation (notably the phenyl acetate and paracetamol case studies)
Jamie A Manson assisted in the preparation of the manuscript (notably the
reactor engineering section) Mark J Willis assisted in the direction of the coding
of the relevant methodology Graeme Clemens assisted in the setting up of some
experimentation (notably the metoprolol case study) and general supervision
Brian A Taylor assisted in the direction of the approach and general supervision
Thomas W Chamberlain and Richard A Bourne both assisted in the direction of
the approach general supervision and preparation of the manuscript
This copy has been supplied on the understanding that it is copyright material
and that no quotation from the thesis may be published without proper
acknowledgement
The right of Connor Jack Taylor to be identified as Author of this work has
been asserted by Connor Jack Taylor in accordance with the Copyright Designs
and Patents Act 1988
2
Acknowledgements
This project could not have been completed without the ongoing help of
several individuals who have helped guide the project into the finished thesis and
publications Firstly Irsquod like to thank Dr Richard Bourne for his continued support
advice and brilliance in assisting with the project wherever possible in both
running experiments and preparing project directions Your supervision style of
treating a PhD student as an academic partner is well appreciated and has
undoubtedly led to an excellent postgraduate experience
Dr Thomas Chamberlain thank you also for your ongoing support and
contributions to my supervision Although yoursquore busy it does not go unnoticed
that you are always willing to go the extra mile in proofreading posterspapers
and even just transfer report chapters - your sharp wit means that you can sell
my science better than anyone can including myself
To Brian and Graeme thank you also for your support in the direction of
my project and sourcing opportunities for me to present and develop myself as
a researcher I really appreciate it Thank you also to Mark Willis Ian Ashworth
Rob Cox and the rest of the CPUT team at AZ for your invaluable thoughts and
discussions
To Adam Jamie and Calum thank you for all of your nonsense talks and
debates particularly in the control room that helped keep me sane - even the
consistent whinging was funny More recently Ollie and Holly have been helping
with that also Ricardo thank you for all of your advice as well as your nonsense
talking too (but only after you shut off your lsquowork personarsquo after 6pm) Brendan
thank you for being a consistent source of hyperactive entertainment donrsquot let
Luke try to calm your ideas Rosie and Sam thank you for all of the tea breaks
at AZ that also managed to keep us all sane Mary thank you for your help in
running the lab and similarly thank you to everyone in the iPRD for your help
and support over the years John Bao Nando Ilias Claudio Micaela Nisha
Alison Christiane James Pia and the ones that have moved on Alastair Will
Mike Becky Chris Horb Chris Hone Alvaro and not forgetting Fanfu
To Rhiann and my encouraging parents thank you for always being there
and motivating me to be my best and inspiring me to go further
3
Abstract
A major bottleneck in the transition from chemistry research at lab scale
to process development is a lack of quantitative chemical synthesis information
Critical aspects of this information include knowing the correct reaction model
and precise kinetic parameters If this information is available classical reaction
engineering principles may be utilised to shorten process development times and
lower costs
Identifying the correct reaction model for a particular process however
can be challenging and time-consuming particularly for physical-organic
chemists and kinetics experts that may be busy with other aspects of process
development The work presented herein describes computational approaches
that automatically determine the most likely kinetic model and associated
parameters based on the experimental data supplied without expert chemical
intuition
The concept for these methodologies involves a comprehensive model
evaluation tool The experimental data and the species involved in the process
are inputted Based on mass balance all mass-balance-allowed transformations
between these species are identified All possible models are then compiled from
this list of transformations featuring unique combinations of these model terms
Every model is then evaluated using ordinary differential equation (ODE) solvers
and optimisation algorithms to maximise the convergence of simulated reaction
progression with the experimental data thereby identifying the kinetic
parameters Each model is then statistically evaluated to determine which model
is the most likely to be correct
Using these methodologies allows any chemist to automatically determine
a reaction model and kinetic constants for a particular system by performing all
kinetic analysis autonomously Their most expensive resource time can then be
focussed on other tasks that cannot be automated
4
Table of Contents
Acknowledgements 2
Abstract 3
Table of Contents 4
List of Schemes 7
List of Figures 9
List of Tables 14
List of Abbreviations 17
Chapter 1 Introduction 19
11 Continuous flow chemistry 19
111 Batch and flow reactions 19
112 Reactions in flow 24
113 Reaction analysis 33
114 Continuous flow chemistry summary 40
12 Kinetic methodologies 40
121 Conventional methodologies 41
122 Visual kinetic analysis 49
123 Kinetic methodologies summary 56
13 Optimisation 56
131 Local algorithms 59
132 Global 63
133 Optimisation summary 68
14 Research aim 69
Chapter 2 Development of the computational approach to kinetic model determination 70
21 Introduction 70
22 Development of the approach 73
221 Kinetic model generation 74
222 Kinetic model fitting 79
223 Statistical analysis 85
224 Other considerations 86
225 Overview 87
23 Simulated verification of the approach 89
231 Case study Benzoic acid alkylation 90
232 Case study Nitrile hydrolysis 93
5
233 Case study SNAr kinetics 97
24 Conclusion 102
Chapter 3 Experimental applications of the computational approach to kinetic model and parameter determination 103
31 Introduction 103
32 Experimental setup 112
33 Case study Phenyl acetate 115
34 Case study Paracetamol 118
35 Case study Metoprolol 121
36 Conclusion 125
Chapter 4 The development of an improved computational approach to kinetic model determination 126
41 Introduction 126
42 Methodology advancement 127
421 Capabilities 127
422 Rules 131
423 Overview 136
43 Simulated verifications of the approach 138
431 Case study SNAr kinetics 138
432 Case study Pentyne kinetics 145
433 Case study Ytterbium catalysis 149
44 Conclusion 152
Chapter 5 Experimental applications of the new approach 153
51 Introduction 153
52 Case study SNAr kinetics 154
53 Case study PfBr 157
54 Case study Maleic acid 162
55 Conclusion 166
Chapter 6 Conclusion amp future work 167
Chapter 7 Appendix 168
71 Chapter 1 168
72 Chapter 2 168
721 Generated data set for case study benzoic acid alkylation 169
722 Generated data set for case study nitrile hydrolysis 170
723 Generated data set for the case study SNAr kinetics 171
73 Chapter 3 173
6
731 Phenyl acetate 173
732 Paracetamol 178
733 Metoprolol 187
74 Chapter 4 193
741 Generated data set for the case study SNAr kinetics 193
742 Generated data set for the case study Pentyne 195
743 Generated data set for the case study Ytterbium catalysis 197
75 Chapter 5 198
751 SNAr kinetics 198
752 PfBr 206
753 Maleic acid 211
76 Computational setup 214
761 Chapter 2 - 3 214
762 Chapter 4 - 5 214
Chapter 8 References 214
7
List of Schemes
Chapter 1
Scheme 11 The conversion of hexanol 11 to hexene 12 in a continuous flow setup[19]
21
Scheme 12 The flow synthesis of the adduct 15 via a Michael addition between the
dicarbonyl 13 and the alkyne 14[20] 22
Scheme 13 The multistep continuous flow synthesis of ibuprofen 18 23
Scheme 14 The temperature-accelerated SNAr reaction of 19 with 110 to form 111 in
THF (boiling point 66 degC) under flow conditions[51] 26
Scheme 15 The Fischer Indole synthesis of 114 from the hydrazine 112 and
dihydrofuran 113 in methanol (boiling point 65 degC) using a flow setup[52] 26
Scheme 16 The hydrogenation of isophorone 115 to TMCH 116[65] 27
Scheme 17 The [2 + 2] photocycloaddition of malemide 117 with 1-hexyne to produce
the cyclic product 118[74] 29
Scheme 18 An electrochemical facilitated nucleophilic substitution reaction to afford the
product 121[78] 29
Scheme 19 An enzyme catalysed continuous cyanohydrin formation forming 123[84] 30
Scheme 110 Multiple enzymatic catalysed continuous process to form UDP galactose
125[85] Individual enzymes stated 30
Scheme 111 The multi-step flow synthesis of 127 from coupling o-dibromobenzene 126
with varying electrophiles via sequential halogen-lithium exchange reactions[87] 31
Scheme 112 A multi-step flow synthesis of ibuprofen 18 involving an in-line purification
step[89] 33
Scheme 113 A reaction scheme showing the formation of benzyne 132 which was
followed by analysis via mass spectrometry[108] 35
Scheme 114 A reaction scheme showing the thermal isomerization of 133a to 133b
which was followed by analysis via HPLC[111] 36
Scheme 115 A reaction scheme showing a fluorination reaction yielding 136 which was
followed by analysis via in-line IR[112] 37
Scheme 116 The Grignard reaction that was tracked by on-line NMR[123] 38
Scheme 117 A Heck coupling of an aryl bromide 140 with 141 to form the adduct 142
This case study showed no indication of product inhibition or catalyst deactivation 50
Scheme 118 The epoxide opening of 143 to form 144 using a catalytic system This case
study indicates some product inhibition or catalyst deactivation 51
Scheme 119 A nickel-catalysed alkylation reaction of chalcone 145 with Et2Zn 146 to
form the adduct 147 53
Chapter 2
Scheme 21 An example esterification reaction 75
Scheme 22 The reaction of benzoic acid with iodomethane to form methyl benzoate
Modelled as a second order reaction 91
8
Scheme 23 The reaction of a nitrile with hydroxide to form the corresponding amide which
is susceptible to further hydrolysis to form the carboxylic acid Modelled as sequential
second order reactions 94
Scheme 24 The reaction of 24-dichloropyrimidine 210 with morpholine 211 to form the
4-substituted product 212 and the 2-substituted product 213 and the subsequent
bis-substituted product 214 98
Chapter 3
Scheme 31 The base catalysed Knoevenagel condensation between benzaldehyde and
ethyl cyanoacetate to form 34 109
Scheme 32 The Paal-Knorr reaction of 25-hexanedione 35 and ethanolamine 36 to
yield 37 to show how the kinetics of a process can be observed by using a controlled
ramp technique 111
Scheme 33 The reaction of phenol 38 with acetyl chloride 39 to form phenyl acetate
310 and hydrochloric acid 311 115
Scheme 34 The reaction of 4-aminophenol with acetic anhydride to form paracetamol in
step one followed by a further reaction with acetic anhydride to form diacetamate in
step two 118
Scheme 35 The reaction of the epoxide starting material with isopropylamine to form
metoprolol as well as the overreaction to form the bis-substituted product 122
Chapter 4
Scheme 41 The self-catalysed reaction of maleic acid 41 and methanol 42 to form the
mono-product 43 and the di-product 44[237] 132
Scheme 42 The reaction of 24-difluoronitrobenzene 45 with pyrrolidine 46 to form the
ortho-substituted product 47 and the para-substituted product 48 Consecutive
reactions then occur to form the bis-substituted product 49 In each reaction
hydrofluoric acid 410 is formed[222] 139
Scheme 43 The reaction of the starting material 411 with the spirodiene 412 to form
the product 413 and LiBr 414[238] 146
Scheme 44 The reaction of the starting material 415 with diphenylphosphine 416 in the
presence of the ytterbium catalyst 417 to form the product 418 where [Yb] Yb(η2-
Ph2CNPh)(hmpa)3[239] 149
Chapter 5
Scheme 51 The reaction of 246-trichloropyrimidine (SM) 51 with ethyl 4-
aminobutanoate 52 to form the major 2-substituted SNAr product 53 and the minor
4-substituted SNAr product 54 154
Scheme 52 The reaction of alanine methyl ester (Al-Me) 56 with PfBr 57 to form the
protected amino acid 58 Hydrobromic acid 59 is also generated as a side product
158
Scheme 53 The retrosynthetic methodology of the transformation of L-alanine to (S)-
eleagnine via the Pf-protected alanine methyl ester (Pf-Al-Me)[244] 158
Scheme 54 The synthetic route from cheap starting materials bromobenzene 510 and
fluorene 511 to the intermediate PfOH 512 and finally the desired PfBr material
58 159
9
Scheme 55 The reaction of maleic acid 513 and methanol 514 to form the mono-
product 515 and the di-product 516 163
List of Figures
Chapter 1
Figure 11 An annotated picture of an in-line liquid-liquid separator developed by Zaiput
Flow Technologies 33
Figure 12 The response surface showing temperature and residence time effects on the
thermal isomerisation of 133a[108] Reproduced with permission 36
Figure 13 An IR absorption showing the detailed rise of the C-F bond peak over time
indicating the extent of reaction completion[109] Reproduced with permission 37
Figure 1 4 The on-line NMR analysis in the aromatic region of the Grignard reaction
shown in Scheme 116 at different time intervals[120] Reproduced with permission 38
Figure 15 A graphical representation of generated time-series data for a first order
reaction shown in eqn 11 The data is log-transformed to give a linear fit where the
gradient is equal to the rate constant multiplied by -1 42
Figure 16 A graphical representation of generated time-series data for a zero order
reaction shown in eqn 11 This data does not need to be transformed as the linear fit
is equal to the rate constant multiplied by -1 43
Figure 17 A graphical representation of generated time-series data for a second order
reaction shown in eqn 11 This data is plotted as the reciprocal of the concentration
vs time and the gradient of the linear fit to this data is the rate constant 43
Figure 18 A graphical representation of generated time-series data for a second order
reaction shown in eqn 18 where [A] = [B] = This data is plotted as a log-
transformed concentration fraction vs time The gradient of the linear fit to this data is
the rate constant multiplied by the initial concentration of B minus the initial
concentration of A 45
Figure 19 A representation of Michaelis-Menten kinetics where the initial reaction rate of
individual experiments with differing substrate concentrations x is plotted This plot is
then used to determine the kinetic parameters Vmax and KM 48
Figure 110 A representation of the Lineweaver-Burk equation where the inverse of the
initial reaction rate of individual experiments with differing substrate concentrations x
is plotted This plot is then used to determine the kinetic parameters Vmax and KM 49
Figure 111 An overlay of two experimental datasets with the same lsquoexcessrsquo of reactant
concentration for the reaction shown in Scheme 117 This overlap indicates no
product inhibition or catalyst deactivation Reproduced with permission 51
Figure 112 As there is no overlay in the two experimental datasets with the same lsquoexcessrsquo
of reactant concentration in the reaction system shown in Scheme 118 this indicates
some product inhibition or catalyst deactivation A further experiment is necessary to
determine what is occurring Reproduced with permission 52
10
Figure 113 Graphical rate equations for the alkylation reaction shown in Scheme 119 a)
Standard graphical rate equation b) Using the RPKA methodology to observe any
overlap in the lsquodifferent excessrsquo reaction curves This overlap indicates that the
reaction order of Et2Zn is 1 Reproduced with permission 53
Figure 114 A time shift of the profiles of two reactions to observe overlaying plots This
allows the comparison of two profiles with the same starting material concentrations
but different product concentrations therefore identifying signs of product inhibition or
catalyst deactivation Reproduced with permission 54
Figure 115 A summary of the use of RPKA and VTNA a) catalyst deactivation or product
inhibition b) catalyst order c) reagent order d) catalyst deactivation or product
inhibition e) catalyst order f) reagent order Reproduced with permission 56
Figure 116 Some different classes of optimisation problem where variable n is an input
variable and the function evaluation is a measure of how the function is minimised
with the changing variable a) Linear optimisation problem b) Convex optimisation
problem c) Non-linear optimisation problem 59
Figure 117 A representation of a steepest-descent algorithm minimising a 2-dimensional
contoured parameter space where о indicates a measurement Where red areas are
function maxima and blue areas are function minima 60
Figure 118 A representation of a simplex optimisation for a 2-dimensional contoured
parameter space where the numbered vertices of each polyhedron indicate a
measurement Where red areas are function maxima and blue areas are function
minima 61
Figure 119 The different geometric transformations of the Nelder-Mead simplex inside
contraction (XIC) multiple contraction (MC) outside contraction (XOC) reflection (XR)
and expansion (XE) 62
Figure 120 A 1-dimensional optimisation using an interior-point method The approximate
objective function is minimised for the starting trust region t0 63
Figure 121 A 1-dimensional optimisation using an interior-point method The approximate
objective function is minimised for the sequential trust regions until the overall function
is minimised The path that the algorithm can take can be described as the algorithm
path or the central path towards the optimum 63
Figure 122 A depiction of the flow of a simple genetic algorithm 64
Figure 123 A depiction of one iteration of a simple genetic algorithm Figure adapted from
works reported by Boyd amp Vandenberghe[155] 65
Figure 124 The Bayesian optimisation of f(x) where (i) - (viii) represent the sequential
iterations of the minimisation The acquisition function is shown in red measurements
are shown as red dots and the current estimated surrogate model is shown in blue
with its corresponding 95 confidence interval The maximum of the acquisition
function indicates the next measurement to be taken 67
Figure 125 A graphical method to solving ILP problems where C1 - 4 indicate the linear
constraints the green area indicates the feasible region f shows the objective
function red dots represent the integer values of the inputs and P1 and P2 indicate
two feasible potential maxima to the problem Figure adapted from works reported by
Boyd amp Vandenberghe[155] 68
Chapter 2
11
Figure 21 The Mass Matrix inputted into the approach assigning mass to each of the
species 75
Figure 22 The stoichiometric matrices for the reaction model shown in Scheme 21 as
well as the overall stoichiometry matrix S 76
Figure 23 The ILP optimisation identifying a feasible solution to the objective function
hence identifying a mass-balance-allowed reaction Where X1 = A X2 = B X3 = C X4
= D 76
Figure 24 A visual representation of all of the possible reaction models when given five
mass-balance-allowed sample reactions each shown as a different coloured block
When i = 1 each reaction is in itself a model and when i gt 1 each reaction behaves
as a model fragment These fragments when combined in different ways provide full
and unique reaction models each of which are to be assessed for their validity with
respect to experimental data 78
Figure 25 A schematic summarising how the model generation stage of the approach
progresses Where the participating species are inputted and sorted ODE functions
that describe all possible mass-balance-allowed reactions are outputted 79
Figure 26 The iterations of an optimisation algorithm with respect to the convergence of
simulated ODEs with sample data - this occurs via the minimisation of the SSE
output 81
Figure 27 An outline of the stages of the computational approach 88
Figure 28 An example showing the generation of a simulated data set from the literature
a) An ODE is simulated for a particular model with a set of kinetic parameters in this
case A rarr B where mdash = A mdash = B b) Particular time points are taken from this ODE
to represent individual measurements where x = A x = B c) Up to 5 relative
random error is added to these measurements to more closely resemble real
experimental data 90
Figure 29 The fit of the identified model and kinetic parameters to the generated
experimental data with starting concentrations of 01 M benzoic acid and 011 M
iodomethane Where x = benzoic acid x = iodomethane x = methyl benzoate mdash =
benzoic acid (ODE) mdash = iodomethane (ODE) mdash = methyl benzoate (ODE) 93
Figure 210 The fit of the identified model and kinetic parameters to the generated
experimental data with starting concentrations of 1 M nitrile and 2 M hydroxide at 90
degC Where x = nitrile x = amide x = carboxylic acid mdash = nitrile (ODE) mdash = amide
(ODE) mdash = carboxylic acid (ODE) 97
Figure 211 The fit of the identified model and kinetic parameters to the generated
experimental data with starting concentrations of 1 M 24-dichloropyrimidine and 22
M morpholine at 90 degC Where x = 24-dichloropyrimidine x = 4-substituted product x
= 2-substituted product x = bis-substituted product mdash = 24-dichloropyrimidine
(ODE) mdash = 4-substituted product (ODE) mdash = 2-substituted product (ODE) mdash = bis-
substituted product Graph is only shown to 260 minutes to show curvature of the
initial data points 102
Chapter 3
Figure 31 A diagram to show the direction and flows within a flow regime where a)
laminar flow b) turbulent flow 104
12
Figure 32 A plug flow reactor model where there is perfect mixing in the radial direction
but no forward or backward mixing in the axial direction Plugs 1 and 2 are examples
of the infinitely short plugs existing within this reactor model 105
Figure 33 A depiction of how a kinetic experiment can be run utilising a step change in
flow rates between two steady-states (I and II) allowing time-series data to be plotted
from transient data Figure adapted from Mozharov et al[93] 107
Figure 34 A kinetic profile generated from the Knoevenagel condensation shown in
Scheme 31 where kinetic information was obtained by measuring conversation at
given residence times at steady-state at two temperatures Steady-state markers x
are shown as part of the lsquoA Modelrsquo Reproduced with permission 109
Figure 35 A kinetic profile generated from the Knoevenagel condensation shown in
Scheme 31 where kinetic information was obtained using a flow rate step-change at
two temperatures Steady-state markers x are shown as part of the lsquoA Modelrsquo where
step-change markers o are shown as part of the lsquoB Modelrsquo Reproduced with
permission 110
Figure 36 A depiction of how a continuous flow reactor may be described as a series of
sequential pseudo-batch reactors where the colour represents the extent of
conversion from low (green) to high (red) Q represents the total flow rate ti
represents the initial time of each pseudo-batch reactor entering the reactor tf
represents the final time tm is the time at which the concentration is actually
measured by the IR probe Reproduced with permission 110
Figure 37 A combination of the kinetic models for the reaction yielding 37 in Scheme 32
where the differing colours represent different values of S where S is a corrective
residence time multiplier to show the reproducibility of the controlled flow ramp
methodology S = 14 (blue) S = 13 (red) S = 12 (green) S= 23 (orange) steady-
state experiments = x Reproduced with permission 111
Figure 38 A photograph of the automated continuous flow reactor used for this work 113
Figure 39 A mathematically correct representation of how linear gradient flow ramps can
be utilised to sample with a high data density on the initial curvature of the kinetic plot
Where diams = data point Tn = experiment temperature Q = total flow rate Time = time
the reaction has been running τ = residence time that the reaction mixture
experiences 114
Figure 310 Kinetic profiles for two flow ramp experiments at 65 degC and 75 degC where x =
phenol x = phenyl acetate mdash = phenol (ODE) mdash = phenyl acetate (ODE) 117
Figure 311 Graphs showing the agreement between steady-state and flow ramp
measurements for the reaction of phenol with acetyl chloride where curves are fitted
to the steady-state data Where = phenol (steady-state) x = phenol (flow ramp) =
phenyl acetate (steady-state) x = phenyl acetate (flow ramp) 118
Figure 312 Kinetic profiles for four flow ramp experiments at 30 degC 60 degC 160 degC and 180
degC where x = 4-aminophenol x = paracetamol x = diacetamate mdash = 4-aminophenol
(ODE) mdash = paracetamol (ODE) mdash = diacetamate (ODE) See Chapter 732 for full
experimental conditions and raw data 120
Figure 313 Kinetic profiles for the flow ramp experiments at 130 degC 150 degC 190 degC and
210 degC where x = starting material x = Metoprolol x = bis-substituted product mdash =
starting material (ODE) mdash = Metoprolol (ODE) mdash = bis-substituted product (ODE)
See Chapter 733 for full experimental conditions and raw data 123
13
Chapter 4
Figure 41 An illustration of how the lsquoinflationrsquo step takes all mass-balance-allowed
transformations sequentially then deduces all allowed integer and non-integer orders
and generates corresponding rate laws for these transformations If catalytic reactions
are to be explored also rate laws for these catalytic dependencies are also
generated These transformations are all then saved from which full reaction models
can be constructed 130
Figure 42 An overview of the updated computational approach to kinetic model and
parameter determination 137
Figure 43 The fit of the identified model and kinetic parameters to the generated
experimental data with starting concentrations of 12 M 24-difluoronitrobenzene and 3
M pyrrolidine at 30 degC Where x = 24-difluoronitrobenzene x = ortho-substituted
product x = para-substituted product x = bis-substituted product mdash = 24-
difluoronitrobenzene (ODE) mdash = ortho-substituted product (ODE) mdash = para-
substituted product (ODE) mdash = bis-substituted product Plot only shown to 500
minutes to the show curvature of the initial data points 145
Figure 44 The fit of the identified model and kinetic parameters to the generated
experimental data with starting concentrations of 1 M starting material and 08 M
spirodiene at -78 degC Where x = starting material x = spirodiene x = product mdash =
starting material (ODE) mdash = spirodiene (ODE) mdash = product (ODE) 149
Figure 45 The fit of the identified model and kinetic parameters to the generated
experimental data with starting concentrations of 15 M starting material 2 M
diphenylphosphine and 01 M ytterbium catalyst at 22 degC Where x = starting
material x = diphenylphosphine x = product mdash = starting material (ODE) mdash =
diphenylphosphine (ODE) mdash = product (ODE) 152
Chapter 5
Figure 51 The distinctive proton peaks shown in red that are monitored via NMR as time
progresses in the SNAr case study 155
Figure 52 Kinetic profiles for four kinetic experiments at -25 degC 0 degC 25 degC and 50 degC
where = starting material = 2-substituted product = 4-substituted product mdash =
starting material (ODE) mdash = 2-substituted product (ODE) mdash = 4-substituted product
(ODE) See Chapter 751 for full experimental conditions and raw data 156
Figure 53 The batch setup for experimentation in the PfBr case study where the
temperature probe is submerged in the reaction medium that is heated via a heater
stirrer 160
Figure 54 Kinetic profiles for three kinetic experiments at 30 degC 35 degC and 40 degC where
red plots indicate PfBr concentrations and blue plots indicate Pf-Al-Me concentrations
At 30 degC = experimental data mdash = ODE At 35 degC = experimental data - - - =
ODE At 40 degC = experimental data = ODE See Chapter 752 for full
experimental conditions and raw data 161
Figure 55 Kinetic profiles for two kinetic experiments at 50 degC with the initial concentration
of maleic acid at 04 M and 08 M At 04 M = maleic acid mdash = maleic acid (ODE)
= mono-product mdash = mono-product (ODE) = di-product mdash = di-product (ODE)
At 08 M = maleic acid - - - = maleic acid (ODE) = mono-product - - - = mono-
product (ODE) = di-product - - - = di-product (ODE) See Chapter 753 for full
experimental conditions and raw data 165
14
Chapter 73
Figure 731 The flow reactor setup for the phenyl acetate case study experiments 174
Figure 732 An example HPLC chromatogram in the phenyl acetate case study at 254 nm
175
Figure 733 The reactor setup for the paracetamol flow ramp experiment at 30 degC 179
Figure 734 The reactor setup for the paracetamol flow ramp experiment at 60 degC 180
Figure 735 The reactor setup for the paracetamol flow ramp experiment at 160 degC 180
Figure 736 The reactor setup for the paracetamol flow ramp experiment at 180 degC 180
Figure 737 An example HPLC chromatogram from the paracetamol case study showing
the separation of all reaction components at 254 nm 181
Figure 738 A photograph of the automated flow system at AstraZeneca 188
Figure 739 The reactor setup for the metoprolol flow ramp experiments at 190210 degC in
Leeds 189
Figure 7310 The reactor setup for the metoprolol flow ramp experiments at 130150 degC at
AstraZeneca 190
Figure 7311 An example HPLC chromatogram during a kinetic experiment in the
metoprolol case study at 220 nm 190
Chapter 75
Figure 751 The dedicated NMR spectrometer used for kinetic experiments in the SNAr
kinetics case study 199
Figure 752 lsquoStackedrsquo NMR spectrum showing several NMR spectra over time in the 25 degC
experiment 200
Figure 753 A 13C NMR confirming the presence of the PfBr material compared to
literature values to identify the material[246] 207
Figure 754 IR analysis of the PfBr material showing the absence of a hydroxy peak from
any residual PfOH 208
Figure 755 HPLC analysis of the PfBr material at 254 nm indicating that a pure product is
present 208
Figure 756 An example HPLC chromatogram at 230 nm during a kinetic experiment in the
PfBr case study 210
Figure 757 An example NMR spectrum from the maleic acid case study 212
List of Tables
Chapter 1
Table 11 A table summarising reaction analysis techniques in flow systems adapted from
Houben and Lapkin[121] 39
Chapter 2
15
Table 21 A table showing the optimised k values for the identified models in the benzoic
acid alkylation case study alongside each modelrsquos SSE and AICC 92
Table 22 A table showing the top three ranked models for the nitrile hydrolysis case study
The kinetic parameters for each reaction within the model is shown as well as the
SSE and AICC evaluation 95
Table 23 A table showing the top three ranked models for the SNAr case study The kinetic
parameters for each reaction within the model is shown as well as the SSE and AICC
evaluation 100
Chapter 3
Table 31 Evaluation of the feasibility of each reaction model for the phenyl acetate study
116
Table 32 Evaluation of the feasibility of each reaction model for the paracetamol study 120
Table 33 Evaluation of the feasibility of each reaction model for the metoprolol study 124
Chapter 4
Table 41 A table showing examples of allowed and disallowed models according to Rule
4 134
Table 42 A table showing the top five ranked models for the SNAr case study as identified
by the old approach The kinetic parameters for each reaction within the model are
shown as well as the SSE and AICC evaluation 142
Table 43 A table showing the top five ranked models for the SNAr case study as identified
by the new approach The kinetic parameters for each reaction within the model are
shown as well as the SSE and AICC evaluation α denotes a variable molar
dependence within the kinetic parameter units depending on the rate law 143
Table 44 A table showing the top five ranked models for the pentyne case study as
identified by the new approach The kinetic parameters for each reaction within the
model are shown as well as the SSE and AICC evaluation α denotes a variable molar
dependence within the kinetic parameter units depending on the rate law 147
Table 45 A table showing the top five ranked models for the ytterbium catalysis case study
as identified by the new approach The kinetic parameters for each reaction within the
model are shown as well as the SSE and AICC evaluation α denotes a variable molar
dependence within the kinetic parameter units depending on the rate law 150
Chapter 5
Table 51 Evaluation of the feasibility of each reaction model for the SNAr case study
where α is variable for each model depending on the overall model order 156
Table 52 Evaluation of the feasibility of each reaction model for the PfBr case study where
α is variable for each model depending on the overall model order 161
Table 53 Evaluation of the feasibility of each reaction model for the maleic acid case
study where α is variable for each model depending on the overall model order 165
16
17
List of Abbreviations
A Pre-exponential factor
Ac Acetyl
AIC Akaikes information criterion
AICC Corrected Akaikes information criterion
API Active pharmaceutical ingredient
Aq Aqueous
Bn Benzyl
bp Boiling point
Bu Butyl
cm Centimetre
CSTR Continuous stirred tank reactor
CRN Chemical reaction network
DCM Dichloromethane
Ea Activation energy
Equiv Equivalents
Et Ethyl
g Gram
GA Genetic algorithm
GC Gas chromatography
h Hour
HPLC High performance liquid chromatography
Hz Hertz
ID Inner diameter
ILP Integer linear programming
IR Infrared
k Rate constant
K Kelvin
kref Reference rate constant
18
L Litre
m Metre
M Molar
Me Methyl
MILP Mixed integer linear programming
min Minute
mL Millilitre
MM Mass matrix
mmol Millimole
mol Mole
MS Mass spectrometry
NMR Nuclear magnetic resonance
OD Outer diameter
ODE Ordinary differential equation
PFR Plug flow reactor
Ph Phenyl
R Ideal gas constant
Re Reynolds number
S Stoichiometry
SNAr Nucleophilic aromatic substitution
SSE Sum of squared error
T Temperature
TFA Target factor analysis
tR Residence time
Tref Reference temperature
tRes Residence time
V Volume
19
Chapter 1 Introduction
The main aim of this project is to develop and advance methodologies for
kinetic model determination and parameter estimation The acquisition of the
experimental data necessary for these studies is flexible and can be obtained by
any means However given the numerous advantages of continuous flow
chemistry and the availability of a flow chemistry platform many chemistries
were performed using this regime For this reason continuous flow chemistry is
broadly covered in this introduction as well as a comprehensive look at methods
of obtaining kinetic data in Chapter 31
Current methodologies of obtaining kinetic information are herein broadly
covered and critically analysed However in-depth discussions about the
relevant literature to the kinetic methodologies developed during this project are
highlighted in Chapter 21 Furthermore as these kinetic methodologies feature
significant use of optimisation algorithms discussions regarding optimisation
problems and common algorithms are also found in this introductory chapter
This coverage depicts the general relevancy of different types of algorithm to
particular circumstances with specific kinetic fitting algorithm discussions
featured in Chapter 2222
11 Continuous flow chemistry
Continuous flow chemistry is rapidly becoming the optimum way to conduct
a wide variety of different chemical reactions This section introduces the concept
of flow chemistry featuring a discussion of the advantages and disadvantages
as well as when to adopt this methodology This broad introduction also covers
different reports from the literature pertaining to different classes of reaction in
flow as well as how these reactions can be analysed and optimised either on-
line or off-line
111 Batch and flow reactions
To discuss flow chemistry it is first important to understand the
differences between this methodology and traditional batch chemistry Batch
reactions are still the lsquonormalrsquo bench practice today after being standardised 200
years ago in the time of Friedrich Wӧhler as there are still advantages to
20
conducting synthesis this way This batch reaction approach to synthesis
whereby the chemistry is conducted essentially in a vessel is historically the
most fruitful and rewarding approach in terms of discoveries Suzuki couplings[1]
Sonogashira couplings[2] and the Wittig reaction[3] among hundreds of other
ground breaking mechanisms were all discovered via batch reactions A flow
chemistry regime differs in that there is no bulk reaction medium in a vessel By
using pumps tubing and differing flow reactors small volumes of reaction
medium are constantly flowing and reacting to provide a continuous outlet stream
of reacted material Although this flow methodology has been known for a
relatively long time the historic uptake in synthetic laboratories has been low[4]
However as flow technology improves and becomes easier to adopt in the
laboratory[5] it is increasingly important to evaluate whether a particular chemical
process would be most efficient in batch or flow regimes in terms of product
output or otherwise
For example when considering exploratory synthesis in contrast to batch
using flow chemistry consisting of tubing and microreactors to attempt to
discover new syntheses by exploring discrete options is not typically a good
application[6 7] This is because the main strengths of flow processes come
mainly from already existing reaction pathways where optimising product output
is the focus and to construct a flow system to conduct a purely exploratory
reaction is a traditionally inefficient use of time whereas batch can be
implemented much faster In recent years however high throughput flow
systems have been developed for automated discovery[8 9] Unfortunately
though as the equipment for this type of discovery is specialist and can be
expensive it can still be argued that simple exploratory benchtop batch reactions
are still much more efficient in terms of time and cost
There are other general instances where batch is often still favourable for
chemical transformations for example when precipitation drives reaction
completion[7] In batch this isnrsquot an issue however when using a flow setup this
will frequently result in channel mixer or pressure regulator clogging - this is also
true when using high viscous liquids[10] As a general rule precipitation
suspensions and other instances where solids are used can lead to
complications in the process - this can be mitigated through reaction dilution but
may then suffer from low productivity The introduction however of standardised
21
laboratory equipment (such as miniaturised CSTRs Freactors) for continuous
flow can then facilitate such multiphase processes to allow maintained
efficiency[11 12]
Despite some of these limitations there are significant benefits to
continuous flow processes which have become apparent alongside the
tremendous practical advances in recent years many of which have been
utilised in actually transferring batch processes into flow as more and more
batch procedures are superseded[13-15] Reduction of reaction times[16 17] and
increases in conversion and selectivity may be observed by transferring to flow
processes[18] This may be for a number of reasons but is likely due to the
increased mass transfer that can be expected from flow systems as well as the
ability to increase the temperature of the reaction medium further past the boiling
point of the solvent which is discussed further in Chapter 1121 This will lead
to an overall increase in both the reaction rate and productivity Two examples
are shown herein where increased conversion was observed Scheme 11
reports the synthesis of hexene from hexanol in flow by Wilson and McCreedy[19]
with a conversion of around 90 whereas in conventional batch reactors this
reaction conversion does not exceed 60 Most notably there was no
degradation of the performance after three days of continuous use which may
be expected from a fixed bed catalyst Scheme 12 shows another direct
comparison of conversion in flow and batch by Wiles et al[20] where the Michael
addition is completed in 20 minutes with 100 conversion in flow compared to
the reaction completion in 24 hours with 89 conversion in batch
Scheme 11 The conversion of hexanol 11 to hexene 12 in a continuous flow setup[19]
22
Scheme 12 The flow synthesis of the adduct 15 via a Michael addition between the
dicarbonyl 13 and the alkyne 14[20]
A main advantage to using flow chemistry setups to perform reactions
arises from the equipment featured within the setups themselves - namely the
pumps Pump flow rates can be set to very precise flows which can very
accurately deliver particular ratios of reagents at given points along the flow
setup[21-23] This ensures that the correct stoichiometry of the reagents is present
in the reaction and these exact stoichiometries can be delivered continuously
and with minimal error[21 24] This allows for optimisation and kinetics studies with
precise reagent additions that would otherwise be troublesome for an
experimenter to consistently and dependably deliver These same flow rates also
ensure that the residence time is exact and consistent meaning sampling points
are reliably accurate in sampling the reaction medium after a specific reaction
time[25 26] This point however is highly dependent on the mixing regime present
which is discussed further in Chapter 31
Another noteworthy advantage to flow processes is that a large number
of reactions can be executed and hence a large amount of data can be obtained
using only minimal quantities of a reagent in flow This is because much less
reagent is required for reaction and subsequent on-line analysis in a microreactor
compared to bench scale batch setups This is a particularly desirable attribute
of a system if you have an expensive material or a material that is synthesised
by a time consuming process where you need to be conservative with its use
but still obtain lots of experimental data[24]
One example of a reaction that has been successfully transferred from
batch to flow is a multi-step synthesis of ibuprofen 18 conducted by Bogdan et
al[27] This synthesis demonstrates that even flow processes with multiple steps
can be achieved without intermediate purification steps in a streamlined and
efficient manner This is provided as long as care in the reaction chronology has
been undertaken ensuring excess reagents and byproducts from previous steps
are compatible with downstream processes shown in Scheme 13 This
efficiency is important when creating complex molecules because although the
stepwise batch reactor processes are effective they are also very wasteful
particularly when they involve consecutive work-up procedures An example of
this is in the pharmaceutical industry where in general 25 - 100 kg of waste is
23
produced for every 1 kg of complex molecule[28] However to facilitate reaction
compatibility expensive or atom-inefficient transformations may be necessary
such as the use of phenyl-iodine(III) diacetate and TMOF to incur a chemical
rearrangement in the reported ibuprofen synthesis below This may require a
careful balance to achieve green metrics in product manufacturing Further
discussion on reaction telescoping is provided in Chapter 1126
Scheme 13 The multistep continuous flow synthesis of ibuprofen 18
In large scale batch reactor design used in industry the most significant
problems to be overcome are the heating and agitation of the system and it has
even been reported that processes cannot be scaled up further due to
temperature and mixing gradients[29] This problem relates to the fact that it is
difficult to effectively heat and agitate a large mass completely uniformly which
can lead to different reactivities present at different points within the vessel - this
can result in decreased product yield due to an increased rate of side reactions
or more seriously a runaway reaction when exothermic processes are
involved[30 31]
By contrast mesoscale flow systems (channel diameter 1 - 10 mm) and
in particular miniaturised flow reactors (channel diameter 50 - 1000 microm) are
excellent at efficiently heating and mixing reactants[32] Rapid heating of reaction
microchannels through the walls of a preheated reactor ensures the reaction
mixture is thoroughly and uniformly heated and mixed which is attributed to the
24
large surface area to volume ratios of the microchannels[18 33] This heating can
be achieved by oil baths conventional ovens or even microwave heating all of
which achieve the same goal which is precise temperature control with
increased safety[34-36] The high molecular diffusion across the relatively narrow
microchannels allows assumptions of perfect cross-sectional mixing in a lsquoplug
flowrsquo regime[37] (see Chapter 31) and mass transfer can further be improved
through the use of static mixers[38] or CSTRs[39]
This increased safety in flow reactors is attributed to only a small amount
of reaction material present in the reactor at any one time enclosed within a
tubular vessel Therefore although the chemical exposure is the same during
reservoir preparation the experimenter is not exposed to any harmful material
during experimentation as long as all inlets and waste streams are properly
contained The is advantageous especially in processes where there are highly
exothermic steps alongside even the possibility of scale-up of formerly non-
scalable reactions[36 40] This scalability can be achieved simply by running one
flow reactor for a long period of time or several identical flow reactors in parallel
in a process called lsquonumberingrsquo - any number of flow reactors can be lsquonumbered
uprsquo to achieve the required throughput[41-43]
112 Reactions in flow
Alongside the aforementioned general advantages that flow processes
have over batch there are several distinct reaction niches which have specific
facets whereby translation to flow has distinct benefits There are many different
areas where continuous processes have helped to transform research as well
as industrial processes that may branch from them This literature review will
focus only on the most common types of reaction in flow in which most reactions
are likely to encompassed Also refer to flow chemistry reviews on polymer
chemistry[44] the use of extreme temperature[45] and slurry reactors[46]
1121 Temperature-accelerated reactions
Temperature-accelerated reactions are the most basic and most common
use of flow setups whereby reactants are fed into a heated microreactor to
perform a chemical transformation The use of flow enables access to higher
temperatures in a system with excellent safety which means that reactions can
be performed which would otherwise be too slow or unobtainable in other
25
systems Temperature-accelerated reactions in a traditional batch setup are
often limited by the laboratory equipment and the boiling point of the solvent and
having to switch to different higher-boiling solvents can lead to complications in
both the reaction and the purification[47 48] High-pressure batch vessels can be
used to facilitate these higher temperature reactions (such as Parr reactors or
autoclaves)[49] but additional equipment and safety considerations must be
made in these cases
However in flow setups there is no need to give significant consideration
to changing the solvent as the boiling of the solvent can be suppressed in most
cases by the use of a back-pressure regulator[50] Therefore when conducting
these reactions where higher temperatures can be accessed in flow setups the
reaction rates are also generally higher[14] This alongside the aforementioned
increased associated safety in using flow setups can make flow a desirable and
convenient option for temperature-accelerated reactions Scheme 14 and
Scheme 15 show examples of temperature-accelerated reactions that have
been conducted in flow where in both cases the temperature of the reaction was
conducted at a higher temperature than the boiling point of the solvent leading
to decreased reaction times [51 52] It is also worth noting that unless explicitly
stated a back pressure regulator will have been used in all schemes in this
literature review if the temperature of the reaction exceeds the boiling point of
the solvent used
26
Scheme 14 The temperature-accelerated SNAr reaction of 19 with 110 to form 111 in THF
(boiling point 66 degC) under flow conditions[51]
Scheme 15 The Fischer Indole synthesis of 114 from the hydrazine 112 and dihydrofuran
113 in methanol (boiling point 65 degC) using a flow setup[52]
1122 Supercritical fluid
The use of supercritical fluids (SCFs) as solvents in flow processes have
attracted attention in the past 30 years mainly motivated by the prospect of
replacing toxic industrial solvents[53] For example the environmental interest of
using supercritical CO2 or H2O ushers in opportunities for greener chemical
processes by replacing some of the more harmful solvent systems[54-56] This is
an admirable objective for process chemists and can lead to cleaner and more
sustainable reactions[57]
Whilst the green aspects of using SCFs are attractive perhaps the
greatest quality they possess are their physiochemical ldquohybridrdquo properties an
intermediary between liquids and gases whereby properties can be finely tuned
by marginal variations in temperature and pressure As a result SCFs exhibit
gas-like viscosities as well as no surface tension which are objectively
advantageous in processes involving interface and surface chemistry[58-60]
Furthermore the liquid-like densities allow for substantial dissolution of
precursors within the SCF and diffusion coefficients are generally at least 100
times greater in SCFs than in liquids All of these factors contribute towards
processes whereby the reaction conversion is significantly improved as a direct
effect of using SCFs[53 61-63] However the compatibility of these supercritical
solvents must still be tested with the process of interest (as with any solvent) as
there may be solubility or reactivity issues
27
Supercritical CO2 (scCO2) is a common solvent in the realm of SCFs
because of its easily obtained critical parameters at bench scale it is also
extracted easily with high purity as a byproduct from many processes as well as
being non-toxic and non-flammable[64] One of the most notable industrial scale
applications using scCO2 is the hydrogenation of isophorone 115 shown in
Scheme 16 which obtains 116 in a sufficiently pure state without any
downstream purification[65] Another common process developed from the use of
scCO2 by taking advantage of the non-toxicity of the solvent is the
decaffeination of coffee beans which has since become one of the most popular
decaffeination methods[66 67]
Scheme 16 The hydrogenation of isophorone 115 to TMCH 116[65]
One major problem with using scCO2 in flow processes however is its
incompatibility with primary and secondary amines due to carbamate formation
which can precipitate out of solution and therefore block any microchannels in
the system[68] Other supercritical solvents can be used in these cases such as
scNH3 although this presents a problem in itself that it cannot be used with
aqueous solutions because of ammonium hydroxide formation - nonetheless
supercritical ethane and propane have been used as direct replacements for
scCO2 due to similar critical parameters[69]
Using continuous reactors for SCFs have the advantage over batch
reactors that they do not require depressurisation to add further material to the
process or recover products Also a predominant advantage to using continuous
reactors is that reaction parameters such as temperature flow rate and pressure
can all be changed almost independently of each other In context this ability
allows the properties of the SCF to be altered in real time when optimising
reactions which cannot be done easily in batch reactors - this versatility of
continuous reactors makes it the favourable choice when working with SCFs[70]
1123 Photochemical reactions
28
The use of photons at given wavelengths to provide sufficient energy to
overcome activation energy barriers is the basis of photochemical reactions
complex molecular structures can be achieved via these unique reaction
pathways that are otherwise unobtainable via thermochemical or electrochemical
methods[71 72] Implementing photochemical reactions is also beneficial as a
photon is a ldquogreenrdquo reagent which is traceless and thus doesnrsquot require
removalrecycling in the same way many other reagents do
Photochemistry is not regarded only as a unique and novel pathway to
molecules with exotic structures however - one example of where
photochemistry is used extensively in industry is in the Toray process to attain
caprolactam which is used to manufacture Nylon 6[73] Photochemical reactions
have also been found to benefit from continuous flow systems where large-scale
photochemical synthesis is significantly more effective when compared to their
corresponding batch approaches[74] This is due to problems regarding
penetration into the bulk reaction medium which is an important boundary that
has to be overcome Most of the photochemical synthesis occurs within a short
radius of the lamp meaning the reaction conversion is scale dependant The
small tubular diameters in flow systems take advantage of this by exposing the
entire reaction medium to the light source as it passes through the reactor[75]
One example where a photochemical reaction has been implemented into
a flow process is reported in the continuous [2 + 2] photocycloaddition producing
the cyclic product 118 shown in Scheme 17 [74] In this reaction the conversion
is quoted at 83 and because the reaction conversion is scale independent the
continuous process can be run indefinitely to produce over 500 g per 24 hour
period This process can then be scaled up further as in any continuous flow
process by numbering up
29
Scheme 17 The [2 + 2] photocycloaddition of malemide 117 with 1-hexyne to produce the
cyclic product 118[74]
1124 Electrochemical reactions
Electrochemistry is another clean and efficient reaction method in the
realm of organic synthesis where the electricity supplied to the reaction system
induces the formation of the reactive intermediates from neutral substrates This
method of reaction has significant advantages to conventional batch processes
one of which being that harmful oxidising and reducing agents can be substituted
using electrochemistry By applying precisely controlled current between two
electrodes reactions can be achieved by using milder reagents This method
allows milder reagents as electrons can be addedremoved without the need for
chemical reducingoxidising agents which could complicate the reaction
especially in flow systems where downstream processes can be highly affected
by excess chemical reagents[76] Also as the electrons are the ldquoreagentrdquo in these
reactions as well as being widely and readily available electrochemical reaction
pathways become cheaper and less labour-intensive as alternative costly
reagents donrsquot need to be used[77]
One example of where electrochemical synthesis in flow has been
observed is in the anodic substitution reaction by Horii et al [78] shown in scheme
18 with yields of up to 74 In flow processes such as this the laminar flow
regime is used as an advantage - two inlets of separate flows join together in the
reaction vessel where their respective microchannel sidewalls are anodic and
cathodic opposite to one another This ensures the dominant oxidation of the
substrate 119 to form a cationic intermediate whilst the nucleophile 120
diffuses across the tubular diameter to react to afford 121 [79] Laminar flow and
other mixing regimes are discussed further in Chapter 31
Scheme 18 An electrochemical facilitated nucleophilic substitution reaction to afford the
product 121[78]
1125 Enzymatic reactions
30
Biocatalytic processes are also an area in which research is continuously
progressing in order to develop alternative process routes to the synthesis of fine
chemicals The main issues however arise from enzymes only being able to
operate efficiently in narrow pH and temperature ranges with many organic
substrates having poor solubility in water However implementation of enzymes
whilst using non-aqueous solvents can dramatically improve their applicability[80
81] Within biochemical processes this niche can be important in achieving
reaction optimisation despite given limitations with using biocatalysts
The use of immobilised active enzymes in the column of a flow system is
very attractive and there are many reports in the literature of applied
processes[82 83] An example of this is the continuous process of chiral
cyanohydrin formation shown in Scheme 19 where a column is packed with
defatted almond meal[84] There are also examples where multiple columns with
different immobilised enzymes are used as a multistep continuous process in
order to reach the desired product - one example is reported where 7 separate
columns with differing enzymes achieve the synthesis of UDP-galactose from
inexpensive starting materials[85] This is shown in Scheme 110 as a simplified
one column synthesis with multiple enzymes This also shows how
advantageous immobilised biocatalysis can be in multistep synthesis as there
are no catalysts or harmful reagents that can affect downstream processes
Scheme 19 An enzyme catalysed continuous cyanohydrin formation forming 123[84]
Scheme 110 Multiple enzymatic catalysed continuous process to form UDP galactose
125[85] Individual enzymes stated
1126 Telescoped reactions
31
When considering a total synthesis for a pharmaceutical ingredient or
otherwise it would be ideal to limit the number of steps and hence the amount
of waste time and resources This can be achieved in one way by reaction
telescoping[24] Reaction telescoping is essentially performing multiple chemical
transformations to a molecule sequentially without the need for the purification
of intermediates or removal of waste for example the lsquoone-potrsquo synthesis of
pyridine and quinoline derivatives in batch reported by Kobayashi et al[86]
There are further advantages however to reaction telescoping in flow
that are not observed in batch Using a flow system allows the introduction of
reagents in exact stoichiometries at specific points in the reaction cycle simply
by addition via inlets further down the line within the system Pairing these
additions with differing fixed-temperature reaction vessels also allow for isolated
reaction optimisation for each step along the flow setup in a multi-step synthesis
An example of a multi-step reaction where the success of the synthesis is
attributed to the effective residence time and temperature control of each step is
shown in Scheme 111 in the synthesis of 127[87]
Scheme 111 The multi-step flow synthesis of 127 from coupling o-dibromobenzene 126
with varying electrophiles via sequential halogen-lithium exchange reactions[87]
The main drawback of reaction telescoping is that downstream
transformations have to be compatible with side products and waste from
upstream reactions as any incompatibility leads to a lesser conversion of any
intermediates This serves as a hindrance to the other transformations down the
line hence leading to poor conversion for the overall process Therefore when
considering reaction telescoping great care must be taken into account for
reagent compatibility and reaction chronology
A further advantage to using a flow system however is the opportunity of
in-line purification which can solve reagent compatibility issues - this gives
32
greater accessibility to a variety of different reactions that can all be
accomplished in a single process This in-line purification is made possible by an
in-line liquid-liquid separator such as the separator reported by Zaiput Flow
Technologies that allows immiscible liquids to be separated into two streams
one organic and one aqueous via filtration using a hydrophobic membrane[88]
This separator is shown in Figure 11 An example where a membrane
separation has been used shown in Scheme 112 is in an ibuprofen multi-step
synthesis where Snead and Jamison improved on previous work aforementioned
by Bogdan et al[27 89] This in-line separation avoided the need for triflic acid and
increased the yield to 98 by incorporating this aspect within the process
Flow in
Two separated flows out
33
Figure 11 An annotated picture of an in-line liquid-liquid separator developed by Zaiput Flow
Technologies
Scheme 112 A multi-step flow synthesis of ibuprofen 18 involving an in-line purification
step[89]
There are also several other methods of in-line purification that can be
considered alongside or instead of liquid-liquid separation Gas-liquid
separation[90] micro-distillation[91] solid-supported scavenging[50] and gravity-
based separation[92] have all been reported in the literature but have not be
covered in detail as these methods are not well established
113 Reaction analysis
Reaction analysis in benchtop batch processes are relatively time-
consuming and labour-intensive as samples must often be removed by hand
from the reaction mixture to determine reagent conversion product composition
etc Therefore the elimination of these practices and adoption of their respective
flow processes has many potential cost benefits particularly in fine chemical and
pharmaceutical production[93]
On the other hand for these same methods of analysis the sampling
process can be fully automated by the use of sampling valves A sample valve
34
is a device attached to the line of a flow system where the reaction mixture
passes through undisturbed as if it was an extension of the tubing however there
is a lsquoswitchingrsquo mechanism whereby the flow is diverged from its path into a
separate flow system instantaneously then the original flow is restored
milliseconds later This diverted flow then leads to an analytical system (HPLC
mass spectrometer etc) and has much thinner tubing with a constant mobile
phase flowing ready to carry the injected sample to the analytical equipment
This sampling is termed lsquoon-linersquo as the flow is rerouted from the flow along the
reactor lsquoIn-linersquo therefore refers to sampling without the need to divert reaction
material and is typically non-destructive In all cases great care must be taken
in calibrating the machine to chemistries of interest as quantitative analysis can
often only be performed by calibrating the response of the equipment to known
standard concentrations of each chemical species
This section will report on reaction analysis in flow by the use of well-
established and common techniques such as mass spectrometry and high-
performance liquid chromatography (HPLC) as well as fast developing and high
interest areas such as NMR and IR In each case the system is assumed to be
at lsquosteady-statersquo in which the flow output is consistent - this is explained in detail
in Chapter 31 Also refer to specific papers covering onin-line analysis by UV[94
95] Raman[96] fluorescence[97] GC[98 99] XAFS[100] and NIR[101-103]
1131 Mass spectrometry
The use of mass spectrometry in reaction analysis is a common technique
and when coupled with flow systems on-line mass analysis can be employed to
qualitatively and quantitatively monitor reactions for the identification of products
and intermediates as well as analysis of relative composition[104-106] All of this
can be performed in real-time due to the short method times and is ideal in the
context of reaction monitoring as lots of information can be gained from the mass
spectrometer with little need for data manipulation[107]
An example where mass spectrometry has been used for on-line analysis
in order to monitor reactive intermediates in flow is in the formation of benzyne
132 shown in Scheme 113[108] This experiment was conducted to show how
mass spectrometers are ideally suited to on-line analysis applications although
35
they are rarely used in this way as traditional mass spectrometry instruments are
too large and bulky to be conveniently coupled to flow systems
Scheme 113 A reaction scheme showing the formation of benzyne 132 which was followed
by analysis via mass spectrometry[108]
1132 HPLC
HPLC can also give very good qualitative and quantitative analysis of a
reaction mixture - however the advantage that HPLC has over mass
spectrometry is that it is typically easier to quantify the individual components of
a mixture[109] This is a particularly useful characteristic for modelling the kinetics
of a reaction as the relative abundancies of products from a reaction can be
measured precisely by their peak areas in the chromatograph at different
times[110] as well the ability to differentiate molecules with the same mass and
even different isomers of the same mass
An example where the kinetics of a reaction were studied using the coupling
of a flow system with on-line HPLC is in the thermal isomerization of the endo
molecule 133a to its exo counterpart 133b shown in Scheme 114[111] This
example shows how combining on-line HPLC with an automated flow system
with varying pump flow rates and temperature can lead to an understanding of
the factors influencing yield and purity of a process with the ability to provide
useful data to be utilised for generating response surfaces shown in Figure 12
36
Scheme 114 A reaction scheme showing the thermal isomerization of 133a to 133b which
was followed by analysis via HPLC[111]
Figure 12 The response surface showing temperature and residence time effects on the
thermal isomerisation of 133a[111] Reproduced with permission
1133 IR
The use of in-line IR analysis in flow systems is different as it is not
quantitative in the same respect as mass spectrometry or HPLC IR rather
detects the relative abundancies of particular species by monitoring individual
peak signals The advantage to in-line IR is that key identifiable peaks from
functional groups in an IR spectrum (O-H bonds C=O bonds etc) can be
tracked over time as disappearance or appearance of peaks can serve as an
indicator of reaction completion[112-114] IR analysis is fundamentally non-
destructive which in the context of a flow system means that in-line IR analysis
has been developed and integrated into systems which do not require samples
to be removed from the flow a truly continuous non-interrupted stream but still
continuously analysed by IR[115-117]
An example of where in-line IR analysis has been used to monitor the
completion of a reaction is in the fluorination reaction to yield 136 shown in
Scheme 115[112] The in-line probe brand used was the ReactIR In this reaction
the region where C-F bonds are expected to absorb was monitored during the
reaction in order to establish a reaction completion trend based on the intensity
of the peak produced - this is shown in Figure 13
37
Scheme 115 A reaction scheme showing a fluorination reaction yielding 136 which was
followed by analysis via in-line IR[112]
Figure 13 An IR absorption showing the detailed rise of the C-F bond peak over time
indicating the extent of reaction completion[112] Reproduced with permission
1134 NMR
The use of on-line NMR is also a good quantitative option for flow system
analytics The potential to incorporate high resolution NMR systems into a flow
system to show both structural and conformational changes in chemical
transformations is a desirable potential analytical technique At current generally
only small low-field systems have been developed to be conveniently coupled
with flow systems However this technique thus far has led to the increased
value of using NMR spectroscopy as a non-invasive method as more process
development applications are available[118] Although there are some reports of
using high resolution on-line NMR[119 120] most cases generally utilise low field
NMR systems The low resolution analytical technique is unlike traditional NMR
analysis in a high resolution system (gt 300 MHz) as low-field systems tend to
38
analyse the relaxation times and relaxation weighted signals to identify product
[121]
The main downside to this technique is that as the resolution is often too
low for accurate interpretation of NMR spectra because of small differences in
chemical shifts therefore it is difficult to use for multi-component reaction
analysis[122] However there are examples where this technique has been useful
In a report by Goldbach et al[123] low field on-line NMR was used to monitor the
reagent and product concentrations of the Grignard reaction shown in Scheme
116 This reaction conversion was monitored by peak areas in the aromatic
region over time shown in Figure 14 where over 90 conversion was reported
by the examination of peak appearance and disappearance
Scheme 116 The Grignard reaction that was tracked by on-line NMR[123]
Figure 1 4 The on-line NMR analysis in the aromatic region of the Grignard reaction shown in
Scheme 116 at different time intervals[123] Reproduced with permission
1135 Summary
There is no best method of flow reaction analysis as each individual case
would benefit from an independent examination of the necessary results to be
generated This is because different reactions and outcomes would be more
suited to different analytical systems A table summarising these main analytical
methods as well as other methods with their respective sensitivities acquisition
speeds and limitations are shown in Table 11[124]
39
Table 11 A table summarising reaction analysis techniques in flow systems adapted from
Houben and Lapkin[124]
Technique Type of
information
Sensitivity
mol
Typical
speed of
acquisition
s
Limitations
Mid-IR
Chemical
identity
concentration
~10-1 ~1
Steps have to be
taken to tolerate
water within the
system
Near-IR
Chemical
identity
concentration
~10-1 ~1 Less information
than Mid-IR
Raman
Chemical
identity
concentration
crystal structure
~10-1 ~1-100
Fluorescence
masking Raman
signal
UV-vis
Chemical
identity
concentration
~10-4 lt1 Limited number of
species
NMR
Molecular
structure
concentration
~10-3 ~10
Flow method is
currently limited in
sensitivity and
resolution
GC Concentration ~10-6 10-1500
Typically slow
cannot identify
unknown compounds
HPLC Concentration ~10-6 200-1500
Long method times
must be combined
with mass spec for
proof of molecular
identity
Mass spec
Chemical
identity
concentration
~10-8 ~5-20
Requires
chemoinformatics
expertise
40
114 Continuous flow chemistry summary
Flow chemistry is a powerful methodology that can be employed to obtain
enhanced reaction control over similar batch processes increased heat and
mass transfer accurate residence times and precise continuous addition of
reagents These advantages alongside automated sampling procedures mean
that this regime is an ideal methodology for generating time-series data for the
purposes of this project As kinetic studies benefit from this additional control as
well as further hardware-manipulation techniques discussed in Chapter 31 that
are not possible in batch continuous flow will be used when possible However
not all of the identified niches of flow will be exploited for this project such as
SCF usage electrochemistry etc and have been covered as a holistic overview
of the field
Flow chemistry is not the answer to every case study and itrsquos likely that
there will be instances where chemistry is better suited to batch conditions
however Each chemistry must be evaluated to see if the study would more
appropriate for a flow or a batch regime For totally homogenous systems or for
very fast reactions it is likely that a flow system would be used for the generation
of kinetic data For experimental case studies that require sampling of a
suspension in a reaction medium it is likely that a batch system would be more
appropriate In any case the availability of an automated flow system is very
useful (Chapter 32) and unlocks powerful reaction control that can be difficult to
obtain in batch but batch systems must be employed if the chemistry requires it
12 Kinetic methodologies
The kinetic methodologies applied in this project are computational which
utilise ordinary differential equations (ODEs) to describe kinetic models as well
as optimisation algorithms to maximise the convergence of these ODE curves to
the experimental data - this is described in detail in Chapter 222 This differs
from traditional analytical techniques used more generally in chemistry as well
as specific applied methods in determining reaction order described herein
These methods although useful are difficult to scale as they require user input
and at times qualitative analysis which are not suitable for automatic kinetic
information determination Furthermore these methods may struggle with
41
complex reaction systems or systems with loss of mass balance For these
reasons these methods are covered to describe common kinetic analysis
techniques but are not utilised in this project
121 Conventional methodologies
There are several conventional but considered outdated methodologies
to determining kinetic information that are still employed The most basic
analytical solutions for simple reactions can still be powerful in identifying
reaction order and rate constants[125 126] Consider the first order reaction of
species A reacting to form species B shown in eqn 11 The change in the
concentration of A as time progresses can be described as a differential
equation eqn 12 which can then be integrated to give the integrated rate
equation eqn 13 This integrated rate equation can then be used to determine
the concentration of A at any reaction time and a plot of ln[A] vs time allows the
determination of the rate constant as shown in Figure 15 This method also
allows qualitative confirmation of the reaction order as the experimental data
points should fit to a linear line
Where
bull A = starting material
bull B = product
bull k = rate constant
bull [A] = concentration of A
bull t = time
bull [A]t = concentration of A at time t
bull [A]0 = initial concentration of A at t = 0
119860119896rarr119861 eqn 11
119889[119860]
119889119905= minus119896[119860] eqn 12
ln[119860]119905 = minus119896119905 + ln[119860]0 eqn 13
42
Figure 15 A graphical representation of generated time-series data for a first order reaction
shown in eqn 11 The data is log-transformed to give a linear fit where the gradient is
equal to the rate constant multiplied by -1
If the plot of ln[A] vs time does not produce a linear fit then it is likely that
the reaction order is not 1 with respect to A and may be zero order second order
or even another non-integer order To deduce if the reaction is zero order the
reaction can still be viewed as eqn 11 but the rate of change of A must be
described differently as the zero order reaction is not dependant on the
concentration of A at any time Therefore this differential equation can be
described as eqn 14 which can then be integrated to give the integrated rate
equation eqn 15 A simple plot of [A] vs time deduces if the reaction is zero
order as a linear fit indicates this where the rate constant can also be identified
as shown in Figure 16
119889[119860]
119889119905= minus119896 eqn 14
[119860]119905 = minus119896119905 + [119860]0 eqn 15
43
Figure 16 A graphical representation of generated time-series data for a zero order reaction
shown in eqn 11 This data does not need to be transformed as the linear fit is equal to
the rate constant multiplied by -1
If the reaction is second order with respect to A the rate of change of A
must be described as in eqn 16 which when integrated gives the integrated
rate equation shown in eqn 17 A plot of 1[A] vs time then allows the chemist
to deduce that the reaction is second order if a linear fit is obtained The gradient
of this linear fit can then be ascribed as the rate constant as shown in Figure
17
Figure 17 A graphical representation of generated time-series data for a second order
reaction shown in eqn 11 This data is plotted as the reciprocal of the concentration vs
time and the gradient of the linear fit to this data is the rate constant
If the reaction is more complex and features bimolecular reactions of
different species such as the reaction shown in eqn 18 then there are two
possible scenarios that may be considered to determine the rate constant and
confirm the reaction order The first scenario is where the initial concentrations
of species A and species B are the same In this case the rate of change of A
can be written as eqn 19 However at any time [A] = [B] meaning that the
scenario mimics the second order reaction illustrated in eqn 16 and kinetic
information can be identified by using the corresponding aforementioned
methodology
119889[119860]
119889119905= minus119896[119860]2 eqn 16
1
[119860]119905
= 119896119905 +1
[119860]0
eqn 17
44
The second possible scenario is where the initial concentrations of A and
B are not equal In this case it is useful to define a term x where this relates to
the concentration of each of the species that have reacted at a particular time t
The expression of the rate law then becomes eqn 110 which can be rearranged
to eqn 111
If eqn 111 is then integrated between time zero and t the time of interest
Then integrating by using the method of partial fractions eqn 112 becomes
Substituting [A] for [A]0 - x and [B] for [B]0 - x eqn 113 simplifies to
Therefore resulting in the overall integrated rate equation
Which can be rearranged to obtain
This obtained integrated rate equation shown as eqn 116 can then be
used to determine the rate constant A plot of ln[119861][119860]0
[119860][119861]0 vs time confirms a first
order dependence on both species in the bimolecular reaction if a linear fit is
119860 + 119861 119896rarr 119862 eqn 18
119889[119860]
119889119905= minus119896[119860][119861] = minus119896[119860]2 eqn 19
minus119889119909
119889119905= minus119896([119860]0 minus 119909)([119861]0 minus 119909) eqn 110
119889119909
([119860]0 minus 119909)([119861]0 minus 119909)= 119896 119889119905 eqn 111
int119889119909
([119860]0 minus 119909)([119861]0 minus 119909)
119909
0
= 119896 int 119889119905119905
0
eqn 112
int119889119909
([119860]0 minus 119909)([119861]0 minus 119909)
119909
0
=1
[119861]0 minus [119860]0(ln
[119860]0[119860]0 minus 119909
minus ln[119861]0
[119861]0 minus 119909) eqn 113
int119889119909
([119860]0 minus 119909)([119861]0 minus 119909)
119909
0
=1
[119861]0 minus [119860]0(ln[119861][119860]0[119860][119861]0
) eqn 114
1
[119861]0 minus [119860]0(ln[119861][119860]0[119860][119861]0
) = 119896119905 eqn 115
ln[119861][119860]0[119860][119861]0
= 119896([119861]0 minus [119860]0)119905 eqn 116
45
observed as shown in Figure 18 where the gradient can be used to calculate
the rate constant If a bimolecular reaction is known to occur but this graphing
indicates curvature then itrsquos possible that one or more of the species may have
a reaction order not equal to one Under these circumstances other techniques
must be used to confirm reaction order such as computational approaches to
fitting differential equations which is further described in Chapter 222
Figure 18 A graphical representation of generated time-series data for a second order
reaction shown in eqn 18 where [A] = [B] = This data is plotted as a log-
transformed concentration fraction vs time The gradient of the linear fit to this data is the
rate constant multiplied by the initial concentration of B minus the initial concentration of
A
For kinetic studies involving either biological (enzymatic) or chemical
catalysts the reaction system can still be described by elementary reaction steps
and their respective differential equations If we look at one of the simplest
catalytic systems where an enzyme E binds with a substrate S This is a
reversible binding step where the forward reaction step is k1 and the backward
reaction step is k-1 in which the enzyme-substrate complex ES is formed This
complex can then react to form the product P as well as regenerating the
enzyme catalyst E This reaction is shown in eqn 117 and as before the
differential equations with respect to each of these species are described in eqn
118 - 121
119864 + 119878 1198961119896minus1
119864119878 1198962rarr 119864 + 119875 eqn 117
119889[119878]
119889119905= minus1198961[119864][119878] + 119896minus1[119864119878] eqn 118
46
However although this system can be described in this way it is more
commonly described as approximated models as simple assumptions can
derive a model known as Michaelis-Menten kinetics[127 128] This provides a more
simplistic method of catalytic modelling and prediction by relating the catalyst
concentration to the rate enhancement of a reaction in a different way Michaelis-
Menten kinetics employ the steady-state approximation with respect to the
enzyme-substrate complex ES This means that it is assumed that this complex
will rapidly approach a state where it is generated at the same rate that is
consumed This means that the overall rate of change as described in eqn 122
is zero - this allows a new relationship to be derived between the enzyme
substrate and complex as shown in eqn 123
In order to describe the system as an overall equation relating to the rate
of the reaction we must be able to determine the rate of product formation
shown in eqn 120 However as it is unknown what the free enzyme
concentration is at any point after the reaction has progressed it is more
appropriate to describe the free enzyme E as the total concentration of all
enzyme ET minus the complex concentration [E] = [ET] - [ES] This substitution
into the steady-state approximation derived equation eqn 123 allows the
complex concentration to be described by other concentrations
Followed by expansion
Then rearrangement and factorisation
119889[119864]
119889119905= minus1198961[119864][119878] + 119896minus1[119864119878] + 1198962[119864119878] eqn 119
119889[119875]
119889119905= 1198962[119864119878] eqn 120
119889[119864119878]
119889119905= 1198961[119864][119878] minus 119896minus1[119864119878] minus 1198962[119864119878] eqn 121
119889[119864119878]
119889119905= 1198961[119864][119878] minus (119896minus1 + 1198962)[119864119878] = 0 eqn 122
1198961[119864][119878] = (119896minus1 + 1198962)[119864119878] eqn 123
1198961([119864119879] minus [119864119878])[119878] = (119896minus1 + 1198962)[119864119878] eqn 124
1198961[119864119879][119878] minus 1198961[119864119878][119878] = (119896minus1 + 1198962)[119864119878] eqn 125
47
Then a final rearrangement allows the overall relationship to be described as
Therefore substitution of this relationship into the product formation step in eqn
120 where v is the rate of the reaction relates the overall rate with only the total
enzyme concentration substrate concentration and kinetic rate constants
shown as eqn 129
To now arrive at the familiar form of the Michaelis-Menten equation final
substitutions are made for Vmax and KM shown in eqn 130 producing the overall
equation shown in eqn 131
These terms used in the Michaelis-Menten equation Vmax and KM are
different indicators to what are typically found in other areas of kinetics Vmax
relates to the maximum velocity of the reaction which is independent of substrate
concentration KM is a ratio measure of the breakdown of the enzyme-substrate
complex with relation to the its corresponding formation Different enzymes have
different KM values and can be affected by a range of conditions such as pH and
temperature This equation and other variations when the reaction model differs
(such as enzyme catalysed bimolecular reactions) are commonly used when
studying catalytic kinetics to predict how a system will behave upon changing
concentrations
This model is also useful as the apparent reaction order of the system can
be easily described When the concentration of substrate [S] is very low in
comparison to KM this means that the substrate concentration is deemed to be
1198961[119864119879][119878] = (119896minus1 + 1198962)[119864119878] + 1198961[119864119878][119878] eqn 126
1198961[119864119879][119878] = [119864119878]((119896minus1 + 1198962) + 1198961[119878]) eqn 127
[119864119878] =1198961[119864119879][119878]
(119896minus1 + 1198962) + 1198961[119878]=
[119864119879][119878]
(119896minus1 + 11989621198961
) + [119878]
eqn 128
119907 = 1198962[119864119878] =1198962[119864119879][119878]
(119896minus1 + 11989621198961
) + [119878]
eqn 129
119881119898119886119909 = 1198962[119864119879] 119870119872 =119896minus1 + 11989621198961
eqn 130
119907 =119881119898119886119909[119878]
119870119872 + [119878] eqn 131
48
negligible leading to a direct proportionality between the rate and [S] This
means the reaction appropriates first order kinetics as shown in eqn 132 When
[S] is very large in comparison to KM this means that KM is deemed to be
negligible meaning that the equation cancels any occurrence of [S] leading to
overall zero order kinetics This is shown in eqn 133
Vmax and KM can be determined experimentally by measuring the initial
rates of reaction at varying substrate concentrations After these rates are
determined the graph of reaction rate vs substrate concentration can be plotted
where Vmax is the reaction rate that the curve tends to KM is found via plotting
the relationship of reaction rate to substrate concentration indicated by a curve
whereby KM is equal to the substrate concentration (x axis) when the reaction
rate is half of Vmax (y axis) The experimental determination of these constants is
shown in Figure 19
Figure 19 A representation of Michaelis-Menten kinetics where the initial reaction rate of
individual experiments with differing substrate concentrations x is plotted This plot is
then used to determine the kinetic parameters Vmax and KM
Further development in these Michaelis-Menten kinetic plots then
linearised and simplified this technique leading to a simpler interpretation of the
kinetics as well as easier adoption in determining kinetic parameters This form
of the Michaelis-Menten equation known as the Lineweaver-Burk equation
shown in eqn 134 is simply the double-reciprocal form of eqn 131[129] This
119907 =119881119898119886119909[119878]
119870119872 eqn 132
119907 = 119881119898119886119909 eqn 133
49
allows less complex plotting methods to determine Vmax and KM as shown in
Figure 110
Figure 110 A representation of the Lineweaver-Burk equation where the inverse of the initial
reaction rate of individual experiments with differing substrate concentrations x is
plotted This plot is then used to determine the kinetic parameters Vmax and KM
122 Visual kinetic analysis
In order to identify catalytic reaction behaviour and the order of the
species in these processes different methodologies with the theme of visual
qualitative analysis were developed to allow many scientists to easily extract
kinetic information from their reactions Although the root of these analyses are
still highly mathematical visual kinetic analyses depend on the subjective
analysis of the scientist Therefore precise kinetic parameters cannot be
elucidated however the plots required are simple to construct and easy to
interpret allowing easy determination of the order of the catalystreagents or of
product inhibitioncatalyst deactivation[130]
Reaction progress kinetic analysis (RPKA) employs a checklist to visually
determine this kinetic information efficiently with very few reactions[131] These
reactions which feature in situ measurements are combined with mathematical
manipulations to construct graphical rate equations where kinetic information can
be identified This methodology comprises three different analyses for three sets
of experiments These experiments identify product inhibitioncatalyst
deactivation the order in the catalyst and the order in any of the other
components of the reaction
50
For a product inhibitioncatalyst deactivation probing study curves of
reaction rate vs substrate concentration are compared for reactions that are
started at different points - one with higher concentrations (reaction 1) and one
with lower (reaction 2) This means that although the initial starting material
concentrations are different both reactions at some point will have the same
concentration of all of the starting materials as the other reaction This is true as
long as both experiments have the same difference in the concentration of
reactants referred to as lsquosame excessrsquo experiments Consequently at these
points in the reaction where there are the same concentrations of starting
materials the reaction with the greater initial concentrations (reaction 1) will have
a greater concentration of product as well as a greater number of catalytic
turnovers This means that there are two sets of experimental data where the
reaction profiles should overlay to indicate the lack of product inhibition and
catalyst deactivation A case study where there was shown to be no indication of
inhibitiondeactivation is shown in Scheme 117 and Figure 111[132]
Scheme 117 A Heck coupling of an aryl bromide 140 with 141 to form the adduct 142
This case study showed no indication of product inhibition or catalyst deactivation
51
Figure 111 An overlay of two experimental datasets with the same lsquoexcessrsquo of reactant
concentration for the reaction shown in Scheme 117 This overlap indicates no product
inhibition or catalyst deactivation Reproduced with permission
If these curves donrsquot overlay it can be inferred that product inhibition or
catalyst deactivation is occurring An example of this is shown in Scheme 118
and Figure 112[133] To discern between these two possibilities a third
experiment is required where there is more product added This experiment
should feature the same initial concentrations as the experiment initiated at lower
concentrations (reaction 2) but the reaction should also feature the same
product concentration as generated by the other reaction until this point This
results in two reactions that are identical in stoichiometric composition but vary
in the number of turnovers completed by the catalyst Therefore overlay of these
two reaction profiles indicate product inhibition whilst no overlay indicates
catalyst deactivation
Scheme 118 The epoxide opening of 143 to form 144 using a catalytic system This case
study indicates some product inhibition or catalyst deactivation
52
Figure 112 As there is no overlay in the two experimental datasets with the same lsquoexcessrsquo of
reactant concentration in the reaction system shown in Scheme 118 this indicates
some product inhibition or catalyst deactivation A further experiment is necessary to
determine what is occurring Reproduced with permission
To then use RPKA to elucidate the order in catalyst the datasets of
different reactions run with different catalyst concentrations are plotted as
rate[cat]γ vs substrate concentration The value of γ is changed until all of the
curves overlay - this value is then the correct order in the catalyst Similarly for
determining the order in a given reactant ldquoBrdquo the datasets of lsquodifferent excessrsquo
reactions are obtained ie where all concentrations are constant apart from the
specific substrate of interest in this case reactant B The profiles are plotted as
rate[B]β vs [A] and the value of β is altered until the curves overlay This value
of β then indicates the correct order for reactant B A reported example of an
alkylation reaction shown in Scheme 119 was analysed in this manner to
determine the order with respect to Et2Zn 146 by performing lsquodifferent excessrsquo
experiments as shown in Figure 113a This data was then plotted using this
methodology in Figure 113b to confirm the reaction order of this species to be
1[131]
53
Scheme 119 A nickel-catalysed alkylation reaction of chalcone 145 with Et2Zn 146 to form
the adduct 147
Figure 113 Graphical rate equations for the alkylation reaction shown in Scheme 119 a)
Standard graphical rate equation b) Using the RPKA methodology to observe any
overlap in the lsquodifferent excessrsquo reaction curves This overlap indicates that the reaction
order of Et2Zn is 1 Reproduced with permission
Another form of visual kinetic analysis Variable Time Normalisation
Analysis (VTNA) has also been reported to determine this same information by
utilising exclusively concentration-time reaction profiles[134 135] This technique
may be preferential to RPKA as this data is typically more readily available from
54
the use of almost any reaction monitoring technique when compared to the data
handling necessary to extract rate information
To identify product inhibition or catalyst deactivation the reaction profiles
of two or more reactions are examined where the reactions have different
starting concentrations - these datasets are both plotted together The profile of
the reaction with the lower initial concentration of starting materials is then shifted
on the time axis until the first data point overlaps with the second (higher initial
concentrations of starting materials) reaction profile If there is an overlay of the
two concentration profiles at this point this suggests that there is no product
inhibition or catalyst deactivation present in the system This procedure is
highlighted in Figure 114[130] However a lack of overlay indicates that one of
these scenarios is present and a third experiment must be conducted to
determine the cause of this lack of overlay This third experiment must contain
added product in the same way as previously mentioned for the RPKA
methodology where an overlay of this new curve with existing data indicates
product inhibition and the converse outcome indicates catalyst deactivation
Figure 114 A time shift of the profiles of two reactions to observe overlaying plots This allows
the comparison of two profiles with the same starting material concentrations but
different product concentrations therefore identifying signs of product inhibition or
catalyst deactivation Reproduced with permission
To then elucidate the order in any of the species present two reactions or
more are run with different initial concentrations of this species S but with the
same initial concentrations of all other species The time scale of these reactions
are then replaced with Σ[S]γΔt - this expression is shown in eqn 134[136 137] A
plot of concentration of S vs Σ[S]γΔt is then graphed where the value of γ that
produces an overlay of the reaction profiles is the order in species S in a similar
55
manner to RPKA plotting methods This plotting method can be used for
identifying both the order in catalysts and reactants in a chemical system
Where
bull n = number of experiments
bull i = current experiment
bull γ = order of reaction
bull t = time of measurement
These visual kinetic analysis methods may be used in different
circumstances for the simple determination of reactantcatalyst orders as well
as to identify any occurrences of product inhibition or catalyst deactivation
Where reaction rate information is available RPKA may be used and where
concentration-time data is available VTNA can be used There are many
applications reported by academic and industrial research groups in a wide
range of catalytic reactions using both RPKA[138-140] and VTNA[141-143] Figure
115 shows a summary of the analysis of these techniques with the information
that each technique provides given the particular experimental protocol[130]
sum([119878]119894 + [119878]119894minus1
2)
120574
(119905119894 minus 119905119894minus1)
119899
119894=1
eqn 134
56
Figure 115 A summary of the use of RPKA and VTNA a) catalyst deactivation or product
inhibition b) catalyst order c) reagent order d) catalyst deactivation or product
inhibition e) catalyst order f) reagent order Reproduced with permission
123 Kinetic methodologies summary
Herein reported are several methodologies to determine kinetic
information all of which have become convention to varying degrees and
adopted by many experts and non-experts alike It is because of the large
adoption of these techniques that is why these particular methods have been
covered in this introduction although the usage of them within the context of this
project will be minimal There are many other more complex methodologies
peripheral to this project that although are very powerful in particular
circumstances are not widely adopted by research groups For this reason the
concepts of these methodologies are not introduced but for further reading there
are reports to be found on model-based design of experiments (mbDoE)[144-146]
hybrid modelling[147] and soft modelling[148-150] as well as other more niche
techniques that can be found in the literature[151-153]
These introduced methodologies are unlikely to be used in the context of
this project as many require qualitative assessments or data manipulation by a
user that is difficult to automate Furthermore the analysis of complex reaction
models may become more and more difficult with increasing model terms
meaning that precise kinetic parameters may also be more difficult to determine
These factors produce tough challenges in the context of the main aims of the
project (described further in Chapter 14) as the identification of kinetic models
and parameters cannot be scaled effectively or automated Therefore other
procedures are utilised in answering the challenge of creating a fully autonomous
kinetic model and parameter determination methodology which are introduced
in detail in Chapter 22
13 Optimisation
When searching for the optimum solution(s) to a particular optimisation
problem the best approach in gaining the most amount of information possible
would be to simply measure the response of the optimisation function at every
combination of input parameters at infinitesimally small variations This would
give a complete and perfect insight into the impact of the input parameters on
57
the response meaning that it would be easy for a user to even qualitatively
identify the optimum However as function evaluations can be expensive
(computationally and otherwise) performing this resource- and time-intensive
optimisation is not feasible[154 155] Approximations of this approach can be
performed in some circumstances by applying grid search methodology[156] but
for many applications the number of function evaluations necessary to explore
such a large number of parameter combinations means that this approach is not
viable Due to the fixed-space exploration of these approaches parameter
estimations may also be imprecise
For both efficient and accurate determination of optimum parameter inputs
for a given function it is often appropriate to use an optimisation algorithm These
algorithms heavily vary in their approaches to identifying optimised outputs but
a major criteria that they attempt to fulfil is to obtain this information in an efficient
manner - specifically saving computational time and memory The choice of
algorithm can then depend on the nature of the problem specifically the type of
optimisation (local or global) as well as the nature of the optimisation problem
An algorithm can still generally achieve optimality in many circumstances
however specific algorithms have been found to perform more efficiently in
different situations [157]
Many algorithms can be broadly described as either a local or a global
optimiser Local optimisers are fast can handle large-scale problems and are
widely applicable to many scenarios For this reason they are employed
extensively in a variety of circumstances However in local optimisation the
compromise is to accept that the identified optimum may only be locally optimal
which does not guarantee a result that is globally optimal ie a better function
evaluation than all other feasible points[158] These optimisers also require a
starting point which is a critical difference between local and global optimisers
as this can affect the objective value of the local solution that is found
In global optimisation by contrast the true global optimum of the system is
found The compromise however is often efficiency Global optimisation
algorithms are commonly used where the computational cost of the function
evaluations is not critical This is because the number of function evaluations is
traditionally very high which can also lead to very large computational times[158]
Therefore the choice to use a global optimisation algorithm may be made in
58
circumstances where the value of certifying the true global optimum outweighs
the computational cost to arrive at this identification Careful considerations must
therefore be made in selecting the optimal algorithm based on what is desired in
each scenario
The nature of the optimisation problem itself can also be a large factor in
the choice of algorithm used as some algorithms can identify optima more
efficiently based on the type of problem present[159] Some common optimisation
problems are highlighted in Figure 116 Specific classes of algorithms can then
be utilised in different scenarios Some classes of these algorithms include
linear programming (LP)[160] mixed integer linear programming (MILP)[161]
nonlinear programming (NLP)[162] convex programming (CP)[163] quadratic
programming (QP)[164] and more[158] These algorithm classes can then also be
further separated into discrete and continuous algorithms then further still in
many ways
59
Figure 116 Some different classes of optimisation problem where variable n is an input
variable and the function evaluation is a measure of how the function is minimised with
the changing variable a) Linear optimisation problem b) Convex optimisation problem
c) Non-linear optimisation problem
As it is beyond the scope of this project to compare and discuss classes of
optimisation algorithms classifications are made only on their localglobal
nature Commonly utilised local and global algorithms are qualitatively reported
with reference to further reading for mathematical proofs As this project also
involves heavy use of specific optimisation algorithms (in a black box manner)
those utilised are also introduced qualitatively
131 Local algorithms
Many local optimisation algorithms typically iterate towards an optimum
by using gradients in the response or approximating the local response surface
around the measurements One of the most intuitive and simplest form of
gradient-based algorithm is the steepest descent algorithm that iterates by
performing measurements along the trajectory of lsquosteepest-descentrsquo towards the
minimum[165] An example steepest-descent representation is shown in Figure
117 Shown are two variables on the x and y axes respectively X1 and X2 where
the blue contoured area represents a minimum in the response and the red area
represents a maximum in the response A steepest-descent algorithm initially
takes a guess of the inputs to measure the response The algorithm then runs
exploratory measurements in each direction from the initial guess and calculates
the change in the response for each direction The most favourable direction in
n-dimensional space is identified and measurements continue along this
trajectory towards the minimum until a decrease in the response is observed
The most favourable direction is then identified again until the measurements
can no longer observe a favourable change in the output This terminates the
algorithm as it has converged on a local minimum[166]
60
Figure 117 A representation of a steepest-descent algorithm minimising a 2-dimensional
contoured parameter space where о indicates a measurement Where red areas are
function maxima and blue areas are function minima
Another intuitive gradient-based optimisation algorithm is the simplex
algorithm[167] This method uses convex polyhedra formed of n + 1 vertices
(where n is the number of variables) - an individual polyhedron is referred to as
a simplex The algorithm begins by conducting either user-defined or random
measurements of the response function at particular inputs as shown in Figure
118 in 2-dimensional space where each vertex of the initial simplex represents
a function evaluation measurement The worst performing vertex is then
replaced upon each iteration of the algorithm via a reflection resulting in a new
simplex that explores a new area of parameter space This approach locates
areas with a more optimal response and hence successive simplex iteration
converge on a local optima at point
61
Figure 118 A representation of a simplex optimisation for a 2-dimensional contoured
parameter space where the numbered vertices of each polyhedron indicate a
measurement Where red areas are function maxima and blue areas are function
minima
As shown in Figure 118 the initial simplex comprising of the
measurements 1 - 3 is evaluated via the response function at each vertex The
worst vertex measurement 2 is then replaced via reflection to evaluate the
response function at measurement 4 Similarly measurement 3 is then replaced
by measurement 5 in a further simplex iteration The optimisation typically stops
when a better response function evaluation cannot be found indicating that a
local optimum has been identified - this is illustrated by measurement 11 Further
modifications have also been adapted from this methodology notably the
Nelder-Mead simplex algorithm[168] that allows further geometric transformations
as well as just reflections These transformations are highlighted in Figure 119
Because of the efficient and intuitive nature of these simplex algorithms
particularly the adapted Nelder-Mead variation their use in applications in the
literature are vast the original Nelder-Mead report has over 30000 citations
62
Figure 119 The different geometric transformations of the Nelder-Mead simplex inside
contraction (XIC) multiple contraction (MC) outside contraction (XOC) reflection (XR) and
expansion (XE)
Another notable form of local optimisation methodology is the interior-
point method The interior-point method is a class of algorithm that is very
effective at solving both nonlinear and convex problems by approximating local
regions around measurements as a lsquotrust regionrsquo[157] An initial trust region t0 is
identified around the starting point shown as x0 in Figure XY where the trust
region has an approximated objective function to minimise The gradient of the
trust region determines both how the region is approximated as either linear or
quadratic and also the steps necessary in minimising the approximated
objective function This optimisation is shown as a 1-dimensional minimisation in
Figure 120 where the x-axis is the magnitude of the variable and the y-axis is
the measure of the approximated objective function
63
Figure 120 A 1-dimensional optimisation using an interior-point method The approximate
objective function is minimised for the starting trust region t0
When this initial trust region objective function is minimised a new trust
region around this minimum is then approximated shown as t1 in Figure 121
This new approximated objective function is then also minimised The algorithm
continues to iterate via trust regions along what can be described holistically as
the lsquocentral pathrsquo towards the optimum for the true objective function where no
further improvements can be made This central path can be viewed as an
averaged direction based on the actual algorithm path taken In this example
the is objective function was minimised in the fourth trust region t3 finding the
optimum xbest More detailed algorithmic and mathematical discussions of this
optimisation technique can be found in some of the more relatively recent
reports[169 170]
Figure 121 A 1-dimensional optimisation using an interior-point method The approximate
objective function is minimised for the sequential trust regions until the overall function is
minimised The path that the algorithm can take can be described as the algorithm path
or the central path towards the optimum
132 Global
There is much variation in the methodologies applied by global
optimisation algorithms but one of the most common techniques relates to what
can broadly be described as a genetic algorithm[171] Genetics algorithms perform
computations to search for a global optimum utilising techniques inspired by
64
Darwinian evolutionary biology Although there are many forms of genetic
algorithms the methodology of a simple genetic algorithm (SGA) is qualitatively
introduced herein The six stages of SGA can be categorised as initialisation
evaluation selection crossover mutation and replacement After initialisation
the other stages of SGA are repeatedly iterated until the optimum has been
found which leads to termination of the algorithm The optimum is typically
assumed to be found if the evaluation stage does not produce a better function
evaluation (fitness value) for the given objective function (fitness function)[158]
The workflow of the algorithm is depicted in Figure 122
Figure 122 A depiction of the flow of a simple genetic algorithm
The selection stage aims to find the best parents from the current
population to generate the next population where a population is a collection of
all of the sets of inputs for the given variables and a parent is one potential set
of inputs from this population The parents are often selected simply based on
their fitness value In the crossover stage each individual variable input value
(chromosome) from each parent has a probability of 05 to exist in the resulting
children set Each of the children in the following population then have another
given probability of a random chromosome mutating in the mutation stage This
stage prevents a genetic algorithm from becoming stuck in a local minima After
this cycle has occurred this represents one iteration of the algorithm which then
successively occurs until the optimum has been reached This SGA methodology
is highlighted in the adapted simple example shown in Figure 123 whereby a
fitness function (the sum of all inputs) is maximised by the input of integer
chromosomes[158] The ability of genetic algorithms to obtain an optimised result
65
for a given function is very desirable even with a very large number of input
variables Despite the high computational expenditure to this methodology
requires itrsquos reliability has resulted in high adoption in the general literature for
many applications
Figure 123 A depiction of one iteration of a simple genetic algorithm Figure adapted from
works reported by Boyd amp Vandenberghe[158]
Bayesian optimisation is another category of global optimisation methods
that generally proceed in a more efficient manner than genetic algorithms by
utilising approximated (surrogate) models to optimise expensive-to-evaluate
objective functions[166] Random evaluated data points are initially conducted
then a surrogate model is built to fit these data points as well as a corresponding
acquisition function Bayesian optimisation methods obtain their efficiency from
their use of these acquisition functions which balance exploration of the
parameter space and exploitation of already known high-performing regions of
parameter space[172] This acquisition function is maximised after each iteration
of the algorithm to determine the optimum measurement point to evaluate next
in order to explore parameter space but also attempt to gain a better evaluation
Iterations of a Bayesian optimisation for the minimisation of an arbitrary
function f(x) with respect to the 1-dimensional optimisation of variable x is
shown in Figure 124[166] Two initial measurements are inputted shown as red
dots in the first iteration (i) The surrogate model is fitted in blue where the blue
area indicates the uncertainty in the model The acquisition function is shown in
red with a vertical red line indicating the next parameter measurement to be
evaluated - this evaluation is shown specifically in (i) as another red dot From
the second iteration (ii) there is now enough data to fit 95 confidence intervals
to the surrogate model indicating the regions of highest uncertainty The
66
maximum of the acquisition function again determines the next parameter
measurement As aforementioned this parameter measurement is made based
on the compromise of exploring known regions of high performance and regions
where these confidence intervals are the largest As further measurements are
made in the iterations thereafter (iii) - (viii) the confidence intervals shrink
around areas richer with measurements and the surrogate model gains
confidence in its predictions Therefore as the algorithm gains confidence in the
model this means that the algorithm also gains confidence that it has achieved
the global optimum for the particular function
67
Figure 124 The Bayesian optimisation of f(x) where (i) - (viii) represent the sequential
iterations of the minimisation The acquisition function is shown in red measurements
are shown as red dots and the current estimated surrogate model is shown in blue with
its corresponding 95 confidence interval The maximum of the acquisition function
indicates the next measurement to be taken
Integer linear programming (ILP) is a class of methodologies that are
concerned with variables that can only take the form of integers and although is
not classically a type of global optimisation algorithm is still a mathematical
optimisation that is useful in specific cases and is utilised in this project An ILP
problem is in general very difficult to solve and many solvers have attempted to
simplify the procedure by utilising a much simpler linear programming (LP)
approach then rounding down the values to the nearest integer - this is known
as LP relaxation but may not always be effective in identifying the optimum
solution so other techniques must be used[158] In ILP optimisations it is also
common to have multiple linear constraints which define a feasible region that
the optimum can be found
Although ILP algorithms may proceed using different methodologies the
most intuitive introduction would be a 2-dimensional problem with a graphical
method The function to be maximised f shown as eqn 135 is bound by 4
linear constraints C1 - 4 shown as eqn 136 - 139
As the problem consists of two variables x and y it can be illustrated by a 2-
dimensional graphical plane where each linear constraint is a straight line
forming a closed feasible region - this is indicated in Figure 125[158] Therefore
all feasible solutions to this problem must be an integer in x and y within the
bounds of this feasible region The objective function f is represented as a
straight line with given inputs of x and y that indicates its current position This
function however can be viewed as a dynamic line that moves in parallel with
respect to different values of x and y Therefore in order to obtain the maximum
feasible evaluation of f the line is moved from its current location in the figure
119891 = 12119909 + 7119910 eqn 135
1198621 = 2119909 minus 3119910 le 6 eqn 136
1198622 = 7119909 + 4119910 le 28 eqn 137
1198623 = minus119909 + 119910 le 2 eqn 138
1198624 = minus2119909 minus 119910 le 2 eqn 139
68
until it intersects with the allowed two integer-valued inputs within the feasible
region for the first time All integer-valued input combinations within the feasible
region are marked with a red dot where the first intersecting point would be either
point 1 (23) or point 2 (31) indicated as P1 and P2 respectively These points
can be evaluated mathematically by the objective function to determinine the true
maximum where P1 = 43 and P2 = 45 Although this specific example is 2-
dimensional and this intuitive graphical method cannot be easily performed in 3-
dimensions and is impossible in further dimensions many computational ILP
algorithms proceed using this generalised concept to identify optimum inputs for
a given function
Figure 125 A graphical method to solving ILP problems where C1 - 4 indicate the linear
constraints the green area indicates the feasible region f shows the objective function
red dots represent the integer values of the inputs and P1 and P2 indicate two feasible
potential maxima to the problem Figure adapted from works reported by Boyd amp
Vandenberghe[158]
133 Optimisation summary
There are many methodologies that optimisation algorithms utilise
meaning that there are several classes of algorithm that are available and then
69
multiple subclasses thereafter There are specific cases where a particular
algorithm class is necessary to solve a problem but also cases where many
algorithms may be suitable it is then necessary to decide which algorithm to use
in this instance based on other factors such as computational efficiency In this
project these decisions will be explored as optimisation algorithms must be used
in multiple unique scenarios This is because other methodologies such as grid
search are too inefficient and imprecise especially as many input variables (for
example kinetic parameters to be optimised) must be determined in an
appropriate length of time and with high precision
14 Research aim
The aim of this project is to develop and advance an automated methodology
to kinetic model and parameter determination The basis of this project arises
from a methodology reported by Tsu et al[173] that provides a framework to a
technique that achieves this by evaluating all possible reaction models This
reported framework however has limited simulated examples and no real
experimental examples that prove its efficiency This methodology can represent
a positive change in the laboratory where physical-organic chemists can make
use of their human resource on other tasks instead of determining a reaction
model and kinetic parameters which can be assigned to a computer This is the
advantage to exploring this automated methodology that this project is
predicated on which leads the specific project goals herein described
bull To build this automated computational approach to kinetic model and
parameter determination based on the framework aforementioned as
well as to test the effectiveness of the approach in simulatedliterature
case studies (Chapter 2)
bull To prove the effectiveness of the approach in real experimental case
studies This approach will be coupled with automated kinetic profile
generation by flow rate manipulation in a continuous flow chemistry
experimental setup (Chapter 3)
Although methodology described is very powerful for many chemical
scenarios there are also instances where this technique does not work
Specifically this approach is not designed for applications where the reaction
70
order can be a non-integer or where particular species may be catalytic in
nature Therefore further specific project goals are described
bull To further develop this automated approach to kinetic model and
parameter determination to include chemistries that may proceed via a
catalytic route or have non-integer orders with respect to one or more
species in the reaction model The effectiveness of this new approach
must also be proven in a simulatedliterature case study(s) (Chapter 4)
bull To prove the effectiveness of this new approach in real experimental case
studies to achieve kinetic information (Chapter 5)
This project will ultimately lead to a tool that any chemist can utilise by
plugging time-series data and chemical species into the automated approach
then observing the output in the form of the most likely kinetic model and
associated parameters Without kinetic expertise any chemist will be able to use
this approach and interpret the output in order to obtain scalable process
understanding
Chapter 2 Development of the computational approach to
kinetic model determination
21 Introduction
A chemical system can be seen as a cascading dynamic reaction
scheme where molecules can orientate themselves in a particular way and with
a particular energy to allow a reaction to occur This reaction of course will follow
a particular reaction mechanism These mechanisms can give a deep
understanding of the underlying chemistry that we merely observe as a
transformation and can give real-world benefits as it then becomes clearer and
easier to control and understand chemical reactivity[174 175]
For the development of a chemical process however one of the greater
concerns is to mathematically characterise the transformation from the starting
materials to products - this can be complex and occur over many reaction steps
and involve many measurable and immeasurable intermediates This allows
quantitative information to be gained regarding the chemical synthesis allowing
71
for classical reaction engineering principles to be applied to shorten process
development times and lower costs[173] Therefore the objective is to develop
stoichiometric and kinetic descriptions of the individual transformations rather
than detailed mechanistic insights and rationales[176] Where stoichiometry refers
to the stoichiometric coefficient of a particular species in a reaction and kinetic
descriptions refer to the kinetic parameters involved in the rate equations for a
process For a system with multiple reactions this is referred to as a chemical
reaction network (CRN)
The basis for many stoichiometric and kinetic modelling studies with the
specific aim of CRN determination is the data-driven work reported by Aris and
Mah[177] This work is an early example of using computation to evaluate aspects
of a CRN specifically how many independent reactions can be shown to account
for changes in experimental data providing that all chemical species are
measured Bonvin and Rippin[178] later reported tar
get factor analysis (TFA) which was shown to derive approximate stoichiometric
models for complex systems as well as to test user-inputted stoichiometries for
their suitability to experimental (simulated) data TFA has been used and
advanced to verify proposed reaction stoichiometry in a select few reported
works[179 180]
TFA was then used as the basis for further work reported by Brendel et
al[181] and Bhatt et al[182] whereby an incremental identification method was
proposed This is a step-wise method where the stoichiometry is initially verified
using TFA then other model identification strategies are utilised to identify the
structure and parameters of the rate laws within the ODE models However TFA
initially requires a CRN to be at least postulated by a user before it can be used
This requires a high degree of chemical intuition but may also be incorrect as
there are many possible forms in which the CRN can exist especially when
dealing with a system with a large number of chemical species
An alternative step-wise method was also reported by Burnham et al[183]
in which a global ODE model structure was generated which is capable of
representing an entire set of possible chemical reactions As this global ODE
model structure represents an over-trained model model terms are sequentially
removed using statistical measures until all insignificant terms are removed
72
giving the final CRN As this features several optimisations of models with many
kinetic parameters in order to identify insignificant terms this optimisation can be
very slow and also suffer from local optima This is also the case with the
determination of insignificant terms as the identified optimum model itself may
be non-global
Willis and von Stosch[176] then reported the use of mixed integer linear
programming (MILP) to determine the model structure as well as its associated
kinetic parameters This was because previously reported step-wise
identification approaches fail to consistently predict the underlying network
structure[184-186] In this work a global CRN structure was reported but MILP was
used to dismiss all non-mass-balancing reactions from the structure
Decomposition of the global structure then occurs by statistical means and
although the global structure is now much smaller in this work termination at
local optima may still be an issue
Tsu et al[173] then reported an improvement upon this method where ILP
initially identifies all mass-balancing reactions then builds every possible
reaction model It is this approach that will be focussed on in this chapter and
further description and discussion is provided in Chapter 22 Every model is then
fitted and statistically evaluated which avoids the potential pitfall of local optima
when determining the correct model However this can be computationally
demanding as there are many more models to evaluate than in any previously
reported work
Other works in the literature include more algorithmic approaches to CRN
identification Differential evolution[187] genetic programming[188] and multi-
objective genetic algorithms[189] have all been used as global optimisers to
attempt to determine the CRN These specific global optimisers which focus on
mimicking real-life Darwinian evolution are attractive as the CRN is identified
with minimal human interaction or expertise However this optimisation method
can still encounter problems due to local optima and take a very long time to
compute due to the number of iterations necessary for convergence upon the
optimum
The main assumption that is universal among these approaches to CRN
determination is that all reaction kinetics follow the law of mass action This
73
states that the rate of reaction of an elementary reaction is directly proportional
to the product of the concentrations of the reactants raised to the power of their
stoichiometric coefficients[190] For the reaction shown in eqn 1 based on the
law of mass action the reaction rate can be described by eqn 2 and therefore
eqn 3 The kinetic rate constant k therefore determines the speed of the
reaction as well as the reactant concentrations
Where
bull α β γ = stoichiometric coefficients
bull x1-3 = chemical species
bull k = kinetic rate constant
bull rate = rate of reaction
The law of mass action is applicable in most cases however there are
particular cases where it is not accurate to describe a process using mass action
kinetics where these approaches are not applicable Such processes typically
occur when concentrations of particular substrates are very low[191]
22 Development of the approach
The computational approach was developed using MATLAB by loosely
following the approach outlined by Tsu et al[173] The approach contains two main
sequential stages kinetic model generation and kinetic model fitting Firstly all
mass-balance-allowed reactions are identified from the inputted species (starting
materials intermediates and products) Then all of the feasible reaction models
ie all possible combinations of these allowed reactions are compiled and stored
in a model database
After the model database has been generated for the particular process
the kinetic model fitting stage then evaluates the fit of the ordinary differential
equations (ODEs) for that particular model to the experimental data provided
The MATLAB ODE solvers can be used to in such a way to allow an assessment
1205721199091 + 1205731199092119896rarr 1205741199093 eqn 21
119903119886119905119890 prop [1199091]120572[1199092]
120573 eqn 22
119903119886119905119890 = 119896[1199091]120572[1199092]
120573 eqn 23
74
of how the concentration of a species changes over time when given particular k
values Therefore optimising the k values for a given reaction model by
maximising the convergence of the ODEs with the experimental data provides
an indirect route to their identification The convergence metric which is the sum
of squared error (SSE) between the simulated ODEs and the data as well as the
k values for each model are then stored
Statistical analysis is then applied to each of the models Corrected
Akaikersquos Information Criterion (AICC) is used as a measure to identify the models
that best balance model simplicity and convergence to the data and hence
identify the most valid models When these models have been identified it is
then possible to run Monte Carlo simulations if the error of the experimental data
is known These simulations assume that the error is normally distributed around
the data point and compile both the error in experimental data and error in the
kinetic fitting of the ODE to obtain an uncertainty prediction in the identified k
values for the process
221 Kinetic model generation
In order to generate the kinetic models for evaluation the first step is to
input all of the known species of a chemical process into the system The species
can be identified by any means typically by experimentation where all starting
materials intermediates and products are identified These species are inputted
based on their respective number of differing atoms ie number of carbon
atoms number of oxygen atoms etc which is known as a Mass Matrix (MM)
For example if you take the known reaction model of A + B C + D
shown in Scheme 21 you could visualise initially inputting these four species
into a mass matrix shown in Figure 21
75
Scheme 21 An example esterification reaction
Figure 21 The Mass Matrix inputted into the approach assigning mass to each of the
species
It is also possible to describe the reactions (forward and backward) shown
in Scheme 21 in terms of the stoichiometry of reactants used (SR) and the
products formed (SP) as a set of matrices in Figure 22 When describing these
matrices a 0 represents that the species does not participate a 1 represents
that the species does participate with a kinetic order of 1 and 2 represents that
the species participates with a reaction order of 2 For example in the forward
reaction both species A and B participate as a reactant with reaction order 1
meaning that they are represented by lsquo1rsquo whereas C and D do not participate as
reactants so are represented by lsquo0rsquo These stoichiometric matrices are then
combined to form an overall stoichiometry S where S = SP - SR This overall
stoichiometry for an unknown model would otherwise be identified using an
Integer Linear Programming (ILP) optimisation and is necessary to identify all
feasible mass-balanced reactions
76
Figure 22 The stoichiometric matrices for the reaction model shown in Scheme 21 as well
as the overall stoichiometry matrix S
The ILP optimisation proceeds by finding every feasible stoichiometry that
satisfies the objective function of MMmiddotS = 0 where S is the transposed vector of
a single reaction with values for each of the species present Therefore as there
are four species in the esterification process shown in Scheme 21 the ILP
optimisation will proceed using the known Mass Matrix to identify the values of
X1-4 that satisfy the objective function shown in Figure 23 The optimised
solution is then the resulting stoichiometric vector which relates to a particular
feasible reaction The upper bound for the number of reactants in a stoichiometric
vector is 2 as it is very rare to encounter third order reactions as a single reaction
step When an optimised solution is found the solution is saved then successive
constraints are added to the ILP optimisation to guarantee that the same
combination of binary variables (and hence stoichiometry) are not obtained when
the optimisation problem is solved again The optimisation then ceases when
there are no more solutions to be found and hence all feasible mass-balance-
allowed transformations are identified
Figure 23 The ILP optimisation identifying a feasible solution to the objective function hence
identifying a mass-balance-allowed reaction Where X1 = A X2 = B X3 = C X4 = D
After all feasible reactions are identified these standalone reactions are
themselves potential models There are also other possibilites for reaction
models where there are any combinations of two of the possible reactions or
any combinations of three of the reactions etc The total number of possible
models (η) is equal to the sum of the binomial coefficients (or all combinations)
77
for every number of reactions in the model up to the total number of possible
identified reactions (δ) - this is shown in eqn 24 All of these combinations are
then generated and saved to a model database which will be accessed in the
next stage of the approach For example if the ILP optimisation identifies 5
possible reactions (δ = 5) the summation of all combinations gives η equal to
31 This example can be shown in a model representation in Figure 24 where
this could be any appropriate reaction where SM = starting material Int1 =
intermediate 1 Int2 = intermediate 2 P = product and Imp = impurity It should
also be noted that as all of these forward reactions are mass-balanced all
backward reactions would also be plausible but are omitted from the
representation for concisiveness
Where
bull η = total number of models
bull δ = number of possible reactions
bull i = iterative number of reactions considered for the model
120578 = sum 120575
119894 (120575 minus 119894)
120575
119894=123hellip120575
eqn 24
78
Figure 24 A visual representation of all of the possible reaction models when given five mass-
balance-allowed sample reactions each shown as a different coloured block When i = 1
each reaction is in itself a model and when i gt 1 each reaction behaves as a model
fragment These fragments when combined in different ways provide full and unique
reaction models each of which are to be assessed for their validity with respect to
experimental data
After every possible model has been saved into the model database each
of these models are then automatically transformed into their respective ODEs
which is a form that can be readily used in the kinetic model fitting stage of the
approach The individual stoichiometric reactions that make up each model are
compiled into a set of differential equations for each model where each of the
participating species have their own differential equation to show how their
concentration changes over time Figure 25 summarises the model generation
section of the approach by using the esterification reaction as an example This
shows how the initial input of the species is first used to identify the feasible
mass-balance-allowed reactions then how these reactions can be ordered into
every possible reaction model then subsequently how these models are
transformed into sets of differential equations for use in the kinetic model fitting
stage of the approach
79
Figure 25 A schematic summarising how the model generation stage of the approach
progresses Where the participating species are inputted and sorted ODE functions that
describe all possible mass-balance-allowed reactions are outputted
222 Kinetic model fitting
After the model generation stage of the approach is completed and there
is a sorted database with all possible models compiled with their respective ODE
functions the next stage of the approach can begin kinetic model fitting This
80
stage proceeds by sequentially loading individual models from the database
then attempting to optimise the kinetic constants for each of the reactions within
the model These optimisations progress based on the simulated ODE resultsrsquo
convergence with experimental data where more suitable models exhibit a
favourable change in ODE convergence based on the kinetic constants provided
by the optimiser Where models do not accurately describe the chemistry taking
place in the experimental dataset the optimiser typically ceases very quickly as
there is no way to incur a favourable change in the ODE results as it iterates
After the fitting of a particular model is complete the kinetic constants (optimised
results) as well as the minimised error metric of the ODE convergence (sum of
squared error or SSE) are assigned to the model and saved for statistical
analysis
2221 The objective function
When a model is initially selected for kinetic fitting the objective is to use
an optimisation algorithm to minimise the SSE between the simulated ODE
results and the experimental results This is shown in Figure 26 with a set of
time-series data showing a first-order decrease in the concentration of A The
first iteration of the algorithm is shown where a guess of k = 04 is applied to the
ODE solver The lsquodifferencersquo between the experimental result of data point Ex
and the simulated ODE of data point Sx is shown as Dx This value is squared
to make the value positive and summed with all other differences to give one
SSE value this is shown mathematically in eqn 25
119878119878119864 = sum (119864119909 minus 119878119909)2
119909=123hellip
eqn 25
Where
bull SSE = sum of squared error
bull Ex = experimental data point
bull Sx = simulated ODE data point
As the algorithm iterates the aim is to decrease the SSE output by varying
the input k values In this example optimisation shown in Figure 26 the optimiser
(and hence SSE) reaches a minimum at iteration 11 as the ODE converges very
well with the experimental data This method serves as an indirect route to
81
identifying kinetic constants as in this case the k values are the optimised inputs
for the optimisation algorithm
Figure 26 The iterations of an optimisation algorithm with respect to the convergence of
simulated ODEs with sample data - this occurs via the minimisation of the SSE output
For each iteration of the algorithm the inputted k values are used
alongside the ODE equations for the current model The ODE solver simulates
how each of the specified initial speciesrsquo concentrations change over time given
82
the reaction rate calculated from the k values the species concentration at that
moment and the reaction model The ODE solver used for this approach is the
MATLAB solver lsquoode15srsquo This is a stiff ODE solver meaning that it can be used
to solve lsquostiffrsquo ODEs An ODE is stiff when the integration must be completed in
unreasonably small increments by typical solvers that could require millions of
evaluations leading to a solver failure As there are many reaction models that
are to be evaluated it isnrsquot clear which ODEs would present themselves as stiff
problems Therefore ode15s was used which can approach curve solutions for
both stiff and non-stiff ODEs as opposed to a non-stiff solver which would be
able to solve non-stiff ODEs faster but fail when stiff ODEs were to be evaluated
Depending on the nature of the experimental data different inputs for the
optimisation algorithm may also be used If there is only one data set or all data
sets are at the same temperature then k values can be optimised If there are
multiple data sets at different temperatures however it is often better to optimise
directly for the activation energy and reference k value This is because there are
fewer variables for the algorithm to optimise meaning there is a greater chance
of convergence on a global optimum and not a local one this is discussed further
in Chapter 2222
The reference k value is at a particular reference temperature typically
the midpoint of the temperatures explored experimentally This is to ensure that
there are no weightings in the fittings of parameters towards the extremes of the
temperatures explored This reference k value and activation energy value for
each of the transformations are optimised as these inputs generate the k values
for each transformation using the re-parameterised Arrhenius equation shown
as eqn 26 where the general Arrhenius equation is shown as eqn 27
119896 = 119896119903119890119891119890[minus119864119886119877(1119879minus1119879119903119890119891
)] eqn 26
119896 = 119860 119890minus119864119886119877119879 eqn 27
Where
bull k = rate constant
bull kref = reference rate constant at a particular temperature
bull Ea = activation energy kJ mol-1
bull A = pre-exponential factor
83
bull T = temperature of reaction K
bull Tref = reference temperature for the reference rate constant K
bull R = ideal gas constant J mol-1 K-1
The re-parameterised Arrhenius equation is used for kinetic fitting as there
is only one optimum for the reference k and activation energy values regardless
of the kinetic model This means that the output of the algorithm can be assumed
to be at a discrete optimised point This is not the case if optimising for set of
values for a pre-exponential factor and activation energy due to the high
correlation between these values[192 193] This means that there are several sets
of values that can all combine to obtain the same rate constant which can be
avoided when using the re-parameterised equation to fit kinetic parameters to
data sets that include multiple temperatures
The final consideration when compiling the objective function is the
method of measuring the convergence of the simulated ODEs to the
experimental data For all simulated and experimental case studies herein
reported the SSE metric has provided good convergence to time-series data for
all species This could present a problem however in cases where particular
species occur in only small quantities and SSE does not provide a good fit to the
data This is because the SSE metric reduces the overall error hence giving a
biased fit to species that are present in larger concentrations This could be
prevented by using a different error metric - such as a weighted sum of squared
error (WSE) or a relative sum of squared error (RSE) Both of these error metrics
serve to normalise the errors in convergence between species present in higher
and lower concentrations and can be used in this approach if the experimental
data suggests that it would be appropriate
2222 The optimisation algorithm
When fitting kinetics using this approach the algorithm used to minimise
the error metric described in Chapter 2221 and hence maximise the
convergence of the simulated ODE with experimental data is the MATLAB
function fmincon fmincon utilises an interior point algorithm which is described
in detail in Chapter 131 This function has been reported extensively in the
literature for the nonlinear optimisation of dynamic models including
considerable uses in the fitting of kinetic parameters to reaction models[194-196]
84
fmincon is a local optimisation tool that leads to fast and accurate
convergence on local optima As the given error metric SSE reports a value
based on the residuals that is correlated to the magnitude of the concentrations
involved it is not clear based on this value whether true convergence has
occurred However due to the nature of the problem it is simple to plot the
experimental data and simulated ODE after kinetic fitting to visually confirm that
convergence has occurred Based on the convergence to the experimental data
it can then be assumed that the optimum found is the global optimum for that
model If non-convergence occurs then it is either because the given model does
not accurately represent the chemistry in the system or the algorithm became
trapped in a local optimum The likelihood of these scenarios depends on the
non-linearity of the data and the number of variables to be optimised
Generally speaking in these scenarios it is assumed that when non-
convergence occurs it is because the model does not accurately represent the
chemistry This is because of two reasons The first is that most kinetic data does
not feature sharp inflexions or cliff-edges in which concentration-time data
deviates from an otherwise smoothed curvature It is this curvature in the data
that makes local solvers such as fmincon very effective at identifying kinetic
parameters as large aspects of their methodologies involve gradient-based
calculations Therefore the path that the optimiser takes towards the optimum
typically iteratively improves as the optimiser progresses and with a smoothed
parameter space this means that the iterative improvement is unlikely to reach a
local optimum The second reason is that when fitting kinetics typically the
number of variables to be optimised is low as many models feature chemistry
that has fewer than 10 model terms This means that it is unlikely that fmincon
will encounter local optima when optimising and will only find the globally
optimum solution
There is not a discrete reported number of variables to be optimised that
means that fmincon will start to encounter local optima issues Kinetic studies
are reported routinely where ~15 or more parameters are optimised using
fmincon both isothermally and across different temperatures without issues[197
198] However it cannot be assumed a priori with certainty that these issues will
not occur Therefore in cases where there are more than 10 model terms to be
optimised a form of global optimisation called multi-start fmincon (ms-fmincon)
85
will be used This methodology employs fmincon but with multiple starting points
from which the optimisation starts Using ms-fmincon with 5 randomised starting
points means that from those 5 optimisations the global optimum is very likely
to be found when more than 10 parameters are to be optimised This approach
utilises ms-fmincon because it has been proven to be effective in optimising even
large scale systems A recent example of this was reported where 383
parameters were optimised accurately for a large kinetic model[199]
223 Statistical analysis
After the kinetic parameters are optimised for each model and the error
metric (SSE) recorded statistical analysis can then be performed to determine
the most likely model that describes the experimental data Akaikersquos Information
Criterion (AIC) eqn 28 provides a relative evaluation of a model for a particular
set of data[200]
119860119868119862 = 119899 ln (119878119878119864
119899) + 2119896 eqn 28
Where
bull AIC = Akaikersquos Information Criterion
bull n = number of observations
bull SSE = sum of squared error
bull k = number of model terms
This calculation provides a relative evaluation of balancing the goodness-
of-fit of the model to the experimental data with having as few model terms as
possible where a minimised value is optimal Therefore models are more
favourable if they only contain terms that have a significant effect on the fit to the
data inputted This means that the optimum model that AIC selects is less likely
to be over-trained as all model terms contribute a significant amount towards
the fit of the data
In the context of this approach an AIC evaluation can inform the
experimenter which reaction model is the most likely to be correct in relation to
other models considered This model should only contain reactions that
significantly contribute towards the convergence of the simulated ODEs with
experimental data points As AIC assumes that the amount of data is sufficiently
large in relation to the number of model parameters it is also beneficial for the
86
purposes of this approach to use a corrected AIC value to compensate for the
reduced sample sizes
The Corrected Akaikersquos Information Criterion (AICC) eqn 29 both
converges to AIC for large sample sizes but gives a more accurate answer for
smaller sample sizes as a greater weighting is placed on the number of model
terms[201] Reported data suggests that an uncorrected AIC value is appropriate
only when the ratio of nk is greater than 40 otherwise an AICC evaluation should
be used[202] However as the model penalisation aspect of AICC is favourable to
differentiate models with similar SSE values and many of the lsquoobservationsrsquo in
the context of a kinetic profile can be highly correlated if the ratio of nk is less
than 40 then the number of observations should be the number of individual
experiments rather than individual data points This is also true where several
experiments are used in fitting to contribute towards one SSE value where each
experiment has a vastly different number of measurements within them
119860119868119862119862 = 119860119868119862 + 2119896(119896 + 1)
119899 minus 119896 minus 2+ 119899 ∙ ln(2120587) + 119899
eqn 29
Where
bull AIC = Akaikersquos Information Criterion
bull AICC = Corrected Akaikersquos Information Criterion
bull n = number of observations
bull k = number of model terms
224 Other considerations
There may be some instances where there are intermediates or products
formed that cannot be identified This occurrence can be chemistry-dependant
but it is common that the quantitative analysis of a process can show total mass
balance losses as a reaction progresses This can indicate that either the species
calibrations are inaccurate or there is a real loss of massconcentration that is
unaccounted for If calibrations are correct with certainty and there is still a loss
of mass that is unaccounted for it can also be beneficial to input an additional
species into the system This will force the approach to identify a new pathway
to an unknown species which can be assigned the total mass loss of the process
as the time-series data progresses Due to the nature of the AICC evaluation it
can then be determined statistically if this loss of mass contributes significantly
87
enough towards the fitting of the data to suggest that there is a chemical pathway
occurring that is not described by the userrsquos inputted species This pathway will
be a grouped reaction description with an observed rate constant kobs This is
because if another pathway is shown to occur then it is not possible to know
how many routes that mass is lost by Chemical considerations must then be
undertaken to identify missing species and the approach must be re-run
When running the approach the model generation aspect is very fast
whilst the kinetic fitting stage is significantly slower due to the many optimisations
that must be conducted The kinetic fitting stage is considerably accelerated by
utilising parallel computing This means that each optimisation operation is
conducted on a single computer core meaning that separate tasks can be sent
to separate cores within the computer This means that optimisations are
conducted in parallel as the process speed scales directly with the amount of
computer cores available The time taken for each optimisation is heavily
dependent on the model it is fitting and the number of ODE evaluations to be
conducted A typical range for a single optimisation can take from 10 - 120
seconds on a standard Intel i5-2310 processor however many optimisations
take less than 1 second if the model does not describe the experimental data
accurately
225 Overview
This computational approach to kinetic model selection and parameter
identification was developed in MATLAB by loosely following the methodology
reported by Tsu et al[173] The approach first identifies all possible reactions that
can happen based on mass balance alone from the species inputted by the user
All plausible models are then compiled by taking every combination of these
reactions and sequentially optimising the kinetic parameters for each of these
models Each model is then statistically evaluated and ranked highlighting the
most likely model based on the experimental data supplied The approach outline
is summarised in Figure 27
88
Figure 27 An outline of the stages of the computational approach
This method serves as a comprehensive model evaluator where chemical
intuition is removed thereby removing a chemistrsquos bias and considering a
number of possible models that may otherwise not have been considered It is
however not the role of this approach to remove all necessity for a physical-
organic chemist to supervise the discovery of a kinetic model This approach is
to be used as a complementary tool whereby all models are evaluated without
human effort or interaction but final considerations are still made by the chemist
when the ranked model list is generated This is because there may be reactions
present in the most likely model that describe chemistry that is unlikely or unable
to occur but still give a good fit to the experimental data It may also be possible
that many models give very similar AICC evaluations so many models may be
competing
The benefits to this tool are clear All models are generated based on
logical transformations of the species inputted and every possibility is
comprehensively evaluated without the need for a chemistrsquos or statisticianrsquos most
important resource time Typically a chemist would evaluate a select few models
based on chemical intuition and remove certain chemical possibilities a priori
then further refine the model until it is satisfactory When all possibilities are
considered by an approach that automatically evaluates them this allows the
chemist to work on other projects including more important aspects of laboratory
work or theory that cannot be assigned to a machine However although
89
powerful this tool ultimately is data-driven and must be used in conjunction with
real chemical intuition by an end user to determine that the models identified as
most likely are accurate and consistent with the science
23 Simulated verification of the approach
Before any real experimentation takes place it is important to first verify
that the approach works as a means of identifying the correct reaction model and
kinetic parameters Therefore several simulated case studies were conducted
with varying goals to show the adaptability of the approach to different
circumstances These simulated case studies feature reactions from the
literature where the model and kinetic parameters are already identified
Simulated experimental data is generated from this information and used as the
basis for verifying the approach
To simulate the data first the true model and kinetic parameters reported
in a given literature source are inputted into MATLAB The experiment is then
simulated at a particular temperature and set of initial concentrations by using
an ODE solver to evaluate the change in species concentrations over a given
experimental timeframe Individual data points from this timeframe are then
extracted which serve as the experimental data points for the particular
simulated case study To then make the case study more robust up to 5
relative error in each measurement is added to approximate this simulated data
more closely to real experimental data This generation of simulated data is
summarised in Figure 28
90
Figure 28 An example showing the generation of a simulated data set from the literature a)
An ODE is simulated for a particular model with a set of kinetic parameters in this case A
rarr B where mdash = A mdash = B b) Particular time points are taken from this ODE to
represent individual measurements where x = A x = B c) Up to 5 relative random
error is added to these measurements to more closely resemble real experimental data
231 Case study Benzoic acid alkylation
The first simulated case study was a very basic system where there are
only three species to be considered[203] The reaction system was benzoic acid
21 reacting with iodomethane 22 in the presence of the base 18-bis-
(tetramethylguanidino)naphthalene (TMGN) to form the methyl benzoate
product 23 and hydroiodic acid 24 This reaction is shown in Scheme 22
TMGN was present at one equivalent with respect to benzoic acid and was
assumed to deprotonate the benzoic acid so that all of the starting material is in
the carboxylate form There were no rates reported by the authors for this
deprotonation but they indicated that modelling this system as a simple second
order reaction under these conditions yielded accurate results
91
Scheme 22 The reaction of benzoic acid with iodomethane to form methyl benzoate
Modelled as a second order reaction
2311 Data acquisition
The second order reaction model reported by Gholamipour-Shirazi[203]
was used to generate the ODEs shown in eqn 210 - 213 Three isothermal
simulated data sets were generated using these ODEs with the k value of 057
M-1 s-1 with the following initial concentrations
bull 01 M benzoic acid 21 008 M iodomethane 22 0 M methyl benzoate
23 0 M hydroiodic acid 24
bull 01 M benzoic acid 21 011 M iodomethane 22 0 M methyl benzoate
23 0 M hydroiodic acid 24
bull 01 M benzoic acid 21 015 M iodomethane 22 0 M methyl benzoate
23 0 M hydroiodic acid 24
119889[120784 120783]
119889119905= minus119896 [120784 120783][120784 120784] eqn 210
119889[120784 120784]
119889119905= minus119896 [120784 120783][120784 120784] eqn 211
119889[120784 120785]
119889119905= 119896 [120784 120783][120784 120784] eqn 212
119889[120784 120786]
119889119905= 119896 [120784 120783][120784 120784] eqn 213
5 relative error was then added to these simulated data sets then used
as the inputted experimental data for the computational approach These data
sets can be found in Chapter 721
2312 Results and discussion
Based on the inputs of the molecular weights for this system there were
two mass-balance-allowed reactions shown in eqn 214 and eqn 215 which
are two of the three possible models that can be generated The third model
92
shown in eqn 216 is the combination of these two allowed reactions resulting
in an equilibrium reaction model
Forward 21 + 22 rarr 23 + 24 eqn 214
Backward 23 + 24 rarr 21 + 22 eqn 215
Equilibrium 21 + 22 23 + 24 eqn 216
These three models were then each evaluated based on how well the
simulated ODE curves converge to the experimental data inputted The kinetic
parameters kx were optimised for each model and the SSE was recorded
These results are tabulated in Table 21 The concentrations of HI were assumed
to not be measured during the kinetic fitting and were instead inferred
Table 21 A table showing the optimised k values for the identified models in the benzoic acid
alkylation case study alongside each modelrsquos SSE and AICC
The computational approach reveals that the reaction model containing
solely the forward reaction gives the minimum overall error and the best (lowest)
AICC evaluation when assessing the experimental data indicating that this is the
most likely reaction model For the backward reaction the minimisation algorithm
could not optimise a k value to give a better fit than the initial guess of 1 x 10⁻³
M-1 s-1 indicating that the reaction model is in complete disagreement with the
experimental data For the equilibrium model the error is as low as the forward
reaction model alone as the optimiser assigns a small k value to the reverse
reaction to attempt to fit to the noise of the system Although this model fits the
data equally well there is the added complexity of a second model term as this
term adds no value in terms of lowering the SSE it is an unfavourable addition
in terms of an AICC evaluation which prefers simplistic models and is therefore
considered a less appropriate model than the forward reaction term alone
This case study has shown that it is possible to use this computational
approach to identify the correct model and kinetic parameters for a simple
Reaction kx M-1 s-1 SSE M AICC
Forward 05807 08101 -655
Backward - 10185 -174
Equilibrium 05817 00009 08101 -410
93
system by simply inputting the participating species and their respective
changes in time-series data The k value identified is very similar to the one used
for the generation of the simulated data and varies only because of the 5
noise added to the system The fit of the identified model and k value for the data
supplied is shown in Figure 29 where the data set shown is the middle
experiment where the starting concentrations were 01 M benzoic acid and 011
M iodomethane
Figure 29 The fit of the identified model and kinetic parameters to the generated experimental
data with starting concentrations of 01 M benzoic acid and 011 M iodomethane Where
x = benzoic acid x = iodomethane x = methyl benzoate mdash = benzoic acid (ODE) mdash =
iodomethane (ODE) mdash = methyl benzoate (ODE)
232 Case study Nitrile hydrolysis
This case study features a slightly larger system where there are 5
species to consider in the hydrolysis of a nitrile[204] The nitrile of interest 25 is
hydrolysed by hydroxide 26 to form the amide 27 This amide is then further
hydrolysed to form the carboxylic acid 28 and ammonia 29 This reaction is
shown in Scheme 23 As in many acidbase reactions there are a lot of fast
proton transfer steps the mass of species 26 is therefore added to the system
94
as water H2O rather than hydroxide OH- in order to preserve mass balance
This allows appropriate reaction models to be generated
Scheme 23 The reaction of a nitrile with hydroxide to form the corresponding amide which is
susceptible to further hydrolysis to form the carboxylic acid Modelled as sequential
second order reactions
2321 Data acquisition
The sequential second order reaction model reported by Niemeier et
al[204] was used to generate the ODEs shown in eqn 217 - 221 The reported
kinetic constants for the two steps were
bull Step one k75 degc = 927 x 10-3 M-1 s-1 Ea = 871 kJ mol-1
bull Step two k75 degc = 363 x 10-5 M-1 s-1 Ea = 745 kJ mol-1
Four simulated data sets were generated at four separate temperatures by using
eqn 26 to calculate k values with the following initial concentrations
bull 08 M nitrile 25 18 M hydroxide 26 0 M amide 27 0 M carboxylic
acid 28 0 M ammonia 29 60 degC
bull 08 M nitrile 25 18 M hydroxide 26 0 M amide 27 0 M carboxylic
acid 28 0 M ammonia 29 70 degC
bull 1 M nitrile 25 2 M hydroxide 26 0 M amide 27 0 M carboxylic acid
28 0 M ammonia 29 80 degC
bull 1 M nitrile 25 2 M hydroxide 26 0 M amide 27 0 M carboxylic acid
28 0 M ammonia 29 90 degC
119889[120784 120787]
119889119905= minus1198961[120784 120787][120784 120788] eqn 217
95
119889[120784 120788]
119889119905= minus1198961[120784 120787][120784 120788] minus 1198962[120784 120789][120784 120788] eqn 218
119889[120784 120789]
119889119905= 1198961[120784 120787][120784 120788] minus 1198962[120784 120789][120784 120788] eqn 219
119889[120784 120790]
119889119905= 1198962[120784 120789][120784 120788] eqn 220
119889[120784 120791]
119889119905= 1198962[120784 120789][120784 120788] eqn 221
5 relative error was then added to these simulated data sets then used
as the inputted experimental data for the computational approach These data
sets can be found in Chapter 722
2322 Results and discussion
Based on the inputs of the molecular weights for this system there were
four mass-balance-allowed reactions shown in eqn 222 - 225 All possible
models were then compiled subject to eqn 24 resulting in 15 models
25 + 26 rarr 27 eqn 222
27 rarr 25 + 26 eqn 223
26 + 27 rarr 28 + 29 eqn 224
28 + 29 rarr 26 + 27 eqn 225
All 15 models were evaluated sequentially then ranked based on their
AICC It was found that the highest ranked model was the correct model with
kinetic parameters optimised to be very close to the real values As artificial error
was added to the results this optimisation is assumed to be correct as the
relative error in the kinetic parameters is negligible The top three performing
models are shown in Table 22 where the reference k values at 75 degC are shown
as well as the activation energy SSE and AICC
Table 22 A table showing the top three ranked models for the nitrile hydrolysis case study
The kinetic parameters for each reaction within the model is shown as well as the SSE
and AICC evaluation
Model
rank Model
kx75 degC M-1 s-1
or s-1
Ea kJ
mol-1 SSE M AICC
1 25 + 26 rarr 27 923 x 10-3 867 00179 -1623
96
26 + 27 rarr 28 + 29 449 x 10-5 716
2
25 + 26 rarr 27
26 + 27 rarr 28 + 29
28 + 29 rarr 26 + 27
928 x 10-3
430 x 10-5
194 x 10-4
867
755
263
00179 -1567
3
25 + 26 rarr 27
27 rarr 25 + 26
26 + 27 rarr 28 + 29
932 x 10-3
363 x 10-5
420 x 10-5
865
373
748
00180 -1566
This case study has shown that it is possible to identify the correct model
and kinetic parameters for a multistep chemical system using the computational
approach Interestingly this study has shown again that the overall error is very
similar in the top-ranked competing models meaning that the deciding factor
then becomes the number of model terms due to the AICC evaluation The data
inputted was at different temperatures and the kinetic parameter optimisation
proceeded smoothly when optimising reference k values and activation energies
directly An example kinetic plot showing the fit of the identified model to the
experimental data is shown in Figure 210 - this is the fourth experiment where
the starting concentrations were 1 M nitrile and 2 M hydroxide at 90 degC
97
Figure 210 The fit of the identified model and kinetic parameters to the generated
experimental data with starting concentrations of 1 M nitrile and 2 M hydroxide at 90 degC
Where x = nitrile x = amide x = carboxylic acid mdash = nitrile (ODE) mdash = amide (ODE) mdash
= carboxylic acid (ODE)
233 Case study SNAr kinetics
The final simulated case study involves a larger scale multistep system
where there are 6 species in a SNAr chemical setting 24-dichloropyrimidine
(starting material SM) 210 reacts with morpholine 211 to form either the 4-
substituted product 212 or the 2-substituted product 213 These products can
then further react with another equivalent of morpholine to produce the bis-
substituted product 214 Each of these reactions form hydrochloric acid 215
as a byproduct that is neutralised by an excess of base This system is shown in
Scheme 24
98
Scheme 24 The reaction of 24-dichloropyrimidine 210 with morpholine 211 to form the 4-
substituted product 212 and the 2-substituted product 213 and the subsequent bis-
substituted product 214
2331 Data acquisition
The multistep SNAr reaction model reported by Reizman and Jensen consists
of 4 second-order reactions These reactions were used to generate the ODEs
shown in eqn 226 - 231 The reported kinetic constants for these three steps
were
bull Step one log(A) = 34 M-1 s-1 Ea = 270 kJ mol-1
bull Step two log(A) = 35 M-1 s-1 Ea = 321 kJ mol-1
bull Step three log(A) = 49 M-1 s-1 Ea = 600 kJ mol-1
bull Step four log(A) = 30 M-1 s-1 Ea = 450 kJ mol-1
Three simulated data sets were generated at 90 degC by using eqn 27 to calculate
k values with the following initial concentrations
bull 1 M SM 210 22 M morpholine 211 0 M 4-substituted product 212 0
M 2-substituted product 213 0 M bis-substituted product 214 and 0 M
hydrochloric acid 215
bull 12 M SM 210 28 M morpholine 211 0 M 4-substituted product 212
0 M 2-substituted product 213 0 M bis-substituted product 214 and 0
M hydrochloric acid 215
bull 09 M SM 210 32 M morpholine 211 0 M 4-substituted product 212
0 M 2-substituted product 213 0 M bis-substituted product 214 and 0
M hydrochloric acid 215
99
119889[120784 120783120782]
119889119905= minus1198961[120784 120783120782][120784 120783120783] minus 1198962[120784 120783120782][120784 120783120783] eqn 226
119889[120784 120783120783]
119889119905= minus1198961[120784 120783120782][120784 120783120783] minus 1198962[120784 120783120782][120784 120783120783]
minus 1198963[120784 120783120784][120784 120783120783] minus 1198964[120784 120783120785][120784 120783120783]
eqn 227
119889[120784 120783120784]
119889119905= 1198961[120784 120783120782][120784 120783120783] minus 1198963[120784 120783120784][120784 120783120783] eqn 228
119889[120784 120783120785]
119889119905= 1198962[120784 120783120782][120784 120783120783] minus 1198964[120784 120783120785][120784 120783120783] eqn 229
119889[120784 120783120786]
119889119905= 1198963[120784 120783120784][120784 120783120783] + 1198964[120784 120783120785][120784 120783120783] eqn 230
119889[120784 120783120787]
119889119905= 1198961[120784 120783120782][120784 120783120783] + 1198962[120784 120783120782][120784 120783120783]
+1198963[120784 120783120784][120784 120783120783] + 1198964[120784 120783120785][120784 120783120783]
eqn 231
2 relative error was then added to these simulated data sets then used
as the inputted experimental data for the computational approach These data
sets can be found in Chapter 723
2332 Results and discussion
From these 6 species there are 16 mass-balance-allowed reactions that can
be identified shown in eqn 232 - 247 All possible reaction models were
generated subject to eqn 24 which resulted in 65535 unique models to be
evaluated by the approach
213 rarr 212 eqn 232
212 rarr 213 eqn 233
210 + 211 rarr 212 + 215 eqn 234
212 + 215 rarr 210 + 211 eqn 235
210 + 214 rarr 212 + 212 eqn 236
210 + 211 rarr 213 + 215 eqn 237
211 + 212 rarr 214 + 215 eqn 238
100
212 + 212 rarr 210 + 214 eqn 239
214 + 215 rarr 211 + 213 eqn 240
213 + 215 rarr 210 + 211 eqn 241
211 + 213 rarr 214 + 215 eqn 242
210 + 214 rarr 212 + 213 eqn 243
210 + 214 rarr 213 + 213 eqn 244
214 + 215 rarr 211 + 212 eqn 245
212 + 213 rarr 210 + 214 eqn 246
213 + 213 rarr 210 + 214 eqn 247
All 65535 models were evaluated by the computational approach which
incurred a computation time of 52 hours (see Chapter 761 for details on
computer specifications) Each of these models were ranked based on their
AICC and it was found that the highest ranked model was also the correct model
with kinetic parameters optimised to values that were very close to the generated
values As in the nitrile hydrolysis case study Chapter 232 this optimisation is
assumed to be correct as the error in the fitted parameters is negligible
considering that artificial error was added to the dataset The top three
performing models are shown in Table 23 where the optimised k values are
shown as well as their corresponding SSE and AICC values
Table 23 A table showing the top three ranked models for the SNAr case study The kinetic
parameters for each reaction within the model is shown as well as the SSE and AICC
evaluation
Model
rank Model kx M-1 s-1 SSE M AICC
1
210 + 211 rarr 212 + 215
210 + 211 rarr 213 + 215
211+ 212 rarr 214 + 215
211 + 213 rarr 214 + 215
032945
007686
000018
000037
00024 -2112
2
210 + 211 rarr 212 + 215
210 + 211 rarr 213 + 215
211+ 212 rarr 214 + 215
032948
007679
000018
00024 -2086
101
211 + 213 rarr 214 + 215
213 + 215 rarr 210 + 211
000033
000004
3
210 + 211 rarr 212 + 215
210 + 211 rarr 213 + 215
211+ 212 rarr 214 + 215
211 + 213 rarr 214 + 215
210 + 214 rarr 213 + 213
032949
007672
000018
000036
015890
00024 -2085
This final simulated case study has shown that it is still possible to identify
the correct reaction model and kinetic parameters for a more complicated
multistep chemical system even when there are several thousand models to
consider Many of these models are very similar and the top-ranked competing
models contain the four model terms that are appropriate as well as typically
one other model These models are top-ranking because the additional terms
are optimised by the algorithms to either have a negligible effect on the output
or to minimise the error in the kinetic fitting to a certain extent It is then the role
of the AICC evaluation to determine whether these additional model terms are
producing a significant effect in order for their consideration in the correct
reaction model In this case the SSE value was unchanged among the top-
ranked competing models meaning that the deciding factor then became the
number of model terms An example kinetic plot showing the fit of the identified
model to the experimental data is shown in Figure 211 - this is the first
experiment where the starting concentrations were 1 M 24-dichloropyrimidine
and 22 M morpholine at 90 degC
102
Figure 211 The fit of the identified model and kinetic parameters to the generated
experimental data with starting concentrations of 1 M 24-dichloropyrimidine and 22 M
morpholine at 90 degC Where x = 24-dichloropyrimidine x = 4-substituted product x = 2-
substituted product x = bis-substituted product mdash = 24-dichloropyrimidine (ODE) mdash =
4-substituted product (ODE) mdash = 2-substituted product (ODE) mdash = bis-substituted
product Graph is only shown to 260 minutes to show curvature of the initial data points
24 Conclusion
It has been shown that a computational approach to kinetic modelling
loosely based on work by Tsu et al can be programmed in MATLAB This
approach takes chemical species information as well as experimental datasets
to identify both the correct reaction model and kinetic parameters for the
chemical process by utilising optimisation algorithms and statistical analysis
This approach has been proven to work successfully for three simulated case
studies of varying optimisation difficulty with different sets of experimental data
inputs with varying artificial errors The success shown from these studies
inspires confidence that the approach can be implemented with real
experimental data and be used as an effective tool in process development to
automatically identify the correct model and kinetic parameters of various
103
chemical systems The next step is to prove the efficiency of this approach
alongside real experimentation
Chapter 3 Experimental applications of the computational
approach to kinetic model and parameter determination
31 Introduction
With the development of the computational approach completed and
verified with multiple simulated case studies the viability of the approach on real
experimental data must also be tested This experimental application can utilise
data from any source to determine the most likely reaction model and kinetic
parameters but for reasons that shall be discussed further all experimentation
for this chapter was conducted using an automated continuous flow reactor
platform
There is a long history of conducting and analysing chemical and enzymatic
kinetics using flow techniques with the first reported case published around 100
years ago by Hartridge et al as a means to study very fast reactions[205] During
this time many different processes analytical methods and experimental setups
have been reported here citing only a few[206-209] A widely regarded essential
requirement for kinetic experiments however is for the reaction system to
operate in a turbulent flow regime[210] Turbulent flow leads to fast continuous
mixing and can be predicted by calculating the Reynolds number Re in eqn
31
Where
bull Re = Reynolds number
bull ν = average flow velocity
bull d = tube diameter
bull ρ = fluid density
bull η = fluid viscosity
119877119890 = 120584119889120588
120578 eqn 31
104
Using the unitless Reynolds number the flow regime can be predicted to be
turbulent[210] when Re exceeds 2000 or laminar[211] when Re is less than 2000
These regimes are illustrated in Figure 31a and 31b respectively Under laminar
flow conditions there is a parabolic velocity profile - meaning that the flow
velocity at the centre of the tube is double the average velocity due to friction on
the walls of the tubing known as dispersion This dispersion was originally
thought to blur the time axis leading to a substantial distortion of the observed
kinetics and hence meaningful kinetic experiments under these conditions might
be impossible[212]
Figure 31 A diagram to show the direction and flows within a flow regime where a) laminar
flow b) turbulent flow
Interestingly these assumptions remained untested until a number of
reported kinetics works from the Douglas group showed that accurate kinetic
experiments could be conducted under laminar flow conditions[213-215] The
Reynolds numbers for the experiments conducted ranged between 28 and 85
implying laminar flow However the kinetics monitored in these systems agreed
very well with results obtained conventionally by stopped-flow methods Further
work suggests that molecular diffusion has a very significant role and under
certain circumstances it can be a good approximation to neglect the effects of
laminar flow ie for particular flow velocities with given internal diameters[212 216]
With this approximation the kinetics can then be analysed as if the tubular flow
was homogeneous which can lead to accurate kinetic studies even in laminar
flow regimes
105
In many continuous flow settings for micro- or meso-flow volumes it is
typically simpler to adopt an idealised plug flow reactor model This model states
that each infinitely thin section of flow known as a plug travels in the axial
direction of the reactor and is perfectly mixed in the radial direction only where
a uniform distribution of the reactor concentrations occurs This means that the
residence time of the plug is a direct function of the length of the tubular reactor
and the velocity of the fluid This is shown in Figure 32 This model is commonly
employed to simplify tubular mixing and remains an accurate approximation for
kinetic measurements[37] All kinetic experiments by other authors covered in this
introduction employ this model and further experimentation as part of this project
also utilises this model - this is discussed further in Chapter 32
Figure 32 A plug flow reactor model where there is perfect mixing in the radial direction but
no forward or backward mixing in the axial direction Plugs 1 and 2 are examples of the
infinitely short plugs existing within this reactor model
Many of the advantages of continuous flow chemistry as previously
stated in Chapter 11 are also particularly attractive for running kinetic
experiments Increased heat and mass transfer[217 218] ensures that the reaction
is well controlled meaning that it can be asserted with confidence that the
experimental conditions applied to it are truly experienced by the reaction
medium Precise reagent control arises out of utilising flow chemistry as specific
flow rates allow accurate addition of chemicals at various points within the reactor
system[22 23 35] - this is very important when deducing the order of the species
106
within a system as reagent stoichiometry is present in exact quantities Coupling
of flow reactor platforms with quantitative analysis such as UV HPLC or GC
also unlocks automation capabilities[6 219] where multiple experiments can be
queued for the system to run autonomously The increased safety[220] the
efficiency of operating at reaction temperatures above the boiling point of the
solvent[221 222] and the ability to run and analyse extremely fast reactions[223 224]
means that flow experiments can be run that would otherwise be very difficult or
impossible to run in a batch system For these reasons it is more desirable in
particular circumstances to run kinetic experiments in flow rather than more
traditional batch kinetic experiments whereby sampling occurs throughout the
progression of a single reaction These advantages will be exploited throughout
these experimental acquisitions of data
The main disadvantage to kinetic modelling in flow systems however is
the necessity of the system to reach lsquosteady-statersquo Steady-state simply refers to
the state in which the reactor is in where the responses from the system are a
direct consequence of the conditions applied to it This is an important distinction
because as the reaction parameters are changed a certain amount of time is
then required for those reaction parameters to be applied to the system to
achieve a consistent output[225] This can be very wasteful as a system typically
needs approximately 15 - 3 reactor volumes of reagent in the acclimation to
steady-state prior to each measurement[226] This wastes a lot of precious
reaction material as well as time as the time taken to reach steady-state is in
direct relation to the residence time required ie a 15 minute residence time
results in up to a 45 minute wait for steady-state
Kinetic experiments in flow have been performed in this way for a long
time as the advantageous properties of continuous flow chemistry were worth
the wastage from the steady-state measurements However in recent years
deviations from these conventional techniques have become more popular that
take advantage of the transitionary period between two steady-state
measurements This is because during this period transient reaction information
is available but is otherwise lost because of traditional sampling methods
However if the pump flow rates are manipulated to structure this transient data
in a way that can be translated to regular time-series data an entire reaction
profile can be mapped very quickly and efficiently This then negates the need
107
for multiple steady-state measurements and rectifies this flow chemistry
disadvantage as kinetic profiles can be obtained with minimal material
The first transient flow method reported by Mozharov et al[96] is an
instantaneous step change in the flow rates where the reaction initially takes
place at a low flow rate F1 and then the flow rate is increased by an order or
magnitude to F2 This high flow rate then pushes out the transient data profile of
the reaction medium whilst the liquid is monitored by an in-line analysis
technique sensitive enough to detect a change in product concentration for
example Raman spectroscopy as reported by the authors Using this in-line
technique many measurements are taken in short time intervals to generate a
reaction profile from which kinetic information can be derived This is possible
as the magnitude of F2 the experimental times of the analytical measurements
(tn) and the dimensions of the flow path in the system are known therefore the
reaction profile along the microreactor capillary can be recreated and plotted
This concept is depicted in Figure 33 with the corresponding equation shown in
eqn 32 to convert the species concentration in experimental time to the species
concentration in residence time This conversion then maps the kinetic profile of
the chemical process between the calculated residence times
Figure 33 A depiction of how a kinetic experiment can be run utilising a step change in flow
rates between two steady-states (I and II) allowing time-series data to be plotted from
transient data Figure adapted from Mozharov et al[96]
120591 = 119905211986521198651minus 1199051198652 minus 11986511198651
eqn 32
108
Where
bull τ = residence time of the reaction medium
bull t = experimental time experienced by the reactor
bull t2 = experimental time taken to reach steady-state
bull F1 = initial flow rate
bull F2 = higher flow rate that the pumps are instantaneously changed to
This concept was also used experimentally as a means to test the
accuracy of the technique in relation to conventional steady-state
measurements The base catalysed Knoevenagel condensation between
benzaldehyde 31 and ethyl cyanoacetate 32 alongside the base 33 to form
the corresponding adduct 34 is shown in Scheme 31 The corresponding
kinetic profiles were generated by conventional sequential steady-state
measurements in Figure 34 and by the described step-change methodology in
Figure 35 where the reaction proceeded at a low flow rate before a sudden step
change to a higher flow rate It is shown that the two sets of time-series data are
very comparable however the step-change methodology has many
advantages This technique can determine a kinetic profile from only one
experiment with a much lower consumption of reagents and significantly
reduced experimental time
109
Scheme 31 The base catalysed Knoevenagel condensation between benzaldehyde and ethyl
cyanoacetate to form 34
Figure 34 A kinetic profile generated from the Knoevenagel condensation shown in Scheme
31 where kinetic information was obtained by measuring conversation at given
residence times at steady-state at two temperatures Steady-state markers x are
shown as part of the lsquoA Modelrsquo Reproduced with permission
110
Figure 35 A kinetic profile generated from the Knoevenagel condensation shown in Scheme
31 where kinetic information was obtained using a flow rate step-change at two
temperatures Steady-state markers x are shown as part of the lsquoA Modelrsquo where step-
change markers o are shown as part of the lsquoB Modelrsquo Reproduced with permission
The main critique of this technique as stated in the original publication is
that the step increase in flow rate is never perfect as the system always needs
time to speed up to the higher flow rate therefore the exact function F(τ) during
this transitional period is uncertain[96] This non-ideality is caused by several
experimental factors such as non-rigidity of the tubing walls and the syringe
preventing an immediate change in both the flow rates and the pressure profile
throughout the system[227]
Moore and Jensen[227] then reported a new concept that involves a
controlled ramp instead of a step change which leads to less uncertainty in the
determination of the residence times leading to greater accuracy in the time-
series data This therefore also leads to greater accuracy in the kinetic
parameters obtained from the experiment This report introduced the concept of
ldquopseudo-batchrdquo reactors referring to each fluid element passing through the flow
reactor in a time that is unique which can be thought of as many successive
pseudo-batch reactions This concept is shown in Figure 36
Figure 36 A depiction of how a continuous flow reactor may be described as a series of
sequential pseudo-batch reactors where the colour represents the extent of conversion
from low (green) to high (red) Q represents the total flow rate ti represents the initial
time of each pseudo-batch reactor entering the reactor tf represents the final time tm is
the time at which the concentration is actually measured by the IR probe Reproduced
with permission
This controlled ramp method results in a more predictable and accurate
residence time profile when compared to the step change method as the
residence time uncertainty decreases as well as a greater sampling rate with a
data density 10-fold higher than previously reported in Mozharov et alrsquos
technique This was shown experimentally in Scheme 32 in the Paal-Knorr
reaction of 25-hexanedione 35 and ethanolamine 36 generating 37 whilst
constantly monitored by an in-line IR probe This greater data density also
reduces the error within the kinetic profiles generated whilst still agreeing with
111
kinetic profiles generated purely from steady-state measurements as shown in
Figure 37 where these datasets are shown to be very precise and reproducible
Scheme 32 The Paal-Knorr reaction of 25-hexanedione 35 and ethanolamine 36 to yield
37 to show how the kinetics of a process can be observed by using a controlled ramp
technique
Figure 37 A combination of the kinetic models for the reaction yielding 37 in Scheme 32
where the differing colours represent different values of S where S is a corrective
residence time multiplier to show the reproducibility of the controlled flow ramp
methodology S = 14 (blue) S = 13 (red) S = 12 (green) S= 23 (orange) steady-state
experiments = x Reproduced with permission
Controlled ramps have now been reported many times because of the
experimental advantages that they possess[225 228] They feature all of the
advantages of conventional flow chemistry as reported earlier in this
introduction without the disadvantages that arise from typical steady-state
sampling This allows users to generate accurate data-rich kinetic information
from a process whilst using minimal material and time This methodology will
112
feature heavily in the data acquisition portions of this chapter as we opted to use
controlled ramps for all of our experimentation to exploit these advantages
More recently further efficiency has also been realised by the
combination of temperature gradients[229] with controlled flow ramps[146 230-232]
This allows for the fitting of kinetic parameters including activation energies to
a non-isothermal dataset obtained from one flow experiment This methodology
therefore results in even less material and time consumption as all kinetic
parameters can be determined from one flow experiment Although this relatively
new technique has only been reported for very simple systems it represents an
advancement in performing exceptionally efficient kinetic experiments using
continuous flow
32 Experimental setup
All flow experiments were conducted using a tubular reaction vessel built
in-house consisting of a 116rdquo OD (132rdquo ID) stainless steel tubing coiled around
a cylindrical aluminium heated block Reagents were pumped using JASCO
PU980 dual piston HPLC pumps and flow streams were mixed using Swagelok
SS-100-3 tee-pieces Sampling was conducted by using a VICI Valco EUDA-
CI4W5 sample loop with a 05 microL aliquot volume This results in small aliquots
of reaction mixture automatically transferring to the HPLC for on-line analysis
The reaction system was maintained under a fixed back pressure using an
Upchurch Scientific 1000 PSI back pressure regulator Quantitative analysis was
performed using an Agilent 1100 series HPLC instrument fitted with a Sigma
Ascentis Express C18 reverse phase column (5cm x 46mm 27 microm) In all
experiments biphenyl was added to one reservoir as an internal standard This
experimental setup is shown in Figure 38
113
Figure 38 A photograph of the automated continuous flow reactor used for this work
Previous work using this experimental setup has shown that transient flow
experiments show an error of less than 4 in the observed rate constants due
to dispersion whilst steady-state experiments show an absolute error of 05
and a relative error of 024 [233 234] Therefore when considering the kinetic
simulations in these studies a plug flow model was adopted If we consider the
general axial dispersion plug flow reactor model[235] in eqn 33
Erstwhile studies by Hone[225] on our reactor platform and similar investigations
by Jensen[230 236 237] using a comparable system have found that dispersion only
introduces a small deviation from plug flow Given this eqn 33 can be simplified
to ignore the second order term to give eqn 34 - 36 This plug flow reactor
design equation can be utilised to model each species in the reaction with
respect to residence time
Where
bull DR = axial dispersion coefficient
11986311987711988921198621198941198891199112
minus 119906119889119862119894119889119911+ 119903119894 = 0 eqn 33
119906119889119862119894119889119911= 119903119894 eqn 34
120591 =119911
119906 eqn 35
119889119862119894119889120591= 119903119894 eqn 36
114
bull Ci = molar concentration of species i
bull z = the length along the reactor
bull u = superficial velocity
bull ri = rate of reaction of species i
For each chemical process concentration-time data is collected by using
linear flow ramp gradients with on-line HPLC analysis Steady-state is initially
achieved within the system then sampling begins during the controlled ramping
to the next steady-state condition capturing the transitory information This is
shown in Figure 39 At least two flow ramp experiments at different temperatures
are conducted with HPLC sampling every 2 - 4 minutes depending on the length
of the HPLC method The residence time is then calculated for each sampling
point using eqn 37 to translate this transient data to a time-series dataset
Figure 39 A mathematically correct representation of how linear gradient flow ramps can be
utilised to sample with a high data density on the initial curvature of the kinetic plot
Where diams = data point Tn = experiment temperature Q = total flow rate Time = time the
reaction has been running τ = residence time that the reaction mixture experiences
Where
bull τ = residence time
bull α = deceleration of flow rate
120591 = 119886 ∙ 119905 minus 1205830 +radic(1205830 minus 119886 ∙ 119905)2 + 2 ∙ 119871 ∙ 119886
119886 eqn 37
115
bull μ0 = initial flow rate
bull t = experiment time
bull L = reactor volume
33 Case study Phenyl acetate
The first reaction system explored using the computational approach was
the presupposed model of the reaction of phenol 38 with acetyl chloride 39
to form phenyl acetate 310 and hydrochloric acid 311 shown in Scheme 33
This first experimental verification of the approach was a final validation of the
approach by selecting a simple example with few chemical species The goal of
this study was to confirm the presupposed model shown in Scheme 33 as well
as identify the kinetic parameters for this process The validity of the controlled
ramp method would also be determined based on comparisons of the
experimental data with steady-state measurements Full experimental details
including the preparation of the feed solutions experimental setup flow ramping
rates HPLC analysis and raw data can be found in Chapter 731
Scheme 33 The reaction of phenol 38 with acetyl chloride 39 to form phenyl acetate 310
and hydrochloric acid 311
The kinetic data was obtained using the controlled ramp methodology at
two temperatures 65 degC and 75 degC and the four participating species were
inputted into the computational approach Based on these four species only two
reactions were calculated to be possible based on mass balance - these are
shown as the forward reaction eqn 38 and the backward reaction eqn 39
which are two of the three possible models that were generated The third model
shown as eqn 310 is the combination of these two allowed reactions resulting
in an equilibrium reaction model
Forward 38 + 39 rarr 310 + 311 eqn 38
116
Backward 310 + 311 rarr 38 + 39 eqn 39
Equilibrium 38 + 39 310 + 311 eqn 310
These three models were then each evaluated automatically by the
approach based on how well the simulated ODE curves converge to the time-
series data obtained from the controlled ramps The k values SSE error metric
and the AICC evaluation for each of the models is shown in Table 31 This data
represents a similar scenario to the simulated benzoic acid esterification case
study shown in Chapter 231 where the identified most likely model has a similar
error to another model but with more model terms The forward reaction model
fits both temperature datasets very well whilst the backward reaction model
does not fit to the experimental data at all as there is no direction in the
parameter space from the initial guess that the optimisation algorithm can travel
to make a favourable change in the convergence to the data The equilibrium
model fits the data equally as well as the forward model as it sets the backward
rate constant to be negligible leading to a low SSE However as this second
term adds no value in further lowering the SSE it is an unfavourable addition in
terms of the AICC evaluation which prefers more simplistic models and is
therefore considered a less appropriate model than the forward reaction term
alone
Table 31 Evaluation of the feasibility of each reaction model for the phenyl acetate study
By only inputting the species involved in the reaction then running two
controlled flow ramps with the automated computational approach described the
intuitive reaction model was confirmed and the kinetic parameters were
determined as k75 degC = 1045 x 10-3 plusmn 042 x 10-3 M-1 s-1 Ea = 693 plusmn 78 kJ mol-1
This combination of the correct reaction model and kinetic parameters allowed a
Reaction Model
k Values x 10-3 M-1 s-1
SSE M AICC Evaluation
65 degC 75 degC
Forward 515 1045 0019 136
Backward - - 0532 803
Forward +
Backward
515
0
1045
0 0019 1636
117
fit to the experimental data with an average residual of less than 3 x 10⁻³ M and
is shown in Figure 310 where the colours of the data and fitted ODEs mimic the
colours shown in Scheme 33 This study has shown that the transition from
simulated to real experimental data does not affect the accuracy of the approach
and that the approach can be applied to experimental data with confidence that
the correct reaction model is to be identified
Figure 310 Kinetic profiles for two flow ramp experiments at 65 degC and 75 degC where x =
phenol x = phenyl acetate mdash = phenol (ODE) mdash = phenyl acetate (ODE)
The equivalent temperature and residence time kinetic profiles were also
mapped by performing a series of conventional steady-state experiments to
ensure that a transient-flow regime remained accurate in model and parameter
determination Results showed excellent agreement in plotted curvature and
confirmed the same reaction model to be the most likely whilst identifying very
comparable kinetic constants Figure 311 shows a comparison of the two
sampling methodologies for this particular reaction See Chapter 7315 for
further details
118
Figure 311 Graphs showing the agreement between steady-state and flow ramp
measurements for the reaction of phenol with acetyl chloride where curves are fitted to
the steady-state data Where = phenol (steady-state) x = phenol (flow ramp) =
phenyl acetate (steady-state) x = phenyl acetate (flow ramp)
34 Case study Paracetamol
The next reaction system that was explored was the chemical system
producing paracetamol whereby 4-aminophenol 312 reacts with acetic
anhydride 313 to form paracetamol 314 and the over-reacted diacetamate
impurity 315 shown in Scheme 34 as the intuitive sequential reaction This
reaction system serves as the first real experimental multistep reaction that is
studied by this approach in order to determine the correct reaction model and
kinetic parameters However as there is a large disparity between the reaction
kinetics of step one and two quantitative kinetic analysis of both processes
simultaneously ie during a single ramp was not possible Therefore two sets
of differing temperature ramps were performed to investigate independently the
formation of paracetamol and diacetamate at 3060 degC and 160180 degC
respectively Each of these ramps differ in reactor size and hence residence
times as well as starting concentrations of acetic anhydride This was performed
to illustrate the capability of the approach to handle data from a variety of sources
whilst still accurately determining the kinetic properties of a process
Scheme 34 The reaction of 4-aminophenol with acetic anhydride to form paracetamol in step
one followed by a further reaction with acetic anhydride to form diacetamate in step two
Based on the five species identified including the acetic acid 316
formed with each reaction of acetic anhydride there were six reactions that were
calculated to be possible based on mass balance These reactions are shown
as eqn 311 - 316
312 + 313 rarr 314 + 316 eqn 311
119
314 + 316 rarr 312 + 313 eqn 312
314 + 313 rarr 315 + 316 eqn 313
315 + 316 rarr 314 + 313 eqn 314
312 + 315 rarr 314 + 314 eqn 315
314 + 314 rarr 312 + 315 eqn 316
Interestingly some of the mass-balance-allowed reactions identified by
the ILP optimisation seem very unlikely to happen based on chemical intuition
The reaction of 4-aminophenol with diacetamate shown in eqn 315 for
example suggests that it is possible for this starting material to react with the
over-reacted product to form two equivalents of the desired product We know
from intuition that the ester bond is too strong to break and react without a
chemical stimulus so we may have initial speculations on the feasibility of this
reaction However it can never be stated with certainty that this reaction cannot
happen until its feasibility is studied and therefore all possible models are still
generated to be evaluated This is a major advantage of this approach that
reactions and models that may otherwise be discarded due to chemical bias are
automatically evaluated without a chemistrsquos input This could lead to unexpected
(but statistically and chemically accurate) models that describe time-series data
which can lead to better process efficiency and even discover new reactions
63 potential models were identified from the five reactions and the
reaction model shown in Scheme 34 was determined to be the most likely
representation of the system by AICC The approach also determined the kinetic
parameters of step one k60 degC = 645 plusmn 026 M-1 s-1 Ea = 32 plusmn 12 kJ mol-1 and
step two k180 degC = 427 x 10-2 plusmn 017 x 10-2 M-1 s-1 Ea = 979 plusmn 65 kJ mol-1 by
fitting k values to each dataset in the kinetic fitting stage of the approach These
values us to assert that step one will likely be very fast at a wide range of
temperature ranges and that step two has a higher sensitivity to changes in
temperature when the energy of the system increases This identified model
alongside the identified kinetic parameters fits to the experimental data very
accurately with an average residual of less than 1 x 10⁻⁴ M and is shown in
Figure 312 The top 5 ranked models are shown in Table 32 with their
respective SSE error metric and AICC evaluation
120
Figure 312 Kinetic profiles for four flow ramp experiments at 30 degC 60 degC 160 degC and 180
degC where x = 4-aminophenol x = paracetamol x = diacetamate mdash = 4-aminophenol
(ODE) mdash = paracetamol (ODE) mdash = diacetamate (ODE) See Chapter 732 for full
experimental conditions and raw data
Table 32 Evaluation of the feasibility of each reaction model for the paracetamol study
Rank Reaction Model
k values s-1 or M-1 s-1 SSE
x103 M
AICC
Evaluation 30 degC 60 degC 160 degC 180 degC
1 312 + 313 rarr 314 + 316
314 + 313 rarr 315 + 316
59082
-
64471
-
-
00129
-
00427 0295 1292
2
314 + 316 rarr 312 + 313
312 + 313 rarr 314 + 316
314 + 313 rarr 315 + 316
01599
59509
-
09120
67519
-
-
-
00125
-
-
00427
0293 3690
3
312 + 313 rarr 314 + 316
312 + 315 rarr 314 + 314
314 + 313 rarr 315 + 316
59067
38065
-
64348
35719
-
-
-
00129
-
-
00428
0295 3692
4
315 + 316 rarr 314 + 313
312 + 313 rarr 314 + 316
314 + 313 rarr 315 + 316
23783
59188
-
27076
64641
-
00210
-
00130
00022
-
00430
0295 3692
121
5
314 + 314 rarr 312 + 315
312 + 313 rarr 314 + 316
314 + 313 rarr 315 + 316
00799
59258
-
02270
64833
-
-
-
00127
-
-
00425
0295 3692
Interestingly there are many reaction models that were found to have a
lower SSE error metric than the identified most likely model This is again where
the AICC ranking metric is used to great effect to balance the convergence to
experimental data as well as the simplicity of the model It is in these cases that
models that contain transformations discussed previously as very unlikely such
as in the rank 3 model that the terms are likely being used by the optimisation
algorithm to fit experimental noise For this reason this approach cannot be
completely autonomous and must require evaluation by a chemist when
observing the top rated models to be certain that the quality of the data assures
correct model determination - this was discussed in Chapter 225
This paracetamol study has shown that the approach can correctly identify
the reaction model and kinetic parameters for a multistep reaction using real
experimental data from different temperature flow ramps by inputted only the
observed species and time-series data As a side note - interestingly contrary to
common undergraduate laboratory experiment scripts[238] the over-reacted
diacetamate will not form in any measurable quantities in a conventional
undergraduate experiment Assuming that the reaction is similar in water to
acetonitrile the reaction doesnrsquot need refluxing and will go to full conversion of
paracetamol within seconds at room temperature Furthermore using the kinetic
parameters in this study and the recommended reflux temperature of common
laboratory manuals 100 degC and a typical 02 M reaction mixture of paracetamol
and acetic anhydride it would take approximately 12 years for the reaction to
achieve complete conversion to diacetamate
35 Case study Metoprolol
The final experimental case study that was explored was the chemical
system producing metoprolol whereby the epoxide starting material 317 reacts
with isopropylamine 318 to form metoprolol 319 which can further react to
form the bis-substituted impurity 320 shown in Scheme 35 Metoprolol is a
122
cardioselective beta-blocker commonly used for the treatment of hypertension
for which kinetic information would help in the process development stage of
manufacture at AstraZeneca This reaction system serves as the first real
experimental multistep reaction that is studied by this approach where parallel
reactions occur in tandem leading to a more difficult system for which to optimise
kinetic parameters and identify the correct reaction model
Scheme 35 The reaction of the epoxide starting material with isopropylamine to form
metoprolol as well as the overreaction to form the bis-substituted product
Two sets of two-temperature flow ramps were run on parallelised flow
reactor platforms one set in our lab in Leeds (190210 degC) and one set at
AstraZenecarsquos lab in Macclesfield (130150 degC) The two reactor platforms differ
in equipment specification and reactor volume and the two experimental sets
differ in temperatures and starting concentrations This parallelisation of
experiments on different systems was performed to further confirm the
reproducibility of this flow ramp methodology as corroborating data can be
achieved by an operator on separate reactor systems in different locations The
experimental results were then combined and the computational approach was
applied Full details of experimentation can be found in Chapter 7331
Based on the four species identified there were six reactions that were
calculated to be possible based on mass balance These reactions are shown
as eqn 317 - 322
317 + 318 rarr 319 eqn 317
319 rarr 317 + 318 eqn 318
319 + 317 rarr 320 eqn 319
320 rarr 319 + 317 eqn 320
123
319 + 319 rarr 318 + 320 eqn 321
318 + 320 rarr 319 + 319 eqn 322
63 reaction models were generated which correspond to every possible
combination of these allowed reactions and each of them were evaluated
sequentially by the approach The reaction model shown in Scheme 35 was
identified as the most likely representation of the system by AICC and the kinetic
parameters for the formation of metoprolol were found to be k170 degC = 0286 plusmn
0012 M-1 min-1 Ea = 724 plusmn 29 kJ mol-1 and for the formation of the bis-
substituted product k170 degC = 0019 plusmn 0001 M-1 min-1 Ea = 750 plusmn 30 kJ mol-1
This identified model alongside the kinetic parameters fit to the experimental data
very accurately with an average residual of less than 2 x 10⁻³ M and is shown
in Figure 313 The top 5 ranked models are shown in Table 33 with their
respective SSE error metric and AICC evaluation
Figure 313 Kinetic profiles for the flow ramp experiments at 130 degC 150 degC 190 degC and 210
degC where x = starting material x = Metoprolol x = bis-substituted product mdash = starting
material (ODE) mdash = Metoprolol (ODE) mdash = bis-substituted product (ODE) See Chapter
733 for full experimental conditions and raw data
124
Table 33 Evaluation of the feasibility of each reaction model for the metoprolol study
Rank Reaction Model
Kinetic parameters SSE
x10 M
AICC
Evaluation k170 degC min-1 or
M-1 min-1 Ea kJ mol-1
1 317 + 318 rarr 319
319 + 317 rarr 320
02857
00191
7242
7500
01212 -31145
2 317 + 318 rarr 319
319 rarr 318 + 320
03065
00260
7569
6552
01252 -30961
3
317 + 318 rarr 319
319 rarr 317 + 318
317 + 319 rarr 320
03008
00043
00188
7463
5379
7557
01188 -30768
4
317 + 318 rarr 319
319 + 317 rarr 320
320 rarr 319 + 317
02858
00202
00158
7245
8216
4920
01209 -30669
5
317 + 318 rarr 319
319 + 317 rarr 320
318 + 320 rarr 319 + 319
02857
00191
00003
7242
7508
4898
01212 -30653
The reference k values and activation energies were fitted directly in the
kinetic fitting stage of the approach and the experimental dataset was adjusted
to incorporate an artificial-zero time point which is a common practice when
fitting kinetics in order to assert an experimental lsquostart timersquo when concentrations
are known This can fix any fitting discrepancies that may occur as the first
measured time point may not be accurate - it is assumed however that all time
points following this first measurement are correct with respect to the first
measurement This is assumed only for the fitting of the kinetic parameters as
the parameters are likely to be more accurate In the case of this experiment
small deviations in asserting the time of the initial measurement may occur from
thermal expansion of the solvent because of the very high temperatures or from
pump flow rate errors
It has been shown in this study that it is possible to deconvolute reaction
pathways that are happening simultaneously using this computational approach
Differing-temperature experimental datasets were collected from different
125
experimental systems and collated to show that the correct model could be
identified even with data from different sources Kinetic parameters are also
identified from this approach that gives an excellent fit to the experimental data
This kinetic information can then be used to optimise this process between
given limits for temperature chemical equivalents and reaction time Using
current pricing for the starting material used in this work[239] other standard
industrial optimisation techniques would have been significantly more expensive
to implement When comparing this kinetic approach to other optimisation
methods steady-state kinetic measurements would have cost 24 more in
terms of material consumption and a screening and full factorial design of
experiments (DoE) optimisation would have cost 106 more - see Chapter
7336 for more details Then of course factoring in the cost of the time of the
chemist running the experiments (which hereby would be automated) and the
time for interpretation of the data and kinetics (which the approach elucidates)
this results in a significant reduction in labour time and overall cost which also
results in a more comprehensive overview of the possible kinetic models at play
36 Conclusion
It has been shown in this work that when real experimental time-series data
for a chemical process is available total process understanding can be achieved
without the need for high-level chemical intuition or human interference When
participating species are known or inferred complete sets of kinetic information
can be obtained via construction of all possible reaction models and identification
of their respective kinetic parameters This was undertaken by coupling an
automated flow reactor platform with a computational approach to deduce and
evaluate each kinetic model utilising optimisation algorithms After post-reaction
statistical analysis indicates which models are the most likely to be true based
on the experimental data provided which can be from batch or flow this
information can then be interpreted by a trained chemist to further differentiate
reaction pathways based on what should and should not be chemically possible
This approach has been proven to be powerful in determining the reaction
model and kinetic parameters in a variety of experimental circumstances The
approach will be particularly powerful in situations where the reaction model is
126
not completely understood for example when there are competing reaction
pathways The approach can be computationally expensive depending on the
number of possible reaction models although all of the optimisations carried out
by the approach on the work described was evaluated in less than 5 minutes on
a standard 4-core Intel i5-2310 processor However the added computational
cost is minimal compared to the reduction of time and experimental cost with
regards to kinetic evaluation Furthermore this approach can be run
automatically as bench scientists use their human resource for more challenging
tasks that cannot be automated
This work is the first implementation of the approach on experimental
time-series data and has been proven to efficiently interpret kinetic information
using minimal amounts of material to generate sufficient experimental data to
enable accurate model determination Using this methodology can considerably
outweigh the cost of further experimentation to discriminate speculated kinetic
models and can greatly reduce the time and cost barriers to full process
understanding
Chapter 4 The development of an improved computational
approach to kinetic model determination
41 Introduction
The aforementioned computational approach to kinetic model and
parameter determination as described in Chapter 2 and Chapter 3 is a powerful
tool for many experimental applications However there are two major limitations
to this tool The first limitation is in the reaction orders of the particular species
that are available - these orders are constrained to two integer orders 1 and 2
There are instances however where reactions can feature zero order reactions
or even have non-integer orders for which this approach currently cannot
facilitate and identify The second limitation is the inability of the approach to
model catalytic reactions and hence determine the reaction order of species
within a catalytic reaction As catalytic reactions are common in research
manufacturing and process development there are many applications where this
approach could ideally be utilised but is not currently applicable
127
Further development of the computational approach to rectify these
limitations can therefore increase its applicability greatly which further increases
the scope of the tool for chemical applications As the comprehensive model
evaluation aspect of this methodology has been proven to be effective for
determining correct reaction models the skeleton of the approach remains
unchanged This includes the two major steps of the approach model generation
and kinetic parameter fitting as well as the statistical measurements involved ie
AICC However although the basis for the approach remains the same many
structural changes of the programmed tool are necessary for the incorporation
of these new applications non-integer order models and catalytic models The
advancement of the approach to incorporate these changes makes it applicable
in almost all chemical processes which is the final step in answering the overall
research aim of the project to build an automated methodology to kinetic model
discrimination and parameter determination
42 Methodology advancement
421 Capabilities
When mass-balance-allowed reactions are identified by the approach
these reactions can then be compiled into a number of models that feature them
as discussed in Chapter 22 However there is a difference between an allowed
reaction based on the mass balance of the reactants and products and the rate
laws that govern the way that these species react All models are currently
compiled in a way that assumes a first order dependence on all species that are
featured Therefore for the mass-balance-allowed transformation of A to B as
shown in eqn 41 the rate law for the change in B is shown in eqn 42
A fundamental change to this methodology explores the same
transformation but using different reactivities by also investigating different
orders of the reacting species To explore different reaction orders including
non-integer reaction orders the rate law of the elementary reaction can be
described with differing powers of α shown in eqn 43 where α = 0 05 or 1
119860119896rarr119861 eqn 41
119889[119861]
119889119905= 119896[119860] eqn 42
128
This allows multiple chemical pathways to be explored that describe the
chemistry in different ways which were not available previously using this
methodology Each of the newly identified reactions are then treated as
lsquoavailablersquo reactions from which reaction models can be constructed in the same
way as described in Chapter 22 Therefore for each mass-balance-allowed
reaction identified by the approach that is lsquounimolecularrsquo there are 3
corresponding reaction orders possible and therefore 3 reactions that are added
to the pool of available reactions for kinetic model generation In the context of
this approach the transformation of a single mass-balance-allowed reaction to
every variant of its corresponding rate law is termed lsquoinflationrsquo
For lsquobimolecularrsquo reactions identified by the approach as mass-balancing
similar chemical descriptions can be written as with the lsquounimolecularrsquo reactions
For the reaction of A and B to form C there are multiple potential combinations
of the species orders α and β in the potential rate laws shown in eqn 44 and
45
These values of α and β can take the form of 0 05 1 as before However it is
extremely rare for two chemical species to react with a zero order dependence
on both species Therefore in an effort to lower the number of lsquoavailablersquo
reactions and hence lower the number of kinetic model evaluations necessary
these particular reactions are seen as unfeasible and are therefore not included
in the model generation stage This is also true of a zero order05 order
bimolecular reaction Therefore for every lsquobimolecularrsquo mass-balance-allowed
transformation identified by the approach there are 5 corresponding reactions
that are added to the pool of available reactions for kinetic model generation
This approach has also been modified to include catalytic reactions in the
model generation if the user selects the option to do so The user can select to
either include catalytic reactions or exclusively look at catalytic reactions (ie no
reactions can occur without a catalyst) As before all mass-balance-allowed
119889[119861]
119889119905= 119896[119860]120572 eqn 43
119860 + 119861119896rarr 119862 eqn 44
119889[119862]
119889119905= 119896[119860]120572[119861]120573 120572 + 120573 ge 1 120572 = 120573 ne 05 120572 120573 isin 0 05 1 eqn 45
129
transformations are identified then for the reaction of A and B to form C all
combinations of integer and non-integer catalytic reactions are generated within
the inflation step At this point the species that is user-selected to behave
catalytically is then incorporated into the rate laws For each mass-balance-
allowed (inflated) transformation the catalytic species can take the order of 05
1 or 2 and each of these rate law variations are constructed and added to the
pool of available reactions for kinetic model generation Note also that in these
catalytic reactions the dependence of the orders become empirical to a greater
extent whereby individual species are used and regenerated as opposed to
referring specifically to molecularity (ie number of species reacting together at
once) When catalytic reactions are included in model generation with the
selected catalytic species lsquoCatrsquo eqn 44 becomes eqn 46 and the general rate
law shown in eqn 45 becomes eqn 47 where γ = order of catalyst
All combinations of catalytic and non-catalytic reactions are generated For each
mass-balance-allowed lsquobimolecularrsquo reaction where catalytic variants are also
generated there are 15 possible corresponding reactions that are added to the
pool of available reactions for kinetic model generation This inflation step is
summarised qualitatively in Figure 41 showing how individual mass-balance-
allowed reactions can generate multiple transformations that are dependent on
different rate laws
119860 + 119861 + 119862119886119905119896rarr 119862 + 119862119886119905 eqn 46
119889[119862]
119889119905= 119896[119860]120572[119861]120573[119862119886119905]120574 120572 + 120573 ge 1 120572 = 120573 ne 05 120572 120573
isin 0 05 1 120574 isin 0512
eqn 47
130
Figure 41 An illustration of how the lsquoinflationrsquo step takes all mass-balance-allowed
transformations sequentially then deduces all allowed integer and non-integer orders
and generates corresponding rate laws for these transformations If catalytic reactions
are to be explored also rate laws for these catalytic dependencies are also generated
These transformations are all then saved from which full reaction models can be
constructed
These new capabilities incorporated into the overall computational
approach allow kinetic model determination for more complex chemical systems
for catalyticnon-catalytic processes with integer or non-integer orders This
approach can then be used as before whereby the chemical species and
experimental datasets are uploaded and the program runs an extensive kinetic
model evaluation loop followed by statistical analysis to determine the most
likely model However the major disadvantage to evaluating all possible models
generated after the newly incorporated inflation step is the huge computational
cost As the pool of available reactions is expanded greatly from simple mass-
balance-allowed reactions to all rate laws possibly governing these reactions
the number of possible models to be generated from these reactions grows
131
exponentially It is therefore not feasible with current technology to evaluate
every possible model However many of these possible models are also
unfeasible due to their inability to occur anyway Upon generation of a reaction
model the fitness of the model can be determined by employing simple and
appropriate logical and chemical constraints or rules These rules ensure that
generated models with an infeasibility to occur are identified and discarded
without the need for further evaluation and consumption of computational
resources
422 Rules
In order to evaluate only the models that are feasible a priori logical and
chemical rules must be applied to the available models to discard large numbers
of them as many models may feature redundant or impossible model terms
within them To postulate such rules requires logical yet simplistic
rationalisations of how reactions occur - rationalisations that seem obvious upon
realisation but are seldom taught or reported in the literature
To show the importance of these rules when running this approach
Scheme 41 shows a model reaction of maleic acid 41 reacting with methanol
42 to form the mono-product 43 and the di-product 44 which can be used
to show the number of models to be evaluated[240] In this reaction the maleic
acid is self-catalytic so this species behaves as both a starting material and a
catalyst Using these 5 species there are 6 possible mass-balance-allowed
reactions From these 6 reactions after inflation steps to look at all integer and
non-integer species dependencies and all catalytic and non-catalytic reactions
the total number of models to evaluate is gt1854900872 A specific number
cannot be quoted as just compiling this number of reaction models takes over
110 GB of memory and so an accurate estimate cannot be achieved with the
equipment available The evaluation of this number of models would likely take
several years to complete even when using high-performance computing
clusters It is therefore imperative that these rules drastically reduce the number
of models to evaluate to enable this methodology as a practical process
development application
132
Scheme 41 The self-catalysed reaction of maleic acid 41 and methanol 42 to form the
mono-product 43 and the di-product 44[240]
Rule 1 One variant of each reaction
There are many variations of the same elementary transformations to be
considered when building models for evaluation Examples of these variations
could be
bull A + B rarr C
bull A + B0 rarr C
bull A05 + B rarr C
bull etc
It is very unlikely however that the same reactants will undergo the same
chemical transformation to products with many different rate laws It would not
be expected that an elementary step would proceed in numerous ways in both
an overall second order and an overall first order manner to result in the same
product for example Therefore when compiling reaction models for evaluation
only one variant of each elementary reaction can be present in a single model
This also reduces the maximum number of model terms in a single model to the
total number of elementary reactions which in this example is 6 When this rule
is enforced during model generation for the model chemical system the total
number of models for evaluation is 8156735
Rule 2 Iterative model evaluations
Although it cannot be known what the lsquoaveragersquo number of model terms
in a lsquogeneralrsquo model is the assumption can be made that the user is investigating
a single synthetic step in a chemical process With a single synthetic step there
may be consecutive reactions and impurities formed but it would undoubtedly
be regarded as unlikely if any model was proposed with 30 model terms for
example In accepting this postulation it must therefore also be true that there is
a continuum of likelihood whereby a model will contain a certain number of model
133
terms especially when evaluated by AICC Therefore there must also exist a
limit of model terms that once reached it can be regarded that the corresponding
model is too unlikely to occur to be treated as a serious model candidate Without
a vast literature study it is not possible to know what this number should be and
this prospective study extends past the scope of this project - this discussion is
highlighted to simply introduce the concept of the existence of this upper limit of
model terms
Although this upper limit is unknown it is possible to start at a prospective
number of model terms then the user can decide if this number should be
increased based on the responses observed From chemical intuition based on
the findings of AICC values thus far in the project much of the data can be fitted
effectively with le 4 model terms and adding further model terms in general leads
to diminishing model evaluations This is of course a biased generalisation
based on the chemical systems that have been studied within the project
However using an initial upper limit of 4 model terms in the model generation
stage may be generally appropriate for single-step chemical systems - if this limit
does not give a satisfactory model that fits the supplied experimental data it can
be iteratively increased to 5 model terms then 6 etc As there are many models
that would require computationally expensive evaluations with over 4 model
terms this rule allows the user to determine if further evaluations with larger
models are necessary which could otherwise potentially waste computational
resources and more importantly time When this rule is enforced during model
generation in the model chemical system as well as the previous Rule 1 the
total number of models for evaluation is 668735
Rule 3 Catalytic reactions considered only
In order to reduce the number of available reactions from which to build
models and hence reduce the number of unnecessary model evaluations it is
assumed from the userrsquos input of a catalytic species that all mass-balance-
allowed reactions present will proceed only with a catalyst This is assumed due
to the available lower energy pathways in the presence of the catalyst This can
then be changed by user input if a suitable model is not found where the model
generation is re-run to incorporate reactions that both do and do not proceed
using the specified catalyst When this rule is enforced during model generation
134
as well as each previous rule the total number of models for evaluation in the
model chemical system is 173711
Rule 4 There must be at least one reaction from starting materials to products
As the starting concentrations are initially inputted into the system it can
be deduced which of the species are lsquostarting materialsrsquo In some instances there
may be species that are considered by the user to be the products of the reaction
at the first time point but in the context of this rule are also considered to be a
starting material For clarity this definition of lsquostarting materialrsquo refers only to
species that have mass in the initial concentrations The rule states that there
must be at least one term in the model that describes a decrease in the
concentration of one of the identified starting materials This logic-based rule
ensures with certainty that the models that are evaluated feature terms that
exhibit a change in concentrations Although seemingly obvious this rule is
necessary to remove these commonly occurring models that would only lead to
wasted computational resources
For example if there are four species in a chemical system (A B C D)
and their initial concentrations are 1 M 0 M 0 M and 0 M respectively the only
starting material identified is A Many models that are feasible according to mass
balance may not be feasible according to this rule as they may not exhibit a
change in concentration Table 41 shows some examples of allowed models
based on these starting concentrations that will progress onto the kinetic fitting
stage of the approach as well as disallowed models that will be discarded As
shown entries 3 and 4 will both feature a change in concentrations whereas
entries 1 and 2 will not and are hence discarded When this rule is enforced as
well as each previous rule the total number of models for evaluation in the model
chemical system is 121836
Table 41 A table showing examples of allowed and disallowed models according to Rule 4
Entry 1 2 3 4
Model B rarr C
B + B rarr D
B + B rarr D
D rarr A
A rarr D
B rarr C
A rarr B + B
B rarr C
Allowed
135
Rule 5 New lsquostarting materialsrsquo available from products
As an extension of Rule 4 relating to identifying lsquostarting materialsrsquo from
initial concentrations further starting materials can also be identified from the
products of these earlier reactions For example in entry 4 in Table 41 B is not
initially identified as a starting material However as A is a starting material
forming B as a product there is certain to be some concentration of B as time
progresses meaning that B can also be viewed as a starting material at some
point Therefore as starting materials in entry 4 are A and B both reactions in
this model are allowed because they both feature a change in concentration from
a starting material to another species
Under Rule 5 models that feature model terms incurring a decrease in
concentration from these newly identified starting materials only can be allowed
Therefore entry 4 will be a model that is progressed onto the model evaluation
stage However in entry 3 in Table 41 it can be noted that the initially identified
starting material (A) forms D as a product meaning that the starting materials in
this model are A and D The second model term features a reaction of B to form
C but this logic-based rule highlights that there is no possible scenario where B
will be formed in order to further react If this model were to progress onto model
evaluation it would certainly be an over-trained model and would rank lowly
according to an AICC evaluation as the second model term will not provide a
benefit to the model over just having the first model term alone Therefore under
Rule 5 entry 3 would be disallowed and not progress onto the model evaluation
stage thereby saving computational resources on this redundant model When
all rules are enforced including Rule 5 the total number of evaluations for the
model system is 98725
Final considerations for model generation
Other considerations were also made when compiling models in the
model generation stage specifically referring to the allowed orders of particular
species For catalytic species the allowed orders were determined to be 05 1
and 2 This is because the order in a catalytic species of a system being greater
than gt2 or =15 are too rare to warrant serious consideration and would incur a
significantly greater computational expense to evaluate all of the generated
models
136
Much thought was exercised as to whether a zero-order dependence on
a catalyst is possible as this discussion is missing from the literature and general
teaching It can be postulated that since the presence of a catalyst allows a more
favourable lower energy pathway there must therefore be some dependence on
the concentration of the catalyst for this lower energy pathway to progress This
rationalisation infers that it is not possible for a zero-order dependence of
catalyst but there may always be selected cases where this can be empirically
true In any case if a zero-order dependence of catalyst is possible it is too
unlikely to warrant serious consideration as this would generate many more
models to be evaluated
For non-catalytic systems this approach attempts to build reaction
models from base-level elementary reactions (where the both the stoichiometry
and order of participating species are 1 for each occurrence of the species in
the reaction scheme) However there are two notable exceptions 0 and 05
orders which are inherently more empirical in nature A zero-order dependence
on a particular species in this approach will still have a stoichiometry of 1
whereby one molecule of this species is consumed in the reaction but the
reaction rate does not depend upon its concentration A 05 order dependence
will have both a stoichiometry of 05 and an order of 05 There are many other
integer and non-integer empirical dependencies of varying stoichiometry and
order that are possible in complex chemical reaction networks (CRNs) However
these dependencies are very rare and not common enough to warrant serious
consideration for this computational approach as this would generate many more
models to proceed into model evaluation resulting in a much higher
computational expense Therefore reactions are only considered for model
generation with species that have orders in the rate laws of 0 05 or 1
423 Overview
This updated computational approach to kinetic model selection and
parameter identification was developed in MATLAB by adjusting the previously
developed tool reported in Chapter 2 and Chapter 3 Firstly the user inputs
experimental data and the participating species into the system The approach
identifies all possible reactions that can happen based on mass balance then
generates all conceivable rate laws subject to basic chemical intuition in the
inflation step (and subject to the user defining a catalytic species) Every
137
combination of these rate laws are then compiled into different reaction models
followed by logical rule enforcements to remove vast numbers of redundant or
wasteful models All remaining models are sequentially loaded then kinetic
parameters are optimised to increase convergence of ordinary differential
equation (ODE) curves to the experimental data Finally each model is then
statistically evaluated and ranked highlighting the most likely model based on
the experimental data supplied The approach overview is highlighted in Figure
42
Figure 42 An overview of the updated computational approach to kinetic model and
parameter determination
This updated methodology represents a significantly improved automatic
tool for process development by comprehensively evaluating every possible
model without the need for chemical intuition or more importantly chemistsrsquo
time This approach has been upgraded to allow both catalytic reactions and
reactions with non-integer orders to be identified therefore vastly expanding its
scope However it is still important to note that although this tool is powerful it
is ultimately data-driven and subsequently must only be used as a
complementary tool Therefore after all model evaluations the tool must still be
138
used in conjunction with real chemical intuition by an end user to determine that
the models identified as most likely are accurate and consistent with the science
43 Simulated verifications of the approach
In the same manner as the previous methodology it is first important to
verify that the approach identifies the correct models and kinetic parameters
before conducting any real experimentation Several simulated case studies
were conducted that feature different true kinetic models showing how this
methodology has been adapted to identify catalytic speciesrsquo orders as well as
non-integer and zero order species dependencies in chemical systems These
case studies feature reactions from the literature whereby simulated
experimental data is generated from known models and kinetic parameters
To simulate the experimental data as shown in Chapter 23 the true
model and kinetic parameters reported in the literature source are inputted into
MATLAB The experiments are then simulated at particular temperatures and
initial sets of concentrations by using an ODE solver to evaluate the change in
species concentrations over a given experimental timeframe Individual data
points are then extracted from this timeframe which then represent experimental
data points for the simulated case study Up to plusmn 2 relative error is then added
to each measurement to approximate this simulated data more closely to real
experimental data
431 Case study SNAr kinetics
The first simulated case study was the SNAr reaction described in Scheme
42 where 24-difluoronitrobenzene (starting material SM) 45 reacts with
pyrrolidine 46 to form either the ortho-substituted product 47 or the para-
substituted product 48 - both of which can then react further with pyrrolidine to
form the bis-substituted product 49 and form hydrofluoric acid 410 as a
byproduct in each step[225] This case study features lsquosimplersquo elementary
reactions in the true model as there are no non-integer or zero order
dependencies However this scenario is still important to study as the new
approach must still be able to correctly identify model structures and kinetic
parameters of systems that feature only these elementary reactions In this case
both the old approach and the new approach were run in order to determine if
139
they both arrive at the same identified model as they should This should confirm
that even in a multicomponent process the new approach will still identify the
correct elementary reactions instead of substituting non-integer or zero order
rate laws
Scheme 42 The reaction of 24-difluoronitrobenzene 45 with pyrrolidine 46 to form the
ortho-substituted product 47 and the para-substituted product 48 Consecutive
reactions then occur to form the bis-substituted product 49 In each reaction
hydrofluoric acid 410 is formed[225]
4311 Data acquisition
The multistep SNAr reaction model reported by Hone et al consists of 4
second-order reactions These reactions were used to generate the ODEs
shown in eqn 41 - 46 The reported kinetic constants for these three steps
were
bull Step one k90 degC = 0579 M-1 s-1 Ea = 333 kJ mol-1
bull Step two k90 degC = 0027 M-1 s-1 Ea = 353 kJ mol-1
bull Step three k90 degC = 0009 M-1 s-1 Ea = 389 kJ mol-1
bull Step four k90 degC = 0016 M-1 s-1 Ea = 448 kJ mol-1
Five simulated data sets were generated at 30 degC by using eqn 27 to calculate
k values with the following initial concentrations
bull 1 M SM 45 11 M pyrrolidine 46 0 M ortho-substituted product 47 0
M para-substituted product 48 0 M bis-substituted product 49 and 0 M
hydrofluoric acid 410
140
bull 08 M SM 45 15 M pyrrolidine 46 0 M ortho-substituted product 47
0 M para-substituted product 48 0 M bis-substituted product 49 and 0
M hydrofluoric acid 410
bull 1 M SM 45 2 M pyrrolidine 46 0 M ortho-substituted product 47 0 M
para-substituted product 48 0 M bis-substituted product 49 and 0 M
hydrofluoric acid 410
bull 1 M SM 45 25 M pyrrolidine 46 0 M ortho-substituted product 47 0
M para-substituted product 48 0 M bis-substituted product 49 and 0 M
hydrofluoric acid 410
bull 12 M SM 45 3 M pyrrolidine 46 0 M ortho-substituted product 47 0
M para-substituted product 48 0 M bis-substituted product 49 and 0 M
hydrofluoric acid 410
119889[120786 120787]
119889119905= minus1198961[120786 120787][120786 120788] minus 1198962[120786 120787][120786 120788] eqn 41
119889[120786 120788]
119889119905= minus1198961[120786 120787][120786 120788] minus 1198962[120786 120787][120786 120788] minus 1198963[120786 120789][120786 120788]
minus 1198964[120786 120790][120786 120788]
eqn 42
119889[120786 120789]
119889119905= 1198961[120786 120787][120786 120788] minus 1198963[120786 120789][120786 120788] eqn 43
119889[120786 120790]
119889119905= 1198962[120786 120787][120786 120788] minus 1198964[120786 120790][120786 120788] eqn 44
119889[120786 120791]
119889119905= 1198963[120786 120789][120786 120788] + 1198964[120786 120790][120786 120788] eqn 45
119889[120786 120783120782]
119889119905= 1198961[120786 120787][120786 120788] + 1198962[120786 120787][120786 120788]
+1198963[120786 120789][120786 120788] + 1198964[120786 120790][120786 120788]
eqn 46
2 relative error was then added to each data point in these simulated
data sets then used as the inputted experimental data for both the old and new
computational approach These data sets can be found in Chapter 741
4312 Results and discussion
As the initial ILP optimisation proceeds in the same manner for both the
old and new approaches the mass-balance-allowed reactions identified in each
case are the same It is only the subsequent rate laws and models that differ in
141
the model generation steps between the old and new approaches From the 6
species inputted there are 16 mass-balance-allowed reactions that were
identified shown in eqn 47 - 422
48 rarr 47 eqn 47
47 rarr 48 eqn 48
45 + 46 rarr 47 + 410 eqn 49
47 + 410 rarr 45 + 46 eqn 410
45 + 49 rarr 47 + 47 eqn 411
45 + 46 rarr 48 + 410 eqn 412
46 + 47 rarr 49 + 410 eqn 413
47 + 47 rarr 45 + 49 eqn 414
49 + 410 rarr 46 + 48 eqn 415
48 + 410 rarr 45 + 46 eqn 416
46 + 48 rarr 49 + 410 eqn 417
45 + 49 rarr 47 + 48 eqn 418
45 + 49 rarr 48 + 48 eqn 419
49 + 410 rarr 46 + 47 eqn 420
47 + 48 rarr 45 + 49 eqn 421
48 + 48 rarr 45 + 49 eqn 422
Old approach
When running the old approach every combination of the 16 identified
mass-balance-allowed transformations was constructed resulting in 65535
unique models to be evaluated All of these resulting models were evaluated by
the approach which incurred a computation time of 13 hours (see Chapter 762
for details on computer specifications)
Each of these models were ranked based on their AICC evaluation and it
was found that the highest ranked model was also the correct model with kinetic
parameters optimised to values that were very close to the literature values used
to generate the data As with previous simulations described in Chapter 23 the
142
optimisation is assumed to be correct as the error in the fitted parameters is
negligible considering that artificial error was added to the data set The top five
performing models are shown in Table 42 where the optimised k values are
shown as well as their corresponding SSE and AICC values
Table 42 A table showing the top five ranked models for the SNAr case study as identified by
the old approach The kinetic parameters for each reaction within the model are shown
as well as the SSE and AICC evaluation
Model
rank Model kx M-1 min-1 SSE M AICC
1
45 + 46 rarr 47 + 410
45 + 46 rarr 48 + 410
47 + 46 rarr 49 + 410
48 + 46 rarr 49 + 410
00656
00026
00007
00008
00040 -30627
2
45 + 46 rarr 47 + 410
45 + 46 rarr 48 + 410
47 + 46 rarr 49 + 410
48 + 46 rarr 49 + 410
45 + 49 rarr 47 + 48
49 + 410 rarr 46 + 48
00657
00026
00007
00010
00065
lt00001
00039 -30125
3
45 + 46 rarr 47 + 410
45 + 46 rarr 48 + 410
47 + 46 rarr 49 + 410
48 + 48 rarr 49 + 45
00657
00027
00007
00174
00044 -30097
4
45 + 46 rarr 47 + 410
45 + 46 rarr 48 + 410
47 + 46 rarr 49 + 410
48 + 46 rarr 49 + 410
45 + 49 rarr 47 + 48
00663
00028
00007
00010
00026
00042 -30053
5
45 + 46 rarr 47 + 410
45 + 46 rarr 48 + 410
47 + 46 rarr 49 + 410
48 + 46 rarr 49 + 410
00655
00026
00007
00009
00041 -29946
143
45 + 49 rarr 47 + 47
45 + 49 rarr 48 + 48
00143
00065
New approach
When running the new approach all allowed combinations of the mass-
balance-allowed reactions and corresponding non-integer and zero order rate
laws were compiled subject to the rules described earlier in Chapter 422 This
model generation resulted in 141505 unique models to be evaluated by the
approach which incurred a 28 hour computation time (see Chapter 762 for
details on computer specifications)
Each of these models were ranked based on their AICC and it was found
that the highest ranked model was also the correct model with kinetic
parameters optimised to values that were very close to the literature values that
were used to generate the data As highlighted in the old approach section the
optimisation is assumed to be correct as the error in the fitted parameters is
negligible considering that artificial error was added to the dataset The top five
performing models from this new approach are shown in Table 43 where the
optimised k values are shown as well as their corresponding SSE and AICC
values
Table 43 A table showing the top five ranked models for the SNAr case study as identified by
the new approach The kinetic parameters for each reaction within the model are shown
as well as the SSE and AICC evaluation α denotes a variable molar dependence within
the kinetic parameter units depending on the rate law
Model
rank Model kx Mα min-1 SSE M AICC
1
45 + 46 rarr 47 + 410
45 + 46 rarr 48 + 410
47 + 46 rarr 49 + 410
48 + 46 rarr 49 + 410
00656
00026
00007
00008
00040 -30627
2
45 + 46 rarr 47 + 410
46 + 47 rarr 49 + 410
480 rarr 47
47 rarr 48
00680
00007
00501
00394
00042 -30333
144
3
45 + 46 rarr 47 + 410
45 + 46 rarr 48 + 410
47 + 46 rarr 49 + 410
48 + 48 rarr 49 + 45
00657
00027
00007
00174
00044 -30097
4
45 + 46 rarr 47 + 410
45 + 46 rarr 48 + 410
47 + 46 rarr 49 + 410
48 + 41005 rarr 45 + 46
00640
00024
00007
00008
00061 -28521
5
45 + 46 rarr 47 + 410
47 + 46 rarr 49 + 410
47 rarr 48
48 rarr 47
00670
00007
00041
00997
00065 -28276
Discussion
This initial simulated case study has shown that it is still possible to identify
the correct reaction model and kinetic parameters with this new approach for a
lsquosimplersquo reaction system featuring a first-order dependencies on all species The
most-likely identified model and corresponding SSEAICC values were the
same in this instance for both the old and new approach which is to be expected
if the new approach is functioning correctly As shown in the old approach there
are models that have a greater convergence to the experimental data (and hence
a lower SSE) but the statistical analysis correctly assigns these models an
unfavourable AICC based on their extra (insignificant) model terms However as
the initial limit of 4 terms in a model is enforced in the new approach it can be
determined by the user that compiling and evaluating the 5-term-models is not
required based on the marginal possible SSE benefits These small benefits are
very unlikely to warrant extra terms based on AICC evaluation as the
convergence to experimental data is already excellent meaning that the model
identified is very likely to be correct An example kinetic plot showing the fit of
the identified model to the experimental data is shown in Figure 43 - this is the
fifth simulated experiment where the starting concentrations were 12 M 24-
difluoronitrobenzene and 3 M pyrrolidine at 30 degC
145
Figure 43 The fit of the identified model and kinetic parameters to the generated experimental
data with starting concentrations of 12 M 24-difluoronitrobenzene and 3 M pyrrolidine at
30 degC Where x = 24-difluoronitrobenzene x = ortho-substituted product x = para-
substituted product x = bis-substituted product mdash = 24-difluoronitrobenzene (ODE) mdash
= ortho-substituted product (ODE) mdash = para-substituted product (ODE) mdash = bis-
substituted product Plot only shown to 500 minutes to the show curvature of the initial
data points
It has been shown that the new approach can identify the correct model
and kinetic parameters for a multistep process with first-order dependencies on
all species with the same accuracy as expected from the old approach
Therefore it is now possible to confidently move on to simulated case studies
where rate laws are more complex featuring catalytic reactions and orders that
are non-integer or zero
432 Case study Pentyne kinetics
This simulated case study features a chemical system that reacts with a zero-
order dependence on one of the species[241] The starting material 411 reacts
with the spirodiene 412 to form the product 413 and LiBr 414 as shown in
Scheme 43 The true rate law however shows a first-order dependence on the
starting material and a zero-order dependence on the spirodiene Interestingly
this reaction order has been used as evidence for the existence of a pentyne
species as this order suggests an initial reaction of the starting material to form
146
a much more reactive species leading to the zero-order dependence on the
spirodiene
Scheme 43 The reaction of the starting material 411 with the spirodiene 412 to form the
product 413 and LiBr 414[241]
4321 Data acquisition
The overall first-order reaction model reported by Gilbert et al[241] was used
to generate the ODEs shown in eqn 423 - 426 Three isothermal simulated
data sets were generated using these ODEs with the k value of 000846 min-1 at
-78 degC with the following initial concentrations
bull 1 M 2-bromocyclopentenyl lithium (starting material) 411 08 M
spirodiene 412 0 M product 413 0 M LiBr 414
bull 12 M 2-bromocyclopentenyl lithium (starting material) 411 15 M
spirodiene 412 0 M product 413 0 M LiBr 414
bull 1 M 2-bromocyclopentenyl lithium (starting material) 411 1 M
spirodiene 412 0 M product 413 0 M LiBr 414
119889[120786 120783120783]
119889119905= minus1198961[120786 120783120783] eqn 423
119889[120786 120783120784]
119889119905= minus1198961[120786 120783120783] eqn 424
119889[120786 120783120785]
119889119905= 1198961[120786 120783120783] eqn 425
119889[120786 120783120786]
119889119905= 1198961[120786 120783120783] eqn 426
2 relative error was then added to these simulated data sets then used
as the inputted experimental data for the computational approach These data
sets can be found in Chapter 742
4322 Results and discussion
147
From these 3 species there are 2 mass-balance-allowed reactions that
can be identified shown in eqn 427 and eqn 428 From these two reactions
the corresponding rate laws were generated and all models were compiled
subject to the rules defined in Chapter 422 - this resulted in 30 unique models
to be evaluated by the approach
411 + 412 rarr 413 + 414 eqn 427
413 + 414 rarr 411 + 412 eqn 428
All 30 models were evaluated by the computational approach incurring a
computation time of around lt1 minute (see Chapter 761 for details on computer
specifications) Each of these models were ranked based on their AICC and it
was found that the highest ranked model was also the correct model with kinetic
parameters optimised to values that were very close to the generated values
The top five performing models are shown in Table 44 where the optimised k
values are shown as well as their corresponding SSE and AICC values
Table 44 A table showing the top five ranked models for the pentyne case study as identified
by the new approach The kinetic parameters for each reaction within the model are
shown as well as the SSE and AICC evaluation α denotes a variable molar dependence
within the kinetic parameter units depending on the rate law
Model
rank Model kx Mα min-1 SSE M AICC
1 411 + 4120 rarr 413 + 414 00085 00046 -134903
2 411 + 4120 rarr 413 + 414
413 + 414 rarr 411 + 412
00085
lt00001 00046 -132515
3 411 + 4120 rarr 413 + 414
413 + 41405 rarr 411 + 412
00085
lt00001 00046 -132515
4 411 + 4120 rarr 413 + 414
4130 + 414 rarr 411 + 412
00085
lt00001 00046 -132514
5 411 + 4120 rarr 413 + 414
413 + 4140 rarr 411 + 412
00085
lt00001 00046 -132514
Interestingly all five of these top-ranked models all have the same SSE
values and ranks 2 - 5 all have very similar AICC evaluations It is clear from
these models that the primary reason that they score highly is due to the
148
presence of the true model term 411 + 4120 rarr 413 + 414 One extra model
term is present that is rendered negligible but as the algorithm is forced to fit it
it is fitted with a value lt00001 In the old approach these negligible reactions
could be found but not repeated whereas in the new approach every variation
of the rate law of a particular negligible reaction can be repeated and score highly
according to AICC
Nonetheless the highest ranked model according to the approach is the
true kinetic model and the corresponding k value was also identified correctly
This case study shows that it is possible for the approach to identify models that
feature reactions that do not have typical species order dependencies of 1
therefore also that it can be used for real experimentation featuring zero or non-
integer order model terms An example kinetic plot showing the fit of the identified
model to the simulated experimental data is shown in Figure 44 - this is the first
experiment where the starting concentrations were 1 M starting material and 08
M spirodiene at -78 degC
149
Figure 44 The fit of the identified model and kinetic parameters to the generated experimental
data with starting concentrations of 1 M starting material and 08 M spirodiene at -78 degC
Where x = starting material x = spirodiene x = product mdash = starting material (ODE) mdash
= spirodiene (ODE) mdash = product (ODE)
433 Case study Ytterbium catalysis
The final simulated case study involves a ytterbium catalysed reaction
with lsquonon-normalrsquo empirical rate laws[242] 1-Phenyl-2-trimethylsilylacetylene
(starting material) 415 reacts with diphenylphosphine 416 in the presence of
a ytterbium catalyst ([Yb(η2-Ph2CNPh)(hmpa)3]) 417 to form the product 418
as shown in Scheme 44
Scheme 44 The reaction of the starting material 415 with diphenylphosphine 416 in the
presence of the ytterbium catalyst 417 to form the product 418 where [Yb] Yb(η2-
Ph2CNPh)(hmpa)3[242]
4331 Data acquisition
The complex order dependencies for the reaction model reported by Takaki
et al[242] consists of 1 reaction that was used to generate the ODEs shown in
eqn 429 - 432 In the true empirical rate law the order in the starting material
is 1 the order in diphenylphosphine is 0 and the order of the ytterbium catalyst
is 2 Four isothermal simulated data sets were generated at 25 degC using these
ODEs with the k value of 9324 M2 h-1 with the following initial concentrations
bull 2 M starting material 415 2 M diphenylphosphine 416 02 M ytterbium
catalyst 417 0 M product 418
bull 15 M starting material 415 2 M diphenylphosphine 416 01 M
ytterbium catalyst 417 0 M product 418
bull 14 M starting material 415 18 M diphenylphosphine 416 03 M
ytterbium catalyst 417 0 M product 418
bull 22 M starting material 415 16 M diphenylphosphine 416 025 M
ytterbium catalyst 417 0 M product 418
119889[120786 120783120787]
119889119905= minus119896 [120786 120783120787][120786 120783120789]2 eqn 429
150
119889[120786 120783120788]
119889119905= minus119896 [120786 120783120787][120786 120783120789]2 eqn 430
119889[120786 120783120789]
119889119905= minus2119896 [120786 120783120787][120786 120783120789]2 + 2119896 [120786 120783120787][120786 120783120789]2 eqn 431
119889[120786 120783120790]
119889119905= 119896 [120786 120783120787][120786 120783120789]2 eqn 432
2 relative error was then added to these simulated data sets then
used as the inputted experimental data for the computational approach These
data sets can be found in Chapter 721
4332 Results and discussion
Based on the inputs of the molecular weights for this system there are
two mass-balance-allowed reactions However as it is known that this is a
catalytic system these two reactions must be facilitated by the user-defined
ytterbium catalyst 417 shown in eqn 433 and 434 It is then the role of the
approach to identify all combinations of allowed reactions and rate laws to
determine which is the most likely model
415 + 416 120786120783120789rarr 418 eqn 433
415 + 416 120786120783120789rarr 418 eqn 434
After the model generation stage 105 models were identified and
evaluated by the computational approach incurring a time of around 1 minute
(see Chapter 762 for details on computer specifications) Each of these models
were ranked based on their AICC and it was found that the highest ranked model
was also the correct model with the k value optimised to a value that was very
close to the value used for data generation The top five performing models are
shown in Table 45 where the optimised k values are shown as well as their
corresponding SSE and AICC values
Table 45 A table showing the top five ranked models for the ytterbium catalysis case study as
identified by the new approach The kinetic parameters for each reaction within the
model are shown as well as the SSE and AICC evaluation α denotes a variable molar
dependence within the kinetic parameter units depending on the rate law
Model
rank Model kx Mα h-1 SSE M AICC
1 415 + 4160 4172
rarr 418 93191 928 x 10-4 -24138
151
2
415 + 4160 4172
rarr 418
418 41705
rarr 415 + 416
93191
lt00001 928 x 10-4 -23910
3
415 + 4160 4172
rarr 418
418 4171
rarr 415 + 416
93191
lt00001 928 x 10-4 -23910
4
415 + 4160 4172
rarr 418
418 4172
rarr 415 + 416
93191
lt00001 928 x 10-4 -23910
5 415 + 416 4172
rarr 418 80784 11549 -1335
As in the previous pentyne case study four of these top-ranked models
all have the same SSE values and ranks 2 - 4 all have very similar AICC
evaluations The reasoning for this appears to be the same as previously
discussed where the primary reason that they score highly is due to the
presence of the true model term 415 + 4160 4172
rarr 418 One extra model term
is present in ranks 2 - 4 that the algorithm is forced to fit although it does not
provide any significance to the model hence it is fitted with a value lt00001
Nonetheless the highest ranked model according to the approach is the
true kinetic model and the corresponding k value was also identified correctly
This case study shows not only that it is possible to identify models that feature
catalytic species but also that the orders of the catalytic and non-catalytic
species can be identified As a lsquotypicalrsquo catalytic example is more likely to be first-
order with respect to all species the ability that the approach has shown to
identify non-normal order dependencies in the rate law for multiple species
inspires confidence that the approach will be successful in its use in real
experimentation An example kinetic plot showing the fit of the identified model
to the simulated experimental data is shown in Figure 45 - this is the second
experiment where the starting concentrations were 15 M starting material 2 M
diphenylphosphine and 01 M ytterbium catalyst at 22 degC
152
Figure 45 The fit of the identified model and kinetic parameters to the generated experimental
data with starting concentrations of 15 M starting material 2 M diphenylphosphine and
01 M ytterbium catalyst at 22 degC Where x = starting material x = diphenylphosphine x
= product mdash = starting material (ODE) mdash = diphenylphosphine (ODE) mdash = product
(ODE)
44 Conclusion
It has been shown that the previously built computational approach to
kinetic modelling can be adapted to catalytic systems and rate laws with non-
normal order dependencies This new approach has been proven to work
successfully for three simulated case studies featuring different modelling
criteria with sets of experimental data inputs with artificial errors The success
shown from these studies inspires confidence that the approach can be
implemented with real experimental data
The scope of the approach has increased substantially following the
improvements in this work and can now be used for many more chemical
applications However due to the comprehensive nature of the approach the
computational expense has also increased as there are many more reactions
that must be considered when building reaction models This computational
stress as before can be reduced by replacing existing computer hardware with
more computer logical cores - this is because the code is highly parallelised and
153
the speed of the approach is directly proportional to the number of computer
cores available Although the approach is very powerful this computational
expense may still be cumbersome for desktop computers depending on the
number of species involved in a particular chemical system However as time
passes processing technology consistently improves and there will undoubtedly
be a time where millions of models can be evaluated at a desk in a matter of
hours via comprehensive methodologies such as this
This comprehensive approach to kinetic model and parameter
determination has been shown to be successful in simulated case studies - the
next step is to prove the efficiency of this methodology with real experimental
case studies The aim of these case studies is to show that this approach can
correctly identify models of various-complexity chemical processes thereby
realising the main aim of this project in developing an automated kinetic analysis
tool with a wide scope for process development
Chapter 5 Experimental applications of the new approach
51 Introduction
With the development of the new computational approach complete and
verified with multiple simulated case studies the viability of the approach for real
experimental data must also be tested Real experimental case studies are to be
conducted to measure the ability of this new and final computational approach
As the scope of this new approach has been broadened to include
catalytic reactions and species order dependencies of zero or 05 it is important
to study chemical systems that may exhibit these properties to prove that the
new approach can identify these models It is also important that the approach
can continue to identify more lsquosimplersquo models that have species order
dependencies of 1 as well as utilise kinetic data from any means This is
because the kinetic motifs often cannot be determined a priori and the beneficial
feature of this methodology is that models are identified and ranked according to
statistical measures This removes bias and therefore considers all rate laws for
every possible model meaning that the approach does not know initially if a
154
model is supposed to contain a zero order term or not for example and will only
determine this after the comprehensive model evaluations
Experimental case studies from any reaction process (batch flow etc)
and analytical technique (HPLC NMR etc) will be used in these final
experimental verifications These case studies will prove that the approach can
identify models including lsquonormalrsquo zero or 05 species order dependencies for
both catalytic and non-catalytic processes The research project aim will thereby
be realised by ultimately developing a powerful automated methodology to be
used in process development for the modelling of real chemical systems
52 Case study SNAr kinetics
The first reaction system explored using the new computational approach
was the presupposed model of the reaction of 246-trichloropyrimidine (SM) 51
with ethyl 4-aminobutanoate 52 to form the major 2-substituted SNAr product
53 and the minor 4-substituted SNAr product 54 as shown in Scheme 51 As
the ethyl 4-aminobutanoate is present in its hydrochloride salt the hydrochloric
acid present (and generated from subsequent SNAr reactions as 55) is
neutralised by an excess of triethylamine
Scheme 51 The reaction of 246-trichloropyrimidine (SM) 51 with ethyl 4-aminobutanoate
52 to form the major 2-substituted SNAr product 53 and the minor 4-substituted SNAr
product 54
As the desired major product from this reaction can be further reacted to
synthesise bioactive derivatives of pharmaceuticals[243 244] this initial
transformation is of interest in the process development of these molecules A
collaborator in the Spring group at Cambridge University Hikaru Seki has a
particular interest in these bioactive molecules for his research project and
155
wanted to maximise the synthetic yield of the 2-substituted SNAr product 53 by
obtaining kinetic understanding of the system Therefore all practical
experimental work in this case study was conducted by Hikaru Seki at Cambridge
University then the results were forwarded to Leeds for kinetic analysis
Four kinetic experiments were conducted at -25 degC 0 degC 25 degC and 50
degC with three replicate experiments at 25 degC Each experiment was conducted
in batch in an NMR tube within a 500 MHz NMR spectrometer which allowed
continuous NMR acquisition at a rate of approximately one sample per 80
seconds This continuous reaction monitoring generates a large data density for
the subsequent kinetic analysis using the new computational approach by
monitoring the proton peaks of the individual species shown in Figure 51 Full
experimental details can be found in Chapter 751
Figure 51 The distinctive proton peaks shown in red that are monitored via NMR as time
progresses in the SNAr case study
Based on the five species identified there were six reactions that were
calculated to be possible based on mass balance - these reactions are shown
as eqn 51 - 56 From these reactions all corresponding rate laws were
generated and all models were compiled subject to the rules defined in Chapter
422 This resulted in 3320 unique models to be evaluated by the approach
53 rarr 54 eqn 51
54 rarr 53 eqn 52
51 + 52 rarr 53 + 55 eqn 53
53 + 55 rarr 51 + 52 eqn 54
51 + 52 rarr 54 + 55 eqn 55
54 + 55 rarr 51 + 52 eqn 56
All 3320 models were evaluated by the computational approach incurring
a computation time of around 9 hours (see Chapter 761 for details on computer
156
specifications) Each of these models were then ranked based on their AICC
evaluation and it was found that the most likely representation of the system is
the model shown in Scheme 51 with lsquotypicalrsquo first-order species dependencies
in the rate laws The approach also determined the kinetic parameters of the
transformation to the major product k25 degC = 0499 plusmn 0006 M-1 min-1 Ea = 4419
plusmn 057 kJ mol-1 and to the minor product k25 degC = 0384 plusmn 0009 M-1 min-1 Ea =
3657 plusmn 088 kJ mol-1 This model and the corresponding kinetic parameters
allowed a fit to the experimental data with an average residual of less than 26 x
10-4 M and is shown in Figure 52 The top 5 ranked models are shown in Table
51 with their respective SSE error metric and AICC evaluation
Figure 52 Kinetic profiles for four kinetic experiments at -25 degC 0 degC 25 degC and 50 degC where
= starting material = 2-substituted product = 4-substituted product mdash = starting
material (ODE) mdash = 2-substituted product (ODE) mdash = 4-substituted product (ODE) See
Chapter 751 for full experimental conditions and raw data
Table 51 Evaluation of the feasibility of each reaction model for the SNAr case study where α
is variable for each model depending on the overall model order
Rank Reaction Model
Kinetic parameters
SSE
103 M AICC k25 degC Mα
min-1 Ea kJ mol-1
1 51 + 52 rarr 53 + 55 0499 4419 1614 -5191
157
51 + 52 rarr 54 + 55 0384 3657
2 51 + 52 rarr 53 + 55
51 + 5205 rarr 54 + 55
0407
0073
4061
3101 3723 -4857
3 51 + 52 rarr 53 + 55
510 + 52 rarr 54 + 55
0466
0017
4225
2756 3777 -4851
4 51 + 52 rarr 53 + 55
51 + 520 rarr 54 + 55
0466
0017
4225
2756 3777 -4729
5 51 + 5205 rarr 53 + 55
51 + 52 rarr 54 + 55
0092
0298
3806
3227 5127 -4664
It is clear from the kinetic plots that the fit of the ODEs to the experimental
data do not result in normally-distributed residuals This could be for one of many
reasons but is most likely due to either errors in producing the correct
concentration of amine 52 or NMR integrations errors or evaporation of solvent
(CD3OD) into the headspace at higher temperatures This must be considered
by a trained chemist upon completion of the computational approach and this is
an example showing that this methodology must be used in conjunction with
chemical expertise to confirm the approach output In this case however the
residuals are only a small consideration and it can be observed that the model
still fits the experimental data well so the identified model is still valid
This first experimental case study has shown that the new approach can
correctly identify the reaction model and kinetic parameters even when
considering a multitude of differing rate laws In this case it was found that each
the rate laws featured first-order dependencies on each of the species which is
common in chemical processes This kinetic information can then be used to
optimise this process for the highest yields of the 2-substituted (major) product
53 for our collaboratorrsquos research project which can then be used as a building
block for bioactive materials
53 Case study PfBr
The next case study that was explored was a chemical system featuring
a protection of an amino acid for further functionalisation where alanine methyl
158
ester (Al-Me) 56 reacts with 9-bromo-9-phenylfluorene (PfBr) 57 to form the
protected amino acid (Pf-Al-Me) 58 and hydrobromic acid 59 as a side-
product as shown in Scheme 52 The alanine methyl ester is present in its
hydrochloride salt form so this hydrochloric acid and the formation of
hydrobromic acid are both neutralised by an excess of suspended potassium
phosphate
Scheme 52 The reaction of alanine methyl ester (Al-Me) 56 with PfBr 57 to form the
protected amino acid 58 Hydrobromic acid 59 is also generated as a side product
PfBr is the reagent to introduce the 9-phenylfluorene (Pf) protecting group
in a synthesis Pf is a pharmaceutically relevant and bulky protecting group that
can be introduced as a more acid stable alternative to the more commonly used
trityl protecting group[245 246] The chemical system of interest is the protection
step in the total synthesis of (S)-eleagnine from L-alanine as shown in Scheme
53 as a retrosynthetic methodology[247] Understanding this transformation by
performing kinetic analysis would therefore accelerate process development
when scaling up this process
Scheme 53 The retrosynthetic methodology of the transformation of L-alanine to (S)-
eleagnine via the Pf-protected alanine methyl ester (Pf-Al-Me)[247]
Due to the high cost of PfBr as a starting material (pound137 for 5 g)[248] PfBr
was synthesised from cheaper materials as it was unknown how much would be
necessary for kinetic analysis Bromobenzene 510 was initially treated with
magnesium then reacted with fluorenone 511 to make the intermediate PfOH
512 PfOH was then isolated and reacted with hydrobromic acid to form the
desired PfBr product as shown in Scheme 54[249] The most expensive material
159
in the synthesis of this PfBr product is fluorenone costing pound76 for 500 g resulting
in a much cheaper method to obtaining this desired material[250] This reaction
was carried out on a 40 g scale and full experimental details can be found in
Chapter 7521 As there was an absence of an OH peak from the IR spectrum
of PfBr the PfBr material was analysed by HPLC and the purity was determined
to be gt99 With pure PfBr as a starting material the kinetic case study was
then possible to begin
Scheme 54 The synthetic route from cheap starting materials bromobenzene 510 and
fluorene 511 to the intermediate PfOH 512 and finally the desired PfBr material 58
Three experiments were conducted in a three-neck round bottomed flask
at 30 degC 35 degC and 40 degC Samples (05 mL) were extracted manually from the
bulk reaction medium with a syringe followed by syringing approximately 03 mL
of water and shaking the syringe - this dissolves the suspended potassium
phosphate and allows injection into the sample loop for analysis via HPLC The
batch setup for experimentation is shown in Figure 53
160
Figure 53 The batch setup for experimentation in the PfBr case study where the temperature
probe is submerged in the reaction medium that is heated via a heater stirrer
After all experiments were run the experimental data and the identified
species were inputted into the new approach Based on these four species there
were two feasible reactions calculated - these reactions are shown as eqn 57
and eqn 58 From these reactions all corresponding rate laws were generated
and all models were compiled subject to the rules defined in Chapter 422 This
resulted in 30 unique models to be evaluated by the approach
56 + 57 rarr 58 + 59 eqn 57
58 + 59 rarr 56 + 57 eqn 58
All 30 models were evaluated by the new computational approach
incurring a computation time of less than 2 minutes (see Chapter 761 for details
on computer specifications) Each of these models were then ranked based on
their AICC evaluation and it was found that the most likely representation of the
system is the model shown in Scheme 52 but with a zero-order dependence on
the alanine methyl ester in the rate law This makes sense chemically as the
bulky aromatic rings would stabilise the cation formed if the reaction were to
proceed via a traditional SN1 mechanism this means that the rate-determining-
161
step is likely to be the loss of the bromide ion followed by a fast reaction with the
alanine methyl ester The approach also determined the kinetic parameters of
this transformation as k35 degC = 106 x 10-2 plusmn 001 x 10-2 min-1 Ea = 6291 plusmn 023
kJ mol-1 This model and the corresponding kinetic parameters allowed a fit to
the experimental data with an average residual of 26 x 10-4 M and is shown in
Figure 54 in a combined plot The top 5 ranked models are shown in Table 52
with their respective SSE error metrics and AICC evaluations
Figure 54 Kinetic profiles for three kinetic experiments at 30 degC 35 degC and 40 degC where red
plots indicate PfBr concentrations and blue plots indicate Pf-Al-Me concentrations At 30
degC = experimental data mdash = ODE At 35 degC = experimental data - - - = ODE At
40 degC = experimental data = ODE See Chapter 752 for full experimental
conditions and raw data
Table 52 Evaluation of the feasibility of each reaction model for the PfBr case study where α
is variable for each model depending on the overall model order
Rank Reaction Model
Kinetic parameters
SSE
10-5 M AICC k35 degC Mα min-
1
Ea kJ mol-
1
1 560 + 57 rarr 58 + 59 00106 6291 351 -23815
2 560 + 57 rarr 58 + 59
58 + 5905 rarr 56 + 57
00115
00144
6709
7000 276 -23805
3 560 + 57 rarr 58 + 59
58 + 590 rarr 56 + 57
00129
00034
6527
7000 276 -23804
4 560 + 57 rarr 58 + 59 00128 6571 281 -23764
162
580 + 59 rarr 56 + 57 00057 7000
5 560 + 57 rarr 58 + 59
5805 + 59 rarr 56 + 57
00112
00167
6606
7000 295 -23654
Interestingly the top 5 ranked models all feature the main lsquoimportantrsquo
model term of 560 + 57 rarr 58 + 59 with models 2 - 5 also featuring some
variant of the reversible reaction This is a similar outcome to the simulated
pentyne kinetics case study in Chapter 432 In this experimental case however
the reversible reaction should be very unlikely as the hydrobromic acid is
removed by the excess potassium phosphate present It can be concluded
therefore that these extra model terms are just fitting to the experimental noise
especially as the magnitude of the SSE metrics are so low
It has been shown in this case study that the new computational approach
can correctly identify the reaction model and kinetic parameters of a system
where there is a zero-order dependency on one of the species This is the first
instance of an identified model featuring non-first-order rate laws in a real
chemical process and further proves the broadened applicability of the new
approach as a kinetic analysis tool This kinetic information can then be used to
shorten process development times and lower costs if (S)-eleagnine was
synthesised using this route
54 Case study Maleic acid
The final experimental case study that was explored was the chemical
system involving maleic acid 513 reacting with methanol 514 to form the
monomethylated maleic acid ester (mono-product) 515 and the dimethylated
maleic acid ester (di-product) 516 shown in Scheme 55 Each reaction also
liberates a molecule of water 517
163
Scheme 55 The reaction of maleic acid 513 and methanol 514 to form the mono-product
515 and the di-product 516
Our collaborators at AstraZeneca were interested in this reaction following
the contamination of a batch of an API maleate salt with the corresponding
monomethyl maleate salt as this contamination could be mitigated if the impurity
formation was well understood Kinetic experiments were run and the findings
were published as it was found that the reaction forming the mono-product was
autocatalytic[240] In this case the reaction was found to be catalytic with an order
of 05 meaning that the overall order with respect to the maleic acid was 15 in
forming the mono-product The consecutive reaction forming the di-product is
also catalytic with respect to the maleic acid with a 05 order dependence
Although this information is now known and reported it took several months for
physical-organic chemists at AstraZeneca to decipher this reaction model as this
model is not immediately intuitive Therefore this case study was run to
retrospectively show the efficiency of this approach in elucidating non-intuitive
reaction models and how this methodology can serve as a viable substitute for
many hours spent on a project by experts that could be working on other aspects
of process development
All experimental data was obtained from our collaborators at AstraZeneca
and was collected using batch experimentation and 1H NMR sampling Five
experiments were conducted at differing starting concentrations and
temperatures in the range of 40 - 60 degC This experimental data was inputted into
the computational approach as well as the identified species Based on these
five species there were six feasible reactions identified - these reactions are
shown as eqn 59 - 514
513 + 514 rarr 515 + 517 eqn 59
515 + 517 rarr 513 + 514 eqn 510
515 + 514 rarr 516 + 517 eqn 511
516 + 517 rarr 515 + 514 eqn 512
515 + 515 rarr 513 + 516 eqn 513
513 + 516 rarr 515 + 515 eqn 514
As the experiments were ran with methanol as a solvent this exhibits an
effective methanol concentration of ~24 M which is far greater than the maleic
164
acid concentration that had a maximum concentration of 08 M As the methanol
is in such a high concentration its concentration remains effectively unchanged
throughout the reaction meaning that the rate law would approximate pseudo-
first-order kinetics Therefore after all rate laws were compiled using these
mass-balance-allowed reactions all rate laws pertaining to non-zero-order with
respect to methanol concentration were removed As the methanol concentration
would be effectively unchanged it would be very difficult to differentiate between
models with differing order dependencies on the methanol - this would likely lead
to many models tied for lsquomost likelyrsquo with exactly equivalent SSE values
After the subsequent rate laws were compiled the models were
generated subject to the rules defined in Chapter 422 and with the maleic acid
defined as a catalyst This resulted in 5086 unique models to be evaluated by
the approach which incurred a computation time around 17 hours (see Chapter
761 for details on computer specifications) Each of these models were then
ranked based on their AICC evaluation and it was found that the most likely
representation of the system is the reaction model shown in Scheme 55 but
each step is catalysed by maleic acid with a species order dependence of 05 -
these are the same findings that our collaborators made during their kinetic
analysis The approach also determined the kinetic parameters of this
transformation to be kmono 50 degC = 385 x 10-3 plusmn 001 x 10-3 M-05 min-1 Ea = 7261
plusmn 012 kJ mol-1 and kdi 50 degC = 466 x 10-4 plusmn 001 x 10-4 M-05 min-1 Ea = 6974 plusmn
010 kJ mol-1 These parameters were again very similar to those obtained by
our collaborators although our collaborators reported the kinetic parameters as
Arrhenius constants and activation energies This model and the corresponding
kinetic parameters allowed a fit to the experimental data with an average residual
of 11 x 10-3 M and two experimental fittings at 50 degC (with initial concentrations
of 08 M and 04 M) are shown in Figure 55 The top 5 ranked models are shown
in Table 53 with their respective SSE error metrics and AICC evaluations
165
Figure 55 Kinetic profiles for two kinetic experiments at 50 degC with the initial concentration of
maleic acid at 04 M and 08 M At 04 M = maleic acid mdash = maleic acid (ODE) =
mono-product mdash = mono-product (ODE) = di-product mdash = di-product (ODE) At 08
M = maleic acid - - - = maleic acid (ODE) = mono-product - - - = mono-product
(ODE) = di-product - - - = di-product (ODE) See Chapter 753 for full experimental
conditions and raw data
Table 53 Evaluation of the feasibility of each reaction model for the maleic acid case study
where α is variable for each model depending on the overall model order
Rank Reaction Model
Kinetic parameters
SSE
10-2 M AICC k50 degC 10-3 Mα
min-1 Ea kJ mol-1
1
51315 + 5140 rarr 515
+ 51305 + 517
51305 + 515 + 5140
rarr 516 + 51305 + 517
385
047
7261
6974 028 -4968
2
51315 + 5140 rarr 515
+ 51305 + 517
513 + 5152 rarr 5132 +
516
408
192
7832
7977 033 -4908
3
51315 + 5140 rarr 515
+ 51305 + 517
513 + 515 + 5140 rarr
516 + 513 + 517
391
103
7419
7995 033 -4902
166
4
51315 + 5140 rarr 515
+ 51305 + 517
51305 + 5152 rarr
51315 + 516
397
076
7652
7306 042 -4806
5
5132 + 5140 rarr 515 +
513 + 517
513 + 515 + 5140 rarr
516 + 513 + 517
560
078
7998
7936 053 -4715
As in previous case studies the top ranked models all feature the main
lsquoimportantrsquo model term that describes the convergence to experimental data in
the best way with models 1 - 4 featuring this term 51315 + 5140 rarr 515 +
51305 + 517 This is because the SSE metric is a measure of the total error in
the fit to the data and as this model term features the transformation of 513 to
515 which are the species present in the highest concentrations this model
term therefore has the highest impact on minimising the SSE
It has been shown in this case study that the new computational approach
can correctly identify the reaction model and kinetic parameters of a real
chemical system where there are both catalytic species and species with non-
integer order dependencies This is the first instance of an identified model
featuring a catalytic species and non-integer-order rate laws using real
experimental data As the model was already identified by our collaborators this
methodology has corroborated their findings and shown that process
understanding can be accelerated using this approach This approach
automatically identified the correct reaction model in ~17 hours whereas our
collaborators using more traditional lsquotrial and errorrsquo approaches arrived at the
correct model in months Retrospectively this would have allowed faster
implementation of measures to reduce the amount of monomethyl maleate salt
impurity in their API maleate salt thereby proceeding with process development
and cutting costs
55 Conclusion
167
It has been shown that using this new computational approach total
process understanding can be automatically achieved without the need for high-
level chemical intuition The widened scope of this new approach has been
proven to be effective in three experimental case studies each with differing rate
laws and kinetic structural motifs The approach has been proven to be effective
and applicable for lsquonormalrsquo kinetic models where each species has a first-order
dependence for zero-order and non-integer rate laws and for catalytic species
of variable integer- and non-integer-order
It has also been shown from these case studies that using this
methodology can greatly accelerate process development and reduce the
workload of kinetic analysis for the physical-organic chemists After
experimentation all kinetic analysis can be automated whilst experts focus on
other aspects of process development Then after the computational approach
has finished running they can work in conjunction with the approach to identify
which models are the most likely to be both statistically and scientifically correct
Chapter 6 Conclusion amp future work
The project aim to develop and advance an automated methodology to
kinetic model and parameter determination has been answered in the thesis
chapters herein The computational approach should be used in conjunction with
experts to automate the comprehensive kinetic analysis that is otherwise not
feasible using traditional means The approach takes experimental data and the
identified species then identifies every possible mass-balance-allowed
transformation between these species Each of these reactions are then
compiled into every possible unique reaction model with each feasible
corresponding rate law These models are then evaluated based on their fit to
experimental data by combining the use of ordinary differential equation (ODE)
solvers and optimisation algorithms The models are then statistically ranked
based on their convergence to experimental data and the number of model terms
in the model thereby identifying the most likely model and its corresponding
kinetic parameters
168
The original structure of this comprehensive methodology was originally
reported by Tsu et al[173] which was then replicated improved and utilised for
real experimentation in Chapters 2 - 3 The approach was used in tandem with
an automated flow reactor platform by exploiting flow rate manipulations to
obtain full reaction profiles followed by implementation of the approach The
methodology was then further improved and the scope was widened in Chapter
4 as catalytic systems and differing-non-integer order species dependencies in
the rate laws were also explored This improved methodology was then proven
to be effective in real experimental systems in Chapter 5 as batch
experimentation ran at Leeds and by collaborators showed the wide applicability
of the approach to different types of reactions This approach can be used as a
tool for process development by anyone as expert chemical intuition is removed
from the kinetic analysis Therefore the project aim has been answered in the
work described herein as any chemist can use this approach and interpret the
output in order to obtain total process understanding
Further work on the use and development of this approach for metal-
catalysed processes would be beneficial Metal-catalysed processes are very
important in industry but catalytic cycles can be complex meaning that it is not
immediately obvious how to automate a tool to explore these potential models
In some cases it may be sufficient to describe a reaction based on empirical rate
laws and this can currently be implemented using the approach developed
However another research project on the development of a tool to identify these
kinetic models and catalytic cycles may be warranted As a suggestion this could
be performed by inputting many known catalytic cycles into a training set then
using machine learning techniques to build a neural network to identify trends in
experimental data to attribute particular catalytic cycles to chemical processes
Chapter 7 Appendix
71 Chapter 1
No appendix data for Chapter 1
72 Chapter 2
169
721 Generated data set for case study benzoic acid alkylation
Experiment 1
Time s 21 M 22 M 23 M
0 01 08 0
475 0081361 0060964 0017126
1024 0069511 004901 0031805
2015 0054394 003336 0044477
295 0044695 0027749 0051252
432 0038039 0019903 0062653
60 0032285 0013536 0065719
Experiment 2
Time s 21 M 22 M 23 M
0 01 011 0
468 007631 0084741 0023482
1027 0057707 0069104 0040456
20 004138 0054662 0056759
302 0034101 004059 0067659
476 0023686 0031161 0075772
60 0018377 0027305 0083761
Experiment 3
Time s 21 M 22 M 23 M
0 1 015 0
5 0069767 0121755 0032513
105 0047199 0098611 005277
2163 0027758 0077627 0072909
3054 0019626 0069013 0079639
4578 0011357 0059865 0091724
170
60 0006574 005691 0093444
722 Generated data set for case study nitrile hydrolysis
Experiment 1 60 degC
Time s 25 M 27 M 28 M
0 08 0 0
5235363 0814005 001713 100E-06
3247861 067236 0106334 339E-05
6719836 0634071 0199701 0000124
1456155 0463323 034173 0000516
2899323 027438 0528037 0001536
3687175 0220788 0551639 000212
4868495 0162216 0630518 0003131
600 0124203 0705371 0004112
Experiment 2 70 degC
Time s 25 M 27 M 28 M
0 08 0 0
6133417 0761239 0049487 683E-06
2689 0588801 0199668 115E-04
6870925 0426543 0363734 0000585
1501538 021105 0573179 000192
297041 0079934 0705184 0004502
3564911 005351 0757795 0005854
4867485 0024103 0789235 0008408
600 0013094 0752509 0010127
Experiment 3 80 degC
Time s 25 M 27 M 28 M
171
0 1 0 0
5817383 0852929 015263 428E-05
2471834 0568389 0476974 589E-04
714048 0218624 0778816 0002633
1543583 0060192 089969 0006685
3038829 0006754 0944201 0014173
3720244 0002737 09556 001819
4765104 0000608 1009417 0023157
600 0000113 09467 0028902
Experiment 4 90 degC
Time s 25 M 27 M 28 M
0 1 0 0
5910759 0711158 0281532 172E-04
2420962 030002 070196 171E-03
6878985 0060896 0961462 0006075
1425421 0005202 1023471 0013823
2881599 555E-05 0935542 0027497
3644764 521E-06 0970668 0036328
4780807 143E-07 095015 0045819
600 179E-07 089561 0059331
723 Generated data set for the case study SNAr kinetics
Experiment 1
Time 210 M 212 M 213 M 214 M
0 1 0 0 0
0114724 0916317 0078593 0018182 249E-06
103049 0464119 0448791 0104213 0000125
2141533 0226584 0624128 0146157 0000376
3643057 0102715 0737636 0171082 0000744
172
7743801 0012971 0788209 0187458 0001768
1216477 0001476 0805589 018666 0002965
4403067 0 0816998 0186517 0010796
1072065 0 0801824 0178389 0026607
2551342 0 078187 0172065 0061291
4351342 0 0744149 0156488 0102055
600 0 0702123 0148841 0135997
Experiment 2
Time 210 M 212 M 213 M 214 M
0 12 0 0 0
0088864 1073662 0091451 00213 294E-06
0254455 0913278 0236597 0053222 217E-05
1152788 0407456 0638051 0147144 0000266
3171611 0093893 0900254 02064 0001032
939048 0001601 0959144 0228044 0003623
4041694 0 097195 021939 0016209
195366 0 0911133 0206891 0075681
3112192 0 0891022 0190707 0118451
4312192 0 0869047 0184739 015486
4912192 0 0861757 0175374 0176878
600 0 0839806 0165531 0209888
Experiment 3
Time 210 M 212 M 213 M 214 M
0 09 0 0 0
0091037 0797548 0079495 0018563 313E-06
0259823 0653654 0198581 0046012 219E-05
1158987 0239387 0538734 0122398 0000279
173
4175397 0013188 0712848 0169522 0001555
6793661 0001174 0728233 0166388 0002729
9757783 0 0717645 0170752 0003931
4449079 0 0719684 0164371 0019044
1956282 0 0666457 014927 0080022
3156282 0 0644589 0131672 0126933
4956282 0 0600784 0117343 0185606
600 0 0578163 0107537 0221849
73 Chapter 3
731 Phenyl acetate
7311 Preparation of feed solutions
Three feeds were used for this work and desired reservoir solutions were
prepared by dissolving the desired reagents in acetonitrile under stirring at
ambient conditions The first feed consisted of phenol (132 mL 015 mol 05
mol dm-3) and biphenyl (115 g 75 mmol 0025 mol dm-3) in acetonitrile (300
mL) the second feed contained acetyl chloride (225 mL 032 mol 105 mol dm-
3) the third feed was a 11 mixture of acetonitrile and water for dilution
7312 Flow ramp experiments
Linear gradient flow ramps allowed the generation of a complete reaction
profile from a single transient experiment To obtain transient data each of the
three pumps were initially set at the maximum flow rate to be investigated 175
mL min-1 Steady-state was established in the 35 mL reactor and the flow rate
for each pump decreased at a constant rate of 00181 mL min-1 for 92 minutes
Samples of reactor effluent were injected for HPLC analysis at 2 minute intervals
thus achieving a large data density The reactor setup schematic is shown in
Figure 731
174
Figure 731 The flow reactor setup for the phenyl acetate case study experiments
7313 HPLC Analysis
All HPLC analysis was conducted using an Agilent 1100 series HPLC
instrument fitted with a Sigma Ascentis Express C18 reverse phase column (5cm
x 46mm 27 microm) Biphenyl was used as an internal standard The column
temperature was 70 degC and the HPLC method is shown
Time min A (water 01
TFA)
B (acetonitrile
01 TFA) Flow rate mL min-1
000 50 50 2
150 20 80 2
151 50 50 2
An example HPLC chromatogram during a kinetic experiment is shown in
Figure 732
175
Figure 732 An example HPLC chromatogram in the phenyl acetate case study at 254 nm
7314 Validation with steady-state measurements
Steady-state measurements were taken at 1 3 5 7 9 11 13 and 15
minutes at both 65 degC and 75 degC Using the identified most likely reaction model
from the flow ramps the k values for the steady-state experiments were found to
be kSS-65 degC = 472 x 10-3 plusmn 001 x 10-3 M-1 s-1 kSS-75 degC = 929 x 10-3 plusmn 003 x 10-3
M-1 s-1 These k values give the steady-state kinetic parameters as kSS-65 degC =
472 x 10-3 plusmn 001 x 10-3 M-1 s-1 Ea-SS = 663 plusmn 05 kJ mol-1 which are very
comparable to the flow ramp evaluation of the kinetic parameters kR-65 degC =
00052 plusmn 00002 M-1 s-1 Ea-R = 693 plusmn 78 kJ mol-1 As the steady-state
measurements were taken without a dilution pump the concentrations are
different to that of the ramps hence the steady-state time-series concentration
data was normalised to match the concentrations from the ramps to show the
agreement in their nature in Figure 311
7315 Raw data
Flow ramp experiments
Flow ramp
measurements 65 degC 75 degC
τ min 38 M 310 M 38 M 310 M
102 01493 00072 01346 00262
104 01461 00095 01297 00269
106 01436 00104 01284 00260
108 01459 00119 01300 00262
111 01433 00121 01268 00287
114 01394 00128 01244 00304
116 01398 00135 01251 00310
119 01428 00144 01200 00322
122 01410 00150 01176 00340
125 01397 00142 01249 00304
129 01358 00140 01204 00334
132 01388 00168 01188 00369
176
136 01382 00166 01190 00405
140 01365 00170 01204 00315
144 01358 00182 01174 00408
149 01324 00173 01142 00392
153 01338 00188 01170 00383
158 01360 00194 01148 00395
164 01334 00204 01134 00426
170 01320 00213 01132 00406
176 01333 00223 01113 00430
182 01315 00232 01121 00456
189 01319 00220 01095 00445
197 01278 00228 01029 00523
205 01285 00260 01072 00501
214 01280 00334 01021 00554
224 01267 00287 01065 00524
235 01248 00305 00996 00603
247 01253 00309 00984 00566
260 01214 00338 00974 00575
274 01217 00297 00914 00661
290 01195 00360 00914 00620
308 01196 00379 00900 00654
328 01162 00408 00830 00762
351 01111 00444 00790 00774
377 01114 00452 00848 00739
406 01017 00527 00737 00722
441 01033 00536 00705 00843
481 00986 00559 00618 00981
528 00955 00598 00564 00962
583 00908 00678 00599 00985
649 00807 00704 00576 01039
177
729 00781 00770 00488 01150
824 00705 00835 00421 01160
940 00662 00921 00360 01223
1079 00587 00981 00249 01358
Steady state experiments
Steady-state
measurements 65 degC 75 degC
τ min 38 M 310 M 38 M 310 M
102 01771 00177 01591 00387
308 01461 00470 01183 00824
481 01214 00736 00858 01123
649 01050 00940 00625 01370
900 00844 01155 00419 01567
1101 00717 01263 00297 01715
1301 00559 01384 00218 01822
1502 00512 01488 00177 01886
Normalised steady state experiments
Steady-state
measurements
(normalised)
65 degC 75 degC
τ min 38 M 310 M 38 M 310 M
102 01417 00142 01273 00310
308 01169 00377 00947 00660
481 00971 00590 00686 00898
649 00840 00753 00500 01096
900 00675 00926 00335 01253
1101 00573 01012 00238 01372
178
1301 00447 01109 00174 01458
1502 00409 01192 00142 01509
732 Paracetamol
7321 Preparation of feed solutions
For the work at the temperature of 30 degC two feeds were used and
desired reservoir solutions were prepared by dissolving the desired reagents in
acetonitrile under stirring at ambient conditions The first feed consisted of 4-
aminophenol (058 mL 6 mmol 002 mol dm-3) and biphenyl (115 g 75 mmol
0025 mol dm-3) in acetonitrile (300 mL) the second feed contained acetic
anhydride (085 mL 9 mmol 003 mol dm-3) in acetonitrile (300 mL)
For the work at the temperature of 60 degC two feeds were used and
desired reservoir solutions were prepared by dissolving the desired reagents in
acetonitrile under stirring at ambient conditions The first feed consisted of 4-
aminophenol (044 mL 45 mmol 0015 mol dm-3) and biphenyl (115 g 75
mmol 0025 mol dm-3) in acetonitrile (300 mL) the second feed contained acetic
anhydride (085 mL 9 mmol 003 mol dm-3) in acetonitrile (300 mL)
For the work at the temperature of 160 degC two feeds were used and
desired reservoir solutions were prepared by dissolving the desired reagents in
acetonitrile under stirring at ambient conditions The first feed consisted of 4-
aminophenol (101 mL 105 mmol 0035 mol dm-3) and biphenyl (115 g 75
mmol 0025 mol dm-3) in acetonitrile (300 mL) the second feed contained acetic
anhydride (298 mL 315 mmol 0105 mol dm-3) in acetonitrile (300 mL)
For the work at the temperature of 180 degC two feeds were used and
desired reservoir solutions were prepared by dissolving the desired reagents in
acetonitrile under stirring at ambient conditions The first feed consisted of 4-
aminophenol (261 mL 27 mmol 009 mol dm-3) and biphenyl (115 g 75 mmol
0025 mol dm-3) in acetonitrile (300 mL) the second feed contained acetic
anhydride (533 mL 564 mmol 019 mol dm-3) in acetonitrile (300 mL)
7322 Flow ramp experiments
For the work at the temperature of 30 degC a 025 mL reactor was used
For the work at the temperature of 60 degC a 05 mL reactor was used For the
179
work at the temperatures of 160 degC and 180 degC a 35 mL reactor was used
Linear gradient flow ramps allowed the generation of complete reaction profiles
from a single transient experiment To obtain transient data each of the two
pumps were initially set at the maximum flow rate to be investigated 175 mL
min-1 Steady-state was established and the flow rate for each pump decreased
at a constant rate of 00181 mL min-1 for 92 minutes Samples of reactor effluent
were injected for HPLC analysis at 2 minute intervals thus achieving a large data
density The reactor setups for each of these 4 reactions are shown in Figures
733 - 736 For the higher temperature reactions 160 degC and 180 degC 4-
aminophenol is used and assumed to react instantaneously to form paracetamol
based on the kinetics observed at lower temperatures
Figure 733 The reactor setup for the paracetamol flow ramp experiment at 30 degC
180
Figure 734 The reactor setup for the paracetamol flow ramp experiment at 60 degC
Figure 735 The reactor setup for the paracetamol flow ramp experiment at 160 degC
Figure 736 The reactor setup for the paracetamol flow ramp experiment at 180 degC
7323 HPLC analysis
All HPLC analysis was conducted using an Agilent 1100 series HPLC
instrument fitted with a Sigma Ascentis Express C18 reverse phase column (5cm
x 46mm 27 microm) Biphenyl was used as an internal standard The column
temperature was 70 degC and the HPLC method is shown
Time min A (water 01
TFA)
B (acetonitrile
01 TFA) Flow rate mL min-1
000 50 50 2
150 20 80 2
151 50 50 2
An example HPLC chromatogram showing the separation and analysis of
all components at once - these species were each added to the same solution
for method development
181
Figure 737 An example HPLC chromatogram from the paracetamol case study showing the
separation of all reaction components at 254 nm
7324 Raw data
Flow ramp experiment 1 30 degC
τ s 312 M 314 M 315 M
428 000698 000267 0
437 000722 000266 0
447 000766 000284 0
457 000716 000287 0
467 000688 000278 0
478 000749 000306 0
489 000717 000299 0
501 000715 000317 0
513 000685 000273 0
526 000727 000320 0
540 000622 000296 0
555 000635 000337 0
570 000643 000374 0
586 000639 000446 0
603 000623 000401 0
182
621 000643 000391 0
640 000600 000385 0
645 000654 000378 0
683 000613 000368 0
706 000519 000376 0
731 000592 000455 0
758 000585 000481 0
787 000554 000410 0
818 000564 000432 0
851 000503 000429 0
888 000568 000493 0
927 000441 000444 0
971 000444 000506 0
1019 000416 000513 0
1071 000446 000556 0
1129 000413 000575 0
1194 000440 000546 0
1267 000483 000566 0
1349 000452 000564 0
1443 000353 000601 0
1550 000276 000588 0
1675 000370 000654 0
1820 000325 000720 0
1994 000229 000676 0
2202 000214 000686 0
2459 000239 000770 0
2781 000178 000878 0
3197 000221 000826 0
3900 000171 000848 0
4518 000145 000871 0
183
Flow ramp experiment 2 60 degC
τ s 312 M 314 M 315 M
875 0003048 0004234 0
894 0003702 0003846 0
913 0003852 0003772 0
955 0003402 0003918 0
978 0003071 0003860 0
1002 0002944 0004318 0
1027 0003195 0004243 0
1053 0003084 0004111 0
1080 0003046 0004262 0
1109 0003112 0004330 0
1140 0002925 0004253 0
1172 0002919 0004464 0
1206 0002921 0004562 0
1243 0002741 0004796 0
1281 0002612 0004906 0
1290 0002480 0004399 0
1366 0002481 0004597 0
1412 0002545 0004952 0
1462 0002325 0004951 0
1516 0002416 0004964 0
1573 0002407 0005149 0
1635 0002401 0005027 0
1702 0002710 0004966 0
1775 0002157 0005196 0
1855 0002382 0005121 0
1942 0002037 0005228 0
184
2037 0002221 0005387 0
2142 0001760 0005411 0
2259 0001446 0005728 0
2389 0001541 0005809 0
2534 0001507 0005924 0
2699 0001471 0005553 0
2886 0001147 0005686 0
3100 0001304 0006117 0
3349 0001168 0005719 0
3641 0001018 0006181 0
3987 0000916 0006444 0
4405 0000976 0006104 0
4918 0001025 0006840 0
Flow ramp experiment 3 160 degC
τ min 312 M 314 M 315 M
125 0 001766 000056
129 0 001737 000054
132 0 001786 000038
136 0 001789 000042
140 0 001722 000061
144 0 001738 000055
149 0 001779 000059
153 0 001807 000068
158 0 001794 000064
164 0 001722 000067
170 0 001734 000072
176 0 001792 000077
185
182 0 001738 000076
189 0 001755 000081
197 0 001738 000074
205 0 001785 000102
214 0 001762 000086
224 0 001801 000105
235 0 001753 000111
247 0 001793 000102
260 0 001763 000123
274 0 001672 000118
308 0 001736 000124
328 0 001728 000160
351 0 001635 000153
377 0 001696 000174
406 0 001670 000199
441 0 001536 000187
481 0 001590 000222
528 0 001614 000263
583 0 001482 000258
649 0 001454 000317
729 0 001474 000331
824 0 001407 000355
940 0 001315 000386
1079 0 001292 000412
Flow ramp experiment 4 180 degC
τ min 312 M 314 M 315 M
104 0 003703 000456
186
106 0 003829 000519
108 0 003746 000652
111 0 003910 000557
114 0 003812 000656
116 0 003894 000592
119 0 003622 000877
122 0 003941 000625
125 0 003733 000754
129 0 003798 000713
132 0 003861 000717
136 0 003606 000930
140 0 003615 000890
144 0 003655 000870
149 0 003584 000854
153 0 003765 000893
158 0 003480 001017
164 0 003459 001078
170 0 003522 001035
176 0 003357 001114
182 0 003407 001127
189 0 003598 000927
197 0 003491 000963
205 0 003546 001197
214 0 003307 001152
224 0 003586 001004
235 0 003600 001103
247 0 003364 001246
260 0 003717 000943
187
274 0 003256 001202
290 0 003278 001151
308 0 003298 001160
328 0 003304 001311
351 0 003179 001295
377 0 003002 001227
406 0 003024 001543
441 0 003117 001338
481 0 003076 001426
528 0 002431 001748
583 0 002326 001784
649 0 002665 001973
729 0 002265 001803
824 0 001960 002426
940 0 001780 002347
1079 0 001594 002903
733 Metoprolol
7331 AstraZeneca experimental setup
All AstraZeneca experiments were conducted using a tubular reaction vessel
(Polar Bear Plus) using PTFE tubing (1 mm ID) Reagents were pumped using
JASCO PU-4180 dual piston HPLC pumps and flow streams were mixed using
Swagelok SS-100-3 tee-pieces Sampling was conducted by using a VICI Valco
EUDA-CI4W5 sample loop with a 006 microL aliquot volume The reaction system
was maintained under a fixed back pressure using an Upchurch Scientific 150
psi back pressure regulator Quantitative analysis was performed using an
Agilent 1100 series HPLC instrument fitted with an Acquity C18 reverse phase
column (3 cm x 46 mm 17 microm) This setup is shown in Figure 638 In all
experiments biphenyl was added to one reservoir as an internal standard
188
Figure 738 A photograph of the automated flow system at AstraZeneca
7332 Preparation of feed solutions
For the Leeds experiments two feeds were used for the flow ramps and
desired reservoir solutions were prepared by dissolving the desired reagents in
acetonitrile under stirring at ambient conditions The first feed consisted of 2-((4-
(2-methoxyethyl)phenoxy)methyl)oxirane (SM) (5676 mL 03 mol 1 mol dm-3)
and biphenyl (115 g 75 mmol 0025 mol dm-3) in acetonitrile (300 mL) the
second feed contained isopropylamine (1546 mL 018 mol 06 mol dm-3) in
acetonitrile (300 mL)
For the AstraZeneca experiments two feeds were used for the flow
ramps and desired reservoir solutions were prepared by dissolving the desired
reagents in acetonitrile under stirring at ambient conditions The first feed
consisted of 2-((4-(2-methoxyethyl)phenoxy)methyl)oxirane (SM) (5676 mL 03
mol 1 mol dm-3) and biphenyl (115 g 75 mmol 0025 mol dm-3) in acetonitrile
(300 mL) the second feed contained isopropylamine (5153 mL 09 mol 3 mol
dm-3) in acetonitrile (300 mL)
7333 Flow ramp experiments
189
For the Leeds experiments a 35 mL reactor was used Linear gradient
flow ramps allowed the generation of complete reaction profiles from a single
transient experiment To obtain transient data each of the two pumps were
initially set at the maximum flow rate to be investigated 175 mL min-1 Steady-
state was established and the flow rate for each pump decreased at a constant
rate of 00181 mL min-1 for 92 minutes Samples of reactor effluent were injected
for HPLC analysis at 4 minute intervals thus achieving a large data density This
reactor setup is shown in Figure 739
Figure 739 The reactor setup for the metoprolol flow ramp experiments at 190210 degC in
Leeds
For the AstraZeneca experiments a 5 mL reactor was used Linear gradient flow
ramps allowed the generation of complete reaction profiles from a single
transient experiment To obtain transient data each of the two pumps were
initially set at the maximum flow rate to be investigated 125 mL min-1 Steady-
state was established and the flow rate for each pump decreased at a constant
rate of 00125 mL min-1 for 96 minutes Samples of reactor effluent were injected
for HPLC analysis at 6 minute intervals thus achieving a large data density This
reactor setup is shown in Figure 7310
190
Figure 7310 The reactor setup for the metoprolol flow ramp experiments at 130150 degC at
AstraZeneca
7334 HPLC analysis
All HPLC analysis was conducted using an Agilent 1100 series HPLC
instrument fitted with a Sigma Ascentis Express C18 reverse phase column (5cm
x 46mm 27 microm) Biphenyl was used as an internal standard The column
temperature was 40 degC and the HPLC method is shown
Time min A (water 01
TFA)
B (acetonitrile
01 TFA) Flow rate mL min-1
000 77 23 2
300 10 90 2
400 10 90 2
410 77 23 2
An example HPLC chromatogram during a kinetic experiment is shown in
Figure 7311
Figure 7311 An example HPLC chromatogram during a kinetic experiment in the metoprolol
case study at 220 nm
7335 Cost evaluation
Using the Leeds experimental setup outlined in Chapter 32 and current
pricing for the starting material used in the Metoprolol work (pound80725 g)[239] it has
been shown that this kinetic approach used less material and was cheaper to
implement than other standard industrial optimisation techniques
As the starting material is the most expensive reaction component by a
large margin this was the only factor taken into consideration - other costs were
not considered eg solvent isopropylamine energy etc It is assumed that a 1
M solution of starting material is used and so the cost associated for every 1 mL
of this solution used (0208 g 1 mmol) is pound671 It is also assumed that 2 reactor
volumes are consumed prior to all steady-state reactions and all reactions were
191
conducted using a 35 mL reactor The addition of skilled labour and time have
not been considered but would incur significantly higher costs for these other
techniques as this technique only requires the initial setup of the reservoirs and
reactor because everything else is automated
Technique What is required Solution
usage mL Cost pound
Flow ramps
4 x linearly decreasing flow ramps from
175 mL min-1 decreasing at a rate of
00181 mL min-1 for 92 minutes
340 pound2281
Steady-state
kinetics 4 sets of 16 steady-state experiments 420 pound2818
Design of
Experiments
study
One screening design (19 steady-state
experiments) and one optimisation design
(81 steady-state experiments) to consider
the factors of temperature residence time
starting material equivalents and
isopropylamine equivalents
700 pound4697
7336 Raw data
Flow ramp experiment 1 130 degC
τ min 317 M 319 M 320 M
210 0435 0053 0000
224 0427 0056 0000
240 0423 0060 0000
258 0417 0064 0000
371 0381 0102 0000
416 0397 0088 0000
472 0383 0099 0000
545 0369 0110 0000
641 0362 0123 0000
773 0347 0146 0001
961 0286 0206 0002
Flow ramp experiment 2 150 degC
192
τ min 317 M 319 M 320 M
200 0358 0116 0000
210 0357 0125 0000
224 0350 0135 0001
240 0347 0144 0001
258 0340 0153 0001
280 0333 0166 0001
305 0311 0178 0002
335 0299 0193 0002
371 0269 0207 0002
416 0259 0234 0003
472 0233 0251 0003
545 0208 0287 0004
641 0169 0284 0005
773 0144 0327 0006
Flow ramp experiment 3 190 degC
τ min 317 M 319 M 320 M
255 0340 0117 0004
269 0328 0121 0005
284 0321 0126 0006
302 0320 0132 0006
321 0309 0138 0007
343 0307 0137 0007
368 0305 0150 0008
397 0299 0152 0009
430 0294 0161 0010
470 0284 0171 0012
517 0270 0176 0014
573 0261 0183 0016
643 0254 0186 0018
730 0246 0190 0021
842 0232 0211 0025
986 0213 0217 0028
Flow ramp experiment 4 210 degC
τ min 317 M 319 M 320 M
250 0305 0166 0012
193
263 0299 0165 0013
278 0294 0172 0014
295 0294 0172 0015
314 0282 0182 0017
335 0279 0186 0019
360 0269 0190 0021
388 0272 0201 0023
421 0247 0221 0030
460 0236 0218 0028
506 0230 0219 0032
562 0218 0222 0038
630 0231 0211 0042
716 0201 0235 0045
825 0188 0235 0051
968 0182 0239 0058
74 Chapter 4
741 Generated data set for the case study SNAr kinetics
Experiment 1
Time s 45 M 47 M 48 M 49 M
0 1 0 0 0
104232 0912548 0068648 0002878 279E-05
5078096 0715174 0266199 0011023 0000485
1475526 0464384 0521723 0020875 0002315
3331443 0269972 0708549 002876 0006042
5628294 0168854 080687 0031878 0009439
9017797 0099139 0856211 003494 0013887
2108206 0032979 088963 0036126 0024236
3328275 0015074 0929082 0036808 003211
4382468 0008534 0933212 0036452 0037487
600 0004209 0921486 0036363 0043389
194
Experiment 2
Time s 45 M 47 M 48 M 49 M
0 08 0 0 0
1302612 0703325 0092533 0003854 627E-05
5712155 0478466 0312694 0012573 0000883
1084263 0329335 044882 0018183 0002403
2064908 0176938 0596415 0023908 0005922
6941793 0014924 0723646 0029388 0023796
1516461 0000354 0725866 0029244 0051839
3009398 380E-07 066851 0026369 0099546
5153318 0 0621532 0024249 0155196
9253113 0 0545081 0019839 0239656
1200 0 0506326 0018372 0288136
Experiment 3
Time s 45 M 47 M 48 M 49 M
0 1 0 0 0
0962483 0873362 0112646 0004695 780E-05
1002158 0342803 0632465 0025508 0004215
2106925 0138132 0817645 0033569 001147
6078714 0008667 0899281 0037403 0036358
1010498 0000643 0895452 003658 0061674
1727609 714E-06 0851082 0034174 0101391
3082939 0 0806696 0030438 017491
5621972 0 069294 0025835 0270209
9040341 0 0598858 0021781 0384583
1600 0 0457229 0015241 0527733
Experiment 4
Time s 45 M 47 M 48 M 49 M
195
0 1 0 0 0
1044725 0854673 0149213 0006087 0000139
509551 0460925 0515756 0020548 0002257
2132233 0072138 0877848 0035074 0017175
4714859 0005208 0917717 0036551 0041614
6931167 00006 0887854 0035809 0061604
1280495 225E-06 086418 0033593 0115427
2886839 0 0741762 002754 0232766
7368751 0 0519088 0018297 0455041
1222483 0 0381306 0012248 060453
1800 0 0274267 0007936 0705143
Experiment 5
Time s 45 M 47 M 48 M 49 M
0 12 0 0 0
0849478 0999855 0175423 0007178 0000158
5548213 0466871 0712408 0028769 0004137
1181201 0191904 0969199 0039345 0012093
3500272 0010569 110712 0045047 0044862
911267 147E-05 1038677 0040673 0119288
1237999 690E-07 1005138 0040148 0158185
1953324 0 0920941 003614 0234604
4831808 0 0709117 0024989 0478645
632278 0 0609582 0021143 0562277
900 0 0502989 0016122 0680497
742 Generated data set for the case study Pentyne
Experiment 1
Time min 411 M 412 M 413 M
0 1 08 0
196
1293971 0973192 0803545 0011085
3972297 0958388 0766506 0033251
1843854 0857109 0663378 0141812
3290479 0770748 054892 0246498
5690479 0629294 0416498 0388829
9290479 0449379 025987 0548273
120 0369111 0164188 0644284
Experiment 2
Time min 411 M 412 M 413 M
0 12 15 0
1205027 1199383 1460822 0012139
3721389 1157799 1439238 0037013
1802628 1036602 1347405 0171608
5033117 077347 1092225 0421136
8633117 0582851 0871663 0614124
1403312 0359291 0678145 0833511
180 0259447 0551321 0936175
Experiment 3
Time min 411 M 412 M 413 M
0 1 1 0
1293971 0994904 0974041 0010778
3972297 0975053 0966892 0033053
1843854 086422 0871237 0145646
3290479 0750116 0752064 0246904
8090479 0508082 0506177 0504648
1529048 0276204 0271468 072687
240 0129659 0132753 0856012
197
743 Generated data set for the case study Ytterbium catalysis
Experiment 1
Time h 415 M 416 M 418 M
0 2 2 0
0054397 1950736 1962883 0040294
0386129 1737689 1725949 026888
0701874 1545843 1542334 0459994
1901874 0986091 0979723 1020241
3101874 0631223 0628196 136402
4301874 040357 0400764 1596431
6 0213539 0212908 1784115
Experiment 2
Time h 415 M 416 M 418 M
0 15 2 0
0029722 1499822 2000933 0004169
02413 1470961 1962226 0033316
0911826 1373396 1881085 0122394
1511826 1302576 1805505 0196746
2711826 1164105 1659122 0336104
3911826 1042952 1535555 0457449
6 085898 1357163 0642853
Experiment 3
Time h 415 M 416 M 418 M
0 14 18 0
0027487 1370804 1774104 003184
0106977 1284762 1675632 012038
0249912 114023 1539842 0264912
198
092138 0646932 1043942 0752256
152138 0389843 0794653 1012081
212138 0235788 0635663 1164374
3 0112972 0511689 1287393
Experiment 4
Time h 415 M 416 M 418 M
0 22 16 0
0043551 2153819 153798 005486
0241672 1906782 1311278 0288655
0439793 1706777 1105476 049592
0839793 1351856 0751683 0854071
1239793 1066839 0466383 1129747
1639793 0846621 0246217 1354339
2 0682943 0085826 1509085
75 Chapter 5
751 SNAr kinetics
7511 Experimental equipment
All experiments were run in an NMR tube using a dedicated 500 MHz
NMR spectrometer at The University of Cambridge as shown in Figure 751
199
Figure 751 The dedicated NMR spectrometer used for kinetic experiments in the SNAr
kinetics case study
7512 Kinetic experiments
In each experiment 246-trichloropyrimidine (700 microL 200 mM in CD3OD)
was warmedcooled to the required temperature in the 500 MHz NMR
spectrometer The NMR was then locked onto the solvent then the probe was
tuned and matched to the 1H nuclei then shimming ensued The spectrum of the
200 mM solution of 246-trichloropyrimidine was acquired
To this NMR tube a pre-cooledwarmed solution of CD3OD containing
200 mM ethyl 4-aminobutyrate hydrochloride and 600 mM Et3N (700 microL) was
added and mixed thoroughly by shaking the NMR tube This gave the desired
reaction concentration of 100 mM pyrimidine 100 mM amine and 300 mM Et3N
Spectra were acquired every ~80 seconds The software was used in each case
to obtain absolute integrals for each peak which were then converted to
200
concentrations based on the 246-trichloropyrimidine solution of known
concentration
7513 Example NMR spectra
An example lsquostackedrsquo NMR spectrum is shown in Figure 752 showing
the appearancedisappearance of peaks over time in the 25 degC experiment
Where the peak at 780 ppm corresponds to 246-trichloropyrimidine 666 ppm
corresponds to the 2-substituted product and 641 corresponds to the 4-substited
product
Figure 752 lsquoStackedrsquo NMR spectrum showing several NMR spectra over time in the 25 degC
experiment
7514 Raw data
Experiment 1 -25 degC
Time min 51 M 53 M 54 M
1455 0088818 0004156 0004562
1591667 0088538 0004229 0004611
1726667 0088465 0004295 0004727
1863333 0088063 0004362 0004842
1998333 008805 0004577 0004908
201
2133333 0087811 0004609 0004962
227 0087412 0004713 0005096
2405 0087133 0004827 0005202
2541667 0086922 0004901 0005268
2676667 008667 0004993 0005345
2813333 0086501 0005049 0005407
2948333 0086142 0005142 0005518
3083333 0085983 0005268 0005704
322 0085639 0005412 0005803
3355 0085286 0005468 0005826
3491667 0085108 0005589 000596
3626667 0084887 0005646 0005947
3763333 0084482 0005781 0006102
3898333 0084308 0005902 0006179
4035 0083927 0005914 000626
417 0083758 0006021 000639
4306667 0083386 0006157 0006496
4441667 0083205 0006154 0006574
4576667 0083093 0006298 0006627
4713333 008282 0006377 0006689
4848333 0082663 0006475 0006751
4985 0082501 0006492 0006786
512 0082273 000655 0006939
5256667 008206 0006658 0006902
5391667 008186 0006786 0007038
5526667 0081225 0006729 0007105
Experiment 2 0 degC
Time min 51 M 53 M 54 M
202
7333333 0072103 0007607 0008513
88 0070344 0008018 0008965
1016667 0068594 0008452 0009462
1151667 0068423 0008887 0009854
1288333 0066803 0009266 001028
1423333 0065829 0009635 0010682
156 0064594 0010002 0011061
1695 0063823 0010341 0011471
1831667 0062319 0010702 0011804
1966667 0061394 0010984 0012177
2101667 0060906 0011342 0012486
2238333 0059741 0011585 0012806
2373333 0058765 001182 0013095
251 0058315 0012151 0013445
2645 0057463 001241 0013671
278 0056496 0012685 0013978
2916667 0056066 00129 0014287
3051667 0055037 0013136 001449
3188333 0054482 0013382 0014789
3323333 0053852 0013629 0015023
3458333 0053151 0013804 0015225
3595 0052684 0014054 001548
373 0052192 0014261 0015707
3866667 005156 0014409 001589
4001667 0051008 0014613 0016133
4136667 0050399 0014842 0016311
4273333 0049812 0015017 0016498
4408333 0049557 0015136 0016666
4545 0048743 0015301 0016861
468 0048366 0015482 0017042
203
4816667 0047763 0015635 001723
4951667 0047326 0015831 0017433
5086667 0046947 0015973 0017573
5223333 0046384 0016088 0017747
5358333 0045991 0016243 0017903
5495 0045672 0016393 0018043
563 0045107 0016496 0018225
5766667 0044674 0016691 0018395
5901667 0044423 0016839 0018509
6036667 0044113 0016972 0018683
6173333 0043619 0017086 001884
Experiment 3 25 degC
Time min 51 M 53 M 54 M
3366667 0064314 0009652 0009883
48 0057052 0012118 0012863
615 0051792 0013813 0014922
75 0047939 0015186 0016476
8866667 0044748 0016215 0017819
1021667 0041922 0017079 0018798
1158333 0039664 0017878 0019678
1293333 0037598 0018491 0020463
1428333 0035777 0019052 0021122
1565 0034195 0019558 0021718
17 0032928 0019875 0022181
1836667 0031709 0020362 0022676
1971667 0030632 0020622 0023126
2106667 0029623 0020886 0023404
2243333 0028668 002128 0023818
204
2378333 0027704 0021452 002409
2515 0026937 0021641 0024389
265 0026303 0021884 0024635
2786667 0025572 0022112 0024925
2921667 0024988 0022265 0025126
3056667 0024358 0022417 0025261
3193333 0023747 0022601 0025533
3328333 0023156 0022788 0025713
3463333 0022678 0022896 0025943
36 0022158 0022984 0026042
3735 0021731 0023193 0026254
3871667 0021252 0023299 0026356
4006667 0020811 0023542 0026561
4143333 0020451 0023635 0026706
4278333 0019954 0023675 0026824
4413333 001972 0023743 0026953
455 0019374 0023807 0027033
4685 0019129 0023925 0027167
4821667 0018686 0024057 0027249
4956667 0018359 0024079 0027301
5093333 0018011 0024171 0027439
5228333 0017894 0024265 0027549
5363333 0017535 0024319 0027649
55 0017377 0024477 0027784
5635 001712 0024351 0027716
5771667 0016878 0024502 0027857
Experiment 4 50 degC
Time min 51 M 53 M 54 M
205
335 0044859 0017049 0028158
5066667 0033058 0020402 0034142
6416667 0028533 0021812 0036713
7766667 0025543 0022842 0038521
9133333 0022916 00235 0039813
105 0021041 0024107 004121
1185 0019498 0024602 0041829
132 0018156 0025096 0042681
1456667 0016918 0025264 0043145
1591667 0015895 0025503 0043496
1728333 0015031 0025778 0043978
1863333 0014386 0025935 0044504
20 0013754 0026166 0044669
2135 0013006 0026135 0045027
227 0012731 002645 004525
2406667 0012071 0026529 0045439
2541667 0011723 0026593 0045892
2678333 0011273 0026724 0046128
2813333 001075 0026737 004605
295 0010443 0026863 0046276
3085 0010126 0026964 0046178
3221667 0009967 0027158 0046613
3356667 0009483 00272 0046695
3493333 0009351 0027183 0047223
3628333 0009066 0027134 0047014
3763333 0008787 0027312 0047229
39 0008496 0027291 0047245
4035 000833 0027346 0047363
4171667 000802 0027313 0047267
4306667 0007943 0027459 0047585
206
4443333 0007797 0027504 0047612
4578333 0007612 0027442 0047469
4713333 0007363 0027731 0047777
485 0007162 0027549 0047689
4985 0007122 0027588 0047921
512 0006956 0027672 0048034
5256667 0006869 0027621 0047948
5391667 0006654 002781 0048184
5528333 0006511 0027703 0048181
5663333 0006367 0027739 0048193
5798333 0006367 0027751 0048241
752 PfBr
7521 Synthesis of PfBr material
To synthesise the PfBr material the synthesis reported by Tian and
Menard was approximately followed[249] To a suspension of magnesium turnings
(92 g 382 mmol) in anhydrous THF (5 mL) in a nitrogen atmosphere was added
05 mL of bromobenzene at room temperature to initiate the reaction The
reaction vessel was cooled to 0 degC using an ice bath and a solution of
bromobenzene in THF (12 M 270 mL) was added dropwise at 0 degC The reaction
medium was allowed to reach room temperature and stirred vigorously for 2
hours To this solution was added 9-fluorenone (301 g 186 mmol) in small
portions left to stir at room temperature for 1 hour The reaction was quenched
with dropwise addition of hydrochloric acid (1 M 100 mL) at 0 degC The solution
was extracted with Et2O (3 x 150 mL) and the combined organic layer was
washed with brine dried over MgSO4 filtered and concentrated under reduced
pressure to yield PfOH (426 g 89 ) NMR IR and mass spectroscopy analysis
confirmed the identity of the material
To prepare PfBr PfOH (361 g 140 mmol) was dissolved in toluene (150
mL) and aqueous HBr (48 ww 50 mL) was added at room temperature This
suspension was stirred vigorously at room temperature for 48 hours with the
vessel wrapped in foil to reduce light The mixture was extracted with toluene (3
207
x 100 mL) then the combined organic layer was washed with brine dried over
MgSO4 filtered and concentrated under reduced pressure to afford the crude
product The product was then recrystallised with hexane to afford PfBr (39 g 87
) 13C NMR IR and HPLC analysis confirmed the identity and purity of the
material as shown in Figure 753 Figure 754 and Figure 755 respectively
Figure 753 A 13C NMR confirming the presence of the PfBr material compared to literature
values to identify the material[249]
208
Figure 754 IR analysis of the PfBr material showing the absence of a hydroxy peak from any
residual PfOH
Figure 755 HPLC analysis of the PfBr material at 254 nm indicating that a pure product is
present
7522 Kinetic experiments
Three kinetic experiments were run at different temperatures 30 degC 35
degC and 40 degC For the first experiment at 30 degC alanine methyl ester
hydrochloride (0940 g 0007 mol) biphenyl (0195 g 0001 mol) and potassium
phosphate (35 g 0017 mol) were added to 5050 acetonitriledichloromethane
(375 mL) in a vessel A solution was then prepared of PfBr (0958 g 0003 mol)
in 5050 acetonitriledichloromethane (375 mL) and added to the reaction
vessel A sample was then immediately taken via HPLC then the stopwatch was
started to track the time of each injection This first HPLC serves as the artificial
209
zero time point then each subsequent HPLC injection followed every ~10
minutes thereafter
For the second experiment at 35 degC alanine methyl ester hydrochloride
(0977 g 0007 mol) biphenyl (0199 g 0001 mol) and potassium phosphate
(35 g 0017 mol) were added to 5050 acetonitriledichloromethane (375 mL)
in a vessel A solution was then prepared of PfBr (1017 g 0003 mol) in 5050
acetonitriledichloromethane (375 mL) and added to the reaction vessel A
sample was then immediately taken via HPLC then the stopwatch was started
to track the time of each injection This first HPLC serves as the artificial zero
time point then each subsequent HPLC injection followed every ~10 minutes
thereafter
For the third experiment at 40 degC alanine methyl ester hydrochloride
(0841 g 0006 mol) biphenyl (0219 g 0001 mol) and potassium phosphate
(35 g 0017 mol) were added to 5050 acetonitriledichloromethane (375 mL)
in a vessel A solution was then prepared of PfBr (1064 g 0003 mol) in 5050
acetonitriledichloromethane (375 mL) and added to the reaction vessel A
sample was then immediately taken via HPLC then the stopwatch was started
to track the time of each injection This first HPLC serves as the artificial zero
time point then each subsequent HPLC injection followed every ~10 minutes
thereafter
7523 HPLC analysis
All HPLC analysis was conducted using an Agilent 1100 series HPLC
instrument fitted with a Sigma Ascentis Express C18 reverse phase column (5cm
x 46mm 27 microm) Biphenyl was used as an internal standard The column
temperature was 40 degC and the HPLC method is shown
Time min A (water 01
TFA)
B (acetonitrile
01 TFA) Flow rate mL min-1
000 80 20 1
700 15 85 1
800 15 85 1
810 80 20 1
210
An example HPLC chromatogram during a kinetic experiment is shown in
Figure 756
Figure 756 An example HPLC chromatogram at 230 nm during a kinetic experiment in the
PfBr case study
7524 Raw data
Experiment 1 30 degC
Time min 57 M 58 M
0 0029401 0009756
95 0028029 0011516
195 0026429 0013131
29 0024664 0014922
40 0022779 0016856
50 0021252 0019153
605 0019363 0020372
71 0017813 0022065
83 001612 0023823
Experiment 2 35 degC
Time min 57 M 58 M
0 0036314 0006684
95 0030494 0011469
20 0028083 001372
315 0025271 0016536
41 0023355 0018562
211
51 0021259 0020741
625 0017572 0023705
Experiment 3 40 degC
Time min 57 M 58 M
0 0037032 0005772
105 0029931 0013994
205 0026302 0017446
305 0022947 002101
40 0020038 0023665
505 0017687 0025741
605 0016003 0027979
753 Maleic acid
7531 Example NMR
An example NMR spectrum is shown in Figure 754 where the peaks of
each species are highlighted
212
Figure 757 An example NMR spectrum from the maleic acid case study
7532 Raw data
Experiment 1 40 degC
Time min 513 M 515 M 516 M
0 0761 0 0
120 066207 0097408 0002283
240 0554769 0201665 0004947
360 0485518 0265589 0009893
Experiment 2 50 degC
Time min 513 M 515 M 516 M
0 0404344 0003268 0
325 0364451 0037657 186E-05
605 0346181 0071026 0000373
875 0319523 0095447 0001659
1225 0299017 0113343 0003225
2175 0234143 01661 0006264
2885 0204502 0198537 0009507
4175 015883 0230601 0015846
6875 0107378 0276833 0028336
13425 0052198 0313931 0053689
17825 0033649 0310389 0063196
28375 001799 0307033 0083516
Experiment 3 50 degC
Time min 513 M 515 M 516 M
0 0787537 0007088 0
28 0706604 0088537 565E-04
60 0625073 0164707 0002563
213
95 0556919 0226165 0006126
118 0530477 0271021 0007904
148 0480567 0308812 0011678
178 0426661 0316753 001425
208 0405376 035592 0020026
242 0384453 0382377 0021991
298 0344452 0431289 0029072
358 0299951 0456885 0034314
613 0205957 0541791 0061416
1306 0092916 0582232 0105274
1549 0076529 0596801 0119691
1768 0063259 0597105 0130915
Experiment 4 55 degC
Time min 513 M 515 M 516 M
0 0687045 0103644 0000811
30 0597449 019108 297E-03
60 0531145 0252908 0007448
90 0479052 0301502 0010947
168 0365378 0402913 0023209
228 031788 0443385 0030235
283 028467 0469404 0037426
348 0221288 0520375 0049837
408 0200913 0533579 0057007
Experiment 4 60 degC
Time min 513 M 515 M 516 M
0 0738693 0014307 0
60 0442764 0296682 136E-02
214
120 0335085 0389301 0029367
180 0265809 0447282 0040662
240 0224394 0475143 0053463
360 0117468 0551196 0084336
480 0070029 0575292 0107679
1320 0015813 0538395 0198792
76 Computational setup
761 Chapter 2 - 3
For all computation in Chapter 2 - 3 MATLAB 2018a was used on a
desktop computer with a 4-core Intel i5-2310 processor
762 Chapter 4 - 5
For all computation in Chapter 4 - 5 MATLAB 2020a was used on a
custom built laptop with an 8-core AMD Ryzen 7 4800H processor
Chapter 8 References
1 Miyaura N K Yamada and A Suzuki A new stereospecific cross-coupling by the palladium-catalyzed reaction of 1-alkenylboranes with 1-alkenyl or 1-alkynyl halides Tetrahedron Letters 1979 20(36) p 3437-3440
2 Sonogashira K Y Tohda and N Hagihara A convenient synthesis of acetylenes catalytic substitutions of acetylenic hydrogen with bromoalkenes iodoarenes and bromopyridines Tetrahedron Letters 1975 16(50) p 4467-4470
3 Wittig G and W Haag Uumlber Triphenyl‐phosphinmethylene als olefinbildende Reagenzien (II Mitteil 1) Chemische Berichte 1955 88(11) p 1654-1666
4 Baumann M et al A Perspective on Continuous Flow Chemistry in the Pharmaceutical Industry Organic Process Research amp Development 2020
5 Noeacutel T Flow into the Chemistry Curriculum Chemistry World 2019 6 Reizman BJ and KF Jensen Feedback in flow for accelerated reaction
development Accounts of Chemical Research 2016 49(9) p 1786-1796
7 Plutschack MB et al The Hitchhikerrsquos Guide to Flow Chemistry Chemical Reviews 2017 117(18) p 11796-11893
215
8 Granda JM et al Controlling an organic synthesis robot with machine learning to search for new reactivity Nature 2018 559(7714) p 377-381
9 Peela NR IC Lee and DG Vlachos Design and fabrication of a high-throughput microreactor and its evaluation for highly exothermic reactions Industrial amp Engineering Chemistry Research 2012 51(50) p 16270-16277
10 Rivera NR et al Investigation of a Flow Step Clogging Incident A Precautionary Note on the Use of THF in Commercial-Scale Continuous Process Organic Process Research amp Development 2019 23(11) p 2556-2561
11 Chapman MR et al Simple and versatile laboratory scale CSTR for multiphasic continuous-flow chemistry and long residence times Organic Process Research amp Development 2017 21(9) p 1294-1301
12 Guan F et al A universal reactor platform for batch and flow application to homogeneous and heterogeneous hydrogenation Reaction Chemistry amp Engineering 2020 5(10) p 1903-1908
13 Muumlller G et al Continuous chemistry in microreaction systems for practical use Chimia International Journal for Chemistry 2006 60(9) p 618-622
14 Pennemann H et al Benchmarking of microreactor applications Organic Process Research amp Development 2004 8(3) p 422-439
15 Schwalbe T V Autze and G Wille Chemical synthesis in microreactors Chimia-Zurich 2002 56(11) p 636-646
16 Fletcher PD et al Micro reactors principles and applications in organic synthesis Tetrahedron 2002 58(24) p 4735-4757
17 Haswell SJ and P Watts Green chemistry synthesis in micro reactors Green Chemistry 2003 5(2) p 240-249
18 Hessel V and H Loumlwe Organic synthesis with microstructured reactors Chemical Engineering Technology Industrial Chemistry‐Plant Equipment‐Process Engineering‐Biotechnology 2005 28(3) p 267-284
19 Wilson NG and T McCreedy On-chip catalysis using a lithographically fabricated glass microreactormdashthe dehydration of alcohols using sulfated zirconia Chemical Communications 2000(9) p 733-734
20 Wiles C et al 1 4-Addition of enolates to α β-unsaturated ketones within a micro reactor Lab on a Chip 2002 2(2) p 62-64
21 Wegner J S Ceylan and A Kirschning Flow chemistryndasha key enabling technology for (multistep) organic synthesis Advanced Synthesis Catalysis 2012 354(1) p 17-57
22 Nagaki A et al Lithiation of 1 2‐Dichloroethene in Flow Microreactors
Versatile Synthesis of Alkenes and Alkynes by Precise Residence‐Time Control Angewandte Chemie International Edition 2012 51(13) p 3245-3248
23 Mason BP et al Greener approaches to organic synthesis using microreactor technology Chemical Reviews 2007 107(6) p 2300-2318
24 Newman SG and KF Jensen The role of flow in green chemistry and engineering Green Chemistry 2013 15(6) p 1456-1472
25 Riva E et al Reaction of Grignard reagents with carbonyl compounds under continuous flow conditions Tetrahedron 2010 66(17) p 3242-3247
216
26 Baumann M and IR Baxendale The synthesis of active pharmaceutical ingredients (APIs) using continuous flow chemistry Beilstein Journal of Organic Chemistry 2015 11(1) p 1194-1219
27 Bogdan AR et al The continuous‐flow synthesis of ibuprofen Angewandte Chemie International Edition 2009 48(45) p 8547-8550
28 Sheldon RA Catalysis the key to waste minimization Journal of Chemical Technology amp Biotechnology International Research in Process Environmental amp Clean Technology 1997 68(4) p 381-388
29 Kummer A T Varga and L Nagy Semi-batch reactor control with NMPC avoiding thermal runaway Computers and Chemical Engineering 2020 134 p 106694
30 Kao C-S and K-H Hu Acrylic reactor runaway and explosion accident analysis Journal of Loss Prevention in the Process Industries 2002 15(3) p 213-222
31 Fabiano B et al A perspective on Seveso accident based on cause-consequences analysis by three different methods Journal of Loss Prevention in the Process Industries 2017 49 p 18-35
32 Malet-Sanz L and F Susanne Continuous flow synthesis A pharma perspective Journal of Medicinal Chemistry 2012 55(9) p 4062-4098
33 Kunz U and T Turek Flow through reactors for organic chemistry directly electrically heated tubular mini reactors as an enabling technology for organic synthesis Beilstein Journal of Organic Chemistry 2009 5(1) p 70
34 Kappe CO Controlled microwave heating in modern organic synthesis Angewandte Chemie International Edition 2004 43(46) p 6250-6284
35 Yoshida Ji A Nagaki and T Yamada Flash chemistry fast chemical synthesis by using microreactors Chemistry - A European Journal 2008 14(25) p 7450-7459
36 van der Linden JJ et al Investigation of the Moffattminus Swern oxidation in a continuous flow microreactor system Organic Process Research amp Development 2008 12(5) p 911-920
37 Cutler AH MJ Antal Jr and M Jones Jr A critical evaluation of the plug-flow idealization of tubular-flow reactor data Industrial amp Engineering Chemistry Research 1988 27(4) p 691-697
38 Lebl R et al Scalable continuous flow hydrogenations using PdAl2O3-coated rectangular cross-section 3D-printed static mixers Catalysis Today 2020
39 Jolley KE MR Chapman and AJ Blacker A general and atom-efficient continuous-flow approach to prepare amines amides and imines via reactive N-chloramines Beilstein Journal of Organic Chemistry 2018 14(1) p 2220-2228
40 Hessel V Novel process windowsndashgate to maximizing process intensification via flow chemistry Chemical Engineering Technology Industrial Chemistry-Plant Equipment-Process Engineering-Biotechnology 2009 32(11) p 1655-1681
41 Bogdan AR and NW Sach The Use of Copper Flow Reactor Technology for the Continuous Synthesis of 1 4‐Disubstituted 1 2 3‐Triazoles Advanced Synthesis Catalysis 2009 351(6) p 849-854
42 Hornung CH et al A microcapillary flow disc reactor for organic synthesis Organic Process Research amp Development 2007 11(3) p 399-405
217
43 Acke DR and CV Stevens Study of the Baylisminus Hillman reaction in a microreactor environment first continuous production of Baylisminus Hillman adducts Organic Process Research amp Development 2006 10(3) p 417-422
44 McQuade DT and PH Seeberger Applying flow chemistry Methods materials and multistep synthesis J Org Chem 2013 78(13) p 6384-6389
45 Razzaq T and CO Kappe Continuous Flow Organic Synthesis under High‐TemperaturePressure Conditions ChemistryndashAn Asian Journal 2010 5(6) p 1274-1289
46 Hartman RL Managing solids in microreactors for the upstream continuous processing of fine chemicals Organic Process Research amp Development 2012 16(5) p 870-887
47 Reichardt C Solvent effects in organic chemistry 1979 Verlag Chemie 48 Reichardt C and T Welton Solvents and solvent effects in organic
chemistry 2011 John Wiley amp Sons 49 Singh D and PL Dhepe An efficient catalytic transfer hydrogenation-
hydrodeoxygenation of lignin derived monomers Investigating catalyst properties-activity correlation Catalysis Communications 2021 149 p 106220
50 Baxendale IR et al Multistep synthesis using modular flow reactors BestmannndashOhira reagent for the formation of alkynes and triazoles Angewandte Chemie 2009 121(22) p 4077-4081
51 Alam MP et al C O bond formation in a microfluidic reactor high yield S N Ar substitution of heteroaryl chlorides Tetrahedron letters 2016 57(19) p 2059-2062
52 Gutmann B et al On the Fischer Indole Synthesis of 7-Ethyltryptophol Mechanistic and Process Intensification Studies under Continuous Flow Conditions Organic Process Research amp Development 2013 17(2) p 294-302
53 Marre S Y Roig and C Aymonier Supercritical microfluidics Opportunities in flow-through chemistry and materials science The Journal of Supercritical Fluids 2012 66 p 251-264
54 Savage PE Organic chemical reactions in supercritical water Chemical reviews 1999 99(2) p 603-622
55 Adschiri T et al Green materials synthesis with supercritical water Green Chemistry 2011 13(6) p 1380-1390
56 Munshi P and S Bhaduri Supercritical CO 2 a twenty-first century solvent for the chemical industry Current Science (00113891) 2009 97(1)
57 Eckert CA et al Sustainable reactions in tunable solvents The Journal of Physical Chemistry B 2004 108(47) p 18108-18118
58 ONeil A and JJ Watkins Fabrication of device nanostructures using supercritical fluids MRS bulletin 2005 30(12) p 967-975
59 Romang AH and JJ Watkins Supercritical fluids for the fabrication of semiconductor devices emerging or missed opportunities Chemical reviews 2010 110(1) p 459
60 Marre S F Cansell and C Aymonier Tailor-made surface properties of particles with a hydrophilic or hydrophobic polymer shell mediated by supercritical CO2 Langmuir 2008 24(1) p 252
218
61 Cansell F and C Aymonier Design of functional nanostructured materials using supercritical fluids The Journal of Supercritical Fluids 2009 47(3) p 508-516
62 Chamberlain TW et al Catalytic nanoreactors in continuous flow hydrogenation inside single-walled carbon nanotubes using supercritical CO 2 Chemical Communications 2014 50(40) p 5200-5202
63 Devetta L et al Kinetic experiments and modeling of a three-phase catalytic hydrogenation reaction in supercritical CO 2 Catalysis Today 1999 48(1) p 337-345
64 Han X and M Poliakoff Continuous reactions in supercritical carbon dioxide problems solutions and possible ways forward Chemical Society Reviews 2012 41(4) p 1428-1436
65 Licence P et al Chemical reactions in supercritical carbon dioxide from laboratory to commercial plant Green Chemistry 2003 5(2) p 99-104
66 Leitner W Supercritical carbon dioxide as a green reaction medium for catalysis Accounts of chemical research 2002 35(9) p 746-756
67 McHugh M and V Krukonis Supercritical fluid extraction principles and practice 2013 Elsevier
68 Hitzler MG et al Selective catalytic hydrogenation of organic compounds in supercritical fluids as a continuous process Organic Process Research amp Development 1998 2(3) p 137-146
69 Cason JP and CB Roberts Metallic copper nanoparticle synthesis in AOT reverse micelles in compressed propane and supercritical ethane solutions The Journal of Physical Chemistry B 2000 104(6) p 1217-1221
70 Hyde JR et al Continuous catalytic reactions in supercritical fluids Applied Catalysis A General 2001 222(1) p 119-131
71 Hoffmann N Photochemical reactions of aromatic compounds and the concept of the photon as a traceless reagent Photochemical amp Photobiological Sciences 2012 11(11) p 1613-1641
72 Hoffmann N Photochemical reactions as key steps in organic synthesis Chemical Reviews 2008 108(3) p 1052
73 Knowles JP LD Elliott and KI Booker-Milburn Flow photochemistry Old light through new windows Beilstein journal of organic chemistry 2012 8 p 2025
74 Hook BD et al A practical flow reactor for continuous organic photochemistry The Journal of organic chemistry 2005 70(19) p 7558-7564
75 Schuster EM and P Wipf Photochemical flow reactions Israel Journal of Chemistry 2014 54(4) p 361-370
76 Yoshida J-i et al Modern strategies in electroorganic synthesis Chemical reviews 2008 108(7) p 2265-2299
77 Watts K A Baker and T Wirth Electrochemical synthesis in microreactors Journal of Flow Chemistry 2014 4(1) p 2-11
78 Horii D T Fuchigami and M Atobe A new approach to anodic substitution reaction using parallel laminar flow in a micro-flow reactor Journal of the American Chemical Society 2007 129(38) p 11692-11693
79 Horii D et al A novel electrosynthetic system for anodic substitution reactions by using parallel laminar flow in a microflow reactor Chemistry-A European Journal 2008 14(33) p 10382-10387
219
80 ZNIDARŠIC-PLAZL P Enzymatic microreactors utilizing non-aqueous media Chimica Oggi-Chemistry Today 2014 32 p 1
81 Rao NN et al Continuous biocatalytic processes Organic Process Research amp Development 2009 13(3) p 607-616
82 Babich L et al Continuous‐Flow Reactor‐Based Enzymatic Synthesis
of Phosphorylated Compounds on a Large Scale Chemistry-A European Journal 2012 18(21) p 6604-6609
83 Jas G and A Kirschning Continuous flow techniques in organic synthesis Chemistry-A European Journal 2003 9(23) p 5708-5723
84 Chen P et al A practical high through-put continuous process for the synthesis of chiral cyanohydrins The Journal of organic chemistry 2002 67(23) p 8251-8253
85 Liu Z et al Combined biosynthetic pathway for de novo production of UDP‐galactose catalysis with multiple enzymes immobilized on agarose
beads ChemBioChem 2002 3(4) p 348-355 86 Kobayashi S H Ishitani and S Nagayama Lanthanide triflate catalyzed
imino Diels-Alder reactions convenient syntheses of pyridine and quinoline derivatives Synthesis 1995 1995(09) p 1195-1202
87 Usutani H et al Generation and reactions of o-bromophenyllithium without benzyne formation using a microreactor Journal of the American Chemical Society 2007 129(11) p 3046-3047
88 Britton J and CL Raston Multi-step continuous-flow synthesis Chemical Society Reviews 2017 46(5) p 1250-1271
89 Snead DR and TF Jamison A three‐minute synthesis and purification
of ibuprofen Pushing the limits of continuous‐flow processing Angewandte Chemie International Edition 2015 54(3) p 983-987
90 Sahoo HR JG Kralj and KF Jensen Multistep Continuous‐Flow Microchemical Synthesis Involving Multiple Reactions and Separations Angewandte Chemie 2007 119(30) p 5806-5810
91 Hartman RL et al Multistep microchemical synthesis enabled by microfluidic distillation Angewandte Chemie International Edition 2010 49(5) p 899-903
92 Gloumlckner S et al The rapid synthesis of oxazolines and their heterogeneous oxidation to oxazoles under flow conditions Organic amp biomolecular chemistry 2015 13(1) p 207-214
93 Roberge DM et al Microreactor technology a revolution for the fine chemical and pharmaceutical industries Chemical engineering amp technology 2005 28(3) p 318-323
94 Exarchou V et al LC-UV-solid-phase extraction-NMR-MS combined with a cryogenic flow probe and its application to the identification of compounds present in Greek oregano Analytical Chemistry 2003 75(22) p 6288-6294
95 Benito-Lopez F et al Optical fiber-based on-line UVVis spectroscopic monitoring of chemical reaction kinetics under high pressure in a capillary microreactor Chemical Communications 2005(22) p 2857-2859
96 Mozharov S et al Improved method for kinetic studies in microreactors using flow manipulation and noninvasive Raman spectrometry Journal of the American Chemical Society 2011 133(10) p 3601-3608
97 Song H and RF Ismagilov Millisecond kinetics on a microfluidic chip using nanoliters of reagents Journal of the American Chemical Society 2003 125(47) p 14613-14619
220
98 Martinuzzi I et al Reaction mechanism for glycerol dehydration in the gas phase over a solid acid catalyst determined with on-line gas chromatography Chemical Engineering Science 2014 116 p 118-127
99 Moret S et al Microwave assisted saponification (MAS) followed by on-line liquid chromatography (LC)ndashgas chromatography (GC) for high-throughput and high-sensitivity determination of mineral oil in different cereal-based foodstuffs Food chemistry 2016 196 p 50-57
100 Grunwaldt J-D and BS Clausen Combining XRD and EXAFS with on-line catalytic studies for in situ characterization of catalysts Topics in Catalysis 2002 18(1) p 37-43
101 De Beer T et al In‐line and real‐time process monitoring of a freeze drying process using Raman and NIR spectroscopy as complementary process analytical technology (PAT) tools Journal of pharmaceutical sciences 2009 98(9) p 3430-3446
102 Ward H and FE Sistare On-line determination and control of the water content in a continuous conversion reactor using NIR spectroscopy Analytica chimica acta 2007 595(1) p 319-322
103 Cervera-Padrell AE et al Monitoring and control of a continuous Grignard reaction for the synthesis of an active pharmaceutical ingredient intermediate using inline NIR spectroscopy Organic Process Research amp Development 2012 16(5) p 901-914
104 Bristow TW et al On-line monitoring of continuous flow chemical synthesis using a portable small footprint mass spectrometer Journal of The American Society for Mass Spectrometry 2014 25(10) p 1794-1802
105 Roscioli KM et al Real time pharmaceutical reaction monitoring by electrospray ion mobility-mass spectrometry International Journal of Mass Spectrometry 2013 336 p 27-36
106 Mathieson JS et al Continuous parallel ESI-MS analysis of reactions carried out in a bespoke 3D printed device Beilstein journal of nanotechnology 2013 4 p 285
107 Robert J and A JohnaacuteBlacker Online quantitative mass spectrometry for the rapid adaptive optimisation of automated flow reactors Reaction Chemistry amp Engineering 2016 1(1) p 96-100
108 Browne DL et al Continuous flow reaction monitoring using an on‐line miniature mass spectrometer Rapid Communications in Mass Spectrometry 2012 26(17) p 1999-2010
109 Zhang J et al Design and scaling up of microchemical systems a review Annual review of chemical and biomolecular engineering 2017 8 p 285-305
110 Rasheed M and T Wirth Fast optimisation of a Diels-Alder reaction in a flow microreactor by in-line HPLC analysis Chemistry Today 2011 29(3) p 56
111 Welch CJ et al Online analysis of flowing streams using microflow HPLC Organic Process Research amp Development 2009 13(5) p 1022-1025
112 Carter CF et al ReactIR flow cell a new analytical tool for continuous flow chemical processing Organic Process Research amp Development 2010 14(2) p 393-404
113 Malet-Sanz L et al Preparation of arylsulfonyl chlorides by chlorosulfonylation of in situ generated diazonium salts using a
221
continuous flow reactor Organic amp biomolecular chemistry 2010 8(23) p 5324-5332
114 Carter CF et al The continuous flow synthesis of butane-2 3-diacetal protected building blocks using microreactors Organic amp biomolecular chemistry 2010 8(7) p 1588-1595
115 Smith CJ et al A fully automated multistep flow synthesis of 5-amino-4-cyano-1 2 3-triazoles Organic amp biomolecular chemistry 2011 9(6) p 1938-1947
116 Floyd TM MA Schmidt and KF Jensen Silicon micromixers with infrared detection for studies of liquid-phase reactions Industrial amp engineering chemistry research 2005 44(8) p 2351-2358
117 Carter CF et al Synthesis of acetal protected building blocks using flow chemistry with flow IR analysis preparation of butane-2 3-diacetal tartrates Organic amp biomolecular chemistry 2009 7(22) p 4594-4597
118 Sans V et al A self optimizing synthetic organic reactor system using real-time in-line NMR spectroscopy Chemical science 2015 6(2) p 1258-1264
119 Maiwald M et al Quantitative high-resolution on-line NMR spectroscopy in reaction and process monitoring Journal of Magnetic Resonance 2004 166(2) p 135-146
120 Maiwald M et al Quantitative on-line high-resolution NMR spectroscopy in process engineering applications Analytical and bioanalytical chemistry 2003 375(8) p 1111-1115
121 Dalitz F et al Process and reaction monitoring by low-field NMR spectroscopy Progress in nuclear magnetic resonance spectroscopy 2012 60 p 52-70
122 Silva Elipe MV and RR Milburn Monitoring chemical reactions by low‐field benchtop NMR at 45 MHz pros and cons Magnetic Resonance in Chemistry 2016 54(6) p 437-443
123 Goldbach M et al Preparation of Grignard reagents from magnesium metal under continuous flow conditions and on-line monitoring by NMR spectroscopy Tetrahedron Letters 2016 57(1) p 122-125
124 Houben C and AA Lapkin Automatic discovery and optimization of chemical processes Current Opinion in Chemical Engineering 2015 9 p 1-7
125 Cox BG Modern liquid phase kinetics 1994 Oxford University Press 126 Perrin CL Linear or nonlinear least-squares analysis of kinetic data
Journal of Chemical Education 2017 94(6) p 669-672 127 Michaelis L and ML Menten Die kinetik der invertinwirkung 2007
Universitaumltsbibliothek Johann Christian Senckenberg 128 Johnson KA A century of enzyme kinetic analysis 1913 to 2013 FEBS
Letters 2013 587(17) p 2753-2766 129 Lineweaver H and D Burk The determination of enzyme dissociation
constants Journal of the American Chemical Society 1934 56(3) p 658-666
130 Nielsen CD-T and J Bureacutes Visual kinetic analysis Chemical Science 2019 10(2) p 348-353
131 Blackmond DG Reaction progress kinetic analysis a powerful methodology for mechanistic studies of complex catalytic reactions Angewandte Chemie International Edition 2005 44(28) p 4302-4320
222
132 Rosner T et al Kinetic studies of Heck coupling reactions using palladacycle catalysts experimental and kinetic modeling of the role of dimer species Journal of the American Chemical Society 2001 123(9) p 1848-1855
133 Nielsen LP et al Mechanistic investigation leads to a synthetic improvement in the hydrolytic kinetic resolution of terminal epoxides Journal of the American Chemical Society 2004 126(5) p 1360-1362
134 Baxter RD et al Mechanistic rationalization of unusual kinetics in Pd-catalyzed CndashH olefination Journal of the American Chemical Society 2012 134(10) p 4600-4606
135 Blackmond DG Kinetic profiling of catalytic organic reactions as a mechanistic tool Journal of the American Chemical Society 2015 137(34) p 10852-10866
136 Bureacutes J A simple graphical method to determine the order in catalyst Angewandte Chemie International Edition 2016 55(6) p 2028-2031
137 Bureacutes J Variable time normalization analysis General graphical elucidation of reaction orders from concentration profiles Angewandte Chemie International Edition 2016 55(52) p 16084-16087
138 Mathew JS et al Investigations of Pd-catalyzed ArX coupling reactions informed by reaction progress kinetic analysis The Journal of Organic Chemistry 2006 71(13) p 4711-4722
139 Streuff J et al Mechanism of the tiIII-catalyzed acyloin-type umpolung a catalyst-controlled radical reaction Journal of the American Chemical Society 2015 137(45) p 14396-14405
140 Lin S and EN Jacobsen Thiourea-catalysed ring opening of episulfonium ions with indole derivatives by means of stabilizing non-covalent interactions Nature Chemistry 2012 4(10) p 817
141 Noda H et al Catalytic asymmetric synthesis of CF 3-substituted tertiary propargylic alcohols via direct aldol reaction of α-N 3 amide Chemical Science 2017 8(4) p 3260-3269
142 Lundberg H et al Mechanistic elucidation of zirconium-catalyzed direct amidation Journal of the American Chemical Society 2017 139(6) p 2286-2295
143 Vasilenko V CK Blasius and LH Gade One-Pot Sequential Kinetic Profiling of a Highly Reactive Manganese Catalyst for Ketone Hydroboration Leveraging σ-Bond Metathesis via Alkoxide Exchange Steps Journal of the American Chemical Society 2018 140(29) p 9244-9254
144 Franceschini G and S Macchietto Model-based design of experiments for parameter precision State of the art Chemical Engineering Science 2008 63(19) p 4846-4872
145 Galvanin F S Macchietto and F Bezzo Model-based design of parallel experiments Industrial amp Engineering Chemistry Research 2007 46(3) p 871-882
146 Waldron C et al Model-based design of transient flow experiments for the identification of kinetic parameters Reaction Chemistry amp Engineering 2020 5(1) p 112-123
147 Von Stosch M et al Hybrid semi-parametric modeling in process systems engineering Past present and future Computers and Chemical Engineering 2014 60 p 86-101
223
148 de Juan A et al Combining hard-and soft-modelling to solve kinetic problems Chemometrics Intelligent Laboratory Systems 2000 54(2) p 123-141
149 de Carvalho AR et al Comparison of PLS and kinetic models for a second-order reaction as monitored using ultraviolet visible and mid-infrared spectroscopy Talanta 2006 68(4) p 1190-1200
150 Fath V et al Efficient Kinetic Data Acquisition and Model Prediction Continuous Flow Microreactors Inline FT-IR Spectroscopy and Self-modeling Curve Resolution Organic Process Research amp Development 2020
151 Toch K JW Thybaut and GB Marin A systematic methodology for kinetic modeling of chemical reactions applied to n‐hexane hydroisomerization AIChE Journal 2015 61(3) p 880-892
152 Yang S-T X Liu and Y Zhang Metabolic engineeringndashapplications methods and challenges in Bioprocessing for Value-Added Products from Renewable Resources 2007 Elsevier p 73-118
153 Vasquez E and T Eldredge Process modeling for hydrocarbon fuel conversion in Advances in Clean Hydrocarbon Fuel Processing 2011 Elsevier p 509-545
154 Paul S V Kurin and S Whiteson Fast Efficient Hyperparameter Tuning for Policy Gradient Methods in Advances in Neural Information Processing Systems 2019
155 Wistuba M N Schilling and L Schmidt-Thieme Scalable gaussian process-based transfer surrogates for hyperparameter optimization Machine Learning 2018 107(1) p 43-78
156 Lerman P Fitting segmented regression models by grid search Journal of the Royal Statistical Society Series C 1980 29(1) p 77-84
157 Huang C-YR C-Y Lai and K-TT Cheng Fundamentals of algorithms in Electronic Design Automation 2009 Elsevier p 173-234
158 Boyd SP and L Vandenberghe Convex optimization 2004 Cambridge university press p 1-16
159 Vasiljević D Comparison of optimization algorithms in Classical and Evolutionary Algorithms in the Optimization of Optical Systems 2002 Springer p 83-88
160 Inuiguchi M and J Ramık Possibilistic linear programming a brief review of fuzzy mathematical programming and a comparison with stochastic programming in portfolio selection problem Fuzzy Sets amp Systems 2000 111(1) p 3-28
161 Beacutenichou M et al Experiments in mixed-integer linear programming Mathematical Programming 1971 1(1) p 76-94
162 Kuhn HW and AW Tucker Nonlinear programming in Traces and emergence of nonlinear programming 2014 Springer p 247-258
163 Bregman LM The relaxation method of finding the common point of convex sets and its application to the solution of problems in convex programming USSR Computational Mathetmatics and Mathematical Physics 1967 7(3) p 200-217
164 Frank M and P Wolfe An algorithm for quadratic programming Naval Research Logistics Quarterly 1956 3(1‐2) p 95-110
165 Drummond LG and BF Svaiter A steepest descent method for vector optimization Journal of Computational amp Applied Mathematics 2005 175(2) p 395-414
224
166 Clayton AD et al Algorithms for the self-optimisation of chemical reactions Reaction Chemistry amp Engineering 2019 4(9) p 1545-1554
167 Spendley W GR Hext and FR Himsworth Sequential application of simplex designs in optimisation and evolutionary operation Technometrics 1962 4(4) p 441-461
168 Nelder JA and R Mead A simplex method for function minimization The Computer Journal 1965 7(4) p 308-313
169 Byrd RH JC Gilbert and J Nocedal A trust region method based on interior point techniques for nonlinear programming Mathematical Programming 2000 89(1) p 149-185
170 Waltz RA et al An interior algorithm for nonlinear optimization that combines line search and trust region steps Mathematical Programming 2006 107(3) p 391-408
171 Whitley D A genetic algorithm tutorial Statistics amp Computing 1994 4(2) p 65-85
172 Brochu E VM Cora and N De Freitas A tutorial on Bayesian optimization of expensive cost functions with application to active user modeling and hierarchical reinforcement learning preprint arXiv10122599 2010
173 Tsu J VHG Diacuteaz and MJ Willis Computational approaches to kinetic model selection Computers and Chemical Engineering 2019 121 p 618-632
174 de la Mare PBD Reaction Mechanism Encyclopaeligdia Britannica 2008 [cited 2020 April 13] Available from httpswwwbritannicacomsciencereaction-mechanism
175 Carey FA and RJ Sundberg Study and Description of Organic Reaction Mechanisms Advanced Organic Chemistry Part A Structure amp Mechanisms 2000 p 187-261
176 Willis MJ and M von Stosch Inference of chemical reaction networks using mixed integer linear programming Computers and Chemical Engineering 2016 90 p 31-43
177 Aris R and R Mah Independence of chemical reactions Industrial Engineering Chemistry Fundamentals 1963 2(2) p 90-94
178 Bonvin D and D Rippin Target factor analysis for the identification of stoichiometric models Chemical Engineering Science 1990 45(12) p 3417-3426
179 Amrhein M B Srinivasan and D Bonvin Target factor analysis of reaction data Use of data pre-treatment and reaction-invariant relationships Chemical Engineering Science 1999 54(5) p 579-591
180 Georgakis C and R Lin Stoichiometric Modeling of Complex Pharmaceutical Reactions in Proceedings of the Annual AIChE meeting in Cincinnati OH November 2005
181 Brendel M D Bonvin and W Marquardt Incremental identification of kinetic models for homogeneous reaction systems Chemical Engineering Science 2006 61(16) p 5404-5420
182 Bhatt N et al Incremental identification of reaction systemsmdashA comparison between rate-based and extent-based approaches Chemical Engineering Science 2012 83 p 24-38
183 Burnham SC et al Inference of chemical reaction networks Chemical Engineering Science 2008 63(4) p 862-873
225
184 Crampin EJ S Schnell and PE McSharry Mathematical and computational techniques to deduce complex biochemical reaction mechanisms Progress in Biophysics amp Molecular Biology 2004 86(1) p 77-112
185 Searson DP et al Inference of chemical reaction networks using hybrid s-system models Chemical Product amp Process Modelling 2007 2(1)
186 Srividhya J et al Reconstructing biochemical pathways from time course data Proteomics 2007 7(6) p 828-838
187 Searson DP MJ Willis and A Wright Reverse Engineering Chemical Reaction Networks from Time Series Data Statistical Modelling of Molecular Descriptors in QSARQSPR 2014 2(12)
188 Koza JR et al Automatic computational discovery of chemical reaction networks using genetic programming in Computational Discovery of Scientific Knowledge 2007 Springer p 205-227
189 Hii CJ AR Wright and MJ Willis Utilizing a genetic algorithm to elucidate chemical reaction networks An experimental case study International Journal of Chemical Engineering Applications 2014 5(6) p 516
190 Chellaboina V et al Modeling and analysis of mass-action kinetics IEEE Control Systems Magazine 2009 29(4) p 60-78
191 Sayikli C and EZ Bagci Limitations of using mass action kinetics method in modeling biochemical systems illustration for a second order reaction in International Conference on Computational Science and Its Applications 2011 Springer
192 Furusjouml E O Svensson and L-G Danielsson Estimation of kinetic parameters from non-isothermal batch experiments monitored by in situ vibrational spectroscopy Chemometrics Intelligent Laboratory Systems 2003 66(1) p 1-14
193 Pagano RL et al Cure kinetic parameter estimation of thermosetting resins with isothermal data by using particle swarm optimization European Polymer Journal 2008 44(8) p 2678-2686
194 Zhang Y-Y and J-H Liu Kinetic study of enantioselective hydrolysis of (R S)-ketoprofen ethyl ester using immobilized T laibacchii lipase Biochemical Engineering Journal 2011 54(1) p 40-46
195 VanBuren V L Cassimeris and DJ Odde Mechanochemical model of microtubule structure and self-assembly kinetics Biophysical Journal 2005 89(5) p 2911-2926
196 Gao D Y Xiao and A Varma Guaiacol hydrodeoxygenation over platinum catalyst reaction pathways and kinetics Industrial Engineering Chemistry Research 2015 54(43) p 10638-10644
197 Changi S TM Brown and PE Savage Reaction kinetics and pathways for phytol in high-temperature water Chemical Engineering Journal 2012 189 p 336-345
198 Zhang Y et al One-pot Enzymatic Synthesis of Enantiopure 1 3-oxathiolane by Trichosporon Laibachii Lipase and Kinetic Model Organic Process Research amp Development 2020
199 Villaverde AF et al Benchmarking optimization methods for parameter estimation in large kinetic models Bioinformatics 2019 35(5) p 830-838
200 Akaike H Fitting autoregressive models for prediction Annals of the Institute of Statistical Mathematics 1969 21(1) p 243-247
226
201 Hurvich CM and C-L Tsai Regression and time series model selection in small samples Biometrika 1989 76(2) p 297-307
202 Burnham KP and DR Anderson A practical information-theoretic approach Model Selection and Multimodel Inference Vol 2 49-96 2002 New York Springer
203 Gholamipour-Shirazi A and C Rolando Alkylation of substituted benzoic acids in a continuous flow microfluidic microreactor kinetics and linear free energy relationships Organic Process Research amp Development 2012 16(5) p 811-818
204 Niemeier JK et al Application of kinetic modeling and competitive solvent hydrolysis in the development of a highly selective hydrolysis of a nitrile to an amide Organic Process Research amp Development 2014 18(3) p 410-416
205 Hartridge H and FJW Roughton A method of measuring the velocity of very rapid chemical reactions Proceedings of the Royal Society of London Series A Containing Papers of a Mathematical Physical Character 1923 104(726) p 376-394
206 Gibson QH Rapid mixing Stopped flow Methods in Enzymology 1969 16 p 187-228
207 Seong GH J Heo and RM Crooks Measurement of enzyme kinetics using a continuous-flow microfluidic system Analytical Chemistry 2003 75(13) p 3161-3167
208 Rozich AF and DJ Castens Inhibition kinetics of nitrification in continuous-flow reactors Water Pollution Control Federation 1986 p 220-226
209 Christensen M et al Development of an automated kinetic profiling system with online HPLC for reaction optimization Reaction Chemistry amp Engineering 2019 4(9) p 1555-1558
210 Johnson KA Rapid quench kinetic analysis of polymerases adenosinetriphosphatases and enzyme intermediates Contemporary Enzyme Kinetics Mechanism Reliable Lab Solutions 2009 p 407
211 Probstein RF Physicochemical hydrodynamics an introduction 2005 John Wiley amp Sons
212 Konermann L Monitoring reaction kinetics in solution by continuous-flow methods the effects of convection and molecular diffusion under laminar flow conditions Journal of Physical Chemistry A 1999 103(36) p 7210-7216
213 Konermann L et al Acid-induced denaturation of myoglobin studied by time-resolved electrospray ionization mass spectrometry Biochemistry 1997 36(21) p 6448-6454
214 Konermann L B Collings and D Douglas Cytochrome c folding kinetics studied by time-resolved electrospray ionization mass spectrometry Biochemistry 1997 36(18) p 5554-5559
215 Zechel DL et al Pre-steady state kinetic analysis of an enzymatic reaction monitored by time-resolved electrospray ionization mass spectrometry Biochemistry 1998 37(21) p 7664-7669
216 Zhou X R Medhekar and MD Toney A continuous-flow system for high-precision kinetics using small volumes Analytical Chemistry 2003 75(15) p 3681-3687
217 Jensen KF BJ Reizman and SG Newman Tools for chemical synthesis in microsystems Lab on a Chip 2014 14(17) p 3206-3212
227
218 Hartman RL JP McMullen and KF Jensen Deciding whether to go with the flow evaluating the merits of flow reactors for synthesis Angewandte Chemie International Edition 2011 50(33) p 7502-7519
219 Baxendale IR L Brocken and CJ Mallia Flow chemistry approaches directed at improving chemical synthesis Green Processing Synthesis 2013 2(3) p 211-230
220 Gutmann B D Cantillo and CO Kappe Continuous‐flow technologymdasha tool for the safe manufacturing of active pharmaceutical ingredients Angewandte Chemie International Edition 2015 54(23) p 6688-6728
221 Bedore MW et al Aminolysis of epoxides in a microreactor system a continuous flow approach to β-amino alcohols Organic Process Research amp Development 2010 14(2) p 432-440
222 Zaborenko N et al Kinetic and scale-up investigations of epoxide aminolysis in microreactors at high temperatures and pressures Organic Process Research amp Development 2011 15(1) p 131-139
223 Monteiro JL et al Continuous Flow Homolytic Aromatic Substitution with Electrophilic Radicals A Fast and Scalable Protocol for Trifluoromethylation Chemistry - A European Journal 2017 23(1) p 176-186
224 Nagaki A D Ichinari and J-i Yoshida Three-component coupling based on flash chemistry Carbolithiation of benzyne with functionalized aryllithiums followed by reactions with electrophiles Journal of the American Chemical Society 2014 136(35) p 12245-12248
225 Hone CA et al Rapid multistep kinetic model generation from transient flow data Reaction Chemistry amp Engineering 2017 2(2) p 103-108
226 Valera FE et al The Flowrsquos the Thinghellip Or Is It Assessing the Merits of Homogeneous Reactions in Flask and Flow Angewandte Chemie International Edition 2010 49(14) p 2478-2485
227 Moore JS and KF Jensen ldquoBatchrdquo kinetics in flow online IR analysis and continuous control Angewandte Chemie International Edition 2014 53(2) p 470-473
228 Haas CP et al Automated generation of photochemical reaction data by transient flow experiments coupled with online HPLC analysis Reaction Chemistry amp Engineering 2020
229 Schaber SD et al Design execution and analysis of time-varying experiments for model discrimination and parameter estimation in microreactors Organic Process Research amp Development 2014 18(11) p 1461-1467
230 Aroh KC and KF Jensen Efficient kinetic experiments in continuous flow microreactors Reaction Chemistry amp Engineering 2018 3(1) p 94-101
231 Gomez MV et al Determination of kinetic parameters within a single nonisothermal on-flow experiment by nanoliter NMR spectroscopy Analytical Chemistry 2015 87(20) p 10547-10555
232 Waldron C et al An autonomous microreactor platform for the rapid identification of kinetic models Reaction Chemistry amp Engineering 2019 4(9) p 1623-1636
233 Hone CA et al Definitive screening designs for multistep kinetic models in flow Reaction Chemistry amp Engineering 2019 4(9) p 1565-1570
228
234 Holmes N et al Online quantitative mass spectrometry for the rapid adaptive optimisation of automated flow reactors Reaction Chemistry amp Engineering 2016 1(1) p 96-100
235 Levenspiel O Chemical reaction engineering Industrial amp Engineering Chemistry Research 1999 38(11) p 4140-4143
236 McMullen JP and KF Jensen Rapid determination of reaction kinetics with an automated microfluidic system Organic Process Research amp Development 2011 15(2) p 398-407
237 Nagy KD et al Mixing and dispersion in small-scale flow systems Organic Process Research amp Development 2012 16(5) p 976-981
238 Afonso CA et al Comprehensive Organic Chemistry Experiments for the Laboratory Classroom 2016 Royal Society of Chemistry
239 Fluorochem 2019 27062019] Available from httpwwwfluorochemcoukProductsProductcode=303261
240 Ashworth IW et al Where has my acid gone Understanding the self-catalyzed esterification of maleic acid in methanol during salt formation Organic Process Research amp Development 2012 16(10) p 1646-1651
241 Gilbert JC EG McKinley and D-R Hou The nature of cyclopentyne from different precursors Tetrahedron 1997 53(29) p 9891-9902
242 Takaki K et al Intermolecular hydrophosphination of alkynes and related carbonminus carbon multiple bonds catalyzed by organoytterbiums The Journal of Organic Chemistry 2003 68(17) p 6554-6565
243 Berthelot DJ-C et al Heterocyclic amides as modulators of TRPA1 2013 Google Patents
244 Binch H et al Aminopyridine derivatives having aurora a selective inhibitory action 2013 Google Patents
245 Lood CS et al Synthesis of Chiral (Indol-2-yl) methanamines and Insight into the Stereochemistry Protecting Effects of the 9-Phenyl-9-fluorenyl Protecting Group European Journal of Organic Chemistry 2015 3793 p 3805
246 Poisson J-F A Orellana and AE Greene Stereocontrolled synthesis of (minus)-kainic acid from trans-4-hydroxy-L-proline The Journal of Organic Chemistry 2005 70(26) p 10860-10863
247 Lood C M Nieger and A Koskinen Enantiospecific gram scale synthesis of (S)-eleagnine Tetrahedron 2015 71(30) p 5019-5024
248 9-Bromo-9-phenylfluorene Sigma Aldrich Available from httpswwwsigmaaldrichcomcatalogproductaldrich368873 [27092020]
249 Tian Z and F Menard Synthesis of Kainoids and C4 Derivatives The Journal of Organic Chemistry 2018 83(11) p 6162-6170
250 9-Fluorenone Sigma Aldrich Available from httpswwwsigmaaldrichcomcatalogproductaldrichf1506 [27092020]

2
Acknowledgements
This project could not have been completed without the ongoing help of
several individuals who have helped guide the project into the finished thesis and
publications Firstly Irsquod like to thank Dr Richard Bourne for his continued support
advice and brilliance in assisting with the project wherever possible in both
running experiments and preparing project directions Your supervision style of
treating a PhD student as an academic partner is well appreciated and has
undoubtedly led to an excellent postgraduate experience
Dr Thomas Chamberlain thank you also for your ongoing support and
contributions to my supervision Although yoursquore busy it does not go unnoticed
that you are always willing to go the extra mile in proofreading posterspapers
and even just transfer report chapters - your sharp wit means that you can sell
my science better than anyone can including myself
To Brian and Graeme thank you also for your support in the direction of
my project and sourcing opportunities for me to present and develop myself as
a researcher I really appreciate it Thank you also to Mark Willis Ian Ashworth
Rob Cox and the rest of the CPUT team at AZ for your invaluable thoughts and
discussions
To Adam Jamie and Calum thank you for all of your nonsense talks and
debates particularly in the control room that helped keep me sane - even the
consistent whinging was funny More recently Ollie and Holly have been helping
with that also Ricardo thank you for all of your advice as well as your nonsense
talking too (but only after you shut off your lsquowork personarsquo after 6pm) Brendan
thank you for being a consistent source of hyperactive entertainment donrsquot let
Luke try to calm your ideas Rosie and Sam thank you for all of the tea breaks
at AZ that also managed to keep us all sane Mary thank you for your help in
running the lab and similarly thank you to everyone in the iPRD for your help
and support over the years John Bao Nando Ilias Claudio Micaela Nisha
Alison Christiane James Pia and the ones that have moved on Alastair Will
Mike Becky Chris Horb Chris Hone Alvaro and not forgetting Fanfu
To Rhiann and my encouraging parents thank you for always being there
and motivating me to be my best and inspiring me to go further
3
Abstract
A major bottleneck in the transition from chemistry research at lab scale
to process development is a lack of quantitative chemical synthesis information
Critical aspects of this information include knowing the correct reaction model
and precise kinetic parameters If this information is available classical reaction
engineering principles may be utilised to shorten process development times and
lower costs
Identifying the correct reaction model for a particular process however
can be challenging and time-consuming particularly for physical-organic
chemists and kinetics experts that may be busy with other aspects of process
development The work presented herein describes computational approaches
that automatically determine the most likely kinetic model and associated
parameters based on the experimental data supplied without expert chemical
intuition
The concept for these methodologies involves a comprehensive model
evaluation tool The experimental data and the species involved in the process
are inputted Based on mass balance all mass-balance-allowed transformations
between these species are identified All possible models are then compiled from
this list of transformations featuring unique combinations of these model terms
Every model is then evaluated using ordinary differential equation (ODE) solvers
and optimisation algorithms to maximise the convergence of simulated reaction
progression with the experimental data thereby identifying the kinetic
parameters Each model is then statistically evaluated to determine which model
is the most likely to be correct
Using these methodologies allows any chemist to automatically determine
a reaction model and kinetic constants for a particular system by performing all
kinetic analysis autonomously Their most expensive resource time can then be
focussed on other tasks that cannot be automated
4
Table of Contents
Acknowledgements 2
Abstract 3
Table of Contents 4
List of Schemes 7
List of Figures 9
List of Tables 14
List of Abbreviations 17
Chapter 1 Introduction 19
11 Continuous flow chemistry 19
111 Batch and flow reactions 19
112 Reactions in flow 24
113 Reaction analysis 33
114 Continuous flow chemistry summary 40
12 Kinetic methodologies 40
121 Conventional methodologies 41
122 Visual kinetic analysis 49
123 Kinetic methodologies summary 56
13 Optimisation 56
131 Local algorithms 59
132 Global 63
133 Optimisation summary 68
14 Research aim 69
Chapter 2 Development of the computational approach to kinetic model determination 70
21 Introduction 70
22 Development of the approach 73
221 Kinetic model generation 74
222 Kinetic model fitting 79
223 Statistical analysis 85
224 Other considerations 86
225 Overview 87
23 Simulated verification of the approach 89
231 Case study Benzoic acid alkylation 90
232 Case study Nitrile hydrolysis 93
5
233 Case study SNAr kinetics 97
24 Conclusion 102
Chapter 3 Experimental applications of the computational approach to kinetic model and parameter determination 103
31 Introduction 103
32 Experimental setup 112
33 Case study Phenyl acetate 115
34 Case study Paracetamol 118
35 Case study Metoprolol 121
36 Conclusion 125
Chapter 4 The development of an improved computational approach to kinetic model determination 126
41 Introduction 126
42 Methodology advancement 127
421 Capabilities 127
422 Rules 131
423 Overview 136
43 Simulated verifications of the approach 138
431 Case study SNAr kinetics 138
432 Case study Pentyne kinetics 145
433 Case study Ytterbium catalysis 149
44 Conclusion 152
Chapter 5 Experimental applications of the new approach 153
51 Introduction 153
52 Case study SNAr kinetics 154
53 Case study PfBr 157
54 Case study Maleic acid 162
55 Conclusion 166
Chapter 6 Conclusion amp future work 167
Chapter 7 Appendix 168
71 Chapter 1 168
72 Chapter 2 168
721 Generated data set for case study benzoic acid alkylation 169
722 Generated data set for case study nitrile hydrolysis 170
723 Generated data set for the case study SNAr kinetics 171
73 Chapter 3 173
6
731 Phenyl acetate 173
732 Paracetamol 178
733 Metoprolol 187
74 Chapter 4 193
741 Generated data set for the case study SNAr kinetics 193
742 Generated data set for the case study Pentyne 195
743 Generated data set for the case study Ytterbium catalysis 197
75 Chapter 5 198
751 SNAr kinetics 198
752 PfBr 206
753 Maleic acid 211
76 Computational setup 214
761 Chapter 2 - 3 214
762 Chapter 4 - 5 214
Chapter 8 References 214
7
List of Schemes
Chapter 1
Scheme 11 The conversion of hexanol 11 to hexene 12 in a continuous flow setup[19]
21
Scheme 12 The flow synthesis of the adduct 15 via a Michael addition between the
dicarbonyl 13 and the alkyne 14[20] 22
Scheme 13 The multistep continuous flow synthesis of ibuprofen 18 23
Scheme 14 The temperature-accelerated SNAr reaction of 19 with 110 to form 111 in
THF (boiling point 66 degC) under flow conditions[51] 26
Scheme 15 The Fischer Indole synthesis of 114 from the hydrazine 112 and
dihydrofuran 113 in methanol (boiling point 65 degC) using a flow setup[52] 26
Scheme 16 The hydrogenation of isophorone 115 to TMCH 116[65] 27
Scheme 17 The [2 + 2] photocycloaddition of malemide 117 with 1-hexyne to produce
the cyclic product 118[74] 29
Scheme 18 An electrochemical facilitated nucleophilic substitution reaction to afford the
product 121[78] 29
Scheme 19 An enzyme catalysed continuous cyanohydrin formation forming 123[84] 30
Scheme 110 Multiple enzymatic catalysed continuous process to form UDP galactose
125[85] Individual enzymes stated 30
Scheme 111 The multi-step flow synthesis of 127 from coupling o-dibromobenzene 126
with varying electrophiles via sequential halogen-lithium exchange reactions[87] 31
Scheme 112 A multi-step flow synthesis of ibuprofen 18 involving an in-line purification
step[89] 33
Scheme 113 A reaction scheme showing the formation of benzyne 132 which was
followed by analysis via mass spectrometry[108] 35
Scheme 114 A reaction scheme showing the thermal isomerization of 133a to 133b
which was followed by analysis via HPLC[111] 36
Scheme 115 A reaction scheme showing a fluorination reaction yielding 136 which was
followed by analysis via in-line IR[112] 37
Scheme 116 The Grignard reaction that was tracked by on-line NMR[123] 38
Scheme 117 A Heck coupling of an aryl bromide 140 with 141 to form the adduct 142
This case study showed no indication of product inhibition or catalyst deactivation 50
Scheme 118 The epoxide opening of 143 to form 144 using a catalytic system This case
study indicates some product inhibition or catalyst deactivation 51
Scheme 119 A nickel-catalysed alkylation reaction of chalcone 145 with Et2Zn 146 to
form the adduct 147 53
Chapter 2
Scheme 21 An example esterification reaction 75
Scheme 22 The reaction of benzoic acid with iodomethane to form methyl benzoate
Modelled as a second order reaction 91
8
Scheme 23 The reaction of a nitrile with hydroxide to form the corresponding amide which
is susceptible to further hydrolysis to form the carboxylic acid Modelled as sequential
second order reactions 94
Scheme 24 The reaction of 24-dichloropyrimidine 210 with morpholine 211 to form the
4-substituted product 212 and the 2-substituted product 213 and the subsequent
bis-substituted product 214 98
Chapter 3
Scheme 31 The base catalysed Knoevenagel condensation between benzaldehyde and
ethyl cyanoacetate to form 34 109
Scheme 32 The Paal-Knorr reaction of 25-hexanedione 35 and ethanolamine 36 to
yield 37 to show how the kinetics of a process can be observed by using a controlled
ramp technique 111
Scheme 33 The reaction of phenol 38 with acetyl chloride 39 to form phenyl acetate
310 and hydrochloric acid 311 115
Scheme 34 The reaction of 4-aminophenol with acetic anhydride to form paracetamol in
step one followed by a further reaction with acetic anhydride to form diacetamate in
step two 118
Scheme 35 The reaction of the epoxide starting material with isopropylamine to form
metoprolol as well as the overreaction to form the bis-substituted product 122
Chapter 4
Scheme 41 The self-catalysed reaction of maleic acid 41 and methanol 42 to form the
mono-product 43 and the di-product 44[237] 132
Scheme 42 The reaction of 24-difluoronitrobenzene 45 with pyrrolidine 46 to form the
ortho-substituted product 47 and the para-substituted product 48 Consecutive
reactions then occur to form the bis-substituted product 49 In each reaction
hydrofluoric acid 410 is formed[222] 139
Scheme 43 The reaction of the starting material 411 with the spirodiene 412 to form
the product 413 and LiBr 414[238] 146
Scheme 44 The reaction of the starting material 415 with diphenylphosphine 416 in the
presence of the ytterbium catalyst 417 to form the product 418 where [Yb] Yb(η2-
Ph2CNPh)(hmpa)3[239] 149
Chapter 5
Scheme 51 The reaction of 246-trichloropyrimidine (SM) 51 with ethyl 4-
aminobutanoate 52 to form the major 2-substituted SNAr product 53 and the minor
4-substituted SNAr product 54 154
Scheme 52 The reaction of alanine methyl ester (Al-Me) 56 with PfBr 57 to form the
protected amino acid 58 Hydrobromic acid 59 is also generated as a side product
158
Scheme 53 The retrosynthetic methodology of the transformation of L-alanine to (S)-
eleagnine via the Pf-protected alanine methyl ester (Pf-Al-Me)[244] 158
Scheme 54 The synthetic route from cheap starting materials bromobenzene 510 and
fluorene 511 to the intermediate PfOH 512 and finally the desired PfBr material
58 159
9
Scheme 55 The reaction of maleic acid 513 and methanol 514 to form the mono-
product 515 and the di-product 516 163
List of Figures
Chapter 1
Figure 11 An annotated picture of an in-line liquid-liquid separator developed by Zaiput
Flow Technologies 33
Figure 12 The response surface showing temperature and residence time effects on the
thermal isomerisation of 133a[108] Reproduced with permission 36
Figure 13 An IR absorption showing the detailed rise of the C-F bond peak over time
indicating the extent of reaction completion[109] Reproduced with permission 37
Figure 1 4 The on-line NMR analysis in the aromatic region of the Grignard reaction
shown in Scheme 116 at different time intervals[120] Reproduced with permission 38
Figure 15 A graphical representation of generated time-series data for a first order
reaction shown in eqn 11 The data is log-transformed to give a linear fit where the
gradient is equal to the rate constant multiplied by -1 42
Figure 16 A graphical representation of generated time-series data for a zero order
reaction shown in eqn 11 This data does not need to be transformed as the linear fit
is equal to the rate constant multiplied by -1 43
Figure 17 A graphical representation of generated time-series data for a second order
reaction shown in eqn 11 This data is plotted as the reciprocal of the concentration
vs time and the gradient of the linear fit to this data is the rate constant 43
Figure 18 A graphical representation of generated time-series data for a second order
reaction shown in eqn 18 where [A] = [B] = This data is plotted as a log-
transformed concentration fraction vs time The gradient of the linear fit to this data is
the rate constant multiplied by the initial concentration of B minus the initial
concentration of A 45
Figure 19 A representation of Michaelis-Menten kinetics where the initial reaction rate of
individual experiments with differing substrate concentrations x is plotted This plot is
then used to determine the kinetic parameters Vmax and KM 48
Figure 110 A representation of the Lineweaver-Burk equation where the inverse of the
initial reaction rate of individual experiments with differing substrate concentrations x
is plotted This plot is then used to determine the kinetic parameters Vmax and KM 49
Figure 111 An overlay of two experimental datasets with the same lsquoexcessrsquo of reactant
concentration for the reaction shown in Scheme 117 This overlap indicates no
product inhibition or catalyst deactivation Reproduced with permission 51
Figure 112 As there is no overlay in the two experimental datasets with the same lsquoexcessrsquo
of reactant concentration in the reaction system shown in Scheme 118 this indicates
some product inhibition or catalyst deactivation A further experiment is necessary to
determine what is occurring Reproduced with permission 52
10
Figure 113 Graphical rate equations for the alkylation reaction shown in Scheme 119 a)
Standard graphical rate equation b) Using the RPKA methodology to observe any
overlap in the lsquodifferent excessrsquo reaction curves This overlap indicates that the
reaction order of Et2Zn is 1 Reproduced with permission 53
Figure 114 A time shift of the profiles of two reactions to observe overlaying plots This
allows the comparison of two profiles with the same starting material concentrations
but different product concentrations therefore identifying signs of product inhibition or
catalyst deactivation Reproduced with permission 54
Figure 115 A summary of the use of RPKA and VTNA a) catalyst deactivation or product
inhibition b) catalyst order c) reagent order d) catalyst deactivation or product
inhibition e) catalyst order f) reagent order Reproduced with permission 56
Figure 116 Some different classes of optimisation problem where variable n is an input
variable and the function evaluation is a measure of how the function is minimised
with the changing variable a) Linear optimisation problem b) Convex optimisation
problem c) Non-linear optimisation problem 59
Figure 117 A representation of a steepest-descent algorithm minimising a 2-dimensional
contoured parameter space where о indicates a measurement Where red areas are
function maxima and blue areas are function minima 60
Figure 118 A representation of a simplex optimisation for a 2-dimensional contoured
parameter space where the numbered vertices of each polyhedron indicate a
measurement Where red areas are function maxima and blue areas are function
minima 61
Figure 119 The different geometric transformations of the Nelder-Mead simplex inside
contraction (XIC) multiple contraction (MC) outside contraction (XOC) reflection (XR)
and expansion (XE) 62
Figure 120 A 1-dimensional optimisation using an interior-point method The approximate
objective function is minimised for the starting trust region t0 63
Figure 121 A 1-dimensional optimisation using an interior-point method The approximate
objective function is minimised for the sequential trust regions until the overall function
is minimised The path that the algorithm can take can be described as the algorithm
path or the central path towards the optimum 63
Figure 122 A depiction of the flow of a simple genetic algorithm 64
Figure 123 A depiction of one iteration of a simple genetic algorithm Figure adapted from
works reported by Boyd amp Vandenberghe[155] 65
Figure 124 The Bayesian optimisation of f(x) where (i) - (viii) represent the sequential
iterations of the minimisation The acquisition function is shown in red measurements
are shown as red dots and the current estimated surrogate model is shown in blue
with its corresponding 95 confidence interval The maximum of the acquisition
function indicates the next measurement to be taken 67
Figure 125 A graphical method to solving ILP problems where C1 - 4 indicate the linear
constraints the green area indicates the feasible region f shows the objective
function red dots represent the integer values of the inputs and P1 and P2 indicate
two feasible potential maxima to the problem Figure adapted from works reported by
Boyd amp Vandenberghe[155] 68
Chapter 2
11
Figure 21 The Mass Matrix inputted into the approach assigning mass to each of the
species 75
Figure 22 The stoichiometric matrices for the reaction model shown in Scheme 21 as
well as the overall stoichiometry matrix S 76
Figure 23 The ILP optimisation identifying a feasible solution to the objective function
hence identifying a mass-balance-allowed reaction Where X1 = A X2 = B X3 = C X4
= D 76
Figure 24 A visual representation of all of the possible reaction models when given five
mass-balance-allowed sample reactions each shown as a different coloured block
When i = 1 each reaction is in itself a model and when i gt 1 each reaction behaves
as a model fragment These fragments when combined in different ways provide full
and unique reaction models each of which are to be assessed for their validity with
respect to experimental data 78
Figure 25 A schematic summarising how the model generation stage of the approach
progresses Where the participating species are inputted and sorted ODE functions
that describe all possible mass-balance-allowed reactions are outputted 79
Figure 26 The iterations of an optimisation algorithm with respect to the convergence of
simulated ODEs with sample data - this occurs via the minimisation of the SSE
output 81
Figure 27 An outline of the stages of the computational approach 88
Figure 28 An example showing the generation of a simulated data set from the literature
a) An ODE is simulated for a particular model with a set of kinetic parameters in this
case A rarr B where mdash = A mdash = B b) Particular time points are taken from this ODE
to represent individual measurements where x = A x = B c) Up to 5 relative
random error is added to these measurements to more closely resemble real
experimental data 90
Figure 29 The fit of the identified model and kinetic parameters to the generated
experimental data with starting concentrations of 01 M benzoic acid and 011 M
iodomethane Where x = benzoic acid x = iodomethane x = methyl benzoate mdash =
benzoic acid (ODE) mdash = iodomethane (ODE) mdash = methyl benzoate (ODE) 93
Figure 210 The fit of the identified model and kinetic parameters to the generated
experimental data with starting concentrations of 1 M nitrile and 2 M hydroxide at 90
degC Where x = nitrile x = amide x = carboxylic acid mdash = nitrile (ODE) mdash = amide
(ODE) mdash = carboxylic acid (ODE) 97
Figure 211 The fit of the identified model and kinetic parameters to the generated
experimental data with starting concentrations of 1 M 24-dichloropyrimidine and 22
M morpholine at 90 degC Where x = 24-dichloropyrimidine x = 4-substituted product x
= 2-substituted product x = bis-substituted product mdash = 24-dichloropyrimidine
(ODE) mdash = 4-substituted product (ODE) mdash = 2-substituted product (ODE) mdash = bis-
substituted product Graph is only shown to 260 minutes to show curvature of the
initial data points 102
Chapter 3
Figure 31 A diagram to show the direction and flows within a flow regime where a)
laminar flow b) turbulent flow 104
12
Figure 32 A plug flow reactor model where there is perfect mixing in the radial direction
but no forward or backward mixing in the axial direction Plugs 1 and 2 are examples
of the infinitely short plugs existing within this reactor model 105
Figure 33 A depiction of how a kinetic experiment can be run utilising a step change in
flow rates between two steady-states (I and II) allowing time-series data to be plotted
from transient data Figure adapted from Mozharov et al[93] 107
Figure 34 A kinetic profile generated from the Knoevenagel condensation shown in
Scheme 31 where kinetic information was obtained by measuring conversation at
given residence times at steady-state at two temperatures Steady-state markers x
are shown as part of the lsquoA Modelrsquo Reproduced with permission 109
Figure 35 A kinetic profile generated from the Knoevenagel condensation shown in
Scheme 31 where kinetic information was obtained using a flow rate step-change at
two temperatures Steady-state markers x are shown as part of the lsquoA Modelrsquo where
step-change markers o are shown as part of the lsquoB Modelrsquo Reproduced with
permission 110
Figure 36 A depiction of how a continuous flow reactor may be described as a series of
sequential pseudo-batch reactors where the colour represents the extent of
conversion from low (green) to high (red) Q represents the total flow rate ti
represents the initial time of each pseudo-batch reactor entering the reactor tf
represents the final time tm is the time at which the concentration is actually
measured by the IR probe Reproduced with permission 110
Figure 37 A combination of the kinetic models for the reaction yielding 37 in Scheme 32
where the differing colours represent different values of S where S is a corrective
residence time multiplier to show the reproducibility of the controlled flow ramp
methodology S = 14 (blue) S = 13 (red) S = 12 (green) S= 23 (orange) steady-
state experiments = x Reproduced with permission 111
Figure 38 A photograph of the automated continuous flow reactor used for this work 113
Figure 39 A mathematically correct representation of how linear gradient flow ramps can
be utilised to sample with a high data density on the initial curvature of the kinetic plot
Where diams = data point Tn = experiment temperature Q = total flow rate Time = time
the reaction has been running τ = residence time that the reaction mixture
experiences 114
Figure 310 Kinetic profiles for two flow ramp experiments at 65 degC and 75 degC where x =
phenol x = phenyl acetate mdash = phenol (ODE) mdash = phenyl acetate (ODE) 117
Figure 311 Graphs showing the agreement between steady-state and flow ramp
measurements for the reaction of phenol with acetyl chloride where curves are fitted
to the steady-state data Where = phenol (steady-state) x = phenol (flow ramp) =
phenyl acetate (steady-state) x = phenyl acetate (flow ramp) 118
Figure 312 Kinetic profiles for four flow ramp experiments at 30 degC 60 degC 160 degC and 180
degC where x = 4-aminophenol x = paracetamol x = diacetamate mdash = 4-aminophenol
(ODE) mdash = paracetamol (ODE) mdash = diacetamate (ODE) See Chapter 732 for full
experimental conditions and raw data 120
Figure 313 Kinetic profiles for the flow ramp experiments at 130 degC 150 degC 190 degC and
210 degC where x = starting material x = Metoprolol x = bis-substituted product mdash =
starting material (ODE) mdash = Metoprolol (ODE) mdash = bis-substituted product (ODE)
See Chapter 733 for full experimental conditions and raw data 123
13
Chapter 4
Figure 41 An illustration of how the lsquoinflationrsquo step takes all mass-balance-allowed
transformations sequentially then deduces all allowed integer and non-integer orders
and generates corresponding rate laws for these transformations If catalytic reactions
are to be explored also rate laws for these catalytic dependencies are also
generated These transformations are all then saved from which full reaction models
can be constructed 130
Figure 42 An overview of the updated computational approach to kinetic model and
parameter determination 137
Figure 43 The fit of the identified model and kinetic parameters to the generated
experimental data with starting concentrations of 12 M 24-difluoronitrobenzene and 3
M pyrrolidine at 30 degC Where x = 24-difluoronitrobenzene x = ortho-substituted
product x = para-substituted product x = bis-substituted product mdash = 24-
difluoronitrobenzene (ODE) mdash = ortho-substituted product (ODE) mdash = para-
substituted product (ODE) mdash = bis-substituted product Plot only shown to 500
minutes to the show curvature of the initial data points 145
Figure 44 The fit of the identified model and kinetic parameters to the generated
experimental data with starting concentrations of 1 M starting material and 08 M
spirodiene at -78 degC Where x = starting material x = spirodiene x = product mdash =
starting material (ODE) mdash = spirodiene (ODE) mdash = product (ODE) 149
Figure 45 The fit of the identified model and kinetic parameters to the generated
experimental data with starting concentrations of 15 M starting material 2 M
diphenylphosphine and 01 M ytterbium catalyst at 22 degC Where x = starting
material x = diphenylphosphine x = product mdash = starting material (ODE) mdash =
diphenylphosphine (ODE) mdash = product (ODE) 152
Chapter 5
Figure 51 The distinctive proton peaks shown in red that are monitored via NMR as time
progresses in the SNAr case study 155
Figure 52 Kinetic profiles for four kinetic experiments at -25 degC 0 degC 25 degC and 50 degC
where = starting material = 2-substituted product = 4-substituted product mdash =
starting material (ODE) mdash = 2-substituted product (ODE) mdash = 4-substituted product
(ODE) See Chapter 751 for full experimental conditions and raw data 156
Figure 53 The batch setup for experimentation in the PfBr case study where the
temperature probe is submerged in the reaction medium that is heated via a heater
stirrer 160
Figure 54 Kinetic profiles for three kinetic experiments at 30 degC 35 degC and 40 degC where
red plots indicate PfBr concentrations and blue plots indicate Pf-Al-Me concentrations
At 30 degC = experimental data mdash = ODE At 35 degC = experimental data - - - =
ODE At 40 degC = experimental data = ODE See Chapter 752 for full
experimental conditions and raw data 161
Figure 55 Kinetic profiles for two kinetic experiments at 50 degC with the initial concentration
of maleic acid at 04 M and 08 M At 04 M = maleic acid mdash = maleic acid (ODE)
= mono-product mdash = mono-product (ODE) = di-product mdash = di-product (ODE)
At 08 M = maleic acid - - - = maleic acid (ODE) = mono-product - - - = mono-
product (ODE) = di-product - - - = di-product (ODE) See Chapter 753 for full
experimental conditions and raw data 165
14
Chapter 73
Figure 731 The flow reactor setup for the phenyl acetate case study experiments 174
Figure 732 An example HPLC chromatogram in the phenyl acetate case study at 254 nm
175
Figure 733 The reactor setup for the paracetamol flow ramp experiment at 30 degC 179
Figure 734 The reactor setup for the paracetamol flow ramp experiment at 60 degC 180
Figure 735 The reactor setup for the paracetamol flow ramp experiment at 160 degC 180
Figure 736 The reactor setup for the paracetamol flow ramp experiment at 180 degC 180
Figure 737 An example HPLC chromatogram from the paracetamol case study showing
the separation of all reaction components at 254 nm 181
Figure 738 A photograph of the automated flow system at AstraZeneca 188
Figure 739 The reactor setup for the metoprolol flow ramp experiments at 190210 degC in
Leeds 189
Figure 7310 The reactor setup for the metoprolol flow ramp experiments at 130150 degC at
AstraZeneca 190
Figure 7311 An example HPLC chromatogram during a kinetic experiment in the
metoprolol case study at 220 nm 190
Chapter 75
Figure 751 The dedicated NMR spectrometer used for kinetic experiments in the SNAr
kinetics case study 199
Figure 752 lsquoStackedrsquo NMR spectrum showing several NMR spectra over time in the 25 degC
experiment 200
Figure 753 A 13C NMR confirming the presence of the PfBr material compared to
literature values to identify the material[246] 207
Figure 754 IR analysis of the PfBr material showing the absence of a hydroxy peak from
any residual PfOH 208
Figure 755 HPLC analysis of the PfBr material at 254 nm indicating that a pure product is
present 208
Figure 756 An example HPLC chromatogram at 230 nm during a kinetic experiment in the
PfBr case study 210
Figure 757 An example NMR spectrum from the maleic acid case study 212
List of Tables
Chapter 1
Table 11 A table summarising reaction analysis techniques in flow systems adapted from
Houben and Lapkin[121] 39
Chapter 2
15
Table 21 A table showing the optimised k values for the identified models in the benzoic
acid alkylation case study alongside each modelrsquos SSE and AICC 92
Table 22 A table showing the top three ranked models for the nitrile hydrolysis case study
The kinetic parameters for each reaction within the model is shown as well as the
SSE and AICC evaluation 95
Table 23 A table showing the top three ranked models for the SNAr case study The kinetic
parameters for each reaction within the model is shown as well as the SSE and AICC
evaluation 100
Chapter 3
Table 31 Evaluation of the feasibility of each reaction model for the phenyl acetate study
116
Table 32 Evaluation of the feasibility of each reaction model for the paracetamol study 120
Table 33 Evaluation of the feasibility of each reaction model for the metoprolol study 124
Chapter 4
Table 41 A table showing examples of allowed and disallowed models according to Rule
4 134
Table 42 A table showing the top five ranked models for the SNAr case study as identified
by the old approach The kinetic parameters for each reaction within the model are
shown as well as the SSE and AICC evaluation 142
Table 43 A table showing the top five ranked models for the SNAr case study as identified
by the new approach The kinetic parameters for each reaction within the model are
shown as well as the SSE and AICC evaluation α denotes a variable molar
dependence within the kinetic parameter units depending on the rate law 143
Table 44 A table showing the top five ranked models for the pentyne case study as
identified by the new approach The kinetic parameters for each reaction within the
model are shown as well as the SSE and AICC evaluation α denotes a variable molar
dependence within the kinetic parameter units depending on the rate law 147
Table 45 A table showing the top five ranked models for the ytterbium catalysis case study
as identified by the new approach The kinetic parameters for each reaction within the
model are shown as well as the SSE and AICC evaluation α denotes a variable molar
dependence within the kinetic parameter units depending on the rate law 150
Chapter 5
Table 51 Evaluation of the feasibility of each reaction model for the SNAr case study
where α is variable for each model depending on the overall model order 156
Table 52 Evaluation of the feasibility of each reaction model for the PfBr case study where
α is variable for each model depending on the overall model order 161
Table 53 Evaluation of the feasibility of each reaction model for the maleic acid case
study where α is variable for each model depending on the overall model order 165
16
17
List of Abbreviations
A Pre-exponential factor
Ac Acetyl
AIC Akaikes information criterion
AICC Corrected Akaikes information criterion
API Active pharmaceutical ingredient
Aq Aqueous
Bn Benzyl
bp Boiling point
Bu Butyl
cm Centimetre
CSTR Continuous stirred tank reactor
CRN Chemical reaction network
DCM Dichloromethane
Ea Activation energy
Equiv Equivalents
Et Ethyl
g Gram
GA Genetic algorithm
GC Gas chromatography
h Hour
HPLC High performance liquid chromatography
Hz Hertz
ID Inner diameter
ILP Integer linear programming
IR Infrared
k Rate constant
K Kelvin
kref Reference rate constant
18
L Litre
m Metre
M Molar
Me Methyl
MILP Mixed integer linear programming
min Minute
mL Millilitre
MM Mass matrix
mmol Millimole
mol Mole
MS Mass spectrometry
NMR Nuclear magnetic resonance
OD Outer diameter
ODE Ordinary differential equation
PFR Plug flow reactor
Ph Phenyl
R Ideal gas constant
Re Reynolds number
S Stoichiometry
SNAr Nucleophilic aromatic substitution
SSE Sum of squared error
T Temperature
TFA Target factor analysis
tR Residence time
Tref Reference temperature
tRes Residence time
V Volume
19
Chapter 1 Introduction
The main aim of this project is to develop and advance methodologies for
kinetic model determination and parameter estimation The acquisition of the
experimental data necessary for these studies is flexible and can be obtained by
any means However given the numerous advantages of continuous flow
chemistry and the availability of a flow chemistry platform many chemistries
were performed using this regime For this reason continuous flow chemistry is
broadly covered in this introduction as well as a comprehensive look at methods
of obtaining kinetic data in Chapter 31
Current methodologies of obtaining kinetic information are herein broadly
covered and critically analysed However in-depth discussions about the
relevant literature to the kinetic methodologies developed during this project are
highlighted in Chapter 21 Furthermore as these kinetic methodologies feature
significant use of optimisation algorithms discussions regarding optimisation
problems and common algorithms are also found in this introductory chapter
This coverage depicts the general relevancy of different types of algorithm to
particular circumstances with specific kinetic fitting algorithm discussions
featured in Chapter 2222
11 Continuous flow chemistry
Continuous flow chemistry is rapidly becoming the optimum way to conduct
a wide variety of different chemical reactions This section introduces the concept
of flow chemistry featuring a discussion of the advantages and disadvantages
as well as when to adopt this methodology This broad introduction also covers
different reports from the literature pertaining to different classes of reaction in
flow as well as how these reactions can be analysed and optimised either on-
line or off-line
111 Batch and flow reactions
To discuss flow chemistry it is first important to understand the
differences between this methodology and traditional batch chemistry Batch
reactions are still the lsquonormalrsquo bench practice today after being standardised 200
years ago in the time of Friedrich Wӧhler as there are still advantages to
20
conducting synthesis this way This batch reaction approach to synthesis
whereby the chemistry is conducted essentially in a vessel is historically the
most fruitful and rewarding approach in terms of discoveries Suzuki couplings[1]
Sonogashira couplings[2] and the Wittig reaction[3] among hundreds of other
ground breaking mechanisms were all discovered via batch reactions A flow
chemistry regime differs in that there is no bulk reaction medium in a vessel By
using pumps tubing and differing flow reactors small volumes of reaction
medium are constantly flowing and reacting to provide a continuous outlet stream
of reacted material Although this flow methodology has been known for a
relatively long time the historic uptake in synthetic laboratories has been low[4]
However as flow technology improves and becomes easier to adopt in the
laboratory[5] it is increasingly important to evaluate whether a particular chemical
process would be most efficient in batch or flow regimes in terms of product
output or otherwise
For example when considering exploratory synthesis in contrast to batch
using flow chemistry consisting of tubing and microreactors to attempt to
discover new syntheses by exploring discrete options is not typically a good
application[6 7] This is because the main strengths of flow processes come
mainly from already existing reaction pathways where optimising product output
is the focus and to construct a flow system to conduct a purely exploratory
reaction is a traditionally inefficient use of time whereas batch can be
implemented much faster In recent years however high throughput flow
systems have been developed for automated discovery[8 9] Unfortunately
though as the equipment for this type of discovery is specialist and can be
expensive it can still be argued that simple exploratory benchtop batch reactions
are still much more efficient in terms of time and cost
There are other general instances where batch is often still favourable for
chemical transformations for example when precipitation drives reaction
completion[7] In batch this isnrsquot an issue however when using a flow setup this
will frequently result in channel mixer or pressure regulator clogging - this is also
true when using high viscous liquids[10] As a general rule precipitation
suspensions and other instances where solids are used can lead to
complications in the process - this can be mitigated through reaction dilution but
may then suffer from low productivity The introduction however of standardised
21
laboratory equipment (such as miniaturised CSTRs Freactors) for continuous
flow can then facilitate such multiphase processes to allow maintained
efficiency[11 12]
Despite some of these limitations there are significant benefits to
continuous flow processes which have become apparent alongside the
tremendous practical advances in recent years many of which have been
utilised in actually transferring batch processes into flow as more and more
batch procedures are superseded[13-15] Reduction of reaction times[16 17] and
increases in conversion and selectivity may be observed by transferring to flow
processes[18] This may be for a number of reasons but is likely due to the
increased mass transfer that can be expected from flow systems as well as the
ability to increase the temperature of the reaction medium further past the boiling
point of the solvent which is discussed further in Chapter 1121 This will lead
to an overall increase in both the reaction rate and productivity Two examples
are shown herein where increased conversion was observed Scheme 11
reports the synthesis of hexene from hexanol in flow by Wilson and McCreedy[19]
with a conversion of around 90 whereas in conventional batch reactors this
reaction conversion does not exceed 60 Most notably there was no
degradation of the performance after three days of continuous use which may
be expected from a fixed bed catalyst Scheme 12 shows another direct
comparison of conversion in flow and batch by Wiles et al[20] where the Michael
addition is completed in 20 minutes with 100 conversion in flow compared to
the reaction completion in 24 hours with 89 conversion in batch
Scheme 11 The conversion of hexanol 11 to hexene 12 in a continuous flow setup[19]
22
Scheme 12 The flow synthesis of the adduct 15 via a Michael addition between the
dicarbonyl 13 and the alkyne 14[20]
A main advantage to using flow chemistry setups to perform reactions
arises from the equipment featured within the setups themselves - namely the
pumps Pump flow rates can be set to very precise flows which can very
accurately deliver particular ratios of reagents at given points along the flow
setup[21-23] This ensures that the correct stoichiometry of the reagents is present
in the reaction and these exact stoichiometries can be delivered continuously
and with minimal error[21 24] This allows for optimisation and kinetics studies with
precise reagent additions that would otherwise be troublesome for an
experimenter to consistently and dependably deliver These same flow rates also
ensure that the residence time is exact and consistent meaning sampling points
are reliably accurate in sampling the reaction medium after a specific reaction
time[25 26] This point however is highly dependent on the mixing regime present
which is discussed further in Chapter 31
Another noteworthy advantage to flow processes is that a large number
of reactions can be executed and hence a large amount of data can be obtained
using only minimal quantities of a reagent in flow This is because much less
reagent is required for reaction and subsequent on-line analysis in a microreactor
compared to bench scale batch setups This is a particularly desirable attribute
of a system if you have an expensive material or a material that is synthesised
by a time consuming process where you need to be conservative with its use
but still obtain lots of experimental data[24]
One example of a reaction that has been successfully transferred from
batch to flow is a multi-step synthesis of ibuprofen 18 conducted by Bogdan et
al[27] This synthesis demonstrates that even flow processes with multiple steps
can be achieved without intermediate purification steps in a streamlined and
efficient manner This is provided as long as care in the reaction chronology has
been undertaken ensuring excess reagents and byproducts from previous steps
are compatible with downstream processes shown in Scheme 13 This
efficiency is important when creating complex molecules because although the
stepwise batch reactor processes are effective they are also very wasteful
particularly when they involve consecutive work-up procedures An example of
this is in the pharmaceutical industry where in general 25 - 100 kg of waste is
23
produced for every 1 kg of complex molecule[28] However to facilitate reaction
compatibility expensive or atom-inefficient transformations may be necessary
such as the use of phenyl-iodine(III) diacetate and TMOF to incur a chemical
rearrangement in the reported ibuprofen synthesis below This may require a
careful balance to achieve green metrics in product manufacturing Further
discussion on reaction telescoping is provided in Chapter 1126
Scheme 13 The multistep continuous flow synthesis of ibuprofen 18
In large scale batch reactor design used in industry the most significant
problems to be overcome are the heating and agitation of the system and it has
even been reported that processes cannot be scaled up further due to
temperature and mixing gradients[29] This problem relates to the fact that it is
difficult to effectively heat and agitate a large mass completely uniformly which
can lead to different reactivities present at different points within the vessel - this
can result in decreased product yield due to an increased rate of side reactions
or more seriously a runaway reaction when exothermic processes are
involved[30 31]
By contrast mesoscale flow systems (channel diameter 1 - 10 mm) and
in particular miniaturised flow reactors (channel diameter 50 - 1000 microm) are
excellent at efficiently heating and mixing reactants[32] Rapid heating of reaction
microchannels through the walls of a preheated reactor ensures the reaction
mixture is thoroughly and uniformly heated and mixed which is attributed to the
24
large surface area to volume ratios of the microchannels[18 33] This heating can
be achieved by oil baths conventional ovens or even microwave heating all of
which achieve the same goal which is precise temperature control with
increased safety[34-36] The high molecular diffusion across the relatively narrow
microchannels allows assumptions of perfect cross-sectional mixing in a lsquoplug
flowrsquo regime[37] (see Chapter 31) and mass transfer can further be improved
through the use of static mixers[38] or CSTRs[39]
This increased safety in flow reactors is attributed to only a small amount
of reaction material present in the reactor at any one time enclosed within a
tubular vessel Therefore although the chemical exposure is the same during
reservoir preparation the experimenter is not exposed to any harmful material
during experimentation as long as all inlets and waste streams are properly
contained The is advantageous especially in processes where there are highly
exothermic steps alongside even the possibility of scale-up of formerly non-
scalable reactions[36 40] This scalability can be achieved simply by running one
flow reactor for a long period of time or several identical flow reactors in parallel
in a process called lsquonumberingrsquo - any number of flow reactors can be lsquonumbered
uprsquo to achieve the required throughput[41-43]
112 Reactions in flow
Alongside the aforementioned general advantages that flow processes
have over batch there are several distinct reaction niches which have specific
facets whereby translation to flow has distinct benefits There are many different
areas where continuous processes have helped to transform research as well
as industrial processes that may branch from them This literature review will
focus only on the most common types of reaction in flow in which most reactions
are likely to encompassed Also refer to flow chemistry reviews on polymer
chemistry[44] the use of extreme temperature[45] and slurry reactors[46]
1121 Temperature-accelerated reactions
Temperature-accelerated reactions are the most basic and most common
use of flow setups whereby reactants are fed into a heated microreactor to
perform a chemical transformation The use of flow enables access to higher
temperatures in a system with excellent safety which means that reactions can
be performed which would otherwise be too slow or unobtainable in other
25
systems Temperature-accelerated reactions in a traditional batch setup are
often limited by the laboratory equipment and the boiling point of the solvent and
having to switch to different higher-boiling solvents can lead to complications in
both the reaction and the purification[47 48] High-pressure batch vessels can be
used to facilitate these higher temperature reactions (such as Parr reactors or
autoclaves)[49] but additional equipment and safety considerations must be
made in these cases
However in flow setups there is no need to give significant consideration
to changing the solvent as the boiling of the solvent can be suppressed in most
cases by the use of a back-pressure regulator[50] Therefore when conducting
these reactions where higher temperatures can be accessed in flow setups the
reaction rates are also generally higher[14] This alongside the aforementioned
increased associated safety in using flow setups can make flow a desirable and
convenient option for temperature-accelerated reactions Scheme 14 and
Scheme 15 show examples of temperature-accelerated reactions that have
been conducted in flow where in both cases the temperature of the reaction was
conducted at a higher temperature than the boiling point of the solvent leading
to decreased reaction times [51 52] It is also worth noting that unless explicitly
stated a back pressure regulator will have been used in all schemes in this
literature review if the temperature of the reaction exceeds the boiling point of
the solvent used
26
Scheme 14 The temperature-accelerated SNAr reaction of 19 with 110 to form 111 in THF
(boiling point 66 degC) under flow conditions[51]
Scheme 15 The Fischer Indole synthesis of 114 from the hydrazine 112 and dihydrofuran
113 in methanol (boiling point 65 degC) using a flow setup[52]
1122 Supercritical fluid
The use of supercritical fluids (SCFs) as solvents in flow processes have
attracted attention in the past 30 years mainly motivated by the prospect of
replacing toxic industrial solvents[53] For example the environmental interest of
using supercritical CO2 or H2O ushers in opportunities for greener chemical
processes by replacing some of the more harmful solvent systems[54-56] This is
an admirable objective for process chemists and can lead to cleaner and more
sustainable reactions[57]
Whilst the green aspects of using SCFs are attractive perhaps the
greatest quality they possess are their physiochemical ldquohybridrdquo properties an
intermediary between liquids and gases whereby properties can be finely tuned
by marginal variations in temperature and pressure As a result SCFs exhibit
gas-like viscosities as well as no surface tension which are objectively
advantageous in processes involving interface and surface chemistry[58-60]
Furthermore the liquid-like densities allow for substantial dissolution of
precursors within the SCF and diffusion coefficients are generally at least 100
times greater in SCFs than in liquids All of these factors contribute towards
processes whereby the reaction conversion is significantly improved as a direct
effect of using SCFs[53 61-63] However the compatibility of these supercritical
solvents must still be tested with the process of interest (as with any solvent) as
there may be solubility or reactivity issues
27
Supercritical CO2 (scCO2) is a common solvent in the realm of SCFs
because of its easily obtained critical parameters at bench scale it is also
extracted easily with high purity as a byproduct from many processes as well as
being non-toxic and non-flammable[64] One of the most notable industrial scale
applications using scCO2 is the hydrogenation of isophorone 115 shown in
Scheme 16 which obtains 116 in a sufficiently pure state without any
downstream purification[65] Another common process developed from the use of
scCO2 by taking advantage of the non-toxicity of the solvent is the
decaffeination of coffee beans which has since become one of the most popular
decaffeination methods[66 67]
Scheme 16 The hydrogenation of isophorone 115 to TMCH 116[65]
One major problem with using scCO2 in flow processes however is its
incompatibility with primary and secondary amines due to carbamate formation
which can precipitate out of solution and therefore block any microchannels in
the system[68] Other supercritical solvents can be used in these cases such as
scNH3 although this presents a problem in itself that it cannot be used with
aqueous solutions because of ammonium hydroxide formation - nonetheless
supercritical ethane and propane have been used as direct replacements for
scCO2 due to similar critical parameters[69]
Using continuous reactors for SCFs have the advantage over batch
reactors that they do not require depressurisation to add further material to the
process or recover products Also a predominant advantage to using continuous
reactors is that reaction parameters such as temperature flow rate and pressure
can all be changed almost independently of each other In context this ability
allows the properties of the SCF to be altered in real time when optimising
reactions which cannot be done easily in batch reactors - this versatility of
continuous reactors makes it the favourable choice when working with SCFs[70]
1123 Photochemical reactions
28
The use of photons at given wavelengths to provide sufficient energy to
overcome activation energy barriers is the basis of photochemical reactions
complex molecular structures can be achieved via these unique reaction
pathways that are otherwise unobtainable via thermochemical or electrochemical
methods[71 72] Implementing photochemical reactions is also beneficial as a
photon is a ldquogreenrdquo reagent which is traceless and thus doesnrsquot require
removalrecycling in the same way many other reagents do
Photochemistry is not regarded only as a unique and novel pathway to
molecules with exotic structures however - one example of where
photochemistry is used extensively in industry is in the Toray process to attain
caprolactam which is used to manufacture Nylon 6[73] Photochemical reactions
have also been found to benefit from continuous flow systems where large-scale
photochemical synthesis is significantly more effective when compared to their
corresponding batch approaches[74] This is due to problems regarding
penetration into the bulk reaction medium which is an important boundary that
has to be overcome Most of the photochemical synthesis occurs within a short
radius of the lamp meaning the reaction conversion is scale dependant The
small tubular diameters in flow systems take advantage of this by exposing the
entire reaction medium to the light source as it passes through the reactor[75]
One example where a photochemical reaction has been implemented into
a flow process is reported in the continuous [2 + 2] photocycloaddition producing
the cyclic product 118 shown in Scheme 17 [74] In this reaction the conversion
is quoted at 83 and because the reaction conversion is scale independent the
continuous process can be run indefinitely to produce over 500 g per 24 hour
period This process can then be scaled up further as in any continuous flow
process by numbering up
29
Scheme 17 The [2 + 2] photocycloaddition of malemide 117 with 1-hexyne to produce the
cyclic product 118[74]
1124 Electrochemical reactions
Electrochemistry is another clean and efficient reaction method in the
realm of organic synthesis where the electricity supplied to the reaction system
induces the formation of the reactive intermediates from neutral substrates This
method of reaction has significant advantages to conventional batch processes
one of which being that harmful oxidising and reducing agents can be substituted
using electrochemistry By applying precisely controlled current between two
electrodes reactions can be achieved by using milder reagents This method
allows milder reagents as electrons can be addedremoved without the need for
chemical reducingoxidising agents which could complicate the reaction
especially in flow systems where downstream processes can be highly affected
by excess chemical reagents[76] Also as the electrons are the ldquoreagentrdquo in these
reactions as well as being widely and readily available electrochemical reaction
pathways become cheaper and less labour-intensive as alternative costly
reagents donrsquot need to be used[77]
One example of where electrochemical synthesis in flow has been
observed is in the anodic substitution reaction by Horii et al [78] shown in scheme
18 with yields of up to 74 In flow processes such as this the laminar flow
regime is used as an advantage - two inlets of separate flows join together in the
reaction vessel where their respective microchannel sidewalls are anodic and
cathodic opposite to one another This ensures the dominant oxidation of the
substrate 119 to form a cationic intermediate whilst the nucleophile 120
diffuses across the tubular diameter to react to afford 121 [79] Laminar flow and
other mixing regimes are discussed further in Chapter 31
Scheme 18 An electrochemical facilitated nucleophilic substitution reaction to afford the
product 121[78]
1125 Enzymatic reactions
30
Biocatalytic processes are also an area in which research is continuously
progressing in order to develop alternative process routes to the synthesis of fine
chemicals The main issues however arise from enzymes only being able to
operate efficiently in narrow pH and temperature ranges with many organic
substrates having poor solubility in water However implementation of enzymes
whilst using non-aqueous solvents can dramatically improve their applicability[80
81] Within biochemical processes this niche can be important in achieving
reaction optimisation despite given limitations with using biocatalysts
The use of immobilised active enzymes in the column of a flow system is
very attractive and there are many reports in the literature of applied
processes[82 83] An example of this is the continuous process of chiral
cyanohydrin formation shown in Scheme 19 where a column is packed with
defatted almond meal[84] There are also examples where multiple columns with
different immobilised enzymes are used as a multistep continuous process in
order to reach the desired product - one example is reported where 7 separate
columns with differing enzymes achieve the synthesis of UDP-galactose from
inexpensive starting materials[85] This is shown in Scheme 110 as a simplified
one column synthesis with multiple enzymes This also shows how
advantageous immobilised biocatalysis can be in multistep synthesis as there
are no catalysts or harmful reagents that can affect downstream processes
Scheme 19 An enzyme catalysed continuous cyanohydrin formation forming 123[84]
Scheme 110 Multiple enzymatic catalysed continuous process to form UDP galactose
125[85] Individual enzymes stated
1126 Telescoped reactions
31
When considering a total synthesis for a pharmaceutical ingredient or
otherwise it would be ideal to limit the number of steps and hence the amount
of waste time and resources This can be achieved in one way by reaction
telescoping[24] Reaction telescoping is essentially performing multiple chemical
transformations to a molecule sequentially without the need for the purification
of intermediates or removal of waste for example the lsquoone-potrsquo synthesis of
pyridine and quinoline derivatives in batch reported by Kobayashi et al[86]
There are further advantages however to reaction telescoping in flow
that are not observed in batch Using a flow system allows the introduction of
reagents in exact stoichiometries at specific points in the reaction cycle simply
by addition via inlets further down the line within the system Pairing these
additions with differing fixed-temperature reaction vessels also allow for isolated
reaction optimisation for each step along the flow setup in a multi-step synthesis
An example of a multi-step reaction where the success of the synthesis is
attributed to the effective residence time and temperature control of each step is
shown in Scheme 111 in the synthesis of 127[87]
Scheme 111 The multi-step flow synthesis of 127 from coupling o-dibromobenzene 126
with varying electrophiles via sequential halogen-lithium exchange reactions[87]
The main drawback of reaction telescoping is that downstream
transformations have to be compatible with side products and waste from
upstream reactions as any incompatibility leads to a lesser conversion of any
intermediates This serves as a hindrance to the other transformations down the
line hence leading to poor conversion for the overall process Therefore when
considering reaction telescoping great care must be taken into account for
reagent compatibility and reaction chronology
A further advantage to using a flow system however is the opportunity of
in-line purification which can solve reagent compatibility issues - this gives
32
greater accessibility to a variety of different reactions that can all be
accomplished in a single process This in-line purification is made possible by an
in-line liquid-liquid separator such as the separator reported by Zaiput Flow
Technologies that allows immiscible liquids to be separated into two streams
one organic and one aqueous via filtration using a hydrophobic membrane[88]
This separator is shown in Figure 11 An example where a membrane
separation has been used shown in Scheme 112 is in an ibuprofen multi-step
synthesis where Snead and Jamison improved on previous work aforementioned
by Bogdan et al[27 89] This in-line separation avoided the need for triflic acid and
increased the yield to 98 by incorporating this aspect within the process
Flow in
Two separated flows out
33
Figure 11 An annotated picture of an in-line liquid-liquid separator developed by Zaiput Flow
Technologies
Scheme 112 A multi-step flow synthesis of ibuprofen 18 involving an in-line purification
step[89]
There are also several other methods of in-line purification that can be
considered alongside or instead of liquid-liquid separation Gas-liquid
separation[90] micro-distillation[91] solid-supported scavenging[50] and gravity-
based separation[92] have all been reported in the literature but have not be
covered in detail as these methods are not well established
113 Reaction analysis
Reaction analysis in benchtop batch processes are relatively time-
consuming and labour-intensive as samples must often be removed by hand
from the reaction mixture to determine reagent conversion product composition
etc Therefore the elimination of these practices and adoption of their respective
flow processes has many potential cost benefits particularly in fine chemical and
pharmaceutical production[93]
On the other hand for these same methods of analysis the sampling
process can be fully automated by the use of sampling valves A sample valve
34
is a device attached to the line of a flow system where the reaction mixture
passes through undisturbed as if it was an extension of the tubing however there
is a lsquoswitchingrsquo mechanism whereby the flow is diverged from its path into a
separate flow system instantaneously then the original flow is restored
milliseconds later This diverted flow then leads to an analytical system (HPLC
mass spectrometer etc) and has much thinner tubing with a constant mobile
phase flowing ready to carry the injected sample to the analytical equipment
This sampling is termed lsquoon-linersquo as the flow is rerouted from the flow along the
reactor lsquoIn-linersquo therefore refers to sampling without the need to divert reaction
material and is typically non-destructive In all cases great care must be taken
in calibrating the machine to chemistries of interest as quantitative analysis can
often only be performed by calibrating the response of the equipment to known
standard concentrations of each chemical species
This section will report on reaction analysis in flow by the use of well-
established and common techniques such as mass spectrometry and high-
performance liquid chromatography (HPLC) as well as fast developing and high
interest areas such as NMR and IR In each case the system is assumed to be
at lsquosteady-statersquo in which the flow output is consistent - this is explained in detail
in Chapter 31 Also refer to specific papers covering onin-line analysis by UV[94
95] Raman[96] fluorescence[97] GC[98 99] XAFS[100] and NIR[101-103]
1131 Mass spectrometry
The use of mass spectrometry in reaction analysis is a common technique
and when coupled with flow systems on-line mass analysis can be employed to
qualitatively and quantitatively monitor reactions for the identification of products
and intermediates as well as analysis of relative composition[104-106] All of this
can be performed in real-time due to the short method times and is ideal in the
context of reaction monitoring as lots of information can be gained from the mass
spectrometer with little need for data manipulation[107]
An example where mass spectrometry has been used for on-line analysis
in order to monitor reactive intermediates in flow is in the formation of benzyne
132 shown in Scheme 113[108] This experiment was conducted to show how
mass spectrometers are ideally suited to on-line analysis applications although
35
they are rarely used in this way as traditional mass spectrometry instruments are
too large and bulky to be conveniently coupled to flow systems
Scheme 113 A reaction scheme showing the formation of benzyne 132 which was followed
by analysis via mass spectrometry[108]
1132 HPLC
HPLC can also give very good qualitative and quantitative analysis of a
reaction mixture - however the advantage that HPLC has over mass
spectrometry is that it is typically easier to quantify the individual components of
a mixture[109] This is a particularly useful characteristic for modelling the kinetics
of a reaction as the relative abundancies of products from a reaction can be
measured precisely by their peak areas in the chromatograph at different
times[110] as well the ability to differentiate molecules with the same mass and
even different isomers of the same mass
An example where the kinetics of a reaction were studied using the coupling
of a flow system with on-line HPLC is in the thermal isomerization of the endo
molecule 133a to its exo counterpart 133b shown in Scheme 114[111] This
example shows how combining on-line HPLC with an automated flow system
with varying pump flow rates and temperature can lead to an understanding of
the factors influencing yield and purity of a process with the ability to provide
useful data to be utilised for generating response surfaces shown in Figure 12
36
Scheme 114 A reaction scheme showing the thermal isomerization of 133a to 133b which
was followed by analysis via HPLC[111]
Figure 12 The response surface showing temperature and residence time effects on the
thermal isomerisation of 133a[111] Reproduced with permission
1133 IR
The use of in-line IR analysis in flow systems is different as it is not
quantitative in the same respect as mass spectrometry or HPLC IR rather
detects the relative abundancies of particular species by monitoring individual
peak signals The advantage to in-line IR is that key identifiable peaks from
functional groups in an IR spectrum (O-H bonds C=O bonds etc) can be
tracked over time as disappearance or appearance of peaks can serve as an
indicator of reaction completion[112-114] IR analysis is fundamentally non-
destructive which in the context of a flow system means that in-line IR analysis
has been developed and integrated into systems which do not require samples
to be removed from the flow a truly continuous non-interrupted stream but still
continuously analysed by IR[115-117]
An example of where in-line IR analysis has been used to monitor the
completion of a reaction is in the fluorination reaction to yield 136 shown in
Scheme 115[112] The in-line probe brand used was the ReactIR In this reaction
the region where C-F bonds are expected to absorb was monitored during the
reaction in order to establish a reaction completion trend based on the intensity
of the peak produced - this is shown in Figure 13
37
Scheme 115 A reaction scheme showing a fluorination reaction yielding 136 which was
followed by analysis via in-line IR[112]
Figure 13 An IR absorption showing the detailed rise of the C-F bond peak over time
indicating the extent of reaction completion[112] Reproduced with permission
1134 NMR
The use of on-line NMR is also a good quantitative option for flow system
analytics The potential to incorporate high resolution NMR systems into a flow
system to show both structural and conformational changes in chemical
transformations is a desirable potential analytical technique At current generally
only small low-field systems have been developed to be conveniently coupled
with flow systems However this technique thus far has led to the increased
value of using NMR spectroscopy as a non-invasive method as more process
development applications are available[118] Although there are some reports of
using high resolution on-line NMR[119 120] most cases generally utilise low field
NMR systems The low resolution analytical technique is unlike traditional NMR
analysis in a high resolution system (gt 300 MHz) as low-field systems tend to
38
analyse the relaxation times and relaxation weighted signals to identify product
[121]
The main downside to this technique is that as the resolution is often too
low for accurate interpretation of NMR spectra because of small differences in
chemical shifts therefore it is difficult to use for multi-component reaction
analysis[122] However there are examples where this technique has been useful
In a report by Goldbach et al[123] low field on-line NMR was used to monitor the
reagent and product concentrations of the Grignard reaction shown in Scheme
116 This reaction conversion was monitored by peak areas in the aromatic
region over time shown in Figure 14 where over 90 conversion was reported
by the examination of peak appearance and disappearance
Scheme 116 The Grignard reaction that was tracked by on-line NMR[123]
Figure 1 4 The on-line NMR analysis in the aromatic region of the Grignard reaction shown in
Scheme 116 at different time intervals[123] Reproduced with permission
1135 Summary
There is no best method of flow reaction analysis as each individual case
would benefit from an independent examination of the necessary results to be
generated This is because different reactions and outcomes would be more
suited to different analytical systems A table summarising these main analytical
methods as well as other methods with their respective sensitivities acquisition
speeds and limitations are shown in Table 11[124]
39
Table 11 A table summarising reaction analysis techniques in flow systems adapted from
Houben and Lapkin[124]
Technique Type of
information
Sensitivity
mol
Typical
speed of
acquisition
s
Limitations
Mid-IR
Chemical
identity
concentration
~10-1 ~1
Steps have to be
taken to tolerate
water within the
system
Near-IR
Chemical
identity
concentration
~10-1 ~1 Less information
than Mid-IR
Raman
Chemical
identity
concentration
crystal structure
~10-1 ~1-100
Fluorescence
masking Raman
signal
UV-vis
Chemical
identity
concentration
~10-4 lt1 Limited number of
species
NMR
Molecular
structure
concentration
~10-3 ~10
Flow method is
currently limited in
sensitivity and
resolution
GC Concentration ~10-6 10-1500
Typically slow
cannot identify
unknown compounds
HPLC Concentration ~10-6 200-1500
Long method times
must be combined
with mass spec for
proof of molecular
identity
Mass spec
Chemical
identity
concentration
~10-8 ~5-20
Requires
chemoinformatics
expertise
40
114 Continuous flow chemistry summary
Flow chemistry is a powerful methodology that can be employed to obtain
enhanced reaction control over similar batch processes increased heat and
mass transfer accurate residence times and precise continuous addition of
reagents These advantages alongside automated sampling procedures mean
that this regime is an ideal methodology for generating time-series data for the
purposes of this project As kinetic studies benefit from this additional control as
well as further hardware-manipulation techniques discussed in Chapter 31 that
are not possible in batch continuous flow will be used when possible However
not all of the identified niches of flow will be exploited for this project such as
SCF usage electrochemistry etc and have been covered as a holistic overview
of the field
Flow chemistry is not the answer to every case study and itrsquos likely that
there will be instances where chemistry is better suited to batch conditions
however Each chemistry must be evaluated to see if the study would more
appropriate for a flow or a batch regime For totally homogenous systems or for
very fast reactions it is likely that a flow system would be used for the generation
of kinetic data For experimental case studies that require sampling of a
suspension in a reaction medium it is likely that a batch system would be more
appropriate In any case the availability of an automated flow system is very
useful (Chapter 32) and unlocks powerful reaction control that can be difficult to
obtain in batch but batch systems must be employed if the chemistry requires it
12 Kinetic methodologies
The kinetic methodologies applied in this project are computational which
utilise ordinary differential equations (ODEs) to describe kinetic models as well
as optimisation algorithms to maximise the convergence of these ODE curves to
the experimental data - this is described in detail in Chapter 222 This differs
from traditional analytical techniques used more generally in chemistry as well
as specific applied methods in determining reaction order described herein
These methods although useful are difficult to scale as they require user input
and at times qualitative analysis which are not suitable for automatic kinetic
information determination Furthermore these methods may struggle with
41
complex reaction systems or systems with loss of mass balance For these
reasons these methods are covered to describe common kinetic analysis
techniques but are not utilised in this project
121 Conventional methodologies
There are several conventional but considered outdated methodologies
to determining kinetic information that are still employed The most basic
analytical solutions for simple reactions can still be powerful in identifying
reaction order and rate constants[125 126] Consider the first order reaction of
species A reacting to form species B shown in eqn 11 The change in the
concentration of A as time progresses can be described as a differential
equation eqn 12 which can then be integrated to give the integrated rate
equation eqn 13 This integrated rate equation can then be used to determine
the concentration of A at any reaction time and a plot of ln[A] vs time allows the
determination of the rate constant as shown in Figure 15 This method also
allows qualitative confirmation of the reaction order as the experimental data
points should fit to a linear line
Where
bull A = starting material
bull B = product
bull k = rate constant
bull [A] = concentration of A
bull t = time
bull [A]t = concentration of A at time t
bull [A]0 = initial concentration of A at t = 0
119860119896rarr119861 eqn 11
119889[119860]
119889119905= minus119896[119860] eqn 12
ln[119860]119905 = minus119896119905 + ln[119860]0 eqn 13
42
Figure 15 A graphical representation of generated time-series data for a first order reaction
shown in eqn 11 The data is log-transformed to give a linear fit where the gradient is
equal to the rate constant multiplied by -1
If the plot of ln[A] vs time does not produce a linear fit then it is likely that
the reaction order is not 1 with respect to A and may be zero order second order
or even another non-integer order To deduce if the reaction is zero order the
reaction can still be viewed as eqn 11 but the rate of change of A must be
described differently as the zero order reaction is not dependant on the
concentration of A at any time Therefore this differential equation can be
described as eqn 14 which can then be integrated to give the integrated rate
equation eqn 15 A simple plot of [A] vs time deduces if the reaction is zero
order as a linear fit indicates this where the rate constant can also be identified
as shown in Figure 16
119889[119860]
119889119905= minus119896 eqn 14
[119860]119905 = minus119896119905 + [119860]0 eqn 15
43
Figure 16 A graphical representation of generated time-series data for a zero order reaction
shown in eqn 11 This data does not need to be transformed as the linear fit is equal to
the rate constant multiplied by -1
If the reaction is second order with respect to A the rate of change of A
must be described as in eqn 16 which when integrated gives the integrated
rate equation shown in eqn 17 A plot of 1[A] vs time then allows the chemist
to deduce that the reaction is second order if a linear fit is obtained The gradient
of this linear fit can then be ascribed as the rate constant as shown in Figure
17
Figure 17 A graphical representation of generated time-series data for a second order
reaction shown in eqn 11 This data is plotted as the reciprocal of the concentration vs
time and the gradient of the linear fit to this data is the rate constant
If the reaction is more complex and features bimolecular reactions of
different species such as the reaction shown in eqn 18 then there are two
possible scenarios that may be considered to determine the rate constant and
confirm the reaction order The first scenario is where the initial concentrations
of species A and species B are the same In this case the rate of change of A
can be written as eqn 19 However at any time [A] = [B] meaning that the
scenario mimics the second order reaction illustrated in eqn 16 and kinetic
information can be identified by using the corresponding aforementioned
methodology
119889[119860]
119889119905= minus119896[119860]2 eqn 16
1
[119860]119905
= 119896119905 +1
[119860]0
eqn 17
44
The second possible scenario is where the initial concentrations of A and
B are not equal In this case it is useful to define a term x where this relates to
the concentration of each of the species that have reacted at a particular time t
The expression of the rate law then becomes eqn 110 which can be rearranged
to eqn 111
If eqn 111 is then integrated between time zero and t the time of interest
Then integrating by using the method of partial fractions eqn 112 becomes
Substituting [A] for [A]0 - x and [B] for [B]0 - x eqn 113 simplifies to
Therefore resulting in the overall integrated rate equation
Which can be rearranged to obtain
This obtained integrated rate equation shown as eqn 116 can then be
used to determine the rate constant A plot of ln[119861][119860]0
[119860][119861]0 vs time confirms a first
order dependence on both species in the bimolecular reaction if a linear fit is
119860 + 119861 119896rarr 119862 eqn 18
119889[119860]
119889119905= minus119896[119860][119861] = minus119896[119860]2 eqn 19
minus119889119909
119889119905= minus119896([119860]0 minus 119909)([119861]0 minus 119909) eqn 110
119889119909
([119860]0 minus 119909)([119861]0 minus 119909)= 119896 119889119905 eqn 111
int119889119909
([119860]0 minus 119909)([119861]0 minus 119909)
119909
0
= 119896 int 119889119905119905
0
eqn 112
int119889119909
([119860]0 minus 119909)([119861]0 minus 119909)
119909
0
=1
[119861]0 minus [119860]0(ln
[119860]0[119860]0 minus 119909
minus ln[119861]0
[119861]0 minus 119909) eqn 113
int119889119909
([119860]0 minus 119909)([119861]0 minus 119909)
119909
0
=1
[119861]0 minus [119860]0(ln[119861][119860]0[119860][119861]0
) eqn 114
1
[119861]0 minus [119860]0(ln[119861][119860]0[119860][119861]0
) = 119896119905 eqn 115
ln[119861][119860]0[119860][119861]0
= 119896([119861]0 minus [119860]0)119905 eqn 116
45
observed as shown in Figure 18 where the gradient can be used to calculate
the rate constant If a bimolecular reaction is known to occur but this graphing
indicates curvature then itrsquos possible that one or more of the species may have
a reaction order not equal to one Under these circumstances other techniques
must be used to confirm reaction order such as computational approaches to
fitting differential equations which is further described in Chapter 222
Figure 18 A graphical representation of generated time-series data for a second order
reaction shown in eqn 18 where [A] = [B] = This data is plotted as a log-
transformed concentration fraction vs time The gradient of the linear fit to this data is the
rate constant multiplied by the initial concentration of B minus the initial concentration of
A
For kinetic studies involving either biological (enzymatic) or chemical
catalysts the reaction system can still be described by elementary reaction steps
and their respective differential equations If we look at one of the simplest
catalytic systems where an enzyme E binds with a substrate S This is a
reversible binding step where the forward reaction step is k1 and the backward
reaction step is k-1 in which the enzyme-substrate complex ES is formed This
complex can then react to form the product P as well as regenerating the
enzyme catalyst E This reaction is shown in eqn 117 and as before the
differential equations with respect to each of these species are described in eqn
118 - 121
119864 + 119878 1198961119896minus1
119864119878 1198962rarr 119864 + 119875 eqn 117
119889[119878]
119889119905= minus1198961[119864][119878] + 119896minus1[119864119878] eqn 118
46
However although this system can be described in this way it is more
commonly described as approximated models as simple assumptions can
derive a model known as Michaelis-Menten kinetics[127 128] This provides a more
simplistic method of catalytic modelling and prediction by relating the catalyst
concentration to the rate enhancement of a reaction in a different way Michaelis-
Menten kinetics employ the steady-state approximation with respect to the
enzyme-substrate complex ES This means that it is assumed that this complex
will rapidly approach a state where it is generated at the same rate that is
consumed This means that the overall rate of change as described in eqn 122
is zero - this allows a new relationship to be derived between the enzyme
substrate and complex as shown in eqn 123
In order to describe the system as an overall equation relating to the rate
of the reaction we must be able to determine the rate of product formation
shown in eqn 120 However as it is unknown what the free enzyme
concentration is at any point after the reaction has progressed it is more
appropriate to describe the free enzyme E as the total concentration of all
enzyme ET minus the complex concentration [E] = [ET] - [ES] This substitution
into the steady-state approximation derived equation eqn 123 allows the
complex concentration to be described by other concentrations
Followed by expansion
Then rearrangement and factorisation
119889[119864]
119889119905= minus1198961[119864][119878] + 119896minus1[119864119878] + 1198962[119864119878] eqn 119
119889[119875]
119889119905= 1198962[119864119878] eqn 120
119889[119864119878]
119889119905= 1198961[119864][119878] minus 119896minus1[119864119878] minus 1198962[119864119878] eqn 121
119889[119864119878]
119889119905= 1198961[119864][119878] minus (119896minus1 + 1198962)[119864119878] = 0 eqn 122
1198961[119864][119878] = (119896minus1 + 1198962)[119864119878] eqn 123
1198961([119864119879] minus [119864119878])[119878] = (119896minus1 + 1198962)[119864119878] eqn 124
1198961[119864119879][119878] minus 1198961[119864119878][119878] = (119896minus1 + 1198962)[119864119878] eqn 125
47
Then a final rearrangement allows the overall relationship to be described as
Therefore substitution of this relationship into the product formation step in eqn
120 where v is the rate of the reaction relates the overall rate with only the total
enzyme concentration substrate concentration and kinetic rate constants
shown as eqn 129
To now arrive at the familiar form of the Michaelis-Menten equation final
substitutions are made for Vmax and KM shown in eqn 130 producing the overall
equation shown in eqn 131
These terms used in the Michaelis-Menten equation Vmax and KM are
different indicators to what are typically found in other areas of kinetics Vmax
relates to the maximum velocity of the reaction which is independent of substrate
concentration KM is a ratio measure of the breakdown of the enzyme-substrate
complex with relation to the its corresponding formation Different enzymes have
different KM values and can be affected by a range of conditions such as pH and
temperature This equation and other variations when the reaction model differs
(such as enzyme catalysed bimolecular reactions) are commonly used when
studying catalytic kinetics to predict how a system will behave upon changing
concentrations
This model is also useful as the apparent reaction order of the system can
be easily described When the concentration of substrate [S] is very low in
comparison to KM this means that the substrate concentration is deemed to be
1198961[119864119879][119878] = (119896minus1 + 1198962)[119864119878] + 1198961[119864119878][119878] eqn 126
1198961[119864119879][119878] = [119864119878]((119896minus1 + 1198962) + 1198961[119878]) eqn 127
[119864119878] =1198961[119864119879][119878]
(119896minus1 + 1198962) + 1198961[119878]=
[119864119879][119878]
(119896minus1 + 11989621198961
) + [119878]
eqn 128
119907 = 1198962[119864119878] =1198962[119864119879][119878]
(119896minus1 + 11989621198961
) + [119878]
eqn 129
119881119898119886119909 = 1198962[119864119879] 119870119872 =119896minus1 + 11989621198961
eqn 130
119907 =119881119898119886119909[119878]
119870119872 + [119878] eqn 131
48
negligible leading to a direct proportionality between the rate and [S] This
means the reaction appropriates first order kinetics as shown in eqn 132 When
[S] is very large in comparison to KM this means that KM is deemed to be
negligible meaning that the equation cancels any occurrence of [S] leading to
overall zero order kinetics This is shown in eqn 133
Vmax and KM can be determined experimentally by measuring the initial
rates of reaction at varying substrate concentrations After these rates are
determined the graph of reaction rate vs substrate concentration can be plotted
where Vmax is the reaction rate that the curve tends to KM is found via plotting
the relationship of reaction rate to substrate concentration indicated by a curve
whereby KM is equal to the substrate concentration (x axis) when the reaction
rate is half of Vmax (y axis) The experimental determination of these constants is
shown in Figure 19
Figure 19 A representation of Michaelis-Menten kinetics where the initial reaction rate of
individual experiments with differing substrate concentrations x is plotted This plot is
then used to determine the kinetic parameters Vmax and KM
Further development in these Michaelis-Menten kinetic plots then
linearised and simplified this technique leading to a simpler interpretation of the
kinetics as well as easier adoption in determining kinetic parameters This form
of the Michaelis-Menten equation known as the Lineweaver-Burk equation
shown in eqn 134 is simply the double-reciprocal form of eqn 131[129] This
119907 =119881119898119886119909[119878]
119870119872 eqn 132
119907 = 119881119898119886119909 eqn 133
49
allows less complex plotting methods to determine Vmax and KM as shown in
Figure 110
Figure 110 A representation of the Lineweaver-Burk equation where the inverse of the initial
reaction rate of individual experiments with differing substrate concentrations x is
plotted This plot is then used to determine the kinetic parameters Vmax and KM
122 Visual kinetic analysis
In order to identify catalytic reaction behaviour and the order of the
species in these processes different methodologies with the theme of visual
qualitative analysis were developed to allow many scientists to easily extract
kinetic information from their reactions Although the root of these analyses are
still highly mathematical visual kinetic analyses depend on the subjective
analysis of the scientist Therefore precise kinetic parameters cannot be
elucidated however the plots required are simple to construct and easy to
interpret allowing easy determination of the order of the catalystreagents or of
product inhibitioncatalyst deactivation[130]
Reaction progress kinetic analysis (RPKA) employs a checklist to visually
determine this kinetic information efficiently with very few reactions[131] These
reactions which feature in situ measurements are combined with mathematical
manipulations to construct graphical rate equations where kinetic information can
be identified This methodology comprises three different analyses for three sets
of experiments These experiments identify product inhibitioncatalyst
deactivation the order in the catalyst and the order in any of the other
components of the reaction
50
For a product inhibitioncatalyst deactivation probing study curves of
reaction rate vs substrate concentration are compared for reactions that are
started at different points - one with higher concentrations (reaction 1) and one
with lower (reaction 2) This means that although the initial starting material
concentrations are different both reactions at some point will have the same
concentration of all of the starting materials as the other reaction This is true as
long as both experiments have the same difference in the concentration of
reactants referred to as lsquosame excessrsquo experiments Consequently at these
points in the reaction where there are the same concentrations of starting
materials the reaction with the greater initial concentrations (reaction 1) will have
a greater concentration of product as well as a greater number of catalytic
turnovers This means that there are two sets of experimental data where the
reaction profiles should overlay to indicate the lack of product inhibition and
catalyst deactivation A case study where there was shown to be no indication of
inhibitiondeactivation is shown in Scheme 117 and Figure 111[132]
Scheme 117 A Heck coupling of an aryl bromide 140 with 141 to form the adduct 142
This case study showed no indication of product inhibition or catalyst deactivation
51
Figure 111 An overlay of two experimental datasets with the same lsquoexcessrsquo of reactant
concentration for the reaction shown in Scheme 117 This overlap indicates no product
inhibition or catalyst deactivation Reproduced with permission
If these curves donrsquot overlay it can be inferred that product inhibition or
catalyst deactivation is occurring An example of this is shown in Scheme 118
and Figure 112[133] To discern between these two possibilities a third
experiment is required where there is more product added This experiment
should feature the same initial concentrations as the experiment initiated at lower
concentrations (reaction 2) but the reaction should also feature the same
product concentration as generated by the other reaction until this point This
results in two reactions that are identical in stoichiometric composition but vary
in the number of turnovers completed by the catalyst Therefore overlay of these
two reaction profiles indicate product inhibition whilst no overlay indicates
catalyst deactivation
Scheme 118 The epoxide opening of 143 to form 144 using a catalytic system This case
study indicates some product inhibition or catalyst deactivation
52
Figure 112 As there is no overlay in the two experimental datasets with the same lsquoexcessrsquo of
reactant concentration in the reaction system shown in Scheme 118 this indicates
some product inhibition or catalyst deactivation A further experiment is necessary to
determine what is occurring Reproduced with permission
To then use RPKA to elucidate the order in catalyst the datasets of
different reactions run with different catalyst concentrations are plotted as
rate[cat]γ vs substrate concentration The value of γ is changed until all of the
curves overlay - this value is then the correct order in the catalyst Similarly for
determining the order in a given reactant ldquoBrdquo the datasets of lsquodifferent excessrsquo
reactions are obtained ie where all concentrations are constant apart from the
specific substrate of interest in this case reactant B The profiles are plotted as
rate[B]β vs [A] and the value of β is altered until the curves overlay This value
of β then indicates the correct order for reactant B A reported example of an
alkylation reaction shown in Scheme 119 was analysed in this manner to
determine the order with respect to Et2Zn 146 by performing lsquodifferent excessrsquo
experiments as shown in Figure 113a This data was then plotted using this
methodology in Figure 113b to confirm the reaction order of this species to be
1[131]
53
Scheme 119 A nickel-catalysed alkylation reaction of chalcone 145 with Et2Zn 146 to form
the adduct 147
Figure 113 Graphical rate equations for the alkylation reaction shown in Scheme 119 a)
Standard graphical rate equation b) Using the RPKA methodology to observe any
overlap in the lsquodifferent excessrsquo reaction curves This overlap indicates that the reaction
order of Et2Zn is 1 Reproduced with permission
Another form of visual kinetic analysis Variable Time Normalisation
Analysis (VTNA) has also been reported to determine this same information by
utilising exclusively concentration-time reaction profiles[134 135] This technique
may be preferential to RPKA as this data is typically more readily available from
54
the use of almost any reaction monitoring technique when compared to the data
handling necessary to extract rate information
To identify product inhibition or catalyst deactivation the reaction profiles
of two or more reactions are examined where the reactions have different
starting concentrations - these datasets are both plotted together The profile of
the reaction with the lower initial concentration of starting materials is then shifted
on the time axis until the first data point overlaps with the second (higher initial
concentrations of starting materials) reaction profile If there is an overlay of the
two concentration profiles at this point this suggests that there is no product
inhibition or catalyst deactivation present in the system This procedure is
highlighted in Figure 114[130] However a lack of overlay indicates that one of
these scenarios is present and a third experiment must be conducted to
determine the cause of this lack of overlay This third experiment must contain
added product in the same way as previously mentioned for the RPKA
methodology where an overlay of this new curve with existing data indicates
product inhibition and the converse outcome indicates catalyst deactivation
Figure 114 A time shift of the profiles of two reactions to observe overlaying plots This allows
the comparison of two profiles with the same starting material concentrations but
different product concentrations therefore identifying signs of product inhibition or
catalyst deactivation Reproduced with permission
To then elucidate the order in any of the species present two reactions or
more are run with different initial concentrations of this species S but with the
same initial concentrations of all other species The time scale of these reactions
are then replaced with Σ[S]γΔt - this expression is shown in eqn 134[136 137] A
plot of concentration of S vs Σ[S]γΔt is then graphed where the value of γ that
produces an overlay of the reaction profiles is the order in species S in a similar
55
manner to RPKA plotting methods This plotting method can be used for
identifying both the order in catalysts and reactants in a chemical system
Where
bull n = number of experiments
bull i = current experiment
bull γ = order of reaction
bull t = time of measurement
These visual kinetic analysis methods may be used in different
circumstances for the simple determination of reactantcatalyst orders as well
as to identify any occurrences of product inhibition or catalyst deactivation
Where reaction rate information is available RPKA may be used and where
concentration-time data is available VTNA can be used There are many
applications reported by academic and industrial research groups in a wide
range of catalytic reactions using both RPKA[138-140] and VTNA[141-143] Figure
115 shows a summary of the analysis of these techniques with the information
that each technique provides given the particular experimental protocol[130]
sum([119878]119894 + [119878]119894minus1
2)
120574
(119905119894 minus 119905119894minus1)
119899
119894=1
eqn 134
56
Figure 115 A summary of the use of RPKA and VTNA a) catalyst deactivation or product
inhibition b) catalyst order c) reagent order d) catalyst deactivation or product
inhibition e) catalyst order f) reagent order Reproduced with permission
123 Kinetic methodologies summary
Herein reported are several methodologies to determine kinetic
information all of which have become convention to varying degrees and
adopted by many experts and non-experts alike It is because of the large
adoption of these techniques that is why these particular methods have been
covered in this introduction although the usage of them within the context of this
project will be minimal There are many other more complex methodologies
peripheral to this project that although are very powerful in particular
circumstances are not widely adopted by research groups For this reason the
concepts of these methodologies are not introduced but for further reading there
are reports to be found on model-based design of experiments (mbDoE)[144-146]
hybrid modelling[147] and soft modelling[148-150] as well as other more niche
techniques that can be found in the literature[151-153]
These introduced methodologies are unlikely to be used in the context of
this project as many require qualitative assessments or data manipulation by a
user that is difficult to automate Furthermore the analysis of complex reaction
models may become more and more difficult with increasing model terms
meaning that precise kinetic parameters may also be more difficult to determine
These factors produce tough challenges in the context of the main aims of the
project (described further in Chapter 14) as the identification of kinetic models
and parameters cannot be scaled effectively or automated Therefore other
procedures are utilised in answering the challenge of creating a fully autonomous
kinetic model and parameter determination methodology which are introduced
in detail in Chapter 22
13 Optimisation
When searching for the optimum solution(s) to a particular optimisation
problem the best approach in gaining the most amount of information possible
would be to simply measure the response of the optimisation function at every
combination of input parameters at infinitesimally small variations This would
give a complete and perfect insight into the impact of the input parameters on
57
the response meaning that it would be easy for a user to even qualitatively
identify the optimum However as function evaluations can be expensive
(computationally and otherwise) performing this resource- and time-intensive
optimisation is not feasible[154 155] Approximations of this approach can be
performed in some circumstances by applying grid search methodology[156] but
for many applications the number of function evaluations necessary to explore
such a large number of parameter combinations means that this approach is not
viable Due to the fixed-space exploration of these approaches parameter
estimations may also be imprecise
For both efficient and accurate determination of optimum parameter inputs
for a given function it is often appropriate to use an optimisation algorithm These
algorithms heavily vary in their approaches to identifying optimised outputs but
a major criteria that they attempt to fulfil is to obtain this information in an efficient
manner - specifically saving computational time and memory The choice of
algorithm can then depend on the nature of the problem specifically the type of
optimisation (local or global) as well as the nature of the optimisation problem
An algorithm can still generally achieve optimality in many circumstances
however specific algorithms have been found to perform more efficiently in
different situations [157]
Many algorithms can be broadly described as either a local or a global
optimiser Local optimisers are fast can handle large-scale problems and are
widely applicable to many scenarios For this reason they are employed
extensively in a variety of circumstances However in local optimisation the
compromise is to accept that the identified optimum may only be locally optimal
which does not guarantee a result that is globally optimal ie a better function
evaluation than all other feasible points[158] These optimisers also require a
starting point which is a critical difference between local and global optimisers
as this can affect the objective value of the local solution that is found
In global optimisation by contrast the true global optimum of the system is
found The compromise however is often efficiency Global optimisation
algorithms are commonly used where the computational cost of the function
evaluations is not critical This is because the number of function evaluations is
traditionally very high which can also lead to very large computational times[158]
Therefore the choice to use a global optimisation algorithm may be made in
58
circumstances where the value of certifying the true global optimum outweighs
the computational cost to arrive at this identification Careful considerations must
therefore be made in selecting the optimal algorithm based on what is desired in
each scenario
The nature of the optimisation problem itself can also be a large factor in
the choice of algorithm used as some algorithms can identify optima more
efficiently based on the type of problem present[159] Some common optimisation
problems are highlighted in Figure 116 Specific classes of algorithms can then
be utilised in different scenarios Some classes of these algorithms include
linear programming (LP)[160] mixed integer linear programming (MILP)[161]
nonlinear programming (NLP)[162] convex programming (CP)[163] quadratic
programming (QP)[164] and more[158] These algorithm classes can then also be
further separated into discrete and continuous algorithms then further still in
many ways
59
Figure 116 Some different classes of optimisation problem where variable n is an input
variable and the function evaluation is a measure of how the function is minimised with
the changing variable a) Linear optimisation problem b) Convex optimisation problem
c) Non-linear optimisation problem
As it is beyond the scope of this project to compare and discuss classes of
optimisation algorithms classifications are made only on their localglobal
nature Commonly utilised local and global algorithms are qualitatively reported
with reference to further reading for mathematical proofs As this project also
involves heavy use of specific optimisation algorithms (in a black box manner)
those utilised are also introduced qualitatively
131 Local algorithms
Many local optimisation algorithms typically iterate towards an optimum
by using gradients in the response or approximating the local response surface
around the measurements One of the most intuitive and simplest form of
gradient-based algorithm is the steepest descent algorithm that iterates by
performing measurements along the trajectory of lsquosteepest-descentrsquo towards the
minimum[165] An example steepest-descent representation is shown in Figure
117 Shown are two variables on the x and y axes respectively X1 and X2 where
the blue contoured area represents a minimum in the response and the red area
represents a maximum in the response A steepest-descent algorithm initially
takes a guess of the inputs to measure the response The algorithm then runs
exploratory measurements in each direction from the initial guess and calculates
the change in the response for each direction The most favourable direction in
n-dimensional space is identified and measurements continue along this
trajectory towards the minimum until a decrease in the response is observed
The most favourable direction is then identified again until the measurements
can no longer observe a favourable change in the output This terminates the
algorithm as it has converged on a local minimum[166]
60
Figure 117 A representation of a steepest-descent algorithm minimising a 2-dimensional
contoured parameter space where о indicates a measurement Where red areas are
function maxima and blue areas are function minima
Another intuitive gradient-based optimisation algorithm is the simplex
algorithm[167] This method uses convex polyhedra formed of n + 1 vertices
(where n is the number of variables) - an individual polyhedron is referred to as
a simplex The algorithm begins by conducting either user-defined or random
measurements of the response function at particular inputs as shown in Figure
118 in 2-dimensional space where each vertex of the initial simplex represents
a function evaluation measurement The worst performing vertex is then
replaced upon each iteration of the algorithm via a reflection resulting in a new
simplex that explores a new area of parameter space This approach locates
areas with a more optimal response and hence successive simplex iteration
converge on a local optima at point
61
Figure 118 A representation of a simplex optimisation for a 2-dimensional contoured
parameter space where the numbered vertices of each polyhedron indicate a
measurement Where red areas are function maxima and blue areas are function
minima
As shown in Figure 118 the initial simplex comprising of the
measurements 1 - 3 is evaluated via the response function at each vertex The
worst vertex measurement 2 is then replaced via reflection to evaluate the
response function at measurement 4 Similarly measurement 3 is then replaced
by measurement 5 in a further simplex iteration The optimisation typically stops
when a better response function evaluation cannot be found indicating that a
local optimum has been identified - this is illustrated by measurement 11 Further
modifications have also been adapted from this methodology notably the
Nelder-Mead simplex algorithm[168] that allows further geometric transformations
as well as just reflections These transformations are highlighted in Figure 119
Because of the efficient and intuitive nature of these simplex algorithms
particularly the adapted Nelder-Mead variation their use in applications in the
literature are vast the original Nelder-Mead report has over 30000 citations
62
Figure 119 The different geometric transformations of the Nelder-Mead simplex inside
contraction (XIC) multiple contraction (MC) outside contraction (XOC) reflection (XR) and
expansion (XE)
Another notable form of local optimisation methodology is the interior-
point method The interior-point method is a class of algorithm that is very
effective at solving both nonlinear and convex problems by approximating local
regions around measurements as a lsquotrust regionrsquo[157] An initial trust region t0 is
identified around the starting point shown as x0 in Figure XY where the trust
region has an approximated objective function to minimise The gradient of the
trust region determines both how the region is approximated as either linear or
quadratic and also the steps necessary in minimising the approximated
objective function This optimisation is shown as a 1-dimensional minimisation in
Figure 120 where the x-axis is the magnitude of the variable and the y-axis is
the measure of the approximated objective function
63
Figure 120 A 1-dimensional optimisation using an interior-point method The approximate
objective function is minimised for the starting trust region t0
When this initial trust region objective function is minimised a new trust
region around this minimum is then approximated shown as t1 in Figure 121
This new approximated objective function is then also minimised The algorithm
continues to iterate via trust regions along what can be described holistically as
the lsquocentral pathrsquo towards the optimum for the true objective function where no
further improvements can be made This central path can be viewed as an
averaged direction based on the actual algorithm path taken In this example
the is objective function was minimised in the fourth trust region t3 finding the
optimum xbest More detailed algorithmic and mathematical discussions of this
optimisation technique can be found in some of the more relatively recent
reports[169 170]
Figure 121 A 1-dimensional optimisation using an interior-point method The approximate
objective function is minimised for the sequential trust regions until the overall function is
minimised The path that the algorithm can take can be described as the algorithm path
or the central path towards the optimum
132 Global
There is much variation in the methodologies applied by global
optimisation algorithms but one of the most common techniques relates to what
can broadly be described as a genetic algorithm[171] Genetics algorithms perform
computations to search for a global optimum utilising techniques inspired by
64
Darwinian evolutionary biology Although there are many forms of genetic
algorithms the methodology of a simple genetic algorithm (SGA) is qualitatively
introduced herein The six stages of SGA can be categorised as initialisation
evaluation selection crossover mutation and replacement After initialisation
the other stages of SGA are repeatedly iterated until the optimum has been
found which leads to termination of the algorithm The optimum is typically
assumed to be found if the evaluation stage does not produce a better function
evaluation (fitness value) for the given objective function (fitness function)[158]
The workflow of the algorithm is depicted in Figure 122
Figure 122 A depiction of the flow of a simple genetic algorithm
The selection stage aims to find the best parents from the current
population to generate the next population where a population is a collection of
all of the sets of inputs for the given variables and a parent is one potential set
of inputs from this population The parents are often selected simply based on
their fitness value In the crossover stage each individual variable input value
(chromosome) from each parent has a probability of 05 to exist in the resulting
children set Each of the children in the following population then have another
given probability of a random chromosome mutating in the mutation stage This
stage prevents a genetic algorithm from becoming stuck in a local minima After
this cycle has occurred this represents one iteration of the algorithm which then
successively occurs until the optimum has been reached This SGA methodology
is highlighted in the adapted simple example shown in Figure 123 whereby a
fitness function (the sum of all inputs) is maximised by the input of integer
chromosomes[158] The ability of genetic algorithms to obtain an optimised result
65
for a given function is very desirable even with a very large number of input
variables Despite the high computational expenditure to this methodology
requires itrsquos reliability has resulted in high adoption in the general literature for
many applications
Figure 123 A depiction of one iteration of a simple genetic algorithm Figure adapted from
works reported by Boyd amp Vandenberghe[158]
Bayesian optimisation is another category of global optimisation methods
that generally proceed in a more efficient manner than genetic algorithms by
utilising approximated (surrogate) models to optimise expensive-to-evaluate
objective functions[166] Random evaluated data points are initially conducted
then a surrogate model is built to fit these data points as well as a corresponding
acquisition function Bayesian optimisation methods obtain their efficiency from
their use of these acquisition functions which balance exploration of the
parameter space and exploitation of already known high-performing regions of
parameter space[172] This acquisition function is maximised after each iteration
of the algorithm to determine the optimum measurement point to evaluate next
in order to explore parameter space but also attempt to gain a better evaluation
Iterations of a Bayesian optimisation for the minimisation of an arbitrary
function f(x) with respect to the 1-dimensional optimisation of variable x is
shown in Figure 124[166] Two initial measurements are inputted shown as red
dots in the first iteration (i) The surrogate model is fitted in blue where the blue
area indicates the uncertainty in the model The acquisition function is shown in
red with a vertical red line indicating the next parameter measurement to be
evaluated - this evaluation is shown specifically in (i) as another red dot From
the second iteration (ii) there is now enough data to fit 95 confidence intervals
to the surrogate model indicating the regions of highest uncertainty The
66
maximum of the acquisition function again determines the next parameter
measurement As aforementioned this parameter measurement is made based
on the compromise of exploring known regions of high performance and regions
where these confidence intervals are the largest As further measurements are
made in the iterations thereafter (iii) - (viii) the confidence intervals shrink
around areas richer with measurements and the surrogate model gains
confidence in its predictions Therefore as the algorithm gains confidence in the
model this means that the algorithm also gains confidence that it has achieved
the global optimum for the particular function
67
Figure 124 The Bayesian optimisation of f(x) where (i) - (viii) represent the sequential
iterations of the minimisation The acquisition function is shown in red measurements
are shown as red dots and the current estimated surrogate model is shown in blue with
its corresponding 95 confidence interval The maximum of the acquisition function
indicates the next measurement to be taken
Integer linear programming (ILP) is a class of methodologies that are
concerned with variables that can only take the form of integers and although is
not classically a type of global optimisation algorithm is still a mathematical
optimisation that is useful in specific cases and is utilised in this project An ILP
problem is in general very difficult to solve and many solvers have attempted to
simplify the procedure by utilising a much simpler linear programming (LP)
approach then rounding down the values to the nearest integer - this is known
as LP relaxation but may not always be effective in identifying the optimum
solution so other techniques must be used[158] In ILP optimisations it is also
common to have multiple linear constraints which define a feasible region that
the optimum can be found
Although ILP algorithms may proceed using different methodologies the
most intuitive introduction would be a 2-dimensional problem with a graphical
method The function to be maximised f shown as eqn 135 is bound by 4
linear constraints C1 - 4 shown as eqn 136 - 139
As the problem consists of two variables x and y it can be illustrated by a 2-
dimensional graphical plane where each linear constraint is a straight line
forming a closed feasible region - this is indicated in Figure 125[158] Therefore
all feasible solutions to this problem must be an integer in x and y within the
bounds of this feasible region The objective function f is represented as a
straight line with given inputs of x and y that indicates its current position This
function however can be viewed as a dynamic line that moves in parallel with
respect to different values of x and y Therefore in order to obtain the maximum
feasible evaluation of f the line is moved from its current location in the figure
119891 = 12119909 + 7119910 eqn 135
1198621 = 2119909 minus 3119910 le 6 eqn 136
1198622 = 7119909 + 4119910 le 28 eqn 137
1198623 = minus119909 + 119910 le 2 eqn 138
1198624 = minus2119909 minus 119910 le 2 eqn 139
68
until it intersects with the allowed two integer-valued inputs within the feasible
region for the first time All integer-valued input combinations within the feasible
region are marked with a red dot where the first intersecting point would be either
point 1 (23) or point 2 (31) indicated as P1 and P2 respectively These points
can be evaluated mathematically by the objective function to determinine the true
maximum where P1 = 43 and P2 = 45 Although this specific example is 2-
dimensional and this intuitive graphical method cannot be easily performed in 3-
dimensions and is impossible in further dimensions many computational ILP
algorithms proceed using this generalised concept to identify optimum inputs for
a given function
Figure 125 A graphical method to solving ILP problems where C1 - 4 indicate the linear
constraints the green area indicates the feasible region f shows the objective function
red dots represent the integer values of the inputs and P1 and P2 indicate two feasible
potential maxima to the problem Figure adapted from works reported by Boyd amp
Vandenberghe[158]
133 Optimisation summary
There are many methodologies that optimisation algorithms utilise
meaning that there are several classes of algorithm that are available and then
69
multiple subclasses thereafter There are specific cases where a particular
algorithm class is necessary to solve a problem but also cases where many
algorithms may be suitable it is then necessary to decide which algorithm to use
in this instance based on other factors such as computational efficiency In this
project these decisions will be explored as optimisation algorithms must be used
in multiple unique scenarios This is because other methodologies such as grid
search are too inefficient and imprecise especially as many input variables (for
example kinetic parameters to be optimised) must be determined in an
appropriate length of time and with high precision
14 Research aim
The aim of this project is to develop and advance an automated methodology
to kinetic model and parameter determination The basis of this project arises
from a methodology reported by Tsu et al[173] that provides a framework to a
technique that achieves this by evaluating all possible reaction models This
reported framework however has limited simulated examples and no real
experimental examples that prove its efficiency This methodology can represent
a positive change in the laboratory where physical-organic chemists can make
use of their human resource on other tasks instead of determining a reaction
model and kinetic parameters which can be assigned to a computer This is the
advantage to exploring this automated methodology that this project is
predicated on which leads the specific project goals herein described
bull To build this automated computational approach to kinetic model and
parameter determination based on the framework aforementioned as
well as to test the effectiveness of the approach in simulatedliterature
case studies (Chapter 2)
bull To prove the effectiveness of the approach in real experimental case
studies This approach will be coupled with automated kinetic profile
generation by flow rate manipulation in a continuous flow chemistry
experimental setup (Chapter 3)
Although methodology described is very powerful for many chemical
scenarios there are also instances where this technique does not work
Specifically this approach is not designed for applications where the reaction
70
order can be a non-integer or where particular species may be catalytic in
nature Therefore further specific project goals are described
bull To further develop this automated approach to kinetic model and
parameter determination to include chemistries that may proceed via a
catalytic route or have non-integer orders with respect to one or more
species in the reaction model The effectiveness of this new approach
must also be proven in a simulatedliterature case study(s) (Chapter 4)
bull To prove the effectiveness of this new approach in real experimental case
studies to achieve kinetic information (Chapter 5)
This project will ultimately lead to a tool that any chemist can utilise by
plugging time-series data and chemical species into the automated approach
then observing the output in the form of the most likely kinetic model and
associated parameters Without kinetic expertise any chemist will be able to use
this approach and interpret the output in order to obtain scalable process
understanding
Chapter 2 Development of the computational approach to
kinetic model determination
21 Introduction
A chemical system can be seen as a cascading dynamic reaction
scheme where molecules can orientate themselves in a particular way and with
a particular energy to allow a reaction to occur This reaction of course will follow
a particular reaction mechanism These mechanisms can give a deep
understanding of the underlying chemistry that we merely observe as a
transformation and can give real-world benefits as it then becomes clearer and
easier to control and understand chemical reactivity[174 175]
For the development of a chemical process however one of the greater
concerns is to mathematically characterise the transformation from the starting
materials to products - this can be complex and occur over many reaction steps
and involve many measurable and immeasurable intermediates This allows
quantitative information to be gained regarding the chemical synthesis allowing
71
for classical reaction engineering principles to be applied to shorten process
development times and lower costs[173] Therefore the objective is to develop
stoichiometric and kinetic descriptions of the individual transformations rather
than detailed mechanistic insights and rationales[176] Where stoichiometry refers
to the stoichiometric coefficient of a particular species in a reaction and kinetic
descriptions refer to the kinetic parameters involved in the rate equations for a
process For a system with multiple reactions this is referred to as a chemical
reaction network (CRN)
The basis for many stoichiometric and kinetic modelling studies with the
specific aim of CRN determination is the data-driven work reported by Aris and
Mah[177] This work is an early example of using computation to evaluate aspects
of a CRN specifically how many independent reactions can be shown to account
for changes in experimental data providing that all chemical species are
measured Bonvin and Rippin[178] later reported tar
get factor analysis (TFA) which was shown to derive approximate stoichiometric
models for complex systems as well as to test user-inputted stoichiometries for
their suitability to experimental (simulated) data TFA has been used and
advanced to verify proposed reaction stoichiometry in a select few reported
works[179 180]
TFA was then used as the basis for further work reported by Brendel et
al[181] and Bhatt et al[182] whereby an incremental identification method was
proposed This is a step-wise method where the stoichiometry is initially verified
using TFA then other model identification strategies are utilised to identify the
structure and parameters of the rate laws within the ODE models However TFA
initially requires a CRN to be at least postulated by a user before it can be used
This requires a high degree of chemical intuition but may also be incorrect as
there are many possible forms in which the CRN can exist especially when
dealing with a system with a large number of chemical species
An alternative step-wise method was also reported by Burnham et al[183]
in which a global ODE model structure was generated which is capable of
representing an entire set of possible chemical reactions As this global ODE
model structure represents an over-trained model model terms are sequentially
removed using statistical measures until all insignificant terms are removed
72
giving the final CRN As this features several optimisations of models with many
kinetic parameters in order to identify insignificant terms this optimisation can be
very slow and also suffer from local optima This is also the case with the
determination of insignificant terms as the identified optimum model itself may
be non-global
Willis and von Stosch[176] then reported the use of mixed integer linear
programming (MILP) to determine the model structure as well as its associated
kinetic parameters This was because previously reported step-wise
identification approaches fail to consistently predict the underlying network
structure[184-186] In this work a global CRN structure was reported but MILP was
used to dismiss all non-mass-balancing reactions from the structure
Decomposition of the global structure then occurs by statistical means and
although the global structure is now much smaller in this work termination at
local optima may still be an issue
Tsu et al[173] then reported an improvement upon this method where ILP
initially identifies all mass-balancing reactions then builds every possible
reaction model It is this approach that will be focussed on in this chapter and
further description and discussion is provided in Chapter 22 Every model is then
fitted and statistically evaluated which avoids the potential pitfall of local optima
when determining the correct model However this can be computationally
demanding as there are many more models to evaluate than in any previously
reported work
Other works in the literature include more algorithmic approaches to CRN
identification Differential evolution[187] genetic programming[188] and multi-
objective genetic algorithms[189] have all been used as global optimisers to
attempt to determine the CRN These specific global optimisers which focus on
mimicking real-life Darwinian evolution are attractive as the CRN is identified
with minimal human interaction or expertise However this optimisation method
can still encounter problems due to local optima and take a very long time to
compute due to the number of iterations necessary for convergence upon the
optimum
The main assumption that is universal among these approaches to CRN
determination is that all reaction kinetics follow the law of mass action This
73
states that the rate of reaction of an elementary reaction is directly proportional
to the product of the concentrations of the reactants raised to the power of their
stoichiometric coefficients[190] For the reaction shown in eqn 1 based on the
law of mass action the reaction rate can be described by eqn 2 and therefore
eqn 3 The kinetic rate constant k therefore determines the speed of the
reaction as well as the reactant concentrations
Where
bull α β γ = stoichiometric coefficients
bull x1-3 = chemical species
bull k = kinetic rate constant
bull rate = rate of reaction
The law of mass action is applicable in most cases however there are
particular cases where it is not accurate to describe a process using mass action
kinetics where these approaches are not applicable Such processes typically
occur when concentrations of particular substrates are very low[191]
22 Development of the approach
The computational approach was developed using MATLAB by loosely
following the approach outlined by Tsu et al[173] The approach contains two main
sequential stages kinetic model generation and kinetic model fitting Firstly all
mass-balance-allowed reactions are identified from the inputted species (starting
materials intermediates and products) Then all of the feasible reaction models
ie all possible combinations of these allowed reactions are compiled and stored
in a model database
After the model database has been generated for the particular process
the kinetic model fitting stage then evaluates the fit of the ordinary differential
equations (ODEs) for that particular model to the experimental data provided
The MATLAB ODE solvers can be used to in such a way to allow an assessment
1205721199091 + 1205731199092119896rarr 1205741199093 eqn 21
119903119886119905119890 prop [1199091]120572[1199092]
120573 eqn 22
119903119886119905119890 = 119896[1199091]120572[1199092]
120573 eqn 23
74
of how the concentration of a species changes over time when given particular k
values Therefore optimising the k values for a given reaction model by
maximising the convergence of the ODEs with the experimental data provides
an indirect route to their identification The convergence metric which is the sum
of squared error (SSE) between the simulated ODEs and the data as well as the
k values for each model are then stored
Statistical analysis is then applied to each of the models Corrected
Akaikersquos Information Criterion (AICC) is used as a measure to identify the models
that best balance model simplicity and convergence to the data and hence
identify the most valid models When these models have been identified it is
then possible to run Monte Carlo simulations if the error of the experimental data
is known These simulations assume that the error is normally distributed around
the data point and compile both the error in experimental data and error in the
kinetic fitting of the ODE to obtain an uncertainty prediction in the identified k
values for the process
221 Kinetic model generation
In order to generate the kinetic models for evaluation the first step is to
input all of the known species of a chemical process into the system The species
can be identified by any means typically by experimentation where all starting
materials intermediates and products are identified These species are inputted
based on their respective number of differing atoms ie number of carbon
atoms number of oxygen atoms etc which is known as a Mass Matrix (MM)
For example if you take the known reaction model of A + B C + D
shown in Scheme 21 you could visualise initially inputting these four species
into a mass matrix shown in Figure 21
75
Scheme 21 An example esterification reaction
Figure 21 The Mass Matrix inputted into the approach assigning mass to each of the
species
It is also possible to describe the reactions (forward and backward) shown
in Scheme 21 in terms of the stoichiometry of reactants used (SR) and the
products formed (SP) as a set of matrices in Figure 22 When describing these
matrices a 0 represents that the species does not participate a 1 represents
that the species does participate with a kinetic order of 1 and 2 represents that
the species participates with a reaction order of 2 For example in the forward
reaction both species A and B participate as a reactant with reaction order 1
meaning that they are represented by lsquo1rsquo whereas C and D do not participate as
reactants so are represented by lsquo0rsquo These stoichiometric matrices are then
combined to form an overall stoichiometry S where S = SP - SR This overall
stoichiometry for an unknown model would otherwise be identified using an
Integer Linear Programming (ILP) optimisation and is necessary to identify all
feasible mass-balanced reactions
76
Figure 22 The stoichiometric matrices for the reaction model shown in Scheme 21 as well
as the overall stoichiometry matrix S
The ILP optimisation proceeds by finding every feasible stoichiometry that
satisfies the objective function of MMmiddotS = 0 where S is the transposed vector of
a single reaction with values for each of the species present Therefore as there
are four species in the esterification process shown in Scheme 21 the ILP
optimisation will proceed using the known Mass Matrix to identify the values of
X1-4 that satisfy the objective function shown in Figure 23 The optimised
solution is then the resulting stoichiometric vector which relates to a particular
feasible reaction The upper bound for the number of reactants in a stoichiometric
vector is 2 as it is very rare to encounter third order reactions as a single reaction
step When an optimised solution is found the solution is saved then successive
constraints are added to the ILP optimisation to guarantee that the same
combination of binary variables (and hence stoichiometry) are not obtained when
the optimisation problem is solved again The optimisation then ceases when
there are no more solutions to be found and hence all feasible mass-balance-
allowed transformations are identified
Figure 23 The ILP optimisation identifying a feasible solution to the objective function hence
identifying a mass-balance-allowed reaction Where X1 = A X2 = B X3 = C X4 = D
After all feasible reactions are identified these standalone reactions are
themselves potential models There are also other possibilites for reaction
models where there are any combinations of two of the possible reactions or
any combinations of three of the reactions etc The total number of possible
models (η) is equal to the sum of the binomial coefficients (or all combinations)
77
for every number of reactions in the model up to the total number of possible
identified reactions (δ) - this is shown in eqn 24 All of these combinations are
then generated and saved to a model database which will be accessed in the
next stage of the approach For example if the ILP optimisation identifies 5
possible reactions (δ = 5) the summation of all combinations gives η equal to
31 This example can be shown in a model representation in Figure 24 where
this could be any appropriate reaction where SM = starting material Int1 =
intermediate 1 Int2 = intermediate 2 P = product and Imp = impurity It should
also be noted that as all of these forward reactions are mass-balanced all
backward reactions would also be plausible but are omitted from the
representation for concisiveness
Where
bull η = total number of models
bull δ = number of possible reactions
bull i = iterative number of reactions considered for the model
120578 = sum 120575
119894 (120575 minus 119894)
120575
119894=123hellip120575
eqn 24
78
Figure 24 A visual representation of all of the possible reaction models when given five mass-
balance-allowed sample reactions each shown as a different coloured block When i = 1
each reaction is in itself a model and when i gt 1 each reaction behaves as a model
fragment These fragments when combined in different ways provide full and unique
reaction models each of which are to be assessed for their validity with respect to
experimental data
After every possible model has been saved into the model database each
of these models are then automatically transformed into their respective ODEs
which is a form that can be readily used in the kinetic model fitting stage of the
approach The individual stoichiometric reactions that make up each model are
compiled into a set of differential equations for each model where each of the
participating species have their own differential equation to show how their
concentration changes over time Figure 25 summarises the model generation
section of the approach by using the esterification reaction as an example This
shows how the initial input of the species is first used to identify the feasible
mass-balance-allowed reactions then how these reactions can be ordered into
every possible reaction model then subsequently how these models are
transformed into sets of differential equations for use in the kinetic model fitting
stage of the approach
79
Figure 25 A schematic summarising how the model generation stage of the approach
progresses Where the participating species are inputted and sorted ODE functions that
describe all possible mass-balance-allowed reactions are outputted
222 Kinetic model fitting
After the model generation stage of the approach is completed and there
is a sorted database with all possible models compiled with their respective ODE
functions the next stage of the approach can begin kinetic model fitting This
80
stage proceeds by sequentially loading individual models from the database
then attempting to optimise the kinetic constants for each of the reactions within
the model These optimisations progress based on the simulated ODE resultsrsquo
convergence with experimental data where more suitable models exhibit a
favourable change in ODE convergence based on the kinetic constants provided
by the optimiser Where models do not accurately describe the chemistry taking
place in the experimental dataset the optimiser typically ceases very quickly as
there is no way to incur a favourable change in the ODE results as it iterates
After the fitting of a particular model is complete the kinetic constants (optimised
results) as well as the minimised error metric of the ODE convergence (sum of
squared error or SSE) are assigned to the model and saved for statistical
analysis
2221 The objective function
When a model is initially selected for kinetic fitting the objective is to use
an optimisation algorithm to minimise the SSE between the simulated ODE
results and the experimental results This is shown in Figure 26 with a set of
time-series data showing a first-order decrease in the concentration of A The
first iteration of the algorithm is shown where a guess of k = 04 is applied to the
ODE solver The lsquodifferencersquo between the experimental result of data point Ex
and the simulated ODE of data point Sx is shown as Dx This value is squared
to make the value positive and summed with all other differences to give one
SSE value this is shown mathematically in eqn 25
119878119878119864 = sum (119864119909 minus 119878119909)2
119909=123hellip
eqn 25
Where
bull SSE = sum of squared error
bull Ex = experimental data point
bull Sx = simulated ODE data point
As the algorithm iterates the aim is to decrease the SSE output by varying
the input k values In this example optimisation shown in Figure 26 the optimiser
(and hence SSE) reaches a minimum at iteration 11 as the ODE converges very
well with the experimental data This method serves as an indirect route to
81
identifying kinetic constants as in this case the k values are the optimised inputs
for the optimisation algorithm
Figure 26 The iterations of an optimisation algorithm with respect to the convergence of
simulated ODEs with sample data - this occurs via the minimisation of the SSE output
For each iteration of the algorithm the inputted k values are used
alongside the ODE equations for the current model The ODE solver simulates
how each of the specified initial speciesrsquo concentrations change over time given
82
the reaction rate calculated from the k values the species concentration at that
moment and the reaction model The ODE solver used for this approach is the
MATLAB solver lsquoode15srsquo This is a stiff ODE solver meaning that it can be used
to solve lsquostiffrsquo ODEs An ODE is stiff when the integration must be completed in
unreasonably small increments by typical solvers that could require millions of
evaluations leading to a solver failure As there are many reaction models that
are to be evaluated it isnrsquot clear which ODEs would present themselves as stiff
problems Therefore ode15s was used which can approach curve solutions for
both stiff and non-stiff ODEs as opposed to a non-stiff solver which would be
able to solve non-stiff ODEs faster but fail when stiff ODEs were to be evaluated
Depending on the nature of the experimental data different inputs for the
optimisation algorithm may also be used If there is only one data set or all data
sets are at the same temperature then k values can be optimised If there are
multiple data sets at different temperatures however it is often better to optimise
directly for the activation energy and reference k value This is because there are
fewer variables for the algorithm to optimise meaning there is a greater chance
of convergence on a global optimum and not a local one this is discussed further
in Chapter 2222
The reference k value is at a particular reference temperature typically
the midpoint of the temperatures explored experimentally This is to ensure that
there are no weightings in the fittings of parameters towards the extremes of the
temperatures explored This reference k value and activation energy value for
each of the transformations are optimised as these inputs generate the k values
for each transformation using the re-parameterised Arrhenius equation shown
as eqn 26 where the general Arrhenius equation is shown as eqn 27
119896 = 119896119903119890119891119890[minus119864119886119877(1119879minus1119879119903119890119891
)] eqn 26
119896 = 119860 119890minus119864119886119877119879 eqn 27
Where
bull k = rate constant
bull kref = reference rate constant at a particular temperature
bull Ea = activation energy kJ mol-1
bull A = pre-exponential factor
83
bull T = temperature of reaction K
bull Tref = reference temperature for the reference rate constant K
bull R = ideal gas constant J mol-1 K-1
The re-parameterised Arrhenius equation is used for kinetic fitting as there
is only one optimum for the reference k and activation energy values regardless
of the kinetic model This means that the output of the algorithm can be assumed
to be at a discrete optimised point This is not the case if optimising for set of
values for a pre-exponential factor and activation energy due to the high
correlation between these values[192 193] This means that there are several sets
of values that can all combine to obtain the same rate constant which can be
avoided when using the re-parameterised equation to fit kinetic parameters to
data sets that include multiple temperatures
The final consideration when compiling the objective function is the
method of measuring the convergence of the simulated ODEs to the
experimental data For all simulated and experimental case studies herein
reported the SSE metric has provided good convergence to time-series data for
all species This could present a problem however in cases where particular
species occur in only small quantities and SSE does not provide a good fit to the
data This is because the SSE metric reduces the overall error hence giving a
biased fit to species that are present in larger concentrations This could be
prevented by using a different error metric - such as a weighted sum of squared
error (WSE) or a relative sum of squared error (RSE) Both of these error metrics
serve to normalise the errors in convergence between species present in higher
and lower concentrations and can be used in this approach if the experimental
data suggests that it would be appropriate
2222 The optimisation algorithm
When fitting kinetics using this approach the algorithm used to minimise
the error metric described in Chapter 2221 and hence maximise the
convergence of the simulated ODE with experimental data is the MATLAB
function fmincon fmincon utilises an interior point algorithm which is described
in detail in Chapter 131 This function has been reported extensively in the
literature for the nonlinear optimisation of dynamic models including
considerable uses in the fitting of kinetic parameters to reaction models[194-196]
84
fmincon is a local optimisation tool that leads to fast and accurate
convergence on local optima As the given error metric SSE reports a value
based on the residuals that is correlated to the magnitude of the concentrations
involved it is not clear based on this value whether true convergence has
occurred However due to the nature of the problem it is simple to plot the
experimental data and simulated ODE after kinetic fitting to visually confirm that
convergence has occurred Based on the convergence to the experimental data
it can then be assumed that the optimum found is the global optimum for that
model If non-convergence occurs then it is either because the given model does
not accurately represent the chemistry in the system or the algorithm became
trapped in a local optimum The likelihood of these scenarios depends on the
non-linearity of the data and the number of variables to be optimised
Generally speaking in these scenarios it is assumed that when non-
convergence occurs it is because the model does not accurately represent the
chemistry This is because of two reasons The first is that most kinetic data does
not feature sharp inflexions or cliff-edges in which concentration-time data
deviates from an otherwise smoothed curvature It is this curvature in the data
that makes local solvers such as fmincon very effective at identifying kinetic
parameters as large aspects of their methodologies involve gradient-based
calculations Therefore the path that the optimiser takes towards the optimum
typically iteratively improves as the optimiser progresses and with a smoothed
parameter space this means that the iterative improvement is unlikely to reach a
local optimum The second reason is that when fitting kinetics typically the
number of variables to be optimised is low as many models feature chemistry
that has fewer than 10 model terms This means that it is unlikely that fmincon
will encounter local optima when optimising and will only find the globally
optimum solution
There is not a discrete reported number of variables to be optimised that
means that fmincon will start to encounter local optima issues Kinetic studies
are reported routinely where ~15 or more parameters are optimised using
fmincon both isothermally and across different temperatures without issues[197
198] However it cannot be assumed a priori with certainty that these issues will
not occur Therefore in cases where there are more than 10 model terms to be
optimised a form of global optimisation called multi-start fmincon (ms-fmincon)
85
will be used This methodology employs fmincon but with multiple starting points
from which the optimisation starts Using ms-fmincon with 5 randomised starting
points means that from those 5 optimisations the global optimum is very likely
to be found when more than 10 parameters are to be optimised This approach
utilises ms-fmincon because it has been proven to be effective in optimising even
large scale systems A recent example of this was reported where 383
parameters were optimised accurately for a large kinetic model[199]
223 Statistical analysis
After the kinetic parameters are optimised for each model and the error
metric (SSE) recorded statistical analysis can then be performed to determine
the most likely model that describes the experimental data Akaikersquos Information
Criterion (AIC) eqn 28 provides a relative evaluation of a model for a particular
set of data[200]
119860119868119862 = 119899 ln (119878119878119864
119899) + 2119896 eqn 28
Where
bull AIC = Akaikersquos Information Criterion
bull n = number of observations
bull SSE = sum of squared error
bull k = number of model terms
This calculation provides a relative evaluation of balancing the goodness-
of-fit of the model to the experimental data with having as few model terms as
possible where a minimised value is optimal Therefore models are more
favourable if they only contain terms that have a significant effect on the fit to the
data inputted This means that the optimum model that AIC selects is less likely
to be over-trained as all model terms contribute a significant amount towards
the fit of the data
In the context of this approach an AIC evaluation can inform the
experimenter which reaction model is the most likely to be correct in relation to
other models considered This model should only contain reactions that
significantly contribute towards the convergence of the simulated ODEs with
experimental data points As AIC assumes that the amount of data is sufficiently
large in relation to the number of model parameters it is also beneficial for the
86
purposes of this approach to use a corrected AIC value to compensate for the
reduced sample sizes
The Corrected Akaikersquos Information Criterion (AICC) eqn 29 both
converges to AIC for large sample sizes but gives a more accurate answer for
smaller sample sizes as a greater weighting is placed on the number of model
terms[201] Reported data suggests that an uncorrected AIC value is appropriate
only when the ratio of nk is greater than 40 otherwise an AICC evaluation should
be used[202] However as the model penalisation aspect of AICC is favourable to
differentiate models with similar SSE values and many of the lsquoobservationsrsquo in
the context of a kinetic profile can be highly correlated if the ratio of nk is less
than 40 then the number of observations should be the number of individual
experiments rather than individual data points This is also true where several
experiments are used in fitting to contribute towards one SSE value where each
experiment has a vastly different number of measurements within them
119860119868119862119862 = 119860119868119862 + 2119896(119896 + 1)
119899 minus 119896 minus 2+ 119899 ∙ ln(2120587) + 119899
eqn 29
Where
bull AIC = Akaikersquos Information Criterion
bull AICC = Corrected Akaikersquos Information Criterion
bull n = number of observations
bull k = number of model terms
224 Other considerations
There may be some instances where there are intermediates or products
formed that cannot be identified This occurrence can be chemistry-dependant
but it is common that the quantitative analysis of a process can show total mass
balance losses as a reaction progresses This can indicate that either the species
calibrations are inaccurate or there is a real loss of massconcentration that is
unaccounted for If calibrations are correct with certainty and there is still a loss
of mass that is unaccounted for it can also be beneficial to input an additional
species into the system This will force the approach to identify a new pathway
to an unknown species which can be assigned the total mass loss of the process
as the time-series data progresses Due to the nature of the AICC evaluation it
can then be determined statistically if this loss of mass contributes significantly
87
enough towards the fitting of the data to suggest that there is a chemical pathway
occurring that is not described by the userrsquos inputted species This pathway will
be a grouped reaction description with an observed rate constant kobs This is
because if another pathway is shown to occur then it is not possible to know
how many routes that mass is lost by Chemical considerations must then be
undertaken to identify missing species and the approach must be re-run
When running the approach the model generation aspect is very fast
whilst the kinetic fitting stage is significantly slower due to the many optimisations
that must be conducted The kinetic fitting stage is considerably accelerated by
utilising parallel computing This means that each optimisation operation is
conducted on a single computer core meaning that separate tasks can be sent
to separate cores within the computer This means that optimisations are
conducted in parallel as the process speed scales directly with the amount of
computer cores available The time taken for each optimisation is heavily
dependent on the model it is fitting and the number of ODE evaluations to be
conducted A typical range for a single optimisation can take from 10 - 120
seconds on a standard Intel i5-2310 processor however many optimisations
take less than 1 second if the model does not describe the experimental data
accurately
225 Overview
This computational approach to kinetic model selection and parameter
identification was developed in MATLAB by loosely following the methodology
reported by Tsu et al[173] The approach first identifies all possible reactions that
can happen based on mass balance alone from the species inputted by the user
All plausible models are then compiled by taking every combination of these
reactions and sequentially optimising the kinetic parameters for each of these
models Each model is then statistically evaluated and ranked highlighting the
most likely model based on the experimental data supplied The approach outline
is summarised in Figure 27
88
Figure 27 An outline of the stages of the computational approach
This method serves as a comprehensive model evaluator where chemical
intuition is removed thereby removing a chemistrsquos bias and considering a
number of possible models that may otherwise not have been considered It is
however not the role of this approach to remove all necessity for a physical-
organic chemist to supervise the discovery of a kinetic model This approach is
to be used as a complementary tool whereby all models are evaluated without
human effort or interaction but final considerations are still made by the chemist
when the ranked model list is generated This is because there may be reactions
present in the most likely model that describe chemistry that is unlikely or unable
to occur but still give a good fit to the experimental data It may also be possible
that many models give very similar AICC evaluations so many models may be
competing
The benefits to this tool are clear All models are generated based on
logical transformations of the species inputted and every possibility is
comprehensively evaluated without the need for a chemistrsquos or statisticianrsquos most
important resource time Typically a chemist would evaluate a select few models
based on chemical intuition and remove certain chemical possibilities a priori
then further refine the model until it is satisfactory When all possibilities are
considered by an approach that automatically evaluates them this allows the
chemist to work on other projects including more important aspects of laboratory
work or theory that cannot be assigned to a machine However although
89
powerful this tool ultimately is data-driven and must be used in conjunction with
real chemical intuition by an end user to determine that the models identified as
most likely are accurate and consistent with the science
23 Simulated verification of the approach
Before any real experimentation takes place it is important to first verify
that the approach works as a means of identifying the correct reaction model and
kinetic parameters Therefore several simulated case studies were conducted
with varying goals to show the adaptability of the approach to different
circumstances These simulated case studies feature reactions from the
literature where the model and kinetic parameters are already identified
Simulated experimental data is generated from this information and used as the
basis for verifying the approach
To simulate the data first the true model and kinetic parameters reported
in a given literature source are inputted into MATLAB The experiment is then
simulated at a particular temperature and set of initial concentrations by using
an ODE solver to evaluate the change in species concentrations over a given
experimental timeframe Individual data points from this timeframe are then
extracted which serve as the experimental data points for the particular
simulated case study To then make the case study more robust up to 5
relative error in each measurement is added to approximate this simulated data
more closely to real experimental data This generation of simulated data is
summarised in Figure 28
90
Figure 28 An example showing the generation of a simulated data set from the literature a)
An ODE is simulated for a particular model with a set of kinetic parameters in this case A
rarr B where mdash = A mdash = B b) Particular time points are taken from this ODE to
represent individual measurements where x = A x = B c) Up to 5 relative random
error is added to these measurements to more closely resemble real experimental data
231 Case study Benzoic acid alkylation
The first simulated case study was a very basic system where there are
only three species to be considered[203] The reaction system was benzoic acid
21 reacting with iodomethane 22 in the presence of the base 18-bis-
(tetramethylguanidino)naphthalene (TMGN) to form the methyl benzoate
product 23 and hydroiodic acid 24 This reaction is shown in Scheme 22
TMGN was present at one equivalent with respect to benzoic acid and was
assumed to deprotonate the benzoic acid so that all of the starting material is in
the carboxylate form There were no rates reported by the authors for this
deprotonation but they indicated that modelling this system as a simple second
order reaction under these conditions yielded accurate results
91
Scheme 22 The reaction of benzoic acid with iodomethane to form methyl benzoate
Modelled as a second order reaction
2311 Data acquisition
The second order reaction model reported by Gholamipour-Shirazi[203]
was used to generate the ODEs shown in eqn 210 - 213 Three isothermal
simulated data sets were generated using these ODEs with the k value of 057
M-1 s-1 with the following initial concentrations
bull 01 M benzoic acid 21 008 M iodomethane 22 0 M methyl benzoate
23 0 M hydroiodic acid 24
bull 01 M benzoic acid 21 011 M iodomethane 22 0 M methyl benzoate
23 0 M hydroiodic acid 24
bull 01 M benzoic acid 21 015 M iodomethane 22 0 M methyl benzoate
23 0 M hydroiodic acid 24
119889[120784 120783]
119889119905= minus119896 [120784 120783][120784 120784] eqn 210
119889[120784 120784]
119889119905= minus119896 [120784 120783][120784 120784] eqn 211
119889[120784 120785]
119889119905= 119896 [120784 120783][120784 120784] eqn 212
119889[120784 120786]
119889119905= 119896 [120784 120783][120784 120784] eqn 213
5 relative error was then added to these simulated data sets then used
as the inputted experimental data for the computational approach These data
sets can be found in Chapter 721
2312 Results and discussion
Based on the inputs of the molecular weights for this system there were
two mass-balance-allowed reactions shown in eqn 214 and eqn 215 which
are two of the three possible models that can be generated The third model
92
shown in eqn 216 is the combination of these two allowed reactions resulting
in an equilibrium reaction model
Forward 21 + 22 rarr 23 + 24 eqn 214
Backward 23 + 24 rarr 21 + 22 eqn 215
Equilibrium 21 + 22 23 + 24 eqn 216
These three models were then each evaluated based on how well the
simulated ODE curves converge to the experimental data inputted The kinetic
parameters kx were optimised for each model and the SSE was recorded
These results are tabulated in Table 21 The concentrations of HI were assumed
to not be measured during the kinetic fitting and were instead inferred
Table 21 A table showing the optimised k values for the identified models in the benzoic acid
alkylation case study alongside each modelrsquos SSE and AICC
The computational approach reveals that the reaction model containing
solely the forward reaction gives the minimum overall error and the best (lowest)
AICC evaluation when assessing the experimental data indicating that this is the
most likely reaction model For the backward reaction the minimisation algorithm
could not optimise a k value to give a better fit than the initial guess of 1 x 10⁻³
M-1 s-1 indicating that the reaction model is in complete disagreement with the
experimental data For the equilibrium model the error is as low as the forward
reaction model alone as the optimiser assigns a small k value to the reverse
reaction to attempt to fit to the noise of the system Although this model fits the
data equally well there is the added complexity of a second model term as this
term adds no value in terms of lowering the SSE it is an unfavourable addition
in terms of an AICC evaluation which prefers simplistic models and is therefore
considered a less appropriate model than the forward reaction term alone
This case study has shown that it is possible to use this computational
approach to identify the correct model and kinetic parameters for a simple
Reaction kx M-1 s-1 SSE M AICC
Forward 05807 08101 -655
Backward - 10185 -174
Equilibrium 05817 00009 08101 -410
93
system by simply inputting the participating species and their respective
changes in time-series data The k value identified is very similar to the one used
for the generation of the simulated data and varies only because of the 5
noise added to the system The fit of the identified model and k value for the data
supplied is shown in Figure 29 where the data set shown is the middle
experiment where the starting concentrations were 01 M benzoic acid and 011
M iodomethane
Figure 29 The fit of the identified model and kinetic parameters to the generated experimental
data with starting concentrations of 01 M benzoic acid and 011 M iodomethane Where
x = benzoic acid x = iodomethane x = methyl benzoate mdash = benzoic acid (ODE) mdash =
iodomethane (ODE) mdash = methyl benzoate (ODE)
232 Case study Nitrile hydrolysis
This case study features a slightly larger system where there are 5
species to consider in the hydrolysis of a nitrile[204] The nitrile of interest 25 is
hydrolysed by hydroxide 26 to form the amide 27 This amide is then further
hydrolysed to form the carboxylic acid 28 and ammonia 29 This reaction is
shown in Scheme 23 As in many acidbase reactions there are a lot of fast
proton transfer steps the mass of species 26 is therefore added to the system
94
as water H2O rather than hydroxide OH- in order to preserve mass balance
This allows appropriate reaction models to be generated
Scheme 23 The reaction of a nitrile with hydroxide to form the corresponding amide which is
susceptible to further hydrolysis to form the carboxylic acid Modelled as sequential
second order reactions
2321 Data acquisition
The sequential second order reaction model reported by Niemeier et
al[204] was used to generate the ODEs shown in eqn 217 - 221 The reported
kinetic constants for the two steps were
bull Step one k75 degc = 927 x 10-3 M-1 s-1 Ea = 871 kJ mol-1
bull Step two k75 degc = 363 x 10-5 M-1 s-1 Ea = 745 kJ mol-1
Four simulated data sets were generated at four separate temperatures by using
eqn 26 to calculate k values with the following initial concentrations
bull 08 M nitrile 25 18 M hydroxide 26 0 M amide 27 0 M carboxylic
acid 28 0 M ammonia 29 60 degC
bull 08 M nitrile 25 18 M hydroxide 26 0 M amide 27 0 M carboxylic
acid 28 0 M ammonia 29 70 degC
bull 1 M nitrile 25 2 M hydroxide 26 0 M amide 27 0 M carboxylic acid
28 0 M ammonia 29 80 degC
bull 1 M nitrile 25 2 M hydroxide 26 0 M amide 27 0 M carboxylic acid
28 0 M ammonia 29 90 degC
119889[120784 120787]
119889119905= minus1198961[120784 120787][120784 120788] eqn 217
95
119889[120784 120788]
119889119905= minus1198961[120784 120787][120784 120788] minus 1198962[120784 120789][120784 120788] eqn 218
119889[120784 120789]
119889119905= 1198961[120784 120787][120784 120788] minus 1198962[120784 120789][120784 120788] eqn 219
119889[120784 120790]
119889119905= 1198962[120784 120789][120784 120788] eqn 220
119889[120784 120791]
119889119905= 1198962[120784 120789][120784 120788] eqn 221
5 relative error was then added to these simulated data sets then used
as the inputted experimental data for the computational approach These data
sets can be found in Chapter 722
2322 Results and discussion
Based on the inputs of the molecular weights for this system there were
four mass-balance-allowed reactions shown in eqn 222 - 225 All possible
models were then compiled subject to eqn 24 resulting in 15 models
25 + 26 rarr 27 eqn 222
27 rarr 25 + 26 eqn 223
26 + 27 rarr 28 + 29 eqn 224
28 + 29 rarr 26 + 27 eqn 225
All 15 models were evaluated sequentially then ranked based on their
AICC It was found that the highest ranked model was the correct model with
kinetic parameters optimised to be very close to the real values As artificial error
was added to the results this optimisation is assumed to be correct as the
relative error in the kinetic parameters is negligible The top three performing
models are shown in Table 22 where the reference k values at 75 degC are shown
as well as the activation energy SSE and AICC
Table 22 A table showing the top three ranked models for the nitrile hydrolysis case study
The kinetic parameters for each reaction within the model is shown as well as the SSE
and AICC evaluation
Model
rank Model
kx75 degC M-1 s-1
or s-1
Ea kJ
mol-1 SSE M AICC
1 25 + 26 rarr 27 923 x 10-3 867 00179 -1623
96
26 + 27 rarr 28 + 29 449 x 10-5 716
2
25 + 26 rarr 27
26 + 27 rarr 28 + 29
28 + 29 rarr 26 + 27
928 x 10-3
430 x 10-5
194 x 10-4
867
755
263
00179 -1567
3
25 + 26 rarr 27
27 rarr 25 + 26
26 + 27 rarr 28 + 29
932 x 10-3
363 x 10-5
420 x 10-5
865
373
748
00180 -1566
This case study has shown that it is possible to identify the correct model
and kinetic parameters for a multistep chemical system using the computational
approach Interestingly this study has shown again that the overall error is very
similar in the top-ranked competing models meaning that the deciding factor
then becomes the number of model terms due to the AICC evaluation The data
inputted was at different temperatures and the kinetic parameter optimisation
proceeded smoothly when optimising reference k values and activation energies
directly An example kinetic plot showing the fit of the identified model to the
experimental data is shown in Figure 210 - this is the fourth experiment where
the starting concentrations were 1 M nitrile and 2 M hydroxide at 90 degC
97
Figure 210 The fit of the identified model and kinetic parameters to the generated
experimental data with starting concentrations of 1 M nitrile and 2 M hydroxide at 90 degC
Where x = nitrile x = amide x = carboxylic acid mdash = nitrile (ODE) mdash = amide (ODE) mdash
= carboxylic acid (ODE)
233 Case study SNAr kinetics
The final simulated case study involves a larger scale multistep system
where there are 6 species in a SNAr chemical setting 24-dichloropyrimidine
(starting material SM) 210 reacts with morpholine 211 to form either the 4-
substituted product 212 or the 2-substituted product 213 These products can
then further react with another equivalent of morpholine to produce the bis-
substituted product 214 Each of these reactions form hydrochloric acid 215
as a byproduct that is neutralised by an excess of base This system is shown in
Scheme 24
98
Scheme 24 The reaction of 24-dichloropyrimidine 210 with morpholine 211 to form the 4-
substituted product 212 and the 2-substituted product 213 and the subsequent bis-
substituted product 214
2331 Data acquisition
The multistep SNAr reaction model reported by Reizman and Jensen consists
of 4 second-order reactions These reactions were used to generate the ODEs
shown in eqn 226 - 231 The reported kinetic constants for these three steps
were
bull Step one log(A) = 34 M-1 s-1 Ea = 270 kJ mol-1
bull Step two log(A) = 35 M-1 s-1 Ea = 321 kJ mol-1
bull Step three log(A) = 49 M-1 s-1 Ea = 600 kJ mol-1
bull Step four log(A) = 30 M-1 s-1 Ea = 450 kJ mol-1
Three simulated data sets were generated at 90 degC by using eqn 27 to calculate
k values with the following initial concentrations
bull 1 M SM 210 22 M morpholine 211 0 M 4-substituted product 212 0
M 2-substituted product 213 0 M bis-substituted product 214 and 0 M
hydrochloric acid 215
bull 12 M SM 210 28 M morpholine 211 0 M 4-substituted product 212
0 M 2-substituted product 213 0 M bis-substituted product 214 and 0
M hydrochloric acid 215
bull 09 M SM 210 32 M morpholine 211 0 M 4-substituted product 212
0 M 2-substituted product 213 0 M bis-substituted product 214 and 0
M hydrochloric acid 215
99
119889[120784 120783120782]
119889119905= minus1198961[120784 120783120782][120784 120783120783] minus 1198962[120784 120783120782][120784 120783120783] eqn 226
119889[120784 120783120783]
119889119905= minus1198961[120784 120783120782][120784 120783120783] minus 1198962[120784 120783120782][120784 120783120783]
minus 1198963[120784 120783120784][120784 120783120783] minus 1198964[120784 120783120785][120784 120783120783]
eqn 227
119889[120784 120783120784]
119889119905= 1198961[120784 120783120782][120784 120783120783] minus 1198963[120784 120783120784][120784 120783120783] eqn 228
119889[120784 120783120785]
119889119905= 1198962[120784 120783120782][120784 120783120783] minus 1198964[120784 120783120785][120784 120783120783] eqn 229
119889[120784 120783120786]
119889119905= 1198963[120784 120783120784][120784 120783120783] + 1198964[120784 120783120785][120784 120783120783] eqn 230
119889[120784 120783120787]
119889119905= 1198961[120784 120783120782][120784 120783120783] + 1198962[120784 120783120782][120784 120783120783]
+1198963[120784 120783120784][120784 120783120783] + 1198964[120784 120783120785][120784 120783120783]
eqn 231
2 relative error was then added to these simulated data sets then used
as the inputted experimental data for the computational approach These data
sets can be found in Chapter 723
2332 Results and discussion
From these 6 species there are 16 mass-balance-allowed reactions that can
be identified shown in eqn 232 - 247 All possible reaction models were
generated subject to eqn 24 which resulted in 65535 unique models to be
evaluated by the approach
213 rarr 212 eqn 232
212 rarr 213 eqn 233
210 + 211 rarr 212 + 215 eqn 234
212 + 215 rarr 210 + 211 eqn 235
210 + 214 rarr 212 + 212 eqn 236
210 + 211 rarr 213 + 215 eqn 237
211 + 212 rarr 214 + 215 eqn 238
100
212 + 212 rarr 210 + 214 eqn 239
214 + 215 rarr 211 + 213 eqn 240
213 + 215 rarr 210 + 211 eqn 241
211 + 213 rarr 214 + 215 eqn 242
210 + 214 rarr 212 + 213 eqn 243
210 + 214 rarr 213 + 213 eqn 244
214 + 215 rarr 211 + 212 eqn 245
212 + 213 rarr 210 + 214 eqn 246
213 + 213 rarr 210 + 214 eqn 247
All 65535 models were evaluated by the computational approach which
incurred a computation time of 52 hours (see Chapter 761 for details on
computer specifications) Each of these models were ranked based on their
AICC and it was found that the highest ranked model was also the correct model
with kinetic parameters optimised to values that were very close to the generated
values As in the nitrile hydrolysis case study Chapter 232 this optimisation is
assumed to be correct as the error in the fitted parameters is negligible
considering that artificial error was added to the dataset The top three
performing models are shown in Table 23 where the optimised k values are
shown as well as their corresponding SSE and AICC values
Table 23 A table showing the top three ranked models for the SNAr case study The kinetic
parameters for each reaction within the model is shown as well as the SSE and AICC
evaluation
Model
rank Model kx M-1 s-1 SSE M AICC
1
210 + 211 rarr 212 + 215
210 + 211 rarr 213 + 215
211+ 212 rarr 214 + 215
211 + 213 rarr 214 + 215
032945
007686
000018
000037
00024 -2112
2
210 + 211 rarr 212 + 215
210 + 211 rarr 213 + 215
211+ 212 rarr 214 + 215
032948
007679
000018
00024 -2086
101
211 + 213 rarr 214 + 215
213 + 215 rarr 210 + 211
000033
000004
3
210 + 211 rarr 212 + 215
210 + 211 rarr 213 + 215
211+ 212 rarr 214 + 215
211 + 213 rarr 214 + 215
210 + 214 rarr 213 + 213
032949
007672
000018
000036
015890
00024 -2085
This final simulated case study has shown that it is still possible to identify
the correct reaction model and kinetic parameters for a more complicated
multistep chemical system even when there are several thousand models to
consider Many of these models are very similar and the top-ranked competing
models contain the four model terms that are appropriate as well as typically
one other model These models are top-ranking because the additional terms
are optimised by the algorithms to either have a negligible effect on the output
or to minimise the error in the kinetic fitting to a certain extent It is then the role
of the AICC evaluation to determine whether these additional model terms are
producing a significant effect in order for their consideration in the correct
reaction model In this case the SSE value was unchanged among the top-
ranked competing models meaning that the deciding factor then became the
number of model terms An example kinetic plot showing the fit of the identified
model to the experimental data is shown in Figure 211 - this is the first
experiment where the starting concentrations were 1 M 24-dichloropyrimidine
and 22 M morpholine at 90 degC
102
Figure 211 The fit of the identified model and kinetic parameters to the generated
experimental data with starting concentrations of 1 M 24-dichloropyrimidine and 22 M
morpholine at 90 degC Where x = 24-dichloropyrimidine x = 4-substituted product x = 2-
substituted product x = bis-substituted product mdash = 24-dichloropyrimidine (ODE) mdash =
4-substituted product (ODE) mdash = 2-substituted product (ODE) mdash = bis-substituted
product Graph is only shown to 260 minutes to show curvature of the initial data points
24 Conclusion
It has been shown that a computational approach to kinetic modelling
loosely based on work by Tsu et al can be programmed in MATLAB This
approach takes chemical species information as well as experimental datasets
to identify both the correct reaction model and kinetic parameters for the
chemical process by utilising optimisation algorithms and statistical analysis
This approach has been proven to work successfully for three simulated case
studies of varying optimisation difficulty with different sets of experimental data
inputs with varying artificial errors The success shown from these studies
inspires confidence that the approach can be implemented with real
experimental data and be used as an effective tool in process development to
automatically identify the correct model and kinetic parameters of various
103
chemical systems The next step is to prove the efficiency of this approach
alongside real experimentation
Chapter 3 Experimental applications of the computational
approach to kinetic model and parameter determination
31 Introduction
With the development of the computational approach completed and
verified with multiple simulated case studies the viability of the approach on real
experimental data must also be tested This experimental application can utilise
data from any source to determine the most likely reaction model and kinetic
parameters but for reasons that shall be discussed further all experimentation
for this chapter was conducted using an automated continuous flow reactor
platform
There is a long history of conducting and analysing chemical and enzymatic
kinetics using flow techniques with the first reported case published around 100
years ago by Hartridge et al as a means to study very fast reactions[205] During
this time many different processes analytical methods and experimental setups
have been reported here citing only a few[206-209] A widely regarded essential
requirement for kinetic experiments however is for the reaction system to
operate in a turbulent flow regime[210] Turbulent flow leads to fast continuous
mixing and can be predicted by calculating the Reynolds number Re in eqn
31
Where
bull Re = Reynolds number
bull ν = average flow velocity
bull d = tube diameter
bull ρ = fluid density
bull η = fluid viscosity
119877119890 = 120584119889120588
120578 eqn 31
104
Using the unitless Reynolds number the flow regime can be predicted to be
turbulent[210] when Re exceeds 2000 or laminar[211] when Re is less than 2000
These regimes are illustrated in Figure 31a and 31b respectively Under laminar
flow conditions there is a parabolic velocity profile - meaning that the flow
velocity at the centre of the tube is double the average velocity due to friction on
the walls of the tubing known as dispersion This dispersion was originally
thought to blur the time axis leading to a substantial distortion of the observed
kinetics and hence meaningful kinetic experiments under these conditions might
be impossible[212]
Figure 31 A diagram to show the direction and flows within a flow regime where a) laminar
flow b) turbulent flow
Interestingly these assumptions remained untested until a number of
reported kinetics works from the Douglas group showed that accurate kinetic
experiments could be conducted under laminar flow conditions[213-215] The
Reynolds numbers for the experiments conducted ranged between 28 and 85
implying laminar flow However the kinetics monitored in these systems agreed
very well with results obtained conventionally by stopped-flow methods Further
work suggests that molecular diffusion has a very significant role and under
certain circumstances it can be a good approximation to neglect the effects of
laminar flow ie for particular flow velocities with given internal diameters[212 216]
With this approximation the kinetics can then be analysed as if the tubular flow
was homogeneous which can lead to accurate kinetic studies even in laminar
flow regimes
105
In many continuous flow settings for micro- or meso-flow volumes it is
typically simpler to adopt an idealised plug flow reactor model This model states
that each infinitely thin section of flow known as a plug travels in the axial
direction of the reactor and is perfectly mixed in the radial direction only where
a uniform distribution of the reactor concentrations occurs This means that the
residence time of the plug is a direct function of the length of the tubular reactor
and the velocity of the fluid This is shown in Figure 32 This model is commonly
employed to simplify tubular mixing and remains an accurate approximation for
kinetic measurements[37] All kinetic experiments by other authors covered in this
introduction employ this model and further experimentation as part of this project
also utilises this model - this is discussed further in Chapter 32
Figure 32 A plug flow reactor model where there is perfect mixing in the radial direction but
no forward or backward mixing in the axial direction Plugs 1 and 2 are examples of the
infinitely short plugs existing within this reactor model
Many of the advantages of continuous flow chemistry as previously
stated in Chapter 11 are also particularly attractive for running kinetic
experiments Increased heat and mass transfer[217 218] ensures that the reaction
is well controlled meaning that it can be asserted with confidence that the
experimental conditions applied to it are truly experienced by the reaction
medium Precise reagent control arises out of utilising flow chemistry as specific
flow rates allow accurate addition of chemicals at various points within the reactor
system[22 23 35] - this is very important when deducing the order of the species
106
within a system as reagent stoichiometry is present in exact quantities Coupling
of flow reactor platforms with quantitative analysis such as UV HPLC or GC
also unlocks automation capabilities[6 219] where multiple experiments can be
queued for the system to run autonomously The increased safety[220] the
efficiency of operating at reaction temperatures above the boiling point of the
solvent[221 222] and the ability to run and analyse extremely fast reactions[223 224]
means that flow experiments can be run that would otherwise be very difficult or
impossible to run in a batch system For these reasons it is more desirable in
particular circumstances to run kinetic experiments in flow rather than more
traditional batch kinetic experiments whereby sampling occurs throughout the
progression of a single reaction These advantages will be exploited throughout
these experimental acquisitions of data
The main disadvantage to kinetic modelling in flow systems however is
the necessity of the system to reach lsquosteady-statersquo Steady-state simply refers to
the state in which the reactor is in where the responses from the system are a
direct consequence of the conditions applied to it This is an important distinction
because as the reaction parameters are changed a certain amount of time is
then required for those reaction parameters to be applied to the system to
achieve a consistent output[225] This can be very wasteful as a system typically
needs approximately 15 - 3 reactor volumes of reagent in the acclimation to
steady-state prior to each measurement[226] This wastes a lot of precious
reaction material as well as time as the time taken to reach steady-state is in
direct relation to the residence time required ie a 15 minute residence time
results in up to a 45 minute wait for steady-state
Kinetic experiments in flow have been performed in this way for a long
time as the advantageous properties of continuous flow chemistry were worth
the wastage from the steady-state measurements However in recent years
deviations from these conventional techniques have become more popular that
take advantage of the transitionary period between two steady-state
measurements This is because during this period transient reaction information
is available but is otherwise lost because of traditional sampling methods
However if the pump flow rates are manipulated to structure this transient data
in a way that can be translated to regular time-series data an entire reaction
profile can be mapped very quickly and efficiently This then negates the need
107
for multiple steady-state measurements and rectifies this flow chemistry
disadvantage as kinetic profiles can be obtained with minimal material
The first transient flow method reported by Mozharov et al[96] is an
instantaneous step change in the flow rates where the reaction initially takes
place at a low flow rate F1 and then the flow rate is increased by an order or
magnitude to F2 This high flow rate then pushes out the transient data profile of
the reaction medium whilst the liquid is monitored by an in-line analysis
technique sensitive enough to detect a change in product concentration for
example Raman spectroscopy as reported by the authors Using this in-line
technique many measurements are taken in short time intervals to generate a
reaction profile from which kinetic information can be derived This is possible
as the magnitude of F2 the experimental times of the analytical measurements
(tn) and the dimensions of the flow path in the system are known therefore the
reaction profile along the microreactor capillary can be recreated and plotted
This concept is depicted in Figure 33 with the corresponding equation shown in
eqn 32 to convert the species concentration in experimental time to the species
concentration in residence time This conversion then maps the kinetic profile of
the chemical process between the calculated residence times
Figure 33 A depiction of how a kinetic experiment can be run utilising a step change in flow
rates between two steady-states (I and II) allowing time-series data to be plotted from
transient data Figure adapted from Mozharov et al[96]
120591 = 119905211986521198651minus 1199051198652 minus 11986511198651
eqn 32
108
Where
bull τ = residence time of the reaction medium
bull t = experimental time experienced by the reactor
bull t2 = experimental time taken to reach steady-state
bull F1 = initial flow rate
bull F2 = higher flow rate that the pumps are instantaneously changed to
This concept was also used experimentally as a means to test the
accuracy of the technique in relation to conventional steady-state
measurements The base catalysed Knoevenagel condensation between
benzaldehyde 31 and ethyl cyanoacetate 32 alongside the base 33 to form
the corresponding adduct 34 is shown in Scheme 31 The corresponding
kinetic profiles were generated by conventional sequential steady-state
measurements in Figure 34 and by the described step-change methodology in
Figure 35 where the reaction proceeded at a low flow rate before a sudden step
change to a higher flow rate It is shown that the two sets of time-series data are
very comparable however the step-change methodology has many
advantages This technique can determine a kinetic profile from only one
experiment with a much lower consumption of reagents and significantly
reduced experimental time
109
Scheme 31 The base catalysed Knoevenagel condensation between benzaldehyde and ethyl
cyanoacetate to form 34
Figure 34 A kinetic profile generated from the Knoevenagel condensation shown in Scheme
31 where kinetic information was obtained by measuring conversation at given
residence times at steady-state at two temperatures Steady-state markers x are
shown as part of the lsquoA Modelrsquo Reproduced with permission
110
Figure 35 A kinetic profile generated from the Knoevenagel condensation shown in Scheme
31 where kinetic information was obtained using a flow rate step-change at two
temperatures Steady-state markers x are shown as part of the lsquoA Modelrsquo where step-
change markers o are shown as part of the lsquoB Modelrsquo Reproduced with permission
The main critique of this technique as stated in the original publication is
that the step increase in flow rate is never perfect as the system always needs
time to speed up to the higher flow rate therefore the exact function F(τ) during
this transitional period is uncertain[96] This non-ideality is caused by several
experimental factors such as non-rigidity of the tubing walls and the syringe
preventing an immediate change in both the flow rates and the pressure profile
throughout the system[227]
Moore and Jensen[227] then reported a new concept that involves a
controlled ramp instead of a step change which leads to less uncertainty in the
determination of the residence times leading to greater accuracy in the time-
series data This therefore also leads to greater accuracy in the kinetic
parameters obtained from the experiment This report introduced the concept of
ldquopseudo-batchrdquo reactors referring to each fluid element passing through the flow
reactor in a time that is unique which can be thought of as many successive
pseudo-batch reactions This concept is shown in Figure 36
Figure 36 A depiction of how a continuous flow reactor may be described as a series of
sequential pseudo-batch reactors where the colour represents the extent of conversion
from low (green) to high (red) Q represents the total flow rate ti represents the initial
time of each pseudo-batch reactor entering the reactor tf represents the final time tm is
the time at which the concentration is actually measured by the IR probe Reproduced
with permission
This controlled ramp method results in a more predictable and accurate
residence time profile when compared to the step change method as the
residence time uncertainty decreases as well as a greater sampling rate with a
data density 10-fold higher than previously reported in Mozharov et alrsquos
technique This was shown experimentally in Scheme 32 in the Paal-Knorr
reaction of 25-hexanedione 35 and ethanolamine 36 generating 37 whilst
constantly monitored by an in-line IR probe This greater data density also
reduces the error within the kinetic profiles generated whilst still agreeing with
111
kinetic profiles generated purely from steady-state measurements as shown in
Figure 37 where these datasets are shown to be very precise and reproducible
Scheme 32 The Paal-Knorr reaction of 25-hexanedione 35 and ethanolamine 36 to yield
37 to show how the kinetics of a process can be observed by using a controlled ramp
technique
Figure 37 A combination of the kinetic models for the reaction yielding 37 in Scheme 32
where the differing colours represent different values of S where S is a corrective
residence time multiplier to show the reproducibility of the controlled flow ramp
methodology S = 14 (blue) S = 13 (red) S = 12 (green) S= 23 (orange) steady-state
experiments = x Reproduced with permission
Controlled ramps have now been reported many times because of the
experimental advantages that they possess[225 228] They feature all of the
advantages of conventional flow chemistry as reported earlier in this
introduction without the disadvantages that arise from typical steady-state
sampling This allows users to generate accurate data-rich kinetic information
from a process whilst using minimal material and time This methodology will
112
feature heavily in the data acquisition portions of this chapter as we opted to use
controlled ramps for all of our experimentation to exploit these advantages
More recently further efficiency has also been realised by the
combination of temperature gradients[229] with controlled flow ramps[146 230-232]
This allows for the fitting of kinetic parameters including activation energies to
a non-isothermal dataset obtained from one flow experiment This methodology
therefore results in even less material and time consumption as all kinetic
parameters can be determined from one flow experiment Although this relatively
new technique has only been reported for very simple systems it represents an
advancement in performing exceptionally efficient kinetic experiments using
continuous flow
32 Experimental setup
All flow experiments were conducted using a tubular reaction vessel built
in-house consisting of a 116rdquo OD (132rdquo ID) stainless steel tubing coiled around
a cylindrical aluminium heated block Reagents were pumped using JASCO
PU980 dual piston HPLC pumps and flow streams were mixed using Swagelok
SS-100-3 tee-pieces Sampling was conducted by using a VICI Valco EUDA-
CI4W5 sample loop with a 05 microL aliquot volume This results in small aliquots
of reaction mixture automatically transferring to the HPLC for on-line analysis
The reaction system was maintained under a fixed back pressure using an
Upchurch Scientific 1000 PSI back pressure regulator Quantitative analysis was
performed using an Agilent 1100 series HPLC instrument fitted with a Sigma
Ascentis Express C18 reverse phase column (5cm x 46mm 27 microm) In all
experiments biphenyl was added to one reservoir as an internal standard This
experimental setup is shown in Figure 38
113
Figure 38 A photograph of the automated continuous flow reactor used for this work
Previous work using this experimental setup has shown that transient flow
experiments show an error of less than 4 in the observed rate constants due
to dispersion whilst steady-state experiments show an absolute error of 05
and a relative error of 024 [233 234] Therefore when considering the kinetic
simulations in these studies a plug flow model was adopted If we consider the
general axial dispersion plug flow reactor model[235] in eqn 33
Erstwhile studies by Hone[225] on our reactor platform and similar investigations
by Jensen[230 236 237] using a comparable system have found that dispersion only
introduces a small deviation from plug flow Given this eqn 33 can be simplified
to ignore the second order term to give eqn 34 - 36 This plug flow reactor
design equation can be utilised to model each species in the reaction with
respect to residence time
Where
bull DR = axial dispersion coefficient
11986311987711988921198621198941198891199112
minus 119906119889119862119894119889119911+ 119903119894 = 0 eqn 33
119906119889119862119894119889119911= 119903119894 eqn 34
120591 =119911
119906 eqn 35
119889119862119894119889120591= 119903119894 eqn 36
114
bull Ci = molar concentration of species i
bull z = the length along the reactor
bull u = superficial velocity
bull ri = rate of reaction of species i
For each chemical process concentration-time data is collected by using
linear flow ramp gradients with on-line HPLC analysis Steady-state is initially
achieved within the system then sampling begins during the controlled ramping
to the next steady-state condition capturing the transitory information This is
shown in Figure 39 At least two flow ramp experiments at different temperatures
are conducted with HPLC sampling every 2 - 4 minutes depending on the length
of the HPLC method The residence time is then calculated for each sampling
point using eqn 37 to translate this transient data to a time-series dataset
Figure 39 A mathematically correct representation of how linear gradient flow ramps can be
utilised to sample with a high data density on the initial curvature of the kinetic plot
Where diams = data point Tn = experiment temperature Q = total flow rate Time = time the
reaction has been running τ = residence time that the reaction mixture experiences
Where
bull τ = residence time
bull α = deceleration of flow rate
120591 = 119886 ∙ 119905 minus 1205830 +radic(1205830 minus 119886 ∙ 119905)2 + 2 ∙ 119871 ∙ 119886
119886 eqn 37
115
bull μ0 = initial flow rate
bull t = experiment time
bull L = reactor volume
33 Case study Phenyl acetate
The first reaction system explored using the computational approach was
the presupposed model of the reaction of phenol 38 with acetyl chloride 39
to form phenyl acetate 310 and hydrochloric acid 311 shown in Scheme 33
This first experimental verification of the approach was a final validation of the
approach by selecting a simple example with few chemical species The goal of
this study was to confirm the presupposed model shown in Scheme 33 as well
as identify the kinetic parameters for this process The validity of the controlled
ramp method would also be determined based on comparisons of the
experimental data with steady-state measurements Full experimental details
including the preparation of the feed solutions experimental setup flow ramping
rates HPLC analysis and raw data can be found in Chapter 731
Scheme 33 The reaction of phenol 38 with acetyl chloride 39 to form phenyl acetate 310
and hydrochloric acid 311
The kinetic data was obtained using the controlled ramp methodology at
two temperatures 65 degC and 75 degC and the four participating species were
inputted into the computational approach Based on these four species only two
reactions were calculated to be possible based on mass balance - these are
shown as the forward reaction eqn 38 and the backward reaction eqn 39
which are two of the three possible models that were generated The third model
shown as eqn 310 is the combination of these two allowed reactions resulting
in an equilibrium reaction model
Forward 38 + 39 rarr 310 + 311 eqn 38
116
Backward 310 + 311 rarr 38 + 39 eqn 39
Equilibrium 38 + 39 310 + 311 eqn 310
These three models were then each evaluated automatically by the
approach based on how well the simulated ODE curves converge to the time-
series data obtained from the controlled ramps The k values SSE error metric
and the AICC evaluation for each of the models is shown in Table 31 This data
represents a similar scenario to the simulated benzoic acid esterification case
study shown in Chapter 231 where the identified most likely model has a similar
error to another model but with more model terms The forward reaction model
fits both temperature datasets very well whilst the backward reaction model
does not fit to the experimental data at all as there is no direction in the
parameter space from the initial guess that the optimisation algorithm can travel
to make a favourable change in the convergence to the data The equilibrium
model fits the data equally as well as the forward model as it sets the backward
rate constant to be negligible leading to a low SSE However as this second
term adds no value in further lowering the SSE it is an unfavourable addition in
terms of the AICC evaluation which prefers more simplistic models and is
therefore considered a less appropriate model than the forward reaction term
alone
Table 31 Evaluation of the feasibility of each reaction model for the phenyl acetate study
By only inputting the species involved in the reaction then running two
controlled flow ramps with the automated computational approach described the
intuitive reaction model was confirmed and the kinetic parameters were
determined as k75 degC = 1045 x 10-3 plusmn 042 x 10-3 M-1 s-1 Ea = 693 plusmn 78 kJ mol-1
This combination of the correct reaction model and kinetic parameters allowed a
Reaction Model
k Values x 10-3 M-1 s-1
SSE M AICC Evaluation
65 degC 75 degC
Forward 515 1045 0019 136
Backward - - 0532 803
Forward +
Backward
515
0
1045
0 0019 1636
117
fit to the experimental data with an average residual of less than 3 x 10⁻³ M and
is shown in Figure 310 where the colours of the data and fitted ODEs mimic the
colours shown in Scheme 33 This study has shown that the transition from
simulated to real experimental data does not affect the accuracy of the approach
and that the approach can be applied to experimental data with confidence that
the correct reaction model is to be identified
Figure 310 Kinetic profiles for two flow ramp experiments at 65 degC and 75 degC where x =
phenol x = phenyl acetate mdash = phenol (ODE) mdash = phenyl acetate (ODE)
The equivalent temperature and residence time kinetic profiles were also
mapped by performing a series of conventional steady-state experiments to
ensure that a transient-flow regime remained accurate in model and parameter
determination Results showed excellent agreement in plotted curvature and
confirmed the same reaction model to be the most likely whilst identifying very
comparable kinetic constants Figure 311 shows a comparison of the two
sampling methodologies for this particular reaction See Chapter 7315 for
further details
118
Figure 311 Graphs showing the agreement between steady-state and flow ramp
measurements for the reaction of phenol with acetyl chloride where curves are fitted to
the steady-state data Where = phenol (steady-state) x = phenol (flow ramp) =
phenyl acetate (steady-state) x = phenyl acetate (flow ramp)
34 Case study Paracetamol
The next reaction system that was explored was the chemical system
producing paracetamol whereby 4-aminophenol 312 reacts with acetic
anhydride 313 to form paracetamol 314 and the over-reacted diacetamate
impurity 315 shown in Scheme 34 as the intuitive sequential reaction This
reaction system serves as the first real experimental multistep reaction that is
studied by this approach in order to determine the correct reaction model and
kinetic parameters However as there is a large disparity between the reaction
kinetics of step one and two quantitative kinetic analysis of both processes
simultaneously ie during a single ramp was not possible Therefore two sets
of differing temperature ramps were performed to investigate independently the
formation of paracetamol and diacetamate at 3060 degC and 160180 degC
respectively Each of these ramps differ in reactor size and hence residence
times as well as starting concentrations of acetic anhydride This was performed
to illustrate the capability of the approach to handle data from a variety of sources
whilst still accurately determining the kinetic properties of a process
Scheme 34 The reaction of 4-aminophenol with acetic anhydride to form paracetamol in step
one followed by a further reaction with acetic anhydride to form diacetamate in step two
Based on the five species identified including the acetic acid 316
formed with each reaction of acetic anhydride there were six reactions that were
calculated to be possible based on mass balance These reactions are shown
as eqn 311 - 316
312 + 313 rarr 314 + 316 eqn 311
119
314 + 316 rarr 312 + 313 eqn 312
314 + 313 rarr 315 + 316 eqn 313
315 + 316 rarr 314 + 313 eqn 314
312 + 315 rarr 314 + 314 eqn 315
314 + 314 rarr 312 + 315 eqn 316
Interestingly some of the mass-balance-allowed reactions identified by
the ILP optimisation seem very unlikely to happen based on chemical intuition
The reaction of 4-aminophenol with diacetamate shown in eqn 315 for
example suggests that it is possible for this starting material to react with the
over-reacted product to form two equivalents of the desired product We know
from intuition that the ester bond is too strong to break and react without a
chemical stimulus so we may have initial speculations on the feasibility of this
reaction However it can never be stated with certainty that this reaction cannot
happen until its feasibility is studied and therefore all possible models are still
generated to be evaluated This is a major advantage of this approach that
reactions and models that may otherwise be discarded due to chemical bias are
automatically evaluated without a chemistrsquos input This could lead to unexpected
(but statistically and chemically accurate) models that describe time-series data
which can lead to better process efficiency and even discover new reactions
63 potential models were identified from the five reactions and the
reaction model shown in Scheme 34 was determined to be the most likely
representation of the system by AICC The approach also determined the kinetic
parameters of step one k60 degC = 645 plusmn 026 M-1 s-1 Ea = 32 plusmn 12 kJ mol-1 and
step two k180 degC = 427 x 10-2 plusmn 017 x 10-2 M-1 s-1 Ea = 979 plusmn 65 kJ mol-1 by
fitting k values to each dataset in the kinetic fitting stage of the approach These
values us to assert that step one will likely be very fast at a wide range of
temperature ranges and that step two has a higher sensitivity to changes in
temperature when the energy of the system increases This identified model
alongside the identified kinetic parameters fits to the experimental data very
accurately with an average residual of less than 1 x 10⁻⁴ M and is shown in
Figure 312 The top 5 ranked models are shown in Table 32 with their
respective SSE error metric and AICC evaluation
120
Figure 312 Kinetic profiles for four flow ramp experiments at 30 degC 60 degC 160 degC and 180
degC where x = 4-aminophenol x = paracetamol x = diacetamate mdash = 4-aminophenol
(ODE) mdash = paracetamol (ODE) mdash = diacetamate (ODE) See Chapter 732 for full
experimental conditions and raw data
Table 32 Evaluation of the feasibility of each reaction model for the paracetamol study
Rank Reaction Model
k values s-1 or M-1 s-1 SSE
x103 M
AICC
Evaluation 30 degC 60 degC 160 degC 180 degC
1 312 + 313 rarr 314 + 316
314 + 313 rarr 315 + 316
59082
-
64471
-
-
00129
-
00427 0295 1292
2
314 + 316 rarr 312 + 313
312 + 313 rarr 314 + 316
314 + 313 rarr 315 + 316
01599
59509
-
09120
67519
-
-
-
00125
-
-
00427
0293 3690
3
312 + 313 rarr 314 + 316
312 + 315 rarr 314 + 314
314 + 313 rarr 315 + 316
59067
38065
-
64348
35719
-
-
-
00129
-
-
00428
0295 3692
4
315 + 316 rarr 314 + 313
312 + 313 rarr 314 + 316
314 + 313 rarr 315 + 316
23783
59188
-
27076
64641
-
00210
-
00130
00022
-
00430
0295 3692
121
5
314 + 314 rarr 312 + 315
312 + 313 rarr 314 + 316
314 + 313 rarr 315 + 316
00799
59258
-
02270
64833
-
-
-
00127
-
-
00425
0295 3692
Interestingly there are many reaction models that were found to have a
lower SSE error metric than the identified most likely model This is again where
the AICC ranking metric is used to great effect to balance the convergence to
experimental data as well as the simplicity of the model It is in these cases that
models that contain transformations discussed previously as very unlikely such
as in the rank 3 model that the terms are likely being used by the optimisation
algorithm to fit experimental noise For this reason this approach cannot be
completely autonomous and must require evaluation by a chemist when
observing the top rated models to be certain that the quality of the data assures
correct model determination - this was discussed in Chapter 225
This paracetamol study has shown that the approach can correctly identify
the reaction model and kinetic parameters for a multistep reaction using real
experimental data from different temperature flow ramps by inputted only the
observed species and time-series data As a side note - interestingly contrary to
common undergraduate laboratory experiment scripts[238] the over-reacted
diacetamate will not form in any measurable quantities in a conventional
undergraduate experiment Assuming that the reaction is similar in water to
acetonitrile the reaction doesnrsquot need refluxing and will go to full conversion of
paracetamol within seconds at room temperature Furthermore using the kinetic
parameters in this study and the recommended reflux temperature of common
laboratory manuals 100 degC and a typical 02 M reaction mixture of paracetamol
and acetic anhydride it would take approximately 12 years for the reaction to
achieve complete conversion to diacetamate
35 Case study Metoprolol
The final experimental case study that was explored was the chemical
system producing metoprolol whereby the epoxide starting material 317 reacts
with isopropylamine 318 to form metoprolol 319 which can further react to
form the bis-substituted impurity 320 shown in Scheme 35 Metoprolol is a
122
cardioselective beta-blocker commonly used for the treatment of hypertension
for which kinetic information would help in the process development stage of
manufacture at AstraZeneca This reaction system serves as the first real
experimental multistep reaction that is studied by this approach where parallel
reactions occur in tandem leading to a more difficult system for which to optimise
kinetic parameters and identify the correct reaction model
Scheme 35 The reaction of the epoxide starting material with isopropylamine to form
metoprolol as well as the overreaction to form the bis-substituted product
Two sets of two-temperature flow ramps were run on parallelised flow
reactor platforms one set in our lab in Leeds (190210 degC) and one set at
AstraZenecarsquos lab in Macclesfield (130150 degC) The two reactor platforms differ
in equipment specification and reactor volume and the two experimental sets
differ in temperatures and starting concentrations This parallelisation of
experiments on different systems was performed to further confirm the
reproducibility of this flow ramp methodology as corroborating data can be
achieved by an operator on separate reactor systems in different locations The
experimental results were then combined and the computational approach was
applied Full details of experimentation can be found in Chapter 7331
Based on the four species identified there were six reactions that were
calculated to be possible based on mass balance These reactions are shown
as eqn 317 - 322
317 + 318 rarr 319 eqn 317
319 rarr 317 + 318 eqn 318
319 + 317 rarr 320 eqn 319
320 rarr 319 + 317 eqn 320
123
319 + 319 rarr 318 + 320 eqn 321
318 + 320 rarr 319 + 319 eqn 322
63 reaction models were generated which correspond to every possible
combination of these allowed reactions and each of them were evaluated
sequentially by the approach The reaction model shown in Scheme 35 was
identified as the most likely representation of the system by AICC and the kinetic
parameters for the formation of metoprolol were found to be k170 degC = 0286 plusmn
0012 M-1 min-1 Ea = 724 plusmn 29 kJ mol-1 and for the formation of the bis-
substituted product k170 degC = 0019 plusmn 0001 M-1 min-1 Ea = 750 plusmn 30 kJ mol-1
This identified model alongside the kinetic parameters fit to the experimental data
very accurately with an average residual of less than 2 x 10⁻³ M and is shown
in Figure 313 The top 5 ranked models are shown in Table 33 with their
respective SSE error metric and AICC evaluation
Figure 313 Kinetic profiles for the flow ramp experiments at 130 degC 150 degC 190 degC and 210
degC where x = starting material x = Metoprolol x = bis-substituted product mdash = starting
material (ODE) mdash = Metoprolol (ODE) mdash = bis-substituted product (ODE) See Chapter
733 for full experimental conditions and raw data
124
Table 33 Evaluation of the feasibility of each reaction model for the metoprolol study
Rank Reaction Model
Kinetic parameters SSE
x10 M
AICC
Evaluation k170 degC min-1 or
M-1 min-1 Ea kJ mol-1
1 317 + 318 rarr 319
319 + 317 rarr 320
02857
00191
7242
7500
01212 -31145
2 317 + 318 rarr 319
319 rarr 318 + 320
03065
00260
7569
6552
01252 -30961
3
317 + 318 rarr 319
319 rarr 317 + 318
317 + 319 rarr 320
03008
00043
00188
7463
5379
7557
01188 -30768
4
317 + 318 rarr 319
319 + 317 rarr 320
320 rarr 319 + 317
02858
00202
00158
7245
8216
4920
01209 -30669
5
317 + 318 rarr 319
319 + 317 rarr 320
318 + 320 rarr 319 + 319
02857
00191
00003
7242
7508
4898
01212 -30653
The reference k values and activation energies were fitted directly in the
kinetic fitting stage of the approach and the experimental dataset was adjusted
to incorporate an artificial-zero time point which is a common practice when
fitting kinetics in order to assert an experimental lsquostart timersquo when concentrations
are known This can fix any fitting discrepancies that may occur as the first
measured time point may not be accurate - it is assumed however that all time
points following this first measurement are correct with respect to the first
measurement This is assumed only for the fitting of the kinetic parameters as
the parameters are likely to be more accurate In the case of this experiment
small deviations in asserting the time of the initial measurement may occur from
thermal expansion of the solvent because of the very high temperatures or from
pump flow rate errors
It has been shown in this study that it is possible to deconvolute reaction
pathways that are happening simultaneously using this computational approach
Differing-temperature experimental datasets were collected from different
125
experimental systems and collated to show that the correct model could be
identified even with data from different sources Kinetic parameters are also
identified from this approach that gives an excellent fit to the experimental data
This kinetic information can then be used to optimise this process between
given limits for temperature chemical equivalents and reaction time Using
current pricing for the starting material used in this work[239] other standard
industrial optimisation techniques would have been significantly more expensive
to implement When comparing this kinetic approach to other optimisation
methods steady-state kinetic measurements would have cost 24 more in
terms of material consumption and a screening and full factorial design of
experiments (DoE) optimisation would have cost 106 more - see Chapter
7336 for more details Then of course factoring in the cost of the time of the
chemist running the experiments (which hereby would be automated) and the
time for interpretation of the data and kinetics (which the approach elucidates)
this results in a significant reduction in labour time and overall cost which also
results in a more comprehensive overview of the possible kinetic models at play
36 Conclusion
It has been shown in this work that when real experimental time-series data
for a chemical process is available total process understanding can be achieved
without the need for high-level chemical intuition or human interference When
participating species are known or inferred complete sets of kinetic information
can be obtained via construction of all possible reaction models and identification
of their respective kinetic parameters This was undertaken by coupling an
automated flow reactor platform with a computational approach to deduce and
evaluate each kinetic model utilising optimisation algorithms After post-reaction
statistical analysis indicates which models are the most likely to be true based
on the experimental data provided which can be from batch or flow this
information can then be interpreted by a trained chemist to further differentiate
reaction pathways based on what should and should not be chemically possible
This approach has been proven to be powerful in determining the reaction
model and kinetic parameters in a variety of experimental circumstances The
approach will be particularly powerful in situations where the reaction model is
126
not completely understood for example when there are competing reaction
pathways The approach can be computationally expensive depending on the
number of possible reaction models although all of the optimisations carried out
by the approach on the work described was evaluated in less than 5 minutes on
a standard 4-core Intel i5-2310 processor However the added computational
cost is minimal compared to the reduction of time and experimental cost with
regards to kinetic evaluation Furthermore this approach can be run
automatically as bench scientists use their human resource for more challenging
tasks that cannot be automated
This work is the first implementation of the approach on experimental
time-series data and has been proven to efficiently interpret kinetic information
using minimal amounts of material to generate sufficient experimental data to
enable accurate model determination Using this methodology can considerably
outweigh the cost of further experimentation to discriminate speculated kinetic
models and can greatly reduce the time and cost barriers to full process
understanding
Chapter 4 The development of an improved computational
approach to kinetic model determination
41 Introduction
The aforementioned computational approach to kinetic model and
parameter determination as described in Chapter 2 and Chapter 3 is a powerful
tool for many experimental applications However there are two major limitations
to this tool The first limitation is in the reaction orders of the particular species
that are available - these orders are constrained to two integer orders 1 and 2
There are instances however where reactions can feature zero order reactions
or even have non-integer orders for which this approach currently cannot
facilitate and identify The second limitation is the inability of the approach to
model catalytic reactions and hence determine the reaction order of species
within a catalytic reaction As catalytic reactions are common in research
manufacturing and process development there are many applications where this
approach could ideally be utilised but is not currently applicable
127
Further development of the computational approach to rectify these
limitations can therefore increase its applicability greatly which further increases
the scope of the tool for chemical applications As the comprehensive model
evaluation aspect of this methodology has been proven to be effective for
determining correct reaction models the skeleton of the approach remains
unchanged This includes the two major steps of the approach model generation
and kinetic parameter fitting as well as the statistical measurements involved ie
AICC However although the basis for the approach remains the same many
structural changes of the programmed tool are necessary for the incorporation
of these new applications non-integer order models and catalytic models The
advancement of the approach to incorporate these changes makes it applicable
in almost all chemical processes which is the final step in answering the overall
research aim of the project to build an automated methodology to kinetic model
discrimination and parameter determination
42 Methodology advancement
421 Capabilities
When mass-balance-allowed reactions are identified by the approach
these reactions can then be compiled into a number of models that feature them
as discussed in Chapter 22 However there is a difference between an allowed
reaction based on the mass balance of the reactants and products and the rate
laws that govern the way that these species react All models are currently
compiled in a way that assumes a first order dependence on all species that are
featured Therefore for the mass-balance-allowed transformation of A to B as
shown in eqn 41 the rate law for the change in B is shown in eqn 42
A fundamental change to this methodology explores the same
transformation but using different reactivities by also investigating different
orders of the reacting species To explore different reaction orders including
non-integer reaction orders the rate law of the elementary reaction can be
described with differing powers of α shown in eqn 43 where α = 0 05 or 1
119860119896rarr119861 eqn 41
119889[119861]
119889119905= 119896[119860] eqn 42
128
This allows multiple chemical pathways to be explored that describe the
chemistry in different ways which were not available previously using this
methodology Each of the newly identified reactions are then treated as
lsquoavailablersquo reactions from which reaction models can be constructed in the same
way as described in Chapter 22 Therefore for each mass-balance-allowed
reaction identified by the approach that is lsquounimolecularrsquo there are 3
corresponding reaction orders possible and therefore 3 reactions that are added
to the pool of available reactions for kinetic model generation In the context of
this approach the transformation of a single mass-balance-allowed reaction to
every variant of its corresponding rate law is termed lsquoinflationrsquo
For lsquobimolecularrsquo reactions identified by the approach as mass-balancing
similar chemical descriptions can be written as with the lsquounimolecularrsquo reactions
For the reaction of A and B to form C there are multiple potential combinations
of the species orders α and β in the potential rate laws shown in eqn 44 and
45
These values of α and β can take the form of 0 05 1 as before However it is
extremely rare for two chemical species to react with a zero order dependence
on both species Therefore in an effort to lower the number of lsquoavailablersquo
reactions and hence lower the number of kinetic model evaluations necessary
these particular reactions are seen as unfeasible and are therefore not included
in the model generation stage This is also true of a zero order05 order
bimolecular reaction Therefore for every lsquobimolecularrsquo mass-balance-allowed
transformation identified by the approach there are 5 corresponding reactions
that are added to the pool of available reactions for kinetic model generation
This approach has also been modified to include catalytic reactions in the
model generation if the user selects the option to do so The user can select to
either include catalytic reactions or exclusively look at catalytic reactions (ie no
reactions can occur without a catalyst) As before all mass-balance-allowed
119889[119861]
119889119905= 119896[119860]120572 eqn 43
119860 + 119861119896rarr 119862 eqn 44
119889[119862]
119889119905= 119896[119860]120572[119861]120573 120572 + 120573 ge 1 120572 = 120573 ne 05 120572 120573 isin 0 05 1 eqn 45
129
transformations are identified then for the reaction of A and B to form C all
combinations of integer and non-integer catalytic reactions are generated within
the inflation step At this point the species that is user-selected to behave
catalytically is then incorporated into the rate laws For each mass-balance-
allowed (inflated) transformation the catalytic species can take the order of 05
1 or 2 and each of these rate law variations are constructed and added to the
pool of available reactions for kinetic model generation Note also that in these
catalytic reactions the dependence of the orders become empirical to a greater
extent whereby individual species are used and regenerated as opposed to
referring specifically to molecularity (ie number of species reacting together at
once) When catalytic reactions are included in model generation with the
selected catalytic species lsquoCatrsquo eqn 44 becomes eqn 46 and the general rate
law shown in eqn 45 becomes eqn 47 where γ = order of catalyst
All combinations of catalytic and non-catalytic reactions are generated For each
mass-balance-allowed lsquobimolecularrsquo reaction where catalytic variants are also
generated there are 15 possible corresponding reactions that are added to the
pool of available reactions for kinetic model generation This inflation step is
summarised qualitatively in Figure 41 showing how individual mass-balance-
allowed reactions can generate multiple transformations that are dependent on
different rate laws
119860 + 119861 + 119862119886119905119896rarr 119862 + 119862119886119905 eqn 46
119889[119862]
119889119905= 119896[119860]120572[119861]120573[119862119886119905]120574 120572 + 120573 ge 1 120572 = 120573 ne 05 120572 120573
isin 0 05 1 120574 isin 0512
eqn 47
130
Figure 41 An illustration of how the lsquoinflationrsquo step takes all mass-balance-allowed
transformations sequentially then deduces all allowed integer and non-integer orders
and generates corresponding rate laws for these transformations If catalytic reactions
are to be explored also rate laws for these catalytic dependencies are also generated
These transformations are all then saved from which full reaction models can be
constructed
These new capabilities incorporated into the overall computational
approach allow kinetic model determination for more complex chemical systems
for catalyticnon-catalytic processes with integer or non-integer orders This
approach can then be used as before whereby the chemical species and
experimental datasets are uploaded and the program runs an extensive kinetic
model evaluation loop followed by statistical analysis to determine the most
likely model However the major disadvantage to evaluating all possible models
generated after the newly incorporated inflation step is the huge computational
cost As the pool of available reactions is expanded greatly from simple mass-
balance-allowed reactions to all rate laws possibly governing these reactions
the number of possible models to be generated from these reactions grows
131
exponentially It is therefore not feasible with current technology to evaluate
every possible model However many of these possible models are also
unfeasible due to their inability to occur anyway Upon generation of a reaction
model the fitness of the model can be determined by employing simple and
appropriate logical and chemical constraints or rules These rules ensure that
generated models with an infeasibility to occur are identified and discarded
without the need for further evaluation and consumption of computational
resources
422 Rules
In order to evaluate only the models that are feasible a priori logical and
chemical rules must be applied to the available models to discard large numbers
of them as many models may feature redundant or impossible model terms
within them To postulate such rules requires logical yet simplistic
rationalisations of how reactions occur - rationalisations that seem obvious upon
realisation but are seldom taught or reported in the literature
To show the importance of these rules when running this approach
Scheme 41 shows a model reaction of maleic acid 41 reacting with methanol
42 to form the mono-product 43 and the di-product 44 which can be used
to show the number of models to be evaluated[240] In this reaction the maleic
acid is self-catalytic so this species behaves as both a starting material and a
catalyst Using these 5 species there are 6 possible mass-balance-allowed
reactions From these 6 reactions after inflation steps to look at all integer and
non-integer species dependencies and all catalytic and non-catalytic reactions
the total number of models to evaluate is gt1854900872 A specific number
cannot be quoted as just compiling this number of reaction models takes over
110 GB of memory and so an accurate estimate cannot be achieved with the
equipment available The evaluation of this number of models would likely take
several years to complete even when using high-performance computing
clusters It is therefore imperative that these rules drastically reduce the number
of models to evaluate to enable this methodology as a practical process
development application
132
Scheme 41 The self-catalysed reaction of maleic acid 41 and methanol 42 to form the
mono-product 43 and the di-product 44[240]
Rule 1 One variant of each reaction
There are many variations of the same elementary transformations to be
considered when building models for evaluation Examples of these variations
could be
bull A + B rarr C
bull A + B0 rarr C
bull A05 + B rarr C
bull etc
It is very unlikely however that the same reactants will undergo the same
chemical transformation to products with many different rate laws It would not
be expected that an elementary step would proceed in numerous ways in both
an overall second order and an overall first order manner to result in the same
product for example Therefore when compiling reaction models for evaluation
only one variant of each elementary reaction can be present in a single model
This also reduces the maximum number of model terms in a single model to the
total number of elementary reactions which in this example is 6 When this rule
is enforced during model generation for the model chemical system the total
number of models for evaluation is 8156735
Rule 2 Iterative model evaluations
Although it cannot be known what the lsquoaveragersquo number of model terms
in a lsquogeneralrsquo model is the assumption can be made that the user is investigating
a single synthetic step in a chemical process With a single synthetic step there
may be consecutive reactions and impurities formed but it would undoubtedly
be regarded as unlikely if any model was proposed with 30 model terms for
example In accepting this postulation it must therefore also be true that there is
a continuum of likelihood whereby a model will contain a certain number of model
133
terms especially when evaluated by AICC Therefore there must also exist a
limit of model terms that once reached it can be regarded that the corresponding
model is too unlikely to occur to be treated as a serious model candidate Without
a vast literature study it is not possible to know what this number should be and
this prospective study extends past the scope of this project - this discussion is
highlighted to simply introduce the concept of the existence of this upper limit of
model terms
Although this upper limit is unknown it is possible to start at a prospective
number of model terms then the user can decide if this number should be
increased based on the responses observed From chemical intuition based on
the findings of AICC values thus far in the project much of the data can be fitted
effectively with le 4 model terms and adding further model terms in general leads
to diminishing model evaluations This is of course a biased generalisation
based on the chemical systems that have been studied within the project
However using an initial upper limit of 4 model terms in the model generation
stage may be generally appropriate for single-step chemical systems - if this limit
does not give a satisfactory model that fits the supplied experimental data it can
be iteratively increased to 5 model terms then 6 etc As there are many models
that would require computationally expensive evaluations with over 4 model
terms this rule allows the user to determine if further evaluations with larger
models are necessary which could otherwise potentially waste computational
resources and more importantly time When this rule is enforced during model
generation in the model chemical system as well as the previous Rule 1 the
total number of models for evaluation is 668735
Rule 3 Catalytic reactions considered only
In order to reduce the number of available reactions from which to build
models and hence reduce the number of unnecessary model evaluations it is
assumed from the userrsquos input of a catalytic species that all mass-balance-
allowed reactions present will proceed only with a catalyst This is assumed due
to the available lower energy pathways in the presence of the catalyst This can
then be changed by user input if a suitable model is not found where the model
generation is re-run to incorporate reactions that both do and do not proceed
using the specified catalyst When this rule is enforced during model generation
134
as well as each previous rule the total number of models for evaluation in the
model chemical system is 173711
Rule 4 There must be at least one reaction from starting materials to products
As the starting concentrations are initially inputted into the system it can
be deduced which of the species are lsquostarting materialsrsquo In some instances there
may be species that are considered by the user to be the products of the reaction
at the first time point but in the context of this rule are also considered to be a
starting material For clarity this definition of lsquostarting materialrsquo refers only to
species that have mass in the initial concentrations The rule states that there
must be at least one term in the model that describes a decrease in the
concentration of one of the identified starting materials This logic-based rule
ensures with certainty that the models that are evaluated feature terms that
exhibit a change in concentrations Although seemingly obvious this rule is
necessary to remove these commonly occurring models that would only lead to
wasted computational resources
For example if there are four species in a chemical system (A B C D)
and their initial concentrations are 1 M 0 M 0 M and 0 M respectively the only
starting material identified is A Many models that are feasible according to mass
balance may not be feasible according to this rule as they may not exhibit a
change in concentration Table 41 shows some examples of allowed models
based on these starting concentrations that will progress onto the kinetic fitting
stage of the approach as well as disallowed models that will be discarded As
shown entries 3 and 4 will both feature a change in concentrations whereas
entries 1 and 2 will not and are hence discarded When this rule is enforced as
well as each previous rule the total number of models for evaluation in the model
chemical system is 121836
Table 41 A table showing examples of allowed and disallowed models according to Rule 4
Entry 1 2 3 4
Model B rarr C
B + B rarr D
B + B rarr D
D rarr A
A rarr D
B rarr C
A rarr B + B
B rarr C
Allowed
135
Rule 5 New lsquostarting materialsrsquo available from products
As an extension of Rule 4 relating to identifying lsquostarting materialsrsquo from
initial concentrations further starting materials can also be identified from the
products of these earlier reactions For example in entry 4 in Table 41 B is not
initially identified as a starting material However as A is a starting material
forming B as a product there is certain to be some concentration of B as time
progresses meaning that B can also be viewed as a starting material at some
point Therefore as starting materials in entry 4 are A and B both reactions in
this model are allowed because they both feature a change in concentration from
a starting material to another species
Under Rule 5 models that feature model terms incurring a decrease in
concentration from these newly identified starting materials only can be allowed
Therefore entry 4 will be a model that is progressed onto the model evaluation
stage However in entry 3 in Table 41 it can be noted that the initially identified
starting material (A) forms D as a product meaning that the starting materials in
this model are A and D The second model term features a reaction of B to form
C but this logic-based rule highlights that there is no possible scenario where B
will be formed in order to further react If this model were to progress onto model
evaluation it would certainly be an over-trained model and would rank lowly
according to an AICC evaluation as the second model term will not provide a
benefit to the model over just having the first model term alone Therefore under
Rule 5 entry 3 would be disallowed and not progress onto the model evaluation
stage thereby saving computational resources on this redundant model When
all rules are enforced including Rule 5 the total number of evaluations for the
model system is 98725
Final considerations for model generation
Other considerations were also made when compiling models in the
model generation stage specifically referring to the allowed orders of particular
species For catalytic species the allowed orders were determined to be 05 1
and 2 This is because the order in a catalytic species of a system being greater
than gt2 or =15 are too rare to warrant serious consideration and would incur a
significantly greater computational expense to evaluate all of the generated
models
136
Much thought was exercised as to whether a zero-order dependence on
a catalyst is possible as this discussion is missing from the literature and general
teaching It can be postulated that since the presence of a catalyst allows a more
favourable lower energy pathway there must therefore be some dependence on
the concentration of the catalyst for this lower energy pathway to progress This
rationalisation infers that it is not possible for a zero-order dependence of
catalyst but there may always be selected cases where this can be empirically
true In any case if a zero-order dependence of catalyst is possible it is too
unlikely to warrant serious consideration as this would generate many more
models to be evaluated
For non-catalytic systems this approach attempts to build reaction
models from base-level elementary reactions (where the both the stoichiometry
and order of participating species are 1 for each occurrence of the species in
the reaction scheme) However there are two notable exceptions 0 and 05
orders which are inherently more empirical in nature A zero-order dependence
on a particular species in this approach will still have a stoichiometry of 1
whereby one molecule of this species is consumed in the reaction but the
reaction rate does not depend upon its concentration A 05 order dependence
will have both a stoichiometry of 05 and an order of 05 There are many other
integer and non-integer empirical dependencies of varying stoichiometry and
order that are possible in complex chemical reaction networks (CRNs) However
these dependencies are very rare and not common enough to warrant serious
consideration for this computational approach as this would generate many more
models to proceed into model evaluation resulting in a much higher
computational expense Therefore reactions are only considered for model
generation with species that have orders in the rate laws of 0 05 or 1
423 Overview
This updated computational approach to kinetic model selection and
parameter identification was developed in MATLAB by adjusting the previously
developed tool reported in Chapter 2 and Chapter 3 Firstly the user inputs
experimental data and the participating species into the system The approach
identifies all possible reactions that can happen based on mass balance then
generates all conceivable rate laws subject to basic chemical intuition in the
inflation step (and subject to the user defining a catalytic species) Every
137
combination of these rate laws are then compiled into different reaction models
followed by logical rule enforcements to remove vast numbers of redundant or
wasteful models All remaining models are sequentially loaded then kinetic
parameters are optimised to increase convergence of ordinary differential
equation (ODE) curves to the experimental data Finally each model is then
statistically evaluated and ranked highlighting the most likely model based on
the experimental data supplied The approach overview is highlighted in Figure
42
Figure 42 An overview of the updated computational approach to kinetic model and
parameter determination
This updated methodology represents a significantly improved automatic
tool for process development by comprehensively evaluating every possible
model without the need for chemical intuition or more importantly chemistsrsquo
time This approach has been upgraded to allow both catalytic reactions and
reactions with non-integer orders to be identified therefore vastly expanding its
scope However it is still important to note that although this tool is powerful it
is ultimately data-driven and subsequently must only be used as a
complementary tool Therefore after all model evaluations the tool must still be
138
used in conjunction with real chemical intuition by an end user to determine that
the models identified as most likely are accurate and consistent with the science
43 Simulated verifications of the approach
In the same manner as the previous methodology it is first important to
verify that the approach identifies the correct models and kinetic parameters
before conducting any real experimentation Several simulated case studies
were conducted that feature different true kinetic models showing how this
methodology has been adapted to identify catalytic speciesrsquo orders as well as
non-integer and zero order species dependencies in chemical systems These
case studies feature reactions from the literature whereby simulated
experimental data is generated from known models and kinetic parameters
To simulate the experimental data as shown in Chapter 23 the true
model and kinetic parameters reported in the literature source are inputted into
MATLAB The experiments are then simulated at particular temperatures and
initial sets of concentrations by using an ODE solver to evaluate the change in
species concentrations over a given experimental timeframe Individual data
points are then extracted from this timeframe which then represent experimental
data points for the simulated case study Up to plusmn 2 relative error is then added
to each measurement to approximate this simulated data more closely to real
experimental data
431 Case study SNAr kinetics
The first simulated case study was the SNAr reaction described in Scheme
42 where 24-difluoronitrobenzene (starting material SM) 45 reacts with
pyrrolidine 46 to form either the ortho-substituted product 47 or the para-
substituted product 48 - both of which can then react further with pyrrolidine to
form the bis-substituted product 49 and form hydrofluoric acid 410 as a
byproduct in each step[225] This case study features lsquosimplersquo elementary
reactions in the true model as there are no non-integer or zero order
dependencies However this scenario is still important to study as the new
approach must still be able to correctly identify model structures and kinetic
parameters of systems that feature only these elementary reactions In this case
both the old approach and the new approach were run in order to determine if
139
they both arrive at the same identified model as they should This should confirm
that even in a multicomponent process the new approach will still identify the
correct elementary reactions instead of substituting non-integer or zero order
rate laws
Scheme 42 The reaction of 24-difluoronitrobenzene 45 with pyrrolidine 46 to form the
ortho-substituted product 47 and the para-substituted product 48 Consecutive
reactions then occur to form the bis-substituted product 49 In each reaction
hydrofluoric acid 410 is formed[225]
4311 Data acquisition
The multistep SNAr reaction model reported by Hone et al consists of 4
second-order reactions These reactions were used to generate the ODEs
shown in eqn 41 - 46 The reported kinetic constants for these three steps
were
bull Step one k90 degC = 0579 M-1 s-1 Ea = 333 kJ mol-1
bull Step two k90 degC = 0027 M-1 s-1 Ea = 353 kJ mol-1
bull Step three k90 degC = 0009 M-1 s-1 Ea = 389 kJ mol-1
bull Step four k90 degC = 0016 M-1 s-1 Ea = 448 kJ mol-1
Five simulated data sets were generated at 30 degC by using eqn 27 to calculate
k values with the following initial concentrations
bull 1 M SM 45 11 M pyrrolidine 46 0 M ortho-substituted product 47 0
M para-substituted product 48 0 M bis-substituted product 49 and 0 M
hydrofluoric acid 410
140
bull 08 M SM 45 15 M pyrrolidine 46 0 M ortho-substituted product 47
0 M para-substituted product 48 0 M bis-substituted product 49 and 0
M hydrofluoric acid 410
bull 1 M SM 45 2 M pyrrolidine 46 0 M ortho-substituted product 47 0 M
para-substituted product 48 0 M bis-substituted product 49 and 0 M
hydrofluoric acid 410
bull 1 M SM 45 25 M pyrrolidine 46 0 M ortho-substituted product 47 0
M para-substituted product 48 0 M bis-substituted product 49 and 0 M
hydrofluoric acid 410
bull 12 M SM 45 3 M pyrrolidine 46 0 M ortho-substituted product 47 0
M para-substituted product 48 0 M bis-substituted product 49 and 0 M
hydrofluoric acid 410
119889[120786 120787]
119889119905= minus1198961[120786 120787][120786 120788] minus 1198962[120786 120787][120786 120788] eqn 41
119889[120786 120788]
119889119905= minus1198961[120786 120787][120786 120788] minus 1198962[120786 120787][120786 120788] minus 1198963[120786 120789][120786 120788]
minus 1198964[120786 120790][120786 120788]
eqn 42
119889[120786 120789]
119889119905= 1198961[120786 120787][120786 120788] minus 1198963[120786 120789][120786 120788] eqn 43
119889[120786 120790]
119889119905= 1198962[120786 120787][120786 120788] minus 1198964[120786 120790][120786 120788] eqn 44
119889[120786 120791]
119889119905= 1198963[120786 120789][120786 120788] + 1198964[120786 120790][120786 120788] eqn 45
119889[120786 120783120782]
119889119905= 1198961[120786 120787][120786 120788] + 1198962[120786 120787][120786 120788]
+1198963[120786 120789][120786 120788] + 1198964[120786 120790][120786 120788]
eqn 46
2 relative error was then added to each data point in these simulated
data sets then used as the inputted experimental data for both the old and new
computational approach These data sets can be found in Chapter 741
4312 Results and discussion
As the initial ILP optimisation proceeds in the same manner for both the
old and new approaches the mass-balance-allowed reactions identified in each
case are the same It is only the subsequent rate laws and models that differ in
141
the model generation steps between the old and new approaches From the 6
species inputted there are 16 mass-balance-allowed reactions that were
identified shown in eqn 47 - 422
48 rarr 47 eqn 47
47 rarr 48 eqn 48
45 + 46 rarr 47 + 410 eqn 49
47 + 410 rarr 45 + 46 eqn 410
45 + 49 rarr 47 + 47 eqn 411
45 + 46 rarr 48 + 410 eqn 412
46 + 47 rarr 49 + 410 eqn 413
47 + 47 rarr 45 + 49 eqn 414
49 + 410 rarr 46 + 48 eqn 415
48 + 410 rarr 45 + 46 eqn 416
46 + 48 rarr 49 + 410 eqn 417
45 + 49 rarr 47 + 48 eqn 418
45 + 49 rarr 48 + 48 eqn 419
49 + 410 rarr 46 + 47 eqn 420
47 + 48 rarr 45 + 49 eqn 421
48 + 48 rarr 45 + 49 eqn 422
Old approach
When running the old approach every combination of the 16 identified
mass-balance-allowed transformations was constructed resulting in 65535
unique models to be evaluated All of these resulting models were evaluated by
the approach which incurred a computation time of 13 hours (see Chapter 762
for details on computer specifications)
Each of these models were ranked based on their AICC evaluation and it
was found that the highest ranked model was also the correct model with kinetic
parameters optimised to values that were very close to the literature values used
to generate the data As with previous simulations described in Chapter 23 the
142
optimisation is assumed to be correct as the error in the fitted parameters is
negligible considering that artificial error was added to the data set The top five
performing models are shown in Table 42 where the optimised k values are
shown as well as their corresponding SSE and AICC values
Table 42 A table showing the top five ranked models for the SNAr case study as identified by
the old approach The kinetic parameters for each reaction within the model are shown
as well as the SSE and AICC evaluation
Model
rank Model kx M-1 min-1 SSE M AICC
1
45 + 46 rarr 47 + 410
45 + 46 rarr 48 + 410
47 + 46 rarr 49 + 410
48 + 46 rarr 49 + 410
00656
00026
00007
00008
00040 -30627
2
45 + 46 rarr 47 + 410
45 + 46 rarr 48 + 410
47 + 46 rarr 49 + 410
48 + 46 rarr 49 + 410
45 + 49 rarr 47 + 48
49 + 410 rarr 46 + 48
00657
00026
00007
00010
00065
lt00001
00039 -30125
3
45 + 46 rarr 47 + 410
45 + 46 rarr 48 + 410
47 + 46 rarr 49 + 410
48 + 48 rarr 49 + 45
00657
00027
00007
00174
00044 -30097
4
45 + 46 rarr 47 + 410
45 + 46 rarr 48 + 410
47 + 46 rarr 49 + 410
48 + 46 rarr 49 + 410
45 + 49 rarr 47 + 48
00663
00028
00007
00010
00026
00042 -30053
5
45 + 46 rarr 47 + 410
45 + 46 rarr 48 + 410
47 + 46 rarr 49 + 410
48 + 46 rarr 49 + 410
00655
00026
00007
00009
00041 -29946
143
45 + 49 rarr 47 + 47
45 + 49 rarr 48 + 48
00143
00065
New approach
When running the new approach all allowed combinations of the mass-
balance-allowed reactions and corresponding non-integer and zero order rate
laws were compiled subject to the rules described earlier in Chapter 422 This
model generation resulted in 141505 unique models to be evaluated by the
approach which incurred a 28 hour computation time (see Chapter 762 for
details on computer specifications)
Each of these models were ranked based on their AICC and it was found
that the highest ranked model was also the correct model with kinetic
parameters optimised to values that were very close to the literature values that
were used to generate the data As highlighted in the old approach section the
optimisation is assumed to be correct as the error in the fitted parameters is
negligible considering that artificial error was added to the dataset The top five
performing models from this new approach are shown in Table 43 where the
optimised k values are shown as well as their corresponding SSE and AICC
values
Table 43 A table showing the top five ranked models for the SNAr case study as identified by
the new approach The kinetic parameters for each reaction within the model are shown
as well as the SSE and AICC evaluation α denotes a variable molar dependence within
the kinetic parameter units depending on the rate law
Model
rank Model kx Mα min-1 SSE M AICC
1
45 + 46 rarr 47 + 410
45 + 46 rarr 48 + 410
47 + 46 rarr 49 + 410
48 + 46 rarr 49 + 410
00656
00026
00007
00008
00040 -30627
2
45 + 46 rarr 47 + 410
46 + 47 rarr 49 + 410
480 rarr 47
47 rarr 48
00680
00007
00501
00394
00042 -30333
144
3
45 + 46 rarr 47 + 410
45 + 46 rarr 48 + 410
47 + 46 rarr 49 + 410
48 + 48 rarr 49 + 45
00657
00027
00007
00174
00044 -30097
4
45 + 46 rarr 47 + 410
45 + 46 rarr 48 + 410
47 + 46 rarr 49 + 410
48 + 41005 rarr 45 + 46
00640
00024
00007
00008
00061 -28521
5
45 + 46 rarr 47 + 410
47 + 46 rarr 49 + 410
47 rarr 48
48 rarr 47
00670
00007
00041
00997
00065 -28276
Discussion
This initial simulated case study has shown that it is still possible to identify
the correct reaction model and kinetic parameters with this new approach for a
lsquosimplersquo reaction system featuring a first-order dependencies on all species The
most-likely identified model and corresponding SSEAICC values were the
same in this instance for both the old and new approach which is to be expected
if the new approach is functioning correctly As shown in the old approach there
are models that have a greater convergence to the experimental data (and hence
a lower SSE) but the statistical analysis correctly assigns these models an
unfavourable AICC based on their extra (insignificant) model terms However as
the initial limit of 4 terms in a model is enforced in the new approach it can be
determined by the user that compiling and evaluating the 5-term-models is not
required based on the marginal possible SSE benefits These small benefits are
very unlikely to warrant extra terms based on AICC evaluation as the
convergence to experimental data is already excellent meaning that the model
identified is very likely to be correct An example kinetic plot showing the fit of
the identified model to the experimental data is shown in Figure 43 - this is the
fifth simulated experiment where the starting concentrations were 12 M 24-
difluoronitrobenzene and 3 M pyrrolidine at 30 degC
145
Figure 43 The fit of the identified model and kinetic parameters to the generated experimental
data with starting concentrations of 12 M 24-difluoronitrobenzene and 3 M pyrrolidine at
30 degC Where x = 24-difluoronitrobenzene x = ortho-substituted product x = para-
substituted product x = bis-substituted product mdash = 24-difluoronitrobenzene (ODE) mdash
= ortho-substituted product (ODE) mdash = para-substituted product (ODE) mdash = bis-
substituted product Plot only shown to 500 minutes to the show curvature of the initial
data points
It has been shown that the new approach can identify the correct model
and kinetic parameters for a multistep process with first-order dependencies on
all species with the same accuracy as expected from the old approach
Therefore it is now possible to confidently move on to simulated case studies
where rate laws are more complex featuring catalytic reactions and orders that
are non-integer or zero
432 Case study Pentyne kinetics
This simulated case study features a chemical system that reacts with a zero-
order dependence on one of the species[241] The starting material 411 reacts
with the spirodiene 412 to form the product 413 and LiBr 414 as shown in
Scheme 43 The true rate law however shows a first-order dependence on the
starting material and a zero-order dependence on the spirodiene Interestingly
this reaction order has been used as evidence for the existence of a pentyne
species as this order suggests an initial reaction of the starting material to form
146
a much more reactive species leading to the zero-order dependence on the
spirodiene
Scheme 43 The reaction of the starting material 411 with the spirodiene 412 to form the
product 413 and LiBr 414[241]
4321 Data acquisition
The overall first-order reaction model reported by Gilbert et al[241] was used
to generate the ODEs shown in eqn 423 - 426 Three isothermal simulated
data sets were generated using these ODEs with the k value of 000846 min-1 at
-78 degC with the following initial concentrations
bull 1 M 2-bromocyclopentenyl lithium (starting material) 411 08 M
spirodiene 412 0 M product 413 0 M LiBr 414
bull 12 M 2-bromocyclopentenyl lithium (starting material) 411 15 M
spirodiene 412 0 M product 413 0 M LiBr 414
bull 1 M 2-bromocyclopentenyl lithium (starting material) 411 1 M
spirodiene 412 0 M product 413 0 M LiBr 414
119889[120786 120783120783]
119889119905= minus1198961[120786 120783120783] eqn 423
119889[120786 120783120784]
119889119905= minus1198961[120786 120783120783] eqn 424
119889[120786 120783120785]
119889119905= 1198961[120786 120783120783] eqn 425
119889[120786 120783120786]
119889119905= 1198961[120786 120783120783] eqn 426
2 relative error was then added to these simulated data sets then used
as the inputted experimental data for the computational approach These data
sets can be found in Chapter 742
4322 Results and discussion
147
From these 3 species there are 2 mass-balance-allowed reactions that
can be identified shown in eqn 427 and eqn 428 From these two reactions
the corresponding rate laws were generated and all models were compiled
subject to the rules defined in Chapter 422 - this resulted in 30 unique models
to be evaluated by the approach
411 + 412 rarr 413 + 414 eqn 427
413 + 414 rarr 411 + 412 eqn 428
All 30 models were evaluated by the computational approach incurring a
computation time of around lt1 minute (see Chapter 761 for details on computer
specifications) Each of these models were ranked based on their AICC and it
was found that the highest ranked model was also the correct model with kinetic
parameters optimised to values that were very close to the generated values
The top five performing models are shown in Table 44 where the optimised k
values are shown as well as their corresponding SSE and AICC values
Table 44 A table showing the top five ranked models for the pentyne case study as identified
by the new approach The kinetic parameters for each reaction within the model are
shown as well as the SSE and AICC evaluation α denotes a variable molar dependence
within the kinetic parameter units depending on the rate law
Model
rank Model kx Mα min-1 SSE M AICC
1 411 + 4120 rarr 413 + 414 00085 00046 -134903
2 411 + 4120 rarr 413 + 414
413 + 414 rarr 411 + 412
00085
lt00001 00046 -132515
3 411 + 4120 rarr 413 + 414
413 + 41405 rarr 411 + 412
00085
lt00001 00046 -132515
4 411 + 4120 rarr 413 + 414
4130 + 414 rarr 411 + 412
00085
lt00001 00046 -132514
5 411 + 4120 rarr 413 + 414
413 + 4140 rarr 411 + 412
00085
lt00001 00046 -132514
Interestingly all five of these top-ranked models all have the same SSE
values and ranks 2 - 5 all have very similar AICC evaluations It is clear from
these models that the primary reason that they score highly is due to the
148
presence of the true model term 411 + 4120 rarr 413 + 414 One extra model
term is present that is rendered negligible but as the algorithm is forced to fit it
it is fitted with a value lt00001 In the old approach these negligible reactions
could be found but not repeated whereas in the new approach every variation
of the rate law of a particular negligible reaction can be repeated and score highly
according to AICC
Nonetheless the highest ranked model according to the approach is the
true kinetic model and the corresponding k value was also identified correctly
This case study shows that it is possible for the approach to identify models that
feature reactions that do not have typical species order dependencies of 1
therefore also that it can be used for real experimentation featuring zero or non-
integer order model terms An example kinetic plot showing the fit of the identified
model to the simulated experimental data is shown in Figure 44 - this is the first
experiment where the starting concentrations were 1 M starting material and 08
M spirodiene at -78 degC
149
Figure 44 The fit of the identified model and kinetic parameters to the generated experimental
data with starting concentrations of 1 M starting material and 08 M spirodiene at -78 degC
Where x = starting material x = spirodiene x = product mdash = starting material (ODE) mdash
= spirodiene (ODE) mdash = product (ODE)
433 Case study Ytterbium catalysis
The final simulated case study involves a ytterbium catalysed reaction
with lsquonon-normalrsquo empirical rate laws[242] 1-Phenyl-2-trimethylsilylacetylene
(starting material) 415 reacts with diphenylphosphine 416 in the presence of
a ytterbium catalyst ([Yb(η2-Ph2CNPh)(hmpa)3]) 417 to form the product 418
as shown in Scheme 44
Scheme 44 The reaction of the starting material 415 with diphenylphosphine 416 in the
presence of the ytterbium catalyst 417 to form the product 418 where [Yb] Yb(η2-
Ph2CNPh)(hmpa)3[242]
4331 Data acquisition
The complex order dependencies for the reaction model reported by Takaki
et al[242] consists of 1 reaction that was used to generate the ODEs shown in
eqn 429 - 432 In the true empirical rate law the order in the starting material
is 1 the order in diphenylphosphine is 0 and the order of the ytterbium catalyst
is 2 Four isothermal simulated data sets were generated at 25 degC using these
ODEs with the k value of 9324 M2 h-1 with the following initial concentrations
bull 2 M starting material 415 2 M diphenylphosphine 416 02 M ytterbium
catalyst 417 0 M product 418
bull 15 M starting material 415 2 M diphenylphosphine 416 01 M
ytterbium catalyst 417 0 M product 418
bull 14 M starting material 415 18 M diphenylphosphine 416 03 M
ytterbium catalyst 417 0 M product 418
bull 22 M starting material 415 16 M diphenylphosphine 416 025 M
ytterbium catalyst 417 0 M product 418
119889[120786 120783120787]
119889119905= minus119896 [120786 120783120787][120786 120783120789]2 eqn 429
150
119889[120786 120783120788]
119889119905= minus119896 [120786 120783120787][120786 120783120789]2 eqn 430
119889[120786 120783120789]
119889119905= minus2119896 [120786 120783120787][120786 120783120789]2 + 2119896 [120786 120783120787][120786 120783120789]2 eqn 431
119889[120786 120783120790]
119889119905= 119896 [120786 120783120787][120786 120783120789]2 eqn 432
2 relative error was then added to these simulated data sets then
used as the inputted experimental data for the computational approach These
data sets can be found in Chapter 721
4332 Results and discussion
Based on the inputs of the molecular weights for this system there are
two mass-balance-allowed reactions However as it is known that this is a
catalytic system these two reactions must be facilitated by the user-defined
ytterbium catalyst 417 shown in eqn 433 and 434 It is then the role of the
approach to identify all combinations of allowed reactions and rate laws to
determine which is the most likely model
415 + 416 120786120783120789rarr 418 eqn 433
415 + 416 120786120783120789rarr 418 eqn 434
After the model generation stage 105 models were identified and
evaluated by the computational approach incurring a time of around 1 minute
(see Chapter 762 for details on computer specifications) Each of these models
were ranked based on their AICC and it was found that the highest ranked model
was also the correct model with the k value optimised to a value that was very
close to the value used for data generation The top five performing models are
shown in Table 45 where the optimised k values are shown as well as their
corresponding SSE and AICC values
Table 45 A table showing the top five ranked models for the ytterbium catalysis case study as
identified by the new approach The kinetic parameters for each reaction within the
model are shown as well as the SSE and AICC evaluation α denotes a variable molar
dependence within the kinetic parameter units depending on the rate law
Model
rank Model kx Mα h-1 SSE M AICC
1 415 + 4160 4172
rarr 418 93191 928 x 10-4 -24138
151
2
415 + 4160 4172
rarr 418
418 41705
rarr 415 + 416
93191
lt00001 928 x 10-4 -23910
3
415 + 4160 4172
rarr 418
418 4171
rarr 415 + 416
93191
lt00001 928 x 10-4 -23910
4
415 + 4160 4172
rarr 418
418 4172
rarr 415 + 416
93191
lt00001 928 x 10-4 -23910
5 415 + 416 4172
rarr 418 80784 11549 -1335
As in the previous pentyne case study four of these top-ranked models
all have the same SSE values and ranks 2 - 4 all have very similar AICC
evaluations The reasoning for this appears to be the same as previously
discussed where the primary reason that they score highly is due to the
presence of the true model term 415 + 4160 4172
rarr 418 One extra model term
is present in ranks 2 - 4 that the algorithm is forced to fit although it does not
provide any significance to the model hence it is fitted with a value lt00001
Nonetheless the highest ranked model according to the approach is the
true kinetic model and the corresponding k value was also identified correctly
This case study shows not only that it is possible to identify models that feature
catalytic species but also that the orders of the catalytic and non-catalytic
species can be identified As a lsquotypicalrsquo catalytic example is more likely to be first-
order with respect to all species the ability that the approach has shown to
identify non-normal order dependencies in the rate law for multiple species
inspires confidence that the approach will be successful in its use in real
experimentation An example kinetic plot showing the fit of the identified model
to the simulated experimental data is shown in Figure 45 - this is the second
experiment where the starting concentrations were 15 M starting material 2 M
diphenylphosphine and 01 M ytterbium catalyst at 22 degC
152
Figure 45 The fit of the identified model and kinetic parameters to the generated experimental
data with starting concentrations of 15 M starting material 2 M diphenylphosphine and
01 M ytterbium catalyst at 22 degC Where x = starting material x = diphenylphosphine x
= product mdash = starting material (ODE) mdash = diphenylphosphine (ODE) mdash = product
(ODE)
44 Conclusion
It has been shown that the previously built computational approach to
kinetic modelling can be adapted to catalytic systems and rate laws with non-
normal order dependencies This new approach has been proven to work
successfully for three simulated case studies featuring different modelling
criteria with sets of experimental data inputs with artificial errors The success
shown from these studies inspires confidence that the approach can be
implemented with real experimental data
The scope of the approach has increased substantially following the
improvements in this work and can now be used for many more chemical
applications However due to the comprehensive nature of the approach the
computational expense has also increased as there are many more reactions
that must be considered when building reaction models This computational
stress as before can be reduced by replacing existing computer hardware with
more computer logical cores - this is because the code is highly parallelised and
153
the speed of the approach is directly proportional to the number of computer
cores available Although the approach is very powerful this computational
expense may still be cumbersome for desktop computers depending on the
number of species involved in a particular chemical system However as time
passes processing technology consistently improves and there will undoubtedly
be a time where millions of models can be evaluated at a desk in a matter of
hours via comprehensive methodologies such as this
This comprehensive approach to kinetic model and parameter
determination has been shown to be successful in simulated case studies - the
next step is to prove the efficiency of this methodology with real experimental
case studies The aim of these case studies is to show that this approach can
correctly identify models of various-complexity chemical processes thereby
realising the main aim of this project in developing an automated kinetic analysis
tool with a wide scope for process development
Chapter 5 Experimental applications of the new approach
51 Introduction
With the development of the new computational approach complete and
verified with multiple simulated case studies the viability of the approach for real
experimental data must also be tested Real experimental case studies are to be
conducted to measure the ability of this new and final computational approach
As the scope of this new approach has been broadened to include
catalytic reactions and species order dependencies of zero or 05 it is important
to study chemical systems that may exhibit these properties to prove that the
new approach can identify these models It is also important that the approach
can continue to identify more lsquosimplersquo models that have species order
dependencies of 1 as well as utilise kinetic data from any means This is
because the kinetic motifs often cannot be determined a priori and the beneficial
feature of this methodology is that models are identified and ranked according to
statistical measures This removes bias and therefore considers all rate laws for
every possible model meaning that the approach does not know initially if a
154
model is supposed to contain a zero order term or not for example and will only
determine this after the comprehensive model evaluations
Experimental case studies from any reaction process (batch flow etc)
and analytical technique (HPLC NMR etc) will be used in these final
experimental verifications These case studies will prove that the approach can
identify models including lsquonormalrsquo zero or 05 species order dependencies for
both catalytic and non-catalytic processes The research project aim will thereby
be realised by ultimately developing a powerful automated methodology to be
used in process development for the modelling of real chemical systems
52 Case study SNAr kinetics
The first reaction system explored using the new computational approach
was the presupposed model of the reaction of 246-trichloropyrimidine (SM) 51
with ethyl 4-aminobutanoate 52 to form the major 2-substituted SNAr product
53 and the minor 4-substituted SNAr product 54 as shown in Scheme 51 As
the ethyl 4-aminobutanoate is present in its hydrochloride salt the hydrochloric
acid present (and generated from subsequent SNAr reactions as 55) is
neutralised by an excess of triethylamine
Scheme 51 The reaction of 246-trichloropyrimidine (SM) 51 with ethyl 4-aminobutanoate
52 to form the major 2-substituted SNAr product 53 and the minor 4-substituted SNAr
product 54
As the desired major product from this reaction can be further reacted to
synthesise bioactive derivatives of pharmaceuticals[243 244] this initial
transformation is of interest in the process development of these molecules A
collaborator in the Spring group at Cambridge University Hikaru Seki has a
particular interest in these bioactive molecules for his research project and
155
wanted to maximise the synthetic yield of the 2-substituted SNAr product 53 by
obtaining kinetic understanding of the system Therefore all practical
experimental work in this case study was conducted by Hikaru Seki at Cambridge
University then the results were forwarded to Leeds for kinetic analysis
Four kinetic experiments were conducted at -25 degC 0 degC 25 degC and 50
degC with three replicate experiments at 25 degC Each experiment was conducted
in batch in an NMR tube within a 500 MHz NMR spectrometer which allowed
continuous NMR acquisition at a rate of approximately one sample per 80
seconds This continuous reaction monitoring generates a large data density for
the subsequent kinetic analysis using the new computational approach by
monitoring the proton peaks of the individual species shown in Figure 51 Full
experimental details can be found in Chapter 751
Figure 51 The distinctive proton peaks shown in red that are monitored via NMR as time
progresses in the SNAr case study
Based on the five species identified there were six reactions that were
calculated to be possible based on mass balance - these reactions are shown
as eqn 51 - 56 From these reactions all corresponding rate laws were
generated and all models were compiled subject to the rules defined in Chapter
422 This resulted in 3320 unique models to be evaluated by the approach
53 rarr 54 eqn 51
54 rarr 53 eqn 52
51 + 52 rarr 53 + 55 eqn 53
53 + 55 rarr 51 + 52 eqn 54
51 + 52 rarr 54 + 55 eqn 55
54 + 55 rarr 51 + 52 eqn 56
All 3320 models were evaluated by the computational approach incurring
a computation time of around 9 hours (see Chapter 761 for details on computer
156
specifications) Each of these models were then ranked based on their AICC
evaluation and it was found that the most likely representation of the system is
the model shown in Scheme 51 with lsquotypicalrsquo first-order species dependencies
in the rate laws The approach also determined the kinetic parameters of the
transformation to the major product k25 degC = 0499 plusmn 0006 M-1 min-1 Ea = 4419
plusmn 057 kJ mol-1 and to the minor product k25 degC = 0384 plusmn 0009 M-1 min-1 Ea =
3657 plusmn 088 kJ mol-1 This model and the corresponding kinetic parameters
allowed a fit to the experimental data with an average residual of less than 26 x
10-4 M and is shown in Figure 52 The top 5 ranked models are shown in Table
51 with their respective SSE error metric and AICC evaluation
Figure 52 Kinetic profiles for four kinetic experiments at -25 degC 0 degC 25 degC and 50 degC where
= starting material = 2-substituted product = 4-substituted product mdash = starting
material (ODE) mdash = 2-substituted product (ODE) mdash = 4-substituted product (ODE) See
Chapter 751 for full experimental conditions and raw data
Table 51 Evaluation of the feasibility of each reaction model for the SNAr case study where α
is variable for each model depending on the overall model order
Rank Reaction Model
Kinetic parameters
SSE
103 M AICC k25 degC Mα
min-1 Ea kJ mol-1
1 51 + 52 rarr 53 + 55 0499 4419 1614 -5191
157
51 + 52 rarr 54 + 55 0384 3657
2 51 + 52 rarr 53 + 55
51 + 5205 rarr 54 + 55
0407
0073
4061
3101 3723 -4857
3 51 + 52 rarr 53 + 55
510 + 52 rarr 54 + 55
0466
0017
4225
2756 3777 -4851
4 51 + 52 rarr 53 + 55
51 + 520 rarr 54 + 55
0466
0017
4225
2756 3777 -4729
5 51 + 5205 rarr 53 + 55
51 + 52 rarr 54 + 55
0092
0298
3806
3227 5127 -4664
It is clear from the kinetic plots that the fit of the ODEs to the experimental
data do not result in normally-distributed residuals This could be for one of many
reasons but is most likely due to either errors in producing the correct
concentration of amine 52 or NMR integrations errors or evaporation of solvent
(CD3OD) into the headspace at higher temperatures This must be considered
by a trained chemist upon completion of the computational approach and this is
an example showing that this methodology must be used in conjunction with
chemical expertise to confirm the approach output In this case however the
residuals are only a small consideration and it can be observed that the model
still fits the experimental data well so the identified model is still valid
This first experimental case study has shown that the new approach can
correctly identify the reaction model and kinetic parameters even when
considering a multitude of differing rate laws In this case it was found that each
the rate laws featured first-order dependencies on each of the species which is
common in chemical processes This kinetic information can then be used to
optimise this process for the highest yields of the 2-substituted (major) product
53 for our collaboratorrsquos research project which can then be used as a building
block for bioactive materials
53 Case study PfBr
The next case study that was explored was a chemical system featuring
a protection of an amino acid for further functionalisation where alanine methyl
158
ester (Al-Me) 56 reacts with 9-bromo-9-phenylfluorene (PfBr) 57 to form the
protected amino acid (Pf-Al-Me) 58 and hydrobromic acid 59 as a side-
product as shown in Scheme 52 The alanine methyl ester is present in its
hydrochloride salt form so this hydrochloric acid and the formation of
hydrobromic acid are both neutralised by an excess of suspended potassium
phosphate
Scheme 52 The reaction of alanine methyl ester (Al-Me) 56 with PfBr 57 to form the
protected amino acid 58 Hydrobromic acid 59 is also generated as a side product
PfBr is the reagent to introduce the 9-phenylfluorene (Pf) protecting group
in a synthesis Pf is a pharmaceutically relevant and bulky protecting group that
can be introduced as a more acid stable alternative to the more commonly used
trityl protecting group[245 246] The chemical system of interest is the protection
step in the total synthesis of (S)-eleagnine from L-alanine as shown in Scheme
53 as a retrosynthetic methodology[247] Understanding this transformation by
performing kinetic analysis would therefore accelerate process development
when scaling up this process
Scheme 53 The retrosynthetic methodology of the transformation of L-alanine to (S)-
eleagnine via the Pf-protected alanine methyl ester (Pf-Al-Me)[247]
Due to the high cost of PfBr as a starting material (pound137 for 5 g)[248] PfBr
was synthesised from cheaper materials as it was unknown how much would be
necessary for kinetic analysis Bromobenzene 510 was initially treated with
magnesium then reacted with fluorenone 511 to make the intermediate PfOH
512 PfOH was then isolated and reacted with hydrobromic acid to form the
desired PfBr product as shown in Scheme 54[249] The most expensive material
159
in the synthesis of this PfBr product is fluorenone costing pound76 for 500 g resulting
in a much cheaper method to obtaining this desired material[250] This reaction
was carried out on a 40 g scale and full experimental details can be found in
Chapter 7521 As there was an absence of an OH peak from the IR spectrum
of PfBr the PfBr material was analysed by HPLC and the purity was determined
to be gt99 With pure PfBr as a starting material the kinetic case study was
then possible to begin
Scheme 54 The synthetic route from cheap starting materials bromobenzene 510 and
fluorene 511 to the intermediate PfOH 512 and finally the desired PfBr material 58
Three experiments were conducted in a three-neck round bottomed flask
at 30 degC 35 degC and 40 degC Samples (05 mL) were extracted manually from the
bulk reaction medium with a syringe followed by syringing approximately 03 mL
of water and shaking the syringe - this dissolves the suspended potassium
phosphate and allows injection into the sample loop for analysis via HPLC The
batch setup for experimentation is shown in Figure 53
160
Figure 53 The batch setup for experimentation in the PfBr case study where the temperature
probe is submerged in the reaction medium that is heated via a heater stirrer
After all experiments were run the experimental data and the identified
species were inputted into the new approach Based on these four species there
were two feasible reactions calculated - these reactions are shown as eqn 57
and eqn 58 From these reactions all corresponding rate laws were generated
and all models were compiled subject to the rules defined in Chapter 422 This
resulted in 30 unique models to be evaluated by the approach
56 + 57 rarr 58 + 59 eqn 57
58 + 59 rarr 56 + 57 eqn 58
All 30 models were evaluated by the new computational approach
incurring a computation time of less than 2 minutes (see Chapter 761 for details
on computer specifications) Each of these models were then ranked based on
their AICC evaluation and it was found that the most likely representation of the
system is the model shown in Scheme 52 but with a zero-order dependence on
the alanine methyl ester in the rate law This makes sense chemically as the
bulky aromatic rings would stabilise the cation formed if the reaction were to
proceed via a traditional SN1 mechanism this means that the rate-determining-
161
step is likely to be the loss of the bromide ion followed by a fast reaction with the
alanine methyl ester The approach also determined the kinetic parameters of
this transformation as k35 degC = 106 x 10-2 plusmn 001 x 10-2 min-1 Ea = 6291 plusmn 023
kJ mol-1 This model and the corresponding kinetic parameters allowed a fit to
the experimental data with an average residual of 26 x 10-4 M and is shown in
Figure 54 in a combined plot The top 5 ranked models are shown in Table 52
with their respective SSE error metrics and AICC evaluations
Figure 54 Kinetic profiles for three kinetic experiments at 30 degC 35 degC and 40 degC where red
plots indicate PfBr concentrations and blue plots indicate Pf-Al-Me concentrations At 30
degC = experimental data mdash = ODE At 35 degC = experimental data - - - = ODE At
40 degC = experimental data = ODE See Chapter 752 for full experimental
conditions and raw data
Table 52 Evaluation of the feasibility of each reaction model for the PfBr case study where α
is variable for each model depending on the overall model order
Rank Reaction Model
Kinetic parameters
SSE
10-5 M AICC k35 degC Mα min-
1
Ea kJ mol-
1
1 560 + 57 rarr 58 + 59 00106 6291 351 -23815
2 560 + 57 rarr 58 + 59
58 + 5905 rarr 56 + 57
00115
00144
6709
7000 276 -23805
3 560 + 57 rarr 58 + 59
58 + 590 rarr 56 + 57
00129
00034
6527
7000 276 -23804
4 560 + 57 rarr 58 + 59 00128 6571 281 -23764
162
580 + 59 rarr 56 + 57 00057 7000
5 560 + 57 rarr 58 + 59
5805 + 59 rarr 56 + 57
00112
00167
6606
7000 295 -23654
Interestingly the top 5 ranked models all feature the main lsquoimportantrsquo
model term of 560 + 57 rarr 58 + 59 with models 2 - 5 also featuring some
variant of the reversible reaction This is a similar outcome to the simulated
pentyne kinetics case study in Chapter 432 In this experimental case however
the reversible reaction should be very unlikely as the hydrobromic acid is
removed by the excess potassium phosphate present It can be concluded
therefore that these extra model terms are just fitting to the experimental noise
especially as the magnitude of the SSE metrics are so low
It has been shown in this case study that the new computational approach
can correctly identify the reaction model and kinetic parameters of a system
where there is a zero-order dependency on one of the species This is the first
instance of an identified model featuring non-first-order rate laws in a real
chemical process and further proves the broadened applicability of the new
approach as a kinetic analysis tool This kinetic information can then be used to
shorten process development times and lower costs if (S)-eleagnine was
synthesised using this route
54 Case study Maleic acid
The final experimental case study that was explored was the chemical
system involving maleic acid 513 reacting with methanol 514 to form the
monomethylated maleic acid ester (mono-product) 515 and the dimethylated
maleic acid ester (di-product) 516 shown in Scheme 55 Each reaction also
liberates a molecule of water 517
163
Scheme 55 The reaction of maleic acid 513 and methanol 514 to form the mono-product
515 and the di-product 516
Our collaborators at AstraZeneca were interested in this reaction following
the contamination of a batch of an API maleate salt with the corresponding
monomethyl maleate salt as this contamination could be mitigated if the impurity
formation was well understood Kinetic experiments were run and the findings
were published as it was found that the reaction forming the mono-product was
autocatalytic[240] In this case the reaction was found to be catalytic with an order
of 05 meaning that the overall order with respect to the maleic acid was 15 in
forming the mono-product The consecutive reaction forming the di-product is
also catalytic with respect to the maleic acid with a 05 order dependence
Although this information is now known and reported it took several months for
physical-organic chemists at AstraZeneca to decipher this reaction model as this
model is not immediately intuitive Therefore this case study was run to
retrospectively show the efficiency of this approach in elucidating non-intuitive
reaction models and how this methodology can serve as a viable substitute for
many hours spent on a project by experts that could be working on other aspects
of process development
All experimental data was obtained from our collaborators at AstraZeneca
and was collected using batch experimentation and 1H NMR sampling Five
experiments were conducted at differing starting concentrations and
temperatures in the range of 40 - 60 degC This experimental data was inputted into
the computational approach as well as the identified species Based on these
five species there were six feasible reactions identified - these reactions are
shown as eqn 59 - 514
513 + 514 rarr 515 + 517 eqn 59
515 + 517 rarr 513 + 514 eqn 510
515 + 514 rarr 516 + 517 eqn 511
516 + 517 rarr 515 + 514 eqn 512
515 + 515 rarr 513 + 516 eqn 513
513 + 516 rarr 515 + 515 eqn 514
As the experiments were ran with methanol as a solvent this exhibits an
effective methanol concentration of ~24 M which is far greater than the maleic
164
acid concentration that had a maximum concentration of 08 M As the methanol
is in such a high concentration its concentration remains effectively unchanged
throughout the reaction meaning that the rate law would approximate pseudo-
first-order kinetics Therefore after all rate laws were compiled using these
mass-balance-allowed reactions all rate laws pertaining to non-zero-order with
respect to methanol concentration were removed As the methanol concentration
would be effectively unchanged it would be very difficult to differentiate between
models with differing order dependencies on the methanol - this would likely lead
to many models tied for lsquomost likelyrsquo with exactly equivalent SSE values
After the subsequent rate laws were compiled the models were
generated subject to the rules defined in Chapter 422 and with the maleic acid
defined as a catalyst This resulted in 5086 unique models to be evaluated by
the approach which incurred a computation time around 17 hours (see Chapter
761 for details on computer specifications) Each of these models were then
ranked based on their AICC evaluation and it was found that the most likely
representation of the system is the reaction model shown in Scheme 55 but
each step is catalysed by maleic acid with a species order dependence of 05 -
these are the same findings that our collaborators made during their kinetic
analysis The approach also determined the kinetic parameters of this
transformation to be kmono 50 degC = 385 x 10-3 plusmn 001 x 10-3 M-05 min-1 Ea = 7261
plusmn 012 kJ mol-1 and kdi 50 degC = 466 x 10-4 plusmn 001 x 10-4 M-05 min-1 Ea = 6974 plusmn
010 kJ mol-1 These parameters were again very similar to those obtained by
our collaborators although our collaborators reported the kinetic parameters as
Arrhenius constants and activation energies This model and the corresponding
kinetic parameters allowed a fit to the experimental data with an average residual
of 11 x 10-3 M and two experimental fittings at 50 degC (with initial concentrations
of 08 M and 04 M) are shown in Figure 55 The top 5 ranked models are shown
in Table 53 with their respective SSE error metrics and AICC evaluations
165
Figure 55 Kinetic profiles for two kinetic experiments at 50 degC with the initial concentration of
maleic acid at 04 M and 08 M At 04 M = maleic acid mdash = maleic acid (ODE) =
mono-product mdash = mono-product (ODE) = di-product mdash = di-product (ODE) At 08
M = maleic acid - - - = maleic acid (ODE) = mono-product - - - = mono-product
(ODE) = di-product - - - = di-product (ODE) See Chapter 753 for full experimental
conditions and raw data
Table 53 Evaluation of the feasibility of each reaction model for the maleic acid case study
where α is variable for each model depending on the overall model order
Rank Reaction Model
Kinetic parameters
SSE
10-2 M AICC k50 degC 10-3 Mα
min-1 Ea kJ mol-1
1
51315 + 5140 rarr 515
+ 51305 + 517
51305 + 515 + 5140
rarr 516 + 51305 + 517
385
047
7261
6974 028 -4968
2
51315 + 5140 rarr 515
+ 51305 + 517
513 + 5152 rarr 5132 +
516
408
192
7832
7977 033 -4908
3
51315 + 5140 rarr 515
+ 51305 + 517
513 + 515 + 5140 rarr
516 + 513 + 517
391
103
7419
7995 033 -4902
166
4
51315 + 5140 rarr 515
+ 51305 + 517
51305 + 5152 rarr
51315 + 516
397
076
7652
7306 042 -4806
5
5132 + 5140 rarr 515 +
513 + 517
513 + 515 + 5140 rarr
516 + 513 + 517
560
078
7998
7936 053 -4715
As in previous case studies the top ranked models all feature the main
lsquoimportantrsquo model term that describes the convergence to experimental data in
the best way with models 1 - 4 featuring this term 51315 + 5140 rarr 515 +
51305 + 517 This is because the SSE metric is a measure of the total error in
the fit to the data and as this model term features the transformation of 513 to
515 which are the species present in the highest concentrations this model
term therefore has the highest impact on minimising the SSE
It has been shown in this case study that the new computational approach
can correctly identify the reaction model and kinetic parameters of a real
chemical system where there are both catalytic species and species with non-
integer order dependencies This is the first instance of an identified model
featuring a catalytic species and non-integer-order rate laws using real
experimental data As the model was already identified by our collaborators this
methodology has corroborated their findings and shown that process
understanding can be accelerated using this approach This approach
automatically identified the correct reaction model in ~17 hours whereas our
collaborators using more traditional lsquotrial and errorrsquo approaches arrived at the
correct model in months Retrospectively this would have allowed faster
implementation of measures to reduce the amount of monomethyl maleate salt
impurity in their API maleate salt thereby proceeding with process development
and cutting costs
55 Conclusion
167
It has been shown that using this new computational approach total
process understanding can be automatically achieved without the need for high-
level chemical intuition The widened scope of this new approach has been
proven to be effective in three experimental case studies each with differing rate
laws and kinetic structural motifs The approach has been proven to be effective
and applicable for lsquonormalrsquo kinetic models where each species has a first-order
dependence for zero-order and non-integer rate laws and for catalytic species
of variable integer- and non-integer-order
It has also been shown from these case studies that using this
methodology can greatly accelerate process development and reduce the
workload of kinetic analysis for the physical-organic chemists After
experimentation all kinetic analysis can be automated whilst experts focus on
other aspects of process development Then after the computational approach
has finished running they can work in conjunction with the approach to identify
which models are the most likely to be both statistically and scientifically correct
Chapter 6 Conclusion amp future work
The project aim to develop and advance an automated methodology to
kinetic model and parameter determination has been answered in the thesis
chapters herein The computational approach should be used in conjunction with
experts to automate the comprehensive kinetic analysis that is otherwise not
feasible using traditional means The approach takes experimental data and the
identified species then identifies every possible mass-balance-allowed
transformation between these species Each of these reactions are then
compiled into every possible unique reaction model with each feasible
corresponding rate law These models are then evaluated based on their fit to
experimental data by combining the use of ordinary differential equation (ODE)
solvers and optimisation algorithms The models are then statistically ranked
based on their convergence to experimental data and the number of model terms
in the model thereby identifying the most likely model and its corresponding
kinetic parameters
168
The original structure of this comprehensive methodology was originally
reported by Tsu et al[173] which was then replicated improved and utilised for
real experimentation in Chapters 2 - 3 The approach was used in tandem with
an automated flow reactor platform by exploiting flow rate manipulations to
obtain full reaction profiles followed by implementation of the approach The
methodology was then further improved and the scope was widened in Chapter
4 as catalytic systems and differing-non-integer order species dependencies in
the rate laws were also explored This improved methodology was then proven
to be effective in real experimental systems in Chapter 5 as batch
experimentation ran at Leeds and by collaborators showed the wide applicability
of the approach to different types of reactions This approach can be used as a
tool for process development by anyone as expert chemical intuition is removed
from the kinetic analysis Therefore the project aim has been answered in the
work described herein as any chemist can use this approach and interpret the
output in order to obtain total process understanding
Further work on the use and development of this approach for metal-
catalysed processes would be beneficial Metal-catalysed processes are very
important in industry but catalytic cycles can be complex meaning that it is not
immediately obvious how to automate a tool to explore these potential models
In some cases it may be sufficient to describe a reaction based on empirical rate
laws and this can currently be implemented using the approach developed
However another research project on the development of a tool to identify these
kinetic models and catalytic cycles may be warranted As a suggestion this could
be performed by inputting many known catalytic cycles into a training set then
using machine learning techniques to build a neural network to identify trends in
experimental data to attribute particular catalytic cycles to chemical processes
Chapter 7 Appendix
71 Chapter 1
No appendix data for Chapter 1
72 Chapter 2
169
721 Generated data set for case study benzoic acid alkylation
Experiment 1
Time s 21 M 22 M 23 M
0 01 08 0
475 0081361 0060964 0017126
1024 0069511 004901 0031805
2015 0054394 003336 0044477
295 0044695 0027749 0051252
432 0038039 0019903 0062653
60 0032285 0013536 0065719
Experiment 2
Time s 21 M 22 M 23 M
0 01 011 0
468 007631 0084741 0023482
1027 0057707 0069104 0040456
20 004138 0054662 0056759
302 0034101 004059 0067659
476 0023686 0031161 0075772
60 0018377 0027305 0083761
Experiment 3
Time s 21 M 22 M 23 M
0 1 015 0
5 0069767 0121755 0032513
105 0047199 0098611 005277
2163 0027758 0077627 0072909
3054 0019626 0069013 0079639
4578 0011357 0059865 0091724
170
60 0006574 005691 0093444
722 Generated data set for case study nitrile hydrolysis
Experiment 1 60 degC
Time s 25 M 27 M 28 M
0 08 0 0
5235363 0814005 001713 100E-06
3247861 067236 0106334 339E-05
6719836 0634071 0199701 0000124
1456155 0463323 034173 0000516
2899323 027438 0528037 0001536
3687175 0220788 0551639 000212
4868495 0162216 0630518 0003131
600 0124203 0705371 0004112
Experiment 2 70 degC
Time s 25 M 27 M 28 M
0 08 0 0
6133417 0761239 0049487 683E-06
2689 0588801 0199668 115E-04
6870925 0426543 0363734 0000585
1501538 021105 0573179 000192
297041 0079934 0705184 0004502
3564911 005351 0757795 0005854
4867485 0024103 0789235 0008408
600 0013094 0752509 0010127
Experiment 3 80 degC
Time s 25 M 27 M 28 M
171
0 1 0 0
5817383 0852929 015263 428E-05
2471834 0568389 0476974 589E-04
714048 0218624 0778816 0002633
1543583 0060192 089969 0006685
3038829 0006754 0944201 0014173
3720244 0002737 09556 001819
4765104 0000608 1009417 0023157
600 0000113 09467 0028902
Experiment 4 90 degC
Time s 25 M 27 M 28 M
0 1 0 0
5910759 0711158 0281532 172E-04
2420962 030002 070196 171E-03
6878985 0060896 0961462 0006075
1425421 0005202 1023471 0013823
2881599 555E-05 0935542 0027497
3644764 521E-06 0970668 0036328
4780807 143E-07 095015 0045819
600 179E-07 089561 0059331
723 Generated data set for the case study SNAr kinetics
Experiment 1
Time 210 M 212 M 213 M 214 M
0 1 0 0 0
0114724 0916317 0078593 0018182 249E-06
103049 0464119 0448791 0104213 0000125
2141533 0226584 0624128 0146157 0000376
3643057 0102715 0737636 0171082 0000744
172
7743801 0012971 0788209 0187458 0001768
1216477 0001476 0805589 018666 0002965
4403067 0 0816998 0186517 0010796
1072065 0 0801824 0178389 0026607
2551342 0 078187 0172065 0061291
4351342 0 0744149 0156488 0102055
600 0 0702123 0148841 0135997
Experiment 2
Time 210 M 212 M 213 M 214 M
0 12 0 0 0
0088864 1073662 0091451 00213 294E-06
0254455 0913278 0236597 0053222 217E-05
1152788 0407456 0638051 0147144 0000266
3171611 0093893 0900254 02064 0001032
939048 0001601 0959144 0228044 0003623
4041694 0 097195 021939 0016209
195366 0 0911133 0206891 0075681
3112192 0 0891022 0190707 0118451
4312192 0 0869047 0184739 015486
4912192 0 0861757 0175374 0176878
600 0 0839806 0165531 0209888
Experiment 3
Time 210 M 212 M 213 M 214 M
0 09 0 0 0
0091037 0797548 0079495 0018563 313E-06
0259823 0653654 0198581 0046012 219E-05
1158987 0239387 0538734 0122398 0000279
173
4175397 0013188 0712848 0169522 0001555
6793661 0001174 0728233 0166388 0002729
9757783 0 0717645 0170752 0003931
4449079 0 0719684 0164371 0019044
1956282 0 0666457 014927 0080022
3156282 0 0644589 0131672 0126933
4956282 0 0600784 0117343 0185606
600 0 0578163 0107537 0221849
73 Chapter 3
731 Phenyl acetate
7311 Preparation of feed solutions
Three feeds were used for this work and desired reservoir solutions were
prepared by dissolving the desired reagents in acetonitrile under stirring at
ambient conditions The first feed consisted of phenol (132 mL 015 mol 05
mol dm-3) and biphenyl (115 g 75 mmol 0025 mol dm-3) in acetonitrile (300
mL) the second feed contained acetyl chloride (225 mL 032 mol 105 mol dm-
3) the third feed was a 11 mixture of acetonitrile and water for dilution
7312 Flow ramp experiments
Linear gradient flow ramps allowed the generation of a complete reaction
profile from a single transient experiment To obtain transient data each of the
three pumps were initially set at the maximum flow rate to be investigated 175
mL min-1 Steady-state was established in the 35 mL reactor and the flow rate
for each pump decreased at a constant rate of 00181 mL min-1 for 92 minutes
Samples of reactor effluent were injected for HPLC analysis at 2 minute intervals
thus achieving a large data density The reactor setup schematic is shown in
Figure 731
174
Figure 731 The flow reactor setup for the phenyl acetate case study experiments
7313 HPLC Analysis
All HPLC analysis was conducted using an Agilent 1100 series HPLC
instrument fitted with a Sigma Ascentis Express C18 reverse phase column (5cm
x 46mm 27 microm) Biphenyl was used as an internal standard The column
temperature was 70 degC and the HPLC method is shown
Time min A (water 01
TFA)
B (acetonitrile
01 TFA) Flow rate mL min-1
000 50 50 2
150 20 80 2
151 50 50 2
An example HPLC chromatogram during a kinetic experiment is shown in
Figure 732
175
Figure 732 An example HPLC chromatogram in the phenyl acetate case study at 254 nm
7314 Validation with steady-state measurements
Steady-state measurements were taken at 1 3 5 7 9 11 13 and 15
minutes at both 65 degC and 75 degC Using the identified most likely reaction model
from the flow ramps the k values for the steady-state experiments were found to
be kSS-65 degC = 472 x 10-3 plusmn 001 x 10-3 M-1 s-1 kSS-75 degC = 929 x 10-3 plusmn 003 x 10-3
M-1 s-1 These k values give the steady-state kinetic parameters as kSS-65 degC =
472 x 10-3 plusmn 001 x 10-3 M-1 s-1 Ea-SS = 663 plusmn 05 kJ mol-1 which are very
comparable to the flow ramp evaluation of the kinetic parameters kR-65 degC =
00052 plusmn 00002 M-1 s-1 Ea-R = 693 plusmn 78 kJ mol-1 As the steady-state
measurements were taken without a dilution pump the concentrations are
different to that of the ramps hence the steady-state time-series concentration
data was normalised to match the concentrations from the ramps to show the
agreement in their nature in Figure 311
7315 Raw data
Flow ramp experiments
Flow ramp
measurements 65 degC 75 degC
τ min 38 M 310 M 38 M 310 M
102 01493 00072 01346 00262
104 01461 00095 01297 00269
106 01436 00104 01284 00260
108 01459 00119 01300 00262
111 01433 00121 01268 00287
114 01394 00128 01244 00304
116 01398 00135 01251 00310
119 01428 00144 01200 00322
122 01410 00150 01176 00340
125 01397 00142 01249 00304
129 01358 00140 01204 00334
132 01388 00168 01188 00369
176
136 01382 00166 01190 00405
140 01365 00170 01204 00315
144 01358 00182 01174 00408
149 01324 00173 01142 00392
153 01338 00188 01170 00383
158 01360 00194 01148 00395
164 01334 00204 01134 00426
170 01320 00213 01132 00406
176 01333 00223 01113 00430
182 01315 00232 01121 00456
189 01319 00220 01095 00445
197 01278 00228 01029 00523
205 01285 00260 01072 00501
214 01280 00334 01021 00554
224 01267 00287 01065 00524
235 01248 00305 00996 00603
247 01253 00309 00984 00566
260 01214 00338 00974 00575
274 01217 00297 00914 00661
290 01195 00360 00914 00620
308 01196 00379 00900 00654
328 01162 00408 00830 00762
351 01111 00444 00790 00774
377 01114 00452 00848 00739
406 01017 00527 00737 00722
441 01033 00536 00705 00843
481 00986 00559 00618 00981
528 00955 00598 00564 00962
583 00908 00678 00599 00985
649 00807 00704 00576 01039
177
729 00781 00770 00488 01150
824 00705 00835 00421 01160
940 00662 00921 00360 01223
1079 00587 00981 00249 01358
Steady state experiments
Steady-state
measurements 65 degC 75 degC
τ min 38 M 310 M 38 M 310 M
102 01771 00177 01591 00387
308 01461 00470 01183 00824
481 01214 00736 00858 01123
649 01050 00940 00625 01370
900 00844 01155 00419 01567
1101 00717 01263 00297 01715
1301 00559 01384 00218 01822
1502 00512 01488 00177 01886
Normalised steady state experiments
Steady-state
measurements
(normalised)
65 degC 75 degC
τ min 38 M 310 M 38 M 310 M
102 01417 00142 01273 00310
308 01169 00377 00947 00660
481 00971 00590 00686 00898
649 00840 00753 00500 01096
900 00675 00926 00335 01253
1101 00573 01012 00238 01372
178
1301 00447 01109 00174 01458
1502 00409 01192 00142 01509
732 Paracetamol
7321 Preparation of feed solutions
For the work at the temperature of 30 degC two feeds were used and
desired reservoir solutions were prepared by dissolving the desired reagents in
acetonitrile under stirring at ambient conditions The first feed consisted of 4-
aminophenol (058 mL 6 mmol 002 mol dm-3) and biphenyl (115 g 75 mmol
0025 mol dm-3) in acetonitrile (300 mL) the second feed contained acetic
anhydride (085 mL 9 mmol 003 mol dm-3) in acetonitrile (300 mL)
For the work at the temperature of 60 degC two feeds were used and
desired reservoir solutions were prepared by dissolving the desired reagents in
acetonitrile under stirring at ambient conditions The first feed consisted of 4-
aminophenol (044 mL 45 mmol 0015 mol dm-3) and biphenyl (115 g 75
mmol 0025 mol dm-3) in acetonitrile (300 mL) the second feed contained acetic
anhydride (085 mL 9 mmol 003 mol dm-3) in acetonitrile (300 mL)
For the work at the temperature of 160 degC two feeds were used and
desired reservoir solutions were prepared by dissolving the desired reagents in
acetonitrile under stirring at ambient conditions The first feed consisted of 4-
aminophenol (101 mL 105 mmol 0035 mol dm-3) and biphenyl (115 g 75
mmol 0025 mol dm-3) in acetonitrile (300 mL) the second feed contained acetic
anhydride (298 mL 315 mmol 0105 mol dm-3) in acetonitrile (300 mL)
For the work at the temperature of 180 degC two feeds were used and
desired reservoir solutions were prepared by dissolving the desired reagents in
acetonitrile under stirring at ambient conditions The first feed consisted of 4-
aminophenol (261 mL 27 mmol 009 mol dm-3) and biphenyl (115 g 75 mmol
0025 mol dm-3) in acetonitrile (300 mL) the second feed contained acetic
anhydride (533 mL 564 mmol 019 mol dm-3) in acetonitrile (300 mL)
7322 Flow ramp experiments
For the work at the temperature of 30 degC a 025 mL reactor was used
For the work at the temperature of 60 degC a 05 mL reactor was used For the
179
work at the temperatures of 160 degC and 180 degC a 35 mL reactor was used
Linear gradient flow ramps allowed the generation of complete reaction profiles
from a single transient experiment To obtain transient data each of the two
pumps were initially set at the maximum flow rate to be investigated 175 mL
min-1 Steady-state was established and the flow rate for each pump decreased
at a constant rate of 00181 mL min-1 for 92 minutes Samples of reactor effluent
were injected for HPLC analysis at 2 minute intervals thus achieving a large data
density The reactor setups for each of these 4 reactions are shown in Figures
733 - 736 For the higher temperature reactions 160 degC and 180 degC 4-
aminophenol is used and assumed to react instantaneously to form paracetamol
based on the kinetics observed at lower temperatures
Figure 733 The reactor setup for the paracetamol flow ramp experiment at 30 degC
180
Figure 734 The reactor setup for the paracetamol flow ramp experiment at 60 degC
Figure 735 The reactor setup for the paracetamol flow ramp experiment at 160 degC
Figure 736 The reactor setup for the paracetamol flow ramp experiment at 180 degC
7323 HPLC analysis
All HPLC analysis was conducted using an Agilent 1100 series HPLC
instrument fitted with a Sigma Ascentis Express C18 reverse phase column (5cm
x 46mm 27 microm) Biphenyl was used as an internal standard The column
temperature was 70 degC and the HPLC method is shown
Time min A (water 01
TFA)
B (acetonitrile
01 TFA) Flow rate mL min-1
000 50 50 2
150 20 80 2
151 50 50 2
An example HPLC chromatogram showing the separation and analysis of
all components at once - these species were each added to the same solution
for method development
181
Figure 737 An example HPLC chromatogram from the paracetamol case study showing the
separation of all reaction components at 254 nm
7324 Raw data
Flow ramp experiment 1 30 degC
τ s 312 M 314 M 315 M
428 000698 000267 0
437 000722 000266 0
447 000766 000284 0
457 000716 000287 0
467 000688 000278 0
478 000749 000306 0
489 000717 000299 0
501 000715 000317 0
513 000685 000273 0
526 000727 000320 0
540 000622 000296 0
555 000635 000337 0
570 000643 000374 0
586 000639 000446 0
603 000623 000401 0
182
621 000643 000391 0
640 000600 000385 0
645 000654 000378 0
683 000613 000368 0
706 000519 000376 0
731 000592 000455 0
758 000585 000481 0
787 000554 000410 0
818 000564 000432 0
851 000503 000429 0
888 000568 000493 0
927 000441 000444 0
971 000444 000506 0
1019 000416 000513 0
1071 000446 000556 0
1129 000413 000575 0
1194 000440 000546 0
1267 000483 000566 0
1349 000452 000564 0
1443 000353 000601 0
1550 000276 000588 0
1675 000370 000654 0
1820 000325 000720 0
1994 000229 000676 0
2202 000214 000686 0
2459 000239 000770 0
2781 000178 000878 0
3197 000221 000826 0
3900 000171 000848 0
4518 000145 000871 0
183
Flow ramp experiment 2 60 degC
τ s 312 M 314 M 315 M
875 0003048 0004234 0
894 0003702 0003846 0
913 0003852 0003772 0
955 0003402 0003918 0
978 0003071 0003860 0
1002 0002944 0004318 0
1027 0003195 0004243 0
1053 0003084 0004111 0
1080 0003046 0004262 0
1109 0003112 0004330 0
1140 0002925 0004253 0
1172 0002919 0004464 0
1206 0002921 0004562 0
1243 0002741 0004796 0
1281 0002612 0004906 0
1290 0002480 0004399 0
1366 0002481 0004597 0
1412 0002545 0004952 0
1462 0002325 0004951 0
1516 0002416 0004964 0
1573 0002407 0005149 0
1635 0002401 0005027 0
1702 0002710 0004966 0
1775 0002157 0005196 0
1855 0002382 0005121 0
1942 0002037 0005228 0
184
2037 0002221 0005387 0
2142 0001760 0005411 0
2259 0001446 0005728 0
2389 0001541 0005809 0
2534 0001507 0005924 0
2699 0001471 0005553 0
2886 0001147 0005686 0
3100 0001304 0006117 0
3349 0001168 0005719 0
3641 0001018 0006181 0
3987 0000916 0006444 0
4405 0000976 0006104 0
4918 0001025 0006840 0
Flow ramp experiment 3 160 degC
τ min 312 M 314 M 315 M
125 0 001766 000056
129 0 001737 000054
132 0 001786 000038
136 0 001789 000042
140 0 001722 000061
144 0 001738 000055
149 0 001779 000059
153 0 001807 000068
158 0 001794 000064
164 0 001722 000067
170 0 001734 000072
176 0 001792 000077
185
182 0 001738 000076
189 0 001755 000081
197 0 001738 000074
205 0 001785 000102
214 0 001762 000086
224 0 001801 000105
235 0 001753 000111
247 0 001793 000102
260 0 001763 000123
274 0 001672 000118
308 0 001736 000124
328 0 001728 000160
351 0 001635 000153
377 0 001696 000174
406 0 001670 000199
441 0 001536 000187
481 0 001590 000222
528 0 001614 000263
583 0 001482 000258
649 0 001454 000317
729 0 001474 000331
824 0 001407 000355
940 0 001315 000386
1079 0 001292 000412
Flow ramp experiment 4 180 degC
τ min 312 M 314 M 315 M
104 0 003703 000456
186
106 0 003829 000519
108 0 003746 000652
111 0 003910 000557
114 0 003812 000656
116 0 003894 000592
119 0 003622 000877
122 0 003941 000625
125 0 003733 000754
129 0 003798 000713
132 0 003861 000717
136 0 003606 000930
140 0 003615 000890
144 0 003655 000870
149 0 003584 000854
153 0 003765 000893
158 0 003480 001017
164 0 003459 001078
170 0 003522 001035
176 0 003357 001114
182 0 003407 001127
189 0 003598 000927
197 0 003491 000963
205 0 003546 001197
214 0 003307 001152
224 0 003586 001004
235 0 003600 001103
247 0 003364 001246
260 0 003717 000943
187
274 0 003256 001202
290 0 003278 001151
308 0 003298 001160
328 0 003304 001311
351 0 003179 001295
377 0 003002 001227
406 0 003024 001543
441 0 003117 001338
481 0 003076 001426
528 0 002431 001748
583 0 002326 001784
649 0 002665 001973
729 0 002265 001803
824 0 001960 002426
940 0 001780 002347
1079 0 001594 002903
733 Metoprolol
7331 AstraZeneca experimental setup
All AstraZeneca experiments were conducted using a tubular reaction vessel
(Polar Bear Plus) using PTFE tubing (1 mm ID) Reagents were pumped using
JASCO PU-4180 dual piston HPLC pumps and flow streams were mixed using
Swagelok SS-100-3 tee-pieces Sampling was conducted by using a VICI Valco
EUDA-CI4W5 sample loop with a 006 microL aliquot volume The reaction system
was maintained under a fixed back pressure using an Upchurch Scientific 150
psi back pressure regulator Quantitative analysis was performed using an
Agilent 1100 series HPLC instrument fitted with an Acquity C18 reverse phase
column (3 cm x 46 mm 17 microm) This setup is shown in Figure 638 In all
experiments biphenyl was added to one reservoir as an internal standard
188
Figure 738 A photograph of the automated flow system at AstraZeneca
7332 Preparation of feed solutions
For the Leeds experiments two feeds were used for the flow ramps and
desired reservoir solutions were prepared by dissolving the desired reagents in
acetonitrile under stirring at ambient conditions The first feed consisted of 2-((4-
(2-methoxyethyl)phenoxy)methyl)oxirane (SM) (5676 mL 03 mol 1 mol dm-3)
and biphenyl (115 g 75 mmol 0025 mol dm-3) in acetonitrile (300 mL) the
second feed contained isopropylamine (1546 mL 018 mol 06 mol dm-3) in
acetonitrile (300 mL)
For the AstraZeneca experiments two feeds were used for the flow
ramps and desired reservoir solutions were prepared by dissolving the desired
reagents in acetonitrile under stirring at ambient conditions The first feed
consisted of 2-((4-(2-methoxyethyl)phenoxy)methyl)oxirane (SM) (5676 mL 03
mol 1 mol dm-3) and biphenyl (115 g 75 mmol 0025 mol dm-3) in acetonitrile
(300 mL) the second feed contained isopropylamine (5153 mL 09 mol 3 mol
dm-3) in acetonitrile (300 mL)
7333 Flow ramp experiments
189
For the Leeds experiments a 35 mL reactor was used Linear gradient
flow ramps allowed the generation of complete reaction profiles from a single
transient experiment To obtain transient data each of the two pumps were
initially set at the maximum flow rate to be investigated 175 mL min-1 Steady-
state was established and the flow rate for each pump decreased at a constant
rate of 00181 mL min-1 for 92 minutes Samples of reactor effluent were injected
for HPLC analysis at 4 minute intervals thus achieving a large data density This
reactor setup is shown in Figure 739
Figure 739 The reactor setup for the metoprolol flow ramp experiments at 190210 degC in
Leeds
For the AstraZeneca experiments a 5 mL reactor was used Linear gradient flow
ramps allowed the generation of complete reaction profiles from a single
transient experiment To obtain transient data each of the two pumps were
initially set at the maximum flow rate to be investigated 125 mL min-1 Steady-
state was established and the flow rate for each pump decreased at a constant
rate of 00125 mL min-1 for 96 minutes Samples of reactor effluent were injected
for HPLC analysis at 6 minute intervals thus achieving a large data density This
reactor setup is shown in Figure 7310
190
Figure 7310 The reactor setup for the metoprolol flow ramp experiments at 130150 degC at
AstraZeneca
7334 HPLC analysis
All HPLC analysis was conducted using an Agilent 1100 series HPLC
instrument fitted with a Sigma Ascentis Express C18 reverse phase column (5cm
x 46mm 27 microm) Biphenyl was used as an internal standard The column
temperature was 40 degC and the HPLC method is shown
Time min A (water 01
TFA)
B (acetonitrile
01 TFA) Flow rate mL min-1
000 77 23 2
300 10 90 2
400 10 90 2
410 77 23 2
An example HPLC chromatogram during a kinetic experiment is shown in
Figure 7311
Figure 7311 An example HPLC chromatogram during a kinetic experiment in the metoprolol
case study at 220 nm
7335 Cost evaluation
Using the Leeds experimental setup outlined in Chapter 32 and current
pricing for the starting material used in the Metoprolol work (pound80725 g)[239] it has
been shown that this kinetic approach used less material and was cheaper to
implement than other standard industrial optimisation techniques
As the starting material is the most expensive reaction component by a
large margin this was the only factor taken into consideration - other costs were
not considered eg solvent isopropylamine energy etc It is assumed that a 1
M solution of starting material is used and so the cost associated for every 1 mL
of this solution used (0208 g 1 mmol) is pound671 It is also assumed that 2 reactor
volumes are consumed prior to all steady-state reactions and all reactions were
191
conducted using a 35 mL reactor The addition of skilled labour and time have
not been considered but would incur significantly higher costs for these other
techniques as this technique only requires the initial setup of the reservoirs and
reactor because everything else is automated
Technique What is required Solution
usage mL Cost pound
Flow ramps
4 x linearly decreasing flow ramps from
175 mL min-1 decreasing at a rate of
00181 mL min-1 for 92 minutes
340 pound2281
Steady-state
kinetics 4 sets of 16 steady-state experiments 420 pound2818
Design of
Experiments
study
One screening design (19 steady-state
experiments) and one optimisation design
(81 steady-state experiments) to consider
the factors of temperature residence time
starting material equivalents and
isopropylamine equivalents
700 pound4697
7336 Raw data
Flow ramp experiment 1 130 degC
τ min 317 M 319 M 320 M
210 0435 0053 0000
224 0427 0056 0000
240 0423 0060 0000
258 0417 0064 0000
371 0381 0102 0000
416 0397 0088 0000
472 0383 0099 0000
545 0369 0110 0000
641 0362 0123 0000
773 0347 0146 0001
961 0286 0206 0002
Flow ramp experiment 2 150 degC
192
τ min 317 M 319 M 320 M
200 0358 0116 0000
210 0357 0125 0000
224 0350 0135 0001
240 0347 0144 0001
258 0340 0153 0001
280 0333 0166 0001
305 0311 0178 0002
335 0299 0193 0002
371 0269 0207 0002
416 0259 0234 0003
472 0233 0251 0003
545 0208 0287 0004
641 0169 0284 0005
773 0144 0327 0006
Flow ramp experiment 3 190 degC
τ min 317 M 319 M 320 M
255 0340 0117 0004
269 0328 0121 0005
284 0321 0126 0006
302 0320 0132 0006
321 0309 0138 0007
343 0307 0137 0007
368 0305 0150 0008
397 0299 0152 0009
430 0294 0161 0010
470 0284 0171 0012
517 0270 0176 0014
573 0261 0183 0016
643 0254 0186 0018
730 0246 0190 0021
842 0232 0211 0025
986 0213 0217 0028
Flow ramp experiment 4 210 degC
τ min 317 M 319 M 320 M
250 0305 0166 0012
193
263 0299 0165 0013
278 0294 0172 0014
295 0294 0172 0015
314 0282 0182 0017
335 0279 0186 0019
360 0269 0190 0021
388 0272 0201 0023
421 0247 0221 0030
460 0236 0218 0028
506 0230 0219 0032
562 0218 0222 0038
630 0231 0211 0042
716 0201 0235 0045
825 0188 0235 0051
968 0182 0239 0058
74 Chapter 4
741 Generated data set for the case study SNAr kinetics
Experiment 1
Time s 45 M 47 M 48 M 49 M
0 1 0 0 0
104232 0912548 0068648 0002878 279E-05
5078096 0715174 0266199 0011023 0000485
1475526 0464384 0521723 0020875 0002315
3331443 0269972 0708549 002876 0006042
5628294 0168854 080687 0031878 0009439
9017797 0099139 0856211 003494 0013887
2108206 0032979 088963 0036126 0024236
3328275 0015074 0929082 0036808 003211
4382468 0008534 0933212 0036452 0037487
600 0004209 0921486 0036363 0043389
194
Experiment 2
Time s 45 M 47 M 48 M 49 M
0 08 0 0 0
1302612 0703325 0092533 0003854 627E-05
5712155 0478466 0312694 0012573 0000883
1084263 0329335 044882 0018183 0002403
2064908 0176938 0596415 0023908 0005922
6941793 0014924 0723646 0029388 0023796
1516461 0000354 0725866 0029244 0051839
3009398 380E-07 066851 0026369 0099546
5153318 0 0621532 0024249 0155196
9253113 0 0545081 0019839 0239656
1200 0 0506326 0018372 0288136
Experiment 3
Time s 45 M 47 M 48 M 49 M
0 1 0 0 0
0962483 0873362 0112646 0004695 780E-05
1002158 0342803 0632465 0025508 0004215
2106925 0138132 0817645 0033569 001147
6078714 0008667 0899281 0037403 0036358
1010498 0000643 0895452 003658 0061674
1727609 714E-06 0851082 0034174 0101391
3082939 0 0806696 0030438 017491
5621972 0 069294 0025835 0270209
9040341 0 0598858 0021781 0384583
1600 0 0457229 0015241 0527733
Experiment 4
Time s 45 M 47 M 48 M 49 M
195
0 1 0 0 0
1044725 0854673 0149213 0006087 0000139
509551 0460925 0515756 0020548 0002257
2132233 0072138 0877848 0035074 0017175
4714859 0005208 0917717 0036551 0041614
6931167 00006 0887854 0035809 0061604
1280495 225E-06 086418 0033593 0115427
2886839 0 0741762 002754 0232766
7368751 0 0519088 0018297 0455041
1222483 0 0381306 0012248 060453
1800 0 0274267 0007936 0705143
Experiment 5
Time s 45 M 47 M 48 M 49 M
0 12 0 0 0
0849478 0999855 0175423 0007178 0000158
5548213 0466871 0712408 0028769 0004137
1181201 0191904 0969199 0039345 0012093
3500272 0010569 110712 0045047 0044862
911267 147E-05 1038677 0040673 0119288
1237999 690E-07 1005138 0040148 0158185
1953324 0 0920941 003614 0234604
4831808 0 0709117 0024989 0478645
632278 0 0609582 0021143 0562277
900 0 0502989 0016122 0680497
742 Generated data set for the case study Pentyne
Experiment 1
Time min 411 M 412 M 413 M
0 1 08 0
196
1293971 0973192 0803545 0011085
3972297 0958388 0766506 0033251
1843854 0857109 0663378 0141812
3290479 0770748 054892 0246498
5690479 0629294 0416498 0388829
9290479 0449379 025987 0548273
120 0369111 0164188 0644284
Experiment 2
Time min 411 M 412 M 413 M
0 12 15 0
1205027 1199383 1460822 0012139
3721389 1157799 1439238 0037013
1802628 1036602 1347405 0171608
5033117 077347 1092225 0421136
8633117 0582851 0871663 0614124
1403312 0359291 0678145 0833511
180 0259447 0551321 0936175
Experiment 3
Time min 411 M 412 M 413 M
0 1 1 0
1293971 0994904 0974041 0010778
3972297 0975053 0966892 0033053
1843854 086422 0871237 0145646
3290479 0750116 0752064 0246904
8090479 0508082 0506177 0504648
1529048 0276204 0271468 072687
240 0129659 0132753 0856012
197
743 Generated data set for the case study Ytterbium catalysis
Experiment 1
Time h 415 M 416 M 418 M
0 2 2 0
0054397 1950736 1962883 0040294
0386129 1737689 1725949 026888
0701874 1545843 1542334 0459994
1901874 0986091 0979723 1020241
3101874 0631223 0628196 136402
4301874 040357 0400764 1596431
6 0213539 0212908 1784115
Experiment 2
Time h 415 M 416 M 418 M
0 15 2 0
0029722 1499822 2000933 0004169
02413 1470961 1962226 0033316
0911826 1373396 1881085 0122394
1511826 1302576 1805505 0196746
2711826 1164105 1659122 0336104
3911826 1042952 1535555 0457449
6 085898 1357163 0642853
Experiment 3
Time h 415 M 416 M 418 M
0 14 18 0
0027487 1370804 1774104 003184
0106977 1284762 1675632 012038
0249912 114023 1539842 0264912
198
092138 0646932 1043942 0752256
152138 0389843 0794653 1012081
212138 0235788 0635663 1164374
3 0112972 0511689 1287393
Experiment 4
Time h 415 M 416 M 418 M
0 22 16 0
0043551 2153819 153798 005486
0241672 1906782 1311278 0288655
0439793 1706777 1105476 049592
0839793 1351856 0751683 0854071
1239793 1066839 0466383 1129747
1639793 0846621 0246217 1354339
2 0682943 0085826 1509085
75 Chapter 5
751 SNAr kinetics
7511 Experimental equipment
All experiments were run in an NMR tube using a dedicated 500 MHz
NMR spectrometer at The University of Cambridge as shown in Figure 751
199
Figure 751 The dedicated NMR spectrometer used for kinetic experiments in the SNAr
kinetics case study
7512 Kinetic experiments
In each experiment 246-trichloropyrimidine (700 microL 200 mM in CD3OD)
was warmedcooled to the required temperature in the 500 MHz NMR
spectrometer The NMR was then locked onto the solvent then the probe was
tuned and matched to the 1H nuclei then shimming ensued The spectrum of the
200 mM solution of 246-trichloropyrimidine was acquired
To this NMR tube a pre-cooledwarmed solution of CD3OD containing
200 mM ethyl 4-aminobutyrate hydrochloride and 600 mM Et3N (700 microL) was
added and mixed thoroughly by shaking the NMR tube This gave the desired
reaction concentration of 100 mM pyrimidine 100 mM amine and 300 mM Et3N
Spectra were acquired every ~80 seconds The software was used in each case
to obtain absolute integrals for each peak which were then converted to
200
concentrations based on the 246-trichloropyrimidine solution of known
concentration
7513 Example NMR spectra
An example lsquostackedrsquo NMR spectrum is shown in Figure 752 showing
the appearancedisappearance of peaks over time in the 25 degC experiment
Where the peak at 780 ppm corresponds to 246-trichloropyrimidine 666 ppm
corresponds to the 2-substituted product and 641 corresponds to the 4-substited
product
Figure 752 lsquoStackedrsquo NMR spectrum showing several NMR spectra over time in the 25 degC
experiment
7514 Raw data
Experiment 1 -25 degC
Time min 51 M 53 M 54 M
1455 0088818 0004156 0004562
1591667 0088538 0004229 0004611
1726667 0088465 0004295 0004727
1863333 0088063 0004362 0004842
1998333 008805 0004577 0004908
201
2133333 0087811 0004609 0004962
227 0087412 0004713 0005096
2405 0087133 0004827 0005202
2541667 0086922 0004901 0005268
2676667 008667 0004993 0005345
2813333 0086501 0005049 0005407
2948333 0086142 0005142 0005518
3083333 0085983 0005268 0005704
322 0085639 0005412 0005803
3355 0085286 0005468 0005826
3491667 0085108 0005589 000596
3626667 0084887 0005646 0005947
3763333 0084482 0005781 0006102
3898333 0084308 0005902 0006179
4035 0083927 0005914 000626
417 0083758 0006021 000639
4306667 0083386 0006157 0006496
4441667 0083205 0006154 0006574
4576667 0083093 0006298 0006627
4713333 008282 0006377 0006689
4848333 0082663 0006475 0006751
4985 0082501 0006492 0006786
512 0082273 000655 0006939
5256667 008206 0006658 0006902
5391667 008186 0006786 0007038
5526667 0081225 0006729 0007105
Experiment 2 0 degC
Time min 51 M 53 M 54 M
202
7333333 0072103 0007607 0008513
88 0070344 0008018 0008965
1016667 0068594 0008452 0009462
1151667 0068423 0008887 0009854
1288333 0066803 0009266 001028
1423333 0065829 0009635 0010682
156 0064594 0010002 0011061
1695 0063823 0010341 0011471
1831667 0062319 0010702 0011804
1966667 0061394 0010984 0012177
2101667 0060906 0011342 0012486
2238333 0059741 0011585 0012806
2373333 0058765 001182 0013095
251 0058315 0012151 0013445
2645 0057463 001241 0013671
278 0056496 0012685 0013978
2916667 0056066 00129 0014287
3051667 0055037 0013136 001449
3188333 0054482 0013382 0014789
3323333 0053852 0013629 0015023
3458333 0053151 0013804 0015225
3595 0052684 0014054 001548
373 0052192 0014261 0015707
3866667 005156 0014409 001589
4001667 0051008 0014613 0016133
4136667 0050399 0014842 0016311
4273333 0049812 0015017 0016498
4408333 0049557 0015136 0016666
4545 0048743 0015301 0016861
468 0048366 0015482 0017042
203
4816667 0047763 0015635 001723
4951667 0047326 0015831 0017433
5086667 0046947 0015973 0017573
5223333 0046384 0016088 0017747
5358333 0045991 0016243 0017903
5495 0045672 0016393 0018043
563 0045107 0016496 0018225
5766667 0044674 0016691 0018395
5901667 0044423 0016839 0018509
6036667 0044113 0016972 0018683
6173333 0043619 0017086 001884
Experiment 3 25 degC
Time min 51 M 53 M 54 M
3366667 0064314 0009652 0009883
48 0057052 0012118 0012863
615 0051792 0013813 0014922
75 0047939 0015186 0016476
8866667 0044748 0016215 0017819
1021667 0041922 0017079 0018798
1158333 0039664 0017878 0019678
1293333 0037598 0018491 0020463
1428333 0035777 0019052 0021122
1565 0034195 0019558 0021718
17 0032928 0019875 0022181
1836667 0031709 0020362 0022676
1971667 0030632 0020622 0023126
2106667 0029623 0020886 0023404
2243333 0028668 002128 0023818
204
2378333 0027704 0021452 002409
2515 0026937 0021641 0024389
265 0026303 0021884 0024635
2786667 0025572 0022112 0024925
2921667 0024988 0022265 0025126
3056667 0024358 0022417 0025261
3193333 0023747 0022601 0025533
3328333 0023156 0022788 0025713
3463333 0022678 0022896 0025943
36 0022158 0022984 0026042
3735 0021731 0023193 0026254
3871667 0021252 0023299 0026356
4006667 0020811 0023542 0026561
4143333 0020451 0023635 0026706
4278333 0019954 0023675 0026824
4413333 001972 0023743 0026953
455 0019374 0023807 0027033
4685 0019129 0023925 0027167
4821667 0018686 0024057 0027249
4956667 0018359 0024079 0027301
5093333 0018011 0024171 0027439
5228333 0017894 0024265 0027549
5363333 0017535 0024319 0027649
55 0017377 0024477 0027784
5635 001712 0024351 0027716
5771667 0016878 0024502 0027857
Experiment 4 50 degC
Time min 51 M 53 M 54 M
205
335 0044859 0017049 0028158
5066667 0033058 0020402 0034142
6416667 0028533 0021812 0036713
7766667 0025543 0022842 0038521
9133333 0022916 00235 0039813
105 0021041 0024107 004121
1185 0019498 0024602 0041829
132 0018156 0025096 0042681
1456667 0016918 0025264 0043145
1591667 0015895 0025503 0043496
1728333 0015031 0025778 0043978
1863333 0014386 0025935 0044504
20 0013754 0026166 0044669
2135 0013006 0026135 0045027
227 0012731 002645 004525
2406667 0012071 0026529 0045439
2541667 0011723 0026593 0045892
2678333 0011273 0026724 0046128
2813333 001075 0026737 004605
295 0010443 0026863 0046276
3085 0010126 0026964 0046178
3221667 0009967 0027158 0046613
3356667 0009483 00272 0046695
3493333 0009351 0027183 0047223
3628333 0009066 0027134 0047014
3763333 0008787 0027312 0047229
39 0008496 0027291 0047245
4035 000833 0027346 0047363
4171667 000802 0027313 0047267
4306667 0007943 0027459 0047585
206
4443333 0007797 0027504 0047612
4578333 0007612 0027442 0047469
4713333 0007363 0027731 0047777
485 0007162 0027549 0047689
4985 0007122 0027588 0047921
512 0006956 0027672 0048034
5256667 0006869 0027621 0047948
5391667 0006654 002781 0048184
5528333 0006511 0027703 0048181
5663333 0006367 0027739 0048193
5798333 0006367 0027751 0048241
752 PfBr
7521 Synthesis of PfBr material
To synthesise the PfBr material the synthesis reported by Tian and
Menard was approximately followed[249] To a suspension of magnesium turnings
(92 g 382 mmol) in anhydrous THF (5 mL) in a nitrogen atmosphere was added
05 mL of bromobenzene at room temperature to initiate the reaction The
reaction vessel was cooled to 0 degC using an ice bath and a solution of
bromobenzene in THF (12 M 270 mL) was added dropwise at 0 degC The reaction
medium was allowed to reach room temperature and stirred vigorously for 2
hours To this solution was added 9-fluorenone (301 g 186 mmol) in small
portions left to stir at room temperature for 1 hour The reaction was quenched
with dropwise addition of hydrochloric acid (1 M 100 mL) at 0 degC The solution
was extracted with Et2O (3 x 150 mL) and the combined organic layer was
washed with brine dried over MgSO4 filtered and concentrated under reduced
pressure to yield PfOH (426 g 89 ) NMR IR and mass spectroscopy analysis
confirmed the identity of the material
To prepare PfBr PfOH (361 g 140 mmol) was dissolved in toluene (150
mL) and aqueous HBr (48 ww 50 mL) was added at room temperature This
suspension was stirred vigorously at room temperature for 48 hours with the
vessel wrapped in foil to reduce light The mixture was extracted with toluene (3
207
x 100 mL) then the combined organic layer was washed with brine dried over
MgSO4 filtered and concentrated under reduced pressure to afford the crude
product The product was then recrystallised with hexane to afford PfBr (39 g 87
) 13C NMR IR and HPLC analysis confirmed the identity and purity of the
material as shown in Figure 753 Figure 754 and Figure 755 respectively
Figure 753 A 13C NMR confirming the presence of the PfBr material compared to literature
values to identify the material[249]
208
Figure 754 IR analysis of the PfBr material showing the absence of a hydroxy peak from any
residual PfOH
Figure 755 HPLC analysis of the PfBr material at 254 nm indicating that a pure product is
present
7522 Kinetic experiments
Three kinetic experiments were run at different temperatures 30 degC 35
degC and 40 degC For the first experiment at 30 degC alanine methyl ester
hydrochloride (0940 g 0007 mol) biphenyl (0195 g 0001 mol) and potassium
phosphate (35 g 0017 mol) were added to 5050 acetonitriledichloromethane
(375 mL) in a vessel A solution was then prepared of PfBr (0958 g 0003 mol)
in 5050 acetonitriledichloromethane (375 mL) and added to the reaction
vessel A sample was then immediately taken via HPLC then the stopwatch was
started to track the time of each injection This first HPLC serves as the artificial
209
zero time point then each subsequent HPLC injection followed every ~10
minutes thereafter
For the second experiment at 35 degC alanine methyl ester hydrochloride
(0977 g 0007 mol) biphenyl (0199 g 0001 mol) and potassium phosphate
(35 g 0017 mol) were added to 5050 acetonitriledichloromethane (375 mL)
in a vessel A solution was then prepared of PfBr (1017 g 0003 mol) in 5050
acetonitriledichloromethane (375 mL) and added to the reaction vessel A
sample was then immediately taken via HPLC then the stopwatch was started
to track the time of each injection This first HPLC serves as the artificial zero
time point then each subsequent HPLC injection followed every ~10 minutes
thereafter
For the third experiment at 40 degC alanine methyl ester hydrochloride
(0841 g 0006 mol) biphenyl (0219 g 0001 mol) and potassium phosphate
(35 g 0017 mol) were added to 5050 acetonitriledichloromethane (375 mL)
in a vessel A solution was then prepared of PfBr (1064 g 0003 mol) in 5050
acetonitriledichloromethane (375 mL) and added to the reaction vessel A
sample was then immediately taken via HPLC then the stopwatch was started
to track the time of each injection This first HPLC serves as the artificial zero
time point then each subsequent HPLC injection followed every ~10 minutes
thereafter
7523 HPLC analysis
All HPLC analysis was conducted using an Agilent 1100 series HPLC
instrument fitted with a Sigma Ascentis Express C18 reverse phase column (5cm
x 46mm 27 microm) Biphenyl was used as an internal standard The column
temperature was 40 degC and the HPLC method is shown
Time min A (water 01
TFA)
B (acetonitrile
01 TFA) Flow rate mL min-1
000 80 20 1
700 15 85 1
800 15 85 1
810 80 20 1
210
An example HPLC chromatogram during a kinetic experiment is shown in
Figure 756
Figure 756 An example HPLC chromatogram at 230 nm during a kinetic experiment in the
PfBr case study
7524 Raw data
Experiment 1 30 degC
Time min 57 M 58 M
0 0029401 0009756
95 0028029 0011516
195 0026429 0013131
29 0024664 0014922
40 0022779 0016856
50 0021252 0019153
605 0019363 0020372
71 0017813 0022065
83 001612 0023823
Experiment 2 35 degC
Time min 57 M 58 M
0 0036314 0006684
95 0030494 0011469
20 0028083 001372
315 0025271 0016536
41 0023355 0018562
211
51 0021259 0020741
625 0017572 0023705
Experiment 3 40 degC
Time min 57 M 58 M
0 0037032 0005772
105 0029931 0013994
205 0026302 0017446
305 0022947 002101
40 0020038 0023665
505 0017687 0025741
605 0016003 0027979
753 Maleic acid
7531 Example NMR
An example NMR spectrum is shown in Figure 754 where the peaks of
each species are highlighted
212
Figure 757 An example NMR spectrum from the maleic acid case study
7532 Raw data
Experiment 1 40 degC
Time min 513 M 515 M 516 M
0 0761 0 0
120 066207 0097408 0002283
240 0554769 0201665 0004947
360 0485518 0265589 0009893
Experiment 2 50 degC
Time min 513 M 515 M 516 M
0 0404344 0003268 0
325 0364451 0037657 186E-05
605 0346181 0071026 0000373
875 0319523 0095447 0001659
1225 0299017 0113343 0003225
2175 0234143 01661 0006264
2885 0204502 0198537 0009507
4175 015883 0230601 0015846
6875 0107378 0276833 0028336
13425 0052198 0313931 0053689
17825 0033649 0310389 0063196
28375 001799 0307033 0083516
Experiment 3 50 degC
Time min 513 M 515 M 516 M
0 0787537 0007088 0
28 0706604 0088537 565E-04
60 0625073 0164707 0002563
213
95 0556919 0226165 0006126
118 0530477 0271021 0007904
148 0480567 0308812 0011678
178 0426661 0316753 001425
208 0405376 035592 0020026
242 0384453 0382377 0021991
298 0344452 0431289 0029072
358 0299951 0456885 0034314
613 0205957 0541791 0061416
1306 0092916 0582232 0105274
1549 0076529 0596801 0119691
1768 0063259 0597105 0130915
Experiment 4 55 degC
Time min 513 M 515 M 516 M
0 0687045 0103644 0000811
30 0597449 019108 297E-03
60 0531145 0252908 0007448
90 0479052 0301502 0010947
168 0365378 0402913 0023209
228 031788 0443385 0030235
283 028467 0469404 0037426
348 0221288 0520375 0049837
408 0200913 0533579 0057007
Experiment 4 60 degC
Time min 513 M 515 M 516 M
0 0738693 0014307 0
60 0442764 0296682 136E-02
214
120 0335085 0389301 0029367
180 0265809 0447282 0040662
240 0224394 0475143 0053463
360 0117468 0551196 0084336
480 0070029 0575292 0107679
1320 0015813 0538395 0198792
76 Computational setup
761 Chapter 2 - 3
For all computation in Chapter 2 - 3 MATLAB 2018a was used on a
desktop computer with a 4-core Intel i5-2310 processor
762 Chapter 4 - 5
For all computation in Chapter 4 - 5 MATLAB 2020a was used on a
custom built laptop with an 8-core AMD Ryzen 7 4800H processor
Chapter 8 References
1 Miyaura N K Yamada and A Suzuki A new stereospecific cross-coupling by the palladium-catalyzed reaction of 1-alkenylboranes with 1-alkenyl or 1-alkynyl halides Tetrahedron Letters 1979 20(36) p 3437-3440
2 Sonogashira K Y Tohda and N Hagihara A convenient synthesis of acetylenes catalytic substitutions of acetylenic hydrogen with bromoalkenes iodoarenes and bromopyridines Tetrahedron Letters 1975 16(50) p 4467-4470
3 Wittig G and W Haag Uumlber Triphenyl‐phosphinmethylene als olefinbildende Reagenzien (II Mitteil 1) Chemische Berichte 1955 88(11) p 1654-1666
4 Baumann M et al A Perspective on Continuous Flow Chemistry in the Pharmaceutical Industry Organic Process Research amp Development 2020
5 Noeacutel T Flow into the Chemistry Curriculum Chemistry World 2019 6 Reizman BJ and KF Jensen Feedback in flow for accelerated reaction
development Accounts of Chemical Research 2016 49(9) p 1786-1796
7 Plutschack MB et al The Hitchhikerrsquos Guide to Flow Chemistry Chemical Reviews 2017 117(18) p 11796-11893
215
8 Granda JM et al Controlling an organic synthesis robot with machine learning to search for new reactivity Nature 2018 559(7714) p 377-381
9 Peela NR IC Lee and DG Vlachos Design and fabrication of a high-throughput microreactor and its evaluation for highly exothermic reactions Industrial amp Engineering Chemistry Research 2012 51(50) p 16270-16277
10 Rivera NR et al Investigation of a Flow Step Clogging Incident A Precautionary Note on the Use of THF in Commercial-Scale Continuous Process Organic Process Research amp Development 2019 23(11) p 2556-2561
11 Chapman MR et al Simple and versatile laboratory scale CSTR for multiphasic continuous-flow chemistry and long residence times Organic Process Research amp Development 2017 21(9) p 1294-1301
12 Guan F et al A universal reactor platform for batch and flow application to homogeneous and heterogeneous hydrogenation Reaction Chemistry amp Engineering 2020 5(10) p 1903-1908
13 Muumlller G et al Continuous chemistry in microreaction systems for practical use Chimia International Journal for Chemistry 2006 60(9) p 618-622
14 Pennemann H et al Benchmarking of microreactor applications Organic Process Research amp Development 2004 8(3) p 422-439
15 Schwalbe T V Autze and G Wille Chemical synthesis in microreactors Chimia-Zurich 2002 56(11) p 636-646
16 Fletcher PD et al Micro reactors principles and applications in organic synthesis Tetrahedron 2002 58(24) p 4735-4757
17 Haswell SJ and P Watts Green chemistry synthesis in micro reactors Green Chemistry 2003 5(2) p 240-249
18 Hessel V and H Loumlwe Organic synthesis with microstructured reactors Chemical Engineering Technology Industrial Chemistry‐Plant Equipment‐Process Engineering‐Biotechnology 2005 28(3) p 267-284
19 Wilson NG and T McCreedy On-chip catalysis using a lithographically fabricated glass microreactormdashthe dehydration of alcohols using sulfated zirconia Chemical Communications 2000(9) p 733-734
20 Wiles C et al 1 4-Addition of enolates to α β-unsaturated ketones within a micro reactor Lab on a Chip 2002 2(2) p 62-64
21 Wegner J S Ceylan and A Kirschning Flow chemistryndasha key enabling technology for (multistep) organic synthesis Advanced Synthesis Catalysis 2012 354(1) p 17-57
22 Nagaki A et al Lithiation of 1 2‐Dichloroethene in Flow Microreactors
Versatile Synthesis of Alkenes and Alkynes by Precise Residence‐Time Control Angewandte Chemie International Edition 2012 51(13) p 3245-3248
23 Mason BP et al Greener approaches to organic synthesis using microreactor technology Chemical Reviews 2007 107(6) p 2300-2318
24 Newman SG and KF Jensen The role of flow in green chemistry and engineering Green Chemistry 2013 15(6) p 1456-1472
25 Riva E et al Reaction of Grignard reagents with carbonyl compounds under continuous flow conditions Tetrahedron 2010 66(17) p 3242-3247
216
26 Baumann M and IR Baxendale The synthesis of active pharmaceutical ingredients (APIs) using continuous flow chemistry Beilstein Journal of Organic Chemistry 2015 11(1) p 1194-1219
27 Bogdan AR et al The continuous‐flow synthesis of ibuprofen Angewandte Chemie International Edition 2009 48(45) p 8547-8550
28 Sheldon RA Catalysis the key to waste minimization Journal of Chemical Technology amp Biotechnology International Research in Process Environmental amp Clean Technology 1997 68(4) p 381-388
29 Kummer A T Varga and L Nagy Semi-batch reactor control with NMPC avoiding thermal runaway Computers and Chemical Engineering 2020 134 p 106694
30 Kao C-S and K-H Hu Acrylic reactor runaway and explosion accident analysis Journal of Loss Prevention in the Process Industries 2002 15(3) p 213-222
31 Fabiano B et al A perspective on Seveso accident based on cause-consequences analysis by three different methods Journal of Loss Prevention in the Process Industries 2017 49 p 18-35
32 Malet-Sanz L and F Susanne Continuous flow synthesis A pharma perspective Journal of Medicinal Chemistry 2012 55(9) p 4062-4098
33 Kunz U and T Turek Flow through reactors for organic chemistry directly electrically heated tubular mini reactors as an enabling technology for organic synthesis Beilstein Journal of Organic Chemistry 2009 5(1) p 70
34 Kappe CO Controlled microwave heating in modern organic synthesis Angewandte Chemie International Edition 2004 43(46) p 6250-6284
35 Yoshida Ji A Nagaki and T Yamada Flash chemistry fast chemical synthesis by using microreactors Chemistry - A European Journal 2008 14(25) p 7450-7459
36 van der Linden JJ et al Investigation of the Moffattminus Swern oxidation in a continuous flow microreactor system Organic Process Research amp Development 2008 12(5) p 911-920
37 Cutler AH MJ Antal Jr and M Jones Jr A critical evaluation of the plug-flow idealization of tubular-flow reactor data Industrial amp Engineering Chemistry Research 1988 27(4) p 691-697
38 Lebl R et al Scalable continuous flow hydrogenations using PdAl2O3-coated rectangular cross-section 3D-printed static mixers Catalysis Today 2020
39 Jolley KE MR Chapman and AJ Blacker A general and atom-efficient continuous-flow approach to prepare amines amides and imines via reactive N-chloramines Beilstein Journal of Organic Chemistry 2018 14(1) p 2220-2228
40 Hessel V Novel process windowsndashgate to maximizing process intensification via flow chemistry Chemical Engineering Technology Industrial Chemistry-Plant Equipment-Process Engineering-Biotechnology 2009 32(11) p 1655-1681
41 Bogdan AR and NW Sach The Use of Copper Flow Reactor Technology for the Continuous Synthesis of 1 4‐Disubstituted 1 2 3‐Triazoles Advanced Synthesis Catalysis 2009 351(6) p 849-854
42 Hornung CH et al A microcapillary flow disc reactor for organic synthesis Organic Process Research amp Development 2007 11(3) p 399-405
217
43 Acke DR and CV Stevens Study of the Baylisminus Hillman reaction in a microreactor environment first continuous production of Baylisminus Hillman adducts Organic Process Research amp Development 2006 10(3) p 417-422
44 McQuade DT and PH Seeberger Applying flow chemistry Methods materials and multistep synthesis J Org Chem 2013 78(13) p 6384-6389
45 Razzaq T and CO Kappe Continuous Flow Organic Synthesis under High‐TemperaturePressure Conditions ChemistryndashAn Asian Journal 2010 5(6) p 1274-1289
46 Hartman RL Managing solids in microreactors for the upstream continuous processing of fine chemicals Organic Process Research amp Development 2012 16(5) p 870-887
47 Reichardt C Solvent effects in organic chemistry 1979 Verlag Chemie 48 Reichardt C and T Welton Solvents and solvent effects in organic
chemistry 2011 John Wiley amp Sons 49 Singh D and PL Dhepe An efficient catalytic transfer hydrogenation-
hydrodeoxygenation of lignin derived monomers Investigating catalyst properties-activity correlation Catalysis Communications 2021 149 p 106220
50 Baxendale IR et al Multistep synthesis using modular flow reactors BestmannndashOhira reagent for the formation of alkynes and triazoles Angewandte Chemie 2009 121(22) p 4077-4081
51 Alam MP et al C O bond formation in a microfluidic reactor high yield S N Ar substitution of heteroaryl chlorides Tetrahedron letters 2016 57(19) p 2059-2062
52 Gutmann B et al On the Fischer Indole Synthesis of 7-Ethyltryptophol Mechanistic and Process Intensification Studies under Continuous Flow Conditions Organic Process Research amp Development 2013 17(2) p 294-302
53 Marre S Y Roig and C Aymonier Supercritical microfluidics Opportunities in flow-through chemistry and materials science The Journal of Supercritical Fluids 2012 66 p 251-264
54 Savage PE Organic chemical reactions in supercritical water Chemical reviews 1999 99(2) p 603-622
55 Adschiri T et al Green materials synthesis with supercritical water Green Chemistry 2011 13(6) p 1380-1390
56 Munshi P and S Bhaduri Supercritical CO 2 a twenty-first century solvent for the chemical industry Current Science (00113891) 2009 97(1)
57 Eckert CA et al Sustainable reactions in tunable solvents The Journal of Physical Chemistry B 2004 108(47) p 18108-18118
58 ONeil A and JJ Watkins Fabrication of device nanostructures using supercritical fluids MRS bulletin 2005 30(12) p 967-975
59 Romang AH and JJ Watkins Supercritical fluids for the fabrication of semiconductor devices emerging or missed opportunities Chemical reviews 2010 110(1) p 459
60 Marre S F Cansell and C Aymonier Tailor-made surface properties of particles with a hydrophilic or hydrophobic polymer shell mediated by supercritical CO2 Langmuir 2008 24(1) p 252
218
61 Cansell F and C Aymonier Design of functional nanostructured materials using supercritical fluids The Journal of Supercritical Fluids 2009 47(3) p 508-516
62 Chamberlain TW et al Catalytic nanoreactors in continuous flow hydrogenation inside single-walled carbon nanotubes using supercritical CO 2 Chemical Communications 2014 50(40) p 5200-5202
63 Devetta L et al Kinetic experiments and modeling of a three-phase catalytic hydrogenation reaction in supercritical CO 2 Catalysis Today 1999 48(1) p 337-345
64 Han X and M Poliakoff Continuous reactions in supercritical carbon dioxide problems solutions and possible ways forward Chemical Society Reviews 2012 41(4) p 1428-1436
65 Licence P et al Chemical reactions in supercritical carbon dioxide from laboratory to commercial plant Green Chemistry 2003 5(2) p 99-104
66 Leitner W Supercritical carbon dioxide as a green reaction medium for catalysis Accounts of chemical research 2002 35(9) p 746-756
67 McHugh M and V Krukonis Supercritical fluid extraction principles and practice 2013 Elsevier
68 Hitzler MG et al Selective catalytic hydrogenation of organic compounds in supercritical fluids as a continuous process Organic Process Research amp Development 1998 2(3) p 137-146
69 Cason JP and CB Roberts Metallic copper nanoparticle synthesis in AOT reverse micelles in compressed propane and supercritical ethane solutions The Journal of Physical Chemistry B 2000 104(6) p 1217-1221
70 Hyde JR et al Continuous catalytic reactions in supercritical fluids Applied Catalysis A General 2001 222(1) p 119-131
71 Hoffmann N Photochemical reactions of aromatic compounds and the concept of the photon as a traceless reagent Photochemical amp Photobiological Sciences 2012 11(11) p 1613-1641
72 Hoffmann N Photochemical reactions as key steps in organic synthesis Chemical Reviews 2008 108(3) p 1052
73 Knowles JP LD Elliott and KI Booker-Milburn Flow photochemistry Old light through new windows Beilstein journal of organic chemistry 2012 8 p 2025
74 Hook BD et al A practical flow reactor for continuous organic photochemistry The Journal of organic chemistry 2005 70(19) p 7558-7564
75 Schuster EM and P Wipf Photochemical flow reactions Israel Journal of Chemistry 2014 54(4) p 361-370
76 Yoshida J-i et al Modern strategies in electroorganic synthesis Chemical reviews 2008 108(7) p 2265-2299
77 Watts K A Baker and T Wirth Electrochemical synthesis in microreactors Journal of Flow Chemistry 2014 4(1) p 2-11
78 Horii D T Fuchigami and M Atobe A new approach to anodic substitution reaction using parallel laminar flow in a micro-flow reactor Journal of the American Chemical Society 2007 129(38) p 11692-11693
79 Horii D et al A novel electrosynthetic system for anodic substitution reactions by using parallel laminar flow in a microflow reactor Chemistry-A European Journal 2008 14(33) p 10382-10387
219
80 ZNIDARŠIC-PLAZL P Enzymatic microreactors utilizing non-aqueous media Chimica Oggi-Chemistry Today 2014 32 p 1
81 Rao NN et al Continuous biocatalytic processes Organic Process Research amp Development 2009 13(3) p 607-616
82 Babich L et al Continuous‐Flow Reactor‐Based Enzymatic Synthesis
of Phosphorylated Compounds on a Large Scale Chemistry-A European Journal 2012 18(21) p 6604-6609
83 Jas G and A Kirschning Continuous flow techniques in organic synthesis Chemistry-A European Journal 2003 9(23) p 5708-5723
84 Chen P et al A practical high through-put continuous process for the synthesis of chiral cyanohydrins The Journal of organic chemistry 2002 67(23) p 8251-8253
85 Liu Z et al Combined biosynthetic pathway for de novo production of UDP‐galactose catalysis with multiple enzymes immobilized on agarose
beads ChemBioChem 2002 3(4) p 348-355 86 Kobayashi S H Ishitani and S Nagayama Lanthanide triflate catalyzed
imino Diels-Alder reactions convenient syntheses of pyridine and quinoline derivatives Synthesis 1995 1995(09) p 1195-1202
87 Usutani H et al Generation and reactions of o-bromophenyllithium without benzyne formation using a microreactor Journal of the American Chemical Society 2007 129(11) p 3046-3047
88 Britton J and CL Raston Multi-step continuous-flow synthesis Chemical Society Reviews 2017 46(5) p 1250-1271
89 Snead DR and TF Jamison A three‐minute synthesis and purification
of ibuprofen Pushing the limits of continuous‐flow processing Angewandte Chemie International Edition 2015 54(3) p 983-987
90 Sahoo HR JG Kralj and KF Jensen Multistep Continuous‐Flow Microchemical Synthesis Involving Multiple Reactions and Separations Angewandte Chemie 2007 119(30) p 5806-5810
91 Hartman RL et al Multistep microchemical synthesis enabled by microfluidic distillation Angewandte Chemie International Edition 2010 49(5) p 899-903
92 Gloumlckner S et al The rapid synthesis of oxazolines and their heterogeneous oxidation to oxazoles under flow conditions Organic amp biomolecular chemistry 2015 13(1) p 207-214
93 Roberge DM et al Microreactor technology a revolution for the fine chemical and pharmaceutical industries Chemical engineering amp technology 2005 28(3) p 318-323
94 Exarchou V et al LC-UV-solid-phase extraction-NMR-MS combined with a cryogenic flow probe and its application to the identification of compounds present in Greek oregano Analytical Chemistry 2003 75(22) p 6288-6294
95 Benito-Lopez F et al Optical fiber-based on-line UVVis spectroscopic monitoring of chemical reaction kinetics under high pressure in a capillary microreactor Chemical Communications 2005(22) p 2857-2859
96 Mozharov S et al Improved method for kinetic studies in microreactors using flow manipulation and noninvasive Raman spectrometry Journal of the American Chemical Society 2011 133(10) p 3601-3608
97 Song H and RF Ismagilov Millisecond kinetics on a microfluidic chip using nanoliters of reagents Journal of the American Chemical Society 2003 125(47) p 14613-14619
220
98 Martinuzzi I et al Reaction mechanism for glycerol dehydration in the gas phase over a solid acid catalyst determined with on-line gas chromatography Chemical Engineering Science 2014 116 p 118-127
99 Moret S et al Microwave assisted saponification (MAS) followed by on-line liquid chromatography (LC)ndashgas chromatography (GC) for high-throughput and high-sensitivity determination of mineral oil in different cereal-based foodstuffs Food chemistry 2016 196 p 50-57
100 Grunwaldt J-D and BS Clausen Combining XRD and EXAFS with on-line catalytic studies for in situ characterization of catalysts Topics in Catalysis 2002 18(1) p 37-43
101 De Beer T et al In‐line and real‐time process monitoring of a freeze drying process using Raman and NIR spectroscopy as complementary process analytical technology (PAT) tools Journal of pharmaceutical sciences 2009 98(9) p 3430-3446
102 Ward H and FE Sistare On-line determination and control of the water content in a continuous conversion reactor using NIR spectroscopy Analytica chimica acta 2007 595(1) p 319-322
103 Cervera-Padrell AE et al Monitoring and control of a continuous Grignard reaction for the synthesis of an active pharmaceutical ingredient intermediate using inline NIR spectroscopy Organic Process Research amp Development 2012 16(5) p 901-914
104 Bristow TW et al On-line monitoring of continuous flow chemical synthesis using a portable small footprint mass spectrometer Journal of The American Society for Mass Spectrometry 2014 25(10) p 1794-1802
105 Roscioli KM et al Real time pharmaceutical reaction monitoring by electrospray ion mobility-mass spectrometry International Journal of Mass Spectrometry 2013 336 p 27-36
106 Mathieson JS et al Continuous parallel ESI-MS analysis of reactions carried out in a bespoke 3D printed device Beilstein journal of nanotechnology 2013 4 p 285
107 Robert J and A JohnaacuteBlacker Online quantitative mass spectrometry for the rapid adaptive optimisation of automated flow reactors Reaction Chemistry amp Engineering 2016 1(1) p 96-100
108 Browne DL et al Continuous flow reaction monitoring using an on‐line miniature mass spectrometer Rapid Communications in Mass Spectrometry 2012 26(17) p 1999-2010
109 Zhang J et al Design and scaling up of microchemical systems a review Annual review of chemical and biomolecular engineering 2017 8 p 285-305
110 Rasheed M and T Wirth Fast optimisation of a Diels-Alder reaction in a flow microreactor by in-line HPLC analysis Chemistry Today 2011 29(3) p 56
111 Welch CJ et al Online analysis of flowing streams using microflow HPLC Organic Process Research amp Development 2009 13(5) p 1022-1025
112 Carter CF et al ReactIR flow cell a new analytical tool for continuous flow chemical processing Organic Process Research amp Development 2010 14(2) p 393-404
113 Malet-Sanz L et al Preparation of arylsulfonyl chlorides by chlorosulfonylation of in situ generated diazonium salts using a
221
continuous flow reactor Organic amp biomolecular chemistry 2010 8(23) p 5324-5332
114 Carter CF et al The continuous flow synthesis of butane-2 3-diacetal protected building blocks using microreactors Organic amp biomolecular chemistry 2010 8(7) p 1588-1595
115 Smith CJ et al A fully automated multistep flow synthesis of 5-amino-4-cyano-1 2 3-triazoles Organic amp biomolecular chemistry 2011 9(6) p 1938-1947
116 Floyd TM MA Schmidt and KF Jensen Silicon micromixers with infrared detection for studies of liquid-phase reactions Industrial amp engineering chemistry research 2005 44(8) p 2351-2358
117 Carter CF et al Synthesis of acetal protected building blocks using flow chemistry with flow IR analysis preparation of butane-2 3-diacetal tartrates Organic amp biomolecular chemistry 2009 7(22) p 4594-4597
118 Sans V et al A self optimizing synthetic organic reactor system using real-time in-line NMR spectroscopy Chemical science 2015 6(2) p 1258-1264
119 Maiwald M et al Quantitative high-resolution on-line NMR spectroscopy in reaction and process monitoring Journal of Magnetic Resonance 2004 166(2) p 135-146
120 Maiwald M et al Quantitative on-line high-resolution NMR spectroscopy in process engineering applications Analytical and bioanalytical chemistry 2003 375(8) p 1111-1115
121 Dalitz F et al Process and reaction monitoring by low-field NMR spectroscopy Progress in nuclear magnetic resonance spectroscopy 2012 60 p 52-70
122 Silva Elipe MV and RR Milburn Monitoring chemical reactions by low‐field benchtop NMR at 45 MHz pros and cons Magnetic Resonance in Chemistry 2016 54(6) p 437-443
123 Goldbach M et al Preparation of Grignard reagents from magnesium metal under continuous flow conditions and on-line monitoring by NMR spectroscopy Tetrahedron Letters 2016 57(1) p 122-125
124 Houben C and AA Lapkin Automatic discovery and optimization of chemical processes Current Opinion in Chemical Engineering 2015 9 p 1-7
125 Cox BG Modern liquid phase kinetics 1994 Oxford University Press 126 Perrin CL Linear or nonlinear least-squares analysis of kinetic data
Journal of Chemical Education 2017 94(6) p 669-672 127 Michaelis L and ML Menten Die kinetik der invertinwirkung 2007
Universitaumltsbibliothek Johann Christian Senckenberg 128 Johnson KA A century of enzyme kinetic analysis 1913 to 2013 FEBS
Letters 2013 587(17) p 2753-2766 129 Lineweaver H and D Burk The determination of enzyme dissociation
constants Journal of the American Chemical Society 1934 56(3) p 658-666
130 Nielsen CD-T and J Bureacutes Visual kinetic analysis Chemical Science 2019 10(2) p 348-353
131 Blackmond DG Reaction progress kinetic analysis a powerful methodology for mechanistic studies of complex catalytic reactions Angewandte Chemie International Edition 2005 44(28) p 4302-4320
222
132 Rosner T et al Kinetic studies of Heck coupling reactions using palladacycle catalysts experimental and kinetic modeling of the role of dimer species Journal of the American Chemical Society 2001 123(9) p 1848-1855
133 Nielsen LP et al Mechanistic investigation leads to a synthetic improvement in the hydrolytic kinetic resolution of terminal epoxides Journal of the American Chemical Society 2004 126(5) p 1360-1362
134 Baxter RD et al Mechanistic rationalization of unusual kinetics in Pd-catalyzed CndashH olefination Journal of the American Chemical Society 2012 134(10) p 4600-4606
135 Blackmond DG Kinetic profiling of catalytic organic reactions as a mechanistic tool Journal of the American Chemical Society 2015 137(34) p 10852-10866
136 Bureacutes J A simple graphical method to determine the order in catalyst Angewandte Chemie International Edition 2016 55(6) p 2028-2031
137 Bureacutes J Variable time normalization analysis General graphical elucidation of reaction orders from concentration profiles Angewandte Chemie International Edition 2016 55(52) p 16084-16087
138 Mathew JS et al Investigations of Pd-catalyzed ArX coupling reactions informed by reaction progress kinetic analysis The Journal of Organic Chemistry 2006 71(13) p 4711-4722
139 Streuff J et al Mechanism of the tiIII-catalyzed acyloin-type umpolung a catalyst-controlled radical reaction Journal of the American Chemical Society 2015 137(45) p 14396-14405
140 Lin S and EN Jacobsen Thiourea-catalysed ring opening of episulfonium ions with indole derivatives by means of stabilizing non-covalent interactions Nature Chemistry 2012 4(10) p 817
141 Noda H et al Catalytic asymmetric synthesis of CF 3-substituted tertiary propargylic alcohols via direct aldol reaction of α-N 3 amide Chemical Science 2017 8(4) p 3260-3269
142 Lundberg H et al Mechanistic elucidation of zirconium-catalyzed direct amidation Journal of the American Chemical Society 2017 139(6) p 2286-2295
143 Vasilenko V CK Blasius and LH Gade One-Pot Sequential Kinetic Profiling of a Highly Reactive Manganese Catalyst for Ketone Hydroboration Leveraging σ-Bond Metathesis via Alkoxide Exchange Steps Journal of the American Chemical Society 2018 140(29) p 9244-9254
144 Franceschini G and S Macchietto Model-based design of experiments for parameter precision State of the art Chemical Engineering Science 2008 63(19) p 4846-4872
145 Galvanin F S Macchietto and F Bezzo Model-based design of parallel experiments Industrial amp Engineering Chemistry Research 2007 46(3) p 871-882
146 Waldron C et al Model-based design of transient flow experiments for the identification of kinetic parameters Reaction Chemistry amp Engineering 2020 5(1) p 112-123
147 Von Stosch M et al Hybrid semi-parametric modeling in process systems engineering Past present and future Computers and Chemical Engineering 2014 60 p 86-101
223
148 de Juan A et al Combining hard-and soft-modelling to solve kinetic problems Chemometrics Intelligent Laboratory Systems 2000 54(2) p 123-141
149 de Carvalho AR et al Comparison of PLS and kinetic models for a second-order reaction as monitored using ultraviolet visible and mid-infrared spectroscopy Talanta 2006 68(4) p 1190-1200
150 Fath V et al Efficient Kinetic Data Acquisition and Model Prediction Continuous Flow Microreactors Inline FT-IR Spectroscopy and Self-modeling Curve Resolution Organic Process Research amp Development 2020
151 Toch K JW Thybaut and GB Marin A systematic methodology for kinetic modeling of chemical reactions applied to n‐hexane hydroisomerization AIChE Journal 2015 61(3) p 880-892
152 Yang S-T X Liu and Y Zhang Metabolic engineeringndashapplications methods and challenges in Bioprocessing for Value-Added Products from Renewable Resources 2007 Elsevier p 73-118
153 Vasquez E and T Eldredge Process modeling for hydrocarbon fuel conversion in Advances in Clean Hydrocarbon Fuel Processing 2011 Elsevier p 509-545
154 Paul S V Kurin and S Whiteson Fast Efficient Hyperparameter Tuning for Policy Gradient Methods in Advances in Neural Information Processing Systems 2019
155 Wistuba M N Schilling and L Schmidt-Thieme Scalable gaussian process-based transfer surrogates for hyperparameter optimization Machine Learning 2018 107(1) p 43-78
156 Lerman P Fitting segmented regression models by grid search Journal of the Royal Statistical Society Series C 1980 29(1) p 77-84
157 Huang C-YR C-Y Lai and K-TT Cheng Fundamentals of algorithms in Electronic Design Automation 2009 Elsevier p 173-234
158 Boyd SP and L Vandenberghe Convex optimization 2004 Cambridge university press p 1-16
159 Vasiljević D Comparison of optimization algorithms in Classical and Evolutionary Algorithms in the Optimization of Optical Systems 2002 Springer p 83-88
160 Inuiguchi M and J Ramık Possibilistic linear programming a brief review of fuzzy mathematical programming and a comparison with stochastic programming in portfolio selection problem Fuzzy Sets amp Systems 2000 111(1) p 3-28
161 Beacutenichou M et al Experiments in mixed-integer linear programming Mathematical Programming 1971 1(1) p 76-94
162 Kuhn HW and AW Tucker Nonlinear programming in Traces and emergence of nonlinear programming 2014 Springer p 247-258
163 Bregman LM The relaxation method of finding the common point of convex sets and its application to the solution of problems in convex programming USSR Computational Mathetmatics and Mathematical Physics 1967 7(3) p 200-217
164 Frank M and P Wolfe An algorithm for quadratic programming Naval Research Logistics Quarterly 1956 3(1‐2) p 95-110
165 Drummond LG and BF Svaiter A steepest descent method for vector optimization Journal of Computational amp Applied Mathematics 2005 175(2) p 395-414
224
166 Clayton AD et al Algorithms for the self-optimisation of chemical reactions Reaction Chemistry amp Engineering 2019 4(9) p 1545-1554
167 Spendley W GR Hext and FR Himsworth Sequential application of simplex designs in optimisation and evolutionary operation Technometrics 1962 4(4) p 441-461
168 Nelder JA and R Mead A simplex method for function minimization The Computer Journal 1965 7(4) p 308-313
169 Byrd RH JC Gilbert and J Nocedal A trust region method based on interior point techniques for nonlinear programming Mathematical Programming 2000 89(1) p 149-185
170 Waltz RA et al An interior algorithm for nonlinear optimization that combines line search and trust region steps Mathematical Programming 2006 107(3) p 391-408
171 Whitley D A genetic algorithm tutorial Statistics amp Computing 1994 4(2) p 65-85
172 Brochu E VM Cora and N De Freitas A tutorial on Bayesian optimization of expensive cost functions with application to active user modeling and hierarchical reinforcement learning preprint arXiv10122599 2010
173 Tsu J VHG Diacuteaz and MJ Willis Computational approaches to kinetic model selection Computers and Chemical Engineering 2019 121 p 618-632
174 de la Mare PBD Reaction Mechanism Encyclopaeligdia Britannica 2008 [cited 2020 April 13] Available from httpswwwbritannicacomsciencereaction-mechanism
175 Carey FA and RJ Sundberg Study and Description of Organic Reaction Mechanisms Advanced Organic Chemistry Part A Structure amp Mechanisms 2000 p 187-261
176 Willis MJ and M von Stosch Inference of chemical reaction networks using mixed integer linear programming Computers and Chemical Engineering 2016 90 p 31-43
177 Aris R and R Mah Independence of chemical reactions Industrial Engineering Chemistry Fundamentals 1963 2(2) p 90-94
178 Bonvin D and D Rippin Target factor analysis for the identification of stoichiometric models Chemical Engineering Science 1990 45(12) p 3417-3426
179 Amrhein M B Srinivasan and D Bonvin Target factor analysis of reaction data Use of data pre-treatment and reaction-invariant relationships Chemical Engineering Science 1999 54(5) p 579-591
180 Georgakis C and R Lin Stoichiometric Modeling of Complex Pharmaceutical Reactions in Proceedings of the Annual AIChE meeting in Cincinnati OH November 2005
181 Brendel M D Bonvin and W Marquardt Incremental identification of kinetic models for homogeneous reaction systems Chemical Engineering Science 2006 61(16) p 5404-5420
182 Bhatt N et al Incremental identification of reaction systemsmdashA comparison between rate-based and extent-based approaches Chemical Engineering Science 2012 83 p 24-38
183 Burnham SC et al Inference of chemical reaction networks Chemical Engineering Science 2008 63(4) p 862-873
225
184 Crampin EJ S Schnell and PE McSharry Mathematical and computational techniques to deduce complex biochemical reaction mechanisms Progress in Biophysics amp Molecular Biology 2004 86(1) p 77-112
185 Searson DP et al Inference of chemical reaction networks using hybrid s-system models Chemical Product amp Process Modelling 2007 2(1)
186 Srividhya J et al Reconstructing biochemical pathways from time course data Proteomics 2007 7(6) p 828-838
187 Searson DP MJ Willis and A Wright Reverse Engineering Chemical Reaction Networks from Time Series Data Statistical Modelling of Molecular Descriptors in QSARQSPR 2014 2(12)
188 Koza JR et al Automatic computational discovery of chemical reaction networks using genetic programming in Computational Discovery of Scientific Knowledge 2007 Springer p 205-227
189 Hii CJ AR Wright and MJ Willis Utilizing a genetic algorithm to elucidate chemical reaction networks An experimental case study International Journal of Chemical Engineering Applications 2014 5(6) p 516
190 Chellaboina V et al Modeling and analysis of mass-action kinetics IEEE Control Systems Magazine 2009 29(4) p 60-78
191 Sayikli C and EZ Bagci Limitations of using mass action kinetics method in modeling biochemical systems illustration for a second order reaction in International Conference on Computational Science and Its Applications 2011 Springer
192 Furusjouml E O Svensson and L-G Danielsson Estimation of kinetic parameters from non-isothermal batch experiments monitored by in situ vibrational spectroscopy Chemometrics Intelligent Laboratory Systems 2003 66(1) p 1-14
193 Pagano RL et al Cure kinetic parameter estimation of thermosetting resins with isothermal data by using particle swarm optimization European Polymer Journal 2008 44(8) p 2678-2686
194 Zhang Y-Y and J-H Liu Kinetic study of enantioselective hydrolysis of (R S)-ketoprofen ethyl ester using immobilized T laibacchii lipase Biochemical Engineering Journal 2011 54(1) p 40-46
195 VanBuren V L Cassimeris and DJ Odde Mechanochemical model of microtubule structure and self-assembly kinetics Biophysical Journal 2005 89(5) p 2911-2926
196 Gao D Y Xiao and A Varma Guaiacol hydrodeoxygenation over platinum catalyst reaction pathways and kinetics Industrial Engineering Chemistry Research 2015 54(43) p 10638-10644
197 Changi S TM Brown and PE Savage Reaction kinetics and pathways for phytol in high-temperature water Chemical Engineering Journal 2012 189 p 336-345
198 Zhang Y et al One-pot Enzymatic Synthesis of Enantiopure 1 3-oxathiolane by Trichosporon Laibachii Lipase and Kinetic Model Organic Process Research amp Development 2020
199 Villaverde AF et al Benchmarking optimization methods for parameter estimation in large kinetic models Bioinformatics 2019 35(5) p 830-838
200 Akaike H Fitting autoregressive models for prediction Annals of the Institute of Statistical Mathematics 1969 21(1) p 243-247
226
201 Hurvich CM and C-L Tsai Regression and time series model selection in small samples Biometrika 1989 76(2) p 297-307
202 Burnham KP and DR Anderson A practical information-theoretic approach Model Selection and Multimodel Inference Vol 2 49-96 2002 New York Springer
203 Gholamipour-Shirazi A and C Rolando Alkylation of substituted benzoic acids in a continuous flow microfluidic microreactor kinetics and linear free energy relationships Organic Process Research amp Development 2012 16(5) p 811-818
204 Niemeier JK et al Application of kinetic modeling and competitive solvent hydrolysis in the development of a highly selective hydrolysis of a nitrile to an amide Organic Process Research amp Development 2014 18(3) p 410-416
205 Hartridge H and FJW Roughton A method of measuring the velocity of very rapid chemical reactions Proceedings of the Royal Society of London Series A Containing Papers of a Mathematical Physical Character 1923 104(726) p 376-394
206 Gibson QH Rapid mixing Stopped flow Methods in Enzymology 1969 16 p 187-228
207 Seong GH J Heo and RM Crooks Measurement of enzyme kinetics using a continuous-flow microfluidic system Analytical Chemistry 2003 75(13) p 3161-3167
208 Rozich AF and DJ Castens Inhibition kinetics of nitrification in continuous-flow reactors Water Pollution Control Federation 1986 p 220-226
209 Christensen M et al Development of an automated kinetic profiling system with online HPLC for reaction optimization Reaction Chemistry amp Engineering 2019 4(9) p 1555-1558
210 Johnson KA Rapid quench kinetic analysis of polymerases adenosinetriphosphatases and enzyme intermediates Contemporary Enzyme Kinetics Mechanism Reliable Lab Solutions 2009 p 407
211 Probstein RF Physicochemical hydrodynamics an introduction 2005 John Wiley amp Sons
212 Konermann L Monitoring reaction kinetics in solution by continuous-flow methods the effects of convection and molecular diffusion under laminar flow conditions Journal of Physical Chemistry A 1999 103(36) p 7210-7216
213 Konermann L et al Acid-induced denaturation of myoglobin studied by time-resolved electrospray ionization mass spectrometry Biochemistry 1997 36(21) p 6448-6454
214 Konermann L B Collings and D Douglas Cytochrome c folding kinetics studied by time-resolved electrospray ionization mass spectrometry Biochemistry 1997 36(18) p 5554-5559
215 Zechel DL et al Pre-steady state kinetic analysis of an enzymatic reaction monitored by time-resolved electrospray ionization mass spectrometry Biochemistry 1998 37(21) p 7664-7669
216 Zhou X R Medhekar and MD Toney A continuous-flow system for high-precision kinetics using small volumes Analytical Chemistry 2003 75(15) p 3681-3687
217 Jensen KF BJ Reizman and SG Newman Tools for chemical synthesis in microsystems Lab on a Chip 2014 14(17) p 3206-3212
227
218 Hartman RL JP McMullen and KF Jensen Deciding whether to go with the flow evaluating the merits of flow reactors for synthesis Angewandte Chemie International Edition 2011 50(33) p 7502-7519
219 Baxendale IR L Brocken and CJ Mallia Flow chemistry approaches directed at improving chemical synthesis Green Processing Synthesis 2013 2(3) p 211-230
220 Gutmann B D Cantillo and CO Kappe Continuous‐flow technologymdasha tool for the safe manufacturing of active pharmaceutical ingredients Angewandte Chemie International Edition 2015 54(23) p 6688-6728
221 Bedore MW et al Aminolysis of epoxides in a microreactor system a continuous flow approach to β-amino alcohols Organic Process Research amp Development 2010 14(2) p 432-440
222 Zaborenko N et al Kinetic and scale-up investigations of epoxide aminolysis in microreactors at high temperatures and pressures Organic Process Research amp Development 2011 15(1) p 131-139
223 Monteiro JL et al Continuous Flow Homolytic Aromatic Substitution with Electrophilic Radicals A Fast and Scalable Protocol for Trifluoromethylation Chemistry - A European Journal 2017 23(1) p 176-186
224 Nagaki A D Ichinari and J-i Yoshida Three-component coupling based on flash chemistry Carbolithiation of benzyne with functionalized aryllithiums followed by reactions with electrophiles Journal of the American Chemical Society 2014 136(35) p 12245-12248
225 Hone CA et al Rapid multistep kinetic model generation from transient flow data Reaction Chemistry amp Engineering 2017 2(2) p 103-108
226 Valera FE et al The Flowrsquos the Thinghellip Or Is It Assessing the Merits of Homogeneous Reactions in Flask and Flow Angewandte Chemie International Edition 2010 49(14) p 2478-2485
227 Moore JS and KF Jensen ldquoBatchrdquo kinetics in flow online IR analysis and continuous control Angewandte Chemie International Edition 2014 53(2) p 470-473
228 Haas CP et al Automated generation of photochemical reaction data by transient flow experiments coupled with online HPLC analysis Reaction Chemistry amp Engineering 2020
229 Schaber SD et al Design execution and analysis of time-varying experiments for model discrimination and parameter estimation in microreactors Organic Process Research amp Development 2014 18(11) p 1461-1467
230 Aroh KC and KF Jensen Efficient kinetic experiments in continuous flow microreactors Reaction Chemistry amp Engineering 2018 3(1) p 94-101
231 Gomez MV et al Determination of kinetic parameters within a single nonisothermal on-flow experiment by nanoliter NMR spectroscopy Analytical Chemistry 2015 87(20) p 10547-10555
232 Waldron C et al An autonomous microreactor platform for the rapid identification of kinetic models Reaction Chemistry amp Engineering 2019 4(9) p 1623-1636
233 Hone CA et al Definitive screening designs for multistep kinetic models in flow Reaction Chemistry amp Engineering 2019 4(9) p 1565-1570
228
234 Holmes N et al Online quantitative mass spectrometry for the rapid adaptive optimisation of automated flow reactors Reaction Chemistry amp Engineering 2016 1(1) p 96-100
235 Levenspiel O Chemical reaction engineering Industrial amp Engineering Chemistry Research 1999 38(11) p 4140-4143
236 McMullen JP and KF Jensen Rapid determination of reaction kinetics with an automated microfluidic system Organic Process Research amp Development 2011 15(2) p 398-407
237 Nagy KD et al Mixing and dispersion in small-scale flow systems Organic Process Research amp Development 2012 16(5) p 976-981
238 Afonso CA et al Comprehensive Organic Chemistry Experiments for the Laboratory Classroom 2016 Royal Society of Chemistry
239 Fluorochem 2019 27062019] Available from httpwwwfluorochemcoukProductsProductcode=303261
240 Ashworth IW et al Where has my acid gone Understanding the self-catalyzed esterification of maleic acid in methanol during salt formation Organic Process Research amp Development 2012 16(10) p 1646-1651
241 Gilbert JC EG McKinley and D-R Hou The nature of cyclopentyne from different precursors Tetrahedron 1997 53(29) p 9891-9902
242 Takaki K et al Intermolecular hydrophosphination of alkynes and related carbonminus carbon multiple bonds catalyzed by organoytterbiums The Journal of Organic Chemistry 2003 68(17) p 6554-6565
243 Berthelot DJ-C et al Heterocyclic amides as modulators of TRPA1 2013 Google Patents
244 Binch H et al Aminopyridine derivatives having aurora a selective inhibitory action 2013 Google Patents
245 Lood CS et al Synthesis of Chiral (Indol-2-yl) methanamines and Insight into the Stereochemistry Protecting Effects of the 9-Phenyl-9-fluorenyl Protecting Group European Journal of Organic Chemistry 2015 3793 p 3805
246 Poisson J-F A Orellana and AE Greene Stereocontrolled synthesis of (minus)-kainic acid from trans-4-hydroxy-L-proline The Journal of Organic Chemistry 2005 70(26) p 10860-10863
247 Lood C M Nieger and A Koskinen Enantiospecific gram scale synthesis of (S)-eleagnine Tetrahedron 2015 71(30) p 5019-5024
248 9-Bromo-9-phenylfluorene Sigma Aldrich Available from httpswwwsigmaaldrichcomcatalogproductaldrich368873 [27092020]
249 Tian Z and F Menard Synthesis of Kainoids and C4 Derivatives The Journal of Organic Chemistry 2018 83(11) p 6162-6170
250 9-Fluorenone Sigma Aldrich Available from httpswwwsigmaaldrichcomcatalogproductaldrichf1506 [27092020]

3
Abstract
A major bottleneck in the transition from chemistry research at lab scale
to process development is a lack of quantitative chemical synthesis information
Critical aspects of this information include knowing the correct reaction model
and precise kinetic parameters If this information is available classical reaction
engineering principles may be utilised to shorten process development times and
lower costs
Identifying the correct reaction model for a particular process however
can be challenging and time-consuming particularly for physical-organic
chemists and kinetics experts that may be busy with other aspects of process
development The work presented herein describes computational approaches
that automatically determine the most likely kinetic model and associated
parameters based on the experimental data supplied without expert chemical
intuition
The concept for these methodologies involves a comprehensive model
evaluation tool The experimental data and the species involved in the process
are inputted Based on mass balance all mass-balance-allowed transformations
between these species are identified All possible models are then compiled from
this list of transformations featuring unique combinations of these model terms
Every model is then evaluated using ordinary differential equation (ODE) solvers
and optimisation algorithms to maximise the convergence of simulated reaction
progression with the experimental data thereby identifying the kinetic
parameters Each model is then statistically evaluated to determine which model
is the most likely to be correct
Using these methodologies allows any chemist to automatically determine
a reaction model and kinetic constants for a particular system by performing all
kinetic analysis autonomously Their most expensive resource time can then be
focussed on other tasks that cannot be automated
4
Table of Contents
Acknowledgements 2
Abstract 3
Table of Contents 4
List of Schemes 7
List of Figures 9
List of Tables 14
List of Abbreviations 17
Chapter 1 Introduction 19
11 Continuous flow chemistry 19
111 Batch and flow reactions 19
112 Reactions in flow 24
113 Reaction analysis 33
114 Continuous flow chemistry summary 40
12 Kinetic methodologies 40
121 Conventional methodologies 41
122 Visual kinetic analysis 49
123 Kinetic methodologies summary 56
13 Optimisation 56
131 Local algorithms 59
132 Global 63
133 Optimisation summary 68
14 Research aim 69
Chapter 2 Development of the computational approach to kinetic model determination 70
21 Introduction 70
22 Development of the approach 73
221 Kinetic model generation 74
222 Kinetic model fitting 79
223 Statistical analysis 85
224 Other considerations 86
225 Overview 87
23 Simulated verification of the approach 89
231 Case study Benzoic acid alkylation 90
232 Case study Nitrile hydrolysis 93
5
233 Case study SNAr kinetics 97
24 Conclusion 102
Chapter 3 Experimental applications of the computational approach to kinetic model and parameter determination 103
31 Introduction 103
32 Experimental setup 112
33 Case study Phenyl acetate 115
34 Case study Paracetamol 118
35 Case study Metoprolol 121
36 Conclusion 125
Chapter 4 The development of an improved computational approach to kinetic model determination 126
41 Introduction 126
42 Methodology advancement 127
421 Capabilities 127
422 Rules 131
423 Overview 136
43 Simulated verifications of the approach 138
431 Case study SNAr kinetics 138
432 Case study Pentyne kinetics 145
433 Case study Ytterbium catalysis 149
44 Conclusion 152
Chapter 5 Experimental applications of the new approach 153
51 Introduction 153
52 Case study SNAr kinetics 154
53 Case study PfBr 157
54 Case study Maleic acid 162
55 Conclusion 166
Chapter 6 Conclusion amp future work 167
Chapter 7 Appendix 168
71 Chapter 1 168
72 Chapter 2 168
721 Generated data set for case study benzoic acid alkylation 169
722 Generated data set for case study nitrile hydrolysis 170
723 Generated data set for the case study SNAr kinetics 171
73 Chapter 3 173
6
731 Phenyl acetate 173
732 Paracetamol 178
733 Metoprolol 187
74 Chapter 4 193
741 Generated data set for the case study SNAr kinetics 193
742 Generated data set for the case study Pentyne 195
743 Generated data set for the case study Ytterbium catalysis 197
75 Chapter 5 198
751 SNAr kinetics 198
752 PfBr 206
753 Maleic acid 211
76 Computational setup 214
761 Chapter 2 - 3 214
762 Chapter 4 - 5 214
Chapter 8 References 214
7
List of Schemes
Chapter 1
Scheme 11 The conversion of hexanol 11 to hexene 12 in a continuous flow setup[19]
21
Scheme 12 The flow synthesis of the adduct 15 via a Michael addition between the
dicarbonyl 13 and the alkyne 14[20] 22
Scheme 13 The multistep continuous flow synthesis of ibuprofen 18 23
Scheme 14 The temperature-accelerated SNAr reaction of 19 with 110 to form 111 in
THF (boiling point 66 degC) under flow conditions[51] 26
Scheme 15 The Fischer Indole synthesis of 114 from the hydrazine 112 and
dihydrofuran 113 in methanol (boiling point 65 degC) using a flow setup[52] 26
Scheme 16 The hydrogenation of isophorone 115 to TMCH 116[65] 27
Scheme 17 The [2 + 2] photocycloaddition of malemide 117 with 1-hexyne to produce
the cyclic product 118[74] 29
Scheme 18 An electrochemical facilitated nucleophilic substitution reaction to afford the
product 121[78] 29
Scheme 19 An enzyme catalysed continuous cyanohydrin formation forming 123[84] 30
Scheme 110 Multiple enzymatic catalysed continuous process to form UDP galactose
125[85] Individual enzymes stated 30
Scheme 111 The multi-step flow synthesis of 127 from coupling o-dibromobenzene 126
with varying electrophiles via sequential halogen-lithium exchange reactions[87] 31
Scheme 112 A multi-step flow synthesis of ibuprofen 18 involving an in-line purification
step[89] 33
Scheme 113 A reaction scheme showing the formation of benzyne 132 which was
followed by analysis via mass spectrometry[108] 35
Scheme 114 A reaction scheme showing the thermal isomerization of 133a to 133b
which was followed by analysis via HPLC[111] 36
Scheme 115 A reaction scheme showing a fluorination reaction yielding 136 which was
followed by analysis via in-line IR[112] 37
Scheme 116 The Grignard reaction that was tracked by on-line NMR[123] 38
Scheme 117 A Heck coupling of an aryl bromide 140 with 141 to form the adduct 142
This case study showed no indication of product inhibition or catalyst deactivation 50
Scheme 118 The epoxide opening of 143 to form 144 using a catalytic system This case
study indicates some product inhibition or catalyst deactivation 51
Scheme 119 A nickel-catalysed alkylation reaction of chalcone 145 with Et2Zn 146 to
form the adduct 147 53
Chapter 2
Scheme 21 An example esterification reaction 75
Scheme 22 The reaction of benzoic acid with iodomethane to form methyl benzoate
Modelled as a second order reaction 91
8
Scheme 23 The reaction of a nitrile with hydroxide to form the corresponding amide which
is susceptible to further hydrolysis to form the carboxylic acid Modelled as sequential
second order reactions 94
Scheme 24 The reaction of 24-dichloropyrimidine 210 with morpholine 211 to form the
4-substituted product 212 and the 2-substituted product 213 and the subsequent
bis-substituted product 214 98
Chapter 3
Scheme 31 The base catalysed Knoevenagel condensation between benzaldehyde and
ethyl cyanoacetate to form 34 109
Scheme 32 The Paal-Knorr reaction of 25-hexanedione 35 and ethanolamine 36 to
yield 37 to show how the kinetics of a process can be observed by using a controlled
ramp technique 111
Scheme 33 The reaction of phenol 38 with acetyl chloride 39 to form phenyl acetate
310 and hydrochloric acid 311 115
Scheme 34 The reaction of 4-aminophenol with acetic anhydride to form paracetamol in
step one followed by a further reaction with acetic anhydride to form diacetamate in
step two 118
Scheme 35 The reaction of the epoxide starting material with isopropylamine to form
metoprolol as well as the overreaction to form the bis-substituted product 122
Chapter 4
Scheme 41 The self-catalysed reaction of maleic acid 41 and methanol 42 to form the
mono-product 43 and the di-product 44[237] 132
Scheme 42 The reaction of 24-difluoronitrobenzene 45 with pyrrolidine 46 to form the
ortho-substituted product 47 and the para-substituted product 48 Consecutive
reactions then occur to form the bis-substituted product 49 In each reaction
hydrofluoric acid 410 is formed[222] 139
Scheme 43 The reaction of the starting material 411 with the spirodiene 412 to form
the product 413 and LiBr 414[238] 146
Scheme 44 The reaction of the starting material 415 with diphenylphosphine 416 in the
presence of the ytterbium catalyst 417 to form the product 418 where [Yb] Yb(η2-
Ph2CNPh)(hmpa)3[239] 149
Chapter 5
Scheme 51 The reaction of 246-trichloropyrimidine (SM) 51 with ethyl 4-
aminobutanoate 52 to form the major 2-substituted SNAr product 53 and the minor
4-substituted SNAr product 54 154
Scheme 52 The reaction of alanine methyl ester (Al-Me) 56 with PfBr 57 to form the
protected amino acid 58 Hydrobromic acid 59 is also generated as a side product
158
Scheme 53 The retrosynthetic methodology of the transformation of L-alanine to (S)-
eleagnine via the Pf-protected alanine methyl ester (Pf-Al-Me)[244] 158
Scheme 54 The synthetic route from cheap starting materials bromobenzene 510 and
fluorene 511 to the intermediate PfOH 512 and finally the desired PfBr material
58 159
9
Scheme 55 The reaction of maleic acid 513 and methanol 514 to form the mono-
product 515 and the di-product 516 163
List of Figures
Chapter 1
Figure 11 An annotated picture of an in-line liquid-liquid separator developed by Zaiput
Flow Technologies 33
Figure 12 The response surface showing temperature and residence time effects on the
thermal isomerisation of 133a[108] Reproduced with permission 36
Figure 13 An IR absorption showing the detailed rise of the C-F bond peak over time
indicating the extent of reaction completion[109] Reproduced with permission 37
Figure 1 4 The on-line NMR analysis in the aromatic region of the Grignard reaction
shown in Scheme 116 at different time intervals[120] Reproduced with permission 38
Figure 15 A graphical representation of generated time-series data for a first order
reaction shown in eqn 11 The data is log-transformed to give a linear fit where the
gradient is equal to the rate constant multiplied by -1 42
Figure 16 A graphical representation of generated time-series data for a zero order
reaction shown in eqn 11 This data does not need to be transformed as the linear fit
is equal to the rate constant multiplied by -1 43
Figure 17 A graphical representation of generated time-series data for a second order
reaction shown in eqn 11 This data is plotted as the reciprocal of the concentration
vs time and the gradient of the linear fit to this data is the rate constant 43
Figure 18 A graphical representation of generated time-series data for a second order
reaction shown in eqn 18 where [A] = [B] = This data is plotted as a log-
transformed concentration fraction vs time The gradient of the linear fit to this data is
the rate constant multiplied by the initial concentration of B minus the initial
concentration of A 45
Figure 19 A representation of Michaelis-Menten kinetics where the initial reaction rate of
individual experiments with differing substrate concentrations x is plotted This plot is
then used to determine the kinetic parameters Vmax and KM 48
Figure 110 A representation of the Lineweaver-Burk equation where the inverse of the
initial reaction rate of individual experiments with differing substrate concentrations x
is plotted This plot is then used to determine the kinetic parameters Vmax and KM 49
Figure 111 An overlay of two experimental datasets with the same lsquoexcessrsquo of reactant
concentration for the reaction shown in Scheme 117 This overlap indicates no
product inhibition or catalyst deactivation Reproduced with permission 51
Figure 112 As there is no overlay in the two experimental datasets with the same lsquoexcessrsquo
of reactant concentration in the reaction system shown in Scheme 118 this indicates
some product inhibition or catalyst deactivation A further experiment is necessary to
determine what is occurring Reproduced with permission 52
10
Figure 113 Graphical rate equations for the alkylation reaction shown in Scheme 119 a)
Standard graphical rate equation b) Using the RPKA methodology to observe any
overlap in the lsquodifferent excessrsquo reaction curves This overlap indicates that the
reaction order of Et2Zn is 1 Reproduced with permission 53
Figure 114 A time shift of the profiles of two reactions to observe overlaying plots This
allows the comparison of two profiles with the same starting material concentrations
but different product concentrations therefore identifying signs of product inhibition or
catalyst deactivation Reproduced with permission 54
Figure 115 A summary of the use of RPKA and VTNA a) catalyst deactivation or product
inhibition b) catalyst order c) reagent order d) catalyst deactivation or product
inhibition e) catalyst order f) reagent order Reproduced with permission 56
Figure 116 Some different classes of optimisation problem where variable n is an input
variable and the function evaluation is a measure of how the function is minimised
with the changing variable a) Linear optimisation problem b) Convex optimisation
problem c) Non-linear optimisation problem 59
Figure 117 A representation of a steepest-descent algorithm minimising a 2-dimensional
contoured parameter space where о indicates a measurement Where red areas are
function maxima and blue areas are function minima 60
Figure 118 A representation of a simplex optimisation for a 2-dimensional contoured
parameter space where the numbered vertices of each polyhedron indicate a
measurement Where red areas are function maxima and blue areas are function
minima 61
Figure 119 The different geometric transformations of the Nelder-Mead simplex inside
contraction (XIC) multiple contraction (MC) outside contraction (XOC) reflection (XR)
and expansion (XE) 62
Figure 120 A 1-dimensional optimisation using an interior-point method The approximate
objective function is minimised for the starting trust region t0 63
Figure 121 A 1-dimensional optimisation using an interior-point method The approximate
objective function is minimised for the sequential trust regions until the overall function
is minimised The path that the algorithm can take can be described as the algorithm
path or the central path towards the optimum 63
Figure 122 A depiction of the flow of a simple genetic algorithm 64
Figure 123 A depiction of one iteration of a simple genetic algorithm Figure adapted from
works reported by Boyd amp Vandenberghe[155] 65
Figure 124 The Bayesian optimisation of f(x) where (i) - (viii) represent the sequential
iterations of the minimisation The acquisition function is shown in red measurements
are shown as red dots and the current estimated surrogate model is shown in blue
with its corresponding 95 confidence interval The maximum of the acquisition
function indicates the next measurement to be taken 67
Figure 125 A graphical method to solving ILP problems where C1 - 4 indicate the linear
constraints the green area indicates the feasible region f shows the objective
function red dots represent the integer values of the inputs and P1 and P2 indicate
two feasible potential maxima to the problem Figure adapted from works reported by
Boyd amp Vandenberghe[155] 68
Chapter 2
11
Figure 21 The Mass Matrix inputted into the approach assigning mass to each of the
species 75
Figure 22 The stoichiometric matrices for the reaction model shown in Scheme 21 as
well as the overall stoichiometry matrix S 76
Figure 23 The ILP optimisation identifying a feasible solution to the objective function
hence identifying a mass-balance-allowed reaction Where X1 = A X2 = B X3 = C X4
= D 76
Figure 24 A visual representation of all of the possible reaction models when given five
mass-balance-allowed sample reactions each shown as a different coloured block
When i = 1 each reaction is in itself a model and when i gt 1 each reaction behaves
as a model fragment These fragments when combined in different ways provide full
and unique reaction models each of which are to be assessed for their validity with
respect to experimental data 78
Figure 25 A schematic summarising how the model generation stage of the approach
progresses Where the participating species are inputted and sorted ODE functions
that describe all possible mass-balance-allowed reactions are outputted 79
Figure 26 The iterations of an optimisation algorithm with respect to the convergence of
simulated ODEs with sample data - this occurs via the minimisation of the SSE
output 81
Figure 27 An outline of the stages of the computational approach 88
Figure 28 An example showing the generation of a simulated data set from the literature
a) An ODE is simulated for a particular model with a set of kinetic parameters in this
case A rarr B where mdash = A mdash = B b) Particular time points are taken from this ODE
to represent individual measurements where x = A x = B c) Up to 5 relative
random error is added to these measurements to more closely resemble real
experimental data 90
Figure 29 The fit of the identified model and kinetic parameters to the generated
experimental data with starting concentrations of 01 M benzoic acid and 011 M
iodomethane Where x = benzoic acid x = iodomethane x = methyl benzoate mdash =
benzoic acid (ODE) mdash = iodomethane (ODE) mdash = methyl benzoate (ODE) 93
Figure 210 The fit of the identified model and kinetic parameters to the generated
experimental data with starting concentrations of 1 M nitrile and 2 M hydroxide at 90
degC Where x = nitrile x = amide x = carboxylic acid mdash = nitrile (ODE) mdash = amide
(ODE) mdash = carboxylic acid (ODE) 97
Figure 211 The fit of the identified model and kinetic parameters to the generated
experimental data with starting concentrations of 1 M 24-dichloropyrimidine and 22
M morpholine at 90 degC Where x = 24-dichloropyrimidine x = 4-substituted product x
= 2-substituted product x = bis-substituted product mdash = 24-dichloropyrimidine
(ODE) mdash = 4-substituted product (ODE) mdash = 2-substituted product (ODE) mdash = bis-
substituted product Graph is only shown to 260 minutes to show curvature of the
initial data points 102
Chapter 3
Figure 31 A diagram to show the direction and flows within a flow regime where a)
laminar flow b) turbulent flow 104
12
Figure 32 A plug flow reactor model where there is perfect mixing in the radial direction
but no forward or backward mixing in the axial direction Plugs 1 and 2 are examples
of the infinitely short plugs existing within this reactor model 105
Figure 33 A depiction of how a kinetic experiment can be run utilising a step change in
flow rates between two steady-states (I and II) allowing time-series data to be plotted
from transient data Figure adapted from Mozharov et al[93] 107
Figure 34 A kinetic profile generated from the Knoevenagel condensation shown in
Scheme 31 where kinetic information was obtained by measuring conversation at
given residence times at steady-state at two temperatures Steady-state markers x
are shown as part of the lsquoA Modelrsquo Reproduced with permission 109
Figure 35 A kinetic profile generated from the Knoevenagel condensation shown in
Scheme 31 where kinetic information was obtained using a flow rate step-change at
two temperatures Steady-state markers x are shown as part of the lsquoA Modelrsquo where
step-change markers o are shown as part of the lsquoB Modelrsquo Reproduced with
permission 110
Figure 36 A depiction of how a continuous flow reactor may be described as a series of
sequential pseudo-batch reactors where the colour represents the extent of
conversion from low (green) to high (red) Q represents the total flow rate ti
represents the initial time of each pseudo-batch reactor entering the reactor tf
represents the final time tm is the time at which the concentration is actually
measured by the IR probe Reproduced with permission 110
Figure 37 A combination of the kinetic models for the reaction yielding 37 in Scheme 32
where the differing colours represent different values of S where S is a corrective
residence time multiplier to show the reproducibility of the controlled flow ramp
methodology S = 14 (blue) S = 13 (red) S = 12 (green) S= 23 (orange) steady-
state experiments = x Reproduced with permission 111
Figure 38 A photograph of the automated continuous flow reactor used for this work 113
Figure 39 A mathematically correct representation of how linear gradient flow ramps can
be utilised to sample with a high data density on the initial curvature of the kinetic plot
Where diams = data point Tn = experiment temperature Q = total flow rate Time = time
the reaction has been running τ = residence time that the reaction mixture
experiences 114
Figure 310 Kinetic profiles for two flow ramp experiments at 65 degC and 75 degC where x =
phenol x = phenyl acetate mdash = phenol (ODE) mdash = phenyl acetate (ODE) 117
Figure 311 Graphs showing the agreement between steady-state and flow ramp
measurements for the reaction of phenol with acetyl chloride where curves are fitted
to the steady-state data Where = phenol (steady-state) x = phenol (flow ramp) =
phenyl acetate (steady-state) x = phenyl acetate (flow ramp) 118
Figure 312 Kinetic profiles for four flow ramp experiments at 30 degC 60 degC 160 degC and 180
degC where x = 4-aminophenol x = paracetamol x = diacetamate mdash = 4-aminophenol
(ODE) mdash = paracetamol (ODE) mdash = diacetamate (ODE) See Chapter 732 for full
experimental conditions and raw data 120
Figure 313 Kinetic profiles for the flow ramp experiments at 130 degC 150 degC 190 degC and
210 degC where x = starting material x = Metoprolol x = bis-substituted product mdash =
starting material (ODE) mdash = Metoprolol (ODE) mdash = bis-substituted product (ODE)
See Chapter 733 for full experimental conditions and raw data 123
13
Chapter 4
Figure 41 An illustration of how the lsquoinflationrsquo step takes all mass-balance-allowed
transformations sequentially then deduces all allowed integer and non-integer orders
and generates corresponding rate laws for these transformations If catalytic reactions
are to be explored also rate laws for these catalytic dependencies are also
generated These transformations are all then saved from which full reaction models
can be constructed 130
Figure 42 An overview of the updated computational approach to kinetic model and
parameter determination 137
Figure 43 The fit of the identified model and kinetic parameters to the generated
experimental data with starting concentrations of 12 M 24-difluoronitrobenzene and 3
M pyrrolidine at 30 degC Where x = 24-difluoronitrobenzene x = ortho-substituted
product x = para-substituted product x = bis-substituted product mdash = 24-
difluoronitrobenzene (ODE) mdash = ortho-substituted product (ODE) mdash = para-
substituted product (ODE) mdash = bis-substituted product Plot only shown to 500
minutes to the show curvature of the initial data points 145
Figure 44 The fit of the identified model and kinetic parameters to the generated
experimental data with starting concentrations of 1 M starting material and 08 M
spirodiene at -78 degC Where x = starting material x = spirodiene x = product mdash =
starting material (ODE) mdash = spirodiene (ODE) mdash = product (ODE) 149
Figure 45 The fit of the identified model and kinetic parameters to the generated
experimental data with starting concentrations of 15 M starting material 2 M
diphenylphosphine and 01 M ytterbium catalyst at 22 degC Where x = starting
material x = diphenylphosphine x = product mdash = starting material (ODE) mdash =
diphenylphosphine (ODE) mdash = product (ODE) 152
Chapter 5
Figure 51 The distinctive proton peaks shown in red that are monitored via NMR as time
progresses in the SNAr case study 155
Figure 52 Kinetic profiles for four kinetic experiments at -25 degC 0 degC 25 degC and 50 degC
where = starting material = 2-substituted product = 4-substituted product mdash =
starting material (ODE) mdash = 2-substituted product (ODE) mdash = 4-substituted product
(ODE) See Chapter 751 for full experimental conditions and raw data 156
Figure 53 The batch setup for experimentation in the PfBr case study where the
temperature probe is submerged in the reaction medium that is heated via a heater
stirrer 160
Figure 54 Kinetic profiles for three kinetic experiments at 30 degC 35 degC and 40 degC where
red plots indicate PfBr concentrations and blue plots indicate Pf-Al-Me concentrations
At 30 degC = experimental data mdash = ODE At 35 degC = experimental data - - - =
ODE At 40 degC = experimental data = ODE See Chapter 752 for full
experimental conditions and raw data 161
Figure 55 Kinetic profiles for two kinetic experiments at 50 degC with the initial concentration
of maleic acid at 04 M and 08 M At 04 M = maleic acid mdash = maleic acid (ODE)
= mono-product mdash = mono-product (ODE) = di-product mdash = di-product (ODE)
At 08 M = maleic acid - - - = maleic acid (ODE) = mono-product - - - = mono-
product (ODE) = di-product - - - = di-product (ODE) See Chapter 753 for full
experimental conditions and raw data 165
14
Chapter 73
Figure 731 The flow reactor setup for the phenyl acetate case study experiments 174
Figure 732 An example HPLC chromatogram in the phenyl acetate case study at 254 nm
175
Figure 733 The reactor setup for the paracetamol flow ramp experiment at 30 degC 179
Figure 734 The reactor setup for the paracetamol flow ramp experiment at 60 degC 180
Figure 735 The reactor setup for the paracetamol flow ramp experiment at 160 degC 180
Figure 736 The reactor setup for the paracetamol flow ramp experiment at 180 degC 180
Figure 737 An example HPLC chromatogram from the paracetamol case study showing
the separation of all reaction components at 254 nm 181
Figure 738 A photograph of the automated flow system at AstraZeneca 188
Figure 739 The reactor setup for the metoprolol flow ramp experiments at 190210 degC in
Leeds 189
Figure 7310 The reactor setup for the metoprolol flow ramp experiments at 130150 degC at
AstraZeneca 190
Figure 7311 An example HPLC chromatogram during a kinetic experiment in the
metoprolol case study at 220 nm 190
Chapter 75
Figure 751 The dedicated NMR spectrometer used for kinetic experiments in the SNAr
kinetics case study 199
Figure 752 lsquoStackedrsquo NMR spectrum showing several NMR spectra over time in the 25 degC
experiment 200
Figure 753 A 13C NMR confirming the presence of the PfBr material compared to
literature values to identify the material[246] 207
Figure 754 IR analysis of the PfBr material showing the absence of a hydroxy peak from
any residual PfOH 208
Figure 755 HPLC analysis of the PfBr material at 254 nm indicating that a pure product is
present 208
Figure 756 An example HPLC chromatogram at 230 nm during a kinetic experiment in the
PfBr case study 210
Figure 757 An example NMR spectrum from the maleic acid case study 212
List of Tables
Chapter 1
Table 11 A table summarising reaction analysis techniques in flow systems adapted from
Houben and Lapkin[121] 39
Chapter 2
15
Table 21 A table showing the optimised k values for the identified models in the benzoic
acid alkylation case study alongside each modelrsquos SSE and AICC 92
Table 22 A table showing the top three ranked models for the nitrile hydrolysis case study
The kinetic parameters for each reaction within the model is shown as well as the
SSE and AICC evaluation 95
Table 23 A table showing the top three ranked models for the SNAr case study The kinetic
parameters for each reaction within the model is shown as well as the SSE and AICC
evaluation 100
Chapter 3
Table 31 Evaluation of the feasibility of each reaction model for the phenyl acetate study
116
Table 32 Evaluation of the feasibility of each reaction model for the paracetamol study 120
Table 33 Evaluation of the feasibility of each reaction model for the metoprolol study 124
Chapter 4
Table 41 A table showing examples of allowed and disallowed models according to Rule
4 134
Table 42 A table showing the top five ranked models for the SNAr case study as identified
by the old approach The kinetic parameters for each reaction within the model are
shown as well as the SSE and AICC evaluation 142
Table 43 A table showing the top five ranked models for the SNAr case study as identified
by the new approach The kinetic parameters for each reaction within the model are
shown as well as the SSE and AICC evaluation α denotes a variable molar
dependence within the kinetic parameter units depending on the rate law 143
Table 44 A table showing the top five ranked models for the pentyne case study as
identified by the new approach The kinetic parameters for each reaction within the
model are shown as well as the SSE and AICC evaluation α denotes a variable molar
dependence within the kinetic parameter units depending on the rate law 147
Table 45 A table showing the top five ranked models for the ytterbium catalysis case study
as identified by the new approach The kinetic parameters for each reaction within the
model are shown as well as the SSE and AICC evaluation α denotes a variable molar
dependence within the kinetic parameter units depending on the rate law 150
Chapter 5
Table 51 Evaluation of the feasibility of each reaction model for the SNAr case study
where α is variable for each model depending on the overall model order 156
Table 52 Evaluation of the feasibility of each reaction model for the PfBr case study where
α is variable for each model depending on the overall model order 161
Table 53 Evaluation of the feasibility of each reaction model for the maleic acid case
study where α is variable for each model depending on the overall model order 165
16
17
List of Abbreviations
A Pre-exponential factor
Ac Acetyl
AIC Akaikes information criterion
AICC Corrected Akaikes information criterion
API Active pharmaceutical ingredient
Aq Aqueous
Bn Benzyl
bp Boiling point
Bu Butyl
cm Centimetre
CSTR Continuous stirred tank reactor
CRN Chemical reaction network
DCM Dichloromethane
Ea Activation energy
Equiv Equivalents
Et Ethyl
g Gram
GA Genetic algorithm
GC Gas chromatography
h Hour
HPLC High performance liquid chromatography
Hz Hertz
ID Inner diameter
ILP Integer linear programming
IR Infrared
k Rate constant
K Kelvin
kref Reference rate constant
18
L Litre
m Metre
M Molar
Me Methyl
MILP Mixed integer linear programming
min Minute
mL Millilitre
MM Mass matrix
mmol Millimole
mol Mole
MS Mass spectrometry
NMR Nuclear magnetic resonance
OD Outer diameter
ODE Ordinary differential equation
PFR Plug flow reactor
Ph Phenyl
R Ideal gas constant
Re Reynolds number
S Stoichiometry
SNAr Nucleophilic aromatic substitution
SSE Sum of squared error
T Temperature
TFA Target factor analysis
tR Residence time
Tref Reference temperature
tRes Residence time
V Volume
19
Chapter 1 Introduction
The main aim of this project is to develop and advance methodologies for
kinetic model determination and parameter estimation The acquisition of the
experimental data necessary for these studies is flexible and can be obtained by
any means However given the numerous advantages of continuous flow
chemistry and the availability of a flow chemistry platform many chemistries
were performed using this regime For this reason continuous flow chemistry is
broadly covered in this introduction as well as a comprehensive look at methods
of obtaining kinetic data in Chapter 31
Current methodologies of obtaining kinetic information are herein broadly
covered and critically analysed However in-depth discussions about the
relevant literature to the kinetic methodologies developed during this project are
highlighted in Chapter 21 Furthermore as these kinetic methodologies feature
significant use of optimisation algorithms discussions regarding optimisation
problems and common algorithms are also found in this introductory chapter
This coverage depicts the general relevancy of different types of algorithm to
particular circumstances with specific kinetic fitting algorithm discussions
featured in Chapter 2222
11 Continuous flow chemistry
Continuous flow chemistry is rapidly becoming the optimum way to conduct
a wide variety of different chemical reactions This section introduces the concept
of flow chemistry featuring a discussion of the advantages and disadvantages
as well as when to adopt this methodology This broad introduction also covers
different reports from the literature pertaining to different classes of reaction in
flow as well as how these reactions can be analysed and optimised either on-
line or off-line
111 Batch and flow reactions
To discuss flow chemistry it is first important to understand the
differences between this methodology and traditional batch chemistry Batch
reactions are still the lsquonormalrsquo bench practice today after being standardised 200
years ago in the time of Friedrich Wӧhler as there are still advantages to
20
conducting synthesis this way This batch reaction approach to synthesis
whereby the chemistry is conducted essentially in a vessel is historically the
most fruitful and rewarding approach in terms of discoveries Suzuki couplings[1]
Sonogashira couplings[2] and the Wittig reaction[3] among hundreds of other
ground breaking mechanisms were all discovered via batch reactions A flow
chemistry regime differs in that there is no bulk reaction medium in a vessel By
using pumps tubing and differing flow reactors small volumes of reaction
medium are constantly flowing and reacting to provide a continuous outlet stream
of reacted material Although this flow methodology has been known for a
relatively long time the historic uptake in synthetic laboratories has been low[4]
However as flow technology improves and becomes easier to adopt in the
laboratory[5] it is increasingly important to evaluate whether a particular chemical
process would be most efficient in batch or flow regimes in terms of product
output or otherwise
For example when considering exploratory synthesis in contrast to batch
using flow chemistry consisting of tubing and microreactors to attempt to
discover new syntheses by exploring discrete options is not typically a good
application[6 7] This is because the main strengths of flow processes come
mainly from already existing reaction pathways where optimising product output
is the focus and to construct a flow system to conduct a purely exploratory
reaction is a traditionally inefficient use of time whereas batch can be
implemented much faster In recent years however high throughput flow
systems have been developed for automated discovery[8 9] Unfortunately
though as the equipment for this type of discovery is specialist and can be
expensive it can still be argued that simple exploratory benchtop batch reactions
are still much more efficient in terms of time and cost
There are other general instances where batch is often still favourable for
chemical transformations for example when precipitation drives reaction
completion[7] In batch this isnrsquot an issue however when using a flow setup this
will frequently result in channel mixer or pressure regulator clogging - this is also
true when using high viscous liquids[10] As a general rule precipitation
suspensions and other instances where solids are used can lead to
complications in the process - this can be mitigated through reaction dilution but
may then suffer from low productivity The introduction however of standardised
21
laboratory equipment (such as miniaturised CSTRs Freactors) for continuous
flow can then facilitate such multiphase processes to allow maintained
efficiency[11 12]
Despite some of these limitations there are significant benefits to
continuous flow processes which have become apparent alongside the
tremendous practical advances in recent years many of which have been
utilised in actually transferring batch processes into flow as more and more
batch procedures are superseded[13-15] Reduction of reaction times[16 17] and
increases in conversion and selectivity may be observed by transferring to flow
processes[18] This may be for a number of reasons but is likely due to the
increased mass transfer that can be expected from flow systems as well as the
ability to increase the temperature of the reaction medium further past the boiling
point of the solvent which is discussed further in Chapter 1121 This will lead
to an overall increase in both the reaction rate and productivity Two examples
are shown herein where increased conversion was observed Scheme 11
reports the synthesis of hexene from hexanol in flow by Wilson and McCreedy[19]
with a conversion of around 90 whereas in conventional batch reactors this
reaction conversion does not exceed 60 Most notably there was no
degradation of the performance after three days of continuous use which may
be expected from a fixed bed catalyst Scheme 12 shows another direct
comparison of conversion in flow and batch by Wiles et al[20] where the Michael
addition is completed in 20 minutes with 100 conversion in flow compared to
the reaction completion in 24 hours with 89 conversion in batch
Scheme 11 The conversion of hexanol 11 to hexene 12 in a continuous flow setup[19]
22
Scheme 12 The flow synthesis of the adduct 15 via a Michael addition between the
dicarbonyl 13 and the alkyne 14[20]
A main advantage to using flow chemistry setups to perform reactions
arises from the equipment featured within the setups themselves - namely the
pumps Pump flow rates can be set to very precise flows which can very
accurately deliver particular ratios of reagents at given points along the flow
setup[21-23] This ensures that the correct stoichiometry of the reagents is present
in the reaction and these exact stoichiometries can be delivered continuously
and with minimal error[21 24] This allows for optimisation and kinetics studies with
precise reagent additions that would otherwise be troublesome for an
experimenter to consistently and dependably deliver These same flow rates also
ensure that the residence time is exact and consistent meaning sampling points
are reliably accurate in sampling the reaction medium after a specific reaction
time[25 26] This point however is highly dependent on the mixing regime present
which is discussed further in Chapter 31
Another noteworthy advantage to flow processes is that a large number
of reactions can be executed and hence a large amount of data can be obtained
using only minimal quantities of a reagent in flow This is because much less
reagent is required for reaction and subsequent on-line analysis in a microreactor
compared to bench scale batch setups This is a particularly desirable attribute
of a system if you have an expensive material or a material that is synthesised
by a time consuming process where you need to be conservative with its use
but still obtain lots of experimental data[24]
One example of a reaction that has been successfully transferred from
batch to flow is a multi-step synthesis of ibuprofen 18 conducted by Bogdan et
al[27] This synthesis demonstrates that even flow processes with multiple steps
can be achieved without intermediate purification steps in a streamlined and
efficient manner This is provided as long as care in the reaction chronology has
been undertaken ensuring excess reagents and byproducts from previous steps
are compatible with downstream processes shown in Scheme 13 This
efficiency is important when creating complex molecules because although the
stepwise batch reactor processes are effective they are also very wasteful
particularly when they involve consecutive work-up procedures An example of
this is in the pharmaceutical industry where in general 25 - 100 kg of waste is
23
produced for every 1 kg of complex molecule[28] However to facilitate reaction
compatibility expensive or atom-inefficient transformations may be necessary
such as the use of phenyl-iodine(III) diacetate and TMOF to incur a chemical
rearrangement in the reported ibuprofen synthesis below This may require a
careful balance to achieve green metrics in product manufacturing Further
discussion on reaction telescoping is provided in Chapter 1126
Scheme 13 The multistep continuous flow synthesis of ibuprofen 18
In large scale batch reactor design used in industry the most significant
problems to be overcome are the heating and agitation of the system and it has
even been reported that processes cannot be scaled up further due to
temperature and mixing gradients[29] This problem relates to the fact that it is
difficult to effectively heat and agitate a large mass completely uniformly which
can lead to different reactivities present at different points within the vessel - this
can result in decreased product yield due to an increased rate of side reactions
or more seriously a runaway reaction when exothermic processes are
involved[30 31]
By contrast mesoscale flow systems (channel diameter 1 - 10 mm) and
in particular miniaturised flow reactors (channel diameter 50 - 1000 microm) are
excellent at efficiently heating and mixing reactants[32] Rapid heating of reaction
microchannels through the walls of a preheated reactor ensures the reaction
mixture is thoroughly and uniformly heated and mixed which is attributed to the
24
large surface area to volume ratios of the microchannels[18 33] This heating can
be achieved by oil baths conventional ovens or even microwave heating all of
which achieve the same goal which is precise temperature control with
increased safety[34-36] The high molecular diffusion across the relatively narrow
microchannels allows assumptions of perfect cross-sectional mixing in a lsquoplug
flowrsquo regime[37] (see Chapter 31) and mass transfer can further be improved
through the use of static mixers[38] or CSTRs[39]
This increased safety in flow reactors is attributed to only a small amount
of reaction material present in the reactor at any one time enclosed within a
tubular vessel Therefore although the chemical exposure is the same during
reservoir preparation the experimenter is not exposed to any harmful material
during experimentation as long as all inlets and waste streams are properly
contained The is advantageous especially in processes where there are highly
exothermic steps alongside even the possibility of scale-up of formerly non-
scalable reactions[36 40] This scalability can be achieved simply by running one
flow reactor for a long period of time or several identical flow reactors in parallel
in a process called lsquonumberingrsquo - any number of flow reactors can be lsquonumbered
uprsquo to achieve the required throughput[41-43]
112 Reactions in flow
Alongside the aforementioned general advantages that flow processes
have over batch there are several distinct reaction niches which have specific
facets whereby translation to flow has distinct benefits There are many different
areas where continuous processes have helped to transform research as well
as industrial processes that may branch from them This literature review will
focus only on the most common types of reaction in flow in which most reactions
are likely to encompassed Also refer to flow chemistry reviews on polymer
chemistry[44] the use of extreme temperature[45] and slurry reactors[46]
1121 Temperature-accelerated reactions
Temperature-accelerated reactions are the most basic and most common
use of flow setups whereby reactants are fed into a heated microreactor to
perform a chemical transformation The use of flow enables access to higher
temperatures in a system with excellent safety which means that reactions can
be performed which would otherwise be too slow or unobtainable in other
25
systems Temperature-accelerated reactions in a traditional batch setup are
often limited by the laboratory equipment and the boiling point of the solvent and
having to switch to different higher-boiling solvents can lead to complications in
both the reaction and the purification[47 48] High-pressure batch vessels can be
used to facilitate these higher temperature reactions (such as Parr reactors or
autoclaves)[49] but additional equipment and safety considerations must be
made in these cases
However in flow setups there is no need to give significant consideration
to changing the solvent as the boiling of the solvent can be suppressed in most
cases by the use of a back-pressure regulator[50] Therefore when conducting
these reactions where higher temperatures can be accessed in flow setups the
reaction rates are also generally higher[14] This alongside the aforementioned
increased associated safety in using flow setups can make flow a desirable and
convenient option for temperature-accelerated reactions Scheme 14 and
Scheme 15 show examples of temperature-accelerated reactions that have
been conducted in flow where in both cases the temperature of the reaction was
conducted at a higher temperature than the boiling point of the solvent leading
to decreased reaction times [51 52] It is also worth noting that unless explicitly
stated a back pressure regulator will have been used in all schemes in this
literature review if the temperature of the reaction exceeds the boiling point of
the solvent used
26
Scheme 14 The temperature-accelerated SNAr reaction of 19 with 110 to form 111 in THF
(boiling point 66 degC) under flow conditions[51]
Scheme 15 The Fischer Indole synthesis of 114 from the hydrazine 112 and dihydrofuran
113 in methanol (boiling point 65 degC) using a flow setup[52]
1122 Supercritical fluid
The use of supercritical fluids (SCFs) as solvents in flow processes have
attracted attention in the past 30 years mainly motivated by the prospect of
replacing toxic industrial solvents[53] For example the environmental interest of
using supercritical CO2 or H2O ushers in opportunities for greener chemical
processes by replacing some of the more harmful solvent systems[54-56] This is
an admirable objective for process chemists and can lead to cleaner and more
sustainable reactions[57]
Whilst the green aspects of using SCFs are attractive perhaps the
greatest quality they possess are their physiochemical ldquohybridrdquo properties an
intermediary between liquids and gases whereby properties can be finely tuned
by marginal variations in temperature and pressure As a result SCFs exhibit
gas-like viscosities as well as no surface tension which are objectively
advantageous in processes involving interface and surface chemistry[58-60]
Furthermore the liquid-like densities allow for substantial dissolution of
precursors within the SCF and diffusion coefficients are generally at least 100
times greater in SCFs than in liquids All of these factors contribute towards
processes whereby the reaction conversion is significantly improved as a direct
effect of using SCFs[53 61-63] However the compatibility of these supercritical
solvents must still be tested with the process of interest (as with any solvent) as
there may be solubility or reactivity issues
27
Supercritical CO2 (scCO2) is a common solvent in the realm of SCFs
because of its easily obtained critical parameters at bench scale it is also
extracted easily with high purity as a byproduct from many processes as well as
being non-toxic and non-flammable[64] One of the most notable industrial scale
applications using scCO2 is the hydrogenation of isophorone 115 shown in
Scheme 16 which obtains 116 in a sufficiently pure state without any
downstream purification[65] Another common process developed from the use of
scCO2 by taking advantage of the non-toxicity of the solvent is the
decaffeination of coffee beans which has since become one of the most popular
decaffeination methods[66 67]
Scheme 16 The hydrogenation of isophorone 115 to TMCH 116[65]
One major problem with using scCO2 in flow processes however is its
incompatibility with primary and secondary amines due to carbamate formation
which can precipitate out of solution and therefore block any microchannels in
the system[68] Other supercritical solvents can be used in these cases such as
scNH3 although this presents a problem in itself that it cannot be used with
aqueous solutions because of ammonium hydroxide formation - nonetheless
supercritical ethane and propane have been used as direct replacements for
scCO2 due to similar critical parameters[69]
Using continuous reactors for SCFs have the advantage over batch
reactors that they do not require depressurisation to add further material to the
process or recover products Also a predominant advantage to using continuous
reactors is that reaction parameters such as temperature flow rate and pressure
can all be changed almost independently of each other In context this ability
allows the properties of the SCF to be altered in real time when optimising
reactions which cannot be done easily in batch reactors - this versatility of
continuous reactors makes it the favourable choice when working with SCFs[70]
1123 Photochemical reactions
28
The use of photons at given wavelengths to provide sufficient energy to
overcome activation energy barriers is the basis of photochemical reactions
complex molecular structures can be achieved via these unique reaction
pathways that are otherwise unobtainable via thermochemical or electrochemical
methods[71 72] Implementing photochemical reactions is also beneficial as a
photon is a ldquogreenrdquo reagent which is traceless and thus doesnrsquot require
removalrecycling in the same way many other reagents do
Photochemistry is not regarded only as a unique and novel pathway to
molecules with exotic structures however - one example of where
photochemistry is used extensively in industry is in the Toray process to attain
caprolactam which is used to manufacture Nylon 6[73] Photochemical reactions
have also been found to benefit from continuous flow systems where large-scale
photochemical synthesis is significantly more effective when compared to their
corresponding batch approaches[74] This is due to problems regarding
penetration into the bulk reaction medium which is an important boundary that
has to be overcome Most of the photochemical synthesis occurs within a short
radius of the lamp meaning the reaction conversion is scale dependant The
small tubular diameters in flow systems take advantage of this by exposing the
entire reaction medium to the light source as it passes through the reactor[75]
One example where a photochemical reaction has been implemented into
a flow process is reported in the continuous [2 + 2] photocycloaddition producing
the cyclic product 118 shown in Scheme 17 [74] In this reaction the conversion
is quoted at 83 and because the reaction conversion is scale independent the
continuous process can be run indefinitely to produce over 500 g per 24 hour
period This process can then be scaled up further as in any continuous flow
process by numbering up
29
Scheme 17 The [2 + 2] photocycloaddition of malemide 117 with 1-hexyne to produce the
cyclic product 118[74]
1124 Electrochemical reactions
Electrochemistry is another clean and efficient reaction method in the
realm of organic synthesis where the electricity supplied to the reaction system
induces the formation of the reactive intermediates from neutral substrates This
method of reaction has significant advantages to conventional batch processes
one of which being that harmful oxidising and reducing agents can be substituted
using electrochemistry By applying precisely controlled current between two
electrodes reactions can be achieved by using milder reagents This method
allows milder reagents as electrons can be addedremoved without the need for
chemical reducingoxidising agents which could complicate the reaction
especially in flow systems where downstream processes can be highly affected
by excess chemical reagents[76] Also as the electrons are the ldquoreagentrdquo in these
reactions as well as being widely and readily available electrochemical reaction
pathways become cheaper and less labour-intensive as alternative costly
reagents donrsquot need to be used[77]
One example of where electrochemical synthesis in flow has been
observed is in the anodic substitution reaction by Horii et al [78] shown in scheme
18 with yields of up to 74 In flow processes such as this the laminar flow
regime is used as an advantage - two inlets of separate flows join together in the
reaction vessel where their respective microchannel sidewalls are anodic and
cathodic opposite to one another This ensures the dominant oxidation of the
substrate 119 to form a cationic intermediate whilst the nucleophile 120
diffuses across the tubular diameter to react to afford 121 [79] Laminar flow and
other mixing regimes are discussed further in Chapter 31
Scheme 18 An electrochemical facilitated nucleophilic substitution reaction to afford the
product 121[78]
1125 Enzymatic reactions
30
Biocatalytic processes are also an area in which research is continuously
progressing in order to develop alternative process routes to the synthesis of fine
chemicals The main issues however arise from enzymes only being able to
operate efficiently in narrow pH and temperature ranges with many organic
substrates having poor solubility in water However implementation of enzymes
whilst using non-aqueous solvents can dramatically improve their applicability[80
81] Within biochemical processes this niche can be important in achieving
reaction optimisation despite given limitations with using biocatalysts
The use of immobilised active enzymes in the column of a flow system is
very attractive and there are many reports in the literature of applied
processes[82 83] An example of this is the continuous process of chiral
cyanohydrin formation shown in Scheme 19 where a column is packed with
defatted almond meal[84] There are also examples where multiple columns with
different immobilised enzymes are used as a multistep continuous process in
order to reach the desired product - one example is reported where 7 separate
columns with differing enzymes achieve the synthesis of UDP-galactose from
inexpensive starting materials[85] This is shown in Scheme 110 as a simplified
one column synthesis with multiple enzymes This also shows how
advantageous immobilised biocatalysis can be in multistep synthesis as there
are no catalysts or harmful reagents that can affect downstream processes
Scheme 19 An enzyme catalysed continuous cyanohydrin formation forming 123[84]
Scheme 110 Multiple enzymatic catalysed continuous process to form UDP galactose
125[85] Individual enzymes stated
1126 Telescoped reactions
31
When considering a total synthesis for a pharmaceutical ingredient or
otherwise it would be ideal to limit the number of steps and hence the amount
of waste time and resources This can be achieved in one way by reaction
telescoping[24] Reaction telescoping is essentially performing multiple chemical
transformations to a molecule sequentially without the need for the purification
of intermediates or removal of waste for example the lsquoone-potrsquo synthesis of
pyridine and quinoline derivatives in batch reported by Kobayashi et al[86]
There are further advantages however to reaction telescoping in flow
that are not observed in batch Using a flow system allows the introduction of
reagents in exact stoichiometries at specific points in the reaction cycle simply
by addition via inlets further down the line within the system Pairing these
additions with differing fixed-temperature reaction vessels also allow for isolated
reaction optimisation for each step along the flow setup in a multi-step synthesis
An example of a multi-step reaction where the success of the synthesis is
attributed to the effective residence time and temperature control of each step is
shown in Scheme 111 in the synthesis of 127[87]
Scheme 111 The multi-step flow synthesis of 127 from coupling o-dibromobenzene 126
with varying electrophiles via sequential halogen-lithium exchange reactions[87]
The main drawback of reaction telescoping is that downstream
transformations have to be compatible with side products and waste from
upstream reactions as any incompatibility leads to a lesser conversion of any
intermediates This serves as a hindrance to the other transformations down the
line hence leading to poor conversion for the overall process Therefore when
considering reaction telescoping great care must be taken into account for
reagent compatibility and reaction chronology
A further advantage to using a flow system however is the opportunity of
in-line purification which can solve reagent compatibility issues - this gives
32
greater accessibility to a variety of different reactions that can all be
accomplished in a single process This in-line purification is made possible by an
in-line liquid-liquid separator such as the separator reported by Zaiput Flow
Technologies that allows immiscible liquids to be separated into two streams
one organic and one aqueous via filtration using a hydrophobic membrane[88]
This separator is shown in Figure 11 An example where a membrane
separation has been used shown in Scheme 112 is in an ibuprofen multi-step
synthesis where Snead and Jamison improved on previous work aforementioned
by Bogdan et al[27 89] This in-line separation avoided the need for triflic acid and
increased the yield to 98 by incorporating this aspect within the process
Flow in
Two separated flows out
33
Figure 11 An annotated picture of an in-line liquid-liquid separator developed by Zaiput Flow
Technologies
Scheme 112 A multi-step flow synthesis of ibuprofen 18 involving an in-line purification
step[89]
There are also several other methods of in-line purification that can be
considered alongside or instead of liquid-liquid separation Gas-liquid
separation[90] micro-distillation[91] solid-supported scavenging[50] and gravity-
based separation[92] have all been reported in the literature but have not be
covered in detail as these methods are not well established
113 Reaction analysis
Reaction analysis in benchtop batch processes are relatively time-
consuming and labour-intensive as samples must often be removed by hand
from the reaction mixture to determine reagent conversion product composition
etc Therefore the elimination of these practices and adoption of their respective
flow processes has many potential cost benefits particularly in fine chemical and
pharmaceutical production[93]
On the other hand for these same methods of analysis the sampling
process can be fully automated by the use of sampling valves A sample valve
34
is a device attached to the line of a flow system where the reaction mixture
passes through undisturbed as if it was an extension of the tubing however there
is a lsquoswitchingrsquo mechanism whereby the flow is diverged from its path into a
separate flow system instantaneously then the original flow is restored
milliseconds later This diverted flow then leads to an analytical system (HPLC
mass spectrometer etc) and has much thinner tubing with a constant mobile
phase flowing ready to carry the injected sample to the analytical equipment
This sampling is termed lsquoon-linersquo as the flow is rerouted from the flow along the
reactor lsquoIn-linersquo therefore refers to sampling without the need to divert reaction
material and is typically non-destructive In all cases great care must be taken
in calibrating the machine to chemistries of interest as quantitative analysis can
often only be performed by calibrating the response of the equipment to known
standard concentrations of each chemical species
This section will report on reaction analysis in flow by the use of well-
established and common techniques such as mass spectrometry and high-
performance liquid chromatography (HPLC) as well as fast developing and high
interest areas such as NMR and IR In each case the system is assumed to be
at lsquosteady-statersquo in which the flow output is consistent - this is explained in detail
in Chapter 31 Also refer to specific papers covering onin-line analysis by UV[94
95] Raman[96] fluorescence[97] GC[98 99] XAFS[100] and NIR[101-103]
1131 Mass spectrometry
The use of mass spectrometry in reaction analysis is a common technique
and when coupled with flow systems on-line mass analysis can be employed to
qualitatively and quantitatively monitor reactions for the identification of products
and intermediates as well as analysis of relative composition[104-106] All of this
can be performed in real-time due to the short method times and is ideal in the
context of reaction monitoring as lots of information can be gained from the mass
spectrometer with little need for data manipulation[107]
An example where mass spectrometry has been used for on-line analysis
in order to monitor reactive intermediates in flow is in the formation of benzyne
132 shown in Scheme 113[108] This experiment was conducted to show how
mass spectrometers are ideally suited to on-line analysis applications although
35
they are rarely used in this way as traditional mass spectrometry instruments are
too large and bulky to be conveniently coupled to flow systems
Scheme 113 A reaction scheme showing the formation of benzyne 132 which was followed
by analysis via mass spectrometry[108]
1132 HPLC
HPLC can also give very good qualitative and quantitative analysis of a
reaction mixture - however the advantage that HPLC has over mass
spectrometry is that it is typically easier to quantify the individual components of
a mixture[109] This is a particularly useful characteristic for modelling the kinetics
of a reaction as the relative abundancies of products from a reaction can be
measured precisely by their peak areas in the chromatograph at different
times[110] as well the ability to differentiate molecules with the same mass and
even different isomers of the same mass
An example where the kinetics of a reaction were studied using the coupling
of a flow system with on-line HPLC is in the thermal isomerization of the endo
molecule 133a to its exo counterpart 133b shown in Scheme 114[111] This
example shows how combining on-line HPLC with an automated flow system
with varying pump flow rates and temperature can lead to an understanding of
the factors influencing yield and purity of a process with the ability to provide
useful data to be utilised for generating response surfaces shown in Figure 12
36
Scheme 114 A reaction scheme showing the thermal isomerization of 133a to 133b which
was followed by analysis via HPLC[111]
Figure 12 The response surface showing temperature and residence time effects on the
thermal isomerisation of 133a[111] Reproduced with permission
1133 IR
The use of in-line IR analysis in flow systems is different as it is not
quantitative in the same respect as mass spectrometry or HPLC IR rather
detects the relative abundancies of particular species by monitoring individual
peak signals The advantage to in-line IR is that key identifiable peaks from
functional groups in an IR spectrum (O-H bonds C=O bonds etc) can be
tracked over time as disappearance or appearance of peaks can serve as an
indicator of reaction completion[112-114] IR analysis is fundamentally non-
destructive which in the context of a flow system means that in-line IR analysis
has been developed and integrated into systems which do not require samples
to be removed from the flow a truly continuous non-interrupted stream but still
continuously analysed by IR[115-117]
An example of where in-line IR analysis has been used to monitor the
completion of a reaction is in the fluorination reaction to yield 136 shown in
Scheme 115[112] The in-line probe brand used was the ReactIR In this reaction
the region where C-F bonds are expected to absorb was monitored during the
reaction in order to establish a reaction completion trend based on the intensity
of the peak produced - this is shown in Figure 13
37
Scheme 115 A reaction scheme showing a fluorination reaction yielding 136 which was
followed by analysis via in-line IR[112]
Figure 13 An IR absorption showing the detailed rise of the C-F bond peak over time
indicating the extent of reaction completion[112] Reproduced with permission
1134 NMR
The use of on-line NMR is also a good quantitative option for flow system
analytics The potential to incorporate high resolution NMR systems into a flow
system to show both structural and conformational changes in chemical
transformations is a desirable potential analytical technique At current generally
only small low-field systems have been developed to be conveniently coupled
with flow systems However this technique thus far has led to the increased
value of using NMR spectroscopy as a non-invasive method as more process
development applications are available[118] Although there are some reports of
using high resolution on-line NMR[119 120] most cases generally utilise low field
NMR systems The low resolution analytical technique is unlike traditional NMR
analysis in a high resolution system (gt 300 MHz) as low-field systems tend to
38
analyse the relaxation times and relaxation weighted signals to identify product
[121]
The main downside to this technique is that as the resolution is often too
low for accurate interpretation of NMR spectra because of small differences in
chemical shifts therefore it is difficult to use for multi-component reaction
analysis[122] However there are examples where this technique has been useful
In a report by Goldbach et al[123] low field on-line NMR was used to monitor the
reagent and product concentrations of the Grignard reaction shown in Scheme
116 This reaction conversion was monitored by peak areas in the aromatic
region over time shown in Figure 14 where over 90 conversion was reported
by the examination of peak appearance and disappearance
Scheme 116 The Grignard reaction that was tracked by on-line NMR[123]
Figure 1 4 The on-line NMR analysis in the aromatic region of the Grignard reaction shown in
Scheme 116 at different time intervals[123] Reproduced with permission
1135 Summary
There is no best method of flow reaction analysis as each individual case
would benefit from an independent examination of the necessary results to be
generated This is because different reactions and outcomes would be more
suited to different analytical systems A table summarising these main analytical
methods as well as other methods with their respective sensitivities acquisition
speeds and limitations are shown in Table 11[124]
39
Table 11 A table summarising reaction analysis techniques in flow systems adapted from
Houben and Lapkin[124]
Technique Type of
information
Sensitivity
mol
Typical
speed of
acquisition
s
Limitations
Mid-IR
Chemical
identity
concentration
~10-1 ~1
Steps have to be
taken to tolerate
water within the
system
Near-IR
Chemical
identity
concentration
~10-1 ~1 Less information
than Mid-IR
Raman
Chemical
identity
concentration
crystal structure
~10-1 ~1-100
Fluorescence
masking Raman
signal
UV-vis
Chemical
identity
concentration
~10-4 lt1 Limited number of
species
NMR
Molecular
structure
concentration
~10-3 ~10
Flow method is
currently limited in
sensitivity and
resolution
GC Concentration ~10-6 10-1500
Typically slow
cannot identify
unknown compounds
HPLC Concentration ~10-6 200-1500
Long method times
must be combined
with mass spec for
proof of molecular
identity
Mass spec
Chemical
identity
concentration
~10-8 ~5-20
Requires
chemoinformatics
expertise
40
114 Continuous flow chemistry summary
Flow chemistry is a powerful methodology that can be employed to obtain
enhanced reaction control over similar batch processes increased heat and
mass transfer accurate residence times and precise continuous addition of
reagents These advantages alongside automated sampling procedures mean
that this regime is an ideal methodology for generating time-series data for the
purposes of this project As kinetic studies benefit from this additional control as
well as further hardware-manipulation techniques discussed in Chapter 31 that
are not possible in batch continuous flow will be used when possible However
not all of the identified niches of flow will be exploited for this project such as
SCF usage electrochemistry etc and have been covered as a holistic overview
of the field
Flow chemistry is not the answer to every case study and itrsquos likely that
there will be instances where chemistry is better suited to batch conditions
however Each chemistry must be evaluated to see if the study would more
appropriate for a flow or a batch regime For totally homogenous systems or for
very fast reactions it is likely that a flow system would be used for the generation
of kinetic data For experimental case studies that require sampling of a
suspension in a reaction medium it is likely that a batch system would be more
appropriate In any case the availability of an automated flow system is very
useful (Chapter 32) and unlocks powerful reaction control that can be difficult to
obtain in batch but batch systems must be employed if the chemistry requires it
12 Kinetic methodologies
The kinetic methodologies applied in this project are computational which
utilise ordinary differential equations (ODEs) to describe kinetic models as well
as optimisation algorithms to maximise the convergence of these ODE curves to
the experimental data - this is described in detail in Chapter 222 This differs
from traditional analytical techniques used more generally in chemistry as well
as specific applied methods in determining reaction order described herein
These methods although useful are difficult to scale as they require user input
and at times qualitative analysis which are not suitable for automatic kinetic
information determination Furthermore these methods may struggle with
41
complex reaction systems or systems with loss of mass balance For these
reasons these methods are covered to describe common kinetic analysis
techniques but are not utilised in this project
121 Conventional methodologies
There are several conventional but considered outdated methodologies
to determining kinetic information that are still employed The most basic
analytical solutions for simple reactions can still be powerful in identifying
reaction order and rate constants[125 126] Consider the first order reaction of
species A reacting to form species B shown in eqn 11 The change in the
concentration of A as time progresses can be described as a differential
equation eqn 12 which can then be integrated to give the integrated rate
equation eqn 13 This integrated rate equation can then be used to determine
the concentration of A at any reaction time and a plot of ln[A] vs time allows the
determination of the rate constant as shown in Figure 15 This method also
allows qualitative confirmation of the reaction order as the experimental data
points should fit to a linear line
Where
bull A = starting material
bull B = product
bull k = rate constant
bull [A] = concentration of A
bull t = time
bull [A]t = concentration of A at time t
bull [A]0 = initial concentration of A at t = 0
119860119896rarr119861 eqn 11
119889[119860]
119889119905= minus119896[119860] eqn 12
ln[119860]119905 = minus119896119905 + ln[119860]0 eqn 13
42
Figure 15 A graphical representation of generated time-series data for a first order reaction
shown in eqn 11 The data is log-transformed to give a linear fit where the gradient is
equal to the rate constant multiplied by -1
If the plot of ln[A] vs time does not produce a linear fit then it is likely that
the reaction order is not 1 with respect to A and may be zero order second order
or even another non-integer order To deduce if the reaction is zero order the
reaction can still be viewed as eqn 11 but the rate of change of A must be
described differently as the zero order reaction is not dependant on the
concentration of A at any time Therefore this differential equation can be
described as eqn 14 which can then be integrated to give the integrated rate
equation eqn 15 A simple plot of [A] vs time deduces if the reaction is zero
order as a linear fit indicates this where the rate constant can also be identified
as shown in Figure 16
119889[119860]
119889119905= minus119896 eqn 14
[119860]119905 = minus119896119905 + [119860]0 eqn 15
43
Figure 16 A graphical representation of generated time-series data for a zero order reaction
shown in eqn 11 This data does not need to be transformed as the linear fit is equal to
the rate constant multiplied by -1
If the reaction is second order with respect to A the rate of change of A
must be described as in eqn 16 which when integrated gives the integrated
rate equation shown in eqn 17 A plot of 1[A] vs time then allows the chemist
to deduce that the reaction is second order if a linear fit is obtained The gradient
of this linear fit can then be ascribed as the rate constant as shown in Figure
17
Figure 17 A graphical representation of generated time-series data for a second order
reaction shown in eqn 11 This data is plotted as the reciprocal of the concentration vs
time and the gradient of the linear fit to this data is the rate constant
If the reaction is more complex and features bimolecular reactions of
different species such as the reaction shown in eqn 18 then there are two
possible scenarios that may be considered to determine the rate constant and
confirm the reaction order The first scenario is where the initial concentrations
of species A and species B are the same In this case the rate of change of A
can be written as eqn 19 However at any time [A] = [B] meaning that the
scenario mimics the second order reaction illustrated in eqn 16 and kinetic
information can be identified by using the corresponding aforementioned
methodology
119889[119860]
119889119905= minus119896[119860]2 eqn 16
1
[119860]119905
= 119896119905 +1
[119860]0
eqn 17
44
The second possible scenario is where the initial concentrations of A and
B are not equal In this case it is useful to define a term x where this relates to
the concentration of each of the species that have reacted at a particular time t
The expression of the rate law then becomes eqn 110 which can be rearranged
to eqn 111
If eqn 111 is then integrated between time zero and t the time of interest
Then integrating by using the method of partial fractions eqn 112 becomes
Substituting [A] for [A]0 - x and [B] for [B]0 - x eqn 113 simplifies to
Therefore resulting in the overall integrated rate equation
Which can be rearranged to obtain
This obtained integrated rate equation shown as eqn 116 can then be
used to determine the rate constant A plot of ln[119861][119860]0
[119860][119861]0 vs time confirms a first
order dependence on both species in the bimolecular reaction if a linear fit is
119860 + 119861 119896rarr 119862 eqn 18
119889[119860]
119889119905= minus119896[119860][119861] = minus119896[119860]2 eqn 19
minus119889119909
119889119905= minus119896([119860]0 minus 119909)([119861]0 minus 119909) eqn 110
119889119909
([119860]0 minus 119909)([119861]0 minus 119909)= 119896 119889119905 eqn 111
int119889119909
([119860]0 minus 119909)([119861]0 minus 119909)
119909
0
= 119896 int 119889119905119905
0
eqn 112
int119889119909
([119860]0 minus 119909)([119861]0 minus 119909)
119909
0
=1
[119861]0 minus [119860]0(ln
[119860]0[119860]0 minus 119909
minus ln[119861]0
[119861]0 minus 119909) eqn 113
int119889119909
([119860]0 minus 119909)([119861]0 minus 119909)
119909
0
=1
[119861]0 minus [119860]0(ln[119861][119860]0[119860][119861]0
) eqn 114
1
[119861]0 minus [119860]0(ln[119861][119860]0[119860][119861]0
) = 119896119905 eqn 115
ln[119861][119860]0[119860][119861]0
= 119896([119861]0 minus [119860]0)119905 eqn 116
45
observed as shown in Figure 18 where the gradient can be used to calculate
the rate constant If a bimolecular reaction is known to occur but this graphing
indicates curvature then itrsquos possible that one or more of the species may have
a reaction order not equal to one Under these circumstances other techniques
must be used to confirm reaction order such as computational approaches to
fitting differential equations which is further described in Chapter 222
Figure 18 A graphical representation of generated time-series data for a second order
reaction shown in eqn 18 where [A] = [B] = This data is plotted as a log-
transformed concentration fraction vs time The gradient of the linear fit to this data is the
rate constant multiplied by the initial concentration of B minus the initial concentration of
A
For kinetic studies involving either biological (enzymatic) or chemical
catalysts the reaction system can still be described by elementary reaction steps
and their respective differential equations If we look at one of the simplest
catalytic systems where an enzyme E binds with a substrate S This is a
reversible binding step where the forward reaction step is k1 and the backward
reaction step is k-1 in which the enzyme-substrate complex ES is formed This
complex can then react to form the product P as well as regenerating the
enzyme catalyst E This reaction is shown in eqn 117 and as before the
differential equations with respect to each of these species are described in eqn
118 - 121
119864 + 119878 1198961119896minus1
119864119878 1198962rarr 119864 + 119875 eqn 117
119889[119878]
119889119905= minus1198961[119864][119878] + 119896minus1[119864119878] eqn 118
46
However although this system can be described in this way it is more
commonly described as approximated models as simple assumptions can
derive a model known as Michaelis-Menten kinetics[127 128] This provides a more
simplistic method of catalytic modelling and prediction by relating the catalyst
concentration to the rate enhancement of a reaction in a different way Michaelis-
Menten kinetics employ the steady-state approximation with respect to the
enzyme-substrate complex ES This means that it is assumed that this complex
will rapidly approach a state where it is generated at the same rate that is
consumed This means that the overall rate of change as described in eqn 122
is zero - this allows a new relationship to be derived between the enzyme
substrate and complex as shown in eqn 123
In order to describe the system as an overall equation relating to the rate
of the reaction we must be able to determine the rate of product formation
shown in eqn 120 However as it is unknown what the free enzyme
concentration is at any point after the reaction has progressed it is more
appropriate to describe the free enzyme E as the total concentration of all
enzyme ET minus the complex concentration [E] = [ET] - [ES] This substitution
into the steady-state approximation derived equation eqn 123 allows the
complex concentration to be described by other concentrations
Followed by expansion
Then rearrangement and factorisation
119889[119864]
119889119905= minus1198961[119864][119878] + 119896minus1[119864119878] + 1198962[119864119878] eqn 119
119889[119875]
119889119905= 1198962[119864119878] eqn 120
119889[119864119878]
119889119905= 1198961[119864][119878] minus 119896minus1[119864119878] minus 1198962[119864119878] eqn 121
119889[119864119878]
119889119905= 1198961[119864][119878] minus (119896minus1 + 1198962)[119864119878] = 0 eqn 122
1198961[119864][119878] = (119896minus1 + 1198962)[119864119878] eqn 123
1198961([119864119879] minus [119864119878])[119878] = (119896minus1 + 1198962)[119864119878] eqn 124
1198961[119864119879][119878] minus 1198961[119864119878][119878] = (119896minus1 + 1198962)[119864119878] eqn 125
47
Then a final rearrangement allows the overall relationship to be described as
Therefore substitution of this relationship into the product formation step in eqn
120 where v is the rate of the reaction relates the overall rate with only the total
enzyme concentration substrate concentration and kinetic rate constants
shown as eqn 129
To now arrive at the familiar form of the Michaelis-Menten equation final
substitutions are made for Vmax and KM shown in eqn 130 producing the overall
equation shown in eqn 131
These terms used in the Michaelis-Menten equation Vmax and KM are
different indicators to what are typically found in other areas of kinetics Vmax
relates to the maximum velocity of the reaction which is independent of substrate
concentration KM is a ratio measure of the breakdown of the enzyme-substrate
complex with relation to the its corresponding formation Different enzymes have
different KM values and can be affected by a range of conditions such as pH and
temperature This equation and other variations when the reaction model differs
(such as enzyme catalysed bimolecular reactions) are commonly used when
studying catalytic kinetics to predict how a system will behave upon changing
concentrations
This model is also useful as the apparent reaction order of the system can
be easily described When the concentration of substrate [S] is very low in
comparison to KM this means that the substrate concentration is deemed to be
1198961[119864119879][119878] = (119896minus1 + 1198962)[119864119878] + 1198961[119864119878][119878] eqn 126
1198961[119864119879][119878] = [119864119878]((119896minus1 + 1198962) + 1198961[119878]) eqn 127
[119864119878] =1198961[119864119879][119878]
(119896minus1 + 1198962) + 1198961[119878]=
[119864119879][119878]
(119896minus1 + 11989621198961
) + [119878]
eqn 128
119907 = 1198962[119864119878] =1198962[119864119879][119878]
(119896minus1 + 11989621198961
) + [119878]
eqn 129
119881119898119886119909 = 1198962[119864119879] 119870119872 =119896minus1 + 11989621198961
eqn 130
119907 =119881119898119886119909[119878]
119870119872 + [119878] eqn 131
48
negligible leading to a direct proportionality between the rate and [S] This
means the reaction appropriates first order kinetics as shown in eqn 132 When
[S] is very large in comparison to KM this means that KM is deemed to be
negligible meaning that the equation cancels any occurrence of [S] leading to
overall zero order kinetics This is shown in eqn 133
Vmax and KM can be determined experimentally by measuring the initial
rates of reaction at varying substrate concentrations After these rates are
determined the graph of reaction rate vs substrate concentration can be plotted
where Vmax is the reaction rate that the curve tends to KM is found via plotting
the relationship of reaction rate to substrate concentration indicated by a curve
whereby KM is equal to the substrate concentration (x axis) when the reaction
rate is half of Vmax (y axis) The experimental determination of these constants is
shown in Figure 19
Figure 19 A representation of Michaelis-Menten kinetics where the initial reaction rate of
individual experiments with differing substrate concentrations x is plotted This plot is
then used to determine the kinetic parameters Vmax and KM
Further development in these Michaelis-Menten kinetic plots then
linearised and simplified this technique leading to a simpler interpretation of the
kinetics as well as easier adoption in determining kinetic parameters This form
of the Michaelis-Menten equation known as the Lineweaver-Burk equation
shown in eqn 134 is simply the double-reciprocal form of eqn 131[129] This
119907 =119881119898119886119909[119878]
119870119872 eqn 132
119907 = 119881119898119886119909 eqn 133
49
allows less complex plotting methods to determine Vmax and KM as shown in
Figure 110
Figure 110 A representation of the Lineweaver-Burk equation where the inverse of the initial
reaction rate of individual experiments with differing substrate concentrations x is
plotted This plot is then used to determine the kinetic parameters Vmax and KM
122 Visual kinetic analysis
In order to identify catalytic reaction behaviour and the order of the
species in these processes different methodologies with the theme of visual
qualitative analysis were developed to allow many scientists to easily extract
kinetic information from their reactions Although the root of these analyses are
still highly mathematical visual kinetic analyses depend on the subjective
analysis of the scientist Therefore precise kinetic parameters cannot be
elucidated however the plots required are simple to construct and easy to
interpret allowing easy determination of the order of the catalystreagents or of
product inhibitioncatalyst deactivation[130]
Reaction progress kinetic analysis (RPKA) employs a checklist to visually
determine this kinetic information efficiently with very few reactions[131] These
reactions which feature in situ measurements are combined with mathematical
manipulations to construct graphical rate equations where kinetic information can
be identified This methodology comprises three different analyses for three sets
of experiments These experiments identify product inhibitioncatalyst
deactivation the order in the catalyst and the order in any of the other
components of the reaction
50
For a product inhibitioncatalyst deactivation probing study curves of
reaction rate vs substrate concentration are compared for reactions that are
started at different points - one with higher concentrations (reaction 1) and one
with lower (reaction 2) This means that although the initial starting material
concentrations are different both reactions at some point will have the same
concentration of all of the starting materials as the other reaction This is true as
long as both experiments have the same difference in the concentration of
reactants referred to as lsquosame excessrsquo experiments Consequently at these
points in the reaction where there are the same concentrations of starting
materials the reaction with the greater initial concentrations (reaction 1) will have
a greater concentration of product as well as a greater number of catalytic
turnovers This means that there are two sets of experimental data where the
reaction profiles should overlay to indicate the lack of product inhibition and
catalyst deactivation A case study where there was shown to be no indication of
inhibitiondeactivation is shown in Scheme 117 and Figure 111[132]
Scheme 117 A Heck coupling of an aryl bromide 140 with 141 to form the adduct 142
This case study showed no indication of product inhibition or catalyst deactivation
51
Figure 111 An overlay of two experimental datasets with the same lsquoexcessrsquo of reactant
concentration for the reaction shown in Scheme 117 This overlap indicates no product
inhibition or catalyst deactivation Reproduced with permission
If these curves donrsquot overlay it can be inferred that product inhibition or
catalyst deactivation is occurring An example of this is shown in Scheme 118
and Figure 112[133] To discern between these two possibilities a third
experiment is required where there is more product added This experiment
should feature the same initial concentrations as the experiment initiated at lower
concentrations (reaction 2) but the reaction should also feature the same
product concentration as generated by the other reaction until this point This
results in two reactions that are identical in stoichiometric composition but vary
in the number of turnovers completed by the catalyst Therefore overlay of these
two reaction profiles indicate product inhibition whilst no overlay indicates
catalyst deactivation
Scheme 118 The epoxide opening of 143 to form 144 using a catalytic system This case
study indicates some product inhibition or catalyst deactivation
52
Figure 112 As there is no overlay in the two experimental datasets with the same lsquoexcessrsquo of
reactant concentration in the reaction system shown in Scheme 118 this indicates
some product inhibition or catalyst deactivation A further experiment is necessary to
determine what is occurring Reproduced with permission
To then use RPKA to elucidate the order in catalyst the datasets of
different reactions run with different catalyst concentrations are plotted as
rate[cat]γ vs substrate concentration The value of γ is changed until all of the
curves overlay - this value is then the correct order in the catalyst Similarly for
determining the order in a given reactant ldquoBrdquo the datasets of lsquodifferent excessrsquo
reactions are obtained ie where all concentrations are constant apart from the
specific substrate of interest in this case reactant B The profiles are plotted as
rate[B]β vs [A] and the value of β is altered until the curves overlay This value
of β then indicates the correct order for reactant B A reported example of an
alkylation reaction shown in Scheme 119 was analysed in this manner to
determine the order with respect to Et2Zn 146 by performing lsquodifferent excessrsquo
experiments as shown in Figure 113a This data was then plotted using this
methodology in Figure 113b to confirm the reaction order of this species to be
1[131]
53
Scheme 119 A nickel-catalysed alkylation reaction of chalcone 145 with Et2Zn 146 to form
the adduct 147
Figure 113 Graphical rate equations for the alkylation reaction shown in Scheme 119 a)
Standard graphical rate equation b) Using the RPKA methodology to observe any
overlap in the lsquodifferent excessrsquo reaction curves This overlap indicates that the reaction
order of Et2Zn is 1 Reproduced with permission
Another form of visual kinetic analysis Variable Time Normalisation
Analysis (VTNA) has also been reported to determine this same information by
utilising exclusively concentration-time reaction profiles[134 135] This technique
may be preferential to RPKA as this data is typically more readily available from
54
the use of almost any reaction monitoring technique when compared to the data
handling necessary to extract rate information
To identify product inhibition or catalyst deactivation the reaction profiles
of two or more reactions are examined where the reactions have different
starting concentrations - these datasets are both plotted together The profile of
the reaction with the lower initial concentration of starting materials is then shifted
on the time axis until the first data point overlaps with the second (higher initial
concentrations of starting materials) reaction profile If there is an overlay of the
two concentration profiles at this point this suggests that there is no product
inhibition or catalyst deactivation present in the system This procedure is
highlighted in Figure 114[130] However a lack of overlay indicates that one of
these scenarios is present and a third experiment must be conducted to
determine the cause of this lack of overlay This third experiment must contain
added product in the same way as previously mentioned for the RPKA
methodology where an overlay of this new curve with existing data indicates
product inhibition and the converse outcome indicates catalyst deactivation
Figure 114 A time shift of the profiles of two reactions to observe overlaying plots This allows
the comparison of two profiles with the same starting material concentrations but
different product concentrations therefore identifying signs of product inhibition or
catalyst deactivation Reproduced with permission
To then elucidate the order in any of the species present two reactions or
more are run with different initial concentrations of this species S but with the
same initial concentrations of all other species The time scale of these reactions
are then replaced with Σ[S]γΔt - this expression is shown in eqn 134[136 137] A
plot of concentration of S vs Σ[S]γΔt is then graphed where the value of γ that
produces an overlay of the reaction profiles is the order in species S in a similar
55
manner to RPKA plotting methods This plotting method can be used for
identifying both the order in catalysts and reactants in a chemical system
Where
bull n = number of experiments
bull i = current experiment
bull γ = order of reaction
bull t = time of measurement
These visual kinetic analysis methods may be used in different
circumstances for the simple determination of reactantcatalyst orders as well
as to identify any occurrences of product inhibition or catalyst deactivation
Where reaction rate information is available RPKA may be used and where
concentration-time data is available VTNA can be used There are many
applications reported by academic and industrial research groups in a wide
range of catalytic reactions using both RPKA[138-140] and VTNA[141-143] Figure
115 shows a summary of the analysis of these techniques with the information
that each technique provides given the particular experimental protocol[130]
sum([119878]119894 + [119878]119894minus1
2)
120574
(119905119894 minus 119905119894minus1)
119899
119894=1
eqn 134
56
Figure 115 A summary of the use of RPKA and VTNA a) catalyst deactivation or product
inhibition b) catalyst order c) reagent order d) catalyst deactivation or product
inhibition e) catalyst order f) reagent order Reproduced with permission
123 Kinetic methodologies summary
Herein reported are several methodologies to determine kinetic
information all of which have become convention to varying degrees and
adopted by many experts and non-experts alike It is because of the large
adoption of these techniques that is why these particular methods have been
covered in this introduction although the usage of them within the context of this
project will be minimal There are many other more complex methodologies
peripheral to this project that although are very powerful in particular
circumstances are not widely adopted by research groups For this reason the
concepts of these methodologies are not introduced but for further reading there
are reports to be found on model-based design of experiments (mbDoE)[144-146]
hybrid modelling[147] and soft modelling[148-150] as well as other more niche
techniques that can be found in the literature[151-153]
These introduced methodologies are unlikely to be used in the context of
this project as many require qualitative assessments or data manipulation by a
user that is difficult to automate Furthermore the analysis of complex reaction
models may become more and more difficult with increasing model terms
meaning that precise kinetic parameters may also be more difficult to determine
These factors produce tough challenges in the context of the main aims of the
project (described further in Chapter 14) as the identification of kinetic models
and parameters cannot be scaled effectively or automated Therefore other
procedures are utilised in answering the challenge of creating a fully autonomous
kinetic model and parameter determination methodology which are introduced
in detail in Chapter 22
13 Optimisation
When searching for the optimum solution(s) to a particular optimisation
problem the best approach in gaining the most amount of information possible
would be to simply measure the response of the optimisation function at every
combination of input parameters at infinitesimally small variations This would
give a complete and perfect insight into the impact of the input parameters on
57
the response meaning that it would be easy for a user to even qualitatively
identify the optimum However as function evaluations can be expensive
(computationally and otherwise) performing this resource- and time-intensive
optimisation is not feasible[154 155] Approximations of this approach can be
performed in some circumstances by applying grid search methodology[156] but
for many applications the number of function evaluations necessary to explore
such a large number of parameter combinations means that this approach is not
viable Due to the fixed-space exploration of these approaches parameter
estimations may also be imprecise
For both efficient and accurate determination of optimum parameter inputs
for a given function it is often appropriate to use an optimisation algorithm These
algorithms heavily vary in their approaches to identifying optimised outputs but
a major criteria that they attempt to fulfil is to obtain this information in an efficient
manner - specifically saving computational time and memory The choice of
algorithm can then depend on the nature of the problem specifically the type of
optimisation (local or global) as well as the nature of the optimisation problem
An algorithm can still generally achieve optimality in many circumstances
however specific algorithms have been found to perform more efficiently in
different situations [157]
Many algorithms can be broadly described as either a local or a global
optimiser Local optimisers are fast can handle large-scale problems and are
widely applicable to many scenarios For this reason they are employed
extensively in a variety of circumstances However in local optimisation the
compromise is to accept that the identified optimum may only be locally optimal
which does not guarantee a result that is globally optimal ie a better function
evaluation than all other feasible points[158] These optimisers also require a
starting point which is a critical difference between local and global optimisers
as this can affect the objective value of the local solution that is found
In global optimisation by contrast the true global optimum of the system is
found The compromise however is often efficiency Global optimisation
algorithms are commonly used where the computational cost of the function
evaluations is not critical This is because the number of function evaluations is
traditionally very high which can also lead to very large computational times[158]
Therefore the choice to use a global optimisation algorithm may be made in
58
circumstances where the value of certifying the true global optimum outweighs
the computational cost to arrive at this identification Careful considerations must
therefore be made in selecting the optimal algorithm based on what is desired in
each scenario
The nature of the optimisation problem itself can also be a large factor in
the choice of algorithm used as some algorithms can identify optima more
efficiently based on the type of problem present[159] Some common optimisation
problems are highlighted in Figure 116 Specific classes of algorithms can then
be utilised in different scenarios Some classes of these algorithms include
linear programming (LP)[160] mixed integer linear programming (MILP)[161]
nonlinear programming (NLP)[162] convex programming (CP)[163] quadratic
programming (QP)[164] and more[158] These algorithm classes can then also be
further separated into discrete and continuous algorithms then further still in
many ways
59
Figure 116 Some different classes of optimisation problem where variable n is an input
variable and the function evaluation is a measure of how the function is minimised with
the changing variable a) Linear optimisation problem b) Convex optimisation problem
c) Non-linear optimisation problem
As it is beyond the scope of this project to compare and discuss classes of
optimisation algorithms classifications are made only on their localglobal
nature Commonly utilised local and global algorithms are qualitatively reported
with reference to further reading for mathematical proofs As this project also
involves heavy use of specific optimisation algorithms (in a black box manner)
those utilised are also introduced qualitatively
131 Local algorithms
Many local optimisation algorithms typically iterate towards an optimum
by using gradients in the response or approximating the local response surface
around the measurements One of the most intuitive and simplest form of
gradient-based algorithm is the steepest descent algorithm that iterates by
performing measurements along the trajectory of lsquosteepest-descentrsquo towards the
minimum[165] An example steepest-descent representation is shown in Figure
117 Shown are two variables on the x and y axes respectively X1 and X2 where
the blue contoured area represents a minimum in the response and the red area
represents a maximum in the response A steepest-descent algorithm initially
takes a guess of the inputs to measure the response The algorithm then runs
exploratory measurements in each direction from the initial guess and calculates
the change in the response for each direction The most favourable direction in
n-dimensional space is identified and measurements continue along this
trajectory towards the minimum until a decrease in the response is observed
The most favourable direction is then identified again until the measurements
can no longer observe a favourable change in the output This terminates the
algorithm as it has converged on a local minimum[166]
60
Figure 117 A representation of a steepest-descent algorithm minimising a 2-dimensional
contoured parameter space where о indicates a measurement Where red areas are
function maxima and blue areas are function minima
Another intuitive gradient-based optimisation algorithm is the simplex
algorithm[167] This method uses convex polyhedra formed of n + 1 vertices
(where n is the number of variables) - an individual polyhedron is referred to as
a simplex The algorithm begins by conducting either user-defined or random
measurements of the response function at particular inputs as shown in Figure
118 in 2-dimensional space where each vertex of the initial simplex represents
a function evaluation measurement The worst performing vertex is then
replaced upon each iteration of the algorithm via a reflection resulting in a new
simplex that explores a new area of parameter space This approach locates
areas with a more optimal response and hence successive simplex iteration
converge on a local optima at point
61
Figure 118 A representation of a simplex optimisation for a 2-dimensional contoured
parameter space where the numbered vertices of each polyhedron indicate a
measurement Where red areas are function maxima and blue areas are function
minima
As shown in Figure 118 the initial simplex comprising of the
measurements 1 - 3 is evaluated via the response function at each vertex The
worst vertex measurement 2 is then replaced via reflection to evaluate the
response function at measurement 4 Similarly measurement 3 is then replaced
by measurement 5 in a further simplex iteration The optimisation typically stops
when a better response function evaluation cannot be found indicating that a
local optimum has been identified - this is illustrated by measurement 11 Further
modifications have also been adapted from this methodology notably the
Nelder-Mead simplex algorithm[168] that allows further geometric transformations
as well as just reflections These transformations are highlighted in Figure 119
Because of the efficient and intuitive nature of these simplex algorithms
particularly the adapted Nelder-Mead variation their use in applications in the
literature are vast the original Nelder-Mead report has over 30000 citations
62
Figure 119 The different geometric transformations of the Nelder-Mead simplex inside
contraction (XIC) multiple contraction (MC) outside contraction (XOC) reflection (XR) and
expansion (XE)
Another notable form of local optimisation methodology is the interior-
point method The interior-point method is a class of algorithm that is very
effective at solving both nonlinear and convex problems by approximating local
regions around measurements as a lsquotrust regionrsquo[157] An initial trust region t0 is
identified around the starting point shown as x0 in Figure XY where the trust
region has an approximated objective function to minimise The gradient of the
trust region determines both how the region is approximated as either linear or
quadratic and also the steps necessary in minimising the approximated
objective function This optimisation is shown as a 1-dimensional minimisation in
Figure 120 where the x-axis is the magnitude of the variable and the y-axis is
the measure of the approximated objective function
63
Figure 120 A 1-dimensional optimisation using an interior-point method The approximate
objective function is minimised for the starting trust region t0
When this initial trust region objective function is minimised a new trust
region around this minimum is then approximated shown as t1 in Figure 121
This new approximated objective function is then also minimised The algorithm
continues to iterate via trust regions along what can be described holistically as
the lsquocentral pathrsquo towards the optimum for the true objective function where no
further improvements can be made This central path can be viewed as an
averaged direction based on the actual algorithm path taken In this example
the is objective function was minimised in the fourth trust region t3 finding the
optimum xbest More detailed algorithmic and mathematical discussions of this
optimisation technique can be found in some of the more relatively recent
reports[169 170]
Figure 121 A 1-dimensional optimisation using an interior-point method The approximate
objective function is minimised for the sequential trust regions until the overall function is
minimised The path that the algorithm can take can be described as the algorithm path
or the central path towards the optimum
132 Global
There is much variation in the methodologies applied by global
optimisation algorithms but one of the most common techniques relates to what
can broadly be described as a genetic algorithm[171] Genetics algorithms perform
computations to search for a global optimum utilising techniques inspired by
64
Darwinian evolutionary biology Although there are many forms of genetic
algorithms the methodology of a simple genetic algorithm (SGA) is qualitatively
introduced herein The six stages of SGA can be categorised as initialisation
evaluation selection crossover mutation and replacement After initialisation
the other stages of SGA are repeatedly iterated until the optimum has been
found which leads to termination of the algorithm The optimum is typically
assumed to be found if the evaluation stage does not produce a better function
evaluation (fitness value) for the given objective function (fitness function)[158]
The workflow of the algorithm is depicted in Figure 122
Figure 122 A depiction of the flow of a simple genetic algorithm
The selection stage aims to find the best parents from the current
population to generate the next population where a population is a collection of
all of the sets of inputs for the given variables and a parent is one potential set
of inputs from this population The parents are often selected simply based on
their fitness value In the crossover stage each individual variable input value
(chromosome) from each parent has a probability of 05 to exist in the resulting
children set Each of the children in the following population then have another
given probability of a random chromosome mutating in the mutation stage This
stage prevents a genetic algorithm from becoming stuck in a local minima After
this cycle has occurred this represents one iteration of the algorithm which then
successively occurs until the optimum has been reached This SGA methodology
is highlighted in the adapted simple example shown in Figure 123 whereby a
fitness function (the sum of all inputs) is maximised by the input of integer
chromosomes[158] The ability of genetic algorithms to obtain an optimised result
65
for a given function is very desirable even with a very large number of input
variables Despite the high computational expenditure to this methodology
requires itrsquos reliability has resulted in high adoption in the general literature for
many applications
Figure 123 A depiction of one iteration of a simple genetic algorithm Figure adapted from
works reported by Boyd amp Vandenberghe[158]
Bayesian optimisation is another category of global optimisation methods
that generally proceed in a more efficient manner than genetic algorithms by
utilising approximated (surrogate) models to optimise expensive-to-evaluate
objective functions[166] Random evaluated data points are initially conducted
then a surrogate model is built to fit these data points as well as a corresponding
acquisition function Bayesian optimisation methods obtain their efficiency from
their use of these acquisition functions which balance exploration of the
parameter space and exploitation of already known high-performing regions of
parameter space[172] This acquisition function is maximised after each iteration
of the algorithm to determine the optimum measurement point to evaluate next
in order to explore parameter space but also attempt to gain a better evaluation
Iterations of a Bayesian optimisation for the minimisation of an arbitrary
function f(x) with respect to the 1-dimensional optimisation of variable x is
shown in Figure 124[166] Two initial measurements are inputted shown as red
dots in the first iteration (i) The surrogate model is fitted in blue where the blue
area indicates the uncertainty in the model The acquisition function is shown in
red with a vertical red line indicating the next parameter measurement to be
evaluated - this evaluation is shown specifically in (i) as another red dot From
the second iteration (ii) there is now enough data to fit 95 confidence intervals
to the surrogate model indicating the regions of highest uncertainty The
66
maximum of the acquisition function again determines the next parameter
measurement As aforementioned this parameter measurement is made based
on the compromise of exploring known regions of high performance and regions
where these confidence intervals are the largest As further measurements are
made in the iterations thereafter (iii) - (viii) the confidence intervals shrink
around areas richer with measurements and the surrogate model gains
confidence in its predictions Therefore as the algorithm gains confidence in the
model this means that the algorithm also gains confidence that it has achieved
the global optimum for the particular function
67
Figure 124 The Bayesian optimisation of f(x) where (i) - (viii) represent the sequential
iterations of the minimisation The acquisition function is shown in red measurements
are shown as red dots and the current estimated surrogate model is shown in blue with
its corresponding 95 confidence interval The maximum of the acquisition function
indicates the next measurement to be taken
Integer linear programming (ILP) is a class of methodologies that are
concerned with variables that can only take the form of integers and although is
not classically a type of global optimisation algorithm is still a mathematical
optimisation that is useful in specific cases and is utilised in this project An ILP
problem is in general very difficult to solve and many solvers have attempted to
simplify the procedure by utilising a much simpler linear programming (LP)
approach then rounding down the values to the nearest integer - this is known
as LP relaxation but may not always be effective in identifying the optimum
solution so other techniques must be used[158] In ILP optimisations it is also
common to have multiple linear constraints which define a feasible region that
the optimum can be found
Although ILP algorithms may proceed using different methodologies the
most intuitive introduction would be a 2-dimensional problem with a graphical
method The function to be maximised f shown as eqn 135 is bound by 4
linear constraints C1 - 4 shown as eqn 136 - 139
As the problem consists of two variables x and y it can be illustrated by a 2-
dimensional graphical plane where each linear constraint is a straight line
forming a closed feasible region - this is indicated in Figure 125[158] Therefore
all feasible solutions to this problem must be an integer in x and y within the
bounds of this feasible region The objective function f is represented as a
straight line with given inputs of x and y that indicates its current position This
function however can be viewed as a dynamic line that moves in parallel with
respect to different values of x and y Therefore in order to obtain the maximum
feasible evaluation of f the line is moved from its current location in the figure
119891 = 12119909 + 7119910 eqn 135
1198621 = 2119909 minus 3119910 le 6 eqn 136
1198622 = 7119909 + 4119910 le 28 eqn 137
1198623 = minus119909 + 119910 le 2 eqn 138
1198624 = minus2119909 minus 119910 le 2 eqn 139
68
until it intersects with the allowed two integer-valued inputs within the feasible
region for the first time All integer-valued input combinations within the feasible
region are marked with a red dot where the first intersecting point would be either
point 1 (23) or point 2 (31) indicated as P1 and P2 respectively These points
can be evaluated mathematically by the objective function to determinine the true
maximum where P1 = 43 and P2 = 45 Although this specific example is 2-
dimensional and this intuitive graphical method cannot be easily performed in 3-
dimensions and is impossible in further dimensions many computational ILP
algorithms proceed using this generalised concept to identify optimum inputs for
a given function
Figure 125 A graphical method to solving ILP problems where C1 - 4 indicate the linear
constraints the green area indicates the feasible region f shows the objective function
red dots represent the integer values of the inputs and P1 and P2 indicate two feasible
potential maxima to the problem Figure adapted from works reported by Boyd amp
Vandenberghe[158]
133 Optimisation summary
There are many methodologies that optimisation algorithms utilise
meaning that there are several classes of algorithm that are available and then
69
multiple subclasses thereafter There are specific cases where a particular
algorithm class is necessary to solve a problem but also cases where many
algorithms may be suitable it is then necessary to decide which algorithm to use
in this instance based on other factors such as computational efficiency In this
project these decisions will be explored as optimisation algorithms must be used
in multiple unique scenarios This is because other methodologies such as grid
search are too inefficient and imprecise especially as many input variables (for
example kinetic parameters to be optimised) must be determined in an
appropriate length of time and with high precision
14 Research aim
The aim of this project is to develop and advance an automated methodology
to kinetic model and parameter determination The basis of this project arises
from a methodology reported by Tsu et al[173] that provides a framework to a
technique that achieves this by evaluating all possible reaction models This
reported framework however has limited simulated examples and no real
experimental examples that prove its efficiency This methodology can represent
a positive change in the laboratory where physical-organic chemists can make
use of their human resource on other tasks instead of determining a reaction
model and kinetic parameters which can be assigned to a computer This is the
advantage to exploring this automated methodology that this project is
predicated on which leads the specific project goals herein described
bull To build this automated computational approach to kinetic model and
parameter determination based on the framework aforementioned as
well as to test the effectiveness of the approach in simulatedliterature
case studies (Chapter 2)
bull To prove the effectiveness of the approach in real experimental case
studies This approach will be coupled with automated kinetic profile
generation by flow rate manipulation in a continuous flow chemistry
experimental setup (Chapter 3)
Although methodology described is very powerful for many chemical
scenarios there are also instances where this technique does not work
Specifically this approach is not designed for applications where the reaction
70
order can be a non-integer or where particular species may be catalytic in
nature Therefore further specific project goals are described
bull To further develop this automated approach to kinetic model and
parameter determination to include chemistries that may proceed via a
catalytic route or have non-integer orders with respect to one or more
species in the reaction model The effectiveness of this new approach
must also be proven in a simulatedliterature case study(s) (Chapter 4)
bull To prove the effectiveness of this new approach in real experimental case
studies to achieve kinetic information (Chapter 5)
This project will ultimately lead to a tool that any chemist can utilise by
plugging time-series data and chemical species into the automated approach
then observing the output in the form of the most likely kinetic model and
associated parameters Without kinetic expertise any chemist will be able to use
this approach and interpret the output in order to obtain scalable process
understanding
Chapter 2 Development of the computational approach to
kinetic model determination
21 Introduction
A chemical system can be seen as a cascading dynamic reaction
scheme where molecules can orientate themselves in a particular way and with
a particular energy to allow a reaction to occur This reaction of course will follow
a particular reaction mechanism These mechanisms can give a deep
understanding of the underlying chemistry that we merely observe as a
transformation and can give real-world benefits as it then becomes clearer and
easier to control and understand chemical reactivity[174 175]
For the development of a chemical process however one of the greater
concerns is to mathematically characterise the transformation from the starting
materials to products - this can be complex and occur over many reaction steps
and involve many measurable and immeasurable intermediates This allows
quantitative information to be gained regarding the chemical synthesis allowing
71
for classical reaction engineering principles to be applied to shorten process
development times and lower costs[173] Therefore the objective is to develop
stoichiometric and kinetic descriptions of the individual transformations rather
than detailed mechanistic insights and rationales[176] Where stoichiometry refers
to the stoichiometric coefficient of a particular species in a reaction and kinetic
descriptions refer to the kinetic parameters involved in the rate equations for a
process For a system with multiple reactions this is referred to as a chemical
reaction network (CRN)
The basis for many stoichiometric and kinetic modelling studies with the
specific aim of CRN determination is the data-driven work reported by Aris and
Mah[177] This work is an early example of using computation to evaluate aspects
of a CRN specifically how many independent reactions can be shown to account
for changes in experimental data providing that all chemical species are
measured Bonvin and Rippin[178] later reported tar
get factor analysis (TFA) which was shown to derive approximate stoichiometric
models for complex systems as well as to test user-inputted stoichiometries for
their suitability to experimental (simulated) data TFA has been used and
advanced to verify proposed reaction stoichiometry in a select few reported
works[179 180]
TFA was then used as the basis for further work reported by Brendel et
al[181] and Bhatt et al[182] whereby an incremental identification method was
proposed This is a step-wise method where the stoichiometry is initially verified
using TFA then other model identification strategies are utilised to identify the
structure and parameters of the rate laws within the ODE models However TFA
initially requires a CRN to be at least postulated by a user before it can be used
This requires a high degree of chemical intuition but may also be incorrect as
there are many possible forms in which the CRN can exist especially when
dealing with a system with a large number of chemical species
An alternative step-wise method was also reported by Burnham et al[183]
in which a global ODE model structure was generated which is capable of
representing an entire set of possible chemical reactions As this global ODE
model structure represents an over-trained model model terms are sequentially
removed using statistical measures until all insignificant terms are removed
72
giving the final CRN As this features several optimisations of models with many
kinetic parameters in order to identify insignificant terms this optimisation can be
very slow and also suffer from local optima This is also the case with the
determination of insignificant terms as the identified optimum model itself may
be non-global
Willis and von Stosch[176] then reported the use of mixed integer linear
programming (MILP) to determine the model structure as well as its associated
kinetic parameters This was because previously reported step-wise
identification approaches fail to consistently predict the underlying network
structure[184-186] In this work a global CRN structure was reported but MILP was
used to dismiss all non-mass-balancing reactions from the structure
Decomposition of the global structure then occurs by statistical means and
although the global structure is now much smaller in this work termination at
local optima may still be an issue
Tsu et al[173] then reported an improvement upon this method where ILP
initially identifies all mass-balancing reactions then builds every possible
reaction model It is this approach that will be focussed on in this chapter and
further description and discussion is provided in Chapter 22 Every model is then
fitted and statistically evaluated which avoids the potential pitfall of local optima
when determining the correct model However this can be computationally
demanding as there are many more models to evaluate than in any previously
reported work
Other works in the literature include more algorithmic approaches to CRN
identification Differential evolution[187] genetic programming[188] and multi-
objective genetic algorithms[189] have all been used as global optimisers to
attempt to determine the CRN These specific global optimisers which focus on
mimicking real-life Darwinian evolution are attractive as the CRN is identified
with minimal human interaction or expertise However this optimisation method
can still encounter problems due to local optima and take a very long time to
compute due to the number of iterations necessary for convergence upon the
optimum
The main assumption that is universal among these approaches to CRN
determination is that all reaction kinetics follow the law of mass action This
73
states that the rate of reaction of an elementary reaction is directly proportional
to the product of the concentrations of the reactants raised to the power of their
stoichiometric coefficients[190] For the reaction shown in eqn 1 based on the
law of mass action the reaction rate can be described by eqn 2 and therefore
eqn 3 The kinetic rate constant k therefore determines the speed of the
reaction as well as the reactant concentrations
Where
bull α β γ = stoichiometric coefficients
bull x1-3 = chemical species
bull k = kinetic rate constant
bull rate = rate of reaction
The law of mass action is applicable in most cases however there are
particular cases where it is not accurate to describe a process using mass action
kinetics where these approaches are not applicable Such processes typically
occur when concentrations of particular substrates are very low[191]
22 Development of the approach
The computational approach was developed using MATLAB by loosely
following the approach outlined by Tsu et al[173] The approach contains two main
sequential stages kinetic model generation and kinetic model fitting Firstly all
mass-balance-allowed reactions are identified from the inputted species (starting
materials intermediates and products) Then all of the feasible reaction models
ie all possible combinations of these allowed reactions are compiled and stored
in a model database
After the model database has been generated for the particular process
the kinetic model fitting stage then evaluates the fit of the ordinary differential
equations (ODEs) for that particular model to the experimental data provided
The MATLAB ODE solvers can be used to in such a way to allow an assessment
1205721199091 + 1205731199092119896rarr 1205741199093 eqn 21
119903119886119905119890 prop [1199091]120572[1199092]
120573 eqn 22
119903119886119905119890 = 119896[1199091]120572[1199092]
120573 eqn 23
74
of how the concentration of a species changes over time when given particular k
values Therefore optimising the k values for a given reaction model by
maximising the convergence of the ODEs with the experimental data provides
an indirect route to their identification The convergence metric which is the sum
of squared error (SSE) between the simulated ODEs and the data as well as the
k values for each model are then stored
Statistical analysis is then applied to each of the models Corrected
Akaikersquos Information Criterion (AICC) is used as a measure to identify the models
that best balance model simplicity and convergence to the data and hence
identify the most valid models When these models have been identified it is
then possible to run Monte Carlo simulations if the error of the experimental data
is known These simulations assume that the error is normally distributed around
the data point and compile both the error in experimental data and error in the
kinetic fitting of the ODE to obtain an uncertainty prediction in the identified k
values for the process
221 Kinetic model generation
In order to generate the kinetic models for evaluation the first step is to
input all of the known species of a chemical process into the system The species
can be identified by any means typically by experimentation where all starting
materials intermediates and products are identified These species are inputted
based on their respective number of differing atoms ie number of carbon
atoms number of oxygen atoms etc which is known as a Mass Matrix (MM)
For example if you take the known reaction model of A + B C + D
shown in Scheme 21 you could visualise initially inputting these four species
into a mass matrix shown in Figure 21
75
Scheme 21 An example esterification reaction
Figure 21 The Mass Matrix inputted into the approach assigning mass to each of the
species
It is also possible to describe the reactions (forward and backward) shown
in Scheme 21 in terms of the stoichiometry of reactants used (SR) and the
products formed (SP) as a set of matrices in Figure 22 When describing these
matrices a 0 represents that the species does not participate a 1 represents
that the species does participate with a kinetic order of 1 and 2 represents that
the species participates with a reaction order of 2 For example in the forward
reaction both species A and B participate as a reactant with reaction order 1
meaning that they are represented by lsquo1rsquo whereas C and D do not participate as
reactants so are represented by lsquo0rsquo These stoichiometric matrices are then
combined to form an overall stoichiometry S where S = SP - SR This overall
stoichiometry for an unknown model would otherwise be identified using an
Integer Linear Programming (ILP) optimisation and is necessary to identify all
feasible mass-balanced reactions
76
Figure 22 The stoichiometric matrices for the reaction model shown in Scheme 21 as well
as the overall stoichiometry matrix S
The ILP optimisation proceeds by finding every feasible stoichiometry that
satisfies the objective function of MMmiddotS = 0 where S is the transposed vector of
a single reaction with values for each of the species present Therefore as there
are four species in the esterification process shown in Scheme 21 the ILP
optimisation will proceed using the known Mass Matrix to identify the values of
X1-4 that satisfy the objective function shown in Figure 23 The optimised
solution is then the resulting stoichiometric vector which relates to a particular
feasible reaction The upper bound for the number of reactants in a stoichiometric
vector is 2 as it is very rare to encounter third order reactions as a single reaction
step When an optimised solution is found the solution is saved then successive
constraints are added to the ILP optimisation to guarantee that the same
combination of binary variables (and hence stoichiometry) are not obtained when
the optimisation problem is solved again The optimisation then ceases when
there are no more solutions to be found and hence all feasible mass-balance-
allowed transformations are identified
Figure 23 The ILP optimisation identifying a feasible solution to the objective function hence
identifying a mass-balance-allowed reaction Where X1 = A X2 = B X3 = C X4 = D
After all feasible reactions are identified these standalone reactions are
themselves potential models There are also other possibilites for reaction
models where there are any combinations of two of the possible reactions or
any combinations of three of the reactions etc The total number of possible
models (η) is equal to the sum of the binomial coefficients (or all combinations)
77
for every number of reactions in the model up to the total number of possible
identified reactions (δ) - this is shown in eqn 24 All of these combinations are
then generated and saved to a model database which will be accessed in the
next stage of the approach For example if the ILP optimisation identifies 5
possible reactions (δ = 5) the summation of all combinations gives η equal to
31 This example can be shown in a model representation in Figure 24 where
this could be any appropriate reaction where SM = starting material Int1 =
intermediate 1 Int2 = intermediate 2 P = product and Imp = impurity It should
also be noted that as all of these forward reactions are mass-balanced all
backward reactions would also be plausible but are omitted from the
representation for concisiveness
Where
bull η = total number of models
bull δ = number of possible reactions
bull i = iterative number of reactions considered for the model
120578 = sum 120575
119894 (120575 minus 119894)
120575
119894=123hellip120575
eqn 24
78
Figure 24 A visual representation of all of the possible reaction models when given five mass-
balance-allowed sample reactions each shown as a different coloured block When i = 1
each reaction is in itself a model and when i gt 1 each reaction behaves as a model
fragment These fragments when combined in different ways provide full and unique
reaction models each of which are to be assessed for their validity with respect to
experimental data
After every possible model has been saved into the model database each
of these models are then automatically transformed into their respective ODEs
which is a form that can be readily used in the kinetic model fitting stage of the
approach The individual stoichiometric reactions that make up each model are
compiled into a set of differential equations for each model where each of the
participating species have their own differential equation to show how their
concentration changes over time Figure 25 summarises the model generation
section of the approach by using the esterification reaction as an example This
shows how the initial input of the species is first used to identify the feasible
mass-balance-allowed reactions then how these reactions can be ordered into
every possible reaction model then subsequently how these models are
transformed into sets of differential equations for use in the kinetic model fitting
stage of the approach
79
Figure 25 A schematic summarising how the model generation stage of the approach
progresses Where the participating species are inputted and sorted ODE functions that
describe all possible mass-balance-allowed reactions are outputted
222 Kinetic model fitting
After the model generation stage of the approach is completed and there
is a sorted database with all possible models compiled with their respective ODE
functions the next stage of the approach can begin kinetic model fitting This
80
stage proceeds by sequentially loading individual models from the database
then attempting to optimise the kinetic constants for each of the reactions within
the model These optimisations progress based on the simulated ODE resultsrsquo
convergence with experimental data where more suitable models exhibit a
favourable change in ODE convergence based on the kinetic constants provided
by the optimiser Where models do not accurately describe the chemistry taking
place in the experimental dataset the optimiser typically ceases very quickly as
there is no way to incur a favourable change in the ODE results as it iterates
After the fitting of a particular model is complete the kinetic constants (optimised
results) as well as the minimised error metric of the ODE convergence (sum of
squared error or SSE) are assigned to the model and saved for statistical
analysis
2221 The objective function
When a model is initially selected for kinetic fitting the objective is to use
an optimisation algorithm to minimise the SSE between the simulated ODE
results and the experimental results This is shown in Figure 26 with a set of
time-series data showing a first-order decrease in the concentration of A The
first iteration of the algorithm is shown where a guess of k = 04 is applied to the
ODE solver The lsquodifferencersquo between the experimental result of data point Ex
and the simulated ODE of data point Sx is shown as Dx This value is squared
to make the value positive and summed with all other differences to give one
SSE value this is shown mathematically in eqn 25
119878119878119864 = sum (119864119909 minus 119878119909)2
119909=123hellip
eqn 25
Where
bull SSE = sum of squared error
bull Ex = experimental data point
bull Sx = simulated ODE data point
As the algorithm iterates the aim is to decrease the SSE output by varying
the input k values In this example optimisation shown in Figure 26 the optimiser
(and hence SSE) reaches a minimum at iteration 11 as the ODE converges very
well with the experimental data This method serves as an indirect route to
81
identifying kinetic constants as in this case the k values are the optimised inputs
for the optimisation algorithm
Figure 26 The iterations of an optimisation algorithm with respect to the convergence of
simulated ODEs with sample data - this occurs via the minimisation of the SSE output
For each iteration of the algorithm the inputted k values are used
alongside the ODE equations for the current model The ODE solver simulates
how each of the specified initial speciesrsquo concentrations change over time given
82
the reaction rate calculated from the k values the species concentration at that
moment and the reaction model The ODE solver used for this approach is the
MATLAB solver lsquoode15srsquo This is a stiff ODE solver meaning that it can be used
to solve lsquostiffrsquo ODEs An ODE is stiff when the integration must be completed in
unreasonably small increments by typical solvers that could require millions of
evaluations leading to a solver failure As there are many reaction models that
are to be evaluated it isnrsquot clear which ODEs would present themselves as stiff
problems Therefore ode15s was used which can approach curve solutions for
both stiff and non-stiff ODEs as opposed to a non-stiff solver which would be
able to solve non-stiff ODEs faster but fail when stiff ODEs were to be evaluated
Depending on the nature of the experimental data different inputs for the
optimisation algorithm may also be used If there is only one data set or all data
sets are at the same temperature then k values can be optimised If there are
multiple data sets at different temperatures however it is often better to optimise
directly for the activation energy and reference k value This is because there are
fewer variables for the algorithm to optimise meaning there is a greater chance
of convergence on a global optimum and not a local one this is discussed further
in Chapter 2222
The reference k value is at a particular reference temperature typically
the midpoint of the temperatures explored experimentally This is to ensure that
there are no weightings in the fittings of parameters towards the extremes of the
temperatures explored This reference k value and activation energy value for
each of the transformations are optimised as these inputs generate the k values
for each transformation using the re-parameterised Arrhenius equation shown
as eqn 26 where the general Arrhenius equation is shown as eqn 27
119896 = 119896119903119890119891119890[minus119864119886119877(1119879minus1119879119903119890119891
)] eqn 26
119896 = 119860 119890minus119864119886119877119879 eqn 27
Where
bull k = rate constant
bull kref = reference rate constant at a particular temperature
bull Ea = activation energy kJ mol-1
bull A = pre-exponential factor
83
bull T = temperature of reaction K
bull Tref = reference temperature for the reference rate constant K
bull R = ideal gas constant J mol-1 K-1
The re-parameterised Arrhenius equation is used for kinetic fitting as there
is only one optimum for the reference k and activation energy values regardless
of the kinetic model This means that the output of the algorithm can be assumed
to be at a discrete optimised point This is not the case if optimising for set of
values for a pre-exponential factor and activation energy due to the high
correlation between these values[192 193] This means that there are several sets
of values that can all combine to obtain the same rate constant which can be
avoided when using the re-parameterised equation to fit kinetic parameters to
data sets that include multiple temperatures
The final consideration when compiling the objective function is the
method of measuring the convergence of the simulated ODEs to the
experimental data For all simulated and experimental case studies herein
reported the SSE metric has provided good convergence to time-series data for
all species This could present a problem however in cases where particular
species occur in only small quantities and SSE does not provide a good fit to the
data This is because the SSE metric reduces the overall error hence giving a
biased fit to species that are present in larger concentrations This could be
prevented by using a different error metric - such as a weighted sum of squared
error (WSE) or a relative sum of squared error (RSE) Both of these error metrics
serve to normalise the errors in convergence between species present in higher
and lower concentrations and can be used in this approach if the experimental
data suggests that it would be appropriate
2222 The optimisation algorithm
When fitting kinetics using this approach the algorithm used to minimise
the error metric described in Chapter 2221 and hence maximise the
convergence of the simulated ODE with experimental data is the MATLAB
function fmincon fmincon utilises an interior point algorithm which is described
in detail in Chapter 131 This function has been reported extensively in the
literature for the nonlinear optimisation of dynamic models including
considerable uses in the fitting of kinetic parameters to reaction models[194-196]
84
fmincon is a local optimisation tool that leads to fast and accurate
convergence on local optima As the given error metric SSE reports a value
based on the residuals that is correlated to the magnitude of the concentrations
involved it is not clear based on this value whether true convergence has
occurred However due to the nature of the problem it is simple to plot the
experimental data and simulated ODE after kinetic fitting to visually confirm that
convergence has occurred Based on the convergence to the experimental data
it can then be assumed that the optimum found is the global optimum for that
model If non-convergence occurs then it is either because the given model does
not accurately represent the chemistry in the system or the algorithm became
trapped in a local optimum The likelihood of these scenarios depends on the
non-linearity of the data and the number of variables to be optimised
Generally speaking in these scenarios it is assumed that when non-
convergence occurs it is because the model does not accurately represent the
chemistry This is because of two reasons The first is that most kinetic data does
not feature sharp inflexions or cliff-edges in which concentration-time data
deviates from an otherwise smoothed curvature It is this curvature in the data
that makes local solvers such as fmincon very effective at identifying kinetic
parameters as large aspects of their methodologies involve gradient-based
calculations Therefore the path that the optimiser takes towards the optimum
typically iteratively improves as the optimiser progresses and with a smoothed
parameter space this means that the iterative improvement is unlikely to reach a
local optimum The second reason is that when fitting kinetics typically the
number of variables to be optimised is low as many models feature chemistry
that has fewer than 10 model terms This means that it is unlikely that fmincon
will encounter local optima when optimising and will only find the globally
optimum solution
There is not a discrete reported number of variables to be optimised that
means that fmincon will start to encounter local optima issues Kinetic studies
are reported routinely where ~15 or more parameters are optimised using
fmincon both isothermally and across different temperatures without issues[197
198] However it cannot be assumed a priori with certainty that these issues will
not occur Therefore in cases where there are more than 10 model terms to be
optimised a form of global optimisation called multi-start fmincon (ms-fmincon)
85
will be used This methodology employs fmincon but with multiple starting points
from which the optimisation starts Using ms-fmincon with 5 randomised starting
points means that from those 5 optimisations the global optimum is very likely
to be found when more than 10 parameters are to be optimised This approach
utilises ms-fmincon because it has been proven to be effective in optimising even
large scale systems A recent example of this was reported where 383
parameters were optimised accurately for a large kinetic model[199]
223 Statistical analysis
After the kinetic parameters are optimised for each model and the error
metric (SSE) recorded statistical analysis can then be performed to determine
the most likely model that describes the experimental data Akaikersquos Information
Criterion (AIC) eqn 28 provides a relative evaluation of a model for a particular
set of data[200]
119860119868119862 = 119899 ln (119878119878119864
119899) + 2119896 eqn 28
Where
bull AIC = Akaikersquos Information Criterion
bull n = number of observations
bull SSE = sum of squared error
bull k = number of model terms
This calculation provides a relative evaluation of balancing the goodness-
of-fit of the model to the experimental data with having as few model terms as
possible where a minimised value is optimal Therefore models are more
favourable if they only contain terms that have a significant effect on the fit to the
data inputted This means that the optimum model that AIC selects is less likely
to be over-trained as all model terms contribute a significant amount towards
the fit of the data
In the context of this approach an AIC evaluation can inform the
experimenter which reaction model is the most likely to be correct in relation to
other models considered This model should only contain reactions that
significantly contribute towards the convergence of the simulated ODEs with
experimental data points As AIC assumes that the amount of data is sufficiently
large in relation to the number of model parameters it is also beneficial for the
86
purposes of this approach to use a corrected AIC value to compensate for the
reduced sample sizes
The Corrected Akaikersquos Information Criterion (AICC) eqn 29 both
converges to AIC for large sample sizes but gives a more accurate answer for
smaller sample sizes as a greater weighting is placed on the number of model
terms[201] Reported data suggests that an uncorrected AIC value is appropriate
only when the ratio of nk is greater than 40 otherwise an AICC evaluation should
be used[202] However as the model penalisation aspect of AICC is favourable to
differentiate models with similar SSE values and many of the lsquoobservationsrsquo in
the context of a kinetic profile can be highly correlated if the ratio of nk is less
than 40 then the number of observations should be the number of individual
experiments rather than individual data points This is also true where several
experiments are used in fitting to contribute towards one SSE value where each
experiment has a vastly different number of measurements within them
119860119868119862119862 = 119860119868119862 + 2119896(119896 + 1)
119899 minus 119896 minus 2+ 119899 ∙ ln(2120587) + 119899
eqn 29
Where
bull AIC = Akaikersquos Information Criterion
bull AICC = Corrected Akaikersquos Information Criterion
bull n = number of observations
bull k = number of model terms
224 Other considerations
There may be some instances where there are intermediates or products
formed that cannot be identified This occurrence can be chemistry-dependant
but it is common that the quantitative analysis of a process can show total mass
balance losses as a reaction progresses This can indicate that either the species
calibrations are inaccurate or there is a real loss of massconcentration that is
unaccounted for If calibrations are correct with certainty and there is still a loss
of mass that is unaccounted for it can also be beneficial to input an additional
species into the system This will force the approach to identify a new pathway
to an unknown species which can be assigned the total mass loss of the process
as the time-series data progresses Due to the nature of the AICC evaluation it
can then be determined statistically if this loss of mass contributes significantly
87
enough towards the fitting of the data to suggest that there is a chemical pathway
occurring that is not described by the userrsquos inputted species This pathway will
be a grouped reaction description with an observed rate constant kobs This is
because if another pathway is shown to occur then it is not possible to know
how many routes that mass is lost by Chemical considerations must then be
undertaken to identify missing species and the approach must be re-run
When running the approach the model generation aspect is very fast
whilst the kinetic fitting stage is significantly slower due to the many optimisations
that must be conducted The kinetic fitting stage is considerably accelerated by
utilising parallel computing This means that each optimisation operation is
conducted on a single computer core meaning that separate tasks can be sent
to separate cores within the computer This means that optimisations are
conducted in parallel as the process speed scales directly with the amount of
computer cores available The time taken for each optimisation is heavily
dependent on the model it is fitting and the number of ODE evaluations to be
conducted A typical range for a single optimisation can take from 10 - 120
seconds on a standard Intel i5-2310 processor however many optimisations
take less than 1 second if the model does not describe the experimental data
accurately
225 Overview
This computational approach to kinetic model selection and parameter
identification was developed in MATLAB by loosely following the methodology
reported by Tsu et al[173] The approach first identifies all possible reactions that
can happen based on mass balance alone from the species inputted by the user
All plausible models are then compiled by taking every combination of these
reactions and sequentially optimising the kinetic parameters for each of these
models Each model is then statistically evaluated and ranked highlighting the
most likely model based on the experimental data supplied The approach outline
is summarised in Figure 27
88
Figure 27 An outline of the stages of the computational approach
This method serves as a comprehensive model evaluator where chemical
intuition is removed thereby removing a chemistrsquos bias and considering a
number of possible models that may otherwise not have been considered It is
however not the role of this approach to remove all necessity for a physical-
organic chemist to supervise the discovery of a kinetic model This approach is
to be used as a complementary tool whereby all models are evaluated without
human effort or interaction but final considerations are still made by the chemist
when the ranked model list is generated This is because there may be reactions
present in the most likely model that describe chemistry that is unlikely or unable
to occur but still give a good fit to the experimental data It may also be possible
that many models give very similar AICC evaluations so many models may be
competing
The benefits to this tool are clear All models are generated based on
logical transformations of the species inputted and every possibility is
comprehensively evaluated without the need for a chemistrsquos or statisticianrsquos most
important resource time Typically a chemist would evaluate a select few models
based on chemical intuition and remove certain chemical possibilities a priori
then further refine the model until it is satisfactory When all possibilities are
considered by an approach that automatically evaluates them this allows the
chemist to work on other projects including more important aspects of laboratory
work or theory that cannot be assigned to a machine However although
89
powerful this tool ultimately is data-driven and must be used in conjunction with
real chemical intuition by an end user to determine that the models identified as
most likely are accurate and consistent with the science
23 Simulated verification of the approach
Before any real experimentation takes place it is important to first verify
that the approach works as a means of identifying the correct reaction model and
kinetic parameters Therefore several simulated case studies were conducted
with varying goals to show the adaptability of the approach to different
circumstances These simulated case studies feature reactions from the
literature where the model and kinetic parameters are already identified
Simulated experimental data is generated from this information and used as the
basis for verifying the approach
To simulate the data first the true model and kinetic parameters reported
in a given literature source are inputted into MATLAB The experiment is then
simulated at a particular temperature and set of initial concentrations by using
an ODE solver to evaluate the change in species concentrations over a given
experimental timeframe Individual data points from this timeframe are then
extracted which serve as the experimental data points for the particular
simulated case study To then make the case study more robust up to 5
relative error in each measurement is added to approximate this simulated data
more closely to real experimental data This generation of simulated data is
summarised in Figure 28
90
Figure 28 An example showing the generation of a simulated data set from the literature a)
An ODE is simulated for a particular model with a set of kinetic parameters in this case A
rarr B where mdash = A mdash = B b) Particular time points are taken from this ODE to
represent individual measurements where x = A x = B c) Up to 5 relative random
error is added to these measurements to more closely resemble real experimental data
231 Case study Benzoic acid alkylation
The first simulated case study was a very basic system where there are
only three species to be considered[203] The reaction system was benzoic acid
21 reacting with iodomethane 22 in the presence of the base 18-bis-
(tetramethylguanidino)naphthalene (TMGN) to form the methyl benzoate
product 23 and hydroiodic acid 24 This reaction is shown in Scheme 22
TMGN was present at one equivalent with respect to benzoic acid and was
assumed to deprotonate the benzoic acid so that all of the starting material is in
the carboxylate form There were no rates reported by the authors for this
deprotonation but they indicated that modelling this system as a simple second
order reaction under these conditions yielded accurate results
91
Scheme 22 The reaction of benzoic acid with iodomethane to form methyl benzoate
Modelled as a second order reaction
2311 Data acquisition
The second order reaction model reported by Gholamipour-Shirazi[203]
was used to generate the ODEs shown in eqn 210 - 213 Three isothermal
simulated data sets were generated using these ODEs with the k value of 057
M-1 s-1 with the following initial concentrations
bull 01 M benzoic acid 21 008 M iodomethane 22 0 M methyl benzoate
23 0 M hydroiodic acid 24
bull 01 M benzoic acid 21 011 M iodomethane 22 0 M methyl benzoate
23 0 M hydroiodic acid 24
bull 01 M benzoic acid 21 015 M iodomethane 22 0 M methyl benzoate
23 0 M hydroiodic acid 24
119889[120784 120783]
119889119905= minus119896 [120784 120783][120784 120784] eqn 210
119889[120784 120784]
119889119905= minus119896 [120784 120783][120784 120784] eqn 211
119889[120784 120785]
119889119905= 119896 [120784 120783][120784 120784] eqn 212
119889[120784 120786]
119889119905= 119896 [120784 120783][120784 120784] eqn 213
5 relative error was then added to these simulated data sets then used
as the inputted experimental data for the computational approach These data
sets can be found in Chapter 721
2312 Results and discussion
Based on the inputs of the molecular weights for this system there were
two mass-balance-allowed reactions shown in eqn 214 and eqn 215 which
are two of the three possible models that can be generated The third model
92
shown in eqn 216 is the combination of these two allowed reactions resulting
in an equilibrium reaction model
Forward 21 + 22 rarr 23 + 24 eqn 214
Backward 23 + 24 rarr 21 + 22 eqn 215
Equilibrium 21 + 22 23 + 24 eqn 216
These three models were then each evaluated based on how well the
simulated ODE curves converge to the experimental data inputted The kinetic
parameters kx were optimised for each model and the SSE was recorded
These results are tabulated in Table 21 The concentrations of HI were assumed
to not be measured during the kinetic fitting and were instead inferred
Table 21 A table showing the optimised k values for the identified models in the benzoic acid
alkylation case study alongside each modelrsquos SSE and AICC
The computational approach reveals that the reaction model containing
solely the forward reaction gives the minimum overall error and the best (lowest)
AICC evaluation when assessing the experimental data indicating that this is the
most likely reaction model For the backward reaction the minimisation algorithm
could not optimise a k value to give a better fit than the initial guess of 1 x 10⁻³
M-1 s-1 indicating that the reaction model is in complete disagreement with the
experimental data For the equilibrium model the error is as low as the forward
reaction model alone as the optimiser assigns a small k value to the reverse
reaction to attempt to fit to the noise of the system Although this model fits the
data equally well there is the added complexity of a second model term as this
term adds no value in terms of lowering the SSE it is an unfavourable addition
in terms of an AICC evaluation which prefers simplistic models and is therefore
considered a less appropriate model than the forward reaction term alone
This case study has shown that it is possible to use this computational
approach to identify the correct model and kinetic parameters for a simple
Reaction kx M-1 s-1 SSE M AICC
Forward 05807 08101 -655
Backward - 10185 -174
Equilibrium 05817 00009 08101 -410
93
system by simply inputting the participating species and their respective
changes in time-series data The k value identified is very similar to the one used
for the generation of the simulated data and varies only because of the 5
noise added to the system The fit of the identified model and k value for the data
supplied is shown in Figure 29 where the data set shown is the middle
experiment where the starting concentrations were 01 M benzoic acid and 011
M iodomethane
Figure 29 The fit of the identified model and kinetic parameters to the generated experimental
data with starting concentrations of 01 M benzoic acid and 011 M iodomethane Where
x = benzoic acid x = iodomethane x = methyl benzoate mdash = benzoic acid (ODE) mdash =
iodomethane (ODE) mdash = methyl benzoate (ODE)
232 Case study Nitrile hydrolysis
This case study features a slightly larger system where there are 5
species to consider in the hydrolysis of a nitrile[204] The nitrile of interest 25 is
hydrolysed by hydroxide 26 to form the amide 27 This amide is then further
hydrolysed to form the carboxylic acid 28 and ammonia 29 This reaction is
shown in Scheme 23 As in many acidbase reactions there are a lot of fast
proton transfer steps the mass of species 26 is therefore added to the system
94
as water H2O rather than hydroxide OH- in order to preserve mass balance
This allows appropriate reaction models to be generated
Scheme 23 The reaction of a nitrile with hydroxide to form the corresponding amide which is
susceptible to further hydrolysis to form the carboxylic acid Modelled as sequential
second order reactions
2321 Data acquisition
The sequential second order reaction model reported by Niemeier et
al[204] was used to generate the ODEs shown in eqn 217 - 221 The reported
kinetic constants for the two steps were
bull Step one k75 degc = 927 x 10-3 M-1 s-1 Ea = 871 kJ mol-1
bull Step two k75 degc = 363 x 10-5 M-1 s-1 Ea = 745 kJ mol-1
Four simulated data sets were generated at four separate temperatures by using
eqn 26 to calculate k values with the following initial concentrations
bull 08 M nitrile 25 18 M hydroxide 26 0 M amide 27 0 M carboxylic
acid 28 0 M ammonia 29 60 degC
bull 08 M nitrile 25 18 M hydroxide 26 0 M amide 27 0 M carboxylic
acid 28 0 M ammonia 29 70 degC
bull 1 M nitrile 25 2 M hydroxide 26 0 M amide 27 0 M carboxylic acid
28 0 M ammonia 29 80 degC
bull 1 M nitrile 25 2 M hydroxide 26 0 M amide 27 0 M carboxylic acid
28 0 M ammonia 29 90 degC
119889[120784 120787]
119889119905= minus1198961[120784 120787][120784 120788] eqn 217
95
119889[120784 120788]
119889119905= minus1198961[120784 120787][120784 120788] minus 1198962[120784 120789][120784 120788] eqn 218
119889[120784 120789]
119889119905= 1198961[120784 120787][120784 120788] minus 1198962[120784 120789][120784 120788] eqn 219
119889[120784 120790]
119889119905= 1198962[120784 120789][120784 120788] eqn 220
119889[120784 120791]
119889119905= 1198962[120784 120789][120784 120788] eqn 221
5 relative error was then added to these simulated data sets then used
as the inputted experimental data for the computational approach These data
sets can be found in Chapter 722
2322 Results and discussion
Based on the inputs of the molecular weights for this system there were
four mass-balance-allowed reactions shown in eqn 222 - 225 All possible
models were then compiled subject to eqn 24 resulting in 15 models
25 + 26 rarr 27 eqn 222
27 rarr 25 + 26 eqn 223
26 + 27 rarr 28 + 29 eqn 224
28 + 29 rarr 26 + 27 eqn 225
All 15 models were evaluated sequentially then ranked based on their
AICC It was found that the highest ranked model was the correct model with
kinetic parameters optimised to be very close to the real values As artificial error
was added to the results this optimisation is assumed to be correct as the
relative error in the kinetic parameters is negligible The top three performing
models are shown in Table 22 where the reference k values at 75 degC are shown
as well as the activation energy SSE and AICC
Table 22 A table showing the top three ranked models for the nitrile hydrolysis case study
The kinetic parameters for each reaction within the model is shown as well as the SSE
and AICC evaluation
Model
rank Model
kx75 degC M-1 s-1
or s-1
Ea kJ
mol-1 SSE M AICC
1 25 + 26 rarr 27 923 x 10-3 867 00179 -1623
96
26 + 27 rarr 28 + 29 449 x 10-5 716
2
25 + 26 rarr 27
26 + 27 rarr 28 + 29
28 + 29 rarr 26 + 27
928 x 10-3
430 x 10-5
194 x 10-4
867
755
263
00179 -1567
3
25 + 26 rarr 27
27 rarr 25 + 26
26 + 27 rarr 28 + 29
932 x 10-3
363 x 10-5
420 x 10-5
865
373
748
00180 -1566
This case study has shown that it is possible to identify the correct model
and kinetic parameters for a multistep chemical system using the computational
approach Interestingly this study has shown again that the overall error is very
similar in the top-ranked competing models meaning that the deciding factor
then becomes the number of model terms due to the AICC evaluation The data
inputted was at different temperatures and the kinetic parameter optimisation
proceeded smoothly when optimising reference k values and activation energies
directly An example kinetic plot showing the fit of the identified model to the
experimental data is shown in Figure 210 - this is the fourth experiment where
the starting concentrations were 1 M nitrile and 2 M hydroxide at 90 degC
97
Figure 210 The fit of the identified model and kinetic parameters to the generated
experimental data with starting concentrations of 1 M nitrile and 2 M hydroxide at 90 degC
Where x = nitrile x = amide x = carboxylic acid mdash = nitrile (ODE) mdash = amide (ODE) mdash
= carboxylic acid (ODE)
233 Case study SNAr kinetics
The final simulated case study involves a larger scale multistep system
where there are 6 species in a SNAr chemical setting 24-dichloropyrimidine
(starting material SM) 210 reacts with morpholine 211 to form either the 4-
substituted product 212 or the 2-substituted product 213 These products can
then further react with another equivalent of morpholine to produce the bis-
substituted product 214 Each of these reactions form hydrochloric acid 215
as a byproduct that is neutralised by an excess of base This system is shown in
Scheme 24
98
Scheme 24 The reaction of 24-dichloropyrimidine 210 with morpholine 211 to form the 4-
substituted product 212 and the 2-substituted product 213 and the subsequent bis-
substituted product 214
2331 Data acquisition
The multistep SNAr reaction model reported by Reizman and Jensen consists
of 4 second-order reactions These reactions were used to generate the ODEs
shown in eqn 226 - 231 The reported kinetic constants for these three steps
were
bull Step one log(A) = 34 M-1 s-1 Ea = 270 kJ mol-1
bull Step two log(A) = 35 M-1 s-1 Ea = 321 kJ mol-1
bull Step three log(A) = 49 M-1 s-1 Ea = 600 kJ mol-1
bull Step four log(A) = 30 M-1 s-1 Ea = 450 kJ mol-1
Three simulated data sets were generated at 90 degC by using eqn 27 to calculate
k values with the following initial concentrations
bull 1 M SM 210 22 M morpholine 211 0 M 4-substituted product 212 0
M 2-substituted product 213 0 M bis-substituted product 214 and 0 M
hydrochloric acid 215
bull 12 M SM 210 28 M morpholine 211 0 M 4-substituted product 212
0 M 2-substituted product 213 0 M bis-substituted product 214 and 0
M hydrochloric acid 215
bull 09 M SM 210 32 M morpholine 211 0 M 4-substituted product 212
0 M 2-substituted product 213 0 M bis-substituted product 214 and 0
M hydrochloric acid 215
99
119889[120784 120783120782]
119889119905= minus1198961[120784 120783120782][120784 120783120783] minus 1198962[120784 120783120782][120784 120783120783] eqn 226
119889[120784 120783120783]
119889119905= minus1198961[120784 120783120782][120784 120783120783] minus 1198962[120784 120783120782][120784 120783120783]
minus 1198963[120784 120783120784][120784 120783120783] minus 1198964[120784 120783120785][120784 120783120783]
eqn 227
119889[120784 120783120784]
119889119905= 1198961[120784 120783120782][120784 120783120783] minus 1198963[120784 120783120784][120784 120783120783] eqn 228
119889[120784 120783120785]
119889119905= 1198962[120784 120783120782][120784 120783120783] minus 1198964[120784 120783120785][120784 120783120783] eqn 229
119889[120784 120783120786]
119889119905= 1198963[120784 120783120784][120784 120783120783] + 1198964[120784 120783120785][120784 120783120783] eqn 230
119889[120784 120783120787]
119889119905= 1198961[120784 120783120782][120784 120783120783] + 1198962[120784 120783120782][120784 120783120783]
+1198963[120784 120783120784][120784 120783120783] + 1198964[120784 120783120785][120784 120783120783]
eqn 231
2 relative error was then added to these simulated data sets then used
as the inputted experimental data for the computational approach These data
sets can be found in Chapter 723
2332 Results and discussion
From these 6 species there are 16 mass-balance-allowed reactions that can
be identified shown in eqn 232 - 247 All possible reaction models were
generated subject to eqn 24 which resulted in 65535 unique models to be
evaluated by the approach
213 rarr 212 eqn 232
212 rarr 213 eqn 233
210 + 211 rarr 212 + 215 eqn 234
212 + 215 rarr 210 + 211 eqn 235
210 + 214 rarr 212 + 212 eqn 236
210 + 211 rarr 213 + 215 eqn 237
211 + 212 rarr 214 + 215 eqn 238
100
212 + 212 rarr 210 + 214 eqn 239
214 + 215 rarr 211 + 213 eqn 240
213 + 215 rarr 210 + 211 eqn 241
211 + 213 rarr 214 + 215 eqn 242
210 + 214 rarr 212 + 213 eqn 243
210 + 214 rarr 213 + 213 eqn 244
214 + 215 rarr 211 + 212 eqn 245
212 + 213 rarr 210 + 214 eqn 246
213 + 213 rarr 210 + 214 eqn 247
All 65535 models were evaluated by the computational approach which
incurred a computation time of 52 hours (see Chapter 761 for details on
computer specifications) Each of these models were ranked based on their
AICC and it was found that the highest ranked model was also the correct model
with kinetic parameters optimised to values that were very close to the generated
values As in the nitrile hydrolysis case study Chapter 232 this optimisation is
assumed to be correct as the error in the fitted parameters is negligible
considering that artificial error was added to the dataset The top three
performing models are shown in Table 23 where the optimised k values are
shown as well as their corresponding SSE and AICC values
Table 23 A table showing the top three ranked models for the SNAr case study The kinetic
parameters for each reaction within the model is shown as well as the SSE and AICC
evaluation
Model
rank Model kx M-1 s-1 SSE M AICC
1
210 + 211 rarr 212 + 215
210 + 211 rarr 213 + 215
211+ 212 rarr 214 + 215
211 + 213 rarr 214 + 215
032945
007686
000018
000037
00024 -2112
2
210 + 211 rarr 212 + 215
210 + 211 rarr 213 + 215
211+ 212 rarr 214 + 215
032948
007679
000018
00024 -2086
101
211 + 213 rarr 214 + 215
213 + 215 rarr 210 + 211
000033
000004
3
210 + 211 rarr 212 + 215
210 + 211 rarr 213 + 215
211+ 212 rarr 214 + 215
211 + 213 rarr 214 + 215
210 + 214 rarr 213 + 213
032949
007672
000018
000036
015890
00024 -2085
This final simulated case study has shown that it is still possible to identify
the correct reaction model and kinetic parameters for a more complicated
multistep chemical system even when there are several thousand models to
consider Many of these models are very similar and the top-ranked competing
models contain the four model terms that are appropriate as well as typically
one other model These models are top-ranking because the additional terms
are optimised by the algorithms to either have a negligible effect on the output
or to minimise the error in the kinetic fitting to a certain extent It is then the role
of the AICC evaluation to determine whether these additional model terms are
producing a significant effect in order for their consideration in the correct
reaction model In this case the SSE value was unchanged among the top-
ranked competing models meaning that the deciding factor then became the
number of model terms An example kinetic plot showing the fit of the identified
model to the experimental data is shown in Figure 211 - this is the first
experiment where the starting concentrations were 1 M 24-dichloropyrimidine
and 22 M morpholine at 90 degC
102
Figure 211 The fit of the identified model and kinetic parameters to the generated
experimental data with starting concentrations of 1 M 24-dichloropyrimidine and 22 M
morpholine at 90 degC Where x = 24-dichloropyrimidine x = 4-substituted product x = 2-
substituted product x = bis-substituted product mdash = 24-dichloropyrimidine (ODE) mdash =
4-substituted product (ODE) mdash = 2-substituted product (ODE) mdash = bis-substituted
product Graph is only shown to 260 minutes to show curvature of the initial data points
24 Conclusion
It has been shown that a computational approach to kinetic modelling
loosely based on work by Tsu et al can be programmed in MATLAB This
approach takes chemical species information as well as experimental datasets
to identify both the correct reaction model and kinetic parameters for the
chemical process by utilising optimisation algorithms and statistical analysis
This approach has been proven to work successfully for three simulated case
studies of varying optimisation difficulty with different sets of experimental data
inputs with varying artificial errors The success shown from these studies
inspires confidence that the approach can be implemented with real
experimental data and be used as an effective tool in process development to
automatically identify the correct model and kinetic parameters of various
103
chemical systems The next step is to prove the efficiency of this approach
alongside real experimentation
Chapter 3 Experimental applications of the computational
approach to kinetic model and parameter determination
31 Introduction
With the development of the computational approach completed and
verified with multiple simulated case studies the viability of the approach on real
experimental data must also be tested This experimental application can utilise
data from any source to determine the most likely reaction model and kinetic
parameters but for reasons that shall be discussed further all experimentation
for this chapter was conducted using an automated continuous flow reactor
platform
There is a long history of conducting and analysing chemical and enzymatic
kinetics using flow techniques with the first reported case published around 100
years ago by Hartridge et al as a means to study very fast reactions[205] During
this time many different processes analytical methods and experimental setups
have been reported here citing only a few[206-209] A widely regarded essential
requirement for kinetic experiments however is for the reaction system to
operate in a turbulent flow regime[210] Turbulent flow leads to fast continuous
mixing and can be predicted by calculating the Reynolds number Re in eqn
31
Where
bull Re = Reynolds number
bull ν = average flow velocity
bull d = tube diameter
bull ρ = fluid density
bull η = fluid viscosity
119877119890 = 120584119889120588
120578 eqn 31
104
Using the unitless Reynolds number the flow regime can be predicted to be
turbulent[210] when Re exceeds 2000 or laminar[211] when Re is less than 2000
These regimes are illustrated in Figure 31a and 31b respectively Under laminar
flow conditions there is a parabolic velocity profile - meaning that the flow
velocity at the centre of the tube is double the average velocity due to friction on
the walls of the tubing known as dispersion This dispersion was originally
thought to blur the time axis leading to a substantial distortion of the observed
kinetics and hence meaningful kinetic experiments under these conditions might
be impossible[212]
Figure 31 A diagram to show the direction and flows within a flow regime where a) laminar
flow b) turbulent flow
Interestingly these assumptions remained untested until a number of
reported kinetics works from the Douglas group showed that accurate kinetic
experiments could be conducted under laminar flow conditions[213-215] The
Reynolds numbers for the experiments conducted ranged between 28 and 85
implying laminar flow However the kinetics monitored in these systems agreed
very well with results obtained conventionally by stopped-flow methods Further
work suggests that molecular diffusion has a very significant role and under
certain circumstances it can be a good approximation to neglect the effects of
laminar flow ie for particular flow velocities with given internal diameters[212 216]
With this approximation the kinetics can then be analysed as if the tubular flow
was homogeneous which can lead to accurate kinetic studies even in laminar
flow regimes
105
In many continuous flow settings for micro- or meso-flow volumes it is
typically simpler to adopt an idealised plug flow reactor model This model states
that each infinitely thin section of flow known as a plug travels in the axial
direction of the reactor and is perfectly mixed in the radial direction only where
a uniform distribution of the reactor concentrations occurs This means that the
residence time of the plug is a direct function of the length of the tubular reactor
and the velocity of the fluid This is shown in Figure 32 This model is commonly
employed to simplify tubular mixing and remains an accurate approximation for
kinetic measurements[37] All kinetic experiments by other authors covered in this
introduction employ this model and further experimentation as part of this project
also utilises this model - this is discussed further in Chapter 32
Figure 32 A plug flow reactor model where there is perfect mixing in the radial direction but
no forward or backward mixing in the axial direction Plugs 1 and 2 are examples of the
infinitely short plugs existing within this reactor model
Many of the advantages of continuous flow chemistry as previously
stated in Chapter 11 are also particularly attractive for running kinetic
experiments Increased heat and mass transfer[217 218] ensures that the reaction
is well controlled meaning that it can be asserted with confidence that the
experimental conditions applied to it are truly experienced by the reaction
medium Precise reagent control arises out of utilising flow chemistry as specific
flow rates allow accurate addition of chemicals at various points within the reactor
system[22 23 35] - this is very important when deducing the order of the species
106
within a system as reagent stoichiometry is present in exact quantities Coupling
of flow reactor platforms with quantitative analysis such as UV HPLC or GC
also unlocks automation capabilities[6 219] where multiple experiments can be
queued for the system to run autonomously The increased safety[220] the
efficiency of operating at reaction temperatures above the boiling point of the
solvent[221 222] and the ability to run and analyse extremely fast reactions[223 224]
means that flow experiments can be run that would otherwise be very difficult or
impossible to run in a batch system For these reasons it is more desirable in
particular circumstances to run kinetic experiments in flow rather than more
traditional batch kinetic experiments whereby sampling occurs throughout the
progression of a single reaction These advantages will be exploited throughout
these experimental acquisitions of data
The main disadvantage to kinetic modelling in flow systems however is
the necessity of the system to reach lsquosteady-statersquo Steady-state simply refers to
the state in which the reactor is in where the responses from the system are a
direct consequence of the conditions applied to it This is an important distinction
because as the reaction parameters are changed a certain amount of time is
then required for those reaction parameters to be applied to the system to
achieve a consistent output[225] This can be very wasteful as a system typically
needs approximately 15 - 3 reactor volumes of reagent in the acclimation to
steady-state prior to each measurement[226] This wastes a lot of precious
reaction material as well as time as the time taken to reach steady-state is in
direct relation to the residence time required ie a 15 minute residence time
results in up to a 45 minute wait for steady-state
Kinetic experiments in flow have been performed in this way for a long
time as the advantageous properties of continuous flow chemistry were worth
the wastage from the steady-state measurements However in recent years
deviations from these conventional techniques have become more popular that
take advantage of the transitionary period between two steady-state
measurements This is because during this period transient reaction information
is available but is otherwise lost because of traditional sampling methods
However if the pump flow rates are manipulated to structure this transient data
in a way that can be translated to regular time-series data an entire reaction
profile can be mapped very quickly and efficiently This then negates the need
107
for multiple steady-state measurements and rectifies this flow chemistry
disadvantage as kinetic profiles can be obtained with minimal material
The first transient flow method reported by Mozharov et al[96] is an
instantaneous step change in the flow rates where the reaction initially takes
place at a low flow rate F1 and then the flow rate is increased by an order or
magnitude to F2 This high flow rate then pushes out the transient data profile of
the reaction medium whilst the liquid is monitored by an in-line analysis
technique sensitive enough to detect a change in product concentration for
example Raman spectroscopy as reported by the authors Using this in-line
technique many measurements are taken in short time intervals to generate a
reaction profile from which kinetic information can be derived This is possible
as the magnitude of F2 the experimental times of the analytical measurements
(tn) and the dimensions of the flow path in the system are known therefore the
reaction profile along the microreactor capillary can be recreated and plotted
This concept is depicted in Figure 33 with the corresponding equation shown in
eqn 32 to convert the species concentration in experimental time to the species
concentration in residence time This conversion then maps the kinetic profile of
the chemical process between the calculated residence times
Figure 33 A depiction of how a kinetic experiment can be run utilising a step change in flow
rates between two steady-states (I and II) allowing time-series data to be plotted from
transient data Figure adapted from Mozharov et al[96]
120591 = 119905211986521198651minus 1199051198652 minus 11986511198651
eqn 32
108
Where
bull τ = residence time of the reaction medium
bull t = experimental time experienced by the reactor
bull t2 = experimental time taken to reach steady-state
bull F1 = initial flow rate
bull F2 = higher flow rate that the pumps are instantaneously changed to
This concept was also used experimentally as a means to test the
accuracy of the technique in relation to conventional steady-state
measurements The base catalysed Knoevenagel condensation between
benzaldehyde 31 and ethyl cyanoacetate 32 alongside the base 33 to form
the corresponding adduct 34 is shown in Scheme 31 The corresponding
kinetic profiles were generated by conventional sequential steady-state
measurements in Figure 34 and by the described step-change methodology in
Figure 35 where the reaction proceeded at a low flow rate before a sudden step
change to a higher flow rate It is shown that the two sets of time-series data are
very comparable however the step-change methodology has many
advantages This technique can determine a kinetic profile from only one
experiment with a much lower consumption of reagents and significantly
reduced experimental time
109
Scheme 31 The base catalysed Knoevenagel condensation between benzaldehyde and ethyl
cyanoacetate to form 34
Figure 34 A kinetic profile generated from the Knoevenagel condensation shown in Scheme
31 where kinetic information was obtained by measuring conversation at given
residence times at steady-state at two temperatures Steady-state markers x are
shown as part of the lsquoA Modelrsquo Reproduced with permission
110
Figure 35 A kinetic profile generated from the Knoevenagel condensation shown in Scheme
31 where kinetic information was obtained using a flow rate step-change at two
temperatures Steady-state markers x are shown as part of the lsquoA Modelrsquo where step-
change markers o are shown as part of the lsquoB Modelrsquo Reproduced with permission
The main critique of this technique as stated in the original publication is
that the step increase in flow rate is never perfect as the system always needs
time to speed up to the higher flow rate therefore the exact function F(τ) during
this transitional period is uncertain[96] This non-ideality is caused by several
experimental factors such as non-rigidity of the tubing walls and the syringe
preventing an immediate change in both the flow rates and the pressure profile
throughout the system[227]
Moore and Jensen[227] then reported a new concept that involves a
controlled ramp instead of a step change which leads to less uncertainty in the
determination of the residence times leading to greater accuracy in the time-
series data This therefore also leads to greater accuracy in the kinetic
parameters obtained from the experiment This report introduced the concept of
ldquopseudo-batchrdquo reactors referring to each fluid element passing through the flow
reactor in a time that is unique which can be thought of as many successive
pseudo-batch reactions This concept is shown in Figure 36
Figure 36 A depiction of how a continuous flow reactor may be described as a series of
sequential pseudo-batch reactors where the colour represents the extent of conversion
from low (green) to high (red) Q represents the total flow rate ti represents the initial
time of each pseudo-batch reactor entering the reactor tf represents the final time tm is
the time at which the concentration is actually measured by the IR probe Reproduced
with permission
This controlled ramp method results in a more predictable and accurate
residence time profile when compared to the step change method as the
residence time uncertainty decreases as well as a greater sampling rate with a
data density 10-fold higher than previously reported in Mozharov et alrsquos
technique This was shown experimentally in Scheme 32 in the Paal-Knorr
reaction of 25-hexanedione 35 and ethanolamine 36 generating 37 whilst
constantly monitored by an in-line IR probe This greater data density also
reduces the error within the kinetic profiles generated whilst still agreeing with
111
kinetic profiles generated purely from steady-state measurements as shown in
Figure 37 where these datasets are shown to be very precise and reproducible
Scheme 32 The Paal-Knorr reaction of 25-hexanedione 35 and ethanolamine 36 to yield
37 to show how the kinetics of a process can be observed by using a controlled ramp
technique
Figure 37 A combination of the kinetic models for the reaction yielding 37 in Scheme 32
where the differing colours represent different values of S where S is a corrective
residence time multiplier to show the reproducibility of the controlled flow ramp
methodology S = 14 (blue) S = 13 (red) S = 12 (green) S= 23 (orange) steady-state
experiments = x Reproduced with permission
Controlled ramps have now been reported many times because of the
experimental advantages that they possess[225 228] They feature all of the
advantages of conventional flow chemistry as reported earlier in this
introduction without the disadvantages that arise from typical steady-state
sampling This allows users to generate accurate data-rich kinetic information
from a process whilst using minimal material and time This methodology will
112
feature heavily in the data acquisition portions of this chapter as we opted to use
controlled ramps for all of our experimentation to exploit these advantages
More recently further efficiency has also been realised by the
combination of temperature gradients[229] with controlled flow ramps[146 230-232]
This allows for the fitting of kinetic parameters including activation energies to
a non-isothermal dataset obtained from one flow experiment This methodology
therefore results in even less material and time consumption as all kinetic
parameters can be determined from one flow experiment Although this relatively
new technique has only been reported for very simple systems it represents an
advancement in performing exceptionally efficient kinetic experiments using
continuous flow
32 Experimental setup
All flow experiments were conducted using a tubular reaction vessel built
in-house consisting of a 116rdquo OD (132rdquo ID) stainless steel tubing coiled around
a cylindrical aluminium heated block Reagents were pumped using JASCO
PU980 dual piston HPLC pumps and flow streams were mixed using Swagelok
SS-100-3 tee-pieces Sampling was conducted by using a VICI Valco EUDA-
CI4W5 sample loop with a 05 microL aliquot volume This results in small aliquots
of reaction mixture automatically transferring to the HPLC for on-line analysis
The reaction system was maintained under a fixed back pressure using an
Upchurch Scientific 1000 PSI back pressure regulator Quantitative analysis was
performed using an Agilent 1100 series HPLC instrument fitted with a Sigma
Ascentis Express C18 reverse phase column (5cm x 46mm 27 microm) In all
experiments biphenyl was added to one reservoir as an internal standard This
experimental setup is shown in Figure 38
113
Figure 38 A photograph of the automated continuous flow reactor used for this work
Previous work using this experimental setup has shown that transient flow
experiments show an error of less than 4 in the observed rate constants due
to dispersion whilst steady-state experiments show an absolute error of 05
and a relative error of 024 [233 234] Therefore when considering the kinetic
simulations in these studies a plug flow model was adopted If we consider the
general axial dispersion plug flow reactor model[235] in eqn 33
Erstwhile studies by Hone[225] on our reactor platform and similar investigations
by Jensen[230 236 237] using a comparable system have found that dispersion only
introduces a small deviation from plug flow Given this eqn 33 can be simplified
to ignore the second order term to give eqn 34 - 36 This plug flow reactor
design equation can be utilised to model each species in the reaction with
respect to residence time
Where
bull DR = axial dispersion coefficient
11986311987711988921198621198941198891199112
minus 119906119889119862119894119889119911+ 119903119894 = 0 eqn 33
119906119889119862119894119889119911= 119903119894 eqn 34
120591 =119911
119906 eqn 35
119889119862119894119889120591= 119903119894 eqn 36
114
bull Ci = molar concentration of species i
bull z = the length along the reactor
bull u = superficial velocity
bull ri = rate of reaction of species i
For each chemical process concentration-time data is collected by using
linear flow ramp gradients with on-line HPLC analysis Steady-state is initially
achieved within the system then sampling begins during the controlled ramping
to the next steady-state condition capturing the transitory information This is
shown in Figure 39 At least two flow ramp experiments at different temperatures
are conducted with HPLC sampling every 2 - 4 minutes depending on the length
of the HPLC method The residence time is then calculated for each sampling
point using eqn 37 to translate this transient data to a time-series dataset
Figure 39 A mathematically correct representation of how linear gradient flow ramps can be
utilised to sample with a high data density on the initial curvature of the kinetic plot
Where diams = data point Tn = experiment temperature Q = total flow rate Time = time the
reaction has been running τ = residence time that the reaction mixture experiences
Where
bull τ = residence time
bull α = deceleration of flow rate
120591 = 119886 ∙ 119905 minus 1205830 +radic(1205830 minus 119886 ∙ 119905)2 + 2 ∙ 119871 ∙ 119886
119886 eqn 37
115
bull μ0 = initial flow rate
bull t = experiment time
bull L = reactor volume
33 Case study Phenyl acetate
The first reaction system explored using the computational approach was
the presupposed model of the reaction of phenol 38 with acetyl chloride 39
to form phenyl acetate 310 and hydrochloric acid 311 shown in Scheme 33
This first experimental verification of the approach was a final validation of the
approach by selecting a simple example with few chemical species The goal of
this study was to confirm the presupposed model shown in Scheme 33 as well
as identify the kinetic parameters for this process The validity of the controlled
ramp method would also be determined based on comparisons of the
experimental data with steady-state measurements Full experimental details
including the preparation of the feed solutions experimental setup flow ramping
rates HPLC analysis and raw data can be found in Chapter 731
Scheme 33 The reaction of phenol 38 with acetyl chloride 39 to form phenyl acetate 310
and hydrochloric acid 311
The kinetic data was obtained using the controlled ramp methodology at
two temperatures 65 degC and 75 degC and the four participating species were
inputted into the computational approach Based on these four species only two
reactions were calculated to be possible based on mass balance - these are
shown as the forward reaction eqn 38 and the backward reaction eqn 39
which are two of the three possible models that were generated The third model
shown as eqn 310 is the combination of these two allowed reactions resulting
in an equilibrium reaction model
Forward 38 + 39 rarr 310 + 311 eqn 38
116
Backward 310 + 311 rarr 38 + 39 eqn 39
Equilibrium 38 + 39 310 + 311 eqn 310
These three models were then each evaluated automatically by the
approach based on how well the simulated ODE curves converge to the time-
series data obtained from the controlled ramps The k values SSE error metric
and the AICC evaluation for each of the models is shown in Table 31 This data
represents a similar scenario to the simulated benzoic acid esterification case
study shown in Chapter 231 where the identified most likely model has a similar
error to another model but with more model terms The forward reaction model
fits both temperature datasets very well whilst the backward reaction model
does not fit to the experimental data at all as there is no direction in the
parameter space from the initial guess that the optimisation algorithm can travel
to make a favourable change in the convergence to the data The equilibrium
model fits the data equally as well as the forward model as it sets the backward
rate constant to be negligible leading to a low SSE However as this second
term adds no value in further lowering the SSE it is an unfavourable addition in
terms of the AICC evaluation which prefers more simplistic models and is
therefore considered a less appropriate model than the forward reaction term
alone
Table 31 Evaluation of the feasibility of each reaction model for the phenyl acetate study
By only inputting the species involved in the reaction then running two
controlled flow ramps with the automated computational approach described the
intuitive reaction model was confirmed and the kinetic parameters were
determined as k75 degC = 1045 x 10-3 plusmn 042 x 10-3 M-1 s-1 Ea = 693 plusmn 78 kJ mol-1
This combination of the correct reaction model and kinetic parameters allowed a
Reaction Model
k Values x 10-3 M-1 s-1
SSE M AICC Evaluation
65 degC 75 degC
Forward 515 1045 0019 136
Backward - - 0532 803
Forward +
Backward
515
0
1045
0 0019 1636
117
fit to the experimental data with an average residual of less than 3 x 10⁻³ M and
is shown in Figure 310 where the colours of the data and fitted ODEs mimic the
colours shown in Scheme 33 This study has shown that the transition from
simulated to real experimental data does not affect the accuracy of the approach
and that the approach can be applied to experimental data with confidence that
the correct reaction model is to be identified
Figure 310 Kinetic profiles for two flow ramp experiments at 65 degC and 75 degC where x =
phenol x = phenyl acetate mdash = phenol (ODE) mdash = phenyl acetate (ODE)
The equivalent temperature and residence time kinetic profiles were also
mapped by performing a series of conventional steady-state experiments to
ensure that a transient-flow regime remained accurate in model and parameter
determination Results showed excellent agreement in plotted curvature and
confirmed the same reaction model to be the most likely whilst identifying very
comparable kinetic constants Figure 311 shows a comparison of the two
sampling methodologies for this particular reaction See Chapter 7315 for
further details
118
Figure 311 Graphs showing the agreement between steady-state and flow ramp
measurements for the reaction of phenol with acetyl chloride where curves are fitted to
the steady-state data Where = phenol (steady-state) x = phenol (flow ramp) =
phenyl acetate (steady-state) x = phenyl acetate (flow ramp)
34 Case study Paracetamol
The next reaction system that was explored was the chemical system
producing paracetamol whereby 4-aminophenol 312 reacts with acetic
anhydride 313 to form paracetamol 314 and the over-reacted diacetamate
impurity 315 shown in Scheme 34 as the intuitive sequential reaction This
reaction system serves as the first real experimental multistep reaction that is
studied by this approach in order to determine the correct reaction model and
kinetic parameters However as there is a large disparity between the reaction
kinetics of step one and two quantitative kinetic analysis of both processes
simultaneously ie during a single ramp was not possible Therefore two sets
of differing temperature ramps were performed to investigate independently the
formation of paracetamol and diacetamate at 3060 degC and 160180 degC
respectively Each of these ramps differ in reactor size and hence residence
times as well as starting concentrations of acetic anhydride This was performed
to illustrate the capability of the approach to handle data from a variety of sources
whilst still accurately determining the kinetic properties of a process
Scheme 34 The reaction of 4-aminophenol with acetic anhydride to form paracetamol in step
one followed by a further reaction with acetic anhydride to form diacetamate in step two
Based on the five species identified including the acetic acid 316
formed with each reaction of acetic anhydride there were six reactions that were
calculated to be possible based on mass balance These reactions are shown
as eqn 311 - 316
312 + 313 rarr 314 + 316 eqn 311
119
314 + 316 rarr 312 + 313 eqn 312
314 + 313 rarr 315 + 316 eqn 313
315 + 316 rarr 314 + 313 eqn 314
312 + 315 rarr 314 + 314 eqn 315
314 + 314 rarr 312 + 315 eqn 316
Interestingly some of the mass-balance-allowed reactions identified by
the ILP optimisation seem very unlikely to happen based on chemical intuition
The reaction of 4-aminophenol with diacetamate shown in eqn 315 for
example suggests that it is possible for this starting material to react with the
over-reacted product to form two equivalents of the desired product We know
from intuition that the ester bond is too strong to break and react without a
chemical stimulus so we may have initial speculations on the feasibility of this
reaction However it can never be stated with certainty that this reaction cannot
happen until its feasibility is studied and therefore all possible models are still
generated to be evaluated This is a major advantage of this approach that
reactions and models that may otherwise be discarded due to chemical bias are
automatically evaluated without a chemistrsquos input This could lead to unexpected
(but statistically and chemically accurate) models that describe time-series data
which can lead to better process efficiency and even discover new reactions
63 potential models were identified from the five reactions and the
reaction model shown in Scheme 34 was determined to be the most likely
representation of the system by AICC The approach also determined the kinetic
parameters of step one k60 degC = 645 plusmn 026 M-1 s-1 Ea = 32 plusmn 12 kJ mol-1 and
step two k180 degC = 427 x 10-2 plusmn 017 x 10-2 M-1 s-1 Ea = 979 plusmn 65 kJ mol-1 by
fitting k values to each dataset in the kinetic fitting stage of the approach These
values us to assert that step one will likely be very fast at a wide range of
temperature ranges and that step two has a higher sensitivity to changes in
temperature when the energy of the system increases This identified model
alongside the identified kinetic parameters fits to the experimental data very
accurately with an average residual of less than 1 x 10⁻⁴ M and is shown in
Figure 312 The top 5 ranked models are shown in Table 32 with their
respective SSE error metric and AICC evaluation
120
Figure 312 Kinetic profiles for four flow ramp experiments at 30 degC 60 degC 160 degC and 180
degC where x = 4-aminophenol x = paracetamol x = diacetamate mdash = 4-aminophenol
(ODE) mdash = paracetamol (ODE) mdash = diacetamate (ODE) See Chapter 732 for full
experimental conditions and raw data
Table 32 Evaluation of the feasibility of each reaction model for the paracetamol study
Rank Reaction Model
k values s-1 or M-1 s-1 SSE
x103 M
AICC
Evaluation 30 degC 60 degC 160 degC 180 degC
1 312 + 313 rarr 314 + 316
314 + 313 rarr 315 + 316
59082
-
64471
-
-
00129
-
00427 0295 1292
2
314 + 316 rarr 312 + 313
312 + 313 rarr 314 + 316
314 + 313 rarr 315 + 316
01599
59509
-
09120
67519
-
-
-
00125
-
-
00427
0293 3690
3
312 + 313 rarr 314 + 316
312 + 315 rarr 314 + 314
314 + 313 rarr 315 + 316
59067
38065
-
64348
35719
-
-
-
00129
-
-
00428
0295 3692
4
315 + 316 rarr 314 + 313
312 + 313 rarr 314 + 316
314 + 313 rarr 315 + 316
23783
59188
-
27076
64641
-
00210
-
00130
00022
-
00430
0295 3692
121
5
314 + 314 rarr 312 + 315
312 + 313 rarr 314 + 316
314 + 313 rarr 315 + 316
00799
59258
-
02270
64833
-
-
-
00127
-
-
00425
0295 3692
Interestingly there are many reaction models that were found to have a
lower SSE error metric than the identified most likely model This is again where
the AICC ranking metric is used to great effect to balance the convergence to
experimental data as well as the simplicity of the model It is in these cases that
models that contain transformations discussed previously as very unlikely such
as in the rank 3 model that the terms are likely being used by the optimisation
algorithm to fit experimental noise For this reason this approach cannot be
completely autonomous and must require evaluation by a chemist when
observing the top rated models to be certain that the quality of the data assures
correct model determination - this was discussed in Chapter 225
This paracetamol study has shown that the approach can correctly identify
the reaction model and kinetic parameters for a multistep reaction using real
experimental data from different temperature flow ramps by inputted only the
observed species and time-series data As a side note - interestingly contrary to
common undergraduate laboratory experiment scripts[238] the over-reacted
diacetamate will not form in any measurable quantities in a conventional
undergraduate experiment Assuming that the reaction is similar in water to
acetonitrile the reaction doesnrsquot need refluxing and will go to full conversion of
paracetamol within seconds at room temperature Furthermore using the kinetic
parameters in this study and the recommended reflux temperature of common
laboratory manuals 100 degC and a typical 02 M reaction mixture of paracetamol
and acetic anhydride it would take approximately 12 years for the reaction to
achieve complete conversion to diacetamate
35 Case study Metoprolol
The final experimental case study that was explored was the chemical
system producing metoprolol whereby the epoxide starting material 317 reacts
with isopropylamine 318 to form metoprolol 319 which can further react to
form the bis-substituted impurity 320 shown in Scheme 35 Metoprolol is a
122
cardioselective beta-blocker commonly used for the treatment of hypertension
for which kinetic information would help in the process development stage of
manufacture at AstraZeneca This reaction system serves as the first real
experimental multistep reaction that is studied by this approach where parallel
reactions occur in tandem leading to a more difficult system for which to optimise
kinetic parameters and identify the correct reaction model
Scheme 35 The reaction of the epoxide starting material with isopropylamine to form
metoprolol as well as the overreaction to form the bis-substituted product
Two sets of two-temperature flow ramps were run on parallelised flow
reactor platforms one set in our lab in Leeds (190210 degC) and one set at
AstraZenecarsquos lab in Macclesfield (130150 degC) The two reactor platforms differ
in equipment specification and reactor volume and the two experimental sets
differ in temperatures and starting concentrations This parallelisation of
experiments on different systems was performed to further confirm the
reproducibility of this flow ramp methodology as corroborating data can be
achieved by an operator on separate reactor systems in different locations The
experimental results were then combined and the computational approach was
applied Full details of experimentation can be found in Chapter 7331
Based on the four species identified there were six reactions that were
calculated to be possible based on mass balance These reactions are shown
as eqn 317 - 322
317 + 318 rarr 319 eqn 317
319 rarr 317 + 318 eqn 318
319 + 317 rarr 320 eqn 319
320 rarr 319 + 317 eqn 320
123
319 + 319 rarr 318 + 320 eqn 321
318 + 320 rarr 319 + 319 eqn 322
63 reaction models were generated which correspond to every possible
combination of these allowed reactions and each of them were evaluated
sequentially by the approach The reaction model shown in Scheme 35 was
identified as the most likely representation of the system by AICC and the kinetic
parameters for the formation of metoprolol were found to be k170 degC = 0286 plusmn
0012 M-1 min-1 Ea = 724 plusmn 29 kJ mol-1 and for the formation of the bis-
substituted product k170 degC = 0019 plusmn 0001 M-1 min-1 Ea = 750 plusmn 30 kJ mol-1
This identified model alongside the kinetic parameters fit to the experimental data
very accurately with an average residual of less than 2 x 10⁻³ M and is shown
in Figure 313 The top 5 ranked models are shown in Table 33 with their
respective SSE error metric and AICC evaluation
Figure 313 Kinetic profiles for the flow ramp experiments at 130 degC 150 degC 190 degC and 210
degC where x = starting material x = Metoprolol x = bis-substituted product mdash = starting
material (ODE) mdash = Metoprolol (ODE) mdash = bis-substituted product (ODE) See Chapter
733 for full experimental conditions and raw data
124
Table 33 Evaluation of the feasibility of each reaction model for the metoprolol study
Rank Reaction Model
Kinetic parameters SSE
x10 M
AICC
Evaluation k170 degC min-1 or
M-1 min-1 Ea kJ mol-1
1 317 + 318 rarr 319
319 + 317 rarr 320
02857
00191
7242
7500
01212 -31145
2 317 + 318 rarr 319
319 rarr 318 + 320
03065
00260
7569
6552
01252 -30961
3
317 + 318 rarr 319
319 rarr 317 + 318
317 + 319 rarr 320
03008
00043
00188
7463
5379
7557
01188 -30768
4
317 + 318 rarr 319
319 + 317 rarr 320
320 rarr 319 + 317
02858
00202
00158
7245
8216
4920
01209 -30669
5
317 + 318 rarr 319
319 + 317 rarr 320
318 + 320 rarr 319 + 319
02857
00191
00003
7242
7508
4898
01212 -30653
The reference k values and activation energies were fitted directly in the
kinetic fitting stage of the approach and the experimental dataset was adjusted
to incorporate an artificial-zero time point which is a common practice when
fitting kinetics in order to assert an experimental lsquostart timersquo when concentrations
are known This can fix any fitting discrepancies that may occur as the first
measured time point may not be accurate - it is assumed however that all time
points following this first measurement are correct with respect to the first
measurement This is assumed only for the fitting of the kinetic parameters as
the parameters are likely to be more accurate In the case of this experiment
small deviations in asserting the time of the initial measurement may occur from
thermal expansion of the solvent because of the very high temperatures or from
pump flow rate errors
It has been shown in this study that it is possible to deconvolute reaction
pathways that are happening simultaneously using this computational approach
Differing-temperature experimental datasets were collected from different
125
experimental systems and collated to show that the correct model could be
identified even with data from different sources Kinetic parameters are also
identified from this approach that gives an excellent fit to the experimental data
This kinetic information can then be used to optimise this process between
given limits for temperature chemical equivalents and reaction time Using
current pricing for the starting material used in this work[239] other standard
industrial optimisation techniques would have been significantly more expensive
to implement When comparing this kinetic approach to other optimisation
methods steady-state kinetic measurements would have cost 24 more in
terms of material consumption and a screening and full factorial design of
experiments (DoE) optimisation would have cost 106 more - see Chapter
7336 for more details Then of course factoring in the cost of the time of the
chemist running the experiments (which hereby would be automated) and the
time for interpretation of the data and kinetics (which the approach elucidates)
this results in a significant reduction in labour time and overall cost which also
results in a more comprehensive overview of the possible kinetic models at play
36 Conclusion
It has been shown in this work that when real experimental time-series data
for a chemical process is available total process understanding can be achieved
without the need for high-level chemical intuition or human interference When
participating species are known or inferred complete sets of kinetic information
can be obtained via construction of all possible reaction models and identification
of their respective kinetic parameters This was undertaken by coupling an
automated flow reactor platform with a computational approach to deduce and
evaluate each kinetic model utilising optimisation algorithms After post-reaction
statistical analysis indicates which models are the most likely to be true based
on the experimental data provided which can be from batch or flow this
information can then be interpreted by a trained chemist to further differentiate
reaction pathways based on what should and should not be chemically possible
This approach has been proven to be powerful in determining the reaction
model and kinetic parameters in a variety of experimental circumstances The
approach will be particularly powerful in situations where the reaction model is
126
not completely understood for example when there are competing reaction
pathways The approach can be computationally expensive depending on the
number of possible reaction models although all of the optimisations carried out
by the approach on the work described was evaluated in less than 5 minutes on
a standard 4-core Intel i5-2310 processor However the added computational
cost is minimal compared to the reduction of time and experimental cost with
regards to kinetic evaluation Furthermore this approach can be run
automatically as bench scientists use their human resource for more challenging
tasks that cannot be automated
This work is the first implementation of the approach on experimental
time-series data and has been proven to efficiently interpret kinetic information
using minimal amounts of material to generate sufficient experimental data to
enable accurate model determination Using this methodology can considerably
outweigh the cost of further experimentation to discriminate speculated kinetic
models and can greatly reduce the time and cost barriers to full process
understanding
Chapter 4 The development of an improved computational
approach to kinetic model determination
41 Introduction
The aforementioned computational approach to kinetic model and
parameter determination as described in Chapter 2 and Chapter 3 is a powerful
tool for many experimental applications However there are two major limitations
to this tool The first limitation is in the reaction orders of the particular species
that are available - these orders are constrained to two integer orders 1 and 2
There are instances however where reactions can feature zero order reactions
or even have non-integer orders for which this approach currently cannot
facilitate and identify The second limitation is the inability of the approach to
model catalytic reactions and hence determine the reaction order of species
within a catalytic reaction As catalytic reactions are common in research
manufacturing and process development there are many applications where this
approach could ideally be utilised but is not currently applicable
127
Further development of the computational approach to rectify these
limitations can therefore increase its applicability greatly which further increases
the scope of the tool for chemical applications As the comprehensive model
evaluation aspect of this methodology has been proven to be effective for
determining correct reaction models the skeleton of the approach remains
unchanged This includes the two major steps of the approach model generation
and kinetic parameter fitting as well as the statistical measurements involved ie
AICC However although the basis for the approach remains the same many
structural changes of the programmed tool are necessary for the incorporation
of these new applications non-integer order models and catalytic models The
advancement of the approach to incorporate these changes makes it applicable
in almost all chemical processes which is the final step in answering the overall
research aim of the project to build an automated methodology to kinetic model
discrimination and parameter determination
42 Methodology advancement
421 Capabilities
When mass-balance-allowed reactions are identified by the approach
these reactions can then be compiled into a number of models that feature them
as discussed in Chapter 22 However there is a difference between an allowed
reaction based on the mass balance of the reactants and products and the rate
laws that govern the way that these species react All models are currently
compiled in a way that assumes a first order dependence on all species that are
featured Therefore for the mass-balance-allowed transformation of A to B as
shown in eqn 41 the rate law for the change in B is shown in eqn 42
A fundamental change to this methodology explores the same
transformation but using different reactivities by also investigating different
orders of the reacting species To explore different reaction orders including
non-integer reaction orders the rate law of the elementary reaction can be
described with differing powers of α shown in eqn 43 where α = 0 05 or 1
119860119896rarr119861 eqn 41
119889[119861]
119889119905= 119896[119860] eqn 42
128
This allows multiple chemical pathways to be explored that describe the
chemistry in different ways which were not available previously using this
methodology Each of the newly identified reactions are then treated as
lsquoavailablersquo reactions from which reaction models can be constructed in the same
way as described in Chapter 22 Therefore for each mass-balance-allowed
reaction identified by the approach that is lsquounimolecularrsquo there are 3
corresponding reaction orders possible and therefore 3 reactions that are added
to the pool of available reactions for kinetic model generation In the context of
this approach the transformation of a single mass-balance-allowed reaction to
every variant of its corresponding rate law is termed lsquoinflationrsquo
For lsquobimolecularrsquo reactions identified by the approach as mass-balancing
similar chemical descriptions can be written as with the lsquounimolecularrsquo reactions
For the reaction of A and B to form C there are multiple potential combinations
of the species orders α and β in the potential rate laws shown in eqn 44 and
45
These values of α and β can take the form of 0 05 1 as before However it is
extremely rare for two chemical species to react with a zero order dependence
on both species Therefore in an effort to lower the number of lsquoavailablersquo
reactions and hence lower the number of kinetic model evaluations necessary
these particular reactions are seen as unfeasible and are therefore not included
in the model generation stage This is also true of a zero order05 order
bimolecular reaction Therefore for every lsquobimolecularrsquo mass-balance-allowed
transformation identified by the approach there are 5 corresponding reactions
that are added to the pool of available reactions for kinetic model generation
This approach has also been modified to include catalytic reactions in the
model generation if the user selects the option to do so The user can select to
either include catalytic reactions or exclusively look at catalytic reactions (ie no
reactions can occur without a catalyst) As before all mass-balance-allowed
119889[119861]
119889119905= 119896[119860]120572 eqn 43
119860 + 119861119896rarr 119862 eqn 44
119889[119862]
119889119905= 119896[119860]120572[119861]120573 120572 + 120573 ge 1 120572 = 120573 ne 05 120572 120573 isin 0 05 1 eqn 45
129
transformations are identified then for the reaction of A and B to form C all
combinations of integer and non-integer catalytic reactions are generated within
the inflation step At this point the species that is user-selected to behave
catalytically is then incorporated into the rate laws For each mass-balance-
allowed (inflated) transformation the catalytic species can take the order of 05
1 or 2 and each of these rate law variations are constructed and added to the
pool of available reactions for kinetic model generation Note also that in these
catalytic reactions the dependence of the orders become empirical to a greater
extent whereby individual species are used and regenerated as opposed to
referring specifically to molecularity (ie number of species reacting together at
once) When catalytic reactions are included in model generation with the
selected catalytic species lsquoCatrsquo eqn 44 becomes eqn 46 and the general rate
law shown in eqn 45 becomes eqn 47 where γ = order of catalyst
All combinations of catalytic and non-catalytic reactions are generated For each
mass-balance-allowed lsquobimolecularrsquo reaction where catalytic variants are also
generated there are 15 possible corresponding reactions that are added to the
pool of available reactions for kinetic model generation This inflation step is
summarised qualitatively in Figure 41 showing how individual mass-balance-
allowed reactions can generate multiple transformations that are dependent on
different rate laws
119860 + 119861 + 119862119886119905119896rarr 119862 + 119862119886119905 eqn 46
119889[119862]
119889119905= 119896[119860]120572[119861]120573[119862119886119905]120574 120572 + 120573 ge 1 120572 = 120573 ne 05 120572 120573
isin 0 05 1 120574 isin 0512
eqn 47
130
Figure 41 An illustration of how the lsquoinflationrsquo step takes all mass-balance-allowed
transformations sequentially then deduces all allowed integer and non-integer orders
and generates corresponding rate laws for these transformations If catalytic reactions
are to be explored also rate laws for these catalytic dependencies are also generated
These transformations are all then saved from which full reaction models can be
constructed
These new capabilities incorporated into the overall computational
approach allow kinetic model determination for more complex chemical systems
for catalyticnon-catalytic processes with integer or non-integer orders This
approach can then be used as before whereby the chemical species and
experimental datasets are uploaded and the program runs an extensive kinetic
model evaluation loop followed by statistical analysis to determine the most
likely model However the major disadvantage to evaluating all possible models
generated after the newly incorporated inflation step is the huge computational
cost As the pool of available reactions is expanded greatly from simple mass-
balance-allowed reactions to all rate laws possibly governing these reactions
the number of possible models to be generated from these reactions grows
131
exponentially It is therefore not feasible with current technology to evaluate
every possible model However many of these possible models are also
unfeasible due to their inability to occur anyway Upon generation of a reaction
model the fitness of the model can be determined by employing simple and
appropriate logical and chemical constraints or rules These rules ensure that
generated models with an infeasibility to occur are identified and discarded
without the need for further evaluation and consumption of computational
resources
422 Rules
In order to evaluate only the models that are feasible a priori logical and
chemical rules must be applied to the available models to discard large numbers
of them as many models may feature redundant or impossible model terms
within them To postulate such rules requires logical yet simplistic
rationalisations of how reactions occur - rationalisations that seem obvious upon
realisation but are seldom taught or reported in the literature
To show the importance of these rules when running this approach
Scheme 41 shows a model reaction of maleic acid 41 reacting with methanol
42 to form the mono-product 43 and the di-product 44 which can be used
to show the number of models to be evaluated[240] In this reaction the maleic
acid is self-catalytic so this species behaves as both a starting material and a
catalyst Using these 5 species there are 6 possible mass-balance-allowed
reactions From these 6 reactions after inflation steps to look at all integer and
non-integer species dependencies and all catalytic and non-catalytic reactions
the total number of models to evaluate is gt1854900872 A specific number
cannot be quoted as just compiling this number of reaction models takes over
110 GB of memory and so an accurate estimate cannot be achieved with the
equipment available The evaluation of this number of models would likely take
several years to complete even when using high-performance computing
clusters It is therefore imperative that these rules drastically reduce the number
of models to evaluate to enable this methodology as a practical process
development application
132
Scheme 41 The self-catalysed reaction of maleic acid 41 and methanol 42 to form the
mono-product 43 and the di-product 44[240]
Rule 1 One variant of each reaction
There are many variations of the same elementary transformations to be
considered when building models for evaluation Examples of these variations
could be
bull A + B rarr C
bull A + B0 rarr C
bull A05 + B rarr C
bull etc
It is very unlikely however that the same reactants will undergo the same
chemical transformation to products with many different rate laws It would not
be expected that an elementary step would proceed in numerous ways in both
an overall second order and an overall first order manner to result in the same
product for example Therefore when compiling reaction models for evaluation
only one variant of each elementary reaction can be present in a single model
This also reduces the maximum number of model terms in a single model to the
total number of elementary reactions which in this example is 6 When this rule
is enforced during model generation for the model chemical system the total
number of models for evaluation is 8156735
Rule 2 Iterative model evaluations
Although it cannot be known what the lsquoaveragersquo number of model terms
in a lsquogeneralrsquo model is the assumption can be made that the user is investigating
a single synthetic step in a chemical process With a single synthetic step there
may be consecutive reactions and impurities formed but it would undoubtedly
be regarded as unlikely if any model was proposed with 30 model terms for
example In accepting this postulation it must therefore also be true that there is
a continuum of likelihood whereby a model will contain a certain number of model
133
terms especially when evaluated by AICC Therefore there must also exist a
limit of model terms that once reached it can be regarded that the corresponding
model is too unlikely to occur to be treated as a serious model candidate Without
a vast literature study it is not possible to know what this number should be and
this prospective study extends past the scope of this project - this discussion is
highlighted to simply introduce the concept of the existence of this upper limit of
model terms
Although this upper limit is unknown it is possible to start at a prospective
number of model terms then the user can decide if this number should be
increased based on the responses observed From chemical intuition based on
the findings of AICC values thus far in the project much of the data can be fitted
effectively with le 4 model terms and adding further model terms in general leads
to diminishing model evaluations This is of course a biased generalisation
based on the chemical systems that have been studied within the project
However using an initial upper limit of 4 model terms in the model generation
stage may be generally appropriate for single-step chemical systems - if this limit
does not give a satisfactory model that fits the supplied experimental data it can
be iteratively increased to 5 model terms then 6 etc As there are many models
that would require computationally expensive evaluations with over 4 model
terms this rule allows the user to determine if further evaluations with larger
models are necessary which could otherwise potentially waste computational
resources and more importantly time When this rule is enforced during model
generation in the model chemical system as well as the previous Rule 1 the
total number of models for evaluation is 668735
Rule 3 Catalytic reactions considered only
In order to reduce the number of available reactions from which to build
models and hence reduce the number of unnecessary model evaluations it is
assumed from the userrsquos input of a catalytic species that all mass-balance-
allowed reactions present will proceed only with a catalyst This is assumed due
to the available lower energy pathways in the presence of the catalyst This can
then be changed by user input if a suitable model is not found where the model
generation is re-run to incorporate reactions that both do and do not proceed
using the specified catalyst When this rule is enforced during model generation
134
as well as each previous rule the total number of models for evaluation in the
model chemical system is 173711
Rule 4 There must be at least one reaction from starting materials to products
As the starting concentrations are initially inputted into the system it can
be deduced which of the species are lsquostarting materialsrsquo In some instances there
may be species that are considered by the user to be the products of the reaction
at the first time point but in the context of this rule are also considered to be a
starting material For clarity this definition of lsquostarting materialrsquo refers only to
species that have mass in the initial concentrations The rule states that there
must be at least one term in the model that describes a decrease in the
concentration of one of the identified starting materials This logic-based rule
ensures with certainty that the models that are evaluated feature terms that
exhibit a change in concentrations Although seemingly obvious this rule is
necessary to remove these commonly occurring models that would only lead to
wasted computational resources
For example if there are four species in a chemical system (A B C D)
and their initial concentrations are 1 M 0 M 0 M and 0 M respectively the only
starting material identified is A Many models that are feasible according to mass
balance may not be feasible according to this rule as they may not exhibit a
change in concentration Table 41 shows some examples of allowed models
based on these starting concentrations that will progress onto the kinetic fitting
stage of the approach as well as disallowed models that will be discarded As
shown entries 3 and 4 will both feature a change in concentrations whereas
entries 1 and 2 will not and are hence discarded When this rule is enforced as
well as each previous rule the total number of models for evaluation in the model
chemical system is 121836
Table 41 A table showing examples of allowed and disallowed models according to Rule 4
Entry 1 2 3 4
Model B rarr C
B + B rarr D
B + B rarr D
D rarr A
A rarr D
B rarr C
A rarr B + B
B rarr C
Allowed
135
Rule 5 New lsquostarting materialsrsquo available from products
As an extension of Rule 4 relating to identifying lsquostarting materialsrsquo from
initial concentrations further starting materials can also be identified from the
products of these earlier reactions For example in entry 4 in Table 41 B is not
initially identified as a starting material However as A is a starting material
forming B as a product there is certain to be some concentration of B as time
progresses meaning that B can also be viewed as a starting material at some
point Therefore as starting materials in entry 4 are A and B both reactions in
this model are allowed because they both feature a change in concentration from
a starting material to another species
Under Rule 5 models that feature model terms incurring a decrease in
concentration from these newly identified starting materials only can be allowed
Therefore entry 4 will be a model that is progressed onto the model evaluation
stage However in entry 3 in Table 41 it can be noted that the initially identified
starting material (A) forms D as a product meaning that the starting materials in
this model are A and D The second model term features a reaction of B to form
C but this logic-based rule highlights that there is no possible scenario where B
will be formed in order to further react If this model were to progress onto model
evaluation it would certainly be an over-trained model and would rank lowly
according to an AICC evaluation as the second model term will not provide a
benefit to the model over just having the first model term alone Therefore under
Rule 5 entry 3 would be disallowed and not progress onto the model evaluation
stage thereby saving computational resources on this redundant model When
all rules are enforced including Rule 5 the total number of evaluations for the
model system is 98725
Final considerations for model generation
Other considerations were also made when compiling models in the
model generation stage specifically referring to the allowed orders of particular
species For catalytic species the allowed orders were determined to be 05 1
and 2 This is because the order in a catalytic species of a system being greater
than gt2 or =15 are too rare to warrant serious consideration and would incur a
significantly greater computational expense to evaluate all of the generated
models
136
Much thought was exercised as to whether a zero-order dependence on
a catalyst is possible as this discussion is missing from the literature and general
teaching It can be postulated that since the presence of a catalyst allows a more
favourable lower energy pathway there must therefore be some dependence on
the concentration of the catalyst for this lower energy pathway to progress This
rationalisation infers that it is not possible for a zero-order dependence of
catalyst but there may always be selected cases where this can be empirically
true In any case if a zero-order dependence of catalyst is possible it is too
unlikely to warrant serious consideration as this would generate many more
models to be evaluated
For non-catalytic systems this approach attempts to build reaction
models from base-level elementary reactions (where the both the stoichiometry
and order of participating species are 1 for each occurrence of the species in
the reaction scheme) However there are two notable exceptions 0 and 05
orders which are inherently more empirical in nature A zero-order dependence
on a particular species in this approach will still have a stoichiometry of 1
whereby one molecule of this species is consumed in the reaction but the
reaction rate does not depend upon its concentration A 05 order dependence
will have both a stoichiometry of 05 and an order of 05 There are many other
integer and non-integer empirical dependencies of varying stoichiometry and
order that are possible in complex chemical reaction networks (CRNs) However
these dependencies are very rare and not common enough to warrant serious
consideration for this computational approach as this would generate many more
models to proceed into model evaluation resulting in a much higher
computational expense Therefore reactions are only considered for model
generation with species that have orders in the rate laws of 0 05 or 1
423 Overview
This updated computational approach to kinetic model selection and
parameter identification was developed in MATLAB by adjusting the previously
developed tool reported in Chapter 2 and Chapter 3 Firstly the user inputs
experimental data and the participating species into the system The approach
identifies all possible reactions that can happen based on mass balance then
generates all conceivable rate laws subject to basic chemical intuition in the
inflation step (and subject to the user defining a catalytic species) Every
137
combination of these rate laws are then compiled into different reaction models
followed by logical rule enforcements to remove vast numbers of redundant or
wasteful models All remaining models are sequentially loaded then kinetic
parameters are optimised to increase convergence of ordinary differential
equation (ODE) curves to the experimental data Finally each model is then
statistically evaluated and ranked highlighting the most likely model based on
the experimental data supplied The approach overview is highlighted in Figure
42
Figure 42 An overview of the updated computational approach to kinetic model and
parameter determination
This updated methodology represents a significantly improved automatic
tool for process development by comprehensively evaluating every possible
model without the need for chemical intuition or more importantly chemistsrsquo
time This approach has been upgraded to allow both catalytic reactions and
reactions with non-integer orders to be identified therefore vastly expanding its
scope However it is still important to note that although this tool is powerful it
is ultimately data-driven and subsequently must only be used as a
complementary tool Therefore after all model evaluations the tool must still be
138
used in conjunction with real chemical intuition by an end user to determine that
the models identified as most likely are accurate and consistent with the science
43 Simulated verifications of the approach
In the same manner as the previous methodology it is first important to
verify that the approach identifies the correct models and kinetic parameters
before conducting any real experimentation Several simulated case studies
were conducted that feature different true kinetic models showing how this
methodology has been adapted to identify catalytic speciesrsquo orders as well as
non-integer and zero order species dependencies in chemical systems These
case studies feature reactions from the literature whereby simulated
experimental data is generated from known models and kinetic parameters
To simulate the experimental data as shown in Chapter 23 the true
model and kinetic parameters reported in the literature source are inputted into
MATLAB The experiments are then simulated at particular temperatures and
initial sets of concentrations by using an ODE solver to evaluate the change in
species concentrations over a given experimental timeframe Individual data
points are then extracted from this timeframe which then represent experimental
data points for the simulated case study Up to plusmn 2 relative error is then added
to each measurement to approximate this simulated data more closely to real
experimental data
431 Case study SNAr kinetics
The first simulated case study was the SNAr reaction described in Scheme
42 where 24-difluoronitrobenzene (starting material SM) 45 reacts with
pyrrolidine 46 to form either the ortho-substituted product 47 or the para-
substituted product 48 - both of which can then react further with pyrrolidine to
form the bis-substituted product 49 and form hydrofluoric acid 410 as a
byproduct in each step[225] This case study features lsquosimplersquo elementary
reactions in the true model as there are no non-integer or zero order
dependencies However this scenario is still important to study as the new
approach must still be able to correctly identify model structures and kinetic
parameters of systems that feature only these elementary reactions In this case
both the old approach and the new approach were run in order to determine if
139
they both arrive at the same identified model as they should This should confirm
that even in a multicomponent process the new approach will still identify the
correct elementary reactions instead of substituting non-integer or zero order
rate laws
Scheme 42 The reaction of 24-difluoronitrobenzene 45 with pyrrolidine 46 to form the
ortho-substituted product 47 and the para-substituted product 48 Consecutive
reactions then occur to form the bis-substituted product 49 In each reaction
hydrofluoric acid 410 is formed[225]
4311 Data acquisition
The multistep SNAr reaction model reported by Hone et al consists of 4
second-order reactions These reactions were used to generate the ODEs
shown in eqn 41 - 46 The reported kinetic constants for these three steps
were
bull Step one k90 degC = 0579 M-1 s-1 Ea = 333 kJ mol-1
bull Step two k90 degC = 0027 M-1 s-1 Ea = 353 kJ mol-1
bull Step three k90 degC = 0009 M-1 s-1 Ea = 389 kJ mol-1
bull Step four k90 degC = 0016 M-1 s-1 Ea = 448 kJ mol-1
Five simulated data sets were generated at 30 degC by using eqn 27 to calculate
k values with the following initial concentrations
bull 1 M SM 45 11 M pyrrolidine 46 0 M ortho-substituted product 47 0
M para-substituted product 48 0 M bis-substituted product 49 and 0 M
hydrofluoric acid 410
140
bull 08 M SM 45 15 M pyrrolidine 46 0 M ortho-substituted product 47
0 M para-substituted product 48 0 M bis-substituted product 49 and 0
M hydrofluoric acid 410
bull 1 M SM 45 2 M pyrrolidine 46 0 M ortho-substituted product 47 0 M
para-substituted product 48 0 M bis-substituted product 49 and 0 M
hydrofluoric acid 410
bull 1 M SM 45 25 M pyrrolidine 46 0 M ortho-substituted product 47 0
M para-substituted product 48 0 M bis-substituted product 49 and 0 M
hydrofluoric acid 410
bull 12 M SM 45 3 M pyrrolidine 46 0 M ortho-substituted product 47 0
M para-substituted product 48 0 M bis-substituted product 49 and 0 M
hydrofluoric acid 410
119889[120786 120787]
119889119905= minus1198961[120786 120787][120786 120788] minus 1198962[120786 120787][120786 120788] eqn 41
119889[120786 120788]
119889119905= minus1198961[120786 120787][120786 120788] minus 1198962[120786 120787][120786 120788] minus 1198963[120786 120789][120786 120788]
minus 1198964[120786 120790][120786 120788]
eqn 42
119889[120786 120789]
119889119905= 1198961[120786 120787][120786 120788] minus 1198963[120786 120789][120786 120788] eqn 43
119889[120786 120790]
119889119905= 1198962[120786 120787][120786 120788] minus 1198964[120786 120790][120786 120788] eqn 44
119889[120786 120791]
119889119905= 1198963[120786 120789][120786 120788] + 1198964[120786 120790][120786 120788] eqn 45
119889[120786 120783120782]
119889119905= 1198961[120786 120787][120786 120788] + 1198962[120786 120787][120786 120788]
+1198963[120786 120789][120786 120788] + 1198964[120786 120790][120786 120788]
eqn 46
2 relative error was then added to each data point in these simulated
data sets then used as the inputted experimental data for both the old and new
computational approach These data sets can be found in Chapter 741
4312 Results and discussion
As the initial ILP optimisation proceeds in the same manner for both the
old and new approaches the mass-balance-allowed reactions identified in each
case are the same It is only the subsequent rate laws and models that differ in
141
the model generation steps between the old and new approaches From the 6
species inputted there are 16 mass-balance-allowed reactions that were
identified shown in eqn 47 - 422
48 rarr 47 eqn 47
47 rarr 48 eqn 48
45 + 46 rarr 47 + 410 eqn 49
47 + 410 rarr 45 + 46 eqn 410
45 + 49 rarr 47 + 47 eqn 411
45 + 46 rarr 48 + 410 eqn 412
46 + 47 rarr 49 + 410 eqn 413
47 + 47 rarr 45 + 49 eqn 414
49 + 410 rarr 46 + 48 eqn 415
48 + 410 rarr 45 + 46 eqn 416
46 + 48 rarr 49 + 410 eqn 417
45 + 49 rarr 47 + 48 eqn 418
45 + 49 rarr 48 + 48 eqn 419
49 + 410 rarr 46 + 47 eqn 420
47 + 48 rarr 45 + 49 eqn 421
48 + 48 rarr 45 + 49 eqn 422
Old approach
When running the old approach every combination of the 16 identified
mass-balance-allowed transformations was constructed resulting in 65535
unique models to be evaluated All of these resulting models were evaluated by
the approach which incurred a computation time of 13 hours (see Chapter 762
for details on computer specifications)
Each of these models were ranked based on their AICC evaluation and it
was found that the highest ranked model was also the correct model with kinetic
parameters optimised to values that were very close to the literature values used
to generate the data As with previous simulations described in Chapter 23 the
142
optimisation is assumed to be correct as the error in the fitted parameters is
negligible considering that artificial error was added to the data set The top five
performing models are shown in Table 42 where the optimised k values are
shown as well as their corresponding SSE and AICC values
Table 42 A table showing the top five ranked models for the SNAr case study as identified by
the old approach The kinetic parameters for each reaction within the model are shown
as well as the SSE and AICC evaluation
Model
rank Model kx M-1 min-1 SSE M AICC
1
45 + 46 rarr 47 + 410
45 + 46 rarr 48 + 410
47 + 46 rarr 49 + 410
48 + 46 rarr 49 + 410
00656
00026
00007
00008
00040 -30627
2
45 + 46 rarr 47 + 410
45 + 46 rarr 48 + 410
47 + 46 rarr 49 + 410
48 + 46 rarr 49 + 410
45 + 49 rarr 47 + 48
49 + 410 rarr 46 + 48
00657
00026
00007
00010
00065
lt00001
00039 -30125
3
45 + 46 rarr 47 + 410
45 + 46 rarr 48 + 410
47 + 46 rarr 49 + 410
48 + 48 rarr 49 + 45
00657
00027
00007
00174
00044 -30097
4
45 + 46 rarr 47 + 410
45 + 46 rarr 48 + 410
47 + 46 rarr 49 + 410
48 + 46 rarr 49 + 410
45 + 49 rarr 47 + 48
00663
00028
00007
00010
00026
00042 -30053
5
45 + 46 rarr 47 + 410
45 + 46 rarr 48 + 410
47 + 46 rarr 49 + 410
48 + 46 rarr 49 + 410
00655
00026
00007
00009
00041 -29946
143
45 + 49 rarr 47 + 47
45 + 49 rarr 48 + 48
00143
00065
New approach
When running the new approach all allowed combinations of the mass-
balance-allowed reactions and corresponding non-integer and zero order rate
laws were compiled subject to the rules described earlier in Chapter 422 This
model generation resulted in 141505 unique models to be evaluated by the
approach which incurred a 28 hour computation time (see Chapter 762 for
details on computer specifications)
Each of these models were ranked based on their AICC and it was found
that the highest ranked model was also the correct model with kinetic
parameters optimised to values that were very close to the literature values that
were used to generate the data As highlighted in the old approach section the
optimisation is assumed to be correct as the error in the fitted parameters is
negligible considering that artificial error was added to the dataset The top five
performing models from this new approach are shown in Table 43 where the
optimised k values are shown as well as their corresponding SSE and AICC
values
Table 43 A table showing the top five ranked models for the SNAr case study as identified by
the new approach The kinetic parameters for each reaction within the model are shown
as well as the SSE and AICC evaluation α denotes a variable molar dependence within
the kinetic parameter units depending on the rate law
Model
rank Model kx Mα min-1 SSE M AICC
1
45 + 46 rarr 47 + 410
45 + 46 rarr 48 + 410
47 + 46 rarr 49 + 410
48 + 46 rarr 49 + 410
00656
00026
00007
00008
00040 -30627
2
45 + 46 rarr 47 + 410
46 + 47 rarr 49 + 410
480 rarr 47
47 rarr 48
00680
00007
00501
00394
00042 -30333
144
3
45 + 46 rarr 47 + 410
45 + 46 rarr 48 + 410
47 + 46 rarr 49 + 410
48 + 48 rarr 49 + 45
00657
00027
00007
00174
00044 -30097
4
45 + 46 rarr 47 + 410
45 + 46 rarr 48 + 410
47 + 46 rarr 49 + 410
48 + 41005 rarr 45 + 46
00640
00024
00007
00008
00061 -28521
5
45 + 46 rarr 47 + 410
47 + 46 rarr 49 + 410
47 rarr 48
48 rarr 47
00670
00007
00041
00997
00065 -28276
Discussion
This initial simulated case study has shown that it is still possible to identify
the correct reaction model and kinetic parameters with this new approach for a
lsquosimplersquo reaction system featuring a first-order dependencies on all species The
most-likely identified model and corresponding SSEAICC values were the
same in this instance for both the old and new approach which is to be expected
if the new approach is functioning correctly As shown in the old approach there
are models that have a greater convergence to the experimental data (and hence
a lower SSE) but the statistical analysis correctly assigns these models an
unfavourable AICC based on their extra (insignificant) model terms However as
the initial limit of 4 terms in a model is enforced in the new approach it can be
determined by the user that compiling and evaluating the 5-term-models is not
required based on the marginal possible SSE benefits These small benefits are
very unlikely to warrant extra terms based on AICC evaluation as the
convergence to experimental data is already excellent meaning that the model
identified is very likely to be correct An example kinetic plot showing the fit of
the identified model to the experimental data is shown in Figure 43 - this is the
fifth simulated experiment where the starting concentrations were 12 M 24-
difluoronitrobenzene and 3 M pyrrolidine at 30 degC
145
Figure 43 The fit of the identified model and kinetic parameters to the generated experimental
data with starting concentrations of 12 M 24-difluoronitrobenzene and 3 M pyrrolidine at
30 degC Where x = 24-difluoronitrobenzene x = ortho-substituted product x = para-
substituted product x = bis-substituted product mdash = 24-difluoronitrobenzene (ODE) mdash
= ortho-substituted product (ODE) mdash = para-substituted product (ODE) mdash = bis-
substituted product Plot only shown to 500 minutes to the show curvature of the initial
data points
It has been shown that the new approach can identify the correct model
and kinetic parameters for a multistep process with first-order dependencies on
all species with the same accuracy as expected from the old approach
Therefore it is now possible to confidently move on to simulated case studies
where rate laws are more complex featuring catalytic reactions and orders that
are non-integer or zero
432 Case study Pentyne kinetics
This simulated case study features a chemical system that reacts with a zero-
order dependence on one of the species[241] The starting material 411 reacts
with the spirodiene 412 to form the product 413 and LiBr 414 as shown in
Scheme 43 The true rate law however shows a first-order dependence on the
starting material and a zero-order dependence on the spirodiene Interestingly
this reaction order has been used as evidence for the existence of a pentyne
species as this order suggests an initial reaction of the starting material to form
146
a much more reactive species leading to the zero-order dependence on the
spirodiene
Scheme 43 The reaction of the starting material 411 with the spirodiene 412 to form the
product 413 and LiBr 414[241]
4321 Data acquisition
The overall first-order reaction model reported by Gilbert et al[241] was used
to generate the ODEs shown in eqn 423 - 426 Three isothermal simulated
data sets were generated using these ODEs with the k value of 000846 min-1 at
-78 degC with the following initial concentrations
bull 1 M 2-bromocyclopentenyl lithium (starting material) 411 08 M
spirodiene 412 0 M product 413 0 M LiBr 414
bull 12 M 2-bromocyclopentenyl lithium (starting material) 411 15 M
spirodiene 412 0 M product 413 0 M LiBr 414
bull 1 M 2-bromocyclopentenyl lithium (starting material) 411 1 M
spirodiene 412 0 M product 413 0 M LiBr 414
119889[120786 120783120783]
119889119905= minus1198961[120786 120783120783] eqn 423
119889[120786 120783120784]
119889119905= minus1198961[120786 120783120783] eqn 424
119889[120786 120783120785]
119889119905= 1198961[120786 120783120783] eqn 425
119889[120786 120783120786]
119889119905= 1198961[120786 120783120783] eqn 426
2 relative error was then added to these simulated data sets then used
as the inputted experimental data for the computational approach These data
sets can be found in Chapter 742
4322 Results and discussion
147
From these 3 species there are 2 mass-balance-allowed reactions that
can be identified shown in eqn 427 and eqn 428 From these two reactions
the corresponding rate laws were generated and all models were compiled
subject to the rules defined in Chapter 422 - this resulted in 30 unique models
to be evaluated by the approach
411 + 412 rarr 413 + 414 eqn 427
413 + 414 rarr 411 + 412 eqn 428
All 30 models were evaluated by the computational approach incurring a
computation time of around lt1 minute (see Chapter 761 for details on computer
specifications) Each of these models were ranked based on their AICC and it
was found that the highest ranked model was also the correct model with kinetic
parameters optimised to values that were very close to the generated values
The top five performing models are shown in Table 44 where the optimised k
values are shown as well as their corresponding SSE and AICC values
Table 44 A table showing the top five ranked models for the pentyne case study as identified
by the new approach The kinetic parameters for each reaction within the model are
shown as well as the SSE and AICC evaluation α denotes a variable molar dependence
within the kinetic parameter units depending on the rate law
Model
rank Model kx Mα min-1 SSE M AICC
1 411 + 4120 rarr 413 + 414 00085 00046 -134903
2 411 + 4120 rarr 413 + 414
413 + 414 rarr 411 + 412
00085
lt00001 00046 -132515
3 411 + 4120 rarr 413 + 414
413 + 41405 rarr 411 + 412
00085
lt00001 00046 -132515
4 411 + 4120 rarr 413 + 414
4130 + 414 rarr 411 + 412
00085
lt00001 00046 -132514
5 411 + 4120 rarr 413 + 414
413 + 4140 rarr 411 + 412
00085
lt00001 00046 -132514
Interestingly all five of these top-ranked models all have the same SSE
values and ranks 2 - 5 all have very similar AICC evaluations It is clear from
these models that the primary reason that they score highly is due to the
148
presence of the true model term 411 + 4120 rarr 413 + 414 One extra model
term is present that is rendered negligible but as the algorithm is forced to fit it
it is fitted with a value lt00001 In the old approach these negligible reactions
could be found but not repeated whereas in the new approach every variation
of the rate law of a particular negligible reaction can be repeated and score highly
according to AICC
Nonetheless the highest ranked model according to the approach is the
true kinetic model and the corresponding k value was also identified correctly
This case study shows that it is possible for the approach to identify models that
feature reactions that do not have typical species order dependencies of 1
therefore also that it can be used for real experimentation featuring zero or non-
integer order model terms An example kinetic plot showing the fit of the identified
model to the simulated experimental data is shown in Figure 44 - this is the first
experiment where the starting concentrations were 1 M starting material and 08
M spirodiene at -78 degC
149
Figure 44 The fit of the identified model and kinetic parameters to the generated experimental
data with starting concentrations of 1 M starting material and 08 M spirodiene at -78 degC
Where x = starting material x = spirodiene x = product mdash = starting material (ODE) mdash
= spirodiene (ODE) mdash = product (ODE)
433 Case study Ytterbium catalysis
The final simulated case study involves a ytterbium catalysed reaction
with lsquonon-normalrsquo empirical rate laws[242] 1-Phenyl-2-trimethylsilylacetylene
(starting material) 415 reacts with diphenylphosphine 416 in the presence of
a ytterbium catalyst ([Yb(η2-Ph2CNPh)(hmpa)3]) 417 to form the product 418
as shown in Scheme 44
Scheme 44 The reaction of the starting material 415 with diphenylphosphine 416 in the
presence of the ytterbium catalyst 417 to form the product 418 where [Yb] Yb(η2-
Ph2CNPh)(hmpa)3[242]
4331 Data acquisition
The complex order dependencies for the reaction model reported by Takaki
et al[242] consists of 1 reaction that was used to generate the ODEs shown in
eqn 429 - 432 In the true empirical rate law the order in the starting material
is 1 the order in diphenylphosphine is 0 and the order of the ytterbium catalyst
is 2 Four isothermal simulated data sets were generated at 25 degC using these
ODEs with the k value of 9324 M2 h-1 with the following initial concentrations
bull 2 M starting material 415 2 M diphenylphosphine 416 02 M ytterbium
catalyst 417 0 M product 418
bull 15 M starting material 415 2 M diphenylphosphine 416 01 M
ytterbium catalyst 417 0 M product 418
bull 14 M starting material 415 18 M diphenylphosphine 416 03 M
ytterbium catalyst 417 0 M product 418
bull 22 M starting material 415 16 M diphenylphosphine 416 025 M
ytterbium catalyst 417 0 M product 418
119889[120786 120783120787]
119889119905= minus119896 [120786 120783120787][120786 120783120789]2 eqn 429
150
119889[120786 120783120788]
119889119905= minus119896 [120786 120783120787][120786 120783120789]2 eqn 430
119889[120786 120783120789]
119889119905= minus2119896 [120786 120783120787][120786 120783120789]2 + 2119896 [120786 120783120787][120786 120783120789]2 eqn 431
119889[120786 120783120790]
119889119905= 119896 [120786 120783120787][120786 120783120789]2 eqn 432
2 relative error was then added to these simulated data sets then
used as the inputted experimental data for the computational approach These
data sets can be found in Chapter 721
4332 Results and discussion
Based on the inputs of the molecular weights for this system there are
two mass-balance-allowed reactions However as it is known that this is a
catalytic system these two reactions must be facilitated by the user-defined
ytterbium catalyst 417 shown in eqn 433 and 434 It is then the role of the
approach to identify all combinations of allowed reactions and rate laws to
determine which is the most likely model
415 + 416 120786120783120789rarr 418 eqn 433
415 + 416 120786120783120789rarr 418 eqn 434
After the model generation stage 105 models were identified and
evaluated by the computational approach incurring a time of around 1 minute
(see Chapter 762 for details on computer specifications) Each of these models
were ranked based on their AICC and it was found that the highest ranked model
was also the correct model with the k value optimised to a value that was very
close to the value used for data generation The top five performing models are
shown in Table 45 where the optimised k values are shown as well as their
corresponding SSE and AICC values
Table 45 A table showing the top five ranked models for the ytterbium catalysis case study as
identified by the new approach The kinetic parameters for each reaction within the
model are shown as well as the SSE and AICC evaluation α denotes a variable molar
dependence within the kinetic parameter units depending on the rate law
Model
rank Model kx Mα h-1 SSE M AICC
1 415 + 4160 4172
rarr 418 93191 928 x 10-4 -24138
151
2
415 + 4160 4172
rarr 418
418 41705
rarr 415 + 416
93191
lt00001 928 x 10-4 -23910
3
415 + 4160 4172
rarr 418
418 4171
rarr 415 + 416
93191
lt00001 928 x 10-4 -23910
4
415 + 4160 4172
rarr 418
418 4172
rarr 415 + 416
93191
lt00001 928 x 10-4 -23910
5 415 + 416 4172
rarr 418 80784 11549 -1335
As in the previous pentyne case study four of these top-ranked models
all have the same SSE values and ranks 2 - 4 all have very similar AICC
evaluations The reasoning for this appears to be the same as previously
discussed where the primary reason that they score highly is due to the
presence of the true model term 415 + 4160 4172
rarr 418 One extra model term
is present in ranks 2 - 4 that the algorithm is forced to fit although it does not
provide any significance to the model hence it is fitted with a value lt00001
Nonetheless the highest ranked model according to the approach is the
true kinetic model and the corresponding k value was also identified correctly
This case study shows not only that it is possible to identify models that feature
catalytic species but also that the orders of the catalytic and non-catalytic
species can be identified As a lsquotypicalrsquo catalytic example is more likely to be first-
order with respect to all species the ability that the approach has shown to
identify non-normal order dependencies in the rate law for multiple species
inspires confidence that the approach will be successful in its use in real
experimentation An example kinetic plot showing the fit of the identified model
to the simulated experimental data is shown in Figure 45 - this is the second
experiment where the starting concentrations were 15 M starting material 2 M
diphenylphosphine and 01 M ytterbium catalyst at 22 degC
152
Figure 45 The fit of the identified model and kinetic parameters to the generated experimental
data with starting concentrations of 15 M starting material 2 M diphenylphosphine and
01 M ytterbium catalyst at 22 degC Where x = starting material x = diphenylphosphine x
= product mdash = starting material (ODE) mdash = diphenylphosphine (ODE) mdash = product
(ODE)
44 Conclusion
It has been shown that the previously built computational approach to
kinetic modelling can be adapted to catalytic systems and rate laws with non-
normal order dependencies This new approach has been proven to work
successfully for three simulated case studies featuring different modelling
criteria with sets of experimental data inputs with artificial errors The success
shown from these studies inspires confidence that the approach can be
implemented with real experimental data
The scope of the approach has increased substantially following the
improvements in this work and can now be used for many more chemical
applications However due to the comprehensive nature of the approach the
computational expense has also increased as there are many more reactions
that must be considered when building reaction models This computational
stress as before can be reduced by replacing existing computer hardware with
more computer logical cores - this is because the code is highly parallelised and
153
the speed of the approach is directly proportional to the number of computer
cores available Although the approach is very powerful this computational
expense may still be cumbersome for desktop computers depending on the
number of species involved in a particular chemical system However as time
passes processing technology consistently improves and there will undoubtedly
be a time where millions of models can be evaluated at a desk in a matter of
hours via comprehensive methodologies such as this
This comprehensive approach to kinetic model and parameter
determination has been shown to be successful in simulated case studies - the
next step is to prove the efficiency of this methodology with real experimental
case studies The aim of these case studies is to show that this approach can
correctly identify models of various-complexity chemical processes thereby
realising the main aim of this project in developing an automated kinetic analysis
tool with a wide scope for process development
Chapter 5 Experimental applications of the new approach
51 Introduction
With the development of the new computational approach complete and
verified with multiple simulated case studies the viability of the approach for real
experimental data must also be tested Real experimental case studies are to be
conducted to measure the ability of this new and final computational approach
As the scope of this new approach has been broadened to include
catalytic reactions and species order dependencies of zero or 05 it is important
to study chemical systems that may exhibit these properties to prove that the
new approach can identify these models It is also important that the approach
can continue to identify more lsquosimplersquo models that have species order
dependencies of 1 as well as utilise kinetic data from any means This is
because the kinetic motifs often cannot be determined a priori and the beneficial
feature of this methodology is that models are identified and ranked according to
statistical measures This removes bias and therefore considers all rate laws for
every possible model meaning that the approach does not know initially if a
154
model is supposed to contain a zero order term or not for example and will only
determine this after the comprehensive model evaluations
Experimental case studies from any reaction process (batch flow etc)
and analytical technique (HPLC NMR etc) will be used in these final
experimental verifications These case studies will prove that the approach can
identify models including lsquonormalrsquo zero or 05 species order dependencies for
both catalytic and non-catalytic processes The research project aim will thereby
be realised by ultimately developing a powerful automated methodology to be
used in process development for the modelling of real chemical systems
52 Case study SNAr kinetics
The first reaction system explored using the new computational approach
was the presupposed model of the reaction of 246-trichloropyrimidine (SM) 51
with ethyl 4-aminobutanoate 52 to form the major 2-substituted SNAr product
53 and the minor 4-substituted SNAr product 54 as shown in Scheme 51 As
the ethyl 4-aminobutanoate is present in its hydrochloride salt the hydrochloric
acid present (and generated from subsequent SNAr reactions as 55) is
neutralised by an excess of triethylamine
Scheme 51 The reaction of 246-trichloropyrimidine (SM) 51 with ethyl 4-aminobutanoate
52 to form the major 2-substituted SNAr product 53 and the minor 4-substituted SNAr
product 54
As the desired major product from this reaction can be further reacted to
synthesise bioactive derivatives of pharmaceuticals[243 244] this initial
transformation is of interest in the process development of these molecules A
collaborator in the Spring group at Cambridge University Hikaru Seki has a
particular interest in these bioactive molecules for his research project and
155
wanted to maximise the synthetic yield of the 2-substituted SNAr product 53 by
obtaining kinetic understanding of the system Therefore all practical
experimental work in this case study was conducted by Hikaru Seki at Cambridge
University then the results were forwarded to Leeds for kinetic analysis
Four kinetic experiments were conducted at -25 degC 0 degC 25 degC and 50
degC with three replicate experiments at 25 degC Each experiment was conducted
in batch in an NMR tube within a 500 MHz NMR spectrometer which allowed
continuous NMR acquisition at a rate of approximately one sample per 80
seconds This continuous reaction monitoring generates a large data density for
the subsequent kinetic analysis using the new computational approach by
monitoring the proton peaks of the individual species shown in Figure 51 Full
experimental details can be found in Chapter 751
Figure 51 The distinctive proton peaks shown in red that are monitored via NMR as time
progresses in the SNAr case study
Based on the five species identified there were six reactions that were
calculated to be possible based on mass balance - these reactions are shown
as eqn 51 - 56 From these reactions all corresponding rate laws were
generated and all models were compiled subject to the rules defined in Chapter
422 This resulted in 3320 unique models to be evaluated by the approach
53 rarr 54 eqn 51
54 rarr 53 eqn 52
51 + 52 rarr 53 + 55 eqn 53
53 + 55 rarr 51 + 52 eqn 54
51 + 52 rarr 54 + 55 eqn 55
54 + 55 rarr 51 + 52 eqn 56
All 3320 models were evaluated by the computational approach incurring
a computation time of around 9 hours (see Chapter 761 for details on computer
156
specifications) Each of these models were then ranked based on their AICC
evaluation and it was found that the most likely representation of the system is
the model shown in Scheme 51 with lsquotypicalrsquo first-order species dependencies
in the rate laws The approach also determined the kinetic parameters of the
transformation to the major product k25 degC = 0499 plusmn 0006 M-1 min-1 Ea = 4419
plusmn 057 kJ mol-1 and to the minor product k25 degC = 0384 plusmn 0009 M-1 min-1 Ea =
3657 plusmn 088 kJ mol-1 This model and the corresponding kinetic parameters
allowed a fit to the experimental data with an average residual of less than 26 x
10-4 M and is shown in Figure 52 The top 5 ranked models are shown in Table
51 with their respective SSE error metric and AICC evaluation
Figure 52 Kinetic profiles for four kinetic experiments at -25 degC 0 degC 25 degC and 50 degC where
= starting material = 2-substituted product = 4-substituted product mdash = starting
material (ODE) mdash = 2-substituted product (ODE) mdash = 4-substituted product (ODE) See
Chapter 751 for full experimental conditions and raw data
Table 51 Evaluation of the feasibility of each reaction model for the SNAr case study where α
is variable for each model depending on the overall model order
Rank Reaction Model
Kinetic parameters
SSE
103 M AICC k25 degC Mα
min-1 Ea kJ mol-1
1 51 + 52 rarr 53 + 55 0499 4419 1614 -5191
157
51 + 52 rarr 54 + 55 0384 3657
2 51 + 52 rarr 53 + 55
51 + 5205 rarr 54 + 55
0407
0073
4061
3101 3723 -4857
3 51 + 52 rarr 53 + 55
510 + 52 rarr 54 + 55
0466
0017
4225
2756 3777 -4851
4 51 + 52 rarr 53 + 55
51 + 520 rarr 54 + 55
0466
0017
4225
2756 3777 -4729
5 51 + 5205 rarr 53 + 55
51 + 52 rarr 54 + 55
0092
0298
3806
3227 5127 -4664
It is clear from the kinetic plots that the fit of the ODEs to the experimental
data do not result in normally-distributed residuals This could be for one of many
reasons but is most likely due to either errors in producing the correct
concentration of amine 52 or NMR integrations errors or evaporation of solvent
(CD3OD) into the headspace at higher temperatures This must be considered
by a trained chemist upon completion of the computational approach and this is
an example showing that this methodology must be used in conjunction with
chemical expertise to confirm the approach output In this case however the
residuals are only a small consideration and it can be observed that the model
still fits the experimental data well so the identified model is still valid
This first experimental case study has shown that the new approach can
correctly identify the reaction model and kinetic parameters even when
considering a multitude of differing rate laws In this case it was found that each
the rate laws featured first-order dependencies on each of the species which is
common in chemical processes This kinetic information can then be used to
optimise this process for the highest yields of the 2-substituted (major) product
53 for our collaboratorrsquos research project which can then be used as a building
block for bioactive materials
53 Case study PfBr
The next case study that was explored was a chemical system featuring
a protection of an amino acid for further functionalisation where alanine methyl
158
ester (Al-Me) 56 reacts with 9-bromo-9-phenylfluorene (PfBr) 57 to form the
protected amino acid (Pf-Al-Me) 58 and hydrobromic acid 59 as a side-
product as shown in Scheme 52 The alanine methyl ester is present in its
hydrochloride salt form so this hydrochloric acid and the formation of
hydrobromic acid are both neutralised by an excess of suspended potassium
phosphate
Scheme 52 The reaction of alanine methyl ester (Al-Me) 56 with PfBr 57 to form the
protected amino acid 58 Hydrobromic acid 59 is also generated as a side product
PfBr is the reagent to introduce the 9-phenylfluorene (Pf) protecting group
in a synthesis Pf is a pharmaceutically relevant and bulky protecting group that
can be introduced as a more acid stable alternative to the more commonly used
trityl protecting group[245 246] The chemical system of interest is the protection
step in the total synthesis of (S)-eleagnine from L-alanine as shown in Scheme
53 as a retrosynthetic methodology[247] Understanding this transformation by
performing kinetic analysis would therefore accelerate process development
when scaling up this process
Scheme 53 The retrosynthetic methodology of the transformation of L-alanine to (S)-
eleagnine via the Pf-protected alanine methyl ester (Pf-Al-Me)[247]
Due to the high cost of PfBr as a starting material (pound137 for 5 g)[248] PfBr
was synthesised from cheaper materials as it was unknown how much would be
necessary for kinetic analysis Bromobenzene 510 was initially treated with
magnesium then reacted with fluorenone 511 to make the intermediate PfOH
512 PfOH was then isolated and reacted with hydrobromic acid to form the
desired PfBr product as shown in Scheme 54[249] The most expensive material
159
in the synthesis of this PfBr product is fluorenone costing pound76 for 500 g resulting
in a much cheaper method to obtaining this desired material[250] This reaction
was carried out on a 40 g scale and full experimental details can be found in
Chapter 7521 As there was an absence of an OH peak from the IR spectrum
of PfBr the PfBr material was analysed by HPLC and the purity was determined
to be gt99 With pure PfBr as a starting material the kinetic case study was
then possible to begin
Scheme 54 The synthetic route from cheap starting materials bromobenzene 510 and
fluorene 511 to the intermediate PfOH 512 and finally the desired PfBr material 58
Three experiments were conducted in a three-neck round bottomed flask
at 30 degC 35 degC and 40 degC Samples (05 mL) were extracted manually from the
bulk reaction medium with a syringe followed by syringing approximately 03 mL
of water and shaking the syringe - this dissolves the suspended potassium
phosphate and allows injection into the sample loop for analysis via HPLC The
batch setup for experimentation is shown in Figure 53
160
Figure 53 The batch setup for experimentation in the PfBr case study where the temperature
probe is submerged in the reaction medium that is heated via a heater stirrer
After all experiments were run the experimental data and the identified
species were inputted into the new approach Based on these four species there
were two feasible reactions calculated - these reactions are shown as eqn 57
and eqn 58 From these reactions all corresponding rate laws were generated
and all models were compiled subject to the rules defined in Chapter 422 This
resulted in 30 unique models to be evaluated by the approach
56 + 57 rarr 58 + 59 eqn 57
58 + 59 rarr 56 + 57 eqn 58
All 30 models were evaluated by the new computational approach
incurring a computation time of less than 2 minutes (see Chapter 761 for details
on computer specifications) Each of these models were then ranked based on
their AICC evaluation and it was found that the most likely representation of the
system is the model shown in Scheme 52 but with a zero-order dependence on
the alanine methyl ester in the rate law This makes sense chemically as the
bulky aromatic rings would stabilise the cation formed if the reaction were to
proceed via a traditional SN1 mechanism this means that the rate-determining-
161
step is likely to be the loss of the bromide ion followed by a fast reaction with the
alanine methyl ester The approach also determined the kinetic parameters of
this transformation as k35 degC = 106 x 10-2 plusmn 001 x 10-2 min-1 Ea = 6291 plusmn 023
kJ mol-1 This model and the corresponding kinetic parameters allowed a fit to
the experimental data with an average residual of 26 x 10-4 M and is shown in
Figure 54 in a combined plot The top 5 ranked models are shown in Table 52
with their respective SSE error metrics and AICC evaluations
Figure 54 Kinetic profiles for three kinetic experiments at 30 degC 35 degC and 40 degC where red
plots indicate PfBr concentrations and blue plots indicate Pf-Al-Me concentrations At 30
degC = experimental data mdash = ODE At 35 degC = experimental data - - - = ODE At
40 degC = experimental data = ODE See Chapter 752 for full experimental
conditions and raw data
Table 52 Evaluation of the feasibility of each reaction model for the PfBr case study where α
is variable for each model depending on the overall model order
Rank Reaction Model
Kinetic parameters
SSE
10-5 M AICC k35 degC Mα min-
1
Ea kJ mol-
1
1 560 + 57 rarr 58 + 59 00106 6291 351 -23815
2 560 + 57 rarr 58 + 59
58 + 5905 rarr 56 + 57
00115
00144
6709
7000 276 -23805
3 560 + 57 rarr 58 + 59
58 + 590 rarr 56 + 57
00129
00034
6527
7000 276 -23804
4 560 + 57 rarr 58 + 59 00128 6571 281 -23764
162
580 + 59 rarr 56 + 57 00057 7000
5 560 + 57 rarr 58 + 59
5805 + 59 rarr 56 + 57
00112
00167
6606
7000 295 -23654
Interestingly the top 5 ranked models all feature the main lsquoimportantrsquo
model term of 560 + 57 rarr 58 + 59 with models 2 - 5 also featuring some
variant of the reversible reaction This is a similar outcome to the simulated
pentyne kinetics case study in Chapter 432 In this experimental case however
the reversible reaction should be very unlikely as the hydrobromic acid is
removed by the excess potassium phosphate present It can be concluded
therefore that these extra model terms are just fitting to the experimental noise
especially as the magnitude of the SSE metrics are so low
It has been shown in this case study that the new computational approach
can correctly identify the reaction model and kinetic parameters of a system
where there is a zero-order dependency on one of the species This is the first
instance of an identified model featuring non-first-order rate laws in a real
chemical process and further proves the broadened applicability of the new
approach as a kinetic analysis tool This kinetic information can then be used to
shorten process development times and lower costs if (S)-eleagnine was
synthesised using this route
54 Case study Maleic acid
The final experimental case study that was explored was the chemical
system involving maleic acid 513 reacting with methanol 514 to form the
monomethylated maleic acid ester (mono-product) 515 and the dimethylated
maleic acid ester (di-product) 516 shown in Scheme 55 Each reaction also
liberates a molecule of water 517
163
Scheme 55 The reaction of maleic acid 513 and methanol 514 to form the mono-product
515 and the di-product 516
Our collaborators at AstraZeneca were interested in this reaction following
the contamination of a batch of an API maleate salt with the corresponding
monomethyl maleate salt as this contamination could be mitigated if the impurity
formation was well understood Kinetic experiments were run and the findings
were published as it was found that the reaction forming the mono-product was
autocatalytic[240] In this case the reaction was found to be catalytic with an order
of 05 meaning that the overall order with respect to the maleic acid was 15 in
forming the mono-product The consecutive reaction forming the di-product is
also catalytic with respect to the maleic acid with a 05 order dependence
Although this information is now known and reported it took several months for
physical-organic chemists at AstraZeneca to decipher this reaction model as this
model is not immediately intuitive Therefore this case study was run to
retrospectively show the efficiency of this approach in elucidating non-intuitive
reaction models and how this methodology can serve as a viable substitute for
many hours spent on a project by experts that could be working on other aspects
of process development
All experimental data was obtained from our collaborators at AstraZeneca
and was collected using batch experimentation and 1H NMR sampling Five
experiments were conducted at differing starting concentrations and
temperatures in the range of 40 - 60 degC This experimental data was inputted into
the computational approach as well as the identified species Based on these
five species there were six feasible reactions identified - these reactions are
shown as eqn 59 - 514
513 + 514 rarr 515 + 517 eqn 59
515 + 517 rarr 513 + 514 eqn 510
515 + 514 rarr 516 + 517 eqn 511
516 + 517 rarr 515 + 514 eqn 512
515 + 515 rarr 513 + 516 eqn 513
513 + 516 rarr 515 + 515 eqn 514
As the experiments were ran with methanol as a solvent this exhibits an
effective methanol concentration of ~24 M which is far greater than the maleic
164
acid concentration that had a maximum concentration of 08 M As the methanol
is in such a high concentration its concentration remains effectively unchanged
throughout the reaction meaning that the rate law would approximate pseudo-
first-order kinetics Therefore after all rate laws were compiled using these
mass-balance-allowed reactions all rate laws pertaining to non-zero-order with
respect to methanol concentration were removed As the methanol concentration
would be effectively unchanged it would be very difficult to differentiate between
models with differing order dependencies on the methanol - this would likely lead
to many models tied for lsquomost likelyrsquo with exactly equivalent SSE values
After the subsequent rate laws were compiled the models were
generated subject to the rules defined in Chapter 422 and with the maleic acid
defined as a catalyst This resulted in 5086 unique models to be evaluated by
the approach which incurred a computation time around 17 hours (see Chapter
761 for details on computer specifications) Each of these models were then
ranked based on their AICC evaluation and it was found that the most likely
representation of the system is the reaction model shown in Scheme 55 but
each step is catalysed by maleic acid with a species order dependence of 05 -
these are the same findings that our collaborators made during their kinetic
analysis The approach also determined the kinetic parameters of this
transformation to be kmono 50 degC = 385 x 10-3 plusmn 001 x 10-3 M-05 min-1 Ea = 7261
plusmn 012 kJ mol-1 and kdi 50 degC = 466 x 10-4 plusmn 001 x 10-4 M-05 min-1 Ea = 6974 plusmn
010 kJ mol-1 These parameters were again very similar to those obtained by
our collaborators although our collaborators reported the kinetic parameters as
Arrhenius constants and activation energies This model and the corresponding
kinetic parameters allowed a fit to the experimental data with an average residual
of 11 x 10-3 M and two experimental fittings at 50 degC (with initial concentrations
of 08 M and 04 M) are shown in Figure 55 The top 5 ranked models are shown
in Table 53 with their respective SSE error metrics and AICC evaluations
165
Figure 55 Kinetic profiles for two kinetic experiments at 50 degC with the initial concentration of
maleic acid at 04 M and 08 M At 04 M = maleic acid mdash = maleic acid (ODE) =
mono-product mdash = mono-product (ODE) = di-product mdash = di-product (ODE) At 08
M = maleic acid - - - = maleic acid (ODE) = mono-product - - - = mono-product
(ODE) = di-product - - - = di-product (ODE) See Chapter 753 for full experimental
conditions and raw data
Table 53 Evaluation of the feasibility of each reaction model for the maleic acid case study
where α is variable for each model depending on the overall model order
Rank Reaction Model
Kinetic parameters
SSE
10-2 M AICC k50 degC 10-3 Mα
min-1 Ea kJ mol-1
1
51315 + 5140 rarr 515
+ 51305 + 517
51305 + 515 + 5140
rarr 516 + 51305 + 517
385
047
7261
6974 028 -4968
2
51315 + 5140 rarr 515
+ 51305 + 517
513 + 5152 rarr 5132 +
516
408
192
7832
7977 033 -4908
3
51315 + 5140 rarr 515
+ 51305 + 517
513 + 515 + 5140 rarr
516 + 513 + 517
391
103
7419
7995 033 -4902
166
4
51315 + 5140 rarr 515
+ 51305 + 517
51305 + 5152 rarr
51315 + 516
397
076
7652
7306 042 -4806
5
5132 + 5140 rarr 515 +
513 + 517
513 + 515 + 5140 rarr
516 + 513 + 517
560
078
7998
7936 053 -4715
As in previous case studies the top ranked models all feature the main
lsquoimportantrsquo model term that describes the convergence to experimental data in
the best way with models 1 - 4 featuring this term 51315 + 5140 rarr 515 +
51305 + 517 This is because the SSE metric is a measure of the total error in
the fit to the data and as this model term features the transformation of 513 to
515 which are the species present in the highest concentrations this model
term therefore has the highest impact on minimising the SSE
It has been shown in this case study that the new computational approach
can correctly identify the reaction model and kinetic parameters of a real
chemical system where there are both catalytic species and species with non-
integer order dependencies This is the first instance of an identified model
featuring a catalytic species and non-integer-order rate laws using real
experimental data As the model was already identified by our collaborators this
methodology has corroborated their findings and shown that process
understanding can be accelerated using this approach This approach
automatically identified the correct reaction model in ~17 hours whereas our
collaborators using more traditional lsquotrial and errorrsquo approaches arrived at the
correct model in months Retrospectively this would have allowed faster
implementation of measures to reduce the amount of monomethyl maleate salt
impurity in their API maleate salt thereby proceeding with process development
and cutting costs
55 Conclusion
167
It has been shown that using this new computational approach total
process understanding can be automatically achieved without the need for high-
level chemical intuition The widened scope of this new approach has been
proven to be effective in three experimental case studies each with differing rate
laws and kinetic structural motifs The approach has been proven to be effective
and applicable for lsquonormalrsquo kinetic models where each species has a first-order
dependence for zero-order and non-integer rate laws and for catalytic species
of variable integer- and non-integer-order
It has also been shown from these case studies that using this
methodology can greatly accelerate process development and reduce the
workload of kinetic analysis for the physical-organic chemists After
experimentation all kinetic analysis can be automated whilst experts focus on
other aspects of process development Then after the computational approach
has finished running they can work in conjunction with the approach to identify
which models are the most likely to be both statistically and scientifically correct
Chapter 6 Conclusion amp future work
The project aim to develop and advance an automated methodology to
kinetic model and parameter determination has been answered in the thesis
chapters herein The computational approach should be used in conjunction with
experts to automate the comprehensive kinetic analysis that is otherwise not
feasible using traditional means The approach takes experimental data and the
identified species then identifies every possible mass-balance-allowed
transformation between these species Each of these reactions are then
compiled into every possible unique reaction model with each feasible
corresponding rate law These models are then evaluated based on their fit to
experimental data by combining the use of ordinary differential equation (ODE)
solvers and optimisation algorithms The models are then statistically ranked
based on their convergence to experimental data and the number of model terms
in the model thereby identifying the most likely model and its corresponding
kinetic parameters
168
The original structure of this comprehensive methodology was originally
reported by Tsu et al[173] which was then replicated improved and utilised for
real experimentation in Chapters 2 - 3 The approach was used in tandem with
an automated flow reactor platform by exploiting flow rate manipulations to
obtain full reaction profiles followed by implementation of the approach The
methodology was then further improved and the scope was widened in Chapter
4 as catalytic systems and differing-non-integer order species dependencies in
the rate laws were also explored This improved methodology was then proven
to be effective in real experimental systems in Chapter 5 as batch
experimentation ran at Leeds and by collaborators showed the wide applicability
of the approach to different types of reactions This approach can be used as a
tool for process development by anyone as expert chemical intuition is removed
from the kinetic analysis Therefore the project aim has been answered in the
work described herein as any chemist can use this approach and interpret the
output in order to obtain total process understanding
Further work on the use and development of this approach for metal-
catalysed processes would be beneficial Metal-catalysed processes are very
important in industry but catalytic cycles can be complex meaning that it is not
immediately obvious how to automate a tool to explore these potential models
In some cases it may be sufficient to describe a reaction based on empirical rate
laws and this can currently be implemented using the approach developed
However another research project on the development of a tool to identify these
kinetic models and catalytic cycles may be warranted As a suggestion this could
be performed by inputting many known catalytic cycles into a training set then
using machine learning techniques to build a neural network to identify trends in
experimental data to attribute particular catalytic cycles to chemical processes
Chapter 7 Appendix
71 Chapter 1
No appendix data for Chapter 1
72 Chapter 2
169
721 Generated data set for case study benzoic acid alkylation
Experiment 1
Time s 21 M 22 M 23 M
0 01 08 0
475 0081361 0060964 0017126
1024 0069511 004901 0031805
2015 0054394 003336 0044477
295 0044695 0027749 0051252
432 0038039 0019903 0062653
60 0032285 0013536 0065719
Experiment 2
Time s 21 M 22 M 23 M
0 01 011 0
468 007631 0084741 0023482
1027 0057707 0069104 0040456
20 004138 0054662 0056759
302 0034101 004059 0067659
476 0023686 0031161 0075772
60 0018377 0027305 0083761
Experiment 3
Time s 21 M 22 M 23 M
0 1 015 0
5 0069767 0121755 0032513
105 0047199 0098611 005277
2163 0027758 0077627 0072909
3054 0019626 0069013 0079639
4578 0011357 0059865 0091724
170
60 0006574 005691 0093444
722 Generated data set for case study nitrile hydrolysis
Experiment 1 60 degC
Time s 25 M 27 M 28 M
0 08 0 0
5235363 0814005 001713 100E-06
3247861 067236 0106334 339E-05
6719836 0634071 0199701 0000124
1456155 0463323 034173 0000516
2899323 027438 0528037 0001536
3687175 0220788 0551639 000212
4868495 0162216 0630518 0003131
600 0124203 0705371 0004112
Experiment 2 70 degC
Time s 25 M 27 M 28 M
0 08 0 0
6133417 0761239 0049487 683E-06
2689 0588801 0199668 115E-04
6870925 0426543 0363734 0000585
1501538 021105 0573179 000192
297041 0079934 0705184 0004502
3564911 005351 0757795 0005854
4867485 0024103 0789235 0008408
600 0013094 0752509 0010127
Experiment 3 80 degC
Time s 25 M 27 M 28 M
171
0 1 0 0
5817383 0852929 015263 428E-05
2471834 0568389 0476974 589E-04
714048 0218624 0778816 0002633
1543583 0060192 089969 0006685
3038829 0006754 0944201 0014173
3720244 0002737 09556 001819
4765104 0000608 1009417 0023157
600 0000113 09467 0028902
Experiment 4 90 degC
Time s 25 M 27 M 28 M
0 1 0 0
5910759 0711158 0281532 172E-04
2420962 030002 070196 171E-03
6878985 0060896 0961462 0006075
1425421 0005202 1023471 0013823
2881599 555E-05 0935542 0027497
3644764 521E-06 0970668 0036328
4780807 143E-07 095015 0045819
600 179E-07 089561 0059331
723 Generated data set for the case study SNAr kinetics
Experiment 1
Time 210 M 212 M 213 M 214 M
0 1 0 0 0
0114724 0916317 0078593 0018182 249E-06
103049 0464119 0448791 0104213 0000125
2141533 0226584 0624128 0146157 0000376
3643057 0102715 0737636 0171082 0000744
172
7743801 0012971 0788209 0187458 0001768
1216477 0001476 0805589 018666 0002965
4403067 0 0816998 0186517 0010796
1072065 0 0801824 0178389 0026607
2551342 0 078187 0172065 0061291
4351342 0 0744149 0156488 0102055
600 0 0702123 0148841 0135997
Experiment 2
Time 210 M 212 M 213 M 214 M
0 12 0 0 0
0088864 1073662 0091451 00213 294E-06
0254455 0913278 0236597 0053222 217E-05
1152788 0407456 0638051 0147144 0000266
3171611 0093893 0900254 02064 0001032
939048 0001601 0959144 0228044 0003623
4041694 0 097195 021939 0016209
195366 0 0911133 0206891 0075681
3112192 0 0891022 0190707 0118451
4312192 0 0869047 0184739 015486
4912192 0 0861757 0175374 0176878
600 0 0839806 0165531 0209888
Experiment 3
Time 210 M 212 M 213 M 214 M
0 09 0 0 0
0091037 0797548 0079495 0018563 313E-06
0259823 0653654 0198581 0046012 219E-05
1158987 0239387 0538734 0122398 0000279
173
4175397 0013188 0712848 0169522 0001555
6793661 0001174 0728233 0166388 0002729
9757783 0 0717645 0170752 0003931
4449079 0 0719684 0164371 0019044
1956282 0 0666457 014927 0080022
3156282 0 0644589 0131672 0126933
4956282 0 0600784 0117343 0185606
600 0 0578163 0107537 0221849
73 Chapter 3
731 Phenyl acetate
7311 Preparation of feed solutions
Three feeds were used for this work and desired reservoir solutions were
prepared by dissolving the desired reagents in acetonitrile under stirring at
ambient conditions The first feed consisted of phenol (132 mL 015 mol 05
mol dm-3) and biphenyl (115 g 75 mmol 0025 mol dm-3) in acetonitrile (300
mL) the second feed contained acetyl chloride (225 mL 032 mol 105 mol dm-
3) the third feed was a 11 mixture of acetonitrile and water for dilution
7312 Flow ramp experiments
Linear gradient flow ramps allowed the generation of a complete reaction
profile from a single transient experiment To obtain transient data each of the
three pumps were initially set at the maximum flow rate to be investigated 175
mL min-1 Steady-state was established in the 35 mL reactor and the flow rate
for each pump decreased at a constant rate of 00181 mL min-1 for 92 minutes
Samples of reactor effluent were injected for HPLC analysis at 2 minute intervals
thus achieving a large data density The reactor setup schematic is shown in
Figure 731
174
Figure 731 The flow reactor setup for the phenyl acetate case study experiments
7313 HPLC Analysis
All HPLC analysis was conducted using an Agilent 1100 series HPLC
instrument fitted with a Sigma Ascentis Express C18 reverse phase column (5cm
x 46mm 27 microm) Biphenyl was used as an internal standard The column
temperature was 70 degC and the HPLC method is shown
Time min A (water 01
TFA)
B (acetonitrile
01 TFA) Flow rate mL min-1
000 50 50 2
150 20 80 2
151 50 50 2
An example HPLC chromatogram during a kinetic experiment is shown in
Figure 732
175
Figure 732 An example HPLC chromatogram in the phenyl acetate case study at 254 nm
7314 Validation with steady-state measurements
Steady-state measurements were taken at 1 3 5 7 9 11 13 and 15
minutes at both 65 degC and 75 degC Using the identified most likely reaction model
from the flow ramps the k values for the steady-state experiments were found to
be kSS-65 degC = 472 x 10-3 plusmn 001 x 10-3 M-1 s-1 kSS-75 degC = 929 x 10-3 plusmn 003 x 10-3
M-1 s-1 These k values give the steady-state kinetic parameters as kSS-65 degC =
472 x 10-3 plusmn 001 x 10-3 M-1 s-1 Ea-SS = 663 plusmn 05 kJ mol-1 which are very
comparable to the flow ramp evaluation of the kinetic parameters kR-65 degC =
00052 plusmn 00002 M-1 s-1 Ea-R = 693 plusmn 78 kJ mol-1 As the steady-state
measurements were taken without a dilution pump the concentrations are
different to that of the ramps hence the steady-state time-series concentration
data was normalised to match the concentrations from the ramps to show the
agreement in their nature in Figure 311
7315 Raw data
Flow ramp experiments
Flow ramp
measurements 65 degC 75 degC
τ min 38 M 310 M 38 M 310 M
102 01493 00072 01346 00262
104 01461 00095 01297 00269
106 01436 00104 01284 00260
108 01459 00119 01300 00262
111 01433 00121 01268 00287
114 01394 00128 01244 00304
116 01398 00135 01251 00310
119 01428 00144 01200 00322
122 01410 00150 01176 00340
125 01397 00142 01249 00304
129 01358 00140 01204 00334
132 01388 00168 01188 00369
176
136 01382 00166 01190 00405
140 01365 00170 01204 00315
144 01358 00182 01174 00408
149 01324 00173 01142 00392
153 01338 00188 01170 00383
158 01360 00194 01148 00395
164 01334 00204 01134 00426
170 01320 00213 01132 00406
176 01333 00223 01113 00430
182 01315 00232 01121 00456
189 01319 00220 01095 00445
197 01278 00228 01029 00523
205 01285 00260 01072 00501
214 01280 00334 01021 00554
224 01267 00287 01065 00524
235 01248 00305 00996 00603
247 01253 00309 00984 00566
260 01214 00338 00974 00575
274 01217 00297 00914 00661
290 01195 00360 00914 00620
308 01196 00379 00900 00654
328 01162 00408 00830 00762
351 01111 00444 00790 00774
377 01114 00452 00848 00739
406 01017 00527 00737 00722
441 01033 00536 00705 00843
481 00986 00559 00618 00981
528 00955 00598 00564 00962
583 00908 00678 00599 00985
649 00807 00704 00576 01039
177
729 00781 00770 00488 01150
824 00705 00835 00421 01160
940 00662 00921 00360 01223
1079 00587 00981 00249 01358
Steady state experiments
Steady-state
measurements 65 degC 75 degC
τ min 38 M 310 M 38 M 310 M
102 01771 00177 01591 00387
308 01461 00470 01183 00824
481 01214 00736 00858 01123
649 01050 00940 00625 01370
900 00844 01155 00419 01567
1101 00717 01263 00297 01715
1301 00559 01384 00218 01822
1502 00512 01488 00177 01886
Normalised steady state experiments
Steady-state
measurements
(normalised)
65 degC 75 degC
τ min 38 M 310 M 38 M 310 M
102 01417 00142 01273 00310
308 01169 00377 00947 00660
481 00971 00590 00686 00898
649 00840 00753 00500 01096
900 00675 00926 00335 01253
1101 00573 01012 00238 01372
178
1301 00447 01109 00174 01458
1502 00409 01192 00142 01509
732 Paracetamol
7321 Preparation of feed solutions
For the work at the temperature of 30 degC two feeds were used and
desired reservoir solutions were prepared by dissolving the desired reagents in
acetonitrile under stirring at ambient conditions The first feed consisted of 4-
aminophenol (058 mL 6 mmol 002 mol dm-3) and biphenyl (115 g 75 mmol
0025 mol dm-3) in acetonitrile (300 mL) the second feed contained acetic
anhydride (085 mL 9 mmol 003 mol dm-3) in acetonitrile (300 mL)
For the work at the temperature of 60 degC two feeds were used and
desired reservoir solutions were prepared by dissolving the desired reagents in
acetonitrile under stirring at ambient conditions The first feed consisted of 4-
aminophenol (044 mL 45 mmol 0015 mol dm-3) and biphenyl (115 g 75
mmol 0025 mol dm-3) in acetonitrile (300 mL) the second feed contained acetic
anhydride (085 mL 9 mmol 003 mol dm-3) in acetonitrile (300 mL)
For the work at the temperature of 160 degC two feeds were used and
desired reservoir solutions were prepared by dissolving the desired reagents in
acetonitrile under stirring at ambient conditions The first feed consisted of 4-
aminophenol (101 mL 105 mmol 0035 mol dm-3) and biphenyl (115 g 75
mmol 0025 mol dm-3) in acetonitrile (300 mL) the second feed contained acetic
anhydride (298 mL 315 mmol 0105 mol dm-3) in acetonitrile (300 mL)
For the work at the temperature of 180 degC two feeds were used and
desired reservoir solutions were prepared by dissolving the desired reagents in
acetonitrile under stirring at ambient conditions The first feed consisted of 4-
aminophenol (261 mL 27 mmol 009 mol dm-3) and biphenyl (115 g 75 mmol
0025 mol dm-3) in acetonitrile (300 mL) the second feed contained acetic
anhydride (533 mL 564 mmol 019 mol dm-3) in acetonitrile (300 mL)
7322 Flow ramp experiments
For the work at the temperature of 30 degC a 025 mL reactor was used
For the work at the temperature of 60 degC a 05 mL reactor was used For the
179
work at the temperatures of 160 degC and 180 degC a 35 mL reactor was used
Linear gradient flow ramps allowed the generation of complete reaction profiles
from a single transient experiment To obtain transient data each of the two
pumps were initially set at the maximum flow rate to be investigated 175 mL
min-1 Steady-state was established and the flow rate for each pump decreased
at a constant rate of 00181 mL min-1 for 92 minutes Samples of reactor effluent
were injected for HPLC analysis at 2 minute intervals thus achieving a large data
density The reactor setups for each of these 4 reactions are shown in Figures
733 - 736 For the higher temperature reactions 160 degC and 180 degC 4-
aminophenol is used and assumed to react instantaneously to form paracetamol
based on the kinetics observed at lower temperatures
Figure 733 The reactor setup for the paracetamol flow ramp experiment at 30 degC
180
Figure 734 The reactor setup for the paracetamol flow ramp experiment at 60 degC
Figure 735 The reactor setup for the paracetamol flow ramp experiment at 160 degC
Figure 736 The reactor setup for the paracetamol flow ramp experiment at 180 degC
7323 HPLC analysis
All HPLC analysis was conducted using an Agilent 1100 series HPLC
instrument fitted with a Sigma Ascentis Express C18 reverse phase column (5cm
x 46mm 27 microm) Biphenyl was used as an internal standard The column
temperature was 70 degC and the HPLC method is shown
Time min A (water 01
TFA)
B (acetonitrile
01 TFA) Flow rate mL min-1
000 50 50 2
150 20 80 2
151 50 50 2
An example HPLC chromatogram showing the separation and analysis of
all components at once - these species were each added to the same solution
for method development
181
Figure 737 An example HPLC chromatogram from the paracetamol case study showing the
separation of all reaction components at 254 nm
7324 Raw data
Flow ramp experiment 1 30 degC
τ s 312 M 314 M 315 M
428 000698 000267 0
437 000722 000266 0
447 000766 000284 0
457 000716 000287 0
467 000688 000278 0
478 000749 000306 0
489 000717 000299 0
501 000715 000317 0
513 000685 000273 0
526 000727 000320 0
540 000622 000296 0
555 000635 000337 0
570 000643 000374 0
586 000639 000446 0
603 000623 000401 0
182
621 000643 000391 0
640 000600 000385 0
645 000654 000378 0
683 000613 000368 0
706 000519 000376 0
731 000592 000455 0
758 000585 000481 0
787 000554 000410 0
818 000564 000432 0
851 000503 000429 0
888 000568 000493 0
927 000441 000444 0
971 000444 000506 0
1019 000416 000513 0
1071 000446 000556 0
1129 000413 000575 0
1194 000440 000546 0
1267 000483 000566 0
1349 000452 000564 0
1443 000353 000601 0
1550 000276 000588 0
1675 000370 000654 0
1820 000325 000720 0
1994 000229 000676 0
2202 000214 000686 0
2459 000239 000770 0
2781 000178 000878 0
3197 000221 000826 0
3900 000171 000848 0
4518 000145 000871 0
183
Flow ramp experiment 2 60 degC
τ s 312 M 314 M 315 M
875 0003048 0004234 0
894 0003702 0003846 0
913 0003852 0003772 0
955 0003402 0003918 0
978 0003071 0003860 0
1002 0002944 0004318 0
1027 0003195 0004243 0
1053 0003084 0004111 0
1080 0003046 0004262 0
1109 0003112 0004330 0
1140 0002925 0004253 0
1172 0002919 0004464 0
1206 0002921 0004562 0
1243 0002741 0004796 0
1281 0002612 0004906 0
1290 0002480 0004399 0
1366 0002481 0004597 0
1412 0002545 0004952 0
1462 0002325 0004951 0
1516 0002416 0004964 0
1573 0002407 0005149 0
1635 0002401 0005027 0
1702 0002710 0004966 0
1775 0002157 0005196 0
1855 0002382 0005121 0
1942 0002037 0005228 0
184
2037 0002221 0005387 0
2142 0001760 0005411 0
2259 0001446 0005728 0
2389 0001541 0005809 0
2534 0001507 0005924 0
2699 0001471 0005553 0
2886 0001147 0005686 0
3100 0001304 0006117 0
3349 0001168 0005719 0
3641 0001018 0006181 0
3987 0000916 0006444 0
4405 0000976 0006104 0
4918 0001025 0006840 0
Flow ramp experiment 3 160 degC
τ min 312 M 314 M 315 M
125 0 001766 000056
129 0 001737 000054
132 0 001786 000038
136 0 001789 000042
140 0 001722 000061
144 0 001738 000055
149 0 001779 000059
153 0 001807 000068
158 0 001794 000064
164 0 001722 000067
170 0 001734 000072
176 0 001792 000077
185
182 0 001738 000076
189 0 001755 000081
197 0 001738 000074
205 0 001785 000102
214 0 001762 000086
224 0 001801 000105
235 0 001753 000111
247 0 001793 000102
260 0 001763 000123
274 0 001672 000118
308 0 001736 000124
328 0 001728 000160
351 0 001635 000153
377 0 001696 000174
406 0 001670 000199
441 0 001536 000187
481 0 001590 000222
528 0 001614 000263
583 0 001482 000258
649 0 001454 000317
729 0 001474 000331
824 0 001407 000355
940 0 001315 000386
1079 0 001292 000412
Flow ramp experiment 4 180 degC
τ min 312 M 314 M 315 M
104 0 003703 000456
186
106 0 003829 000519
108 0 003746 000652
111 0 003910 000557
114 0 003812 000656
116 0 003894 000592
119 0 003622 000877
122 0 003941 000625
125 0 003733 000754
129 0 003798 000713
132 0 003861 000717
136 0 003606 000930
140 0 003615 000890
144 0 003655 000870
149 0 003584 000854
153 0 003765 000893
158 0 003480 001017
164 0 003459 001078
170 0 003522 001035
176 0 003357 001114
182 0 003407 001127
189 0 003598 000927
197 0 003491 000963
205 0 003546 001197
214 0 003307 001152
224 0 003586 001004
235 0 003600 001103
247 0 003364 001246
260 0 003717 000943
187
274 0 003256 001202
290 0 003278 001151
308 0 003298 001160
328 0 003304 001311
351 0 003179 001295
377 0 003002 001227
406 0 003024 001543
441 0 003117 001338
481 0 003076 001426
528 0 002431 001748
583 0 002326 001784
649 0 002665 001973
729 0 002265 001803
824 0 001960 002426
940 0 001780 002347
1079 0 001594 002903
733 Metoprolol
7331 AstraZeneca experimental setup
All AstraZeneca experiments were conducted using a tubular reaction vessel
(Polar Bear Plus) using PTFE tubing (1 mm ID) Reagents were pumped using
JASCO PU-4180 dual piston HPLC pumps and flow streams were mixed using
Swagelok SS-100-3 tee-pieces Sampling was conducted by using a VICI Valco
EUDA-CI4W5 sample loop with a 006 microL aliquot volume The reaction system
was maintained under a fixed back pressure using an Upchurch Scientific 150
psi back pressure regulator Quantitative analysis was performed using an
Agilent 1100 series HPLC instrument fitted with an Acquity C18 reverse phase
column (3 cm x 46 mm 17 microm) This setup is shown in Figure 638 In all
experiments biphenyl was added to one reservoir as an internal standard
188
Figure 738 A photograph of the automated flow system at AstraZeneca
7332 Preparation of feed solutions
For the Leeds experiments two feeds were used for the flow ramps and
desired reservoir solutions were prepared by dissolving the desired reagents in
acetonitrile under stirring at ambient conditions The first feed consisted of 2-((4-
(2-methoxyethyl)phenoxy)methyl)oxirane (SM) (5676 mL 03 mol 1 mol dm-3)
and biphenyl (115 g 75 mmol 0025 mol dm-3) in acetonitrile (300 mL) the
second feed contained isopropylamine (1546 mL 018 mol 06 mol dm-3) in
acetonitrile (300 mL)
For the AstraZeneca experiments two feeds were used for the flow
ramps and desired reservoir solutions were prepared by dissolving the desired
reagents in acetonitrile under stirring at ambient conditions The first feed
consisted of 2-((4-(2-methoxyethyl)phenoxy)methyl)oxirane (SM) (5676 mL 03
mol 1 mol dm-3) and biphenyl (115 g 75 mmol 0025 mol dm-3) in acetonitrile
(300 mL) the second feed contained isopropylamine (5153 mL 09 mol 3 mol
dm-3) in acetonitrile (300 mL)
7333 Flow ramp experiments
189
For the Leeds experiments a 35 mL reactor was used Linear gradient
flow ramps allowed the generation of complete reaction profiles from a single
transient experiment To obtain transient data each of the two pumps were
initially set at the maximum flow rate to be investigated 175 mL min-1 Steady-
state was established and the flow rate for each pump decreased at a constant
rate of 00181 mL min-1 for 92 minutes Samples of reactor effluent were injected
for HPLC analysis at 4 minute intervals thus achieving a large data density This
reactor setup is shown in Figure 739
Figure 739 The reactor setup for the metoprolol flow ramp experiments at 190210 degC in
Leeds
For the AstraZeneca experiments a 5 mL reactor was used Linear gradient flow
ramps allowed the generation of complete reaction profiles from a single
transient experiment To obtain transient data each of the two pumps were
initially set at the maximum flow rate to be investigated 125 mL min-1 Steady-
state was established and the flow rate for each pump decreased at a constant
rate of 00125 mL min-1 for 96 minutes Samples of reactor effluent were injected
for HPLC analysis at 6 minute intervals thus achieving a large data density This
reactor setup is shown in Figure 7310
190
Figure 7310 The reactor setup for the metoprolol flow ramp experiments at 130150 degC at
AstraZeneca
7334 HPLC analysis
All HPLC analysis was conducted using an Agilent 1100 series HPLC
instrument fitted with a Sigma Ascentis Express C18 reverse phase column (5cm
x 46mm 27 microm) Biphenyl was used as an internal standard The column
temperature was 40 degC and the HPLC method is shown
Time min A (water 01
TFA)
B (acetonitrile
01 TFA) Flow rate mL min-1
000 77 23 2
300 10 90 2
400 10 90 2
410 77 23 2
An example HPLC chromatogram during a kinetic experiment is shown in
Figure 7311
Figure 7311 An example HPLC chromatogram during a kinetic experiment in the metoprolol
case study at 220 nm
7335 Cost evaluation
Using the Leeds experimental setup outlined in Chapter 32 and current
pricing for the starting material used in the Metoprolol work (pound80725 g)[239] it has
been shown that this kinetic approach used less material and was cheaper to
implement than other standard industrial optimisation techniques
As the starting material is the most expensive reaction component by a
large margin this was the only factor taken into consideration - other costs were
not considered eg solvent isopropylamine energy etc It is assumed that a 1
M solution of starting material is used and so the cost associated for every 1 mL
of this solution used (0208 g 1 mmol) is pound671 It is also assumed that 2 reactor
volumes are consumed prior to all steady-state reactions and all reactions were
191
conducted using a 35 mL reactor The addition of skilled labour and time have
not been considered but would incur significantly higher costs for these other
techniques as this technique only requires the initial setup of the reservoirs and
reactor because everything else is automated
Technique What is required Solution
usage mL Cost pound
Flow ramps
4 x linearly decreasing flow ramps from
175 mL min-1 decreasing at a rate of
00181 mL min-1 for 92 minutes
340 pound2281
Steady-state
kinetics 4 sets of 16 steady-state experiments 420 pound2818
Design of
Experiments
study
One screening design (19 steady-state
experiments) and one optimisation design
(81 steady-state experiments) to consider
the factors of temperature residence time
starting material equivalents and
isopropylamine equivalents
700 pound4697
7336 Raw data
Flow ramp experiment 1 130 degC
τ min 317 M 319 M 320 M
210 0435 0053 0000
224 0427 0056 0000
240 0423 0060 0000
258 0417 0064 0000
371 0381 0102 0000
416 0397 0088 0000
472 0383 0099 0000
545 0369 0110 0000
641 0362 0123 0000
773 0347 0146 0001
961 0286 0206 0002
Flow ramp experiment 2 150 degC
192
τ min 317 M 319 M 320 M
200 0358 0116 0000
210 0357 0125 0000
224 0350 0135 0001
240 0347 0144 0001
258 0340 0153 0001
280 0333 0166 0001
305 0311 0178 0002
335 0299 0193 0002
371 0269 0207 0002
416 0259 0234 0003
472 0233 0251 0003
545 0208 0287 0004
641 0169 0284 0005
773 0144 0327 0006
Flow ramp experiment 3 190 degC
τ min 317 M 319 M 320 M
255 0340 0117 0004
269 0328 0121 0005
284 0321 0126 0006
302 0320 0132 0006
321 0309 0138 0007
343 0307 0137 0007
368 0305 0150 0008
397 0299 0152 0009
430 0294 0161 0010
470 0284 0171 0012
517 0270 0176 0014
573 0261 0183 0016
643 0254 0186 0018
730 0246 0190 0021
842 0232 0211 0025
986 0213 0217 0028
Flow ramp experiment 4 210 degC
τ min 317 M 319 M 320 M
250 0305 0166 0012
193
263 0299 0165 0013
278 0294 0172 0014
295 0294 0172 0015
314 0282 0182 0017
335 0279 0186 0019
360 0269 0190 0021
388 0272 0201 0023
421 0247 0221 0030
460 0236 0218 0028
506 0230 0219 0032
562 0218 0222 0038
630 0231 0211 0042
716 0201 0235 0045
825 0188 0235 0051
968 0182 0239 0058
74 Chapter 4
741 Generated data set for the case study SNAr kinetics
Experiment 1
Time s 45 M 47 M 48 M 49 M
0 1 0 0 0
104232 0912548 0068648 0002878 279E-05
5078096 0715174 0266199 0011023 0000485
1475526 0464384 0521723 0020875 0002315
3331443 0269972 0708549 002876 0006042
5628294 0168854 080687 0031878 0009439
9017797 0099139 0856211 003494 0013887
2108206 0032979 088963 0036126 0024236
3328275 0015074 0929082 0036808 003211
4382468 0008534 0933212 0036452 0037487
600 0004209 0921486 0036363 0043389
194
Experiment 2
Time s 45 M 47 M 48 M 49 M
0 08 0 0 0
1302612 0703325 0092533 0003854 627E-05
5712155 0478466 0312694 0012573 0000883
1084263 0329335 044882 0018183 0002403
2064908 0176938 0596415 0023908 0005922
6941793 0014924 0723646 0029388 0023796
1516461 0000354 0725866 0029244 0051839
3009398 380E-07 066851 0026369 0099546
5153318 0 0621532 0024249 0155196
9253113 0 0545081 0019839 0239656
1200 0 0506326 0018372 0288136
Experiment 3
Time s 45 M 47 M 48 M 49 M
0 1 0 0 0
0962483 0873362 0112646 0004695 780E-05
1002158 0342803 0632465 0025508 0004215
2106925 0138132 0817645 0033569 001147
6078714 0008667 0899281 0037403 0036358
1010498 0000643 0895452 003658 0061674
1727609 714E-06 0851082 0034174 0101391
3082939 0 0806696 0030438 017491
5621972 0 069294 0025835 0270209
9040341 0 0598858 0021781 0384583
1600 0 0457229 0015241 0527733
Experiment 4
Time s 45 M 47 M 48 M 49 M
195
0 1 0 0 0
1044725 0854673 0149213 0006087 0000139
509551 0460925 0515756 0020548 0002257
2132233 0072138 0877848 0035074 0017175
4714859 0005208 0917717 0036551 0041614
6931167 00006 0887854 0035809 0061604
1280495 225E-06 086418 0033593 0115427
2886839 0 0741762 002754 0232766
7368751 0 0519088 0018297 0455041
1222483 0 0381306 0012248 060453
1800 0 0274267 0007936 0705143
Experiment 5
Time s 45 M 47 M 48 M 49 M
0 12 0 0 0
0849478 0999855 0175423 0007178 0000158
5548213 0466871 0712408 0028769 0004137
1181201 0191904 0969199 0039345 0012093
3500272 0010569 110712 0045047 0044862
911267 147E-05 1038677 0040673 0119288
1237999 690E-07 1005138 0040148 0158185
1953324 0 0920941 003614 0234604
4831808 0 0709117 0024989 0478645
632278 0 0609582 0021143 0562277
900 0 0502989 0016122 0680497
742 Generated data set for the case study Pentyne
Experiment 1
Time min 411 M 412 M 413 M
0 1 08 0
196
1293971 0973192 0803545 0011085
3972297 0958388 0766506 0033251
1843854 0857109 0663378 0141812
3290479 0770748 054892 0246498
5690479 0629294 0416498 0388829
9290479 0449379 025987 0548273
120 0369111 0164188 0644284
Experiment 2
Time min 411 M 412 M 413 M
0 12 15 0
1205027 1199383 1460822 0012139
3721389 1157799 1439238 0037013
1802628 1036602 1347405 0171608
5033117 077347 1092225 0421136
8633117 0582851 0871663 0614124
1403312 0359291 0678145 0833511
180 0259447 0551321 0936175
Experiment 3
Time min 411 M 412 M 413 M
0 1 1 0
1293971 0994904 0974041 0010778
3972297 0975053 0966892 0033053
1843854 086422 0871237 0145646
3290479 0750116 0752064 0246904
8090479 0508082 0506177 0504648
1529048 0276204 0271468 072687
240 0129659 0132753 0856012
197
743 Generated data set for the case study Ytterbium catalysis
Experiment 1
Time h 415 M 416 M 418 M
0 2 2 0
0054397 1950736 1962883 0040294
0386129 1737689 1725949 026888
0701874 1545843 1542334 0459994
1901874 0986091 0979723 1020241
3101874 0631223 0628196 136402
4301874 040357 0400764 1596431
6 0213539 0212908 1784115
Experiment 2
Time h 415 M 416 M 418 M
0 15 2 0
0029722 1499822 2000933 0004169
02413 1470961 1962226 0033316
0911826 1373396 1881085 0122394
1511826 1302576 1805505 0196746
2711826 1164105 1659122 0336104
3911826 1042952 1535555 0457449
6 085898 1357163 0642853
Experiment 3
Time h 415 M 416 M 418 M
0 14 18 0
0027487 1370804 1774104 003184
0106977 1284762 1675632 012038
0249912 114023 1539842 0264912
198
092138 0646932 1043942 0752256
152138 0389843 0794653 1012081
212138 0235788 0635663 1164374
3 0112972 0511689 1287393
Experiment 4
Time h 415 M 416 M 418 M
0 22 16 0
0043551 2153819 153798 005486
0241672 1906782 1311278 0288655
0439793 1706777 1105476 049592
0839793 1351856 0751683 0854071
1239793 1066839 0466383 1129747
1639793 0846621 0246217 1354339
2 0682943 0085826 1509085
75 Chapter 5
751 SNAr kinetics
7511 Experimental equipment
All experiments were run in an NMR tube using a dedicated 500 MHz
NMR spectrometer at The University of Cambridge as shown in Figure 751
199
Figure 751 The dedicated NMR spectrometer used for kinetic experiments in the SNAr
kinetics case study
7512 Kinetic experiments
In each experiment 246-trichloropyrimidine (700 microL 200 mM in CD3OD)
was warmedcooled to the required temperature in the 500 MHz NMR
spectrometer The NMR was then locked onto the solvent then the probe was
tuned and matched to the 1H nuclei then shimming ensued The spectrum of the
200 mM solution of 246-trichloropyrimidine was acquired
To this NMR tube a pre-cooledwarmed solution of CD3OD containing
200 mM ethyl 4-aminobutyrate hydrochloride and 600 mM Et3N (700 microL) was
added and mixed thoroughly by shaking the NMR tube This gave the desired
reaction concentration of 100 mM pyrimidine 100 mM amine and 300 mM Et3N
Spectra were acquired every ~80 seconds The software was used in each case
to obtain absolute integrals for each peak which were then converted to
200
concentrations based on the 246-trichloropyrimidine solution of known
concentration
7513 Example NMR spectra
An example lsquostackedrsquo NMR spectrum is shown in Figure 752 showing
the appearancedisappearance of peaks over time in the 25 degC experiment
Where the peak at 780 ppm corresponds to 246-trichloropyrimidine 666 ppm
corresponds to the 2-substituted product and 641 corresponds to the 4-substited
product
Figure 752 lsquoStackedrsquo NMR spectrum showing several NMR spectra over time in the 25 degC
experiment
7514 Raw data
Experiment 1 -25 degC
Time min 51 M 53 M 54 M
1455 0088818 0004156 0004562
1591667 0088538 0004229 0004611
1726667 0088465 0004295 0004727
1863333 0088063 0004362 0004842
1998333 008805 0004577 0004908
201
2133333 0087811 0004609 0004962
227 0087412 0004713 0005096
2405 0087133 0004827 0005202
2541667 0086922 0004901 0005268
2676667 008667 0004993 0005345
2813333 0086501 0005049 0005407
2948333 0086142 0005142 0005518
3083333 0085983 0005268 0005704
322 0085639 0005412 0005803
3355 0085286 0005468 0005826
3491667 0085108 0005589 000596
3626667 0084887 0005646 0005947
3763333 0084482 0005781 0006102
3898333 0084308 0005902 0006179
4035 0083927 0005914 000626
417 0083758 0006021 000639
4306667 0083386 0006157 0006496
4441667 0083205 0006154 0006574
4576667 0083093 0006298 0006627
4713333 008282 0006377 0006689
4848333 0082663 0006475 0006751
4985 0082501 0006492 0006786
512 0082273 000655 0006939
5256667 008206 0006658 0006902
5391667 008186 0006786 0007038
5526667 0081225 0006729 0007105
Experiment 2 0 degC
Time min 51 M 53 M 54 M
202
7333333 0072103 0007607 0008513
88 0070344 0008018 0008965
1016667 0068594 0008452 0009462
1151667 0068423 0008887 0009854
1288333 0066803 0009266 001028
1423333 0065829 0009635 0010682
156 0064594 0010002 0011061
1695 0063823 0010341 0011471
1831667 0062319 0010702 0011804
1966667 0061394 0010984 0012177
2101667 0060906 0011342 0012486
2238333 0059741 0011585 0012806
2373333 0058765 001182 0013095
251 0058315 0012151 0013445
2645 0057463 001241 0013671
278 0056496 0012685 0013978
2916667 0056066 00129 0014287
3051667 0055037 0013136 001449
3188333 0054482 0013382 0014789
3323333 0053852 0013629 0015023
3458333 0053151 0013804 0015225
3595 0052684 0014054 001548
373 0052192 0014261 0015707
3866667 005156 0014409 001589
4001667 0051008 0014613 0016133
4136667 0050399 0014842 0016311
4273333 0049812 0015017 0016498
4408333 0049557 0015136 0016666
4545 0048743 0015301 0016861
468 0048366 0015482 0017042
203
4816667 0047763 0015635 001723
4951667 0047326 0015831 0017433
5086667 0046947 0015973 0017573
5223333 0046384 0016088 0017747
5358333 0045991 0016243 0017903
5495 0045672 0016393 0018043
563 0045107 0016496 0018225
5766667 0044674 0016691 0018395
5901667 0044423 0016839 0018509
6036667 0044113 0016972 0018683
6173333 0043619 0017086 001884
Experiment 3 25 degC
Time min 51 M 53 M 54 M
3366667 0064314 0009652 0009883
48 0057052 0012118 0012863
615 0051792 0013813 0014922
75 0047939 0015186 0016476
8866667 0044748 0016215 0017819
1021667 0041922 0017079 0018798
1158333 0039664 0017878 0019678
1293333 0037598 0018491 0020463
1428333 0035777 0019052 0021122
1565 0034195 0019558 0021718
17 0032928 0019875 0022181
1836667 0031709 0020362 0022676
1971667 0030632 0020622 0023126
2106667 0029623 0020886 0023404
2243333 0028668 002128 0023818
204
2378333 0027704 0021452 002409
2515 0026937 0021641 0024389
265 0026303 0021884 0024635
2786667 0025572 0022112 0024925
2921667 0024988 0022265 0025126
3056667 0024358 0022417 0025261
3193333 0023747 0022601 0025533
3328333 0023156 0022788 0025713
3463333 0022678 0022896 0025943
36 0022158 0022984 0026042
3735 0021731 0023193 0026254
3871667 0021252 0023299 0026356
4006667 0020811 0023542 0026561
4143333 0020451 0023635 0026706
4278333 0019954 0023675 0026824
4413333 001972 0023743 0026953
455 0019374 0023807 0027033
4685 0019129 0023925 0027167
4821667 0018686 0024057 0027249
4956667 0018359 0024079 0027301
5093333 0018011 0024171 0027439
5228333 0017894 0024265 0027549
5363333 0017535 0024319 0027649
55 0017377 0024477 0027784
5635 001712 0024351 0027716
5771667 0016878 0024502 0027857
Experiment 4 50 degC
Time min 51 M 53 M 54 M
205
335 0044859 0017049 0028158
5066667 0033058 0020402 0034142
6416667 0028533 0021812 0036713
7766667 0025543 0022842 0038521
9133333 0022916 00235 0039813
105 0021041 0024107 004121
1185 0019498 0024602 0041829
132 0018156 0025096 0042681
1456667 0016918 0025264 0043145
1591667 0015895 0025503 0043496
1728333 0015031 0025778 0043978
1863333 0014386 0025935 0044504
20 0013754 0026166 0044669
2135 0013006 0026135 0045027
227 0012731 002645 004525
2406667 0012071 0026529 0045439
2541667 0011723 0026593 0045892
2678333 0011273 0026724 0046128
2813333 001075 0026737 004605
295 0010443 0026863 0046276
3085 0010126 0026964 0046178
3221667 0009967 0027158 0046613
3356667 0009483 00272 0046695
3493333 0009351 0027183 0047223
3628333 0009066 0027134 0047014
3763333 0008787 0027312 0047229
39 0008496 0027291 0047245
4035 000833 0027346 0047363
4171667 000802 0027313 0047267
4306667 0007943 0027459 0047585
206
4443333 0007797 0027504 0047612
4578333 0007612 0027442 0047469
4713333 0007363 0027731 0047777
485 0007162 0027549 0047689
4985 0007122 0027588 0047921
512 0006956 0027672 0048034
5256667 0006869 0027621 0047948
5391667 0006654 002781 0048184
5528333 0006511 0027703 0048181
5663333 0006367 0027739 0048193
5798333 0006367 0027751 0048241
752 PfBr
7521 Synthesis of PfBr material
To synthesise the PfBr material the synthesis reported by Tian and
Menard was approximately followed[249] To a suspension of magnesium turnings
(92 g 382 mmol) in anhydrous THF (5 mL) in a nitrogen atmosphere was added
05 mL of bromobenzene at room temperature to initiate the reaction The
reaction vessel was cooled to 0 degC using an ice bath and a solution of
bromobenzene in THF (12 M 270 mL) was added dropwise at 0 degC The reaction
medium was allowed to reach room temperature and stirred vigorously for 2
hours To this solution was added 9-fluorenone (301 g 186 mmol) in small
portions left to stir at room temperature for 1 hour The reaction was quenched
with dropwise addition of hydrochloric acid (1 M 100 mL) at 0 degC The solution
was extracted with Et2O (3 x 150 mL) and the combined organic layer was
washed with brine dried over MgSO4 filtered and concentrated under reduced
pressure to yield PfOH (426 g 89 ) NMR IR and mass spectroscopy analysis
confirmed the identity of the material
To prepare PfBr PfOH (361 g 140 mmol) was dissolved in toluene (150
mL) and aqueous HBr (48 ww 50 mL) was added at room temperature This
suspension was stirred vigorously at room temperature for 48 hours with the
vessel wrapped in foil to reduce light The mixture was extracted with toluene (3
207
x 100 mL) then the combined organic layer was washed with brine dried over
MgSO4 filtered and concentrated under reduced pressure to afford the crude
product The product was then recrystallised with hexane to afford PfBr (39 g 87
) 13C NMR IR and HPLC analysis confirmed the identity and purity of the
material as shown in Figure 753 Figure 754 and Figure 755 respectively
Figure 753 A 13C NMR confirming the presence of the PfBr material compared to literature
values to identify the material[249]
208
Figure 754 IR analysis of the PfBr material showing the absence of a hydroxy peak from any
residual PfOH
Figure 755 HPLC analysis of the PfBr material at 254 nm indicating that a pure product is
present
7522 Kinetic experiments
Three kinetic experiments were run at different temperatures 30 degC 35
degC and 40 degC For the first experiment at 30 degC alanine methyl ester
hydrochloride (0940 g 0007 mol) biphenyl (0195 g 0001 mol) and potassium
phosphate (35 g 0017 mol) were added to 5050 acetonitriledichloromethane
(375 mL) in a vessel A solution was then prepared of PfBr (0958 g 0003 mol)
in 5050 acetonitriledichloromethane (375 mL) and added to the reaction
vessel A sample was then immediately taken via HPLC then the stopwatch was
started to track the time of each injection This first HPLC serves as the artificial
209
zero time point then each subsequent HPLC injection followed every ~10
minutes thereafter
For the second experiment at 35 degC alanine methyl ester hydrochloride
(0977 g 0007 mol) biphenyl (0199 g 0001 mol) and potassium phosphate
(35 g 0017 mol) were added to 5050 acetonitriledichloromethane (375 mL)
in a vessel A solution was then prepared of PfBr (1017 g 0003 mol) in 5050
acetonitriledichloromethane (375 mL) and added to the reaction vessel A
sample was then immediately taken via HPLC then the stopwatch was started
to track the time of each injection This first HPLC serves as the artificial zero
time point then each subsequent HPLC injection followed every ~10 minutes
thereafter
For the third experiment at 40 degC alanine methyl ester hydrochloride
(0841 g 0006 mol) biphenyl (0219 g 0001 mol) and potassium phosphate
(35 g 0017 mol) were added to 5050 acetonitriledichloromethane (375 mL)
in a vessel A solution was then prepared of PfBr (1064 g 0003 mol) in 5050
acetonitriledichloromethane (375 mL) and added to the reaction vessel A
sample was then immediately taken via HPLC then the stopwatch was started
to track the time of each injection This first HPLC serves as the artificial zero
time point then each subsequent HPLC injection followed every ~10 minutes
thereafter
7523 HPLC analysis
All HPLC analysis was conducted using an Agilent 1100 series HPLC
instrument fitted with a Sigma Ascentis Express C18 reverse phase column (5cm
x 46mm 27 microm) Biphenyl was used as an internal standard The column
temperature was 40 degC and the HPLC method is shown
Time min A (water 01
TFA)
B (acetonitrile
01 TFA) Flow rate mL min-1
000 80 20 1
700 15 85 1
800 15 85 1
810 80 20 1
210
An example HPLC chromatogram during a kinetic experiment is shown in
Figure 756
Figure 756 An example HPLC chromatogram at 230 nm during a kinetic experiment in the
PfBr case study
7524 Raw data
Experiment 1 30 degC
Time min 57 M 58 M
0 0029401 0009756
95 0028029 0011516
195 0026429 0013131
29 0024664 0014922
40 0022779 0016856
50 0021252 0019153
605 0019363 0020372
71 0017813 0022065
83 001612 0023823
Experiment 2 35 degC
Time min 57 M 58 M
0 0036314 0006684
95 0030494 0011469
20 0028083 001372
315 0025271 0016536
41 0023355 0018562
211
51 0021259 0020741
625 0017572 0023705
Experiment 3 40 degC
Time min 57 M 58 M
0 0037032 0005772
105 0029931 0013994
205 0026302 0017446
305 0022947 002101
40 0020038 0023665
505 0017687 0025741
605 0016003 0027979
753 Maleic acid
7531 Example NMR
An example NMR spectrum is shown in Figure 754 where the peaks of
each species are highlighted
212
Figure 757 An example NMR spectrum from the maleic acid case study
7532 Raw data
Experiment 1 40 degC
Time min 513 M 515 M 516 M
0 0761 0 0
120 066207 0097408 0002283
240 0554769 0201665 0004947
360 0485518 0265589 0009893
Experiment 2 50 degC
Time min 513 M 515 M 516 M
0 0404344 0003268 0
325 0364451 0037657 186E-05
605 0346181 0071026 0000373
875 0319523 0095447 0001659
1225 0299017 0113343 0003225
2175 0234143 01661 0006264
2885 0204502 0198537 0009507
4175 015883 0230601 0015846
6875 0107378 0276833 0028336
13425 0052198 0313931 0053689
17825 0033649 0310389 0063196
28375 001799 0307033 0083516
Experiment 3 50 degC
Time min 513 M 515 M 516 M
0 0787537 0007088 0
28 0706604 0088537 565E-04
60 0625073 0164707 0002563
213
95 0556919 0226165 0006126
118 0530477 0271021 0007904
148 0480567 0308812 0011678
178 0426661 0316753 001425
208 0405376 035592 0020026
242 0384453 0382377 0021991
298 0344452 0431289 0029072
358 0299951 0456885 0034314
613 0205957 0541791 0061416
1306 0092916 0582232 0105274
1549 0076529 0596801 0119691
1768 0063259 0597105 0130915
Experiment 4 55 degC
Time min 513 M 515 M 516 M
0 0687045 0103644 0000811
30 0597449 019108 297E-03
60 0531145 0252908 0007448
90 0479052 0301502 0010947
168 0365378 0402913 0023209
228 031788 0443385 0030235
283 028467 0469404 0037426
348 0221288 0520375 0049837
408 0200913 0533579 0057007
Experiment 4 60 degC
Time min 513 M 515 M 516 M
0 0738693 0014307 0
60 0442764 0296682 136E-02
214
120 0335085 0389301 0029367
180 0265809 0447282 0040662
240 0224394 0475143 0053463
360 0117468 0551196 0084336
480 0070029 0575292 0107679
1320 0015813 0538395 0198792
76 Computational setup
761 Chapter 2 - 3
For all computation in Chapter 2 - 3 MATLAB 2018a was used on a
desktop computer with a 4-core Intel i5-2310 processor
762 Chapter 4 - 5
For all computation in Chapter 4 - 5 MATLAB 2020a was used on a
custom built laptop with an 8-core AMD Ryzen 7 4800H processor
Chapter 8 References
1 Miyaura N K Yamada and A Suzuki A new stereospecific cross-coupling by the palladium-catalyzed reaction of 1-alkenylboranes with 1-alkenyl or 1-alkynyl halides Tetrahedron Letters 1979 20(36) p 3437-3440
2 Sonogashira K Y Tohda and N Hagihara A convenient synthesis of acetylenes catalytic substitutions of acetylenic hydrogen with bromoalkenes iodoarenes and bromopyridines Tetrahedron Letters 1975 16(50) p 4467-4470
3 Wittig G and W Haag Uumlber Triphenyl‐phosphinmethylene als olefinbildende Reagenzien (II Mitteil 1) Chemische Berichte 1955 88(11) p 1654-1666
4 Baumann M et al A Perspective on Continuous Flow Chemistry in the Pharmaceutical Industry Organic Process Research amp Development 2020
5 Noeacutel T Flow into the Chemistry Curriculum Chemistry World 2019 6 Reizman BJ and KF Jensen Feedback in flow for accelerated reaction
development Accounts of Chemical Research 2016 49(9) p 1786-1796
7 Plutschack MB et al The Hitchhikerrsquos Guide to Flow Chemistry Chemical Reviews 2017 117(18) p 11796-11893
215
8 Granda JM et al Controlling an organic synthesis robot with machine learning to search for new reactivity Nature 2018 559(7714) p 377-381
9 Peela NR IC Lee and DG Vlachos Design and fabrication of a high-throughput microreactor and its evaluation for highly exothermic reactions Industrial amp Engineering Chemistry Research 2012 51(50) p 16270-16277
10 Rivera NR et al Investigation of a Flow Step Clogging Incident A Precautionary Note on the Use of THF in Commercial-Scale Continuous Process Organic Process Research amp Development 2019 23(11) p 2556-2561
11 Chapman MR et al Simple and versatile laboratory scale CSTR for multiphasic continuous-flow chemistry and long residence times Organic Process Research amp Development 2017 21(9) p 1294-1301
12 Guan F et al A universal reactor platform for batch and flow application to homogeneous and heterogeneous hydrogenation Reaction Chemistry amp Engineering 2020 5(10) p 1903-1908
13 Muumlller G et al Continuous chemistry in microreaction systems for practical use Chimia International Journal for Chemistry 2006 60(9) p 618-622
14 Pennemann H et al Benchmarking of microreactor applications Organic Process Research amp Development 2004 8(3) p 422-439
15 Schwalbe T V Autze and G Wille Chemical synthesis in microreactors Chimia-Zurich 2002 56(11) p 636-646
16 Fletcher PD et al Micro reactors principles and applications in organic synthesis Tetrahedron 2002 58(24) p 4735-4757
17 Haswell SJ and P Watts Green chemistry synthesis in micro reactors Green Chemistry 2003 5(2) p 240-249
18 Hessel V and H Loumlwe Organic synthesis with microstructured reactors Chemical Engineering Technology Industrial Chemistry‐Plant Equipment‐Process Engineering‐Biotechnology 2005 28(3) p 267-284
19 Wilson NG and T McCreedy On-chip catalysis using a lithographically fabricated glass microreactormdashthe dehydration of alcohols using sulfated zirconia Chemical Communications 2000(9) p 733-734
20 Wiles C et al 1 4-Addition of enolates to α β-unsaturated ketones within a micro reactor Lab on a Chip 2002 2(2) p 62-64
21 Wegner J S Ceylan and A Kirschning Flow chemistryndasha key enabling technology for (multistep) organic synthesis Advanced Synthesis Catalysis 2012 354(1) p 17-57
22 Nagaki A et al Lithiation of 1 2‐Dichloroethene in Flow Microreactors
Versatile Synthesis of Alkenes and Alkynes by Precise Residence‐Time Control Angewandte Chemie International Edition 2012 51(13) p 3245-3248
23 Mason BP et al Greener approaches to organic synthesis using microreactor technology Chemical Reviews 2007 107(6) p 2300-2318
24 Newman SG and KF Jensen The role of flow in green chemistry and engineering Green Chemistry 2013 15(6) p 1456-1472
25 Riva E et al Reaction of Grignard reagents with carbonyl compounds under continuous flow conditions Tetrahedron 2010 66(17) p 3242-3247
216
26 Baumann M and IR Baxendale The synthesis of active pharmaceutical ingredients (APIs) using continuous flow chemistry Beilstein Journal of Organic Chemistry 2015 11(1) p 1194-1219
27 Bogdan AR et al The continuous‐flow synthesis of ibuprofen Angewandte Chemie International Edition 2009 48(45) p 8547-8550
28 Sheldon RA Catalysis the key to waste minimization Journal of Chemical Technology amp Biotechnology International Research in Process Environmental amp Clean Technology 1997 68(4) p 381-388
29 Kummer A T Varga and L Nagy Semi-batch reactor control with NMPC avoiding thermal runaway Computers and Chemical Engineering 2020 134 p 106694
30 Kao C-S and K-H Hu Acrylic reactor runaway and explosion accident analysis Journal of Loss Prevention in the Process Industries 2002 15(3) p 213-222
31 Fabiano B et al A perspective on Seveso accident based on cause-consequences analysis by three different methods Journal of Loss Prevention in the Process Industries 2017 49 p 18-35
32 Malet-Sanz L and F Susanne Continuous flow synthesis A pharma perspective Journal of Medicinal Chemistry 2012 55(9) p 4062-4098
33 Kunz U and T Turek Flow through reactors for organic chemistry directly electrically heated tubular mini reactors as an enabling technology for organic synthesis Beilstein Journal of Organic Chemistry 2009 5(1) p 70
34 Kappe CO Controlled microwave heating in modern organic synthesis Angewandte Chemie International Edition 2004 43(46) p 6250-6284
35 Yoshida Ji A Nagaki and T Yamada Flash chemistry fast chemical synthesis by using microreactors Chemistry - A European Journal 2008 14(25) p 7450-7459
36 van der Linden JJ et al Investigation of the Moffattminus Swern oxidation in a continuous flow microreactor system Organic Process Research amp Development 2008 12(5) p 911-920
37 Cutler AH MJ Antal Jr and M Jones Jr A critical evaluation of the plug-flow idealization of tubular-flow reactor data Industrial amp Engineering Chemistry Research 1988 27(4) p 691-697
38 Lebl R et al Scalable continuous flow hydrogenations using PdAl2O3-coated rectangular cross-section 3D-printed static mixers Catalysis Today 2020
39 Jolley KE MR Chapman and AJ Blacker A general and atom-efficient continuous-flow approach to prepare amines amides and imines via reactive N-chloramines Beilstein Journal of Organic Chemistry 2018 14(1) p 2220-2228
40 Hessel V Novel process windowsndashgate to maximizing process intensification via flow chemistry Chemical Engineering Technology Industrial Chemistry-Plant Equipment-Process Engineering-Biotechnology 2009 32(11) p 1655-1681
41 Bogdan AR and NW Sach The Use of Copper Flow Reactor Technology for the Continuous Synthesis of 1 4‐Disubstituted 1 2 3‐Triazoles Advanced Synthesis Catalysis 2009 351(6) p 849-854
42 Hornung CH et al A microcapillary flow disc reactor for organic synthesis Organic Process Research amp Development 2007 11(3) p 399-405
217
43 Acke DR and CV Stevens Study of the Baylisminus Hillman reaction in a microreactor environment first continuous production of Baylisminus Hillman adducts Organic Process Research amp Development 2006 10(3) p 417-422
44 McQuade DT and PH Seeberger Applying flow chemistry Methods materials and multistep synthesis J Org Chem 2013 78(13) p 6384-6389
45 Razzaq T and CO Kappe Continuous Flow Organic Synthesis under High‐TemperaturePressure Conditions ChemistryndashAn Asian Journal 2010 5(6) p 1274-1289
46 Hartman RL Managing solids in microreactors for the upstream continuous processing of fine chemicals Organic Process Research amp Development 2012 16(5) p 870-887
47 Reichardt C Solvent effects in organic chemistry 1979 Verlag Chemie 48 Reichardt C and T Welton Solvents and solvent effects in organic
chemistry 2011 John Wiley amp Sons 49 Singh D and PL Dhepe An efficient catalytic transfer hydrogenation-
hydrodeoxygenation of lignin derived monomers Investigating catalyst properties-activity correlation Catalysis Communications 2021 149 p 106220
50 Baxendale IR et al Multistep synthesis using modular flow reactors BestmannndashOhira reagent for the formation of alkynes and triazoles Angewandte Chemie 2009 121(22) p 4077-4081
51 Alam MP et al C O bond formation in a microfluidic reactor high yield S N Ar substitution of heteroaryl chlorides Tetrahedron letters 2016 57(19) p 2059-2062
52 Gutmann B et al On the Fischer Indole Synthesis of 7-Ethyltryptophol Mechanistic and Process Intensification Studies under Continuous Flow Conditions Organic Process Research amp Development 2013 17(2) p 294-302
53 Marre S Y Roig and C Aymonier Supercritical microfluidics Opportunities in flow-through chemistry and materials science The Journal of Supercritical Fluids 2012 66 p 251-264
54 Savage PE Organic chemical reactions in supercritical water Chemical reviews 1999 99(2) p 603-622
55 Adschiri T et al Green materials synthesis with supercritical water Green Chemistry 2011 13(6) p 1380-1390
56 Munshi P and S Bhaduri Supercritical CO 2 a twenty-first century solvent for the chemical industry Current Science (00113891) 2009 97(1)
57 Eckert CA et al Sustainable reactions in tunable solvents The Journal of Physical Chemistry B 2004 108(47) p 18108-18118
58 ONeil A and JJ Watkins Fabrication of device nanostructures using supercritical fluids MRS bulletin 2005 30(12) p 967-975
59 Romang AH and JJ Watkins Supercritical fluids for the fabrication of semiconductor devices emerging or missed opportunities Chemical reviews 2010 110(1) p 459
60 Marre S F Cansell and C Aymonier Tailor-made surface properties of particles with a hydrophilic or hydrophobic polymer shell mediated by supercritical CO2 Langmuir 2008 24(1) p 252
218
61 Cansell F and C Aymonier Design of functional nanostructured materials using supercritical fluids The Journal of Supercritical Fluids 2009 47(3) p 508-516
62 Chamberlain TW et al Catalytic nanoreactors in continuous flow hydrogenation inside single-walled carbon nanotubes using supercritical CO 2 Chemical Communications 2014 50(40) p 5200-5202
63 Devetta L et al Kinetic experiments and modeling of a three-phase catalytic hydrogenation reaction in supercritical CO 2 Catalysis Today 1999 48(1) p 337-345
64 Han X and M Poliakoff Continuous reactions in supercritical carbon dioxide problems solutions and possible ways forward Chemical Society Reviews 2012 41(4) p 1428-1436
65 Licence P et al Chemical reactions in supercritical carbon dioxide from laboratory to commercial plant Green Chemistry 2003 5(2) p 99-104
66 Leitner W Supercritical carbon dioxide as a green reaction medium for catalysis Accounts of chemical research 2002 35(9) p 746-756
67 McHugh M and V Krukonis Supercritical fluid extraction principles and practice 2013 Elsevier
68 Hitzler MG et al Selective catalytic hydrogenation of organic compounds in supercritical fluids as a continuous process Organic Process Research amp Development 1998 2(3) p 137-146
69 Cason JP and CB Roberts Metallic copper nanoparticle synthesis in AOT reverse micelles in compressed propane and supercritical ethane solutions The Journal of Physical Chemistry B 2000 104(6) p 1217-1221
70 Hyde JR et al Continuous catalytic reactions in supercritical fluids Applied Catalysis A General 2001 222(1) p 119-131
71 Hoffmann N Photochemical reactions of aromatic compounds and the concept of the photon as a traceless reagent Photochemical amp Photobiological Sciences 2012 11(11) p 1613-1641
72 Hoffmann N Photochemical reactions as key steps in organic synthesis Chemical Reviews 2008 108(3) p 1052
73 Knowles JP LD Elliott and KI Booker-Milburn Flow photochemistry Old light through new windows Beilstein journal of organic chemistry 2012 8 p 2025
74 Hook BD et al A practical flow reactor for continuous organic photochemistry The Journal of organic chemistry 2005 70(19) p 7558-7564
75 Schuster EM and P Wipf Photochemical flow reactions Israel Journal of Chemistry 2014 54(4) p 361-370
76 Yoshida J-i et al Modern strategies in electroorganic synthesis Chemical reviews 2008 108(7) p 2265-2299
77 Watts K A Baker and T Wirth Electrochemical synthesis in microreactors Journal of Flow Chemistry 2014 4(1) p 2-11
78 Horii D T Fuchigami and M Atobe A new approach to anodic substitution reaction using parallel laminar flow in a micro-flow reactor Journal of the American Chemical Society 2007 129(38) p 11692-11693
79 Horii D et al A novel electrosynthetic system for anodic substitution reactions by using parallel laminar flow in a microflow reactor Chemistry-A European Journal 2008 14(33) p 10382-10387
219
80 ZNIDARŠIC-PLAZL P Enzymatic microreactors utilizing non-aqueous media Chimica Oggi-Chemistry Today 2014 32 p 1
81 Rao NN et al Continuous biocatalytic processes Organic Process Research amp Development 2009 13(3) p 607-616
82 Babich L et al Continuous‐Flow Reactor‐Based Enzymatic Synthesis
of Phosphorylated Compounds on a Large Scale Chemistry-A European Journal 2012 18(21) p 6604-6609
83 Jas G and A Kirschning Continuous flow techniques in organic synthesis Chemistry-A European Journal 2003 9(23) p 5708-5723
84 Chen P et al A practical high through-put continuous process for the synthesis of chiral cyanohydrins The Journal of organic chemistry 2002 67(23) p 8251-8253
85 Liu Z et al Combined biosynthetic pathway for de novo production of UDP‐galactose catalysis with multiple enzymes immobilized on agarose
beads ChemBioChem 2002 3(4) p 348-355 86 Kobayashi S H Ishitani and S Nagayama Lanthanide triflate catalyzed
imino Diels-Alder reactions convenient syntheses of pyridine and quinoline derivatives Synthesis 1995 1995(09) p 1195-1202
87 Usutani H et al Generation and reactions of o-bromophenyllithium without benzyne formation using a microreactor Journal of the American Chemical Society 2007 129(11) p 3046-3047
88 Britton J and CL Raston Multi-step continuous-flow synthesis Chemical Society Reviews 2017 46(5) p 1250-1271
89 Snead DR and TF Jamison A three‐minute synthesis and purification
of ibuprofen Pushing the limits of continuous‐flow processing Angewandte Chemie International Edition 2015 54(3) p 983-987
90 Sahoo HR JG Kralj and KF Jensen Multistep Continuous‐Flow Microchemical Synthesis Involving Multiple Reactions and Separations Angewandte Chemie 2007 119(30) p 5806-5810
91 Hartman RL et al Multistep microchemical synthesis enabled by microfluidic distillation Angewandte Chemie International Edition 2010 49(5) p 899-903
92 Gloumlckner S et al The rapid synthesis of oxazolines and their heterogeneous oxidation to oxazoles under flow conditions Organic amp biomolecular chemistry 2015 13(1) p 207-214
93 Roberge DM et al Microreactor technology a revolution for the fine chemical and pharmaceutical industries Chemical engineering amp technology 2005 28(3) p 318-323
94 Exarchou V et al LC-UV-solid-phase extraction-NMR-MS combined with a cryogenic flow probe and its application to the identification of compounds present in Greek oregano Analytical Chemistry 2003 75(22) p 6288-6294
95 Benito-Lopez F et al Optical fiber-based on-line UVVis spectroscopic monitoring of chemical reaction kinetics under high pressure in a capillary microreactor Chemical Communications 2005(22) p 2857-2859
96 Mozharov S et al Improved method for kinetic studies in microreactors using flow manipulation and noninvasive Raman spectrometry Journal of the American Chemical Society 2011 133(10) p 3601-3608
97 Song H and RF Ismagilov Millisecond kinetics on a microfluidic chip using nanoliters of reagents Journal of the American Chemical Society 2003 125(47) p 14613-14619
220
98 Martinuzzi I et al Reaction mechanism for glycerol dehydration in the gas phase over a solid acid catalyst determined with on-line gas chromatography Chemical Engineering Science 2014 116 p 118-127
99 Moret S et al Microwave assisted saponification (MAS) followed by on-line liquid chromatography (LC)ndashgas chromatography (GC) for high-throughput and high-sensitivity determination of mineral oil in different cereal-based foodstuffs Food chemistry 2016 196 p 50-57
100 Grunwaldt J-D and BS Clausen Combining XRD and EXAFS with on-line catalytic studies for in situ characterization of catalysts Topics in Catalysis 2002 18(1) p 37-43
101 De Beer T et al In‐line and real‐time process monitoring of a freeze drying process using Raman and NIR spectroscopy as complementary process analytical technology (PAT) tools Journal of pharmaceutical sciences 2009 98(9) p 3430-3446
102 Ward H and FE Sistare On-line determination and control of the water content in a continuous conversion reactor using NIR spectroscopy Analytica chimica acta 2007 595(1) p 319-322
103 Cervera-Padrell AE et al Monitoring and control of a continuous Grignard reaction for the synthesis of an active pharmaceutical ingredient intermediate using inline NIR spectroscopy Organic Process Research amp Development 2012 16(5) p 901-914
104 Bristow TW et al On-line monitoring of continuous flow chemical synthesis using a portable small footprint mass spectrometer Journal of The American Society for Mass Spectrometry 2014 25(10) p 1794-1802
105 Roscioli KM et al Real time pharmaceutical reaction monitoring by electrospray ion mobility-mass spectrometry International Journal of Mass Spectrometry 2013 336 p 27-36
106 Mathieson JS et al Continuous parallel ESI-MS analysis of reactions carried out in a bespoke 3D printed device Beilstein journal of nanotechnology 2013 4 p 285
107 Robert J and A JohnaacuteBlacker Online quantitative mass spectrometry for the rapid adaptive optimisation of automated flow reactors Reaction Chemistry amp Engineering 2016 1(1) p 96-100
108 Browne DL et al Continuous flow reaction monitoring using an on‐line miniature mass spectrometer Rapid Communications in Mass Spectrometry 2012 26(17) p 1999-2010
109 Zhang J et al Design and scaling up of microchemical systems a review Annual review of chemical and biomolecular engineering 2017 8 p 285-305
110 Rasheed M and T Wirth Fast optimisation of a Diels-Alder reaction in a flow microreactor by in-line HPLC analysis Chemistry Today 2011 29(3) p 56
111 Welch CJ et al Online analysis of flowing streams using microflow HPLC Organic Process Research amp Development 2009 13(5) p 1022-1025
112 Carter CF et al ReactIR flow cell a new analytical tool for continuous flow chemical processing Organic Process Research amp Development 2010 14(2) p 393-404
113 Malet-Sanz L et al Preparation of arylsulfonyl chlorides by chlorosulfonylation of in situ generated diazonium salts using a
221
continuous flow reactor Organic amp biomolecular chemistry 2010 8(23) p 5324-5332
114 Carter CF et al The continuous flow synthesis of butane-2 3-diacetal protected building blocks using microreactors Organic amp biomolecular chemistry 2010 8(7) p 1588-1595
115 Smith CJ et al A fully automated multistep flow synthesis of 5-amino-4-cyano-1 2 3-triazoles Organic amp biomolecular chemistry 2011 9(6) p 1938-1947
116 Floyd TM MA Schmidt and KF Jensen Silicon micromixers with infrared detection for studies of liquid-phase reactions Industrial amp engineering chemistry research 2005 44(8) p 2351-2358
117 Carter CF et al Synthesis of acetal protected building blocks using flow chemistry with flow IR analysis preparation of butane-2 3-diacetal tartrates Organic amp biomolecular chemistry 2009 7(22) p 4594-4597
118 Sans V et al A self optimizing synthetic organic reactor system using real-time in-line NMR spectroscopy Chemical science 2015 6(2) p 1258-1264
119 Maiwald M et al Quantitative high-resolution on-line NMR spectroscopy in reaction and process monitoring Journal of Magnetic Resonance 2004 166(2) p 135-146
120 Maiwald M et al Quantitative on-line high-resolution NMR spectroscopy in process engineering applications Analytical and bioanalytical chemistry 2003 375(8) p 1111-1115
121 Dalitz F et al Process and reaction monitoring by low-field NMR spectroscopy Progress in nuclear magnetic resonance spectroscopy 2012 60 p 52-70
122 Silva Elipe MV and RR Milburn Monitoring chemical reactions by low‐field benchtop NMR at 45 MHz pros and cons Magnetic Resonance in Chemistry 2016 54(6) p 437-443
123 Goldbach M et al Preparation of Grignard reagents from magnesium metal under continuous flow conditions and on-line monitoring by NMR spectroscopy Tetrahedron Letters 2016 57(1) p 122-125
124 Houben C and AA Lapkin Automatic discovery and optimization of chemical processes Current Opinion in Chemical Engineering 2015 9 p 1-7
125 Cox BG Modern liquid phase kinetics 1994 Oxford University Press 126 Perrin CL Linear or nonlinear least-squares analysis of kinetic data
Journal of Chemical Education 2017 94(6) p 669-672 127 Michaelis L and ML Menten Die kinetik der invertinwirkung 2007
Universitaumltsbibliothek Johann Christian Senckenberg 128 Johnson KA A century of enzyme kinetic analysis 1913 to 2013 FEBS
Letters 2013 587(17) p 2753-2766 129 Lineweaver H and D Burk The determination of enzyme dissociation
constants Journal of the American Chemical Society 1934 56(3) p 658-666
130 Nielsen CD-T and J Bureacutes Visual kinetic analysis Chemical Science 2019 10(2) p 348-353
131 Blackmond DG Reaction progress kinetic analysis a powerful methodology for mechanistic studies of complex catalytic reactions Angewandte Chemie International Edition 2005 44(28) p 4302-4320
222
132 Rosner T et al Kinetic studies of Heck coupling reactions using palladacycle catalysts experimental and kinetic modeling of the role of dimer species Journal of the American Chemical Society 2001 123(9) p 1848-1855
133 Nielsen LP et al Mechanistic investigation leads to a synthetic improvement in the hydrolytic kinetic resolution of terminal epoxides Journal of the American Chemical Society 2004 126(5) p 1360-1362
134 Baxter RD et al Mechanistic rationalization of unusual kinetics in Pd-catalyzed CndashH olefination Journal of the American Chemical Society 2012 134(10) p 4600-4606
135 Blackmond DG Kinetic profiling of catalytic organic reactions as a mechanistic tool Journal of the American Chemical Society 2015 137(34) p 10852-10866
136 Bureacutes J A simple graphical method to determine the order in catalyst Angewandte Chemie International Edition 2016 55(6) p 2028-2031
137 Bureacutes J Variable time normalization analysis General graphical elucidation of reaction orders from concentration profiles Angewandte Chemie International Edition 2016 55(52) p 16084-16087
138 Mathew JS et al Investigations of Pd-catalyzed ArX coupling reactions informed by reaction progress kinetic analysis The Journal of Organic Chemistry 2006 71(13) p 4711-4722
139 Streuff J et al Mechanism of the tiIII-catalyzed acyloin-type umpolung a catalyst-controlled radical reaction Journal of the American Chemical Society 2015 137(45) p 14396-14405
140 Lin S and EN Jacobsen Thiourea-catalysed ring opening of episulfonium ions with indole derivatives by means of stabilizing non-covalent interactions Nature Chemistry 2012 4(10) p 817
141 Noda H et al Catalytic asymmetric synthesis of CF 3-substituted tertiary propargylic alcohols via direct aldol reaction of α-N 3 amide Chemical Science 2017 8(4) p 3260-3269
142 Lundberg H et al Mechanistic elucidation of zirconium-catalyzed direct amidation Journal of the American Chemical Society 2017 139(6) p 2286-2295
143 Vasilenko V CK Blasius and LH Gade One-Pot Sequential Kinetic Profiling of a Highly Reactive Manganese Catalyst for Ketone Hydroboration Leveraging σ-Bond Metathesis via Alkoxide Exchange Steps Journal of the American Chemical Society 2018 140(29) p 9244-9254
144 Franceschini G and S Macchietto Model-based design of experiments for parameter precision State of the art Chemical Engineering Science 2008 63(19) p 4846-4872
145 Galvanin F S Macchietto and F Bezzo Model-based design of parallel experiments Industrial amp Engineering Chemistry Research 2007 46(3) p 871-882
146 Waldron C et al Model-based design of transient flow experiments for the identification of kinetic parameters Reaction Chemistry amp Engineering 2020 5(1) p 112-123
147 Von Stosch M et al Hybrid semi-parametric modeling in process systems engineering Past present and future Computers and Chemical Engineering 2014 60 p 86-101
223
148 de Juan A et al Combining hard-and soft-modelling to solve kinetic problems Chemometrics Intelligent Laboratory Systems 2000 54(2) p 123-141
149 de Carvalho AR et al Comparison of PLS and kinetic models for a second-order reaction as monitored using ultraviolet visible and mid-infrared spectroscopy Talanta 2006 68(4) p 1190-1200
150 Fath V et al Efficient Kinetic Data Acquisition and Model Prediction Continuous Flow Microreactors Inline FT-IR Spectroscopy and Self-modeling Curve Resolution Organic Process Research amp Development 2020
151 Toch K JW Thybaut and GB Marin A systematic methodology for kinetic modeling of chemical reactions applied to n‐hexane hydroisomerization AIChE Journal 2015 61(3) p 880-892
152 Yang S-T X Liu and Y Zhang Metabolic engineeringndashapplications methods and challenges in Bioprocessing for Value-Added Products from Renewable Resources 2007 Elsevier p 73-118
153 Vasquez E and T Eldredge Process modeling for hydrocarbon fuel conversion in Advances in Clean Hydrocarbon Fuel Processing 2011 Elsevier p 509-545
154 Paul S V Kurin and S Whiteson Fast Efficient Hyperparameter Tuning for Policy Gradient Methods in Advances in Neural Information Processing Systems 2019
155 Wistuba M N Schilling and L Schmidt-Thieme Scalable gaussian process-based transfer surrogates for hyperparameter optimization Machine Learning 2018 107(1) p 43-78
156 Lerman P Fitting segmented regression models by grid search Journal of the Royal Statistical Society Series C 1980 29(1) p 77-84
157 Huang C-YR C-Y Lai and K-TT Cheng Fundamentals of algorithms in Electronic Design Automation 2009 Elsevier p 173-234
158 Boyd SP and L Vandenberghe Convex optimization 2004 Cambridge university press p 1-16
159 Vasiljević D Comparison of optimization algorithms in Classical and Evolutionary Algorithms in the Optimization of Optical Systems 2002 Springer p 83-88
160 Inuiguchi M and J Ramık Possibilistic linear programming a brief review of fuzzy mathematical programming and a comparison with stochastic programming in portfolio selection problem Fuzzy Sets amp Systems 2000 111(1) p 3-28
161 Beacutenichou M et al Experiments in mixed-integer linear programming Mathematical Programming 1971 1(1) p 76-94
162 Kuhn HW and AW Tucker Nonlinear programming in Traces and emergence of nonlinear programming 2014 Springer p 247-258
163 Bregman LM The relaxation method of finding the common point of convex sets and its application to the solution of problems in convex programming USSR Computational Mathetmatics and Mathematical Physics 1967 7(3) p 200-217
164 Frank M and P Wolfe An algorithm for quadratic programming Naval Research Logistics Quarterly 1956 3(1‐2) p 95-110
165 Drummond LG and BF Svaiter A steepest descent method for vector optimization Journal of Computational amp Applied Mathematics 2005 175(2) p 395-414
224
166 Clayton AD et al Algorithms for the self-optimisation of chemical reactions Reaction Chemistry amp Engineering 2019 4(9) p 1545-1554
167 Spendley W GR Hext and FR Himsworth Sequential application of simplex designs in optimisation and evolutionary operation Technometrics 1962 4(4) p 441-461
168 Nelder JA and R Mead A simplex method for function minimization The Computer Journal 1965 7(4) p 308-313
169 Byrd RH JC Gilbert and J Nocedal A trust region method based on interior point techniques for nonlinear programming Mathematical Programming 2000 89(1) p 149-185
170 Waltz RA et al An interior algorithm for nonlinear optimization that combines line search and trust region steps Mathematical Programming 2006 107(3) p 391-408
171 Whitley D A genetic algorithm tutorial Statistics amp Computing 1994 4(2) p 65-85
172 Brochu E VM Cora and N De Freitas A tutorial on Bayesian optimization of expensive cost functions with application to active user modeling and hierarchical reinforcement learning preprint arXiv10122599 2010
173 Tsu J VHG Diacuteaz and MJ Willis Computational approaches to kinetic model selection Computers and Chemical Engineering 2019 121 p 618-632
174 de la Mare PBD Reaction Mechanism Encyclopaeligdia Britannica 2008 [cited 2020 April 13] Available from httpswwwbritannicacomsciencereaction-mechanism
175 Carey FA and RJ Sundberg Study and Description of Organic Reaction Mechanisms Advanced Organic Chemistry Part A Structure amp Mechanisms 2000 p 187-261
176 Willis MJ and M von Stosch Inference of chemical reaction networks using mixed integer linear programming Computers and Chemical Engineering 2016 90 p 31-43
177 Aris R and R Mah Independence of chemical reactions Industrial Engineering Chemistry Fundamentals 1963 2(2) p 90-94
178 Bonvin D and D Rippin Target factor analysis for the identification of stoichiometric models Chemical Engineering Science 1990 45(12) p 3417-3426
179 Amrhein M B Srinivasan and D Bonvin Target factor analysis of reaction data Use of data pre-treatment and reaction-invariant relationships Chemical Engineering Science 1999 54(5) p 579-591
180 Georgakis C and R Lin Stoichiometric Modeling of Complex Pharmaceutical Reactions in Proceedings of the Annual AIChE meeting in Cincinnati OH November 2005
181 Brendel M D Bonvin and W Marquardt Incremental identification of kinetic models for homogeneous reaction systems Chemical Engineering Science 2006 61(16) p 5404-5420
182 Bhatt N et al Incremental identification of reaction systemsmdashA comparison between rate-based and extent-based approaches Chemical Engineering Science 2012 83 p 24-38
183 Burnham SC et al Inference of chemical reaction networks Chemical Engineering Science 2008 63(4) p 862-873
225
184 Crampin EJ S Schnell and PE McSharry Mathematical and computational techniques to deduce complex biochemical reaction mechanisms Progress in Biophysics amp Molecular Biology 2004 86(1) p 77-112
185 Searson DP et al Inference of chemical reaction networks using hybrid s-system models Chemical Product amp Process Modelling 2007 2(1)
186 Srividhya J et al Reconstructing biochemical pathways from time course data Proteomics 2007 7(6) p 828-838
187 Searson DP MJ Willis and A Wright Reverse Engineering Chemical Reaction Networks from Time Series Data Statistical Modelling of Molecular Descriptors in QSARQSPR 2014 2(12)
188 Koza JR et al Automatic computational discovery of chemical reaction networks using genetic programming in Computational Discovery of Scientific Knowledge 2007 Springer p 205-227
189 Hii CJ AR Wright and MJ Willis Utilizing a genetic algorithm to elucidate chemical reaction networks An experimental case study International Journal of Chemical Engineering Applications 2014 5(6) p 516
190 Chellaboina V et al Modeling and analysis of mass-action kinetics IEEE Control Systems Magazine 2009 29(4) p 60-78
191 Sayikli C and EZ Bagci Limitations of using mass action kinetics method in modeling biochemical systems illustration for a second order reaction in International Conference on Computational Science and Its Applications 2011 Springer
192 Furusjouml E O Svensson and L-G Danielsson Estimation of kinetic parameters from non-isothermal batch experiments monitored by in situ vibrational spectroscopy Chemometrics Intelligent Laboratory Systems 2003 66(1) p 1-14
193 Pagano RL et al Cure kinetic parameter estimation of thermosetting resins with isothermal data by using particle swarm optimization European Polymer Journal 2008 44(8) p 2678-2686
194 Zhang Y-Y and J-H Liu Kinetic study of enantioselective hydrolysis of (R S)-ketoprofen ethyl ester using immobilized T laibacchii lipase Biochemical Engineering Journal 2011 54(1) p 40-46
195 VanBuren V L Cassimeris and DJ Odde Mechanochemical model of microtubule structure and self-assembly kinetics Biophysical Journal 2005 89(5) p 2911-2926
196 Gao D Y Xiao and A Varma Guaiacol hydrodeoxygenation over platinum catalyst reaction pathways and kinetics Industrial Engineering Chemistry Research 2015 54(43) p 10638-10644
197 Changi S TM Brown and PE Savage Reaction kinetics and pathways for phytol in high-temperature water Chemical Engineering Journal 2012 189 p 336-345
198 Zhang Y et al One-pot Enzymatic Synthesis of Enantiopure 1 3-oxathiolane by Trichosporon Laibachii Lipase and Kinetic Model Organic Process Research amp Development 2020
199 Villaverde AF et al Benchmarking optimization methods for parameter estimation in large kinetic models Bioinformatics 2019 35(5) p 830-838
200 Akaike H Fitting autoregressive models for prediction Annals of the Institute of Statistical Mathematics 1969 21(1) p 243-247
226
201 Hurvich CM and C-L Tsai Regression and time series model selection in small samples Biometrika 1989 76(2) p 297-307
202 Burnham KP and DR Anderson A practical information-theoretic approach Model Selection and Multimodel Inference Vol 2 49-96 2002 New York Springer
203 Gholamipour-Shirazi A and C Rolando Alkylation of substituted benzoic acids in a continuous flow microfluidic microreactor kinetics and linear free energy relationships Organic Process Research amp Development 2012 16(5) p 811-818
204 Niemeier JK et al Application of kinetic modeling and competitive solvent hydrolysis in the development of a highly selective hydrolysis of a nitrile to an amide Organic Process Research amp Development 2014 18(3) p 410-416
205 Hartridge H and FJW Roughton A method of measuring the velocity of very rapid chemical reactions Proceedings of the Royal Society of London Series A Containing Papers of a Mathematical Physical Character 1923 104(726) p 376-394
206 Gibson QH Rapid mixing Stopped flow Methods in Enzymology 1969 16 p 187-228
207 Seong GH J Heo and RM Crooks Measurement of enzyme kinetics using a continuous-flow microfluidic system Analytical Chemistry 2003 75(13) p 3161-3167
208 Rozich AF and DJ Castens Inhibition kinetics of nitrification in continuous-flow reactors Water Pollution Control Federation 1986 p 220-226
209 Christensen M et al Development of an automated kinetic profiling system with online HPLC for reaction optimization Reaction Chemistry amp Engineering 2019 4(9) p 1555-1558
210 Johnson KA Rapid quench kinetic analysis of polymerases adenosinetriphosphatases and enzyme intermediates Contemporary Enzyme Kinetics Mechanism Reliable Lab Solutions 2009 p 407
211 Probstein RF Physicochemical hydrodynamics an introduction 2005 John Wiley amp Sons
212 Konermann L Monitoring reaction kinetics in solution by continuous-flow methods the effects of convection and molecular diffusion under laminar flow conditions Journal of Physical Chemistry A 1999 103(36) p 7210-7216
213 Konermann L et al Acid-induced denaturation of myoglobin studied by time-resolved electrospray ionization mass spectrometry Biochemistry 1997 36(21) p 6448-6454
214 Konermann L B Collings and D Douglas Cytochrome c folding kinetics studied by time-resolved electrospray ionization mass spectrometry Biochemistry 1997 36(18) p 5554-5559
215 Zechel DL et al Pre-steady state kinetic analysis of an enzymatic reaction monitored by time-resolved electrospray ionization mass spectrometry Biochemistry 1998 37(21) p 7664-7669
216 Zhou X R Medhekar and MD Toney A continuous-flow system for high-precision kinetics using small volumes Analytical Chemistry 2003 75(15) p 3681-3687
217 Jensen KF BJ Reizman and SG Newman Tools for chemical synthesis in microsystems Lab on a Chip 2014 14(17) p 3206-3212
227
218 Hartman RL JP McMullen and KF Jensen Deciding whether to go with the flow evaluating the merits of flow reactors for synthesis Angewandte Chemie International Edition 2011 50(33) p 7502-7519
219 Baxendale IR L Brocken and CJ Mallia Flow chemistry approaches directed at improving chemical synthesis Green Processing Synthesis 2013 2(3) p 211-230
220 Gutmann B D Cantillo and CO Kappe Continuous‐flow technologymdasha tool for the safe manufacturing of active pharmaceutical ingredients Angewandte Chemie International Edition 2015 54(23) p 6688-6728
221 Bedore MW et al Aminolysis of epoxides in a microreactor system a continuous flow approach to β-amino alcohols Organic Process Research amp Development 2010 14(2) p 432-440
222 Zaborenko N et al Kinetic and scale-up investigations of epoxide aminolysis in microreactors at high temperatures and pressures Organic Process Research amp Development 2011 15(1) p 131-139
223 Monteiro JL et al Continuous Flow Homolytic Aromatic Substitution with Electrophilic Radicals A Fast and Scalable Protocol for Trifluoromethylation Chemistry - A European Journal 2017 23(1) p 176-186
224 Nagaki A D Ichinari and J-i Yoshida Three-component coupling based on flash chemistry Carbolithiation of benzyne with functionalized aryllithiums followed by reactions with electrophiles Journal of the American Chemical Society 2014 136(35) p 12245-12248
225 Hone CA et al Rapid multistep kinetic model generation from transient flow data Reaction Chemistry amp Engineering 2017 2(2) p 103-108
226 Valera FE et al The Flowrsquos the Thinghellip Or Is It Assessing the Merits of Homogeneous Reactions in Flask and Flow Angewandte Chemie International Edition 2010 49(14) p 2478-2485
227 Moore JS and KF Jensen ldquoBatchrdquo kinetics in flow online IR analysis and continuous control Angewandte Chemie International Edition 2014 53(2) p 470-473
228 Haas CP et al Automated generation of photochemical reaction data by transient flow experiments coupled with online HPLC analysis Reaction Chemistry amp Engineering 2020
229 Schaber SD et al Design execution and analysis of time-varying experiments for model discrimination and parameter estimation in microreactors Organic Process Research amp Development 2014 18(11) p 1461-1467
230 Aroh KC and KF Jensen Efficient kinetic experiments in continuous flow microreactors Reaction Chemistry amp Engineering 2018 3(1) p 94-101
231 Gomez MV et al Determination of kinetic parameters within a single nonisothermal on-flow experiment by nanoliter NMR spectroscopy Analytical Chemistry 2015 87(20) p 10547-10555
232 Waldron C et al An autonomous microreactor platform for the rapid identification of kinetic models Reaction Chemistry amp Engineering 2019 4(9) p 1623-1636
233 Hone CA et al Definitive screening designs for multistep kinetic models in flow Reaction Chemistry amp Engineering 2019 4(9) p 1565-1570
228
234 Holmes N et al Online quantitative mass spectrometry for the rapid adaptive optimisation of automated flow reactors Reaction Chemistry amp Engineering 2016 1(1) p 96-100
235 Levenspiel O Chemical reaction engineering Industrial amp Engineering Chemistry Research 1999 38(11) p 4140-4143
236 McMullen JP and KF Jensen Rapid determination of reaction kinetics with an automated microfluidic system Organic Process Research amp Development 2011 15(2) p 398-407
237 Nagy KD et al Mixing and dispersion in small-scale flow systems Organic Process Research amp Development 2012 16(5) p 976-981
238 Afonso CA et al Comprehensive Organic Chemistry Experiments for the Laboratory Classroom 2016 Royal Society of Chemistry
239 Fluorochem 2019 27062019] Available from httpwwwfluorochemcoukProductsProductcode=303261
240 Ashworth IW et al Where has my acid gone Understanding the self-catalyzed esterification of maleic acid in methanol during salt formation Organic Process Research amp Development 2012 16(10) p 1646-1651
241 Gilbert JC EG McKinley and D-R Hou The nature of cyclopentyne from different precursors Tetrahedron 1997 53(29) p 9891-9902
242 Takaki K et al Intermolecular hydrophosphination of alkynes and related carbonminus carbon multiple bonds catalyzed by organoytterbiums The Journal of Organic Chemistry 2003 68(17) p 6554-6565
243 Berthelot DJ-C et al Heterocyclic amides as modulators of TRPA1 2013 Google Patents
244 Binch H et al Aminopyridine derivatives having aurora a selective inhibitory action 2013 Google Patents
245 Lood CS et al Synthesis of Chiral (Indol-2-yl) methanamines and Insight into the Stereochemistry Protecting Effects of the 9-Phenyl-9-fluorenyl Protecting Group European Journal of Organic Chemistry 2015 3793 p 3805
246 Poisson J-F A Orellana and AE Greene Stereocontrolled synthesis of (minus)-kainic acid from trans-4-hydroxy-L-proline The Journal of Organic Chemistry 2005 70(26) p 10860-10863
247 Lood C M Nieger and A Koskinen Enantiospecific gram scale synthesis of (S)-eleagnine Tetrahedron 2015 71(30) p 5019-5024
248 9-Bromo-9-phenylfluorene Sigma Aldrich Available from httpswwwsigmaaldrichcomcatalogproductaldrich368873 [27092020]
249 Tian Z and F Menard Synthesis of Kainoids and C4 Derivatives The Journal of Organic Chemistry 2018 83(11) p 6162-6170
250 9-Fluorenone Sigma Aldrich Available from httpswwwsigmaaldrichcomcatalogproductaldrichf1506 [27092020]

4
Table of Contents
Acknowledgements 2
Abstract 3
Table of Contents 4
List of Schemes 7
List of Figures 9
List of Tables 14
List of Abbreviations 17
Chapter 1 Introduction 19
11 Continuous flow chemistry 19
111 Batch and flow reactions 19
112 Reactions in flow 24
113 Reaction analysis 33
114 Continuous flow chemistry summary 40
12 Kinetic methodologies 40
121 Conventional methodologies 41
122 Visual kinetic analysis 49
123 Kinetic methodologies summary 56
13 Optimisation 56
131 Local algorithms 59
132 Global 63
133 Optimisation summary 68
14 Research aim 69
Chapter 2 Development of the computational approach to kinetic model determination 70
21 Introduction 70
22 Development of the approach 73
221 Kinetic model generation 74
222 Kinetic model fitting 79
223 Statistical analysis 85
224 Other considerations 86
225 Overview 87
23 Simulated verification of the approach 89
231 Case study Benzoic acid alkylation 90
232 Case study Nitrile hydrolysis 93
5
233 Case study SNAr kinetics 97
24 Conclusion 102
Chapter 3 Experimental applications of the computational approach to kinetic model and parameter determination 103
31 Introduction 103
32 Experimental setup 112
33 Case study Phenyl acetate 115
34 Case study Paracetamol 118
35 Case study Metoprolol 121
36 Conclusion 125
Chapter 4 The development of an improved computational approach to kinetic model determination 126
41 Introduction 126
42 Methodology advancement 127
421 Capabilities 127
422 Rules 131
423 Overview 136
43 Simulated verifications of the approach 138
431 Case study SNAr kinetics 138
432 Case study Pentyne kinetics 145
433 Case study Ytterbium catalysis 149
44 Conclusion 152
Chapter 5 Experimental applications of the new approach 153
51 Introduction 153
52 Case study SNAr kinetics 154
53 Case study PfBr 157
54 Case study Maleic acid 162
55 Conclusion 166
Chapter 6 Conclusion amp future work 167
Chapter 7 Appendix 168
71 Chapter 1 168
72 Chapter 2 168
721 Generated data set for case study benzoic acid alkylation 169
722 Generated data set for case study nitrile hydrolysis 170
723 Generated data set for the case study SNAr kinetics 171
73 Chapter 3 173
6
731 Phenyl acetate 173
732 Paracetamol 178
733 Metoprolol 187
74 Chapter 4 193
741 Generated data set for the case study SNAr kinetics 193
742 Generated data set for the case study Pentyne 195
743 Generated data set for the case study Ytterbium catalysis 197
75 Chapter 5 198
751 SNAr kinetics 198
752 PfBr 206
753 Maleic acid 211
76 Computational setup 214
761 Chapter 2 - 3 214
762 Chapter 4 - 5 214
Chapter 8 References 214
7
List of Schemes
Chapter 1
Scheme 11 The conversion of hexanol 11 to hexene 12 in a continuous flow setup[19]
21
Scheme 12 The flow synthesis of the adduct 15 via a Michael addition between the
dicarbonyl 13 and the alkyne 14[20] 22
Scheme 13 The multistep continuous flow synthesis of ibuprofen 18 23
Scheme 14 The temperature-accelerated SNAr reaction of 19 with 110 to form 111 in
THF (boiling point 66 degC) under flow conditions[51] 26
Scheme 15 The Fischer Indole synthesis of 114 from the hydrazine 112 and
dihydrofuran 113 in methanol (boiling point 65 degC) using a flow setup[52] 26
Scheme 16 The hydrogenation of isophorone 115 to TMCH 116[65] 27
Scheme 17 The [2 + 2] photocycloaddition of malemide 117 with 1-hexyne to produce
the cyclic product 118[74] 29
Scheme 18 An electrochemical facilitated nucleophilic substitution reaction to afford the
product 121[78] 29
Scheme 19 An enzyme catalysed continuous cyanohydrin formation forming 123[84] 30
Scheme 110 Multiple enzymatic catalysed continuous process to form UDP galactose
125[85] Individual enzymes stated 30
Scheme 111 The multi-step flow synthesis of 127 from coupling o-dibromobenzene 126
with varying electrophiles via sequential halogen-lithium exchange reactions[87] 31
Scheme 112 A multi-step flow synthesis of ibuprofen 18 involving an in-line purification
step[89] 33
Scheme 113 A reaction scheme showing the formation of benzyne 132 which was
followed by analysis via mass spectrometry[108] 35
Scheme 114 A reaction scheme showing the thermal isomerization of 133a to 133b
which was followed by analysis via HPLC[111] 36
Scheme 115 A reaction scheme showing a fluorination reaction yielding 136 which was
followed by analysis via in-line IR[112] 37
Scheme 116 The Grignard reaction that was tracked by on-line NMR[123] 38
Scheme 117 A Heck coupling of an aryl bromide 140 with 141 to form the adduct 142
This case study showed no indication of product inhibition or catalyst deactivation 50
Scheme 118 The epoxide opening of 143 to form 144 using a catalytic system This case
study indicates some product inhibition or catalyst deactivation 51
Scheme 119 A nickel-catalysed alkylation reaction of chalcone 145 with Et2Zn 146 to
form the adduct 147 53
Chapter 2
Scheme 21 An example esterification reaction 75
Scheme 22 The reaction of benzoic acid with iodomethane to form methyl benzoate
Modelled as a second order reaction 91
8
Scheme 23 The reaction of a nitrile with hydroxide to form the corresponding amide which
is susceptible to further hydrolysis to form the carboxylic acid Modelled as sequential
second order reactions 94
Scheme 24 The reaction of 24-dichloropyrimidine 210 with morpholine 211 to form the
4-substituted product 212 and the 2-substituted product 213 and the subsequent
bis-substituted product 214 98
Chapter 3
Scheme 31 The base catalysed Knoevenagel condensation between benzaldehyde and
ethyl cyanoacetate to form 34 109
Scheme 32 The Paal-Knorr reaction of 25-hexanedione 35 and ethanolamine 36 to
yield 37 to show how the kinetics of a process can be observed by using a controlled
ramp technique 111
Scheme 33 The reaction of phenol 38 with acetyl chloride 39 to form phenyl acetate
310 and hydrochloric acid 311 115
Scheme 34 The reaction of 4-aminophenol with acetic anhydride to form paracetamol in
step one followed by a further reaction with acetic anhydride to form diacetamate in
step two 118
Scheme 35 The reaction of the epoxide starting material with isopropylamine to form
metoprolol as well as the overreaction to form the bis-substituted product 122
Chapter 4
Scheme 41 The self-catalysed reaction of maleic acid 41 and methanol 42 to form the
mono-product 43 and the di-product 44[237] 132
Scheme 42 The reaction of 24-difluoronitrobenzene 45 with pyrrolidine 46 to form the
ortho-substituted product 47 and the para-substituted product 48 Consecutive
reactions then occur to form the bis-substituted product 49 In each reaction
hydrofluoric acid 410 is formed[222] 139
Scheme 43 The reaction of the starting material 411 with the spirodiene 412 to form
the product 413 and LiBr 414[238] 146
Scheme 44 The reaction of the starting material 415 with diphenylphosphine 416 in the
presence of the ytterbium catalyst 417 to form the product 418 where [Yb] Yb(η2-
Ph2CNPh)(hmpa)3[239] 149
Chapter 5
Scheme 51 The reaction of 246-trichloropyrimidine (SM) 51 with ethyl 4-
aminobutanoate 52 to form the major 2-substituted SNAr product 53 and the minor
4-substituted SNAr product 54 154
Scheme 52 The reaction of alanine methyl ester (Al-Me) 56 with PfBr 57 to form the
protected amino acid 58 Hydrobromic acid 59 is also generated as a side product
158
Scheme 53 The retrosynthetic methodology of the transformation of L-alanine to (S)-
eleagnine via the Pf-protected alanine methyl ester (Pf-Al-Me)[244] 158
Scheme 54 The synthetic route from cheap starting materials bromobenzene 510 and
fluorene 511 to the intermediate PfOH 512 and finally the desired PfBr material
58 159
9
Scheme 55 The reaction of maleic acid 513 and methanol 514 to form the mono-
product 515 and the di-product 516 163
List of Figures
Chapter 1
Figure 11 An annotated picture of an in-line liquid-liquid separator developed by Zaiput
Flow Technologies 33
Figure 12 The response surface showing temperature and residence time effects on the
thermal isomerisation of 133a[108] Reproduced with permission 36
Figure 13 An IR absorption showing the detailed rise of the C-F bond peak over time
indicating the extent of reaction completion[109] Reproduced with permission 37
Figure 1 4 The on-line NMR analysis in the aromatic region of the Grignard reaction
shown in Scheme 116 at different time intervals[120] Reproduced with permission 38
Figure 15 A graphical representation of generated time-series data for a first order
reaction shown in eqn 11 The data is log-transformed to give a linear fit where the
gradient is equal to the rate constant multiplied by -1 42
Figure 16 A graphical representation of generated time-series data for a zero order
reaction shown in eqn 11 This data does not need to be transformed as the linear fit
is equal to the rate constant multiplied by -1 43
Figure 17 A graphical representation of generated time-series data for a second order
reaction shown in eqn 11 This data is plotted as the reciprocal of the concentration
vs time and the gradient of the linear fit to this data is the rate constant 43
Figure 18 A graphical representation of generated time-series data for a second order
reaction shown in eqn 18 where [A] = [B] = This data is plotted as a log-
transformed concentration fraction vs time The gradient of the linear fit to this data is
the rate constant multiplied by the initial concentration of B minus the initial
concentration of A 45
Figure 19 A representation of Michaelis-Menten kinetics where the initial reaction rate of
individual experiments with differing substrate concentrations x is plotted This plot is
then used to determine the kinetic parameters Vmax and KM 48
Figure 110 A representation of the Lineweaver-Burk equation where the inverse of the
initial reaction rate of individual experiments with differing substrate concentrations x
is plotted This plot is then used to determine the kinetic parameters Vmax and KM 49
Figure 111 An overlay of two experimental datasets with the same lsquoexcessrsquo of reactant
concentration for the reaction shown in Scheme 117 This overlap indicates no
product inhibition or catalyst deactivation Reproduced with permission 51
Figure 112 As there is no overlay in the two experimental datasets with the same lsquoexcessrsquo
of reactant concentration in the reaction system shown in Scheme 118 this indicates
some product inhibition or catalyst deactivation A further experiment is necessary to
determine what is occurring Reproduced with permission 52
10
Figure 113 Graphical rate equations for the alkylation reaction shown in Scheme 119 a)
Standard graphical rate equation b) Using the RPKA methodology to observe any
overlap in the lsquodifferent excessrsquo reaction curves This overlap indicates that the
reaction order of Et2Zn is 1 Reproduced with permission 53
Figure 114 A time shift of the profiles of two reactions to observe overlaying plots This
allows the comparison of two profiles with the same starting material concentrations
but different product concentrations therefore identifying signs of product inhibition or
catalyst deactivation Reproduced with permission 54
Figure 115 A summary of the use of RPKA and VTNA a) catalyst deactivation or product
inhibition b) catalyst order c) reagent order d) catalyst deactivation or product
inhibition e) catalyst order f) reagent order Reproduced with permission 56
Figure 116 Some different classes of optimisation problem where variable n is an input
variable and the function evaluation is a measure of how the function is minimised
with the changing variable a) Linear optimisation problem b) Convex optimisation
problem c) Non-linear optimisation problem 59
Figure 117 A representation of a steepest-descent algorithm minimising a 2-dimensional
contoured parameter space where о indicates a measurement Where red areas are
function maxima and blue areas are function minima 60
Figure 118 A representation of a simplex optimisation for a 2-dimensional contoured
parameter space where the numbered vertices of each polyhedron indicate a
measurement Where red areas are function maxima and blue areas are function
minima 61
Figure 119 The different geometric transformations of the Nelder-Mead simplex inside
contraction (XIC) multiple contraction (MC) outside contraction (XOC) reflection (XR)
and expansion (XE) 62
Figure 120 A 1-dimensional optimisation using an interior-point method The approximate
objective function is minimised for the starting trust region t0 63
Figure 121 A 1-dimensional optimisation using an interior-point method The approximate
objective function is minimised for the sequential trust regions until the overall function
is minimised The path that the algorithm can take can be described as the algorithm
path or the central path towards the optimum 63
Figure 122 A depiction of the flow of a simple genetic algorithm 64
Figure 123 A depiction of one iteration of a simple genetic algorithm Figure adapted from
works reported by Boyd amp Vandenberghe[155] 65
Figure 124 The Bayesian optimisation of f(x) where (i) - (viii) represent the sequential
iterations of the minimisation The acquisition function is shown in red measurements
are shown as red dots and the current estimated surrogate model is shown in blue
with its corresponding 95 confidence interval The maximum of the acquisition
function indicates the next measurement to be taken 67
Figure 125 A graphical method to solving ILP problems where C1 - 4 indicate the linear
constraints the green area indicates the feasible region f shows the objective
function red dots represent the integer values of the inputs and P1 and P2 indicate
two feasible potential maxima to the problem Figure adapted from works reported by
Boyd amp Vandenberghe[155] 68
Chapter 2
11
Figure 21 The Mass Matrix inputted into the approach assigning mass to each of the
species 75
Figure 22 The stoichiometric matrices for the reaction model shown in Scheme 21 as
well as the overall stoichiometry matrix S 76
Figure 23 The ILP optimisation identifying a feasible solution to the objective function
hence identifying a mass-balance-allowed reaction Where X1 = A X2 = B X3 = C X4
= D 76
Figure 24 A visual representation of all of the possible reaction models when given five
mass-balance-allowed sample reactions each shown as a different coloured block
When i = 1 each reaction is in itself a model and when i gt 1 each reaction behaves
as a model fragment These fragments when combined in different ways provide full
and unique reaction models each of which are to be assessed for their validity with
respect to experimental data 78
Figure 25 A schematic summarising how the model generation stage of the approach
progresses Where the participating species are inputted and sorted ODE functions
that describe all possible mass-balance-allowed reactions are outputted 79
Figure 26 The iterations of an optimisation algorithm with respect to the convergence of
simulated ODEs with sample data - this occurs via the minimisation of the SSE
output 81
Figure 27 An outline of the stages of the computational approach 88
Figure 28 An example showing the generation of a simulated data set from the literature
a) An ODE is simulated for a particular model with a set of kinetic parameters in this
case A rarr B where mdash = A mdash = B b) Particular time points are taken from this ODE
to represent individual measurements where x = A x = B c) Up to 5 relative
random error is added to these measurements to more closely resemble real
experimental data 90
Figure 29 The fit of the identified model and kinetic parameters to the generated
experimental data with starting concentrations of 01 M benzoic acid and 011 M
iodomethane Where x = benzoic acid x = iodomethane x = methyl benzoate mdash =
benzoic acid (ODE) mdash = iodomethane (ODE) mdash = methyl benzoate (ODE) 93
Figure 210 The fit of the identified model and kinetic parameters to the generated
experimental data with starting concentrations of 1 M nitrile and 2 M hydroxide at 90
degC Where x = nitrile x = amide x = carboxylic acid mdash = nitrile (ODE) mdash = amide
(ODE) mdash = carboxylic acid (ODE) 97
Figure 211 The fit of the identified model and kinetic parameters to the generated
experimental data with starting concentrations of 1 M 24-dichloropyrimidine and 22
M morpholine at 90 degC Where x = 24-dichloropyrimidine x = 4-substituted product x
= 2-substituted product x = bis-substituted product mdash = 24-dichloropyrimidine
(ODE) mdash = 4-substituted product (ODE) mdash = 2-substituted product (ODE) mdash = bis-
substituted product Graph is only shown to 260 minutes to show curvature of the
initial data points 102
Chapter 3
Figure 31 A diagram to show the direction and flows within a flow regime where a)
laminar flow b) turbulent flow 104
12
Figure 32 A plug flow reactor model where there is perfect mixing in the radial direction
but no forward or backward mixing in the axial direction Plugs 1 and 2 are examples
of the infinitely short plugs existing within this reactor model 105
Figure 33 A depiction of how a kinetic experiment can be run utilising a step change in
flow rates between two steady-states (I and II) allowing time-series data to be plotted
from transient data Figure adapted from Mozharov et al[93] 107
Figure 34 A kinetic profile generated from the Knoevenagel condensation shown in
Scheme 31 where kinetic information was obtained by measuring conversation at
given residence times at steady-state at two temperatures Steady-state markers x
are shown as part of the lsquoA Modelrsquo Reproduced with permission 109
Figure 35 A kinetic profile generated from the Knoevenagel condensation shown in
Scheme 31 where kinetic information was obtained using a flow rate step-change at
two temperatures Steady-state markers x are shown as part of the lsquoA Modelrsquo where
step-change markers o are shown as part of the lsquoB Modelrsquo Reproduced with
permission 110
Figure 36 A depiction of how a continuous flow reactor may be described as a series of
sequential pseudo-batch reactors where the colour represents the extent of
conversion from low (green) to high (red) Q represents the total flow rate ti
represents the initial time of each pseudo-batch reactor entering the reactor tf
represents the final time tm is the time at which the concentration is actually
measured by the IR probe Reproduced with permission 110
Figure 37 A combination of the kinetic models for the reaction yielding 37 in Scheme 32
where the differing colours represent different values of S where S is a corrective
residence time multiplier to show the reproducibility of the controlled flow ramp
methodology S = 14 (blue) S = 13 (red) S = 12 (green) S= 23 (orange) steady-
state experiments = x Reproduced with permission 111
Figure 38 A photograph of the automated continuous flow reactor used for this work 113
Figure 39 A mathematically correct representation of how linear gradient flow ramps can
be utilised to sample with a high data density on the initial curvature of the kinetic plot
Where diams = data point Tn = experiment temperature Q = total flow rate Time = time
the reaction has been running τ = residence time that the reaction mixture
experiences 114
Figure 310 Kinetic profiles for two flow ramp experiments at 65 degC and 75 degC where x =
phenol x = phenyl acetate mdash = phenol (ODE) mdash = phenyl acetate (ODE) 117
Figure 311 Graphs showing the agreement between steady-state and flow ramp
measurements for the reaction of phenol with acetyl chloride where curves are fitted
to the steady-state data Where = phenol (steady-state) x = phenol (flow ramp) =
phenyl acetate (steady-state) x = phenyl acetate (flow ramp) 118
Figure 312 Kinetic profiles for four flow ramp experiments at 30 degC 60 degC 160 degC and 180
degC where x = 4-aminophenol x = paracetamol x = diacetamate mdash = 4-aminophenol
(ODE) mdash = paracetamol (ODE) mdash = diacetamate (ODE) See Chapter 732 for full
experimental conditions and raw data 120
Figure 313 Kinetic profiles for the flow ramp experiments at 130 degC 150 degC 190 degC and
210 degC where x = starting material x = Metoprolol x = bis-substituted product mdash =
starting material (ODE) mdash = Metoprolol (ODE) mdash = bis-substituted product (ODE)
See Chapter 733 for full experimental conditions and raw data 123
13
Chapter 4
Figure 41 An illustration of how the lsquoinflationrsquo step takes all mass-balance-allowed
transformations sequentially then deduces all allowed integer and non-integer orders
and generates corresponding rate laws for these transformations If catalytic reactions
are to be explored also rate laws for these catalytic dependencies are also
generated These transformations are all then saved from which full reaction models
can be constructed 130
Figure 42 An overview of the updated computational approach to kinetic model and
parameter determination 137
Figure 43 The fit of the identified model and kinetic parameters to the generated
experimental data with starting concentrations of 12 M 24-difluoronitrobenzene and 3
M pyrrolidine at 30 degC Where x = 24-difluoronitrobenzene x = ortho-substituted
product x = para-substituted product x = bis-substituted product mdash = 24-
difluoronitrobenzene (ODE) mdash = ortho-substituted product (ODE) mdash = para-
substituted product (ODE) mdash = bis-substituted product Plot only shown to 500
minutes to the show curvature of the initial data points 145
Figure 44 The fit of the identified model and kinetic parameters to the generated
experimental data with starting concentrations of 1 M starting material and 08 M
spirodiene at -78 degC Where x = starting material x = spirodiene x = product mdash =
starting material (ODE) mdash = spirodiene (ODE) mdash = product (ODE) 149
Figure 45 The fit of the identified model and kinetic parameters to the generated
experimental data with starting concentrations of 15 M starting material 2 M
diphenylphosphine and 01 M ytterbium catalyst at 22 degC Where x = starting
material x = diphenylphosphine x = product mdash = starting material (ODE) mdash =
diphenylphosphine (ODE) mdash = product (ODE) 152
Chapter 5
Figure 51 The distinctive proton peaks shown in red that are monitored via NMR as time
progresses in the SNAr case study 155
Figure 52 Kinetic profiles for four kinetic experiments at -25 degC 0 degC 25 degC and 50 degC
where = starting material = 2-substituted product = 4-substituted product mdash =
starting material (ODE) mdash = 2-substituted product (ODE) mdash = 4-substituted product
(ODE) See Chapter 751 for full experimental conditions and raw data 156
Figure 53 The batch setup for experimentation in the PfBr case study where the
temperature probe is submerged in the reaction medium that is heated via a heater
stirrer 160
Figure 54 Kinetic profiles for three kinetic experiments at 30 degC 35 degC and 40 degC where
red plots indicate PfBr concentrations and blue plots indicate Pf-Al-Me concentrations
At 30 degC = experimental data mdash = ODE At 35 degC = experimental data - - - =
ODE At 40 degC = experimental data = ODE See Chapter 752 for full
experimental conditions and raw data 161
Figure 55 Kinetic profiles for two kinetic experiments at 50 degC with the initial concentration
of maleic acid at 04 M and 08 M At 04 M = maleic acid mdash = maleic acid (ODE)
= mono-product mdash = mono-product (ODE) = di-product mdash = di-product (ODE)
At 08 M = maleic acid - - - = maleic acid (ODE) = mono-product - - - = mono-
product (ODE) = di-product - - - = di-product (ODE) See Chapter 753 for full
experimental conditions and raw data 165
14
Chapter 73
Figure 731 The flow reactor setup for the phenyl acetate case study experiments 174
Figure 732 An example HPLC chromatogram in the phenyl acetate case study at 254 nm
175
Figure 733 The reactor setup for the paracetamol flow ramp experiment at 30 degC 179
Figure 734 The reactor setup for the paracetamol flow ramp experiment at 60 degC 180
Figure 735 The reactor setup for the paracetamol flow ramp experiment at 160 degC 180
Figure 736 The reactor setup for the paracetamol flow ramp experiment at 180 degC 180
Figure 737 An example HPLC chromatogram from the paracetamol case study showing
the separation of all reaction components at 254 nm 181
Figure 738 A photograph of the automated flow system at AstraZeneca 188
Figure 739 The reactor setup for the metoprolol flow ramp experiments at 190210 degC in
Leeds 189
Figure 7310 The reactor setup for the metoprolol flow ramp experiments at 130150 degC at
AstraZeneca 190
Figure 7311 An example HPLC chromatogram during a kinetic experiment in the
metoprolol case study at 220 nm 190
Chapter 75
Figure 751 The dedicated NMR spectrometer used for kinetic experiments in the SNAr
kinetics case study 199
Figure 752 lsquoStackedrsquo NMR spectrum showing several NMR spectra over time in the 25 degC
experiment 200
Figure 753 A 13C NMR confirming the presence of the PfBr material compared to
literature values to identify the material[246] 207
Figure 754 IR analysis of the PfBr material showing the absence of a hydroxy peak from
any residual PfOH 208
Figure 755 HPLC analysis of the PfBr material at 254 nm indicating that a pure product is
present 208
Figure 756 An example HPLC chromatogram at 230 nm during a kinetic experiment in the
PfBr case study 210
Figure 757 An example NMR spectrum from the maleic acid case study 212
List of Tables
Chapter 1
Table 11 A table summarising reaction analysis techniques in flow systems adapted from
Houben and Lapkin[121] 39
Chapter 2
15
Table 21 A table showing the optimised k values for the identified models in the benzoic
acid alkylation case study alongside each modelrsquos SSE and AICC 92
Table 22 A table showing the top three ranked models for the nitrile hydrolysis case study
The kinetic parameters for each reaction within the model is shown as well as the
SSE and AICC evaluation 95
Table 23 A table showing the top three ranked models for the SNAr case study The kinetic
parameters for each reaction within the model is shown as well as the SSE and AICC
evaluation 100
Chapter 3
Table 31 Evaluation of the feasibility of each reaction model for the phenyl acetate study
116
Table 32 Evaluation of the feasibility of each reaction model for the paracetamol study 120
Table 33 Evaluation of the feasibility of each reaction model for the metoprolol study 124
Chapter 4
Table 41 A table showing examples of allowed and disallowed models according to Rule
4 134
Table 42 A table showing the top five ranked models for the SNAr case study as identified
by the old approach The kinetic parameters for each reaction within the model are
shown as well as the SSE and AICC evaluation 142
Table 43 A table showing the top five ranked models for the SNAr case study as identified
by the new approach The kinetic parameters for each reaction within the model are
shown as well as the SSE and AICC evaluation α denotes a variable molar
dependence within the kinetic parameter units depending on the rate law 143
Table 44 A table showing the top five ranked models for the pentyne case study as
identified by the new approach The kinetic parameters for each reaction within the
model are shown as well as the SSE and AICC evaluation α denotes a variable molar
dependence within the kinetic parameter units depending on the rate law 147
Table 45 A table showing the top five ranked models for the ytterbium catalysis case study
as identified by the new approach The kinetic parameters for each reaction within the
model are shown as well as the SSE and AICC evaluation α denotes a variable molar
dependence within the kinetic parameter units depending on the rate law 150
Chapter 5
Table 51 Evaluation of the feasibility of each reaction model for the SNAr case study
where α is variable for each model depending on the overall model order 156
Table 52 Evaluation of the feasibility of each reaction model for the PfBr case study where
α is variable for each model depending on the overall model order 161
Table 53 Evaluation of the feasibility of each reaction model for the maleic acid case
study where α is variable for each model depending on the overall model order 165
16
17
List of Abbreviations
A Pre-exponential factor
Ac Acetyl
AIC Akaikes information criterion
AICC Corrected Akaikes information criterion
API Active pharmaceutical ingredient
Aq Aqueous
Bn Benzyl
bp Boiling point
Bu Butyl
cm Centimetre
CSTR Continuous stirred tank reactor
CRN Chemical reaction network
DCM Dichloromethane
Ea Activation energy
Equiv Equivalents
Et Ethyl
g Gram
GA Genetic algorithm
GC Gas chromatography
h Hour
HPLC High performance liquid chromatography
Hz Hertz
ID Inner diameter
ILP Integer linear programming
IR Infrared
k Rate constant
K Kelvin
kref Reference rate constant
18
L Litre
m Metre
M Molar
Me Methyl
MILP Mixed integer linear programming
min Minute
mL Millilitre
MM Mass matrix
mmol Millimole
mol Mole
MS Mass spectrometry
NMR Nuclear magnetic resonance
OD Outer diameter
ODE Ordinary differential equation
PFR Plug flow reactor
Ph Phenyl
R Ideal gas constant
Re Reynolds number
S Stoichiometry
SNAr Nucleophilic aromatic substitution
SSE Sum of squared error
T Temperature
TFA Target factor analysis
tR Residence time
Tref Reference temperature
tRes Residence time
V Volume
19
Chapter 1 Introduction
The main aim of this project is to develop and advance methodologies for
kinetic model determination and parameter estimation The acquisition of the
experimental data necessary for these studies is flexible and can be obtained by
any means However given the numerous advantages of continuous flow
chemistry and the availability of a flow chemistry platform many chemistries
were performed using this regime For this reason continuous flow chemistry is
broadly covered in this introduction as well as a comprehensive look at methods
of obtaining kinetic data in Chapter 31
Current methodologies of obtaining kinetic information are herein broadly
covered and critically analysed However in-depth discussions about the
relevant literature to the kinetic methodologies developed during this project are
highlighted in Chapter 21 Furthermore as these kinetic methodologies feature
significant use of optimisation algorithms discussions regarding optimisation
problems and common algorithms are also found in this introductory chapter
This coverage depicts the general relevancy of different types of algorithm to
particular circumstances with specific kinetic fitting algorithm discussions
featured in Chapter 2222
11 Continuous flow chemistry
Continuous flow chemistry is rapidly becoming the optimum way to conduct
a wide variety of different chemical reactions This section introduces the concept
of flow chemistry featuring a discussion of the advantages and disadvantages
as well as when to adopt this methodology This broad introduction also covers
different reports from the literature pertaining to different classes of reaction in
flow as well as how these reactions can be analysed and optimised either on-
line or off-line
111 Batch and flow reactions
To discuss flow chemistry it is first important to understand the
differences between this methodology and traditional batch chemistry Batch
reactions are still the lsquonormalrsquo bench practice today after being standardised 200
years ago in the time of Friedrich Wӧhler as there are still advantages to
20
conducting synthesis this way This batch reaction approach to synthesis
whereby the chemistry is conducted essentially in a vessel is historically the
most fruitful and rewarding approach in terms of discoveries Suzuki couplings[1]
Sonogashira couplings[2] and the Wittig reaction[3] among hundreds of other
ground breaking mechanisms were all discovered via batch reactions A flow
chemistry regime differs in that there is no bulk reaction medium in a vessel By
using pumps tubing and differing flow reactors small volumes of reaction
medium are constantly flowing and reacting to provide a continuous outlet stream
of reacted material Although this flow methodology has been known for a
relatively long time the historic uptake in synthetic laboratories has been low[4]
However as flow technology improves and becomes easier to adopt in the
laboratory[5] it is increasingly important to evaluate whether a particular chemical
process would be most efficient in batch or flow regimes in terms of product
output or otherwise
For example when considering exploratory synthesis in contrast to batch
using flow chemistry consisting of tubing and microreactors to attempt to
discover new syntheses by exploring discrete options is not typically a good
application[6 7] This is because the main strengths of flow processes come
mainly from already existing reaction pathways where optimising product output
is the focus and to construct a flow system to conduct a purely exploratory
reaction is a traditionally inefficient use of time whereas batch can be
implemented much faster In recent years however high throughput flow
systems have been developed for automated discovery[8 9] Unfortunately
though as the equipment for this type of discovery is specialist and can be
expensive it can still be argued that simple exploratory benchtop batch reactions
are still much more efficient in terms of time and cost
There are other general instances where batch is often still favourable for
chemical transformations for example when precipitation drives reaction
completion[7] In batch this isnrsquot an issue however when using a flow setup this
will frequently result in channel mixer or pressure regulator clogging - this is also
true when using high viscous liquids[10] As a general rule precipitation
suspensions and other instances where solids are used can lead to
complications in the process - this can be mitigated through reaction dilution but
may then suffer from low productivity The introduction however of standardised
21
laboratory equipment (such as miniaturised CSTRs Freactors) for continuous
flow can then facilitate such multiphase processes to allow maintained
efficiency[11 12]
Despite some of these limitations there are significant benefits to
continuous flow processes which have become apparent alongside the
tremendous practical advances in recent years many of which have been
utilised in actually transferring batch processes into flow as more and more
batch procedures are superseded[13-15] Reduction of reaction times[16 17] and
increases in conversion and selectivity may be observed by transferring to flow
processes[18] This may be for a number of reasons but is likely due to the
increased mass transfer that can be expected from flow systems as well as the
ability to increase the temperature of the reaction medium further past the boiling
point of the solvent which is discussed further in Chapter 1121 This will lead
to an overall increase in both the reaction rate and productivity Two examples
are shown herein where increased conversion was observed Scheme 11
reports the synthesis of hexene from hexanol in flow by Wilson and McCreedy[19]
with a conversion of around 90 whereas in conventional batch reactors this
reaction conversion does not exceed 60 Most notably there was no
degradation of the performance after three days of continuous use which may
be expected from a fixed bed catalyst Scheme 12 shows another direct
comparison of conversion in flow and batch by Wiles et al[20] where the Michael
addition is completed in 20 minutes with 100 conversion in flow compared to
the reaction completion in 24 hours with 89 conversion in batch
Scheme 11 The conversion of hexanol 11 to hexene 12 in a continuous flow setup[19]
22
Scheme 12 The flow synthesis of the adduct 15 via a Michael addition between the
dicarbonyl 13 and the alkyne 14[20]
A main advantage to using flow chemistry setups to perform reactions
arises from the equipment featured within the setups themselves - namely the
pumps Pump flow rates can be set to very precise flows which can very
accurately deliver particular ratios of reagents at given points along the flow
setup[21-23] This ensures that the correct stoichiometry of the reagents is present
in the reaction and these exact stoichiometries can be delivered continuously
and with minimal error[21 24] This allows for optimisation and kinetics studies with
precise reagent additions that would otherwise be troublesome for an
experimenter to consistently and dependably deliver These same flow rates also
ensure that the residence time is exact and consistent meaning sampling points
are reliably accurate in sampling the reaction medium after a specific reaction
time[25 26] This point however is highly dependent on the mixing regime present
which is discussed further in Chapter 31
Another noteworthy advantage to flow processes is that a large number
of reactions can be executed and hence a large amount of data can be obtained
using only minimal quantities of a reagent in flow This is because much less
reagent is required for reaction and subsequent on-line analysis in a microreactor
compared to bench scale batch setups This is a particularly desirable attribute
of a system if you have an expensive material or a material that is synthesised
by a time consuming process where you need to be conservative with its use
but still obtain lots of experimental data[24]
One example of a reaction that has been successfully transferred from
batch to flow is a multi-step synthesis of ibuprofen 18 conducted by Bogdan et
al[27] This synthesis demonstrates that even flow processes with multiple steps
can be achieved without intermediate purification steps in a streamlined and
efficient manner This is provided as long as care in the reaction chronology has
been undertaken ensuring excess reagents and byproducts from previous steps
are compatible with downstream processes shown in Scheme 13 This
efficiency is important when creating complex molecules because although the
stepwise batch reactor processes are effective they are also very wasteful
particularly when they involve consecutive work-up procedures An example of
this is in the pharmaceutical industry where in general 25 - 100 kg of waste is
23
produced for every 1 kg of complex molecule[28] However to facilitate reaction
compatibility expensive or atom-inefficient transformations may be necessary
such as the use of phenyl-iodine(III) diacetate and TMOF to incur a chemical
rearrangement in the reported ibuprofen synthesis below This may require a
careful balance to achieve green metrics in product manufacturing Further
discussion on reaction telescoping is provided in Chapter 1126
Scheme 13 The multistep continuous flow synthesis of ibuprofen 18
In large scale batch reactor design used in industry the most significant
problems to be overcome are the heating and agitation of the system and it has
even been reported that processes cannot be scaled up further due to
temperature and mixing gradients[29] This problem relates to the fact that it is
difficult to effectively heat and agitate a large mass completely uniformly which
can lead to different reactivities present at different points within the vessel - this
can result in decreased product yield due to an increased rate of side reactions
or more seriously a runaway reaction when exothermic processes are
involved[30 31]
By contrast mesoscale flow systems (channel diameter 1 - 10 mm) and
in particular miniaturised flow reactors (channel diameter 50 - 1000 microm) are
excellent at efficiently heating and mixing reactants[32] Rapid heating of reaction
microchannels through the walls of a preheated reactor ensures the reaction
mixture is thoroughly and uniformly heated and mixed which is attributed to the
24
large surface area to volume ratios of the microchannels[18 33] This heating can
be achieved by oil baths conventional ovens or even microwave heating all of
which achieve the same goal which is precise temperature control with
increased safety[34-36] The high molecular diffusion across the relatively narrow
microchannels allows assumptions of perfect cross-sectional mixing in a lsquoplug
flowrsquo regime[37] (see Chapter 31) and mass transfer can further be improved
through the use of static mixers[38] or CSTRs[39]
This increased safety in flow reactors is attributed to only a small amount
of reaction material present in the reactor at any one time enclosed within a
tubular vessel Therefore although the chemical exposure is the same during
reservoir preparation the experimenter is not exposed to any harmful material
during experimentation as long as all inlets and waste streams are properly
contained The is advantageous especially in processes where there are highly
exothermic steps alongside even the possibility of scale-up of formerly non-
scalable reactions[36 40] This scalability can be achieved simply by running one
flow reactor for a long period of time or several identical flow reactors in parallel
in a process called lsquonumberingrsquo - any number of flow reactors can be lsquonumbered
uprsquo to achieve the required throughput[41-43]
112 Reactions in flow
Alongside the aforementioned general advantages that flow processes
have over batch there are several distinct reaction niches which have specific
facets whereby translation to flow has distinct benefits There are many different
areas where continuous processes have helped to transform research as well
as industrial processes that may branch from them This literature review will
focus only on the most common types of reaction in flow in which most reactions
are likely to encompassed Also refer to flow chemistry reviews on polymer
chemistry[44] the use of extreme temperature[45] and slurry reactors[46]
1121 Temperature-accelerated reactions
Temperature-accelerated reactions are the most basic and most common
use of flow setups whereby reactants are fed into a heated microreactor to
perform a chemical transformation The use of flow enables access to higher
temperatures in a system with excellent safety which means that reactions can
be performed which would otherwise be too slow or unobtainable in other
25
systems Temperature-accelerated reactions in a traditional batch setup are
often limited by the laboratory equipment and the boiling point of the solvent and
having to switch to different higher-boiling solvents can lead to complications in
both the reaction and the purification[47 48] High-pressure batch vessels can be
used to facilitate these higher temperature reactions (such as Parr reactors or
autoclaves)[49] but additional equipment and safety considerations must be
made in these cases
However in flow setups there is no need to give significant consideration
to changing the solvent as the boiling of the solvent can be suppressed in most
cases by the use of a back-pressure regulator[50] Therefore when conducting
these reactions where higher temperatures can be accessed in flow setups the
reaction rates are also generally higher[14] This alongside the aforementioned
increased associated safety in using flow setups can make flow a desirable and
convenient option for temperature-accelerated reactions Scheme 14 and
Scheme 15 show examples of temperature-accelerated reactions that have
been conducted in flow where in both cases the temperature of the reaction was
conducted at a higher temperature than the boiling point of the solvent leading
to decreased reaction times [51 52] It is also worth noting that unless explicitly
stated a back pressure regulator will have been used in all schemes in this
literature review if the temperature of the reaction exceeds the boiling point of
the solvent used
26
Scheme 14 The temperature-accelerated SNAr reaction of 19 with 110 to form 111 in THF
(boiling point 66 degC) under flow conditions[51]
Scheme 15 The Fischer Indole synthesis of 114 from the hydrazine 112 and dihydrofuran
113 in methanol (boiling point 65 degC) using a flow setup[52]
1122 Supercritical fluid
The use of supercritical fluids (SCFs) as solvents in flow processes have
attracted attention in the past 30 years mainly motivated by the prospect of
replacing toxic industrial solvents[53] For example the environmental interest of
using supercritical CO2 or H2O ushers in opportunities for greener chemical
processes by replacing some of the more harmful solvent systems[54-56] This is
an admirable objective for process chemists and can lead to cleaner and more
sustainable reactions[57]
Whilst the green aspects of using SCFs are attractive perhaps the
greatest quality they possess are their physiochemical ldquohybridrdquo properties an
intermediary between liquids and gases whereby properties can be finely tuned
by marginal variations in temperature and pressure As a result SCFs exhibit
gas-like viscosities as well as no surface tension which are objectively
advantageous in processes involving interface and surface chemistry[58-60]
Furthermore the liquid-like densities allow for substantial dissolution of
precursors within the SCF and diffusion coefficients are generally at least 100
times greater in SCFs than in liquids All of these factors contribute towards
processes whereby the reaction conversion is significantly improved as a direct
effect of using SCFs[53 61-63] However the compatibility of these supercritical
solvents must still be tested with the process of interest (as with any solvent) as
there may be solubility or reactivity issues
27
Supercritical CO2 (scCO2) is a common solvent in the realm of SCFs
because of its easily obtained critical parameters at bench scale it is also
extracted easily with high purity as a byproduct from many processes as well as
being non-toxic and non-flammable[64] One of the most notable industrial scale
applications using scCO2 is the hydrogenation of isophorone 115 shown in
Scheme 16 which obtains 116 in a sufficiently pure state without any
downstream purification[65] Another common process developed from the use of
scCO2 by taking advantage of the non-toxicity of the solvent is the
decaffeination of coffee beans which has since become one of the most popular
decaffeination methods[66 67]
Scheme 16 The hydrogenation of isophorone 115 to TMCH 116[65]
One major problem with using scCO2 in flow processes however is its
incompatibility with primary and secondary amines due to carbamate formation
which can precipitate out of solution and therefore block any microchannels in
the system[68] Other supercritical solvents can be used in these cases such as
scNH3 although this presents a problem in itself that it cannot be used with
aqueous solutions because of ammonium hydroxide formation - nonetheless
supercritical ethane and propane have been used as direct replacements for
scCO2 due to similar critical parameters[69]
Using continuous reactors for SCFs have the advantage over batch
reactors that they do not require depressurisation to add further material to the
process or recover products Also a predominant advantage to using continuous
reactors is that reaction parameters such as temperature flow rate and pressure
can all be changed almost independently of each other In context this ability
allows the properties of the SCF to be altered in real time when optimising
reactions which cannot be done easily in batch reactors - this versatility of
continuous reactors makes it the favourable choice when working with SCFs[70]
1123 Photochemical reactions
28
The use of photons at given wavelengths to provide sufficient energy to
overcome activation energy barriers is the basis of photochemical reactions
complex molecular structures can be achieved via these unique reaction
pathways that are otherwise unobtainable via thermochemical or electrochemical
methods[71 72] Implementing photochemical reactions is also beneficial as a
photon is a ldquogreenrdquo reagent which is traceless and thus doesnrsquot require
removalrecycling in the same way many other reagents do
Photochemistry is not regarded only as a unique and novel pathway to
molecules with exotic structures however - one example of where
photochemistry is used extensively in industry is in the Toray process to attain
caprolactam which is used to manufacture Nylon 6[73] Photochemical reactions
have also been found to benefit from continuous flow systems where large-scale
photochemical synthesis is significantly more effective when compared to their
corresponding batch approaches[74] This is due to problems regarding
penetration into the bulk reaction medium which is an important boundary that
has to be overcome Most of the photochemical synthesis occurs within a short
radius of the lamp meaning the reaction conversion is scale dependant The
small tubular diameters in flow systems take advantage of this by exposing the
entire reaction medium to the light source as it passes through the reactor[75]
One example where a photochemical reaction has been implemented into
a flow process is reported in the continuous [2 + 2] photocycloaddition producing
the cyclic product 118 shown in Scheme 17 [74] In this reaction the conversion
is quoted at 83 and because the reaction conversion is scale independent the
continuous process can be run indefinitely to produce over 500 g per 24 hour
period This process can then be scaled up further as in any continuous flow
process by numbering up
29
Scheme 17 The [2 + 2] photocycloaddition of malemide 117 with 1-hexyne to produce the
cyclic product 118[74]
1124 Electrochemical reactions
Electrochemistry is another clean and efficient reaction method in the
realm of organic synthesis where the electricity supplied to the reaction system
induces the formation of the reactive intermediates from neutral substrates This
method of reaction has significant advantages to conventional batch processes
one of which being that harmful oxidising and reducing agents can be substituted
using electrochemistry By applying precisely controlled current between two
electrodes reactions can be achieved by using milder reagents This method
allows milder reagents as electrons can be addedremoved without the need for
chemical reducingoxidising agents which could complicate the reaction
especially in flow systems where downstream processes can be highly affected
by excess chemical reagents[76] Also as the electrons are the ldquoreagentrdquo in these
reactions as well as being widely and readily available electrochemical reaction
pathways become cheaper and less labour-intensive as alternative costly
reagents donrsquot need to be used[77]
One example of where electrochemical synthesis in flow has been
observed is in the anodic substitution reaction by Horii et al [78] shown in scheme
18 with yields of up to 74 In flow processes such as this the laminar flow
regime is used as an advantage - two inlets of separate flows join together in the
reaction vessel where their respective microchannel sidewalls are anodic and
cathodic opposite to one another This ensures the dominant oxidation of the
substrate 119 to form a cationic intermediate whilst the nucleophile 120
diffuses across the tubular diameter to react to afford 121 [79] Laminar flow and
other mixing regimes are discussed further in Chapter 31
Scheme 18 An electrochemical facilitated nucleophilic substitution reaction to afford the
product 121[78]
1125 Enzymatic reactions
30
Biocatalytic processes are also an area in which research is continuously
progressing in order to develop alternative process routes to the synthesis of fine
chemicals The main issues however arise from enzymes only being able to
operate efficiently in narrow pH and temperature ranges with many organic
substrates having poor solubility in water However implementation of enzymes
whilst using non-aqueous solvents can dramatically improve their applicability[80
81] Within biochemical processes this niche can be important in achieving
reaction optimisation despite given limitations with using biocatalysts
The use of immobilised active enzymes in the column of a flow system is
very attractive and there are many reports in the literature of applied
processes[82 83] An example of this is the continuous process of chiral
cyanohydrin formation shown in Scheme 19 where a column is packed with
defatted almond meal[84] There are also examples where multiple columns with
different immobilised enzymes are used as a multistep continuous process in
order to reach the desired product - one example is reported where 7 separate
columns with differing enzymes achieve the synthesis of UDP-galactose from
inexpensive starting materials[85] This is shown in Scheme 110 as a simplified
one column synthesis with multiple enzymes This also shows how
advantageous immobilised biocatalysis can be in multistep synthesis as there
are no catalysts or harmful reagents that can affect downstream processes
Scheme 19 An enzyme catalysed continuous cyanohydrin formation forming 123[84]
Scheme 110 Multiple enzymatic catalysed continuous process to form UDP galactose
125[85] Individual enzymes stated
1126 Telescoped reactions
31
When considering a total synthesis for a pharmaceutical ingredient or
otherwise it would be ideal to limit the number of steps and hence the amount
of waste time and resources This can be achieved in one way by reaction
telescoping[24] Reaction telescoping is essentially performing multiple chemical
transformations to a molecule sequentially without the need for the purification
of intermediates or removal of waste for example the lsquoone-potrsquo synthesis of
pyridine and quinoline derivatives in batch reported by Kobayashi et al[86]
There are further advantages however to reaction telescoping in flow
that are not observed in batch Using a flow system allows the introduction of
reagents in exact stoichiometries at specific points in the reaction cycle simply
by addition via inlets further down the line within the system Pairing these
additions with differing fixed-temperature reaction vessels also allow for isolated
reaction optimisation for each step along the flow setup in a multi-step synthesis
An example of a multi-step reaction where the success of the synthesis is
attributed to the effective residence time and temperature control of each step is
shown in Scheme 111 in the synthesis of 127[87]
Scheme 111 The multi-step flow synthesis of 127 from coupling o-dibromobenzene 126
with varying electrophiles via sequential halogen-lithium exchange reactions[87]
The main drawback of reaction telescoping is that downstream
transformations have to be compatible with side products and waste from
upstream reactions as any incompatibility leads to a lesser conversion of any
intermediates This serves as a hindrance to the other transformations down the
line hence leading to poor conversion for the overall process Therefore when
considering reaction telescoping great care must be taken into account for
reagent compatibility and reaction chronology
A further advantage to using a flow system however is the opportunity of
in-line purification which can solve reagent compatibility issues - this gives
32
greater accessibility to a variety of different reactions that can all be
accomplished in a single process This in-line purification is made possible by an
in-line liquid-liquid separator such as the separator reported by Zaiput Flow
Technologies that allows immiscible liquids to be separated into two streams
one organic and one aqueous via filtration using a hydrophobic membrane[88]
This separator is shown in Figure 11 An example where a membrane
separation has been used shown in Scheme 112 is in an ibuprofen multi-step
synthesis where Snead and Jamison improved on previous work aforementioned
by Bogdan et al[27 89] This in-line separation avoided the need for triflic acid and
increased the yield to 98 by incorporating this aspect within the process
Flow in
Two separated flows out
33
Figure 11 An annotated picture of an in-line liquid-liquid separator developed by Zaiput Flow
Technologies
Scheme 112 A multi-step flow synthesis of ibuprofen 18 involving an in-line purification
step[89]
There are also several other methods of in-line purification that can be
considered alongside or instead of liquid-liquid separation Gas-liquid
separation[90] micro-distillation[91] solid-supported scavenging[50] and gravity-
based separation[92] have all been reported in the literature but have not be
covered in detail as these methods are not well established
113 Reaction analysis
Reaction analysis in benchtop batch processes are relatively time-
consuming and labour-intensive as samples must often be removed by hand
from the reaction mixture to determine reagent conversion product composition
etc Therefore the elimination of these practices and adoption of their respective
flow processes has many potential cost benefits particularly in fine chemical and
pharmaceutical production[93]
On the other hand for these same methods of analysis the sampling
process can be fully automated by the use of sampling valves A sample valve
34
is a device attached to the line of a flow system where the reaction mixture
passes through undisturbed as if it was an extension of the tubing however there
is a lsquoswitchingrsquo mechanism whereby the flow is diverged from its path into a
separate flow system instantaneously then the original flow is restored
milliseconds later This diverted flow then leads to an analytical system (HPLC
mass spectrometer etc) and has much thinner tubing with a constant mobile
phase flowing ready to carry the injected sample to the analytical equipment
This sampling is termed lsquoon-linersquo as the flow is rerouted from the flow along the
reactor lsquoIn-linersquo therefore refers to sampling without the need to divert reaction
material and is typically non-destructive In all cases great care must be taken
in calibrating the machine to chemistries of interest as quantitative analysis can
often only be performed by calibrating the response of the equipment to known
standard concentrations of each chemical species
This section will report on reaction analysis in flow by the use of well-
established and common techniques such as mass spectrometry and high-
performance liquid chromatography (HPLC) as well as fast developing and high
interest areas such as NMR and IR In each case the system is assumed to be
at lsquosteady-statersquo in which the flow output is consistent - this is explained in detail
in Chapter 31 Also refer to specific papers covering onin-line analysis by UV[94
95] Raman[96] fluorescence[97] GC[98 99] XAFS[100] and NIR[101-103]
1131 Mass spectrometry
The use of mass spectrometry in reaction analysis is a common technique
and when coupled with flow systems on-line mass analysis can be employed to
qualitatively and quantitatively monitor reactions for the identification of products
and intermediates as well as analysis of relative composition[104-106] All of this
can be performed in real-time due to the short method times and is ideal in the
context of reaction monitoring as lots of information can be gained from the mass
spectrometer with little need for data manipulation[107]
An example where mass spectrometry has been used for on-line analysis
in order to monitor reactive intermediates in flow is in the formation of benzyne
132 shown in Scheme 113[108] This experiment was conducted to show how
mass spectrometers are ideally suited to on-line analysis applications although
35
they are rarely used in this way as traditional mass spectrometry instruments are
too large and bulky to be conveniently coupled to flow systems
Scheme 113 A reaction scheme showing the formation of benzyne 132 which was followed
by analysis via mass spectrometry[108]
1132 HPLC
HPLC can also give very good qualitative and quantitative analysis of a
reaction mixture - however the advantage that HPLC has over mass
spectrometry is that it is typically easier to quantify the individual components of
a mixture[109] This is a particularly useful characteristic for modelling the kinetics
of a reaction as the relative abundancies of products from a reaction can be
measured precisely by their peak areas in the chromatograph at different
times[110] as well the ability to differentiate molecules with the same mass and
even different isomers of the same mass
An example where the kinetics of a reaction were studied using the coupling
of a flow system with on-line HPLC is in the thermal isomerization of the endo
molecule 133a to its exo counterpart 133b shown in Scheme 114[111] This
example shows how combining on-line HPLC with an automated flow system
with varying pump flow rates and temperature can lead to an understanding of
the factors influencing yield and purity of a process with the ability to provide
useful data to be utilised for generating response surfaces shown in Figure 12
36
Scheme 114 A reaction scheme showing the thermal isomerization of 133a to 133b which
was followed by analysis via HPLC[111]
Figure 12 The response surface showing temperature and residence time effects on the
thermal isomerisation of 133a[111] Reproduced with permission
1133 IR
The use of in-line IR analysis in flow systems is different as it is not
quantitative in the same respect as mass spectrometry or HPLC IR rather
detects the relative abundancies of particular species by monitoring individual
peak signals The advantage to in-line IR is that key identifiable peaks from
functional groups in an IR spectrum (O-H bonds C=O bonds etc) can be
tracked over time as disappearance or appearance of peaks can serve as an
indicator of reaction completion[112-114] IR analysis is fundamentally non-
destructive which in the context of a flow system means that in-line IR analysis
has been developed and integrated into systems which do not require samples
to be removed from the flow a truly continuous non-interrupted stream but still
continuously analysed by IR[115-117]
An example of where in-line IR analysis has been used to monitor the
completion of a reaction is in the fluorination reaction to yield 136 shown in
Scheme 115[112] The in-line probe brand used was the ReactIR In this reaction
the region where C-F bonds are expected to absorb was monitored during the
reaction in order to establish a reaction completion trend based on the intensity
of the peak produced - this is shown in Figure 13
37
Scheme 115 A reaction scheme showing a fluorination reaction yielding 136 which was
followed by analysis via in-line IR[112]
Figure 13 An IR absorption showing the detailed rise of the C-F bond peak over time
indicating the extent of reaction completion[112] Reproduced with permission
1134 NMR
The use of on-line NMR is also a good quantitative option for flow system
analytics The potential to incorporate high resolution NMR systems into a flow
system to show both structural and conformational changes in chemical
transformations is a desirable potential analytical technique At current generally
only small low-field systems have been developed to be conveniently coupled
with flow systems However this technique thus far has led to the increased
value of using NMR spectroscopy as a non-invasive method as more process
development applications are available[118] Although there are some reports of
using high resolution on-line NMR[119 120] most cases generally utilise low field
NMR systems The low resolution analytical technique is unlike traditional NMR
analysis in a high resolution system (gt 300 MHz) as low-field systems tend to
38
analyse the relaxation times and relaxation weighted signals to identify product
[121]
The main downside to this technique is that as the resolution is often too
low for accurate interpretation of NMR spectra because of small differences in
chemical shifts therefore it is difficult to use for multi-component reaction
analysis[122] However there are examples where this technique has been useful
In a report by Goldbach et al[123] low field on-line NMR was used to monitor the
reagent and product concentrations of the Grignard reaction shown in Scheme
116 This reaction conversion was monitored by peak areas in the aromatic
region over time shown in Figure 14 where over 90 conversion was reported
by the examination of peak appearance and disappearance
Scheme 116 The Grignard reaction that was tracked by on-line NMR[123]
Figure 1 4 The on-line NMR analysis in the aromatic region of the Grignard reaction shown in
Scheme 116 at different time intervals[123] Reproduced with permission
1135 Summary
There is no best method of flow reaction analysis as each individual case
would benefit from an independent examination of the necessary results to be
generated This is because different reactions and outcomes would be more
suited to different analytical systems A table summarising these main analytical
methods as well as other methods with their respective sensitivities acquisition
speeds and limitations are shown in Table 11[124]
39
Table 11 A table summarising reaction analysis techniques in flow systems adapted from
Houben and Lapkin[124]
Technique Type of
information
Sensitivity
mol
Typical
speed of
acquisition
s
Limitations
Mid-IR
Chemical
identity
concentration
~10-1 ~1
Steps have to be
taken to tolerate
water within the
system
Near-IR
Chemical
identity
concentration
~10-1 ~1 Less information
than Mid-IR
Raman
Chemical
identity
concentration
crystal structure
~10-1 ~1-100
Fluorescence
masking Raman
signal
UV-vis
Chemical
identity
concentration
~10-4 lt1 Limited number of
species
NMR
Molecular
structure
concentration
~10-3 ~10
Flow method is
currently limited in
sensitivity and
resolution
GC Concentration ~10-6 10-1500
Typically slow
cannot identify
unknown compounds
HPLC Concentration ~10-6 200-1500
Long method times
must be combined
with mass spec for
proof of molecular
identity
Mass spec
Chemical
identity
concentration
~10-8 ~5-20
Requires
chemoinformatics
expertise
40
114 Continuous flow chemistry summary
Flow chemistry is a powerful methodology that can be employed to obtain
enhanced reaction control over similar batch processes increased heat and
mass transfer accurate residence times and precise continuous addition of
reagents These advantages alongside automated sampling procedures mean
that this regime is an ideal methodology for generating time-series data for the
purposes of this project As kinetic studies benefit from this additional control as
well as further hardware-manipulation techniques discussed in Chapter 31 that
are not possible in batch continuous flow will be used when possible However
not all of the identified niches of flow will be exploited for this project such as
SCF usage electrochemistry etc and have been covered as a holistic overview
of the field
Flow chemistry is not the answer to every case study and itrsquos likely that
there will be instances where chemistry is better suited to batch conditions
however Each chemistry must be evaluated to see if the study would more
appropriate for a flow or a batch regime For totally homogenous systems or for
very fast reactions it is likely that a flow system would be used for the generation
of kinetic data For experimental case studies that require sampling of a
suspension in a reaction medium it is likely that a batch system would be more
appropriate In any case the availability of an automated flow system is very
useful (Chapter 32) and unlocks powerful reaction control that can be difficult to
obtain in batch but batch systems must be employed if the chemistry requires it
12 Kinetic methodologies
The kinetic methodologies applied in this project are computational which
utilise ordinary differential equations (ODEs) to describe kinetic models as well
as optimisation algorithms to maximise the convergence of these ODE curves to
the experimental data - this is described in detail in Chapter 222 This differs
from traditional analytical techniques used more generally in chemistry as well
as specific applied methods in determining reaction order described herein
These methods although useful are difficult to scale as they require user input
and at times qualitative analysis which are not suitable for automatic kinetic
information determination Furthermore these methods may struggle with
41
complex reaction systems or systems with loss of mass balance For these
reasons these methods are covered to describe common kinetic analysis
techniques but are not utilised in this project
121 Conventional methodologies
There are several conventional but considered outdated methodologies
to determining kinetic information that are still employed The most basic
analytical solutions for simple reactions can still be powerful in identifying
reaction order and rate constants[125 126] Consider the first order reaction of
species A reacting to form species B shown in eqn 11 The change in the
concentration of A as time progresses can be described as a differential
equation eqn 12 which can then be integrated to give the integrated rate
equation eqn 13 This integrated rate equation can then be used to determine
the concentration of A at any reaction time and a plot of ln[A] vs time allows the
determination of the rate constant as shown in Figure 15 This method also
allows qualitative confirmation of the reaction order as the experimental data
points should fit to a linear line
Where
bull A = starting material
bull B = product
bull k = rate constant
bull [A] = concentration of A
bull t = time
bull [A]t = concentration of A at time t
bull [A]0 = initial concentration of A at t = 0
119860119896rarr119861 eqn 11
119889[119860]
119889119905= minus119896[119860] eqn 12
ln[119860]119905 = minus119896119905 + ln[119860]0 eqn 13
42
Figure 15 A graphical representation of generated time-series data for a first order reaction
shown in eqn 11 The data is log-transformed to give a linear fit where the gradient is
equal to the rate constant multiplied by -1
If the plot of ln[A] vs time does not produce a linear fit then it is likely that
the reaction order is not 1 with respect to A and may be zero order second order
or even another non-integer order To deduce if the reaction is zero order the
reaction can still be viewed as eqn 11 but the rate of change of A must be
described differently as the zero order reaction is not dependant on the
concentration of A at any time Therefore this differential equation can be
described as eqn 14 which can then be integrated to give the integrated rate
equation eqn 15 A simple plot of [A] vs time deduces if the reaction is zero
order as a linear fit indicates this where the rate constant can also be identified
as shown in Figure 16
119889[119860]
119889119905= minus119896 eqn 14
[119860]119905 = minus119896119905 + [119860]0 eqn 15
43
Figure 16 A graphical representation of generated time-series data for a zero order reaction
shown in eqn 11 This data does not need to be transformed as the linear fit is equal to
the rate constant multiplied by -1
If the reaction is second order with respect to A the rate of change of A
must be described as in eqn 16 which when integrated gives the integrated
rate equation shown in eqn 17 A plot of 1[A] vs time then allows the chemist
to deduce that the reaction is second order if a linear fit is obtained The gradient
of this linear fit can then be ascribed as the rate constant as shown in Figure
17
Figure 17 A graphical representation of generated time-series data for a second order
reaction shown in eqn 11 This data is plotted as the reciprocal of the concentration vs
time and the gradient of the linear fit to this data is the rate constant
If the reaction is more complex and features bimolecular reactions of
different species such as the reaction shown in eqn 18 then there are two
possible scenarios that may be considered to determine the rate constant and
confirm the reaction order The first scenario is where the initial concentrations
of species A and species B are the same In this case the rate of change of A
can be written as eqn 19 However at any time [A] = [B] meaning that the
scenario mimics the second order reaction illustrated in eqn 16 and kinetic
information can be identified by using the corresponding aforementioned
methodology
119889[119860]
119889119905= minus119896[119860]2 eqn 16
1
[119860]119905
= 119896119905 +1
[119860]0
eqn 17
44
The second possible scenario is where the initial concentrations of A and
B are not equal In this case it is useful to define a term x where this relates to
the concentration of each of the species that have reacted at a particular time t
The expression of the rate law then becomes eqn 110 which can be rearranged
to eqn 111
If eqn 111 is then integrated between time zero and t the time of interest
Then integrating by using the method of partial fractions eqn 112 becomes
Substituting [A] for [A]0 - x and [B] for [B]0 - x eqn 113 simplifies to
Therefore resulting in the overall integrated rate equation
Which can be rearranged to obtain
This obtained integrated rate equation shown as eqn 116 can then be
used to determine the rate constant A plot of ln[119861][119860]0
[119860][119861]0 vs time confirms a first
order dependence on both species in the bimolecular reaction if a linear fit is
119860 + 119861 119896rarr 119862 eqn 18
119889[119860]
119889119905= minus119896[119860][119861] = minus119896[119860]2 eqn 19
minus119889119909
119889119905= minus119896([119860]0 minus 119909)([119861]0 minus 119909) eqn 110
119889119909
([119860]0 minus 119909)([119861]0 minus 119909)= 119896 119889119905 eqn 111
int119889119909
([119860]0 minus 119909)([119861]0 minus 119909)
119909
0
= 119896 int 119889119905119905
0
eqn 112
int119889119909
([119860]0 minus 119909)([119861]0 minus 119909)
119909
0
=1
[119861]0 minus [119860]0(ln
[119860]0[119860]0 minus 119909
minus ln[119861]0
[119861]0 minus 119909) eqn 113
int119889119909
([119860]0 minus 119909)([119861]0 minus 119909)
119909
0
=1
[119861]0 minus [119860]0(ln[119861][119860]0[119860][119861]0
) eqn 114
1
[119861]0 minus [119860]0(ln[119861][119860]0[119860][119861]0
) = 119896119905 eqn 115
ln[119861][119860]0[119860][119861]0
= 119896([119861]0 minus [119860]0)119905 eqn 116
45
observed as shown in Figure 18 where the gradient can be used to calculate
the rate constant If a bimolecular reaction is known to occur but this graphing
indicates curvature then itrsquos possible that one or more of the species may have
a reaction order not equal to one Under these circumstances other techniques
must be used to confirm reaction order such as computational approaches to
fitting differential equations which is further described in Chapter 222
Figure 18 A graphical representation of generated time-series data for a second order
reaction shown in eqn 18 where [A] = [B] = This data is plotted as a log-
transformed concentration fraction vs time The gradient of the linear fit to this data is the
rate constant multiplied by the initial concentration of B minus the initial concentration of
A
For kinetic studies involving either biological (enzymatic) or chemical
catalysts the reaction system can still be described by elementary reaction steps
and their respective differential equations If we look at one of the simplest
catalytic systems where an enzyme E binds with a substrate S This is a
reversible binding step where the forward reaction step is k1 and the backward
reaction step is k-1 in which the enzyme-substrate complex ES is formed This
complex can then react to form the product P as well as regenerating the
enzyme catalyst E This reaction is shown in eqn 117 and as before the
differential equations with respect to each of these species are described in eqn
118 - 121
119864 + 119878 1198961119896minus1
119864119878 1198962rarr 119864 + 119875 eqn 117
119889[119878]
119889119905= minus1198961[119864][119878] + 119896minus1[119864119878] eqn 118
46
However although this system can be described in this way it is more
commonly described as approximated models as simple assumptions can
derive a model known as Michaelis-Menten kinetics[127 128] This provides a more
simplistic method of catalytic modelling and prediction by relating the catalyst
concentration to the rate enhancement of a reaction in a different way Michaelis-
Menten kinetics employ the steady-state approximation with respect to the
enzyme-substrate complex ES This means that it is assumed that this complex
will rapidly approach a state where it is generated at the same rate that is
consumed This means that the overall rate of change as described in eqn 122
is zero - this allows a new relationship to be derived between the enzyme
substrate and complex as shown in eqn 123
In order to describe the system as an overall equation relating to the rate
of the reaction we must be able to determine the rate of product formation
shown in eqn 120 However as it is unknown what the free enzyme
concentration is at any point after the reaction has progressed it is more
appropriate to describe the free enzyme E as the total concentration of all
enzyme ET minus the complex concentration [E] = [ET] - [ES] This substitution
into the steady-state approximation derived equation eqn 123 allows the
complex concentration to be described by other concentrations
Followed by expansion
Then rearrangement and factorisation
119889[119864]
119889119905= minus1198961[119864][119878] + 119896minus1[119864119878] + 1198962[119864119878] eqn 119
119889[119875]
119889119905= 1198962[119864119878] eqn 120
119889[119864119878]
119889119905= 1198961[119864][119878] minus 119896minus1[119864119878] minus 1198962[119864119878] eqn 121
119889[119864119878]
119889119905= 1198961[119864][119878] minus (119896minus1 + 1198962)[119864119878] = 0 eqn 122
1198961[119864][119878] = (119896minus1 + 1198962)[119864119878] eqn 123
1198961([119864119879] minus [119864119878])[119878] = (119896minus1 + 1198962)[119864119878] eqn 124
1198961[119864119879][119878] minus 1198961[119864119878][119878] = (119896minus1 + 1198962)[119864119878] eqn 125
47
Then a final rearrangement allows the overall relationship to be described as
Therefore substitution of this relationship into the product formation step in eqn
120 where v is the rate of the reaction relates the overall rate with only the total
enzyme concentration substrate concentration and kinetic rate constants
shown as eqn 129
To now arrive at the familiar form of the Michaelis-Menten equation final
substitutions are made for Vmax and KM shown in eqn 130 producing the overall
equation shown in eqn 131
These terms used in the Michaelis-Menten equation Vmax and KM are
different indicators to what are typically found in other areas of kinetics Vmax
relates to the maximum velocity of the reaction which is independent of substrate
concentration KM is a ratio measure of the breakdown of the enzyme-substrate
complex with relation to the its corresponding formation Different enzymes have
different KM values and can be affected by a range of conditions such as pH and
temperature This equation and other variations when the reaction model differs
(such as enzyme catalysed bimolecular reactions) are commonly used when
studying catalytic kinetics to predict how a system will behave upon changing
concentrations
This model is also useful as the apparent reaction order of the system can
be easily described When the concentration of substrate [S] is very low in
comparison to KM this means that the substrate concentration is deemed to be
1198961[119864119879][119878] = (119896minus1 + 1198962)[119864119878] + 1198961[119864119878][119878] eqn 126
1198961[119864119879][119878] = [119864119878]((119896minus1 + 1198962) + 1198961[119878]) eqn 127
[119864119878] =1198961[119864119879][119878]
(119896minus1 + 1198962) + 1198961[119878]=
[119864119879][119878]
(119896minus1 + 11989621198961
) + [119878]
eqn 128
119907 = 1198962[119864119878] =1198962[119864119879][119878]
(119896minus1 + 11989621198961
) + [119878]
eqn 129
119881119898119886119909 = 1198962[119864119879] 119870119872 =119896minus1 + 11989621198961
eqn 130
119907 =119881119898119886119909[119878]
119870119872 + [119878] eqn 131
48
negligible leading to a direct proportionality between the rate and [S] This
means the reaction appropriates first order kinetics as shown in eqn 132 When
[S] is very large in comparison to KM this means that KM is deemed to be
negligible meaning that the equation cancels any occurrence of [S] leading to
overall zero order kinetics This is shown in eqn 133
Vmax and KM can be determined experimentally by measuring the initial
rates of reaction at varying substrate concentrations After these rates are
determined the graph of reaction rate vs substrate concentration can be plotted
where Vmax is the reaction rate that the curve tends to KM is found via plotting
the relationship of reaction rate to substrate concentration indicated by a curve
whereby KM is equal to the substrate concentration (x axis) when the reaction
rate is half of Vmax (y axis) The experimental determination of these constants is
shown in Figure 19
Figure 19 A representation of Michaelis-Menten kinetics where the initial reaction rate of
individual experiments with differing substrate concentrations x is plotted This plot is
then used to determine the kinetic parameters Vmax and KM
Further development in these Michaelis-Menten kinetic plots then
linearised and simplified this technique leading to a simpler interpretation of the
kinetics as well as easier adoption in determining kinetic parameters This form
of the Michaelis-Menten equation known as the Lineweaver-Burk equation
shown in eqn 134 is simply the double-reciprocal form of eqn 131[129] This
119907 =119881119898119886119909[119878]
119870119872 eqn 132
119907 = 119881119898119886119909 eqn 133
49
allows less complex plotting methods to determine Vmax and KM as shown in
Figure 110
Figure 110 A representation of the Lineweaver-Burk equation where the inverse of the initial
reaction rate of individual experiments with differing substrate concentrations x is
plotted This plot is then used to determine the kinetic parameters Vmax and KM
122 Visual kinetic analysis
In order to identify catalytic reaction behaviour and the order of the
species in these processes different methodologies with the theme of visual
qualitative analysis were developed to allow many scientists to easily extract
kinetic information from their reactions Although the root of these analyses are
still highly mathematical visual kinetic analyses depend on the subjective
analysis of the scientist Therefore precise kinetic parameters cannot be
elucidated however the plots required are simple to construct and easy to
interpret allowing easy determination of the order of the catalystreagents or of
product inhibitioncatalyst deactivation[130]
Reaction progress kinetic analysis (RPKA) employs a checklist to visually
determine this kinetic information efficiently with very few reactions[131] These
reactions which feature in situ measurements are combined with mathematical
manipulations to construct graphical rate equations where kinetic information can
be identified This methodology comprises three different analyses for three sets
of experiments These experiments identify product inhibitioncatalyst
deactivation the order in the catalyst and the order in any of the other
components of the reaction
50
For a product inhibitioncatalyst deactivation probing study curves of
reaction rate vs substrate concentration are compared for reactions that are
started at different points - one with higher concentrations (reaction 1) and one
with lower (reaction 2) This means that although the initial starting material
concentrations are different both reactions at some point will have the same
concentration of all of the starting materials as the other reaction This is true as
long as both experiments have the same difference in the concentration of
reactants referred to as lsquosame excessrsquo experiments Consequently at these
points in the reaction where there are the same concentrations of starting
materials the reaction with the greater initial concentrations (reaction 1) will have
a greater concentration of product as well as a greater number of catalytic
turnovers This means that there are two sets of experimental data where the
reaction profiles should overlay to indicate the lack of product inhibition and
catalyst deactivation A case study where there was shown to be no indication of
inhibitiondeactivation is shown in Scheme 117 and Figure 111[132]
Scheme 117 A Heck coupling of an aryl bromide 140 with 141 to form the adduct 142
This case study showed no indication of product inhibition or catalyst deactivation
51
Figure 111 An overlay of two experimental datasets with the same lsquoexcessrsquo of reactant
concentration for the reaction shown in Scheme 117 This overlap indicates no product
inhibition or catalyst deactivation Reproduced with permission
If these curves donrsquot overlay it can be inferred that product inhibition or
catalyst deactivation is occurring An example of this is shown in Scheme 118
and Figure 112[133] To discern between these two possibilities a third
experiment is required where there is more product added This experiment
should feature the same initial concentrations as the experiment initiated at lower
concentrations (reaction 2) but the reaction should also feature the same
product concentration as generated by the other reaction until this point This
results in two reactions that are identical in stoichiometric composition but vary
in the number of turnovers completed by the catalyst Therefore overlay of these
two reaction profiles indicate product inhibition whilst no overlay indicates
catalyst deactivation
Scheme 118 The epoxide opening of 143 to form 144 using a catalytic system This case
study indicates some product inhibition or catalyst deactivation
52
Figure 112 As there is no overlay in the two experimental datasets with the same lsquoexcessrsquo of
reactant concentration in the reaction system shown in Scheme 118 this indicates
some product inhibition or catalyst deactivation A further experiment is necessary to
determine what is occurring Reproduced with permission
To then use RPKA to elucidate the order in catalyst the datasets of
different reactions run with different catalyst concentrations are plotted as
rate[cat]γ vs substrate concentration The value of γ is changed until all of the
curves overlay - this value is then the correct order in the catalyst Similarly for
determining the order in a given reactant ldquoBrdquo the datasets of lsquodifferent excessrsquo
reactions are obtained ie where all concentrations are constant apart from the
specific substrate of interest in this case reactant B The profiles are plotted as
rate[B]β vs [A] and the value of β is altered until the curves overlay This value
of β then indicates the correct order for reactant B A reported example of an
alkylation reaction shown in Scheme 119 was analysed in this manner to
determine the order with respect to Et2Zn 146 by performing lsquodifferent excessrsquo
experiments as shown in Figure 113a This data was then plotted using this
methodology in Figure 113b to confirm the reaction order of this species to be
1[131]
53
Scheme 119 A nickel-catalysed alkylation reaction of chalcone 145 with Et2Zn 146 to form
the adduct 147
Figure 113 Graphical rate equations for the alkylation reaction shown in Scheme 119 a)
Standard graphical rate equation b) Using the RPKA methodology to observe any
overlap in the lsquodifferent excessrsquo reaction curves This overlap indicates that the reaction
order of Et2Zn is 1 Reproduced with permission
Another form of visual kinetic analysis Variable Time Normalisation
Analysis (VTNA) has also been reported to determine this same information by
utilising exclusively concentration-time reaction profiles[134 135] This technique
may be preferential to RPKA as this data is typically more readily available from
54
the use of almost any reaction monitoring technique when compared to the data
handling necessary to extract rate information
To identify product inhibition or catalyst deactivation the reaction profiles
of two or more reactions are examined where the reactions have different
starting concentrations - these datasets are both plotted together The profile of
the reaction with the lower initial concentration of starting materials is then shifted
on the time axis until the first data point overlaps with the second (higher initial
concentrations of starting materials) reaction profile If there is an overlay of the
two concentration profiles at this point this suggests that there is no product
inhibition or catalyst deactivation present in the system This procedure is
highlighted in Figure 114[130] However a lack of overlay indicates that one of
these scenarios is present and a third experiment must be conducted to
determine the cause of this lack of overlay This third experiment must contain
added product in the same way as previously mentioned for the RPKA
methodology where an overlay of this new curve with existing data indicates
product inhibition and the converse outcome indicates catalyst deactivation
Figure 114 A time shift of the profiles of two reactions to observe overlaying plots This allows
the comparison of two profiles with the same starting material concentrations but
different product concentrations therefore identifying signs of product inhibition or
catalyst deactivation Reproduced with permission
To then elucidate the order in any of the species present two reactions or
more are run with different initial concentrations of this species S but with the
same initial concentrations of all other species The time scale of these reactions
are then replaced with Σ[S]γΔt - this expression is shown in eqn 134[136 137] A
plot of concentration of S vs Σ[S]γΔt is then graphed where the value of γ that
produces an overlay of the reaction profiles is the order in species S in a similar
55
manner to RPKA plotting methods This plotting method can be used for
identifying both the order in catalysts and reactants in a chemical system
Where
bull n = number of experiments
bull i = current experiment
bull γ = order of reaction
bull t = time of measurement
These visual kinetic analysis methods may be used in different
circumstances for the simple determination of reactantcatalyst orders as well
as to identify any occurrences of product inhibition or catalyst deactivation
Where reaction rate information is available RPKA may be used and where
concentration-time data is available VTNA can be used There are many
applications reported by academic and industrial research groups in a wide
range of catalytic reactions using both RPKA[138-140] and VTNA[141-143] Figure
115 shows a summary of the analysis of these techniques with the information
that each technique provides given the particular experimental protocol[130]
sum([119878]119894 + [119878]119894minus1
2)
120574
(119905119894 minus 119905119894minus1)
119899
119894=1
eqn 134
56
Figure 115 A summary of the use of RPKA and VTNA a) catalyst deactivation or product
inhibition b) catalyst order c) reagent order d) catalyst deactivation or product
inhibition e) catalyst order f) reagent order Reproduced with permission
123 Kinetic methodologies summary
Herein reported are several methodologies to determine kinetic
information all of which have become convention to varying degrees and
adopted by many experts and non-experts alike It is because of the large
adoption of these techniques that is why these particular methods have been
covered in this introduction although the usage of them within the context of this
project will be minimal There are many other more complex methodologies
peripheral to this project that although are very powerful in particular
circumstances are not widely adopted by research groups For this reason the
concepts of these methodologies are not introduced but for further reading there
are reports to be found on model-based design of experiments (mbDoE)[144-146]
hybrid modelling[147] and soft modelling[148-150] as well as other more niche
techniques that can be found in the literature[151-153]
These introduced methodologies are unlikely to be used in the context of
this project as many require qualitative assessments or data manipulation by a
user that is difficult to automate Furthermore the analysis of complex reaction
models may become more and more difficult with increasing model terms
meaning that precise kinetic parameters may also be more difficult to determine
These factors produce tough challenges in the context of the main aims of the
project (described further in Chapter 14) as the identification of kinetic models
and parameters cannot be scaled effectively or automated Therefore other
procedures are utilised in answering the challenge of creating a fully autonomous
kinetic model and parameter determination methodology which are introduced
in detail in Chapter 22
13 Optimisation
When searching for the optimum solution(s) to a particular optimisation
problem the best approach in gaining the most amount of information possible
would be to simply measure the response of the optimisation function at every
combination of input parameters at infinitesimally small variations This would
give a complete and perfect insight into the impact of the input parameters on
57
the response meaning that it would be easy for a user to even qualitatively
identify the optimum However as function evaluations can be expensive
(computationally and otherwise) performing this resource- and time-intensive
optimisation is not feasible[154 155] Approximations of this approach can be
performed in some circumstances by applying grid search methodology[156] but
for many applications the number of function evaluations necessary to explore
such a large number of parameter combinations means that this approach is not
viable Due to the fixed-space exploration of these approaches parameter
estimations may also be imprecise
For both efficient and accurate determination of optimum parameter inputs
for a given function it is often appropriate to use an optimisation algorithm These
algorithms heavily vary in their approaches to identifying optimised outputs but
a major criteria that they attempt to fulfil is to obtain this information in an efficient
manner - specifically saving computational time and memory The choice of
algorithm can then depend on the nature of the problem specifically the type of
optimisation (local or global) as well as the nature of the optimisation problem
An algorithm can still generally achieve optimality in many circumstances
however specific algorithms have been found to perform more efficiently in
different situations [157]
Many algorithms can be broadly described as either a local or a global
optimiser Local optimisers are fast can handle large-scale problems and are
widely applicable to many scenarios For this reason they are employed
extensively in a variety of circumstances However in local optimisation the
compromise is to accept that the identified optimum may only be locally optimal
which does not guarantee a result that is globally optimal ie a better function
evaluation than all other feasible points[158] These optimisers also require a
starting point which is a critical difference between local and global optimisers
as this can affect the objective value of the local solution that is found
In global optimisation by contrast the true global optimum of the system is
found The compromise however is often efficiency Global optimisation
algorithms are commonly used where the computational cost of the function
evaluations is not critical This is because the number of function evaluations is
traditionally very high which can also lead to very large computational times[158]
Therefore the choice to use a global optimisation algorithm may be made in
58
circumstances where the value of certifying the true global optimum outweighs
the computational cost to arrive at this identification Careful considerations must
therefore be made in selecting the optimal algorithm based on what is desired in
each scenario
The nature of the optimisation problem itself can also be a large factor in
the choice of algorithm used as some algorithms can identify optima more
efficiently based on the type of problem present[159] Some common optimisation
problems are highlighted in Figure 116 Specific classes of algorithms can then
be utilised in different scenarios Some classes of these algorithms include
linear programming (LP)[160] mixed integer linear programming (MILP)[161]
nonlinear programming (NLP)[162] convex programming (CP)[163] quadratic
programming (QP)[164] and more[158] These algorithm classes can then also be
further separated into discrete and continuous algorithms then further still in
many ways
59
Figure 116 Some different classes of optimisation problem where variable n is an input
variable and the function evaluation is a measure of how the function is minimised with
the changing variable a) Linear optimisation problem b) Convex optimisation problem
c) Non-linear optimisation problem
As it is beyond the scope of this project to compare and discuss classes of
optimisation algorithms classifications are made only on their localglobal
nature Commonly utilised local and global algorithms are qualitatively reported
with reference to further reading for mathematical proofs As this project also
involves heavy use of specific optimisation algorithms (in a black box manner)
those utilised are also introduced qualitatively
131 Local algorithms
Many local optimisation algorithms typically iterate towards an optimum
by using gradients in the response or approximating the local response surface
around the measurements One of the most intuitive and simplest form of
gradient-based algorithm is the steepest descent algorithm that iterates by
performing measurements along the trajectory of lsquosteepest-descentrsquo towards the
minimum[165] An example steepest-descent representation is shown in Figure
117 Shown are two variables on the x and y axes respectively X1 and X2 where
the blue contoured area represents a minimum in the response and the red area
represents a maximum in the response A steepest-descent algorithm initially
takes a guess of the inputs to measure the response The algorithm then runs
exploratory measurements in each direction from the initial guess and calculates
the change in the response for each direction The most favourable direction in
n-dimensional space is identified and measurements continue along this
trajectory towards the minimum until a decrease in the response is observed
The most favourable direction is then identified again until the measurements
can no longer observe a favourable change in the output This terminates the
algorithm as it has converged on a local minimum[166]
60
Figure 117 A representation of a steepest-descent algorithm minimising a 2-dimensional
contoured parameter space where о indicates a measurement Where red areas are
function maxima and blue areas are function minima
Another intuitive gradient-based optimisation algorithm is the simplex
algorithm[167] This method uses convex polyhedra formed of n + 1 vertices
(where n is the number of variables) - an individual polyhedron is referred to as
a simplex The algorithm begins by conducting either user-defined or random
measurements of the response function at particular inputs as shown in Figure
118 in 2-dimensional space where each vertex of the initial simplex represents
a function evaluation measurement The worst performing vertex is then
replaced upon each iteration of the algorithm via a reflection resulting in a new
simplex that explores a new area of parameter space This approach locates
areas with a more optimal response and hence successive simplex iteration
converge on a local optima at point
61
Figure 118 A representation of a simplex optimisation for a 2-dimensional contoured
parameter space where the numbered vertices of each polyhedron indicate a
measurement Where red areas are function maxima and blue areas are function
minima
As shown in Figure 118 the initial simplex comprising of the
measurements 1 - 3 is evaluated via the response function at each vertex The
worst vertex measurement 2 is then replaced via reflection to evaluate the
response function at measurement 4 Similarly measurement 3 is then replaced
by measurement 5 in a further simplex iteration The optimisation typically stops
when a better response function evaluation cannot be found indicating that a
local optimum has been identified - this is illustrated by measurement 11 Further
modifications have also been adapted from this methodology notably the
Nelder-Mead simplex algorithm[168] that allows further geometric transformations
as well as just reflections These transformations are highlighted in Figure 119
Because of the efficient and intuitive nature of these simplex algorithms
particularly the adapted Nelder-Mead variation their use in applications in the
literature are vast the original Nelder-Mead report has over 30000 citations
62
Figure 119 The different geometric transformations of the Nelder-Mead simplex inside
contraction (XIC) multiple contraction (MC) outside contraction (XOC) reflection (XR) and
expansion (XE)
Another notable form of local optimisation methodology is the interior-
point method The interior-point method is a class of algorithm that is very
effective at solving both nonlinear and convex problems by approximating local
regions around measurements as a lsquotrust regionrsquo[157] An initial trust region t0 is
identified around the starting point shown as x0 in Figure XY where the trust
region has an approximated objective function to minimise The gradient of the
trust region determines both how the region is approximated as either linear or
quadratic and also the steps necessary in minimising the approximated
objective function This optimisation is shown as a 1-dimensional minimisation in
Figure 120 where the x-axis is the magnitude of the variable and the y-axis is
the measure of the approximated objective function
63
Figure 120 A 1-dimensional optimisation using an interior-point method The approximate
objective function is minimised for the starting trust region t0
When this initial trust region objective function is minimised a new trust
region around this minimum is then approximated shown as t1 in Figure 121
This new approximated objective function is then also minimised The algorithm
continues to iterate via trust regions along what can be described holistically as
the lsquocentral pathrsquo towards the optimum for the true objective function where no
further improvements can be made This central path can be viewed as an
averaged direction based on the actual algorithm path taken In this example
the is objective function was minimised in the fourth trust region t3 finding the
optimum xbest More detailed algorithmic and mathematical discussions of this
optimisation technique can be found in some of the more relatively recent
reports[169 170]
Figure 121 A 1-dimensional optimisation using an interior-point method The approximate
objective function is minimised for the sequential trust regions until the overall function is
minimised The path that the algorithm can take can be described as the algorithm path
or the central path towards the optimum
132 Global
There is much variation in the methodologies applied by global
optimisation algorithms but one of the most common techniques relates to what
can broadly be described as a genetic algorithm[171] Genetics algorithms perform
computations to search for a global optimum utilising techniques inspired by
64
Darwinian evolutionary biology Although there are many forms of genetic
algorithms the methodology of a simple genetic algorithm (SGA) is qualitatively
introduced herein The six stages of SGA can be categorised as initialisation
evaluation selection crossover mutation and replacement After initialisation
the other stages of SGA are repeatedly iterated until the optimum has been
found which leads to termination of the algorithm The optimum is typically
assumed to be found if the evaluation stage does not produce a better function
evaluation (fitness value) for the given objective function (fitness function)[158]
The workflow of the algorithm is depicted in Figure 122
Figure 122 A depiction of the flow of a simple genetic algorithm
The selection stage aims to find the best parents from the current
population to generate the next population where a population is a collection of
all of the sets of inputs for the given variables and a parent is one potential set
of inputs from this population The parents are often selected simply based on
their fitness value In the crossover stage each individual variable input value
(chromosome) from each parent has a probability of 05 to exist in the resulting
children set Each of the children in the following population then have another
given probability of a random chromosome mutating in the mutation stage This
stage prevents a genetic algorithm from becoming stuck in a local minima After
this cycle has occurred this represents one iteration of the algorithm which then
successively occurs until the optimum has been reached This SGA methodology
is highlighted in the adapted simple example shown in Figure 123 whereby a
fitness function (the sum of all inputs) is maximised by the input of integer
chromosomes[158] The ability of genetic algorithms to obtain an optimised result
65
for a given function is very desirable even with a very large number of input
variables Despite the high computational expenditure to this methodology
requires itrsquos reliability has resulted in high adoption in the general literature for
many applications
Figure 123 A depiction of one iteration of a simple genetic algorithm Figure adapted from
works reported by Boyd amp Vandenberghe[158]
Bayesian optimisation is another category of global optimisation methods
that generally proceed in a more efficient manner than genetic algorithms by
utilising approximated (surrogate) models to optimise expensive-to-evaluate
objective functions[166] Random evaluated data points are initially conducted
then a surrogate model is built to fit these data points as well as a corresponding
acquisition function Bayesian optimisation methods obtain their efficiency from
their use of these acquisition functions which balance exploration of the
parameter space and exploitation of already known high-performing regions of
parameter space[172] This acquisition function is maximised after each iteration
of the algorithm to determine the optimum measurement point to evaluate next
in order to explore parameter space but also attempt to gain a better evaluation
Iterations of a Bayesian optimisation for the minimisation of an arbitrary
function f(x) with respect to the 1-dimensional optimisation of variable x is
shown in Figure 124[166] Two initial measurements are inputted shown as red
dots in the first iteration (i) The surrogate model is fitted in blue where the blue
area indicates the uncertainty in the model The acquisition function is shown in
red with a vertical red line indicating the next parameter measurement to be
evaluated - this evaluation is shown specifically in (i) as another red dot From
the second iteration (ii) there is now enough data to fit 95 confidence intervals
to the surrogate model indicating the regions of highest uncertainty The
66
maximum of the acquisition function again determines the next parameter
measurement As aforementioned this parameter measurement is made based
on the compromise of exploring known regions of high performance and regions
where these confidence intervals are the largest As further measurements are
made in the iterations thereafter (iii) - (viii) the confidence intervals shrink
around areas richer with measurements and the surrogate model gains
confidence in its predictions Therefore as the algorithm gains confidence in the
model this means that the algorithm also gains confidence that it has achieved
the global optimum for the particular function
67
Figure 124 The Bayesian optimisation of f(x) where (i) - (viii) represent the sequential
iterations of the minimisation The acquisition function is shown in red measurements
are shown as red dots and the current estimated surrogate model is shown in blue with
its corresponding 95 confidence interval The maximum of the acquisition function
indicates the next measurement to be taken
Integer linear programming (ILP) is a class of methodologies that are
concerned with variables that can only take the form of integers and although is
not classically a type of global optimisation algorithm is still a mathematical
optimisation that is useful in specific cases and is utilised in this project An ILP
problem is in general very difficult to solve and many solvers have attempted to
simplify the procedure by utilising a much simpler linear programming (LP)
approach then rounding down the values to the nearest integer - this is known
as LP relaxation but may not always be effective in identifying the optimum
solution so other techniques must be used[158] In ILP optimisations it is also
common to have multiple linear constraints which define a feasible region that
the optimum can be found
Although ILP algorithms may proceed using different methodologies the
most intuitive introduction would be a 2-dimensional problem with a graphical
method The function to be maximised f shown as eqn 135 is bound by 4
linear constraints C1 - 4 shown as eqn 136 - 139
As the problem consists of two variables x and y it can be illustrated by a 2-
dimensional graphical plane where each linear constraint is a straight line
forming a closed feasible region - this is indicated in Figure 125[158] Therefore
all feasible solutions to this problem must be an integer in x and y within the
bounds of this feasible region The objective function f is represented as a
straight line with given inputs of x and y that indicates its current position This
function however can be viewed as a dynamic line that moves in parallel with
respect to different values of x and y Therefore in order to obtain the maximum
feasible evaluation of f the line is moved from its current location in the figure
119891 = 12119909 + 7119910 eqn 135
1198621 = 2119909 minus 3119910 le 6 eqn 136
1198622 = 7119909 + 4119910 le 28 eqn 137
1198623 = minus119909 + 119910 le 2 eqn 138
1198624 = minus2119909 minus 119910 le 2 eqn 139
68
until it intersects with the allowed two integer-valued inputs within the feasible
region for the first time All integer-valued input combinations within the feasible
region are marked with a red dot where the first intersecting point would be either
point 1 (23) or point 2 (31) indicated as P1 and P2 respectively These points
can be evaluated mathematically by the objective function to determinine the true
maximum where P1 = 43 and P2 = 45 Although this specific example is 2-
dimensional and this intuitive graphical method cannot be easily performed in 3-
dimensions and is impossible in further dimensions many computational ILP
algorithms proceed using this generalised concept to identify optimum inputs for
a given function
Figure 125 A graphical method to solving ILP problems where C1 - 4 indicate the linear
constraints the green area indicates the feasible region f shows the objective function
red dots represent the integer values of the inputs and P1 and P2 indicate two feasible
potential maxima to the problem Figure adapted from works reported by Boyd amp
Vandenberghe[158]
133 Optimisation summary
There are many methodologies that optimisation algorithms utilise
meaning that there are several classes of algorithm that are available and then
69
multiple subclasses thereafter There are specific cases where a particular
algorithm class is necessary to solve a problem but also cases where many
algorithms may be suitable it is then necessary to decide which algorithm to use
in this instance based on other factors such as computational efficiency In this
project these decisions will be explored as optimisation algorithms must be used
in multiple unique scenarios This is because other methodologies such as grid
search are too inefficient and imprecise especially as many input variables (for
example kinetic parameters to be optimised) must be determined in an
appropriate length of time and with high precision
14 Research aim
The aim of this project is to develop and advance an automated methodology
to kinetic model and parameter determination The basis of this project arises
from a methodology reported by Tsu et al[173] that provides a framework to a
technique that achieves this by evaluating all possible reaction models This
reported framework however has limited simulated examples and no real
experimental examples that prove its efficiency This methodology can represent
a positive change in the laboratory where physical-organic chemists can make
use of their human resource on other tasks instead of determining a reaction
model and kinetic parameters which can be assigned to a computer This is the
advantage to exploring this automated methodology that this project is
predicated on which leads the specific project goals herein described
bull To build this automated computational approach to kinetic model and
parameter determination based on the framework aforementioned as
well as to test the effectiveness of the approach in simulatedliterature
case studies (Chapter 2)
bull To prove the effectiveness of the approach in real experimental case
studies This approach will be coupled with automated kinetic profile
generation by flow rate manipulation in a continuous flow chemistry
experimental setup (Chapter 3)
Although methodology described is very powerful for many chemical
scenarios there are also instances where this technique does not work
Specifically this approach is not designed for applications where the reaction
70
order can be a non-integer or where particular species may be catalytic in
nature Therefore further specific project goals are described
bull To further develop this automated approach to kinetic model and
parameter determination to include chemistries that may proceed via a
catalytic route or have non-integer orders with respect to one or more
species in the reaction model The effectiveness of this new approach
must also be proven in a simulatedliterature case study(s) (Chapter 4)
bull To prove the effectiveness of this new approach in real experimental case
studies to achieve kinetic information (Chapter 5)
This project will ultimately lead to a tool that any chemist can utilise by
plugging time-series data and chemical species into the automated approach
then observing the output in the form of the most likely kinetic model and
associated parameters Without kinetic expertise any chemist will be able to use
this approach and interpret the output in order to obtain scalable process
understanding
Chapter 2 Development of the computational approach to
kinetic model determination
21 Introduction
A chemical system can be seen as a cascading dynamic reaction
scheme where molecules can orientate themselves in a particular way and with
a particular energy to allow a reaction to occur This reaction of course will follow
a particular reaction mechanism These mechanisms can give a deep
understanding of the underlying chemistry that we merely observe as a
transformation and can give real-world benefits as it then becomes clearer and
easier to control and understand chemical reactivity[174 175]
For the development of a chemical process however one of the greater
concerns is to mathematically characterise the transformation from the starting
materials to products - this can be complex and occur over many reaction steps
and involve many measurable and immeasurable intermediates This allows
quantitative information to be gained regarding the chemical synthesis allowing
71
for classical reaction engineering principles to be applied to shorten process
development times and lower costs[173] Therefore the objective is to develop
stoichiometric and kinetic descriptions of the individual transformations rather
than detailed mechanistic insights and rationales[176] Where stoichiometry refers
to the stoichiometric coefficient of a particular species in a reaction and kinetic
descriptions refer to the kinetic parameters involved in the rate equations for a
process For a system with multiple reactions this is referred to as a chemical
reaction network (CRN)
The basis for many stoichiometric and kinetic modelling studies with the
specific aim of CRN determination is the data-driven work reported by Aris and
Mah[177] This work is an early example of using computation to evaluate aspects
of a CRN specifically how many independent reactions can be shown to account
for changes in experimental data providing that all chemical species are
measured Bonvin and Rippin[178] later reported tar
get factor analysis (TFA) which was shown to derive approximate stoichiometric
models for complex systems as well as to test user-inputted stoichiometries for
their suitability to experimental (simulated) data TFA has been used and
advanced to verify proposed reaction stoichiometry in a select few reported
works[179 180]
TFA was then used as the basis for further work reported by Brendel et
al[181] and Bhatt et al[182] whereby an incremental identification method was
proposed This is a step-wise method where the stoichiometry is initially verified
using TFA then other model identification strategies are utilised to identify the
structure and parameters of the rate laws within the ODE models However TFA
initially requires a CRN to be at least postulated by a user before it can be used
This requires a high degree of chemical intuition but may also be incorrect as
there are many possible forms in which the CRN can exist especially when
dealing with a system with a large number of chemical species
An alternative step-wise method was also reported by Burnham et al[183]
in which a global ODE model structure was generated which is capable of
representing an entire set of possible chemical reactions As this global ODE
model structure represents an over-trained model model terms are sequentially
removed using statistical measures until all insignificant terms are removed
72
giving the final CRN As this features several optimisations of models with many
kinetic parameters in order to identify insignificant terms this optimisation can be
very slow and also suffer from local optima This is also the case with the
determination of insignificant terms as the identified optimum model itself may
be non-global
Willis and von Stosch[176] then reported the use of mixed integer linear
programming (MILP) to determine the model structure as well as its associated
kinetic parameters This was because previously reported step-wise
identification approaches fail to consistently predict the underlying network
structure[184-186] In this work a global CRN structure was reported but MILP was
used to dismiss all non-mass-balancing reactions from the structure
Decomposition of the global structure then occurs by statistical means and
although the global structure is now much smaller in this work termination at
local optima may still be an issue
Tsu et al[173] then reported an improvement upon this method where ILP
initially identifies all mass-balancing reactions then builds every possible
reaction model It is this approach that will be focussed on in this chapter and
further description and discussion is provided in Chapter 22 Every model is then
fitted and statistically evaluated which avoids the potential pitfall of local optima
when determining the correct model However this can be computationally
demanding as there are many more models to evaluate than in any previously
reported work
Other works in the literature include more algorithmic approaches to CRN
identification Differential evolution[187] genetic programming[188] and multi-
objective genetic algorithms[189] have all been used as global optimisers to
attempt to determine the CRN These specific global optimisers which focus on
mimicking real-life Darwinian evolution are attractive as the CRN is identified
with minimal human interaction or expertise However this optimisation method
can still encounter problems due to local optima and take a very long time to
compute due to the number of iterations necessary for convergence upon the
optimum
The main assumption that is universal among these approaches to CRN
determination is that all reaction kinetics follow the law of mass action This
73
states that the rate of reaction of an elementary reaction is directly proportional
to the product of the concentrations of the reactants raised to the power of their
stoichiometric coefficients[190] For the reaction shown in eqn 1 based on the
law of mass action the reaction rate can be described by eqn 2 and therefore
eqn 3 The kinetic rate constant k therefore determines the speed of the
reaction as well as the reactant concentrations
Where
bull α β γ = stoichiometric coefficients
bull x1-3 = chemical species
bull k = kinetic rate constant
bull rate = rate of reaction
The law of mass action is applicable in most cases however there are
particular cases where it is not accurate to describe a process using mass action
kinetics where these approaches are not applicable Such processes typically
occur when concentrations of particular substrates are very low[191]
22 Development of the approach
The computational approach was developed using MATLAB by loosely
following the approach outlined by Tsu et al[173] The approach contains two main
sequential stages kinetic model generation and kinetic model fitting Firstly all
mass-balance-allowed reactions are identified from the inputted species (starting
materials intermediates and products) Then all of the feasible reaction models
ie all possible combinations of these allowed reactions are compiled and stored
in a model database
After the model database has been generated for the particular process
the kinetic model fitting stage then evaluates the fit of the ordinary differential
equations (ODEs) for that particular model to the experimental data provided
The MATLAB ODE solvers can be used to in such a way to allow an assessment
1205721199091 + 1205731199092119896rarr 1205741199093 eqn 21
119903119886119905119890 prop [1199091]120572[1199092]
120573 eqn 22
119903119886119905119890 = 119896[1199091]120572[1199092]
120573 eqn 23
74
of how the concentration of a species changes over time when given particular k
values Therefore optimising the k values for a given reaction model by
maximising the convergence of the ODEs with the experimental data provides
an indirect route to their identification The convergence metric which is the sum
of squared error (SSE) between the simulated ODEs and the data as well as the
k values for each model are then stored
Statistical analysis is then applied to each of the models Corrected
Akaikersquos Information Criterion (AICC) is used as a measure to identify the models
that best balance model simplicity and convergence to the data and hence
identify the most valid models When these models have been identified it is
then possible to run Monte Carlo simulations if the error of the experimental data
is known These simulations assume that the error is normally distributed around
the data point and compile both the error in experimental data and error in the
kinetic fitting of the ODE to obtain an uncertainty prediction in the identified k
values for the process
221 Kinetic model generation
In order to generate the kinetic models for evaluation the first step is to
input all of the known species of a chemical process into the system The species
can be identified by any means typically by experimentation where all starting
materials intermediates and products are identified These species are inputted
based on their respective number of differing atoms ie number of carbon
atoms number of oxygen atoms etc which is known as a Mass Matrix (MM)
For example if you take the known reaction model of A + B C + D
shown in Scheme 21 you could visualise initially inputting these four species
into a mass matrix shown in Figure 21
75
Scheme 21 An example esterification reaction
Figure 21 The Mass Matrix inputted into the approach assigning mass to each of the
species
It is also possible to describe the reactions (forward and backward) shown
in Scheme 21 in terms of the stoichiometry of reactants used (SR) and the
products formed (SP) as a set of matrices in Figure 22 When describing these
matrices a 0 represents that the species does not participate a 1 represents
that the species does participate with a kinetic order of 1 and 2 represents that
the species participates with a reaction order of 2 For example in the forward
reaction both species A and B participate as a reactant with reaction order 1
meaning that they are represented by lsquo1rsquo whereas C and D do not participate as
reactants so are represented by lsquo0rsquo These stoichiometric matrices are then
combined to form an overall stoichiometry S where S = SP - SR This overall
stoichiometry for an unknown model would otherwise be identified using an
Integer Linear Programming (ILP) optimisation and is necessary to identify all
feasible mass-balanced reactions
76
Figure 22 The stoichiometric matrices for the reaction model shown in Scheme 21 as well
as the overall stoichiometry matrix S
The ILP optimisation proceeds by finding every feasible stoichiometry that
satisfies the objective function of MMmiddotS = 0 where S is the transposed vector of
a single reaction with values for each of the species present Therefore as there
are four species in the esterification process shown in Scheme 21 the ILP
optimisation will proceed using the known Mass Matrix to identify the values of
X1-4 that satisfy the objective function shown in Figure 23 The optimised
solution is then the resulting stoichiometric vector which relates to a particular
feasible reaction The upper bound for the number of reactants in a stoichiometric
vector is 2 as it is very rare to encounter third order reactions as a single reaction
step When an optimised solution is found the solution is saved then successive
constraints are added to the ILP optimisation to guarantee that the same
combination of binary variables (and hence stoichiometry) are not obtained when
the optimisation problem is solved again The optimisation then ceases when
there are no more solutions to be found and hence all feasible mass-balance-
allowed transformations are identified
Figure 23 The ILP optimisation identifying a feasible solution to the objective function hence
identifying a mass-balance-allowed reaction Where X1 = A X2 = B X3 = C X4 = D
After all feasible reactions are identified these standalone reactions are
themselves potential models There are also other possibilites for reaction
models where there are any combinations of two of the possible reactions or
any combinations of three of the reactions etc The total number of possible
models (η) is equal to the sum of the binomial coefficients (or all combinations)
77
for every number of reactions in the model up to the total number of possible
identified reactions (δ) - this is shown in eqn 24 All of these combinations are
then generated and saved to a model database which will be accessed in the
next stage of the approach For example if the ILP optimisation identifies 5
possible reactions (δ = 5) the summation of all combinations gives η equal to
31 This example can be shown in a model representation in Figure 24 where
this could be any appropriate reaction where SM = starting material Int1 =
intermediate 1 Int2 = intermediate 2 P = product and Imp = impurity It should
also be noted that as all of these forward reactions are mass-balanced all
backward reactions would also be plausible but are omitted from the
representation for concisiveness
Where
bull η = total number of models
bull δ = number of possible reactions
bull i = iterative number of reactions considered for the model
120578 = sum 120575
119894 (120575 minus 119894)
120575
119894=123hellip120575
eqn 24
78
Figure 24 A visual representation of all of the possible reaction models when given five mass-
balance-allowed sample reactions each shown as a different coloured block When i = 1
each reaction is in itself a model and when i gt 1 each reaction behaves as a model
fragment These fragments when combined in different ways provide full and unique
reaction models each of which are to be assessed for their validity with respect to
experimental data
After every possible model has been saved into the model database each
of these models are then automatically transformed into their respective ODEs
which is a form that can be readily used in the kinetic model fitting stage of the
approach The individual stoichiometric reactions that make up each model are
compiled into a set of differential equations for each model where each of the
participating species have their own differential equation to show how their
concentration changes over time Figure 25 summarises the model generation
section of the approach by using the esterification reaction as an example This
shows how the initial input of the species is first used to identify the feasible
mass-balance-allowed reactions then how these reactions can be ordered into
every possible reaction model then subsequently how these models are
transformed into sets of differential equations for use in the kinetic model fitting
stage of the approach
79
Figure 25 A schematic summarising how the model generation stage of the approach
progresses Where the participating species are inputted and sorted ODE functions that
describe all possible mass-balance-allowed reactions are outputted
222 Kinetic model fitting
After the model generation stage of the approach is completed and there
is a sorted database with all possible models compiled with their respective ODE
functions the next stage of the approach can begin kinetic model fitting This
80
stage proceeds by sequentially loading individual models from the database
then attempting to optimise the kinetic constants for each of the reactions within
the model These optimisations progress based on the simulated ODE resultsrsquo
convergence with experimental data where more suitable models exhibit a
favourable change in ODE convergence based on the kinetic constants provided
by the optimiser Where models do not accurately describe the chemistry taking
place in the experimental dataset the optimiser typically ceases very quickly as
there is no way to incur a favourable change in the ODE results as it iterates
After the fitting of a particular model is complete the kinetic constants (optimised
results) as well as the minimised error metric of the ODE convergence (sum of
squared error or SSE) are assigned to the model and saved for statistical
analysis
2221 The objective function
When a model is initially selected for kinetic fitting the objective is to use
an optimisation algorithm to minimise the SSE between the simulated ODE
results and the experimental results This is shown in Figure 26 with a set of
time-series data showing a first-order decrease in the concentration of A The
first iteration of the algorithm is shown where a guess of k = 04 is applied to the
ODE solver The lsquodifferencersquo between the experimental result of data point Ex
and the simulated ODE of data point Sx is shown as Dx This value is squared
to make the value positive and summed with all other differences to give one
SSE value this is shown mathematically in eqn 25
119878119878119864 = sum (119864119909 minus 119878119909)2
119909=123hellip
eqn 25
Where
bull SSE = sum of squared error
bull Ex = experimental data point
bull Sx = simulated ODE data point
As the algorithm iterates the aim is to decrease the SSE output by varying
the input k values In this example optimisation shown in Figure 26 the optimiser
(and hence SSE) reaches a minimum at iteration 11 as the ODE converges very
well with the experimental data This method serves as an indirect route to
81
identifying kinetic constants as in this case the k values are the optimised inputs
for the optimisation algorithm
Figure 26 The iterations of an optimisation algorithm with respect to the convergence of
simulated ODEs with sample data - this occurs via the minimisation of the SSE output
For each iteration of the algorithm the inputted k values are used
alongside the ODE equations for the current model The ODE solver simulates
how each of the specified initial speciesrsquo concentrations change over time given
82
the reaction rate calculated from the k values the species concentration at that
moment and the reaction model The ODE solver used for this approach is the
MATLAB solver lsquoode15srsquo This is a stiff ODE solver meaning that it can be used
to solve lsquostiffrsquo ODEs An ODE is stiff when the integration must be completed in
unreasonably small increments by typical solvers that could require millions of
evaluations leading to a solver failure As there are many reaction models that
are to be evaluated it isnrsquot clear which ODEs would present themselves as stiff
problems Therefore ode15s was used which can approach curve solutions for
both stiff and non-stiff ODEs as opposed to a non-stiff solver which would be
able to solve non-stiff ODEs faster but fail when stiff ODEs were to be evaluated
Depending on the nature of the experimental data different inputs for the
optimisation algorithm may also be used If there is only one data set or all data
sets are at the same temperature then k values can be optimised If there are
multiple data sets at different temperatures however it is often better to optimise
directly for the activation energy and reference k value This is because there are
fewer variables for the algorithm to optimise meaning there is a greater chance
of convergence on a global optimum and not a local one this is discussed further
in Chapter 2222
The reference k value is at a particular reference temperature typically
the midpoint of the temperatures explored experimentally This is to ensure that
there are no weightings in the fittings of parameters towards the extremes of the
temperatures explored This reference k value and activation energy value for
each of the transformations are optimised as these inputs generate the k values
for each transformation using the re-parameterised Arrhenius equation shown
as eqn 26 where the general Arrhenius equation is shown as eqn 27
119896 = 119896119903119890119891119890[minus119864119886119877(1119879minus1119879119903119890119891
)] eqn 26
119896 = 119860 119890minus119864119886119877119879 eqn 27
Where
bull k = rate constant
bull kref = reference rate constant at a particular temperature
bull Ea = activation energy kJ mol-1
bull A = pre-exponential factor
83
bull T = temperature of reaction K
bull Tref = reference temperature for the reference rate constant K
bull R = ideal gas constant J mol-1 K-1
The re-parameterised Arrhenius equation is used for kinetic fitting as there
is only one optimum for the reference k and activation energy values regardless
of the kinetic model This means that the output of the algorithm can be assumed
to be at a discrete optimised point This is not the case if optimising for set of
values for a pre-exponential factor and activation energy due to the high
correlation between these values[192 193] This means that there are several sets
of values that can all combine to obtain the same rate constant which can be
avoided when using the re-parameterised equation to fit kinetic parameters to
data sets that include multiple temperatures
The final consideration when compiling the objective function is the
method of measuring the convergence of the simulated ODEs to the
experimental data For all simulated and experimental case studies herein
reported the SSE metric has provided good convergence to time-series data for
all species This could present a problem however in cases where particular
species occur in only small quantities and SSE does not provide a good fit to the
data This is because the SSE metric reduces the overall error hence giving a
biased fit to species that are present in larger concentrations This could be
prevented by using a different error metric - such as a weighted sum of squared
error (WSE) or a relative sum of squared error (RSE) Both of these error metrics
serve to normalise the errors in convergence between species present in higher
and lower concentrations and can be used in this approach if the experimental
data suggests that it would be appropriate
2222 The optimisation algorithm
When fitting kinetics using this approach the algorithm used to minimise
the error metric described in Chapter 2221 and hence maximise the
convergence of the simulated ODE with experimental data is the MATLAB
function fmincon fmincon utilises an interior point algorithm which is described
in detail in Chapter 131 This function has been reported extensively in the
literature for the nonlinear optimisation of dynamic models including
considerable uses in the fitting of kinetic parameters to reaction models[194-196]
84
fmincon is a local optimisation tool that leads to fast and accurate
convergence on local optima As the given error metric SSE reports a value
based on the residuals that is correlated to the magnitude of the concentrations
involved it is not clear based on this value whether true convergence has
occurred However due to the nature of the problem it is simple to plot the
experimental data and simulated ODE after kinetic fitting to visually confirm that
convergence has occurred Based on the convergence to the experimental data
it can then be assumed that the optimum found is the global optimum for that
model If non-convergence occurs then it is either because the given model does
not accurately represent the chemistry in the system or the algorithm became
trapped in a local optimum The likelihood of these scenarios depends on the
non-linearity of the data and the number of variables to be optimised
Generally speaking in these scenarios it is assumed that when non-
convergence occurs it is because the model does not accurately represent the
chemistry This is because of two reasons The first is that most kinetic data does
not feature sharp inflexions or cliff-edges in which concentration-time data
deviates from an otherwise smoothed curvature It is this curvature in the data
that makes local solvers such as fmincon very effective at identifying kinetic
parameters as large aspects of their methodologies involve gradient-based
calculations Therefore the path that the optimiser takes towards the optimum
typically iteratively improves as the optimiser progresses and with a smoothed
parameter space this means that the iterative improvement is unlikely to reach a
local optimum The second reason is that when fitting kinetics typically the
number of variables to be optimised is low as many models feature chemistry
that has fewer than 10 model terms This means that it is unlikely that fmincon
will encounter local optima when optimising and will only find the globally
optimum solution
There is not a discrete reported number of variables to be optimised that
means that fmincon will start to encounter local optima issues Kinetic studies
are reported routinely where ~15 or more parameters are optimised using
fmincon both isothermally and across different temperatures without issues[197
198] However it cannot be assumed a priori with certainty that these issues will
not occur Therefore in cases where there are more than 10 model terms to be
optimised a form of global optimisation called multi-start fmincon (ms-fmincon)
85
will be used This methodology employs fmincon but with multiple starting points
from which the optimisation starts Using ms-fmincon with 5 randomised starting
points means that from those 5 optimisations the global optimum is very likely
to be found when more than 10 parameters are to be optimised This approach
utilises ms-fmincon because it has been proven to be effective in optimising even
large scale systems A recent example of this was reported where 383
parameters were optimised accurately for a large kinetic model[199]
223 Statistical analysis
After the kinetic parameters are optimised for each model and the error
metric (SSE) recorded statistical analysis can then be performed to determine
the most likely model that describes the experimental data Akaikersquos Information
Criterion (AIC) eqn 28 provides a relative evaluation of a model for a particular
set of data[200]
119860119868119862 = 119899 ln (119878119878119864
119899) + 2119896 eqn 28
Where
bull AIC = Akaikersquos Information Criterion
bull n = number of observations
bull SSE = sum of squared error
bull k = number of model terms
This calculation provides a relative evaluation of balancing the goodness-
of-fit of the model to the experimental data with having as few model terms as
possible where a minimised value is optimal Therefore models are more
favourable if they only contain terms that have a significant effect on the fit to the
data inputted This means that the optimum model that AIC selects is less likely
to be over-trained as all model terms contribute a significant amount towards
the fit of the data
In the context of this approach an AIC evaluation can inform the
experimenter which reaction model is the most likely to be correct in relation to
other models considered This model should only contain reactions that
significantly contribute towards the convergence of the simulated ODEs with
experimental data points As AIC assumes that the amount of data is sufficiently
large in relation to the number of model parameters it is also beneficial for the
86
purposes of this approach to use a corrected AIC value to compensate for the
reduced sample sizes
The Corrected Akaikersquos Information Criterion (AICC) eqn 29 both
converges to AIC for large sample sizes but gives a more accurate answer for
smaller sample sizes as a greater weighting is placed on the number of model
terms[201] Reported data suggests that an uncorrected AIC value is appropriate
only when the ratio of nk is greater than 40 otherwise an AICC evaluation should
be used[202] However as the model penalisation aspect of AICC is favourable to
differentiate models with similar SSE values and many of the lsquoobservationsrsquo in
the context of a kinetic profile can be highly correlated if the ratio of nk is less
than 40 then the number of observations should be the number of individual
experiments rather than individual data points This is also true where several
experiments are used in fitting to contribute towards one SSE value where each
experiment has a vastly different number of measurements within them
119860119868119862119862 = 119860119868119862 + 2119896(119896 + 1)
119899 minus 119896 minus 2+ 119899 ∙ ln(2120587) + 119899
eqn 29
Where
bull AIC = Akaikersquos Information Criterion
bull AICC = Corrected Akaikersquos Information Criterion
bull n = number of observations
bull k = number of model terms
224 Other considerations
There may be some instances where there are intermediates or products
formed that cannot be identified This occurrence can be chemistry-dependant
but it is common that the quantitative analysis of a process can show total mass
balance losses as a reaction progresses This can indicate that either the species
calibrations are inaccurate or there is a real loss of massconcentration that is
unaccounted for If calibrations are correct with certainty and there is still a loss
of mass that is unaccounted for it can also be beneficial to input an additional
species into the system This will force the approach to identify a new pathway
to an unknown species which can be assigned the total mass loss of the process
as the time-series data progresses Due to the nature of the AICC evaluation it
can then be determined statistically if this loss of mass contributes significantly
87
enough towards the fitting of the data to suggest that there is a chemical pathway
occurring that is not described by the userrsquos inputted species This pathway will
be a grouped reaction description with an observed rate constant kobs This is
because if another pathway is shown to occur then it is not possible to know
how many routes that mass is lost by Chemical considerations must then be
undertaken to identify missing species and the approach must be re-run
When running the approach the model generation aspect is very fast
whilst the kinetic fitting stage is significantly slower due to the many optimisations
that must be conducted The kinetic fitting stage is considerably accelerated by
utilising parallel computing This means that each optimisation operation is
conducted on a single computer core meaning that separate tasks can be sent
to separate cores within the computer This means that optimisations are
conducted in parallel as the process speed scales directly with the amount of
computer cores available The time taken for each optimisation is heavily
dependent on the model it is fitting and the number of ODE evaluations to be
conducted A typical range for a single optimisation can take from 10 - 120
seconds on a standard Intel i5-2310 processor however many optimisations
take less than 1 second if the model does not describe the experimental data
accurately
225 Overview
This computational approach to kinetic model selection and parameter
identification was developed in MATLAB by loosely following the methodology
reported by Tsu et al[173] The approach first identifies all possible reactions that
can happen based on mass balance alone from the species inputted by the user
All plausible models are then compiled by taking every combination of these
reactions and sequentially optimising the kinetic parameters for each of these
models Each model is then statistically evaluated and ranked highlighting the
most likely model based on the experimental data supplied The approach outline
is summarised in Figure 27
88
Figure 27 An outline of the stages of the computational approach
This method serves as a comprehensive model evaluator where chemical
intuition is removed thereby removing a chemistrsquos bias and considering a
number of possible models that may otherwise not have been considered It is
however not the role of this approach to remove all necessity for a physical-
organic chemist to supervise the discovery of a kinetic model This approach is
to be used as a complementary tool whereby all models are evaluated without
human effort or interaction but final considerations are still made by the chemist
when the ranked model list is generated This is because there may be reactions
present in the most likely model that describe chemistry that is unlikely or unable
to occur but still give a good fit to the experimental data It may also be possible
that many models give very similar AICC evaluations so many models may be
competing
The benefits to this tool are clear All models are generated based on
logical transformations of the species inputted and every possibility is
comprehensively evaluated without the need for a chemistrsquos or statisticianrsquos most
important resource time Typically a chemist would evaluate a select few models
based on chemical intuition and remove certain chemical possibilities a priori
then further refine the model until it is satisfactory When all possibilities are
considered by an approach that automatically evaluates them this allows the
chemist to work on other projects including more important aspects of laboratory
work or theory that cannot be assigned to a machine However although
89
powerful this tool ultimately is data-driven and must be used in conjunction with
real chemical intuition by an end user to determine that the models identified as
most likely are accurate and consistent with the science
23 Simulated verification of the approach
Before any real experimentation takes place it is important to first verify
that the approach works as a means of identifying the correct reaction model and
kinetic parameters Therefore several simulated case studies were conducted
with varying goals to show the adaptability of the approach to different
circumstances These simulated case studies feature reactions from the
literature where the model and kinetic parameters are already identified
Simulated experimental data is generated from this information and used as the
basis for verifying the approach
To simulate the data first the true model and kinetic parameters reported
in a given literature source are inputted into MATLAB The experiment is then
simulated at a particular temperature and set of initial concentrations by using
an ODE solver to evaluate the change in species concentrations over a given
experimental timeframe Individual data points from this timeframe are then
extracted which serve as the experimental data points for the particular
simulated case study To then make the case study more robust up to 5
relative error in each measurement is added to approximate this simulated data
more closely to real experimental data This generation of simulated data is
summarised in Figure 28
90
Figure 28 An example showing the generation of a simulated data set from the literature a)
An ODE is simulated for a particular model with a set of kinetic parameters in this case A
rarr B where mdash = A mdash = B b) Particular time points are taken from this ODE to
represent individual measurements where x = A x = B c) Up to 5 relative random
error is added to these measurements to more closely resemble real experimental data
231 Case study Benzoic acid alkylation
The first simulated case study was a very basic system where there are
only three species to be considered[203] The reaction system was benzoic acid
21 reacting with iodomethane 22 in the presence of the base 18-bis-
(tetramethylguanidino)naphthalene (TMGN) to form the methyl benzoate
product 23 and hydroiodic acid 24 This reaction is shown in Scheme 22
TMGN was present at one equivalent with respect to benzoic acid and was
assumed to deprotonate the benzoic acid so that all of the starting material is in
the carboxylate form There were no rates reported by the authors for this
deprotonation but they indicated that modelling this system as a simple second
order reaction under these conditions yielded accurate results
91
Scheme 22 The reaction of benzoic acid with iodomethane to form methyl benzoate
Modelled as a second order reaction
2311 Data acquisition
The second order reaction model reported by Gholamipour-Shirazi[203]
was used to generate the ODEs shown in eqn 210 - 213 Three isothermal
simulated data sets were generated using these ODEs with the k value of 057
M-1 s-1 with the following initial concentrations
bull 01 M benzoic acid 21 008 M iodomethane 22 0 M methyl benzoate
23 0 M hydroiodic acid 24
bull 01 M benzoic acid 21 011 M iodomethane 22 0 M methyl benzoate
23 0 M hydroiodic acid 24
bull 01 M benzoic acid 21 015 M iodomethane 22 0 M methyl benzoate
23 0 M hydroiodic acid 24
119889[120784 120783]
119889119905= minus119896 [120784 120783][120784 120784] eqn 210
119889[120784 120784]
119889119905= minus119896 [120784 120783][120784 120784] eqn 211
119889[120784 120785]
119889119905= 119896 [120784 120783][120784 120784] eqn 212
119889[120784 120786]
119889119905= 119896 [120784 120783][120784 120784] eqn 213
5 relative error was then added to these simulated data sets then used
as the inputted experimental data for the computational approach These data
sets can be found in Chapter 721
2312 Results and discussion
Based on the inputs of the molecular weights for this system there were
two mass-balance-allowed reactions shown in eqn 214 and eqn 215 which
are two of the three possible models that can be generated The third model
92
shown in eqn 216 is the combination of these two allowed reactions resulting
in an equilibrium reaction model
Forward 21 + 22 rarr 23 + 24 eqn 214
Backward 23 + 24 rarr 21 + 22 eqn 215
Equilibrium 21 + 22 23 + 24 eqn 216
These three models were then each evaluated based on how well the
simulated ODE curves converge to the experimental data inputted The kinetic
parameters kx were optimised for each model and the SSE was recorded
These results are tabulated in Table 21 The concentrations of HI were assumed
to not be measured during the kinetic fitting and were instead inferred
Table 21 A table showing the optimised k values for the identified models in the benzoic acid
alkylation case study alongside each modelrsquos SSE and AICC
The computational approach reveals that the reaction model containing
solely the forward reaction gives the minimum overall error and the best (lowest)
AICC evaluation when assessing the experimental data indicating that this is the
most likely reaction model For the backward reaction the minimisation algorithm
could not optimise a k value to give a better fit than the initial guess of 1 x 10⁻³
M-1 s-1 indicating that the reaction model is in complete disagreement with the
experimental data For the equilibrium model the error is as low as the forward
reaction model alone as the optimiser assigns a small k value to the reverse
reaction to attempt to fit to the noise of the system Although this model fits the
data equally well there is the added complexity of a second model term as this
term adds no value in terms of lowering the SSE it is an unfavourable addition
in terms of an AICC evaluation which prefers simplistic models and is therefore
considered a less appropriate model than the forward reaction term alone
This case study has shown that it is possible to use this computational
approach to identify the correct model and kinetic parameters for a simple
Reaction kx M-1 s-1 SSE M AICC
Forward 05807 08101 -655
Backward - 10185 -174
Equilibrium 05817 00009 08101 -410
93
system by simply inputting the participating species and their respective
changes in time-series data The k value identified is very similar to the one used
for the generation of the simulated data and varies only because of the 5
noise added to the system The fit of the identified model and k value for the data
supplied is shown in Figure 29 where the data set shown is the middle
experiment where the starting concentrations were 01 M benzoic acid and 011
M iodomethane
Figure 29 The fit of the identified model and kinetic parameters to the generated experimental
data with starting concentrations of 01 M benzoic acid and 011 M iodomethane Where
x = benzoic acid x = iodomethane x = methyl benzoate mdash = benzoic acid (ODE) mdash =
iodomethane (ODE) mdash = methyl benzoate (ODE)
232 Case study Nitrile hydrolysis
This case study features a slightly larger system where there are 5
species to consider in the hydrolysis of a nitrile[204] The nitrile of interest 25 is
hydrolysed by hydroxide 26 to form the amide 27 This amide is then further
hydrolysed to form the carboxylic acid 28 and ammonia 29 This reaction is
shown in Scheme 23 As in many acidbase reactions there are a lot of fast
proton transfer steps the mass of species 26 is therefore added to the system
94
as water H2O rather than hydroxide OH- in order to preserve mass balance
This allows appropriate reaction models to be generated
Scheme 23 The reaction of a nitrile with hydroxide to form the corresponding amide which is
susceptible to further hydrolysis to form the carboxylic acid Modelled as sequential
second order reactions
2321 Data acquisition
The sequential second order reaction model reported by Niemeier et
al[204] was used to generate the ODEs shown in eqn 217 - 221 The reported
kinetic constants for the two steps were
bull Step one k75 degc = 927 x 10-3 M-1 s-1 Ea = 871 kJ mol-1
bull Step two k75 degc = 363 x 10-5 M-1 s-1 Ea = 745 kJ mol-1
Four simulated data sets were generated at four separate temperatures by using
eqn 26 to calculate k values with the following initial concentrations
bull 08 M nitrile 25 18 M hydroxide 26 0 M amide 27 0 M carboxylic
acid 28 0 M ammonia 29 60 degC
bull 08 M nitrile 25 18 M hydroxide 26 0 M amide 27 0 M carboxylic
acid 28 0 M ammonia 29 70 degC
bull 1 M nitrile 25 2 M hydroxide 26 0 M amide 27 0 M carboxylic acid
28 0 M ammonia 29 80 degC
bull 1 M nitrile 25 2 M hydroxide 26 0 M amide 27 0 M carboxylic acid
28 0 M ammonia 29 90 degC
119889[120784 120787]
119889119905= minus1198961[120784 120787][120784 120788] eqn 217
95
119889[120784 120788]
119889119905= minus1198961[120784 120787][120784 120788] minus 1198962[120784 120789][120784 120788] eqn 218
119889[120784 120789]
119889119905= 1198961[120784 120787][120784 120788] minus 1198962[120784 120789][120784 120788] eqn 219
119889[120784 120790]
119889119905= 1198962[120784 120789][120784 120788] eqn 220
119889[120784 120791]
119889119905= 1198962[120784 120789][120784 120788] eqn 221
5 relative error was then added to these simulated data sets then used
as the inputted experimental data for the computational approach These data
sets can be found in Chapter 722
2322 Results and discussion
Based on the inputs of the molecular weights for this system there were
four mass-balance-allowed reactions shown in eqn 222 - 225 All possible
models were then compiled subject to eqn 24 resulting in 15 models
25 + 26 rarr 27 eqn 222
27 rarr 25 + 26 eqn 223
26 + 27 rarr 28 + 29 eqn 224
28 + 29 rarr 26 + 27 eqn 225
All 15 models were evaluated sequentially then ranked based on their
AICC It was found that the highest ranked model was the correct model with
kinetic parameters optimised to be very close to the real values As artificial error
was added to the results this optimisation is assumed to be correct as the
relative error in the kinetic parameters is negligible The top three performing
models are shown in Table 22 where the reference k values at 75 degC are shown
as well as the activation energy SSE and AICC
Table 22 A table showing the top three ranked models for the nitrile hydrolysis case study
The kinetic parameters for each reaction within the model is shown as well as the SSE
and AICC evaluation
Model
rank Model
kx75 degC M-1 s-1
or s-1
Ea kJ
mol-1 SSE M AICC
1 25 + 26 rarr 27 923 x 10-3 867 00179 -1623
96
26 + 27 rarr 28 + 29 449 x 10-5 716
2
25 + 26 rarr 27
26 + 27 rarr 28 + 29
28 + 29 rarr 26 + 27
928 x 10-3
430 x 10-5
194 x 10-4
867
755
263
00179 -1567
3
25 + 26 rarr 27
27 rarr 25 + 26
26 + 27 rarr 28 + 29
932 x 10-3
363 x 10-5
420 x 10-5
865
373
748
00180 -1566
This case study has shown that it is possible to identify the correct model
and kinetic parameters for a multistep chemical system using the computational
approach Interestingly this study has shown again that the overall error is very
similar in the top-ranked competing models meaning that the deciding factor
then becomes the number of model terms due to the AICC evaluation The data
inputted was at different temperatures and the kinetic parameter optimisation
proceeded smoothly when optimising reference k values and activation energies
directly An example kinetic plot showing the fit of the identified model to the
experimental data is shown in Figure 210 - this is the fourth experiment where
the starting concentrations were 1 M nitrile and 2 M hydroxide at 90 degC
97
Figure 210 The fit of the identified model and kinetic parameters to the generated
experimental data with starting concentrations of 1 M nitrile and 2 M hydroxide at 90 degC
Where x = nitrile x = amide x = carboxylic acid mdash = nitrile (ODE) mdash = amide (ODE) mdash
= carboxylic acid (ODE)
233 Case study SNAr kinetics
The final simulated case study involves a larger scale multistep system
where there are 6 species in a SNAr chemical setting 24-dichloropyrimidine
(starting material SM) 210 reacts with morpholine 211 to form either the 4-
substituted product 212 or the 2-substituted product 213 These products can
then further react with another equivalent of morpholine to produce the bis-
substituted product 214 Each of these reactions form hydrochloric acid 215
as a byproduct that is neutralised by an excess of base This system is shown in
Scheme 24
98
Scheme 24 The reaction of 24-dichloropyrimidine 210 with morpholine 211 to form the 4-
substituted product 212 and the 2-substituted product 213 and the subsequent bis-
substituted product 214
2331 Data acquisition
The multistep SNAr reaction model reported by Reizman and Jensen consists
of 4 second-order reactions These reactions were used to generate the ODEs
shown in eqn 226 - 231 The reported kinetic constants for these three steps
were
bull Step one log(A) = 34 M-1 s-1 Ea = 270 kJ mol-1
bull Step two log(A) = 35 M-1 s-1 Ea = 321 kJ mol-1
bull Step three log(A) = 49 M-1 s-1 Ea = 600 kJ mol-1
bull Step four log(A) = 30 M-1 s-1 Ea = 450 kJ mol-1
Three simulated data sets were generated at 90 degC by using eqn 27 to calculate
k values with the following initial concentrations
bull 1 M SM 210 22 M morpholine 211 0 M 4-substituted product 212 0
M 2-substituted product 213 0 M bis-substituted product 214 and 0 M
hydrochloric acid 215
bull 12 M SM 210 28 M morpholine 211 0 M 4-substituted product 212
0 M 2-substituted product 213 0 M bis-substituted product 214 and 0
M hydrochloric acid 215
bull 09 M SM 210 32 M morpholine 211 0 M 4-substituted product 212
0 M 2-substituted product 213 0 M bis-substituted product 214 and 0
M hydrochloric acid 215
99
119889[120784 120783120782]
119889119905= minus1198961[120784 120783120782][120784 120783120783] minus 1198962[120784 120783120782][120784 120783120783] eqn 226
119889[120784 120783120783]
119889119905= minus1198961[120784 120783120782][120784 120783120783] minus 1198962[120784 120783120782][120784 120783120783]
minus 1198963[120784 120783120784][120784 120783120783] minus 1198964[120784 120783120785][120784 120783120783]
eqn 227
119889[120784 120783120784]
119889119905= 1198961[120784 120783120782][120784 120783120783] minus 1198963[120784 120783120784][120784 120783120783] eqn 228
119889[120784 120783120785]
119889119905= 1198962[120784 120783120782][120784 120783120783] minus 1198964[120784 120783120785][120784 120783120783] eqn 229
119889[120784 120783120786]
119889119905= 1198963[120784 120783120784][120784 120783120783] + 1198964[120784 120783120785][120784 120783120783] eqn 230
119889[120784 120783120787]
119889119905= 1198961[120784 120783120782][120784 120783120783] + 1198962[120784 120783120782][120784 120783120783]
+1198963[120784 120783120784][120784 120783120783] + 1198964[120784 120783120785][120784 120783120783]
eqn 231
2 relative error was then added to these simulated data sets then used
as the inputted experimental data for the computational approach These data
sets can be found in Chapter 723
2332 Results and discussion
From these 6 species there are 16 mass-balance-allowed reactions that can
be identified shown in eqn 232 - 247 All possible reaction models were
generated subject to eqn 24 which resulted in 65535 unique models to be
evaluated by the approach
213 rarr 212 eqn 232
212 rarr 213 eqn 233
210 + 211 rarr 212 + 215 eqn 234
212 + 215 rarr 210 + 211 eqn 235
210 + 214 rarr 212 + 212 eqn 236
210 + 211 rarr 213 + 215 eqn 237
211 + 212 rarr 214 + 215 eqn 238
100
212 + 212 rarr 210 + 214 eqn 239
214 + 215 rarr 211 + 213 eqn 240
213 + 215 rarr 210 + 211 eqn 241
211 + 213 rarr 214 + 215 eqn 242
210 + 214 rarr 212 + 213 eqn 243
210 + 214 rarr 213 + 213 eqn 244
214 + 215 rarr 211 + 212 eqn 245
212 + 213 rarr 210 + 214 eqn 246
213 + 213 rarr 210 + 214 eqn 247
All 65535 models were evaluated by the computational approach which
incurred a computation time of 52 hours (see Chapter 761 for details on
computer specifications) Each of these models were ranked based on their
AICC and it was found that the highest ranked model was also the correct model
with kinetic parameters optimised to values that were very close to the generated
values As in the nitrile hydrolysis case study Chapter 232 this optimisation is
assumed to be correct as the error in the fitted parameters is negligible
considering that artificial error was added to the dataset The top three
performing models are shown in Table 23 where the optimised k values are
shown as well as their corresponding SSE and AICC values
Table 23 A table showing the top three ranked models for the SNAr case study The kinetic
parameters for each reaction within the model is shown as well as the SSE and AICC
evaluation
Model
rank Model kx M-1 s-1 SSE M AICC
1
210 + 211 rarr 212 + 215
210 + 211 rarr 213 + 215
211+ 212 rarr 214 + 215
211 + 213 rarr 214 + 215
032945
007686
000018
000037
00024 -2112
2
210 + 211 rarr 212 + 215
210 + 211 rarr 213 + 215
211+ 212 rarr 214 + 215
032948
007679
000018
00024 -2086
101
211 + 213 rarr 214 + 215
213 + 215 rarr 210 + 211
000033
000004
3
210 + 211 rarr 212 + 215
210 + 211 rarr 213 + 215
211+ 212 rarr 214 + 215
211 + 213 rarr 214 + 215
210 + 214 rarr 213 + 213
032949
007672
000018
000036
015890
00024 -2085
This final simulated case study has shown that it is still possible to identify
the correct reaction model and kinetic parameters for a more complicated
multistep chemical system even when there are several thousand models to
consider Many of these models are very similar and the top-ranked competing
models contain the four model terms that are appropriate as well as typically
one other model These models are top-ranking because the additional terms
are optimised by the algorithms to either have a negligible effect on the output
or to minimise the error in the kinetic fitting to a certain extent It is then the role
of the AICC evaluation to determine whether these additional model terms are
producing a significant effect in order for their consideration in the correct
reaction model In this case the SSE value was unchanged among the top-
ranked competing models meaning that the deciding factor then became the
number of model terms An example kinetic plot showing the fit of the identified
model to the experimental data is shown in Figure 211 - this is the first
experiment where the starting concentrations were 1 M 24-dichloropyrimidine
and 22 M morpholine at 90 degC
102
Figure 211 The fit of the identified model and kinetic parameters to the generated
experimental data with starting concentrations of 1 M 24-dichloropyrimidine and 22 M
morpholine at 90 degC Where x = 24-dichloropyrimidine x = 4-substituted product x = 2-
substituted product x = bis-substituted product mdash = 24-dichloropyrimidine (ODE) mdash =
4-substituted product (ODE) mdash = 2-substituted product (ODE) mdash = bis-substituted
product Graph is only shown to 260 minutes to show curvature of the initial data points
24 Conclusion
It has been shown that a computational approach to kinetic modelling
loosely based on work by Tsu et al can be programmed in MATLAB This
approach takes chemical species information as well as experimental datasets
to identify both the correct reaction model and kinetic parameters for the
chemical process by utilising optimisation algorithms and statistical analysis
This approach has been proven to work successfully for three simulated case
studies of varying optimisation difficulty with different sets of experimental data
inputs with varying artificial errors The success shown from these studies
inspires confidence that the approach can be implemented with real
experimental data and be used as an effective tool in process development to
automatically identify the correct model and kinetic parameters of various
103
chemical systems The next step is to prove the efficiency of this approach
alongside real experimentation
Chapter 3 Experimental applications of the computational
approach to kinetic model and parameter determination
31 Introduction
With the development of the computational approach completed and
verified with multiple simulated case studies the viability of the approach on real
experimental data must also be tested This experimental application can utilise
data from any source to determine the most likely reaction model and kinetic
parameters but for reasons that shall be discussed further all experimentation
for this chapter was conducted using an automated continuous flow reactor
platform
There is a long history of conducting and analysing chemical and enzymatic
kinetics using flow techniques with the first reported case published around 100
years ago by Hartridge et al as a means to study very fast reactions[205] During
this time many different processes analytical methods and experimental setups
have been reported here citing only a few[206-209] A widely regarded essential
requirement for kinetic experiments however is for the reaction system to
operate in a turbulent flow regime[210] Turbulent flow leads to fast continuous
mixing and can be predicted by calculating the Reynolds number Re in eqn
31
Where
bull Re = Reynolds number
bull ν = average flow velocity
bull d = tube diameter
bull ρ = fluid density
bull η = fluid viscosity
119877119890 = 120584119889120588
120578 eqn 31
104
Using the unitless Reynolds number the flow regime can be predicted to be
turbulent[210] when Re exceeds 2000 or laminar[211] when Re is less than 2000
These regimes are illustrated in Figure 31a and 31b respectively Under laminar
flow conditions there is a parabolic velocity profile - meaning that the flow
velocity at the centre of the tube is double the average velocity due to friction on
the walls of the tubing known as dispersion This dispersion was originally
thought to blur the time axis leading to a substantial distortion of the observed
kinetics and hence meaningful kinetic experiments under these conditions might
be impossible[212]
Figure 31 A diagram to show the direction and flows within a flow regime where a) laminar
flow b) turbulent flow
Interestingly these assumptions remained untested until a number of
reported kinetics works from the Douglas group showed that accurate kinetic
experiments could be conducted under laminar flow conditions[213-215] The
Reynolds numbers for the experiments conducted ranged between 28 and 85
implying laminar flow However the kinetics monitored in these systems agreed
very well with results obtained conventionally by stopped-flow methods Further
work suggests that molecular diffusion has a very significant role and under
certain circumstances it can be a good approximation to neglect the effects of
laminar flow ie for particular flow velocities with given internal diameters[212 216]
With this approximation the kinetics can then be analysed as if the tubular flow
was homogeneous which can lead to accurate kinetic studies even in laminar
flow regimes
105
In many continuous flow settings for micro- or meso-flow volumes it is
typically simpler to adopt an idealised plug flow reactor model This model states
that each infinitely thin section of flow known as a plug travels in the axial
direction of the reactor and is perfectly mixed in the radial direction only where
a uniform distribution of the reactor concentrations occurs This means that the
residence time of the plug is a direct function of the length of the tubular reactor
and the velocity of the fluid This is shown in Figure 32 This model is commonly
employed to simplify tubular mixing and remains an accurate approximation for
kinetic measurements[37] All kinetic experiments by other authors covered in this
introduction employ this model and further experimentation as part of this project
also utilises this model - this is discussed further in Chapter 32
Figure 32 A plug flow reactor model where there is perfect mixing in the radial direction but
no forward or backward mixing in the axial direction Plugs 1 and 2 are examples of the
infinitely short plugs existing within this reactor model
Many of the advantages of continuous flow chemistry as previously
stated in Chapter 11 are also particularly attractive for running kinetic
experiments Increased heat and mass transfer[217 218] ensures that the reaction
is well controlled meaning that it can be asserted with confidence that the
experimental conditions applied to it are truly experienced by the reaction
medium Precise reagent control arises out of utilising flow chemistry as specific
flow rates allow accurate addition of chemicals at various points within the reactor
system[22 23 35] - this is very important when deducing the order of the species
106
within a system as reagent stoichiometry is present in exact quantities Coupling
of flow reactor platforms with quantitative analysis such as UV HPLC or GC
also unlocks automation capabilities[6 219] where multiple experiments can be
queued for the system to run autonomously The increased safety[220] the
efficiency of operating at reaction temperatures above the boiling point of the
solvent[221 222] and the ability to run and analyse extremely fast reactions[223 224]
means that flow experiments can be run that would otherwise be very difficult or
impossible to run in a batch system For these reasons it is more desirable in
particular circumstances to run kinetic experiments in flow rather than more
traditional batch kinetic experiments whereby sampling occurs throughout the
progression of a single reaction These advantages will be exploited throughout
these experimental acquisitions of data
The main disadvantage to kinetic modelling in flow systems however is
the necessity of the system to reach lsquosteady-statersquo Steady-state simply refers to
the state in which the reactor is in where the responses from the system are a
direct consequence of the conditions applied to it This is an important distinction
because as the reaction parameters are changed a certain amount of time is
then required for those reaction parameters to be applied to the system to
achieve a consistent output[225] This can be very wasteful as a system typically
needs approximately 15 - 3 reactor volumes of reagent in the acclimation to
steady-state prior to each measurement[226] This wastes a lot of precious
reaction material as well as time as the time taken to reach steady-state is in
direct relation to the residence time required ie a 15 minute residence time
results in up to a 45 minute wait for steady-state
Kinetic experiments in flow have been performed in this way for a long
time as the advantageous properties of continuous flow chemistry were worth
the wastage from the steady-state measurements However in recent years
deviations from these conventional techniques have become more popular that
take advantage of the transitionary period between two steady-state
measurements This is because during this period transient reaction information
is available but is otherwise lost because of traditional sampling methods
However if the pump flow rates are manipulated to structure this transient data
in a way that can be translated to regular time-series data an entire reaction
profile can be mapped very quickly and efficiently This then negates the need
107
for multiple steady-state measurements and rectifies this flow chemistry
disadvantage as kinetic profiles can be obtained with minimal material
The first transient flow method reported by Mozharov et al[96] is an
instantaneous step change in the flow rates where the reaction initially takes
place at a low flow rate F1 and then the flow rate is increased by an order or
magnitude to F2 This high flow rate then pushes out the transient data profile of
the reaction medium whilst the liquid is monitored by an in-line analysis
technique sensitive enough to detect a change in product concentration for
example Raman spectroscopy as reported by the authors Using this in-line
technique many measurements are taken in short time intervals to generate a
reaction profile from which kinetic information can be derived This is possible
as the magnitude of F2 the experimental times of the analytical measurements
(tn) and the dimensions of the flow path in the system are known therefore the
reaction profile along the microreactor capillary can be recreated and plotted
This concept is depicted in Figure 33 with the corresponding equation shown in
eqn 32 to convert the species concentration in experimental time to the species
concentration in residence time This conversion then maps the kinetic profile of
the chemical process between the calculated residence times
Figure 33 A depiction of how a kinetic experiment can be run utilising a step change in flow
rates between two steady-states (I and II) allowing time-series data to be plotted from
transient data Figure adapted from Mozharov et al[96]
120591 = 119905211986521198651minus 1199051198652 minus 11986511198651
eqn 32
108
Where
bull τ = residence time of the reaction medium
bull t = experimental time experienced by the reactor
bull t2 = experimental time taken to reach steady-state
bull F1 = initial flow rate
bull F2 = higher flow rate that the pumps are instantaneously changed to
This concept was also used experimentally as a means to test the
accuracy of the technique in relation to conventional steady-state
measurements The base catalysed Knoevenagel condensation between
benzaldehyde 31 and ethyl cyanoacetate 32 alongside the base 33 to form
the corresponding adduct 34 is shown in Scheme 31 The corresponding
kinetic profiles were generated by conventional sequential steady-state
measurements in Figure 34 and by the described step-change methodology in
Figure 35 where the reaction proceeded at a low flow rate before a sudden step
change to a higher flow rate It is shown that the two sets of time-series data are
very comparable however the step-change methodology has many
advantages This technique can determine a kinetic profile from only one
experiment with a much lower consumption of reagents and significantly
reduced experimental time
109
Scheme 31 The base catalysed Knoevenagel condensation between benzaldehyde and ethyl
cyanoacetate to form 34
Figure 34 A kinetic profile generated from the Knoevenagel condensation shown in Scheme
31 where kinetic information was obtained by measuring conversation at given
residence times at steady-state at two temperatures Steady-state markers x are
shown as part of the lsquoA Modelrsquo Reproduced with permission
110
Figure 35 A kinetic profile generated from the Knoevenagel condensation shown in Scheme
31 where kinetic information was obtained using a flow rate step-change at two
temperatures Steady-state markers x are shown as part of the lsquoA Modelrsquo where step-
change markers o are shown as part of the lsquoB Modelrsquo Reproduced with permission
The main critique of this technique as stated in the original publication is
that the step increase in flow rate is never perfect as the system always needs
time to speed up to the higher flow rate therefore the exact function F(τ) during
this transitional period is uncertain[96] This non-ideality is caused by several
experimental factors such as non-rigidity of the tubing walls and the syringe
preventing an immediate change in both the flow rates and the pressure profile
throughout the system[227]
Moore and Jensen[227] then reported a new concept that involves a
controlled ramp instead of a step change which leads to less uncertainty in the
determination of the residence times leading to greater accuracy in the time-
series data This therefore also leads to greater accuracy in the kinetic
parameters obtained from the experiment This report introduced the concept of
ldquopseudo-batchrdquo reactors referring to each fluid element passing through the flow
reactor in a time that is unique which can be thought of as many successive
pseudo-batch reactions This concept is shown in Figure 36
Figure 36 A depiction of how a continuous flow reactor may be described as a series of
sequential pseudo-batch reactors where the colour represents the extent of conversion
from low (green) to high (red) Q represents the total flow rate ti represents the initial
time of each pseudo-batch reactor entering the reactor tf represents the final time tm is
the time at which the concentration is actually measured by the IR probe Reproduced
with permission
This controlled ramp method results in a more predictable and accurate
residence time profile when compared to the step change method as the
residence time uncertainty decreases as well as a greater sampling rate with a
data density 10-fold higher than previously reported in Mozharov et alrsquos
technique This was shown experimentally in Scheme 32 in the Paal-Knorr
reaction of 25-hexanedione 35 and ethanolamine 36 generating 37 whilst
constantly monitored by an in-line IR probe This greater data density also
reduces the error within the kinetic profiles generated whilst still agreeing with
111
kinetic profiles generated purely from steady-state measurements as shown in
Figure 37 where these datasets are shown to be very precise and reproducible
Scheme 32 The Paal-Knorr reaction of 25-hexanedione 35 and ethanolamine 36 to yield
37 to show how the kinetics of a process can be observed by using a controlled ramp
technique
Figure 37 A combination of the kinetic models for the reaction yielding 37 in Scheme 32
where the differing colours represent different values of S where S is a corrective
residence time multiplier to show the reproducibility of the controlled flow ramp
methodology S = 14 (blue) S = 13 (red) S = 12 (green) S= 23 (orange) steady-state
experiments = x Reproduced with permission
Controlled ramps have now been reported many times because of the
experimental advantages that they possess[225 228] They feature all of the
advantages of conventional flow chemistry as reported earlier in this
introduction without the disadvantages that arise from typical steady-state
sampling This allows users to generate accurate data-rich kinetic information
from a process whilst using minimal material and time This methodology will
112
feature heavily in the data acquisition portions of this chapter as we opted to use
controlled ramps for all of our experimentation to exploit these advantages
More recently further efficiency has also been realised by the
combination of temperature gradients[229] with controlled flow ramps[146 230-232]
This allows for the fitting of kinetic parameters including activation energies to
a non-isothermal dataset obtained from one flow experiment This methodology
therefore results in even less material and time consumption as all kinetic
parameters can be determined from one flow experiment Although this relatively
new technique has only been reported for very simple systems it represents an
advancement in performing exceptionally efficient kinetic experiments using
continuous flow
32 Experimental setup
All flow experiments were conducted using a tubular reaction vessel built
in-house consisting of a 116rdquo OD (132rdquo ID) stainless steel tubing coiled around
a cylindrical aluminium heated block Reagents were pumped using JASCO
PU980 dual piston HPLC pumps and flow streams were mixed using Swagelok
SS-100-3 tee-pieces Sampling was conducted by using a VICI Valco EUDA-
CI4W5 sample loop with a 05 microL aliquot volume This results in small aliquots
of reaction mixture automatically transferring to the HPLC for on-line analysis
The reaction system was maintained under a fixed back pressure using an
Upchurch Scientific 1000 PSI back pressure regulator Quantitative analysis was
performed using an Agilent 1100 series HPLC instrument fitted with a Sigma
Ascentis Express C18 reverse phase column (5cm x 46mm 27 microm) In all
experiments biphenyl was added to one reservoir as an internal standard This
experimental setup is shown in Figure 38
113
Figure 38 A photograph of the automated continuous flow reactor used for this work
Previous work using this experimental setup has shown that transient flow
experiments show an error of less than 4 in the observed rate constants due
to dispersion whilst steady-state experiments show an absolute error of 05
and a relative error of 024 [233 234] Therefore when considering the kinetic
simulations in these studies a plug flow model was adopted If we consider the
general axial dispersion plug flow reactor model[235] in eqn 33
Erstwhile studies by Hone[225] on our reactor platform and similar investigations
by Jensen[230 236 237] using a comparable system have found that dispersion only
introduces a small deviation from plug flow Given this eqn 33 can be simplified
to ignore the second order term to give eqn 34 - 36 This plug flow reactor
design equation can be utilised to model each species in the reaction with
respect to residence time
Where
bull DR = axial dispersion coefficient
11986311987711988921198621198941198891199112
minus 119906119889119862119894119889119911+ 119903119894 = 0 eqn 33
119906119889119862119894119889119911= 119903119894 eqn 34
120591 =119911
119906 eqn 35
119889119862119894119889120591= 119903119894 eqn 36
114
bull Ci = molar concentration of species i
bull z = the length along the reactor
bull u = superficial velocity
bull ri = rate of reaction of species i
For each chemical process concentration-time data is collected by using
linear flow ramp gradients with on-line HPLC analysis Steady-state is initially
achieved within the system then sampling begins during the controlled ramping
to the next steady-state condition capturing the transitory information This is
shown in Figure 39 At least two flow ramp experiments at different temperatures
are conducted with HPLC sampling every 2 - 4 minutes depending on the length
of the HPLC method The residence time is then calculated for each sampling
point using eqn 37 to translate this transient data to a time-series dataset
Figure 39 A mathematically correct representation of how linear gradient flow ramps can be
utilised to sample with a high data density on the initial curvature of the kinetic plot
Where diams = data point Tn = experiment temperature Q = total flow rate Time = time the
reaction has been running τ = residence time that the reaction mixture experiences
Where
bull τ = residence time
bull α = deceleration of flow rate
120591 = 119886 ∙ 119905 minus 1205830 +radic(1205830 minus 119886 ∙ 119905)2 + 2 ∙ 119871 ∙ 119886
119886 eqn 37
115
bull μ0 = initial flow rate
bull t = experiment time
bull L = reactor volume
33 Case study Phenyl acetate
The first reaction system explored using the computational approach was
the presupposed model of the reaction of phenol 38 with acetyl chloride 39
to form phenyl acetate 310 and hydrochloric acid 311 shown in Scheme 33
This first experimental verification of the approach was a final validation of the
approach by selecting a simple example with few chemical species The goal of
this study was to confirm the presupposed model shown in Scheme 33 as well
as identify the kinetic parameters for this process The validity of the controlled
ramp method would also be determined based on comparisons of the
experimental data with steady-state measurements Full experimental details
including the preparation of the feed solutions experimental setup flow ramping
rates HPLC analysis and raw data can be found in Chapter 731
Scheme 33 The reaction of phenol 38 with acetyl chloride 39 to form phenyl acetate 310
and hydrochloric acid 311
The kinetic data was obtained using the controlled ramp methodology at
two temperatures 65 degC and 75 degC and the four participating species were
inputted into the computational approach Based on these four species only two
reactions were calculated to be possible based on mass balance - these are
shown as the forward reaction eqn 38 and the backward reaction eqn 39
which are two of the three possible models that were generated The third model
shown as eqn 310 is the combination of these two allowed reactions resulting
in an equilibrium reaction model
Forward 38 + 39 rarr 310 + 311 eqn 38
116
Backward 310 + 311 rarr 38 + 39 eqn 39
Equilibrium 38 + 39 310 + 311 eqn 310
These three models were then each evaluated automatically by the
approach based on how well the simulated ODE curves converge to the time-
series data obtained from the controlled ramps The k values SSE error metric
and the AICC evaluation for each of the models is shown in Table 31 This data
represents a similar scenario to the simulated benzoic acid esterification case
study shown in Chapter 231 where the identified most likely model has a similar
error to another model but with more model terms The forward reaction model
fits both temperature datasets very well whilst the backward reaction model
does not fit to the experimental data at all as there is no direction in the
parameter space from the initial guess that the optimisation algorithm can travel
to make a favourable change in the convergence to the data The equilibrium
model fits the data equally as well as the forward model as it sets the backward
rate constant to be negligible leading to a low SSE However as this second
term adds no value in further lowering the SSE it is an unfavourable addition in
terms of the AICC evaluation which prefers more simplistic models and is
therefore considered a less appropriate model than the forward reaction term
alone
Table 31 Evaluation of the feasibility of each reaction model for the phenyl acetate study
By only inputting the species involved in the reaction then running two
controlled flow ramps with the automated computational approach described the
intuitive reaction model was confirmed and the kinetic parameters were
determined as k75 degC = 1045 x 10-3 plusmn 042 x 10-3 M-1 s-1 Ea = 693 plusmn 78 kJ mol-1
This combination of the correct reaction model and kinetic parameters allowed a
Reaction Model
k Values x 10-3 M-1 s-1
SSE M AICC Evaluation
65 degC 75 degC
Forward 515 1045 0019 136
Backward - - 0532 803
Forward +
Backward
515
0
1045
0 0019 1636
117
fit to the experimental data with an average residual of less than 3 x 10⁻³ M and
is shown in Figure 310 where the colours of the data and fitted ODEs mimic the
colours shown in Scheme 33 This study has shown that the transition from
simulated to real experimental data does not affect the accuracy of the approach
and that the approach can be applied to experimental data with confidence that
the correct reaction model is to be identified
Figure 310 Kinetic profiles for two flow ramp experiments at 65 degC and 75 degC where x =
phenol x = phenyl acetate mdash = phenol (ODE) mdash = phenyl acetate (ODE)
The equivalent temperature and residence time kinetic profiles were also
mapped by performing a series of conventional steady-state experiments to
ensure that a transient-flow regime remained accurate in model and parameter
determination Results showed excellent agreement in plotted curvature and
confirmed the same reaction model to be the most likely whilst identifying very
comparable kinetic constants Figure 311 shows a comparison of the two
sampling methodologies for this particular reaction See Chapter 7315 for
further details
118
Figure 311 Graphs showing the agreement between steady-state and flow ramp
measurements for the reaction of phenol with acetyl chloride where curves are fitted to
the steady-state data Where = phenol (steady-state) x = phenol (flow ramp) =
phenyl acetate (steady-state) x = phenyl acetate (flow ramp)
34 Case study Paracetamol
The next reaction system that was explored was the chemical system
producing paracetamol whereby 4-aminophenol 312 reacts with acetic
anhydride 313 to form paracetamol 314 and the over-reacted diacetamate
impurity 315 shown in Scheme 34 as the intuitive sequential reaction This
reaction system serves as the first real experimental multistep reaction that is
studied by this approach in order to determine the correct reaction model and
kinetic parameters However as there is a large disparity between the reaction
kinetics of step one and two quantitative kinetic analysis of both processes
simultaneously ie during a single ramp was not possible Therefore two sets
of differing temperature ramps were performed to investigate independently the
formation of paracetamol and diacetamate at 3060 degC and 160180 degC
respectively Each of these ramps differ in reactor size and hence residence
times as well as starting concentrations of acetic anhydride This was performed
to illustrate the capability of the approach to handle data from a variety of sources
whilst still accurately determining the kinetic properties of a process
Scheme 34 The reaction of 4-aminophenol with acetic anhydride to form paracetamol in step
one followed by a further reaction with acetic anhydride to form diacetamate in step two
Based on the five species identified including the acetic acid 316
formed with each reaction of acetic anhydride there were six reactions that were
calculated to be possible based on mass balance These reactions are shown
as eqn 311 - 316
312 + 313 rarr 314 + 316 eqn 311
119
314 + 316 rarr 312 + 313 eqn 312
314 + 313 rarr 315 + 316 eqn 313
315 + 316 rarr 314 + 313 eqn 314
312 + 315 rarr 314 + 314 eqn 315
314 + 314 rarr 312 + 315 eqn 316
Interestingly some of the mass-balance-allowed reactions identified by
the ILP optimisation seem very unlikely to happen based on chemical intuition
The reaction of 4-aminophenol with diacetamate shown in eqn 315 for
example suggests that it is possible for this starting material to react with the
over-reacted product to form two equivalents of the desired product We know
from intuition that the ester bond is too strong to break and react without a
chemical stimulus so we may have initial speculations on the feasibility of this
reaction However it can never be stated with certainty that this reaction cannot
happen until its feasibility is studied and therefore all possible models are still
generated to be evaluated This is a major advantage of this approach that
reactions and models that may otherwise be discarded due to chemical bias are
automatically evaluated without a chemistrsquos input This could lead to unexpected
(but statistically and chemically accurate) models that describe time-series data
which can lead to better process efficiency and even discover new reactions
63 potential models were identified from the five reactions and the
reaction model shown in Scheme 34 was determined to be the most likely
representation of the system by AICC The approach also determined the kinetic
parameters of step one k60 degC = 645 plusmn 026 M-1 s-1 Ea = 32 plusmn 12 kJ mol-1 and
step two k180 degC = 427 x 10-2 plusmn 017 x 10-2 M-1 s-1 Ea = 979 plusmn 65 kJ mol-1 by
fitting k values to each dataset in the kinetic fitting stage of the approach These
values us to assert that step one will likely be very fast at a wide range of
temperature ranges and that step two has a higher sensitivity to changes in
temperature when the energy of the system increases This identified model
alongside the identified kinetic parameters fits to the experimental data very
accurately with an average residual of less than 1 x 10⁻⁴ M and is shown in
Figure 312 The top 5 ranked models are shown in Table 32 with their
respective SSE error metric and AICC evaluation
120
Figure 312 Kinetic profiles for four flow ramp experiments at 30 degC 60 degC 160 degC and 180
degC where x = 4-aminophenol x = paracetamol x = diacetamate mdash = 4-aminophenol
(ODE) mdash = paracetamol (ODE) mdash = diacetamate (ODE) See Chapter 732 for full
experimental conditions and raw data
Table 32 Evaluation of the feasibility of each reaction model for the paracetamol study
Rank Reaction Model
k values s-1 or M-1 s-1 SSE
x103 M
AICC
Evaluation 30 degC 60 degC 160 degC 180 degC
1 312 + 313 rarr 314 + 316
314 + 313 rarr 315 + 316
59082
-
64471
-
-
00129
-
00427 0295 1292
2
314 + 316 rarr 312 + 313
312 + 313 rarr 314 + 316
314 + 313 rarr 315 + 316
01599
59509
-
09120
67519
-
-
-
00125
-
-
00427
0293 3690
3
312 + 313 rarr 314 + 316
312 + 315 rarr 314 + 314
314 + 313 rarr 315 + 316
59067
38065
-
64348
35719
-
-
-
00129
-
-
00428
0295 3692
4
315 + 316 rarr 314 + 313
312 + 313 rarr 314 + 316
314 + 313 rarr 315 + 316
23783
59188
-
27076
64641
-
00210
-
00130
00022
-
00430
0295 3692
121
5
314 + 314 rarr 312 + 315
312 + 313 rarr 314 + 316
314 + 313 rarr 315 + 316
00799
59258
-
02270
64833
-
-
-
00127
-
-
00425
0295 3692
Interestingly there are many reaction models that were found to have a
lower SSE error metric than the identified most likely model This is again where
the AICC ranking metric is used to great effect to balance the convergence to
experimental data as well as the simplicity of the model It is in these cases that
models that contain transformations discussed previously as very unlikely such
as in the rank 3 model that the terms are likely being used by the optimisation
algorithm to fit experimental noise For this reason this approach cannot be
completely autonomous and must require evaluation by a chemist when
observing the top rated models to be certain that the quality of the data assures
correct model determination - this was discussed in Chapter 225
This paracetamol study has shown that the approach can correctly identify
the reaction model and kinetic parameters for a multistep reaction using real
experimental data from different temperature flow ramps by inputted only the
observed species and time-series data As a side note - interestingly contrary to
common undergraduate laboratory experiment scripts[238] the over-reacted
diacetamate will not form in any measurable quantities in a conventional
undergraduate experiment Assuming that the reaction is similar in water to
acetonitrile the reaction doesnrsquot need refluxing and will go to full conversion of
paracetamol within seconds at room temperature Furthermore using the kinetic
parameters in this study and the recommended reflux temperature of common
laboratory manuals 100 degC and a typical 02 M reaction mixture of paracetamol
and acetic anhydride it would take approximately 12 years for the reaction to
achieve complete conversion to diacetamate
35 Case study Metoprolol
The final experimental case study that was explored was the chemical
system producing metoprolol whereby the epoxide starting material 317 reacts
with isopropylamine 318 to form metoprolol 319 which can further react to
form the bis-substituted impurity 320 shown in Scheme 35 Metoprolol is a
122
cardioselective beta-blocker commonly used for the treatment of hypertension
for which kinetic information would help in the process development stage of
manufacture at AstraZeneca This reaction system serves as the first real
experimental multistep reaction that is studied by this approach where parallel
reactions occur in tandem leading to a more difficult system for which to optimise
kinetic parameters and identify the correct reaction model
Scheme 35 The reaction of the epoxide starting material with isopropylamine to form
metoprolol as well as the overreaction to form the bis-substituted product
Two sets of two-temperature flow ramps were run on parallelised flow
reactor platforms one set in our lab in Leeds (190210 degC) and one set at
AstraZenecarsquos lab in Macclesfield (130150 degC) The two reactor platforms differ
in equipment specification and reactor volume and the two experimental sets
differ in temperatures and starting concentrations This parallelisation of
experiments on different systems was performed to further confirm the
reproducibility of this flow ramp methodology as corroborating data can be
achieved by an operator on separate reactor systems in different locations The
experimental results were then combined and the computational approach was
applied Full details of experimentation can be found in Chapter 7331
Based on the four species identified there were six reactions that were
calculated to be possible based on mass balance These reactions are shown
as eqn 317 - 322
317 + 318 rarr 319 eqn 317
319 rarr 317 + 318 eqn 318
319 + 317 rarr 320 eqn 319
320 rarr 319 + 317 eqn 320
123
319 + 319 rarr 318 + 320 eqn 321
318 + 320 rarr 319 + 319 eqn 322
63 reaction models were generated which correspond to every possible
combination of these allowed reactions and each of them were evaluated
sequentially by the approach The reaction model shown in Scheme 35 was
identified as the most likely representation of the system by AICC and the kinetic
parameters for the formation of metoprolol were found to be k170 degC = 0286 plusmn
0012 M-1 min-1 Ea = 724 plusmn 29 kJ mol-1 and for the formation of the bis-
substituted product k170 degC = 0019 plusmn 0001 M-1 min-1 Ea = 750 plusmn 30 kJ mol-1
This identified model alongside the kinetic parameters fit to the experimental data
very accurately with an average residual of less than 2 x 10⁻³ M and is shown
in Figure 313 The top 5 ranked models are shown in Table 33 with their
respective SSE error metric and AICC evaluation
Figure 313 Kinetic profiles for the flow ramp experiments at 130 degC 150 degC 190 degC and 210
degC where x = starting material x = Metoprolol x = bis-substituted product mdash = starting
material (ODE) mdash = Metoprolol (ODE) mdash = bis-substituted product (ODE) See Chapter
733 for full experimental conditions and raw data
124
Table 33 Evaluation of the feasibility of each reaction model for the metoprolol study
Rank Reaction Model
Kinetic parameters SSE
x10 M
AICC
Evaluation k170 degC min-1 or
M-1 min-1 Ea kJ mol-1
1 317 + 318 rarr 319
319 + 317 rarr 320
02857
00191
7242
7500
01212 -31145
2 317 + 318 rarr 319
319 rarr 318 + 320
03065
00260
7569
6552
01252 -30961
3
317 + 318 rarr 319
319 rarr 317 + 318
317 + 319 rarr 320
03008
00043
00188
7463
5379
7557
01188 -30768
4
317 + 318 rarr 319
319 + 317 rarr 320
320 rarr 319 + 317
02858
00202
00158
7245
8216
4920
01209 -30669
5
317 + 318 rarr 319
319 + 317 rarr 320
318 + 320 rarr 319 + 319
02857
00191
00003
7242
7508
4898
01212 -30653
The reference k values and activation energies were fitted directly in the
kinetic fitting stage of the approach and the experimental dataset was adjusted
to incorporate an artificial-zero time point which is a common practice when
fitting kinetics in order to assert an experimental lsquostart timersquo when concentrations
are known This can fix any fitting discrepancies that may occur as the first
measured time point may not be accurate - it is assumed however that all time
points following this first measurement are correct with respect to the first
measurement This is assumed only for the fitting of the kinetic parameters as
the parameters are likely to be more accurate In the case of this experiment
small deviations in asserting the time of the initial measurement may occur from
thermal expansion of the solvent because of the very high temperatures or from
pump flow rate errors
It has been shown in this study that it is possible to deconvolute reaction
pathways that are happening simultaneously using this computational approach
Differing-temperature experimental datasets were collected from different
125
experimental systems and collated to show that the correct model could be
identified even with data from different sources Kinetic parameters are also
identified from this approach that gives an excellent fit to the experimental data
This kinetic information can then be used to optimise this process between
given limits for temperature chemical equivalents and reaction time Using
current pricing for the starting material used in this work[239] other standard
industrial optimisation techniques would have been significantly more expensive
to implement When comparing this kinetic approach to other optimisation
methods steady-state kinetic measurements would have cost 24 more in
terms of material consumption and a screening and full factorial design of
experiments (DoE) optimisation would have cost 106 more - see Chapter
7336 for more details Then of course factoring in the cost of the time of the
chemist running the experiments (which hereby would be automated) and the
time for interpretation of the data and kinetics (which the approach elucidates)
this results in a significant reduction in labour time and overall cost which also
results in a more comprehensive overview of the possible kinetic models at play
36 Conclusion
It has been shown in this work that when real experimental time-series data
for a chemical process is available total process understanding can be achieved
without the need for high-level chemical intuition or human interference When
participating species are known or inferred complete sets of kinetic information
can be obtained via construction of all possible reaction models and identification
of their respective kinetic parameters This was undertaken by coupling an
automated flow reactor platform with a computational approach to deduce and
evaluate each kinetic model utilising optimisation algorithms After post-reaction
statistical analysis indicates which models are the most likely to be true based
on the experimental data provided which can be from batch or flow this
information can then be interpreted by a trained chemist to further differentiate
reaction pathways based on what should and should not be chemically possible
This approach has been proven to be powerful in determining the reaction
model and kinetic parameters in a variety of experimental circumstances The
approach will be particularly powerful in situations where the reaction model is
126
not completely understood for example when there are competing reaction
pathways The approach can be computationally expensive depending on the
number of possible reaction models although all of the optimisations carried out
by the approach on the work described was evaluated in less than 5 minutes on
a standard 4-core Intel i5-2310 processor However the added computational
cost is minimal compared to the reduction of time and experimental cost with
regards to kinetic evaluation Furthermore this approach can be run
automatically as bench scientists use their human resource for more challenging
tasks that cannot be automated
This work is the first implementation of the approach on experimental
time-series data and has been proven to efficiently interpret kinetic information
using minimal amounts of material to generate sufficient experimental data to
enable accurate model determination Using this methodology can considerably
outweigh the cost of further experimentation to discriminate speculated kinetic
models and can greatly reduce the time and cost barriers to full process
understanding
Chapter 4 The development of an improved computational
approach to kinetic model determination
41 Introduction
The aforementioned computational approach to kinetic model and
parameter determination as described in Chapter 2 and Chapter 3 is a powerful
tool for many experimental applications However there are two major limitations
to this tool The first limitation is in the reaction orders of the particular species
that are available - these orders are constrained to two integer orders 1 and 2
There are instances however where reactions can feature zero order reactions
or even have non-integer orders for which this approach currently cannot
facilitate and identify The second limitation is the inability of the approach to
model catalytic reactions and hence determine the reaction order of species
within a catalytic reaction As catalytic reactions are common in research
manufacturing and process development there are many applications where this
approach could ideally be utilised but is not currently applicable
127
Further development of the computational approach to rectify these
limitations can therefore increase its applicability greatly which further increases
the scope of the tool for chemical applications As the comprehensive model
evaluation aspect of this methodology has been proven to be effective for
determining correct reaction models the skeleton of the approach remains
unchanged This includes the two major steps of the approach model generation
and kinetic parameter fitting as well as the statistical measurements involved ie
AICC However although the basis for the approach remains the same many
structural changes of the programmed tool are necessary for the incorporation
of these new applications non-integer order models and catalytic models The
advancement of the approach to incorporate these changes makes it applicable
in almost all chemical processes which is the final step in answering the overall
research aim of the project to build an automated methodology to kinetic model
discrimination and parameter determination
42 Methodology advancement
421 Capabilities
When mass-balance-allowed reactions are identified by the approach
these reactions can then be compiled into a number of models that feature them
as discussed in Chapter 22 However there is a difference between an allowed
reaction based on the mass balance of the reactants and products and the rate
laws that govern the way that these species react All models are currently
compiled in a way that assumes a first order dependence on all species that are
featured Therefore for the mass-balance-allowed transformation of A to B as
shown in eqn 41 the rate law for the change in B is shown in eqn 42
A fundamental change to this methodology explores the same
transformation but using different reactivities by also investigating different
orders of the reacting species To explore different reaction orders including
non-integer reaction orders the rate law of the elementary reaction can be
described with differing powers of α shown in eqn 43 where α = 0 05 or 1
119860119896rarr119861 eqn 41
119889[119861]
119889119905= 119896[119860] eqn 42
128
This allows multiple chemical pathways to be explored that describe the
chemistry in different ways which were not available previously using this
methodology Each of the newly identified reactions are then treated as
lsquoavailablersquo reactions from which reaction models can be constructed in the same
way as described in Chapter 22 Therefore for each mass-balance-allowed
reaction identified by the approach that is lsquounimolecularrsquo there are 3
corresponding reaction orders possible and therefore 3 reactions that are added
to the pool of available reactions for kinetic model generation In the context of
this approach the transformation of a single mass-balance-allowed reaction to
every variant of its corresponding rate law is termed lsquoinflationrsquo
For lsquobimolecularrsquo reactions identified by the approach as mass-balancing
similar chemical descriptions can be written as with the lsquounimolecularrsquo reactions
For the reaction of A and B to form C there are multiple potential combinations
of the species orders α and β in the potential rate laws shown in eqn 44 and
45
These values of α and β can take the form of 0 05 1 as before However it is
extremely rare for two chemical species to react with a zero order dependence
on both species Therefore in an effort to lower the number of lsquoavailablersquo
reactions and hence lower the number of kinetic model evaluations necessary
these particular reactions are seen as unfeasible and are therefore not included
in the model generation stage This is also true of a zero order05 order
bimolecular reaction Therefore for every lsquobimolecularrsquo mass-balance-allowed
transformation identified by the approach there are 5 corresponding reactions
that are added to the pool of available reactions for kinetic model generation
This approach has also been modified to include catalytic reactions in the
model generation if the user selects the option to do so The user can select to
either include catalytic reactions or exclusively look at catalytic reactions (ie no
reactions can occur without a catalyst) As before all mass-balance-allowed
119889[119861]
119889119905= 119896[119860]120572 eqn 43
119860 + 119861119896rarr 119862 eqn 44
119889[119862]
119889119905= 119896[119860]120572[119861]120573 120572 + 120573 ge 1 120572 = 120573 ne 05 120572 120573 isin 0 05 1 eqn 45
129
transformations are identified then for the reaction of A and B to form C all
combinations of integer and non-integer catalytic reactions are generated within
the inflation step At this point the species that is user-selected to behave
catalytically is then incorporated into the rate laws For each mass-balance-
allowed (inflated) transformation the catalytic species can take the order of 05
1 or 2 and each of these rate law variations are constructed and added to the
pool of available reactions for kinetic model generation Note also that in these
catalytic reactions the dependence of the orders become empirical to a greater
extent whereby individual species are used and regenerated as opposed to
referring specifically to molecularity (ie number of species reacting together at
once) When catalytic reactions are included in model generation with the
selected catalytic species lsquoCatrsquo eqn 44 becomes eqn 46 and the general rate
law shown in eqn 45 becomes eqn 47 where γ = order of catalyst
All combinations of catalytic and non-catalytic reactions are generated For each
mass-balance-allowed lsquobimolecularrsquo reaction where catalytic variants are also
generated there are 15 possible corresponding reactions that are added to the
pool of available reactions for kinetic model generation This inflation step is
summarised qualitatively in Figure 41 showing how individual mass-balance-
allowed reactions can generate multiple transformations that are dependent on
different rate laws
119860 + 119861 + 119862119886119905119896rarr 119862 + 119862119886119905 eqn 46
119889[119862]
119889119905= 119896[119860]120572[119861]120573[119862119886119905]120574 120572 + 120573 ge 1 120572 = 120573 ne 05 120572 120573
isin 0 05 1 120574 isin 0512
eqn 47
130
Figure 41 An illustration of how the lsquoinflationrsquo step takes all mass-balance-allowed
transformations sequentially then deduces all allowed integer and non-integer orders
and generates corresponding rate laws for these transformations If catalytic reactions
are to be explored also rate laws for these catalytic dependencies are also generated
These transformations are all then saved from which full reaction models can be
constructed
These new capabilities incorporated into the overall computational
approach allow kinetic model determination for more complex chemical systems
for catalyticnon-catalytic processes with integer or non-integer orders This
approach can then be used as before whereby the chemical species and
experimental datasets are uploaded and the program runs an extensive kinetic
model evaluation loop followed by statistical analysis to determine the most
likely model However the major disadvantage to evaluating all possible models
generated after the newly incorporated inflation step is the huge computational
cost As the pool of available reactions is expanded greatly from simple mass-
balance-allowed reactions to all rate laws possibly governing these reactions
the number of possible models to be generated from these reactions grows
131
exponentially It is therefore not feasible with current technology to evaluate
every possible model However many of these possible models are also
unfeasible due to their inability to occur anyway Upon generation of a reaction
model the fitness of the model can be determined by employing simple and
appropriate logical and chemical constraints or rules These rules ensure that
generated models with an infeasibility to occur are identified and discarded
without the need for further evaluation and consumption of computational
resources
422 Rules
In order to evaluate only the models that are feasible a priori logical and
chemical rules must be applied to the available models to discard large numbers
of them as many models may feature redundant or impossible model terms
within them To postulate such rules requires logical yet simplistic
rationalisations of how reactions occur - rationalisations that seem obvious upon
realisation but are seldom taught or reported in the literature
To show the importance of these rules when running this approach
Scheme 41 shows a model reaction of maleic acid 41 reacting with methanol
42 to form the mono-product 43 and the di-product 44 which can be used
to show the number of models to be evaluated[240] In this reaction the maleic
acid is self-catalytic so this species behaves as both a starting material and a
catalyst Using these 5 species there are 6 possible mass-balance-allowed
reactions From these 6 reactions after inflation steps to look at all integer and
non-integer species dependencies and all catalytic and non-catalytic reactions
the total number of models to evaluate is gt1854900872 A specific number
cannot be quoted as just compiling this number of reaction models takes over
110 GB of memory and so an accurate estimate cannot be achieved with the
equipment available The evaluation of this number of models would likely take
several years to complete even when using high-performance computing
clusters It is therefore imperative that these rules drastically reduce the number
of models to evaluate to enable this methodology as a practical process
development application
132
Scheme 41 The self-catalysed reaction of maleic acid 41 and methanol 42 to form the
mono-product 43 and the di-product 44[240]
Rule 1 One variant of each reaction
There are many variations of the same elementary transformations to be
considered when building models for evaluation Examples of these variations
could be
bull A + B rarr C
bull A + B0 rarr C
bull A05 + B rarr C
bull etc
It is very unlikely however that the same reactants will undergo the same
chemical transformation to products with many different rate laws It would not
be expected that an elementary step would proceed in numerous ways in both
an overall second order and an overall first order manner to result in the same
product for example Therefore when compiling reaction models for evaluation
only one variant of each elementary reaction can be present in a single model
This also reduces the maximum number of model terms in a single model to the
total number of elementary reactions which in this example is 6 When this rule
is enforced during model generation for the model chemical system the total
number of models for evaluation is 8156735
Rule 2 Iterative model evaluations
Although it cannot be known what the lsquoaveragersquo number of model terms
in a lsquogeneralrsquo model is the assumption can be made that the user is investigating
a single synthetic step in a chemical process With a single synthetic step there
may be consecutive reactions and impurities formed but it would undoubtedly
be regarded as unlikely if any model was proposed with 30 model terms for
example In accepting this postulation it must therefore also be true that there is
a continuum of likelihood whereby a model will contain a certain number of model
133
terms especially when evaluated by AICC Therefore there must also exist a
limit of model terms that once reached it can be regarded that the corresponding
model is too unlikely to occur to be treated as a serious model candidate Without
a vast literature study it is not possible to know what this number should be and
this prospective study extends past the scope of this project - this discussion is
highlighted to simply introduce the concept of the existence of this upper limit of
model terms
Although this upper limit is unknown it is possible to start at a prospective
number of model terms then the user can decide if this number should be
increased based on the responses observed From chemical intuition based on
the findings of AICC values thus far in the project much of the data can be fitted
effectively with le 4 model terms and adding further model terms in general leads
to diminishing model evaluations This is of course a biased generalisation
based on the chemical systems that have been studied within the project
However using an initial upper limit of 4 model terms in the model generation
stage may be generally appropriate for single-step chemical systems - if this limit
does not give a satisfactory model that fits the supplied experimental data it can
be iteratively increased to 5 model terms then 6 etc As there are many models
that would require computationally expensive evaluations with over 4 model
terms this rule allows the user to determine if further evaluations with larger
models are necessary which could otherwise potentially waste computational
resources and more importantly time When this rule is enforced during model
generation in the model chemical system as well as the previous Rule 1 the
total number of models for evaluation is 668735
Rule 3 Catalytic reactions considered only
In order to reduce the number of available reactions from which to build
models and hence reduce the number of unnecessary model evaluations it is
assumed from the userrsquos input of a catalytic species that all mass-balance-
allowed reactions present will proceed only with a catalyst This is assumed due
to the available lower energy pathways in the presence of the catalyst This can
then be changed by user input if a suitable model is not found where the model
generation is re-run to incorporate reactions that both do and do not proceed
using the specified catalyst When this rule is enforced during model generation
134
as well as each previous rule the total number of models for evaluation in the
model chemical system is 173711
Rule 4 There must be at least one reaction from starting materials to products
As the starting concentrations are initially inputted into the system it can
be deduced which of the species are lsquostarting materialsrsquo In some instances there
may be species that are considered by the user to be the products of the reaction
at the first time point but in the context of this rule are also considered to be a
starting material For clarity this definition of lsquostarting materialrsquo refers only to
species that have mass in the initial concentrations The rule states that there
must be at least one term in the model that describes a decrease in the
concentration of one of the identified starting materials This logic-based rule
ensures with certainty that the models that are evaluated feature terms that
exhibit a change in concentrations Although seemingly obvious this rule is
necessary to remove these commonly occurring models that would only lead to
wasted computational resources
For example if there are four species in a chemical system (A B C D)
and their initial concentrations are 1 M 0 M 0 M and 0 M respectively the only
starting material identified is A Many models that are feasible according to mass
balance may not be feasible according to this rule as they may not exhibit a
change in concentration Table 41 shows some examples of allowed models
based on these starting concentrations that will progress onto the kinetic fitting
stage of the approach as well as disallowed models that will be discarded As
shown entries 3 and 4 will both feature a change in concentrations whereas
entries 1 and 2 will not and are hence discarded When this rule is enforced as
well as each previous rule the total number of models for evaluation in the model
chemical system is 121836
Table 41 A table showing examples of allowed and disallowed models according to Rule 4
Entry 1 2 3 4
Model B rarr C
B + B rarr D
B + B rarr D
D rarr A
A rarr D
B rarr C
A rarr B + B
B rarr C
Allowed
135
Rule 5 New lsquostarting materialsrsquo available from products
As an extension of Rule 4 relating to identifying lsquostarting materialsrsquo from
initial concentrations further starting materials can also be identified from the
products of these earlier reactions For example in entry 4 in Table 41 B is not
initially identified as a starting material However as A is a starting material
forming B as a product there is certain to be some concentration of B as time
progresses meaning that B can also be viewed as a starting material at some
point Therefore as starting materials in entry 4 are A and B both reactions in
this model are allowed because they both feature a change in concentration from
a starting material to another species
Under Rule 5 models that feature model terms incurring a decrease in
concentration from these newly identified starting materials only can be allowed
Therefore entry 4 will be a model that is progressed onto the model evaluation
stage However in entry 3 in Table 41 it can be noted that the initially identified
starting material (A) forms D as a product meaning that the starting materials in
this model are A and D The second model term features a reaction of B to form
C but this logic-based rule highlights that there is no possible scenario where B
will be formed in order to further react If this model were to progress onto model
evaluation it would certainly be an over-trained model and would rank lowly
according to an AICC evaluation as the second model term will not provide a
benefit to the model over just having the first model term alone Therefore under
Rule 5 entry 3 would be disallowed and not progress onto the model evaluation
stage thereby saving computational resources on this redundant model When
all rules are enforced including Rule 5 the total number of evaluations for the
model system is 98725
Final considerations for model generation
Other considerations were also made when compiling models in the
model generation stage specifically referring to the allowed orders of particular
species For catalytic species the allowed orders were determined to be 05 1
and 2 This is because the order in a catalytic species of a system being greater
than gt2 or =15 are too rare to warrant serious consideration and would incur a
significantly greater computational expense to evaluate all of the generated
models
136
Much thought was exercised as to whether a zero-order dependence on
a catalyst is possible as this discussion is missing from the literature and general
teaching It can be postulated that since the presence of a catalyst allows a more
favourable lower energy pathway there must therefore be some dependence on
the concentration of the catalyst for this lower energy pathway to progress This
rationalisation infers that it is not possible for a zero-order dependence of
catalyst but there may always be selected cases where this can be empirically
true In any case if a zero-order dependence of catalyst is possible it is too
unlikely to warrant serious consideration as this would generate many more
models to be evaluated
For non-catalytic systems this approach attempts to build reaction
models from base-level elementary reactions (where the both the stoichiometry
and order of participating species are 1 for each occurrence of the species in
the reaction scheme) However there are two notable exceptions 0 and 05
orders which are inherently more empirical in nature A zero-order dependence
on a particular species in this approach will still have a stoichiometry of 1
whereby one molecule of this species is consumed in the reaction but the
reaction rate does not depend upon its concentration A 05 order dependence
will have both a stoichiometry of 05 and an order of 05 There are many other
integer and non-integer empirical dependencies of varying stoichiometry and
order that are possible in complex chemical reaction networks (CRNs) However
these dependencies are very rare and not common enough to warrant serious
consideration for this computational approach as this would generate many more
models to proceed into model evaluation resulting in a much higher
computational expense Therefore reactions are only considered for model
generation with species that have orders in the rate laws of 0 05 or 1
423 Overview
This updated computational approach to kinetic model selection and
parameter identification was developed in MATLAB by adjusting the previously
developed tool reported in Chapter 2 and Chapter 3 Firstly the user inputs
experimental data and the participating species into the system The approach
identifies all possible reactions that can happen based on mass balance then
generates all conceivable rate laws subject to basic chemical intuition in the
inflation step (and subject to the user defining a catalytic species) Every
137
combination of these rate laws are then compiled into different reaction models
followed by logical rule enforcements to remove vast numbers of redundant or
wasteful models All remaining models are sequentially loaded then kinetic
parameters are optimised to increase convergence of ordinary differential
equation (ODE) curves to the experimental data Finally each model is then
statistically evaluated and ranked highlighting the most likely model based on
the experimental data supplied The approach overview is highlighted in Figure
42
Figure 42 An overview of the updated computational approach to kinetic model and
parameter determination
This updated methodology represents a significantly improved automatic
tool for process development by comprehensively evaluating every possible
model without the need for chemical intuition or more importantly chemistsrsquo
time This approach has been upgraded to allow both catalytic reactions and
reactions with non-integer orders to be identified therefore vastly expanding its
scope However it is still important to note that although this tool is powerful it
is ultimately data-driven and subsequently must only be used as a
complementary tool Therefore after all model evaluations the tool must still be
138
used in conjunction with real chemical intuition by an end user to determine that
the models identified as most likely are accurate and consistent with the science
43 Simulated verifications of the approach
In the same manner as the previous methodology it is first important to
verify that the approach identifies the correct models and kinetic parameters
before conducting any real experimentation Several simulated case studies
were conducted that feature different true kinetic models showing how this
methodology has been adapted to identify catalytic speciesrsquo orders as well as
non-integer and zero order species dependencies in chemical systems These
case studies feature reactions from the literature whereby simulated
experimental data is generated from known models and kinetic parameters
To simulate the experimental data as shown in Chapter 23 the true
model and kinetic parameters reported in the literature source are inputted into
MATLAB The experiments are then simulated at particular temperatures and
initial sets of concentrations by using an ODE solver to evaluate the change in
species concentrations over a given experimental timeframe Individual data
points are then extracted from this timeframe which then represent experimental
data points for the simulated case study Up to plusmn 2 relative error is then added
to each measurement to approximate this simulated data more closely to real
experimental data
431 Case study SNAr kinetics
The first simulated case study was the SNAr reaction described in Scheme
42 where 24-difluoronitrobenzene (starting material SM) 45 reacts with
pyrrolidine 46 to form either the ortho-substituted product 47 or the para-
substituted product 48 - both of which can then react further with pyrrolidine to
form the bis-substituted product 49 and form hydrofluoric acid 410 as a
byproduct in each step[225] This case study features lsquosimplersquo elementary
reactions in the true model as there are no non-integer or zero order
dependencies However this scenario is still important to study as the new
approach must still be able to correctly identify model structures and kinetic
parameters of systems that feature only these elementary reactions In this case
both the old approach and the new approach were run in order to determine if
139
they both arrive at the same identified model as they should This should confirm
that even in a multicomponent process the new approach will still identify the
correct elementary reactions instead of substituting non-integer or zero order
rate laws
Scheme 42 The reaction of 24-difluoronitrobenzene 45 with pyrrolidine 46 to form the
ortho-substituted product 47 and the para-substituted product 48 Consecutive
reactions then occur to form the bis-substituted product 49 In each reaction
hydrofluoric acid 410 is formed[225]
4311 Data acquisition
The multistep SNAr reaction model reported by Hone et al consists of 4
second-order reactions These reactions were used to generate the ODEs
shown in eqn 41 - 46 The reported kinetic constants for these three steps
were
bull Step one k90 degC = 0579 M-1 s-1 Ea = 333 kJ mol-1
bull Step two k90 degC = 0027 M-1 s-1 Ea = 353 kJ mol-1
bull Step three k90 degC = 0009 M-1 s-1 Ea = 389 kJ mol-1
bull Step four k90 degC = 0016 M-1 s-1 Ea = 448 kJ mol-1
Five simulated data sets were generated at 30 degC by using eqn 27 to calculate
k values with the following initial concentrations
bull 1 M SM 45 11 M pyrrolidine 46 0 M ortho-substituted product 47 0
M para-substituted product 48 0 M bis-substituted product 49 and 0 M
hydrofluoric acid 410
140
bull 08 M SM 45 15 M pyrrolidine 46 0 M ortho-substituted product 47
0 M para-substituted product 48 0 M bis-substituted product 49 and 0
M hydrofluoric acid 410
bull 1 M SM 45 2 M pyrrolidine 46 0 M ortho-substituted product 47 0 M
para-substituted product 48 0 M bis-substituted product 49 and 0 M
hydrofluoric acid 410
bull 1 M SM 45 25 M pyrrolidine 46 0 M ortho-substituted product 47 0
M para-substituted product 48 0 M bis-substituted product 49 and 0 M
hydrofluoric acid 410
bull 12 M SM 45 3 M pyrrolidine 46 0 M ortho-substituted product 47 0
M para-substituted product 48 0 M bis-substituted product 49 and 0 M
hydrofluoric acid 410
119889[120786 120787]
119889119905= minus1198961[120786 120787][120786 120788] minus 1198962[120786 120787][120786 120788] eqn 41
119889[120786 120788]
119889119905= minus1198961[120786 120787][120786 120788] minus 1198962[120786 120787][120786 120788] minus 1198963[120786 120789][120786 120788]
minus 1198964[120786 120790][120786 120788]
eqn 42
119889[120786 120789]
119889119905= 1198961[120786 120787][120786 120788] minus 1198963[120786 120789][120786 120788] eqn 43
119889[120786 120790]
119889119905= 1198962[120786 120787][120786 120788] minus 1198964[120786 120790][120786 120788] eqn 44
119889[120786 120791]
119889119905= 1198963[120786 120789][120786 120788] + 1198964[120786 120790][120786 120788] eqn 45
119889[120786 120783120782]
119889119905= 1198961[120786 120787][120786 120788] + 1198962[120786 120787][120786 120788]
+1198963[120786 120789][120786 120788] + 1198964[120786 120790][120786 120788]
eqn 46
2 relative error was then added to each data point in these simulated
data sets then used as the inputted experimental data for both the old and new
computational approach These data sets can be found in Chapter 741
4312 Results and discussion
As the initial ILP optimisation proceeds in the same manner for both the
old and new approaches the mass-balance-allowed reactions identified in each
case are the same It is only the subsequent rate laws and models that differ in
141
the model generation steps between the old and new approaches From the 6
species inputted there are 16 mass-balance-allowed reactions that were
identified shown in eqn 47 - 422
48 rarr 47 eqn 47
47 rarr 48 eqn 48
45 + 46 rarr 47 + 410 eqn 49
47 + 410 rarr 45 + 46 eqn 410
45 + 49 rarr 47 + 47 eqn 411
45 + 46 rarr 48 + 410 eqn 412
46 + 47 rarr 49 + 410 eqn 413
47 + 47 rarr 45 + 49 eqn 414
49 + 410 rarr 46 + 48 eqn 415
48 + 410 rarr 45 + 46 eqn 416
46 + 48 rarr 49 + 410 eqn 417
45 + 49 rarr 47 + 48 eqn 418
45 + 49 rarr 48 + 48 eqn 419
49 + 410 rarr 46 + 47 eqn 420
47 + 48 rarr 45 + 49 eqn 421
48 + 48 rarr 45 + 49 eqn 422
Old approach
When running the old approach every combination of the 16 identified
mass-balance-allowed transformations was constructed resulting in 65535
unique models to be evaluated All of these resulting models were evaluated by
the approach which incurred a computation time of 13 hours (see Chapter 762
for details on computer specifications)
Each of these models were ranked based on their AICC evaluation and it
was found that the highest ranked model was also the correct model with kinetic
parameters optimised to values that were very close to the literature values used
to generate the data As with previous simulations described in Chapter 23 the
142
optimisation is assumed to be correct as the error in the fitted parameters is
negligible considering that artificial error was added to the data set The top five
performing models are shown in Table 42 where the optimised k values are
shown as well as their corresponding SSE and AICC values
Table 42 A table showing the top five ranked models for the SNAr case study as identified by
the old approach The kinetic parameters for each reaction within the model are shown
as well as the SSE and AICC evaluation
Model
rank Model kx M-1 min-1 SSE M AICC
1
45 + 46 rarr 47 + 410
45 + 46 rarr 48 + 410
47 + 46 rarr 49 + 410
48 + 46 rarr 49 + 410
00656
00026
00007
00008
00040 -30627
2
45 + 46 rarr 47 + 410
45 + 46 rarr 48 + 410
47 + 46 rarr 49 + 410
48 + 46 rarr 49 + 410
45 + 49 rarr 47 + 48
49 + 410 rarr 46 + 48
00657
00026
00007
00010
00065
lt00001
00039 -30125
3
45 + 46 rarr 47 + 410
45 + 46 rarr 48 + 410
47 + 46 rarr 49 + 410
48 + 48 rarr 49 + 45
00657
00027
00007
00174
00044 -30097
4
45 + 46 rarr 47 + 410
45 + 46 rarr 48 + 410
47 + 46 rarr 49 + 410
48 + 46 rarr 49 + 410
45 + 49 rarr 47 + 48
00663
00028
00007
00010
00026
00042 -30053
5
45 + 46 rarr 47 + 410
45 + 46 rarr 48 + 410
47 + 46 rarr 49 + 410
48 + 46 rarr 49 + 410
00655
00026
00007
00009
00041 -29946
143
45 + 49 rarr 47 + 47
45 + 49 rarr 48 + 48
00143
00065
New approach
When running the new approach all allowed combinations of the mass-
balance-allowed reactions and corresponding non-integer and zero order rate
laws were compiled subject to the rules described earlier in Chapter 422 This
model generation resulted in 141505 unique models to be evaluated by the
approach which incurred a 28 hour computation time (see Chapter 762 for
details on computer specifications)
Each of these models were ranked based on their AICC and it was found
that the highest ranked model was also the correct model with kinetic
parameters optimised to values that were very close to the literature values that
were used to generate the data As highlighted in the old approach section the
optimisation is assumed to be correct as the error in the fitted parameters is
negligible considering that artificial error was added to the dataset The top five
performing models from this new approach are shown in Table 43 where the
optimised k values are shown as well as their corresponding SSE and AICC
values
Table 43 A table showing the top five ranked models for the SNAr case study as identified by
the new approach The kinetic parameters for each reaction within the model are shown
as well as the SSE and AICC evaluation α denotes a variable molar dependence within
the kinetic parameter units depending on the rate law
Model
rank Model kx Mα min-1 SSE M AICC
1
45 + 46 rarr 47 + 410
45 + 46 rarr 48 + 410
47 + 46 rarr 49 + 410
48 + 46 rarr 49 + 410
00656
00026
00007
00008
00040 -30627
2
45 + 46 rarr 47 + 410
46 + 47 rarr 49 + 410
480 rarr 47
47 rarr 48
00680
00007
00501
00394
00042 -30333
144
3
45 + 46 rarr 47 + 410
45 + 46 rarr 48 + 410
47 + 46 rarr 49 + 410
48 + 48 rarr 49 + 45
00657
00027
00007
00174
00044 -30097
4
45 + 46 rarr 47 + 410
45 + 46 rarr 48 + 410
47 + 46 rarr 49 + 410
48 + 41005 rarr 45 + 46
00640
00024
00007
00008
00061 -28521
5
45 + 46 rarr 47 + 410
47 + 46 rarr 49 + 410
47 rarr 48
48 rarr 47
00670
00007
00041
00997
00065 -28276
Discussion
This initial simulated case study has shown that it is still possible to identify
the correct reaction model and kinetic parameters with this new approach for a
lsquosimplersquo reaction system featuring a first-order dependencies on all species The
most-likely identified model and corresponding SSEAICC values were the
same in this instance for both the old and new approach which is to be expected
if the new approach is functioning correctly As shown in the old approach there
are models that have a greater convergence to the experimental data (and hence
a lower SSE) but the statistical analysis correctly assigns these models an
unfavourable AICC based on their extra (insignificant) model terms However as
the initial limit of 4 terms in a model is enforced in the new approach it can be
determined by the user that compiling and evaluating the 5-term-models is not
required based on the marginal possible SSE benefits These small benefits are
very unlikely to warrant extra terms based on AICC evaluation as the
convergence to experimental data is already excellent meaning that the model
identified is very likely to be correct An example kinetic plot showing the fit of
the identified model to the experimental data is shown in Figure 43 - this is the
fifth simulated experiment where the starting concentrations were 12 M 24-
difluoronitrobenzene and 3 M pyrrolidine at 30 degC
145
Figure 43 The fit of the identified model and kinetic parameters to the generated experimental
data with starting concentrations of 12 M 24-difluoronitrobenzene and 3 M pyrrolidine at
30 degC Where x = 24-difluoronitrobenzene x = ortho-substituted product x = para-
substituted product x = bis-substituted product mdash = 24-difluoronitrobenzene (ODE) mdash
= ortho-substituted product (ODE) mdash = para-substituted product (ODE) mdash = bis-
substituted product Plot only shown to 500 minutes to the show curvature of the initial
data points
It has been shown that the new approach can identify the correct model
and kinetic parameters for a multistep process with first-order dependencies on
all species with the same accuracy as expected from the old approach
Therefore it is now possible to confidently move on to simulated case studies
where rate laws are more complex featuring catalytic reactions and orders that
are non-integer or zero
432 Case study Pentyne kinetics
This simulated case study features a chemical system that reacts with a zero-
order dependence on one of the species[241] The starting material 411 reacts
with the spirodiene 412 to form the product 413 and LiBr 414 as shown in
Scheme 43 The true rate law however shows a first-order dependence on the
starting material and a zero-order dependence on the spirodiene Interestingly
this reaction order has been used as evidence for the existence of a pentyne
species as this order suggests an initial reaction of the starting material to form
146
a much more reactive species leading to the zero-order dependence on the
spirodiene
Scheme 43 The reaction of the starting material 411 with the spirodiene 412 to form the
product 413 and LiBr 414[241]
4321 Data acquisition
The overall first-order reaction model reported by Gilbert et al[241] was used
to generate the ODEs shown in eqn 423 - 426 Three isothermal simulated
data sets were generated using these ODEs with the k value of 000846 min-1 at
-78 degC with the following initial concentrations
bull 1 M 2-bromocyclopentenyl lithium (starting material) 411 08 M
spirodiene 412 0 M product 413 0 M LiBr 414
bull 12 M 2-bromocyclopentenyl lithium (starting material) 411 15 M
spirodiene 412 0 M product 413 0 M LiBr 414
bull 1 M 2-bromocyclopentenyl lithium (starting material) 411 1 M
spirodiene 412 0 M product 413 0 M LiBr 414
119889[120786 120783120783]
119889119905= minus1198961[120786 120783120783] eqn 423
119889[120786 120783120784]
119889119905= minus1198961[120786 120783120783] eqn 424
119889[120786 120783120785]
119889119905= 1198961[120786 120783120783] eqn 425
119889[120786 120783120786]
119889119905= 1198961[120786 120783120783] eqn 426
2 relative error was then added to these simulated data sets then used
as the inputted experimental data for the computational approach These data
sets can be found in Chapter 742
4322 Results and discussion
147
From these 3 species there are 2 mass-balance-allowed reactions that
can be identified shown in eqn 427 and eqn 428 From these two reactions
the corresponding rate laws were generated and all models were compiled
subject to the rules defined in Chapter 422 - this resulted in 30 unique models
to be evaluated by the approach
411 + 412 rarr 413 + 414 eqn 427
413 + 414 rarr 411 + 412 eqn 428
All 30 models were evaluated by the computational approach incurring a
computation time of around lt1 minute (see Chapter 761 for details on computer
specifications) Each of these models were ranked based on their AICC and it
was found that the highest ranked model was also the correct model with kinetic
parameters optimised to values that were very close to the generated values
The top five performing models are shown in Table 44 where the optimised k
values are shown as well as their corresponding SSE and AICC values
Table 44 A table showing the top five ranked models for the pentyne case study as identified
by the new approach The kinetic parameters for each reaction within the model are
shown as well as the SSE and AICC evaluation α denotes a variable molar dependence
within the kinetic parameter units depending on the rate law
Model
rank Model kx Mα min-1 SSE M AICC
1 411 + 4120 rarr 413 + 414 00085 00046 -134903
2 411 + 4120 rarr 413 + 414
413 + 414 rarr 411 + 412
00085
lt00001 00046 -132515
3 411 + 4120 rarr 413 + 414
413 + 41405 rarr 411 + 412
00085
lt00001 00046 -132515
4 411 + 4120 rarr 413 + 414
4130 + 414 rarr 411 + 412
00085
lt00001 00046 -132514
5 411 + 4120 rarr 413 + 414
413 + 4140 rarr 411 + 412
00085
lt00001 00046 -132514
Interestingly all five of these top-ranked models all have the same SSE
values and ranks 2 - 5 all have very similar AICC evaluations It is clear from
these models that the primary reason that they score highly is due to the
148
presence of the true model term 411 + 4120 rarr 413 + 414 One extra model
term is present that is rendered negligible but as the algorithm is forced to fit it
it is fitted with a value lt00001 In the old approach these negligible reactions
could be found but not repeated whereas in the new approach every variation
of the rate law of a particular negligible reaction can be repeated and score highly
according to AICC
Nonetheless the highest ranked model according to the approach is the
true kinetic model and the corresponding k value was also identified correctly
This case study shows that it is possible for the approach to identify models that
feature reactions that do not have typical species order dependencies of 1
therefore also that it can be used for real experimentation featuring zero or non-
integer order model terms An example kinetic plot showing the fit of the identified
model to the simulated experimental data is shown in Figure 44 - this is the first
experiment where the starting concentrations were 1 M starting material and 08
M spirodiene at -78 degC
149
Figure 44 The fit of the identified model and kinetic parameters to the generated experimental
data with starting concentrations of 1 M starting material and 08 M spirodiene at -78 degC
Where x = starting material x = spirodiene x = product mdash = starting material (ODE) mdash
= spirodiene (ODE) mdash = product (ODE)
433 Case study Ytterbium catalysis
The final simulated case study involves a ytterbium catalysed reaction
with lsquonon-normalrsquo empirical rate laws[242] 1-Phenyl-2-trimethylsilylacetylene
(starting material) 415 reacts with diphenylphosphine 416 in the presence of
a ytterbium catalyst ([Yb(η2-Ph2CNPh)(hmpa)3]) 417 to form the product 418
as shown in Scheme 44
Scheme 44 The reaction of the starting material 415 with diphenylphosphine 416 in the
presence of the ytterbium catalyst 417 to form the product 418 where [Yb] Yb(η2-
Ph2CNPh)(hmpa)3[242]
4331 Data acquisition
The complex order dependencies for the reaction model reported by Takaki
et al[242] consists of 1 reaction that was used to generate the ODEs shown in
eqn 429 - 432 In the true empirical rate law the order in the starting material
is 1 the order in diphenylphosphine is 0 and the order of the ytterbium catalyst
is 2 Four isothermal simulated data sets were generated at 25 degC using these
ODEs with the k value of 9324 M2 h-1 with the following initial concentrations
bull 2 M starting material 415 2 M diphenylphosphine 416 02 M ytterbium
catalyst 417 0 M product 418
bull 15 M starting material 415 2 M diphenylphosphine 416 01 M
ytterbium catalyst 417 0 M product 418
bull 14 M starting material 415 18 M diphenylphosphine 416 03 M
ytterbium catalyst 417 0 M product 418
bull 22 M starting material 415 16 M diphenylphosphine 416 025 M
ytterbium catalyst 417 0 M product 418
119889[120786 120783120787]
119889119905= minus119896 [120786 120783120787][120786 120783120789]2 eqn 429
150
119889[120786 120783120788]
119889119905= minus119896 [120786 120783120787][120786 120783120789]2 eqn 430
119889[120786 120783120789]
119889119905= minus2119896 [120786 120783120787][120786 120783120789]2 + 2119896 [120786 120783120787][120786 120783120789]2 eqn 431
119889[120786 120783120790]
119889119905= 119896 [120786 120783120787][120786 120783120789]2 eqn 432
2 relative error was then added to these simulated data sets then
used as the inputted experimental data for the computational approach These
data sets can be found in Chapter 721
4332 Results and discussion
Based on the inputs of the molecular weights for this system there are
two mass-balance-allowed reactions However as it is known that this is a
catalytic system these two reactions must be facilitated by the user-defined
ytterbium catalyst 417 shown in eqn 433 and 434 It is then the role of the
approach to identify all combinations of allowed reactions and rate laws to
determine which is the most likely model
415 + 416 120786120783120789rarr 418 eqn 433
415 + 416 120786120783120789rarr 418 eqn 434
After the model generation stage 105 models were identified and
evaluated by the computational approach incurring a time of around 1 minute
(see Chapter 762 for details on computer specifications) Each of these models
were ranked based on their AICC and it was found that the highest ranked model
was also the correct model with the k value optimised to a value that was very
close to the value used for data generation The top five performing models are
shown in Table 45 where the optimised k values are shown as well as their
corresponding SSE and AICC values
Table 45 A table showing the top five ranked models for the ytterbium catalysis case study as
identified by the new approach The kinetic parameters for each reaction within the
model are shown as well as the SSE and AICC evaluation α denotes a variable molar
dependence within the kinetic parameter units depending on the rate law
Model
rank Model kx Mα h-1 SSE M AICC
1 415 + 4160 4172
rarr 418 93191 928 x 10-4 -24138
151
2
415 + 4160 4172
rarr 418
418 41705
rarr 415 + 416
93191
lt00001 928 x 10-4 -23910
3
415 + 4160 4172
rarr 418
418 4171
rarr 415 + 416
93191
lt00001 928 x 10-4 -23910
4
415 + 4160 4172
rarr 418
418 4172
rarr 415 + 416
93191
lt00001 928 x 10-4 -23910
5 415 + 416 4172
rarr 418 80784 11549 -1335
As in the previous pentyne case study four of these top-ranked models
all have the same SSE values and ranks 2 - 4 all have very similar AICC
evaluations The reasoning for this appears to be the same as previously
discussed where the primary reason that they score highly is due to the
presence of the true model term 415 + 4160 4172
rarr 418 One extra model term
is present in ranks 2 - 4 that the algorithm is forced to fit although it does not
provide any significance to the model hence it is fitted with a value lt00001
Nonetheless the highest ranked model according to the approach is the
true kinetic model and the corresponding k value was also identified correctly
This case study shows not only that it is possible to identify models that feature
catalytic species but also that the orders of the catalytic and non-catalytic
species can be identified As a lsquotypicalrsquo catalytic example is more likely to be first-
order with respect to all species the ability that the approach has shown to
identify non-normal order dependencies in the rate law for multiple species
inspires confidence that the approach will be successful in its use in real
experimentation An example kinetic plot showing the fit of the identified model
to the simulated experimental data is shown in Figure 45 - this is the second
experiment where the starting concentrations were 15 M starting material 2 M
diphenylphosphine and 01 M ytterbium catalyst at 22 degC
152
Figure 45 The fit of the identified model and kinetic parameters to the generated experimental
data with starting concentrations of 15 M starting material 2 M diphenylphosphine and
01 M ytterbium catalyst at 22 degC Where x = starting material x = diphenylphosphine x
= product mdash = starting material (ODE) mdash = diphenylphosphine (ODE) mdash = product
(ODE)
44 Conclusion
It has been shown that the previously built computational approach to
kinetic modelling can be adapted to catalytic systems and rate laws with non-
normal order dependencies This new approach has been proven to work
successfully for three simulated case studies featuring different modelling
criteria with sets of experimental data inputs with artificial errors The success
shown from these studies inspires confidence that the approach can be
implemented with real experimental data
The scope of the approach has increased substantially following the
improvements in this work and can now be used for many more chemical
applications However due to the comprehensive nature of the approach the
computational expense has also increased as there are many more reactions
that must be considered when building reaction models This computational
stress as before can be reduced by replacing existing computer hardware with
more computer logical cores - this is because the code is highly parallelised and
153
the speed of the approach is directly proportional to the number of computer
cores available Although the approach is very powerful this computational
expense may still be cumbersome for desktop computers depending on the
number of species involved in a particular chemical system However as time
passes processing technology consistently improves and there will undoubtedly
be a time where millions of models can be evaluated at a desk in a matter of
hours via comprehensive methodologies such as this
This comprehensive approach to kinetic model and parameter
determination has been shown to be successful in simulated case studies - the
next step is to prove the efficiency of this methodology with real experimental
case studies The aim of these case studies is to show that this approach can
correctly identify models of various-complexity chemical processes thereby
realising the main aim of this project in developing an automated kinetic analysis
tool with a wide scope for process development
Chapter 5 Experimental applications of the new approach
51 Introduction
With the development of the new computational approach complete and
verified with multiple simulated case studies the viability of the approach for real
experimental data must also be tested Real experimental case studies are to be
conducted to measure the ability of this new and final computational approach
As the scope of this new approach has been broadened to include
catalytic reactions and species order dependencies of zero or 05 it is important
to study chemical systems that may exhibit these properties to prove that the
new approach can identify these models It is also important that the approach
can continue to identify more lsquosimplersquo models that have species order
dependencies of 1 as well as utilise kinetic data from any means This is
because the kinetic motifs often cannot be determined a priori and the beneficial
feature of this methodology is that models are identified and ranked according to
statistical measures This removes bias and therefore considers all rate laws for
every possible model meaning that the approach does not know initially if a
154
model is supposed to contain a zero order term or not for example and will only
determine this after the comprehensive model evaluations
Experimental case studies from any reaction process (batch flow etc)
and analytical technique (HPLC NMR etc) will be used in these final
experimental verifications These case studies will prove that the approach can
identify models including lsquonormalrsquo zero or 05 species order dependencies for
both catalytic and non-catalytic processes The research project aim will thereby
be realised by ultimately developing a powerful automated methodology to be
used in process development for the modelling of real chemical systems
52 Case study SNAr kinetics
The first reaction system explored using the new computational approach
was the presupposed model of the reaction of 246-trichloropyrimidine (SM) 51
with ethyl 4-aminobutanoate 52 to form the major 2-substituted SNAr product
53 and the minor 4-substituted SNAr product 54 as shown in Scheme 51 As
the ethyl 4-aminobutanoate is present in its hydrochloride salt the hydrochloric
acid present (and generated from subsequent SNAr reactions as 55) is
neutralised by an excess of triethylamine
Scheme 51 The reaction of 246-trichloropyrimidine (SM) 51 with ethyl 4-aminobutanoate
52 to form the major 2-substituted SNAr product 53 and the minor 4-substituted SNAr
product 54
As the desired major product from this reaction can be further reacted to
synthesise bioactive derivatives of pharmaceuticals[243 244] this initial
transformation is of interest in the process development of these molecules A
collaborator in the Spring group at Cambridge University Hikaru Seki has a
particular interest in these bioactive molecules for his research project and
155
wanted to maximise the synthetic yield of the 2-substituted SNAr product 53 by
obtaining kinetic understanding of the system Therefore all practical
experimental work in this case study was conducted by Hikaru Seki at Cambridge
University then the results were forwarded to Leeds for kinetic analysis
Four kinetic experiments were conducted at -25 degC 0 degC 25 degC and 50
degC with three replicate experiments at 25 degC Each experiment was conducted
in batch in an NMR tube within a 500 MHz NMR spectrometer which allowed
continuous NMR acquisition at a rate of approximately one sample per 80
seconds This continuous reaction monitoring generates a large data density for
the subsequent kinetic analysis using the new computational approach by
monitoring the proton peaks of the individual species shown in Figure 51 Full
experimental details can be found in Chapter 751
Figure 51 The distinctive proton peaks shown in red that are monitored via NMR as time
progresses in the SNAr case study
Based on the five species identified there were six reactions that were
calculated to be possible based on mass balance - these reactions are shown
as eqn 51 - 56 From these reactions all corresponding rate laws were
generated and all models were compiled subject to the rules defined in Chapter
422 This resulted in 3320 unique models to be evaluated by the approach
53 rarr 54 eqn 51
54 rarr 53 eqn 52
51 + 52 rarr 53 + 55 eqn 53
53 + 55 rarr 51 + 52 eqn 54
51 + 52 rarr 54 + 55 eqn 55
54 + 55 rarr 51 + 52 eqn 56
All 3320 models were evaluated by the computational approach incurring
a computation time of around 9 hours (see Chapter 761 for details on computer
156
specifications) Each of these models were then ranked based on their AICC
evaluation and it was found that the most likely representation of the system is
the model shown in Scheme 51 with lsquotypicalrsquo first-order species dependencies
in the rate laws The approach also determined the kinetic parameters of the
transformation to the major product k25 degC = 0499 plusmn 0006 M-1 min-1 Ea = 4419
plusmn 057 kJ mol-1 and to the minor product k25 degC = 0384 plusmn 0009 M-1 min-1 Ea =
3657 plusmn 088 kJ mol-1 This model and the corresponding kinetic parameters
allowed a fit to the experimental data with an average residual of less than 26 x
10-4 M and is shown in Figure 52 The top 5 ranked models are shown in Table
51 with their respective SSE error metric and AICC evaluation
Figure 52 Kinetic profiles for four kinetic experiments at -25 degC 0 degC 25 degC and 50 degC where
= starting material = 2-substituted product = 4-substituted product mdash = starting
material (ODE) mdash = 2-substituted product (ODE) mdash = 4-substituted product (ODE) See
Chapter 751 for full experimental conditions and raw data
Table 51 Evaluation of the feasibility of each reaction model for the SNAr case study where α
is variable for each model depending on the overall model order
Rank Reaction Model
Kinetic parameters
SSE
103 M AICC k25 degC Mα
min-1 Ea kJ mol-1
1 51 + 52 rarr 53 + 55 0499 4419 1614 -5191
157
51 + 52 rarr 54 + 55 0384 3657
2 51 + 52 rarr 53 + 55
51 + 5205 rarr 54 + 55
0407
0073
4061
3101 3723 -4857
3 51 + 52 rarr 53 + 55
510 + 52 rarr 54 + 55
0466
0017
4225
2756 3777 -4851
4 51 + 52 rarr 53 + 55
51 + 520 rarr 54 + 55
0466
0017
4225
2756 3777 -4729
5 51 + 5205 rarr 53 + 55
51 + 52 rarr 54 + 55
0092
0298
3806
3227 5127 -4664
It is clear from the kinetic plots that the fit of the ODEs to the experimental
data do not result in normally-distributed residuals This could be for one of many
reasons but is most likely due to either errors in producing the correct
concentration of amine 52 or NMR integrations errors or evaporation of solvent
(CD3OD) into the headspace at higher temperatures This must be considered
by a trained chemist upon completion of the computational approach and this is
an example showing that this methodology must be used in conjunction with
chemical expertise to confirm the approach output In this case however the
residuals are only a small consideration and it can be observed that the model
still fits the experimental data well so the identified model is still valid
This first experimental case study has shown that the new approach can
correctly identify the reaction model and kinetic parameters even when
considering a multitude of differing rate laws In this case it was found that each
the rate laws featured first-order dependencies on each of the species which is
common in chemical processes This kinetic information can then be used to
optimise this process for the highest yields of the 2-substituted (major) product
53 for our collaboratorrsquos research project which can then be used as a building
block for bioactive materials
53 Case study PfBr
The next case study that was explored was a chemical system featuring
a protection of an amino acid for further functionalisation where alanine methyl
158
ester (Al-Me) 56 reacts with 9-bromo-9-phenylfluorene (PfBr) 57 to form the
protected amino acid (Pf-Al-Me) 58 and hydrobromic acid 59 as a side-
product as shown in Scheme 52 The alanine methyl ester is present in its
hydrochloride salt form so this hydrochloric acid and the formation of
hydrobromic acid are both neutralised by an excess of suspended potassium
phosphate
Scheme 52 The reaction of alanine methyl ester (Al-Me) 56 with PfBr 57 to form the
protected amino acid 58 Hydrobromic acid 59 is also generated as a side product
PfBr is the reagent to introduce the 9-phenylfluorene (Pf) protecting group
in a synthesis Pf is a pharmaceutically relevant and bulky protecting group that
can be introduced as a more acid stable alternative to the more commonly used
trityl protecting group[245 246] The chemical system of interest is the protection
step in the total synthesis of (S)-eleagnine from L-alanine as shown in Scheme
53 as a retrosynthetic methodology[247] Understanding this transformation by
performing kinetic analysis would therefore accelerate process development
when scaling up this process
Scheme 53 The retrosynthetic methodology of the transformation of L-alanine to (S)-
eleagnine via the Pf-protected alanine methyl ester (Pf-Al-Me)[247]
Due to the high cost of PfBr as a starting material (pound137 for 5 g)[248] PfBr
was synthesised from cheaper materials as it was unknown how much would be
necessary for kinetic analysis Bromobenzene 510 was initially treated with
magnesium then reacted with fluorenone 511 to make the intermediate PfOH
512 PfOH was then isolated and reacted with hydrobromic acid to form the
desired PfBr product as shown in Scheme 54[249] The most expensive material
159
in the synthesis of this PfBr product is fluorenone costing pound76 for 500 g resulting
in a much cheaper method to obtaining this desired material[250] This reaction
was carried out on a 40 g scale and full experimental details can be found in
Chapter 7521 As there was an absence of an OH peak from the IR spectrum
of PfBr the PfBr material was analysed by HPLC and the purity was determined
to be gt99 With pure PfBr as a starting material the kinetic case study was
then possible to begin
Scheme 54 The synthetic route from cheap starting materials bromobenzene 510 and
fluorene 511 to the intermediate PfOH 512 and finally the desired PfBr material 58
Three experiments were conducted in a three-neck round bottomed flask
at 30 degC 35 degC and 40 degC Samples (05 mL) were extracted manually from the
bulk reaction medium with a syringe followed by syringing approximately 03 mL
of water and shaking the syringe - this dissolves the suspended potassium
phosphate and allows injection into the sample loop for analysis via HPLC The
batch setup for experimentation is shown in Figure 53
160
Figure 53 The batch setup for experimentation in the PfBr case study where the temperature
probe is submerged in the reaction medium that is heated via a heater stirrer
After all experiments were run the experimental data and the identified
species were inputted into the new approach Based on these four species there
were two feasible reactions calculated - these reactions are shown as eqn 57
and eqn 58 From these reactions all corresponding rate laws were generated
and all models were compiled subject to the rules defined in Chapter 422 This
resulted in 30 unique models to be evaluated by the approach
56 + 57 rarr 58 + 59 eqn 57
58 + 59 rarr 56 + 57 eqn 58
All 30 models were evaluated by the new computational approach
incurring a computation time of less than 2 minutes (see Chapter 761 for details
on computer specifications) Each of these models were then ranked based on
their AICC evaluation and it was found that the most likely representation of the
system is the model shown in Scheme 52 but with a zero-order dependence on
the alanine methyl ester in the rate law This makes sense chemically as the
bulky aromatic rings would stabilise the cation formed if the reaction were to
proceed via a traditional SN1 mechanism this means that the rate-determining-
161
step is likely to be the loss of the bromide ion followed by a fast reaction with the
alanine methyl ester The approach also determined the kinetic parameters of
this transformation as k35 degC = 106 x 10-2 plusmn 001 x 10-2 min-1 Ea = 6291 plusmn 023
kJ mol-1 This model and the corresponding kinetic parameters allowed a fit to
the experimental data with an average residual of 26 x 10-4 M and is shown in
Figure 54 in a combined plot The top 5 ranked models are shown in Table 52
with their respective SSE error metrics and AICC evaluations
Figure 54 Kinetic profiles for three kinetic experiments at 30 degC 35 degC and 40 degC where red
plots indicate PfBr concentrations and blue plots indicate Pf-Al-Me concentrations At 30
degC = experimental data mdash = ODE At 35 degC = experimental data - - - = ODE At
40 degC = experimental data = ODE See Chapter 752 for full experimental
conditions and raw data
Table 52 Evaluation of the feasibility of each reaction model for the PfBr case study where α
is variable for each model depending on the overall model order
Rank Reaction Model
Kinetic parameters
SSE
10-5 M AICC k35 degC Mα min-
1
Ea kJ mol-
1
1 560 + 57 rarr 58 + 59 00106 6291 351 -23815
2 560 + 57 rarr 58 + 59
58 + 5905 rarr 56 + 57
00115
00144
6709
7000 276 -23805
3 560 + 57 rarr 58 + 59
58 + 590 rarr 56 + 57
00129
00034
6527
7000 276 -23804
4 560 + 57 rarr 58 + 59 00128 6571 281 -23764
162
580 + 59 rarr 56 + 57 00057 7000
5 560 + 57 rarr 58 + 59
5805 + 59 rarr 56 + 57
00112
00167
6606
7000 295 -23654
Interestingly the top 5 ranked models all feature the main lsquoimportantrsquo
model term of 560 + 57 rarr 58 + 59 with models 2 - 5 also featuring some
variant of the reversible reaction This is a similar outcome to the simulated
pentyne kinetics case study in Chapter 432 In this experimental case however
the reversible reaction should be very unlikely as the hydrobromic acid is
removed by the excess potassium phosphate present It can be concluded
therefore that these extra model terms are just fitting to the experimental noise
especially as the magnitude of the SSE metrics are so low
It has been shown in this case study that the new computational approach
can correctly identify the reaction model and kinetic parameters of a system
where there is a zero-order dependency on one of the species This is the first
instance of an identified model featuring non-first-order rate laws in a real
chemical process and further proves the broadened applicability of the new
approach as a kinetic analysis tool This kinetic information can then be used to
shorten process development times and lower costs if (S)-eleagnine was
synthesised using this route
54 Case study Maleic acid
The final experimental case study that was explored was the chemical
system involving maleic acid 513 reacting with methanol 514 to form the
monomethylated maleic acid ester (mono-product) 515 and the dimethylated
maleic acid ester (di-product) 516 shown in Scheme 55 Each reaction also
liberates a molecule of water 517
163
Scheme 55 The reaction of maleic acid 513 and methanol 514 to form the mono-product
515 and the di-product 516
Our collaborators at AstraZeneca were interested in this reaction following
the contamination of a batch of an API maleate salt with the corresponding
monomethyl maleate salt as this contamination could be mitigated if the impurity
formation was well understood Kinetic experiments were run and the findings
were published as it was found that the reaction forming the mono-product was
autocatalytic[240] In this case the reaction was found to be catalytic with an order
of 05 meaning that the overall order with respect to the maleic acid was 15 in
forming the mono-product The consecutive reaction forming the di-product is
also catalytic with respect to the maleic acid with a 05 order dependence
Although this information is now known and reported it took several months for
physical-organic chemists at AstraZeneca to decipher this reaction model as this
model is not immediately intuitive Therefore this case study was run to
retrospectively show the efficiency of this approach in elucidating non-intuitive
reaction models and how this methodology can serve as a viable substitute for
many hours spent on a project by experts that could be working on other aspects
of process development
All experimental data was obtained from our collaborators at AstraZeneca
and was collected using batch experimentation and 1H NMR sampling Five
experiments were conducted at differing starting concentrations and
temperatures in the range of 40 - 60 degC This experimental data was inputted into
the computational approach as well as the identified species Based on these
five species there were six feasible reactions identified - these reactions are
shown as eqn 59 - 514
513 + 514 rarr 515 + 517 eqn 59
515 + 517 rarr 513 + 514 eqn 510
515 + 514 rarr 516 + 517 eqn 511
516 + 517 rarr 515 + 514 eqn 512
515 + 515 rarr 513 + 516 eqn 513
513 + 516 rarr 515 + 515 eqn 514
As the experiments were ran with methanol as a solvent this exhibits an
effective methanol concentration of ~24 M which is far greater than the maleic
164
acid concentration that had a maximum concentration of 08 M As the methanol
is in such a high concentration its concentration remains effectively unchanged
throughout the reaction meaning that the rate law would approximate pseudo-
first-order kinetics Therefore after all rate laws were compiled using these
mass-balance-allowed reactions all rate laws pertaining to non-zero-order with
respect to methanol concentration were removed As the methanol concentration
would be effectively unchanged it would be very difficult to differentiate between
models with differing order dependencies on the methanol - this would likely lead
to many models tied for lsquomost likelyrsquo with exactly equivalent SSE values
After the subsequent rate laws were compiled the models were
generated subject to the rules defined in Chapter 422 and with the maleic acid
defined as a catalyst This resulted in 5086 unique models to be evaluated by
the approach which incurred a computation time around 17 hours (see Chapter
761 for details on computer specifications) Each of these models were then
ranked based on their AICC evaluation and it was found that the most likely
representation of the system is the reaction model shown in Scheme 55 but
each step is catalysed by maleic acid with a species order dependence of 05 -
these are the same findings that our collaborators made during their kinetic
analysis The approach also determined the kinetic parameters of this
transformation to be kmono 50 degC = 385 x 10-3 plusmn 001 x 10-3 M-05 min-1 Ea = 7261
plusmn 012 kJ mol-1 and kdi 50 degC = 466 x 10-4 plusmn 001 x 10-4 M-05 min-1 Ea = 6974 plusmn
010 kJ mol-1 These parameters were again very similar to those obtained by
our collaborators although our collaborators reported the kinetic parameters as
Arrhenius constants and activation energies This model and the corresponding
kinetic parameters allowed a fit to the experimental data with an average residual
of 11 x 10-3 M and two experimental fittings at 50 degC (with initial concentrations
of 08 M and 04 M) are shown in Figure 55 The top 5 ranked models are shown
in Table 53 with their respective SSE error metrics and AICC evaluations
165
Figure 55 Kinetic profiles for two kinetic experiments at 50 degC with the initial concentration of
maleic acid at 04 M and 08 M At 04 M = maleic acid mdash = maleic acid (ODE) =
mono-product mdash = mono-product (ODE) = di-product mdash = di-product (ODE) At 08
M = maleic acid - - - = maleic acid (ODE) = mono-product - - - = mono-product
(ODE) = di-product - - - = di-product (ODE) See Chapter 753 for full experimental
conditions and raw data
Table 53 Evaluation of the feasibility of each reaction model for the maleic acid case study
where α is variable for each model depending on the overall model order
Rank Reaction Model
Kinetic parameters
SSE
10-2 M AICC k50 degC 10-3 Mα
min-1 Ea kJ mol-1
1
51315 + 5140 rarr 515
+ 51305 + 517
51305 + 515 + 5140
rarr 516 + 51305 + 517
385
047
7261
6974 028 -4968
2
51315 + 5140 rarr 515
+ 51305 + 517
513 + 5152 rarr 5132 +
516
408
192
7832
7977 033 -4908
3
51315 + 5140 rarr 515
+ 51305 + 517
513 + 515 + 5140 rarr
516 + 513 + 517
391
103
7419
7995 033 -4902
166
4
51315 + 5140 rarr 515
+ 51305 + 517
51305 + 5152 rarr
51315 + 516
397
076
7652
7306 042 -4806
5
5132 + 5140 rarr 515 +
513 + 517
513 + 515 + 5140 rarr
516 + 513 + 517
560
078
7998
7936 053 -4715
As in previous case studies the top ranked models all feature the main
lsquoimportantrsquo model term that describes the convergence to experimental data in
the best way with models 1 - 4 featuring this term 51315 + 5140 rarr 515 +
51305 + 517 This is because the SSE metric is a measure of the total error in
the fit to the data and as this model term features the transformation of 513 to
515 which are the species present in the highest concentrations this model
term therefore has the highest impact on minimising the SSE
It has been shown in this case study that the new computational approach
can correctly identify the reaction model and kinetic parameters of a real
chemical system where there are both catalytic species and species with non-
integer order dependencies This is the first instance of an identified model
featuring a catalytic species and non-integer-order rate laws using real
experimental data As the model was already identified by our collaborators this
methodology has corroborated their findings and shown that process
understanding can be accelerated using this approach This approach
automatically identified the correct reaction model in ~17 hours whereas our
collaborators using more traditional lsquotrial and errorrsquo approaches arrived at the
correct model in months Retrospectively this would have allowed faster
implementation of measures to reduce the amount of monomethyl maleate salt
impurity in their API maleate salt thereby proceeding with process development
and cutting costs
55 Conclusion
167
It has been shown that using this new computational approach total
process understanding can be automatically achieved without the need for high-
level chemical intuition The widened scope of this new approach has been
proven to be effective in three experimental case studies each with differing rate
laws and kinetic structural motifs The approach has been proven to be effective
and applicable for lsquonormalrsquo kinetic models where each species has a first-order
dependence for zero-order and non-integer rate laws and for catalytic species
of variable integer- and non-integer-order
It has also been shown from these case studies that using this
methodology can greatly accelerate process development and reduce the
workload of kinetic analysis for the physical-organic chemists After
experimentation all kinetic analysis can be automated whilst experts focus on
other aspects of process development Then after the computational approach
has finished running they can work in conjunction with the approach to identify
which models are the most likely to be both statistically and scientifically correct
Chapter 6 Conclusion amp future work
The project aim to develop and advance an automated methodology to
kinetic model and parameter determination has been answered in the thesis
chapters herein The computational approach should be used in conjunction with
experts to automate the comprehensive kinetic analysis that is otherwise not
feasible using traditional means The approach takes experimental data and the
identified species then identifies every possible mass-balance-allowed
transformation between these species Each of these reactions are then
compiled into every possible unique reaction model with each feasible
corresponding rate law These models are then evaluated based on their fit to
experimental data by combining the use of ordinary differential equation (ODE)
solvers and optimisation algorithms The models are then statistically ranked
based on their convergence to experimental data and the number of model terms
in the model thereby identifying the most likely model and its corresponding
kinetic parameters
168
The original structure of this comprehensive methodology was originally
reported by Tsu et al[173] which was then replicated improved and utilised for
real experimentation in Chapters 2 - 3 The approach was used in tandem with
an automated flow reactor platform by exploiting flow rate manipulations to
obtain full reaction profiles followed by implementation of the approach The
methodology was then further improved and the scope was widened in Chapter
4 as catalytic systems and differing-non-integer order species dependencies in
the rate laws were also explored This improved methodology was then proven
to be effective in real experimental systems in Chapter 5 as batch
experimentation ran at Leeds and by collaborators showed the wide applicability
of the approach to different types of reactions This approach can be used as a
tool for process development by anyone as expert chemical intuition is removed
from the kinetic analysis Therefore the project aim has been answered in the
work described herein as any chemist can use this approach and interpret the
output in order to obtain total process understanding
Further work on the use and development of this approach for metal-
catalysed processes would be beneficial Metal-catalysed processes are very
important in industry but catalytic cycles can be complex meaning that it is not
immediately obvious how to automate a tool to explore these potential models
In some cases it may be sufficient to describe a reaction based on empirical rate
laws and this can currently be implemented using the approach developed
However another research project on the development of a tool to identify these
kinetic models and catalytic cycles may be warranted As a suggestion this could
be performed by inputting many known catalytic cycles into a training set then
using machine learning techniques to build a neural network to identify trends in
experimental data to attribute particular catalytic cycles to chemical processes
Chapter 7 Appendix
71 Chapter 1
No appendix data for Chapter 1
72 Chapter 2
169
721 Generated data set for case study benzoic acid alkylation
Experiment 1
Time s 21 M 22 M 23 M
0 01 08 0
475 0081361 0060964 0017126
1024 0069511 004901 0031805
2015 0054394 003336 0044477
295 0044695 0027749 0051252
432 0038039 0019903 0062653
60 0032285 0013536 0065719
Experiment 2
Time s 21 M 22 M 23 M
0 01 011 0
468 007631 0084741 0023482
1027 0057707 0069104 0040456
20 004138 0054662 0056759
302 0034101 004059 0067659
476 0023686 0031161 0075772
60 0018377 0027305 0083761
Experiment 3
Time s 21 M 22 M 23 M
0 1 015 0
5 0069767 0121755 0032513
105 0047199 0098611 005277
2163 0027758 0077627 0072909
3054 0019626 0069013 0079639
4578 0011357 0059865 0091724
170
60 0006574 005691 0093444
722 Generated data set for case study nitrile hydrolysis
Experiment 1 60 degC
Time s 25 M 27 M 28 M
0 08 0 0
5235363 0814005 001713 100E-06
3247861 067236 0106334 339E-05
6719836 0634071 0199701 0000124
1456155 0463323 034173 0000516
2899323 027438 0528037 0001536
3687175 0220788 0551639 000212
4868495 0162216 0630518 0003131
600 0124203 0705371 0004112
Experiment 2 70 degC
Time s 25 M 27 M 28 M
0 08 0 0
6133417 0761239 0049487 683E-06
2689 0588801 0199668 115E-04
6870925 0426543 0363734 0000585
1501538 021105 0573179 000192
297041 0079934 0705184 0004502
3564911 005351 0757795 0005854
4867485 0024103 0789235 0008408
600 0013094 0752509 0010127
Experiment 3 80 degC
Time s 25 M 27 M 28 M
171
0 1 0 0
5817383 0852929 015263 428E-05
2471834 0568389 0476974 589E-04
714048 0218624 0778816 0002633
1543583 0060192 089969 0006685
3038829 0006754 0944201 0014173
3720244 0002737 09556 001819
4765104 0000608 1009417 0023157
600 0000113 09467 0028902
Experiment 4 90 degC
Time s 25 M 27 M 28 M
0 1 0 0
5910759 0711158 0281532 172E-04
2420962 030002 070196 171E-03
6878985 0060896 0961462 0006075
1425421 0005202 1023471 0013823
2881599 555E-05 0935542 0027497
3644764 521E-06 0970668 0036328
4780807 143E-07 095015 0045819
600 179E-07 089561 0059331
723 Generated data set for the case study SNAr kinetics
Experiment 1
Time 210 M 212 M 213 M 214 M
0 1 0 0 0
0114724 0916317 0078593 0018182 249E-06
103049 0464119 0448791 0104213 0000125
2141533 0226584 0624128 0146157 0000376
3643057 0102715 0737636 0171082 0000744
172
7743801 0012971 0788209 0187458 0001768
1216477 0001476 0805589 018666 0002965
4403067 0 0816998 0186517 0010796
1072065 0 0801824 0178389 0026607
2551342 0 078187 0172065 0061291
4351342 0 0744149 0156488 0102055
600 0 0702123 0148841 0135997
Experiment 2
Time 210 M 212 M 213 M 214 M
0 12 0 0 0
0088864 1073662 0091451 00213 294E-06
0254455 0913278 0236597 0053222 217E-05
1152788 0407456 0638051 0147144 0000266
3171611 0093893 0900254 02064 0001032
939048 0001601 0959144 0228044 0003623
4041694 0 097195 021939 0016209
195366 0 0911133 0206891 0075681
3112192 0 0891022 0190707 0118451
4312192 0 0869047 0184739 015486
4912192 0 0861757 0175374 0176878
600 0 0839806 0165531 0209888
Experiment 3
Time 210 M 212 M 213 M 214 M
0 09 0 0 0
0091037 0797548 0079495 0018563 313E-06
0259823 0653654 0198581 0046012 219E-05
1158987 0239387 0538734 0122398 0000279
173
4175397 0013188 0712848 0169522 0001555
6793661 0001174 0728233 0166388 0002729
9757783 0 0717645 0170752 0003931
4449079 0 0719684 0164371 0019044
1956282 0 0666457 014927 0080022
3156282 0 0644589 0131672 0126933
4956282 0 0600784 0117343 0185606
600 0 0578163 0107537 0221849
73 Chapter 3
731 Phenyl acetate
7311 Preparation of feed solutions
Three feeds were used for this work and desired reservoir solutions were
prepared by dissolving the desired reagents in acetonitrile under stirring at
ambient conditions The first feed consisted of phenol (132 mL 015 mol 05
mol dm-3) and biphenyl (115 g 75 mmol 0025 mol dm-3) in acetonitrile (300
mL) the second feed contained acetyl chloride (225 mL 032 mol 105 mol dm-
3) the third feed was a 11 mixture of acetonitrile and water for dilution
7312 Flow ramp experiments
Linear gradient flow ramps allowed the generation of a complete reaction
profile from a single transient experiment To obtain transient data each of the
three pumps were initially set at the maximum flow rate to be investigated 175
mL min-1 Steady-state was established in the 35 mL reactor and the flow rate
for each pump decreased at a constant rate of 00181 mL min-1 for 92 minutes
Samples of reactor effluent were injected for HPLC analysis at 2 minute intervals
thus achieving a large data density The reactor setup schematic is shown in
Figure 731
174
Figure 731 The flow reactor setup for the phenyl acetate case study experiments
7313 HPLC Analysis
All HPLC analysis was conducted using an Agilent 1100 series HPLC
instrument fitted with a Sigma Ascentis Express C18 reverse phase column (5cm
x 46mm 27 microm) Biphenyl was used as an internal standard The column
temperature was 70 degC and the HPLC method is shown
Time min A (water 01
TFA)
B (acetonitrile
01 TFA) Flow rate mL min-1
000 50 50 2
150 20 80 2
151 50 50 2
An example HPLC chromatogram during a kinetic experiment is shown in
Figure 732
175
Figure 732 An example HPLC chromatogram in the phenyl acetate case study at 254 nm
7314 Validation with steady-state measurements
Steady-state measurements were taken at 1 3 5 7 9 11 13 and 15
minutes at both 65 degC and 75 degC Using the identified most likely reaction model
from the flow ramps the k values for the steady-state experiments were found to
be kSS-65 degC = 472 x 10-3 plusmn 001 x 10-3 M-1 s-1 kSS-75 degC = 929 x 10-3 plusmn 003 x 10-3
M-1 s-1 These k values give the steady-state kinetic parameters as kSS-65 degC =
472 x 10-3 plusmn 001 x 10-3 M-1 s-1 Ea-SS = 663 plusmn 05 kJ mol-1 which are very
comparable to the flow ramp evaluation of the kinetic parameters kR-65 degC =
00052 plusmn 00002 M-1 s-1 Ea-R = 693 plusmn 78 kJ mol-1 As the steady-state
measurements were taken without a dilution pump the concentrations are
different to that of the ramps hence the steady-state time-series concentration
data was normalised to match the concentrations from the ramps to show the
agreement in their nature in Figure 311
7315 Raw data
Flow ramp experiments
Flow ramp
measurements 65 degC 75 degC
τ min 38 M 310 M 38 M 310 M
102 01493 00072 01346 00262
104 01461 00095 01297 00269
106 01436 00104 01284 00260
108 01459 00119 01300 00262
111 01433 00121 01268 00287
114 01394 00128 01244 00304
116 01398 00135 01251 00310
119 01428 00144 01200 00322
122 01410 00150 01176 00340
125 01397 00142 01249 00304
129 01358 00140 01204 00334
132 01388 00168 01188 00369
176
136 01382 00166 01190 00405
140 01365 00170 01204 00315
144 01358 00182 01174 00408
149 01324 00173 01142 00392
153 01338 00188 01170 00383
158 01360 00194 01148 00395
164 01334 00204 01134 00426
170 01320 00213 01132 00406
176 01333 00223 01113 00430
182 01315 00232 01121 00456
189 01319 00220 01095 00445
197 01278 00228 01029 00523
205 01285 00260 01072 00501
214 01280 00334 01021 00554
224 01267 00287 01065 00524
235 01248 00305 00996 00603
247 01253 00309 00984 00566
260 01214 00338 00974 00575
274 01217 00297 00914 00661
290 01195 00360 00914 00620
308 01196 00379 00900 00654
328 01162 00408 00830 00762
351 01111 00444 00790 00774
377 01114 00452 00848 00739
406 01017 00527 00737 00722
441 01033 00536 00705 00843
481 00986 00559 00618 00981
528 00955 00598 00564 00962
583 00908 00678 00599 00985
649 00807 00704 00576 01039
177
729 00781 00770 00488 01150
824 00705 00835 00421 01160
940 00662 00921 00360 01223
1079 00587 00981 00249 01358
Steady state experiments
Steady-state
measurements 65 degC 75 degC
τ min 38 M 310 M 38 M 310 M
102 01771 00177 01591 00387
308 01461 00470 01183 00824
481 01214 00736 00858 01123
649 01050 00940 00625 01370
900 00844 01155 00419 01567
1101 00717 01263 00297 01715
1301 00559 01384 00218 01822
1502 00512 01488 00177 01886
Normalised steady state experiments
Steady-state
measurements
(normalised)
65 degC 75 degC
τ min 38 M 310 M 38 M 310 M
102 01417 00142 01273 00310
308 01169 00377 00947 00660
481 00971 00590 00686 00898
649 00840 00753 00500 01096
900 00675 00926 00335 01253
1101 00573 01012 00238 01372
178
1301 00447 01109 00174 01458
1502 00409 01192 00142 01509
732 Paracetamol
7321 Preparation of feed solutions
For the work at the temperature of 30 degC two feeds were used and
desired reservoir solutions were prepared by dissolving the desired reagents in
acetonitrile under stirring at ambient conditions The first feed consisted of 4-
aminophenol (058 mL 6 mmol 002 mol dm-3) and biphenyl (115 g 75 mmol
0025 mol dm-3) in acetonitrile (300 mL) the second feed contained acetic
anhydride (085 mL 9 mmol 003 mol dm-3) in acetonitrile (300 mL)
For the work at the temperature of 60 degC two feeds were used and
desired reservoir solutions were prepared by dissolving the desired reagents in
acetonitrile under stirring at ambient conditions The first feed consisted of 4-
aminophenol (044 mL 45 mmol 0015 mol dm-3) and biphenyl (115 g 75
mmol 0025 mol dm-3) in acetonitrile (300 mL) the second feed contained acetic
anhydride (085 mL 9 mmol 003 mol dm-3) in acetonitrile (300 mL)
For the work at the temperature of 160 degC two feeds were used and
desired reservoir solutions were prepared by dissolving the desired reagents in
acetonitrile under stirring at ambient conditions The first feed consisted of 4-
aminophenol (101 mL 105 mmol 0035 mol dm-3) and biphenyl (115 g 75
mmol 0025 mol dm-3) in acetonitrile (300 mL) the second feed contained acetic
anhydride (298 mL 315 mmol 0105 mol dm-3) in acetonitrile (300 mL)
For the work at the temperature of 180 degC two feeds were used and
desired reservoir solutions were prepared by dissolving the desired reagents in
acetonitrile under stirring at ambient conditions The first feed consisted of 4-
aminophenol (261 mL 27 mmol 009 mol dm-3) and biphenyl (115 g 75 mmol
0025 mol dm-3) in acetonitrile (300 mL) the second feed contained acetic
anhydride (533 mL 564 mmol 019 mol dm-3) in acetonitrile (300 mL)
7322 Flow ramp experiments
For the work at the temperature of 30 degC a 025 mL reactor was used
For the work at the temperature of 60 degC a 05 mL reactor was used For the
179
work at the temperatures of 160 degC and 180 degC a 35 mL reactor was used
Linear gradient flow ramps allowed the generation of complete reaction profiles
from a single transient experiment To obtain transient data each of the two
pumps were initially set at the maximum flow rate to be investigated 175 mL
min-1 Steady-state was established and the flow rate for each pump decreased
at a constant rate of 00181 mL min-1 for 92 minutes Samples of reactor effluent
were injected for HPLC analysis at 2 minute intervals thus achieving a large data
density The reactor setups for each of these 4 reactions are shown in Figures
733 - 736 For the higher temperature reactions 160 degC and 180 degC 4-
aminophenol is used and assumed to react instantaneously to form paracetamol
based on the kinetics observed at lower temperatures
Figure 733 The reactor setup for the paracetamol flow ramp experiment at 30 degC
180
Figure 734 The reactor setup for the paracetamol flow ramp experiment at 60 degC
Figure 735 The reactor setup for the paracetamol flow ramp experiment at 160 degC
Figure 736 The reactor setup for the paracetamol flow ramp experiment at 180 degC
7323 HPLC analysis
All HPLC analysis was conducted using an Agilent 1100 series HPLC
instrument fitted with a Sigma Ascentis Express C18 reverse phase column (5cm
x 46mm 27 microm) Biphenyl was used as an internal standard The column
temperature was 70 degC and the HPLC method is shown
Time min A (water 01
TFA)
B (acetonitrile
01 TFA) Flow rate mL min-1
000 50 50 2
150 20 80 2
151 50 50 2
An example HPLC chromatogram showing the separation and analysis of
all components at once - these species were each added to the same solution
for method development
181
Figure 737 An example HPLC chromatogram from the paracetamol case study showing the
separation of all reaction components at 254 nm
7324 Raw data
Flow ramp experiment 1 30 degC
τ s 312 M 314 M 315 M
428 000698 000267 0
437 000722 000266 0
447 000766 000284 0
457 000716 000287 0
467 000688 000278 0
478 000749 000306 0
489 000717 000299 0
501 000715 000317 0
513 000685 000273 0
526 000727 000320 0
540 000622 000296 0
555 000635 000337 0
570 000643 000374 0
586 000639 000446 0
603 000623 000401 0
182
621 000643 000391 0
640 000600 000385 0
645 000654 000378 0
683 000613 000368 0
706 000519 000376 0
731 000592 000455 0
758 000585 000481 0
787 000554 000410 0
818 000564 000432 0
851 000503 000429 0
888 000568 000493 0
927 000441 000444 0
971 000444 000506 0
1019 000416 000513 0
1071 000446 000556 0
1129 000413 000575 0
1194 000440 000546 0
1267 000483 000566 0
1349 000452 000564 0
1443 000353 000601 0
1550 000276 000588 0
1675 000370 000654 0
1820 000325 000720 0
1994 000229 000676 0
2202 000214 000686 0
2459 000239 000770 0
2781 000178 000878 0
3197 000221 000826 0
3900 000171 000848 0
4518 000145 000871 0
183
Flow ramp experiment 2 60 degC
τ s 312 M 314 M 315 M
875 0003048 0004234 0
894 0003702 0003846 0
913 0003852 0003772 0
955 0003402 0003918 0
978 0003071 0003860 0
1002 0002944 0004318 0
1027 0003195 0004243 0
1053 0003084 0004111 0
1080 0003046 0004262 0
1109 0003112 0004330 0
1140 0002925 0004253 0
1172 0002919 0004464 0
1206 0002921 0004562 0
1243 0002741 0004796 0
1281 0002612 0004906 0
1290 0002480 0004399 0
1366 0002481 0004597 0
1412 0002545 0004952 0
1462 0002325 0004951 0
1516 0002416 0004964 0
1573 0002407 0005149 0
1635 0002401 0005027 0
1702 0002710 0004966 0
1775 0002157 0005196 0
1855 0002382 0005121 0
1942 0002037 0005228 0
184
2037 0002221 0005387 0
2142 0001760 0005411 0
2259 0001446 0005728 0
2389 0001541 0005809 0
2534 0001507 0005924 0
2699 0001471 0005553 0
2886 0001147 0005686 0
3100 0001304 0006117 0
3349 0001168 0005719 0
3641 0001018 0006181 0
3987 0000916 0006444 0
4405 0000976 0006104 0
4918 0001025 0006840 0
Flow ramp experiment 3 160 degC
τ min 312 M 314 M 315 M
125 0 001766 000056
129 0 001737 000054
132 0 001786 000038
136 0 001789 000042
140 0 001722 000061
144 0 001738 000055
149 0 001779 000059
153 0 001807 000068
158 0 001794 000064
164 0 001722 000067
170 0 001734 000072
176 0 001792 000077
185
182 0 001738 000076
189 0 001755 000081
197 0 001738 000074
205 0 001785 000102
214 0 001762 000086
224 0 001801 000105
235 0 001753 000111
247 0 001793 000102
260 0 001763 000123
274 0 001672 000118
308 0 001736 000124
328 0 001728 000160
351 0 001635 000153
377 0 001696 000174
406 0 001670 000199
441 0 001536 000187
481 0 001590 000222
528 0 001614 000263
583 0 001482 000258
649 0 001454 000317
729 0 001474 000331
824 0 001407 000355
940 0 001315 000386
1079 0 001292 000412
Flow ramp experiment 4 180 degC
τ min 312 M 314 M 315 M
104 0 003703 000456
186
106 0 003829 000519
108 0 003746 000652
111 0 003910 000557
114 0 003812 000656
116 0 003894 000592
119 0 003622 000877
122 0 003941 000625
125 0 003733 000754
129 0 003798 000713
132 0 003861 000717
136 0 003606 000930
140 0 003615 000890
144 0 003655 000870
149 0 003584 000854
153 0 003765 000893
158 0 003480 001017
164 0 003459 001078
170 0 003522 001035
176 0 003357 001114
182 0 003407 001127
189 0 003598 000927
197 0 003491 000963
205 0 003546 001197
214 0 003307 001152
224 0 003586 001004
235 0 003600 001103
247 0 003364 001246
260 0 003717 000943
187
274 0 003256 001202
290 0 003278 001151
308 0 003298 001160
328 0 003304 001311
351 0 003179 001295
377 0 003002 001227
406 0 003024 001543
441 0 003117 001338
481 0 003076 001426
528 0 002431 001748
583 0 002326 001784
649 0 002665 001973
729 0 002265 001803
824 0 001960 002426
940 0 001780 002347
1079 0 001594 002903
733 Metoprolol
7331 AstraZeneca experimental setup
All AstraZeneca experiments were conducted using a tubular reaction vessel
(Polar Bear Plus) using PTFE tubing (1 mm ID) Reagents were pumped using
JASCO PU-4180 dual piston HPLC pumps and flow streams were mixed using
Swagelok SS-100-3 tee-pieces Sampling was conducted by using a VICI Valco
EUDA-CI4W5 sample loop with a 006 microL aliquot volume The reaction system
was maintained under a fixed back pressure using an Upchurch Scientific 150
psi back pressure regulator Quantitative analysis was performed using an
Agilent 1100 series HPLC instrument fitted with an Acquity C18 reverse phase
column (3 cm x 46 mm 17 microm) This setup is shown in Figure 638 In all
experiments biphenyl was added to one reservoir as an internal standard
188
Figure 738 A photograph of the automated flow system at AstraZeneca
7332 Preparation of feed solutions
For the Leeds experiments two feeds were used for the flow ramps and
desired reservoir solutions were prepared by dissolving the desired reagents in
acetonitrile under stirring at ambient conditions The first feed consisted of 2-((4-
(2-methoxyethyl)phenoxy)methyl)oxirane (SM) (5676 mL 03 mol 1 mol dm-3)
and biphenyl (115 g 75 mmol 0025 mol dm-3) in acetonitrile (300 mL) the
second feed contained isopropylamine (1546 mL 018 mol 06 mol dm-3) in
acetonitrile (300 mL)
For the AstraZeneca experiments two feeds were used for the flow
ramps and desired reservoir solutions were prepared by dissolving the desired
reagents in acetonitrile under stirring at ambient conditions The first feed
consisted of 2-((4-(2-methoxyethyl)phenoxy)methyl)oxirane (SM) (5676 mL 03
mol 1 mol dm-3) and biphenyl (115 g 75 mmol 0025 mol dm-3) in acetonitrile
(300 mL) the second feed contained isopropylamine (5153 mL 09 mol 3 mol
dm-3) in acetonitrile (300 mL)
7333 Flow ramp experiments
189
For the Leeds experiments a 35 mL reactor was used Linear gradient
flow ramps allowed the generation of complete reaction profiles from a single
transient experiment To obtain transient data each of the two pumps were
initially set at the maximum flow rate to be investigated 175 mL min-1 Steady-
state was established and the flow rate for each pump decreased at a constant
rate of 00181 mL min-1 for 92 minutes Samples of reactor effluent were injected
for HPLC analysis at 4 minute intervals thus achieving a large data density This
reactor setup is shown in Figure 739
Figure 739 The reactor setup for the metoprolol flow ramp experiments at 190210 degC in
Leeds
For the AstraZeneca experiments a 5 mL reactor was used Linear gradient flow
ramps allowed the generation of complete reaction profiles from a single
transient experiment To obtain transient data each of the two pumps were
initially set at the maximum flow rate to be investigated 125 mL min-1 Steady-
state was established and the flow rate for each pump decreased at a constant
rate of 00125 mL min-1 for 96 minutes Samples of reactor effluent were injected
for HPLC analysis at 6 minute intervals thus achieving a large data density This
reactor setup is shown in Figure 7310
190
Figure 7310 The reactor setup for the metoprolol flow ramp experiments at 130150 degC at
AstraZeneca
7334 HPLC analysis
All HPLC analysis was conducted using an Agilent 1100 series HPLC
instrument fitted with a Sigma Ascentis Express C18 reverse phase column (5cm
x 46mm 27 microm) Biphenyl was used as an internal standard The column
temperature was 40 degC and the HPLC method is shown
Time min A (water 01
TFA)
B (acetonitrile
01 TFA) Flow rate mL min-1
000 77 23 2
300 10 90 2
400 10 90 2
410 77 23 2
An example HPLC chromatogram during a kinetic experiment is shown in
Figure 7311
Figure 7311 An example HPLC chromatogram during a kinetic experiment in the metoprolol
case study at 220 nm
7335 Cost evaluation
Using the Leeds experimental setup outlined in Chapter 32 and current
pricing for the starting material used in the Metoprolol work (pound80725 g)[239] it has
been shown that this kinetic approach used less material and was cheaper to
implement than other standard industrial optimisation techniques
As the starting material is the most expensive reaction component by a
large margin this was the only factor taken into consideration - other costs were
not considered eg solvent isopropylamine energy etc It is assumed that a 1
M solution of starting material is used and so the cost associated for every 1 mL
of this solution used (0208 g 1 mmol) is pound671 It is also assumed that 2 reactor
volumes are consumed prior to all steady-state reactions and all reactions were
191
conducted using a 35 mL reactor The addition of skilled labour and time have
not been considered but would incur significantly higher costs for these other
techniques as this technique only requires the initial setup of the reservoirs and
reactor because everything else is automated
Technique What is required Solution
usage mL Cost pound
Flow ramps
4 x linearly decreasing flow ramps from
175 mL min-1 decreasing at a rate of
00181 mL min-1 for 92 minutes
340 pound2281
Steady-state
kinetics 4 sets of 16 steady-state experiments 420 pound2818
Design of
Experiments
study
One screening design (19 steady-state
experiments) and one optimisation design
(81 steady-state experiments) to consider
the factors of temperature residence time
starting material equivalents and
isopropylamine equivalents
700 pound4697
7336 Raw data
Flow ramp experiment 1 130 degC
τ min 317 M 319 M 320 M
210 0435 0053 0000
224 0427 0056 0000
240 0423 0060 0000
258 0417 0064 0000
371 0381 0102 0000
416 0397 0088 0000
472 0383 0099 0000
545 0369 0110 0000
641 0362 0123 0000
773 0347 0146 0001
961 0286 0206 0002
Flow ramp experiment 2 150 degC
192
τ min 317 M 319 M 320 M
200 0358 0116 0000
210 0357 0125 0000
224 0350 0135 0001
240 0347 0144 0001
258 0340 0153 0001
280 0333 0166 0001
305 0311 0178 0002
335 0299 0193 0002
371 0269 0207 0002
416 0259 0234 0003
472 0233 0251 0003
545 0208 0287 0004
641 0169 0284 0005
773 0144 0327 0006
Flow ramp experiment 3 190 degC
τ min 317 M 319 M 320 M
255 0340 0117 0004
269 0328 0121 0005
284 0321 0126 0006
302 0320 0132 0006
321 0309 0138 0007
343 0307 0137 0007
368 0305 0150 0008
397 0299 0152 0009
430 0294 0161 0010
470 0284 0171 0012
517 0270 0176 0014
573 0261 0183 0016
643 0254 0186 0018
730 0246 0190 0021
842 0232 0211 0025
986 0213 0217 0028
Flow ramp experiment 4 210 degC
τ min 317 M 319 M 320 M
250 0305 0166 0012
193
263 0299 0165 0013
278 0294 0172 0014
295 0294 0172 0015
314 0282 0182 0017
335 0279 0186 0019
360 0269 0190 0021
388 0272 0201 0023
421 0247 0221 0030
460 0236 0218 0028
506 0230 0219 0032
562 0218 0222 0038
630 0231 0211 0042
716 0201 0235 0045
825 0188 0235 0051
968 0182 0239 0058
74 Chapter 4
741 Generated data set for the case study SNAr kinetics
Experiment 1
Time s 45 M 47 M 48 M 49 M
0 1 0 0 0
104232 0912548 0068648 0002878 279E-05
5078096 0715174 0266199 0011023 0000485
1475526 0464384 0521723 0020875 0002315
3331443 0269972 0708549 002876 0006042
5628294 0168854 080687 0031878 0009439
9017797 0099139 0856211 003494 0013887
2108206 0032979 088963 0036126 0024236
3328275 0015074 0929082 0036808 003211
4382468 0008534 0933212 0036452 0037487
600 0004209 0921486 0036363 0043389
194
Experiment 2
Time s 45 M 47 M 48 M 49 M
0 08 0 0 0
1302612 0703325 0092533 0003854 627E-05
5712155 0478466 0312694 0012573 0000883
1084263 0329335 044882 0018183 0002403
2064908 0176938 0596415 0023908 0005922
6941793 0014924 0723646 0029388 0023796
1516461 0000354 0725866 0029244 0051839
3009398 380E-07 066851 0026369 0099546
5153318 0 0621532 0024249 0155196
9253113 0 0545081 0019839 0239656
1200 0 0506326 0018372 0288136
Experiment 3
Time s 45 M 47 M 48 M 49 M
0 1 0 0 0
0962483 0873362 0112646 0004695 780E-05
1002158 0342803 0632465 0025508 0004215
2106925 0138132 0817645 0033569 001147
6078714 0008667 0899281 0037403 0036358
1010498 0000643 0895452 003658 0061674
1727609 714E-06 0851082 0034174 0101391
3082939 0 0806696 0030438 017491
5621972 0 069294 0025835 0270209
9040341 0 0598858 0021781 0384583
1600 0 0457229 0015241 0527733
Experiment 4
Time s 45 M 47 M 48 M 49 M
195
0 1 0 0 0
1044725 0854673 0149213 0006087 0000139
509551 0460925 0515756 0020548 0002257
2132233 0072138 0877848 0035074 0017175
4714859 0005208 0917717 0036551 0041614
6931167 00006 0887854 0035809 0061604
1280495 225E-06 086418 0033593 0115427
2886839 0 0741762 002754 0232766
7368751 0 0519088 0018297 0455041
1222483 0 0381306 0012248 060453
1800 0 0274267 0007936 0705143
Experiment 5
Time s 45 M 47 M 48 M 49 M
0 12 0 0 0
0849478 0999855 0175423 0007178 0000158
5548213 0466871 0712408 0028769 0004137
1181201 0191904 0969199 0039345 0012093
3500272 0010569 110712 0045047 0044862
911267 147E-05 1038677 0040673 0119288
1237999 690E-07 1005138 0040148 0158185
1953324 0 0920941 003614 0234604
4831808 0 0709117 0024989 0478645
632278 0 0609582 0021143 0562277
900 0 0502989 0016122 0680497
742 Generated data set for the case study Pentyne
Experiment 1
Time min 411 M 412 M 413 M
0 1 08 0
196
1293971 0973192 0803545 0011085
3972297 0958388 0766506 0033251
1843854 0857109 0663378 0141812
3290479 0770748 054892 0246498
5690479 0629294 0416498 0388829
9290479 0449379 025987 0548273
120 0369111 0164188 0644284
Experiment 2
Time min 411 M 412 M 413 M
0 12 15 0
1205027 1199383 1460822 0012139
3721389 1157799 1439238 0037013
1802628 1036602 1347405 0171608
5033117 077347 1092225 0421136
8633117 0582851 0871663 0614124
1403312 0359291 0678145 0833511
180 0259447 0551321 0936175
Experiment 3
Time min 411 M 412 M 413 M
0 1 1 0
1293971 0994904 0974041 0010778
3972297 0975053 0966892 0033053
1843854 086422 0871237 0145646
3290479 0750116 0752064 0246904
8090479 0508082 0506177 0504648
1529048 0276204 0271468 072687
240 0129659 0132753 0856012
197
743 Generated data set for the case study Ytterbium catalysis
Experiment 1
Time h 415 M 416 M 418 M
0 2 2 0
0054397 1950736 1962883 0040294
0386129 1737689 1725949 026888
0701874 1545843 1542334 0459994
1901874 0986091 0979723 1020241
3101874 0631223 0628196 136402
4301874 040357 0400764 1596431
6 0213539 0212908 1784115
Experiment 2
Time h 415 M 416 M 418 M
0 15 2 0
0029722 1499822 2000933 0004169
02413 1470961 1962226 0033316
0911826 1373396 1881085 0122394
1511826 1302576 1805505 0196746
2711826 1164105 1659122 0336104
3911826 1042952 1535555 0457449
6 085898 1357163 0642853
Experiment 3
Time h 415 M 416 M 418 M
0 14 18 0
0027487 1370804 1774104 003184
0106977 1284762 1675632 012038
0249912 114023 1539842 0264912
198
092138 0646932 1043942 0752256
152138 0389843 0794653 1012081
212138 0235788 0635663 1164374
3 0112972 0511689 1287393
Experiment 4
Time h 415 M 416 M 418 M
0 22 16 0
0043551 2153819 153798 005486
0241672 1906782 1311278 0288655
0439793 1706777 1105476 049592
0839793 1351856 0751683 0854071
1239793 1066839 0466383 1129747
1639793 0846621 0246217 1354339
2 0682943 0085826 1509085
75 Chapter 5
751 SNAr kinetics
7511 Experimental equipment
All experiments were run in an NMR tube using a dedicated 500 MHz
NMR spectrometer at The University of Cambridge as shown in Figure 751
199
Figure 751 The dedicated NMR spectrometer used for kinetic experiments in the SNAr
kinetics case study
7512 Kinetic experiments
In each experiment 246-trichloropyrimidine (700 microL 200 mM in CD3OD)
was warmedcooled to the required temperature in the 500 MHz NMR
spectrometer The NMR was then locked onto the solvent then the probe was
tuned and matched to the 1H nuclei then shimming ensued The spectrum of the
200 mM solution of 246-trichloropyrimidine was acquired
To this NMR tube a pre-cooledwarmed solution of CD3OD containing
200 mM ethyl 4-aminobutyrate hydrochloride and 600 mM Et3N (700 microL) was
added and mixed thoroughly by shaking the NMR tube This gave the desired
reaction concentration of 100 mM pyrimidine 100 mM amine and 300 mM Et3N
Spectra were acquired every ~80 seconds The software was used in each case
to obtain absolute integrals for each peak which were then converted to
200
concentrations based on the 246-trichloropyrimidine solution of known
concentration
7513 Example NMR spectra
An example lsquostackedrsquo NMR spectrum is shown in Figure 752 showing
the appearancedisappearance of peaks over time in the 25 degC experiment
Where the peak at 780 ppm corresponds to 246-trichloropyrimidine 666 ppm
corresponds to the 2-substituted product and 641 corresponds to the 4-substited
product
Figure 752 lsquoStackedrsquo NMR spectrum showing several NMR spectra over time in the 25 degC
experiment
7514 Raw data
Experiment 1 -25 degC
Time min 51 M 53 M 54 M
1455 0088818 0004156 0004562
1591667 0088538 0004229 0004611
1726667 0088465 0004295 0004727
1863333 0088063 0004362 0004842
1998333 008805 0004577 0004908
201
2133333 0087811 0004609 0004962
227 0087412 0004713 0005096
2405 0087133 0004827 0005202
2541667 0086922 0004901 0005268
2676667 008667 0004993 0005345
2813333 0086501 0005049 0005407
2948333 0086142 0005142 0005518
3083333 0085983 0005268 0005704
322 0085639 0005412 0005803
3355 0085286 0005468 0005826
3491667 0085108 0005589 000596
3626667 0084887 0005646 0005947
3763333 0084482 0005781 0006102
3898333 0084308 0005902 0006179
4035 0083927 0005914 000626
417 0083758 0006021 000639
4306667 0083386 0006157 0006496
4441667 0083205 0006154 0006574
4576667 0083093 0006298 0006627
4713333 008282 0006377 0006689
4848333 0082663 0006475 0006751
4985 0082501 0006492 0006786
512 0082273 000655 0006939
5256667 008206 0006658 0006902
5391667 008186 0006786 0007038
5526667 0081225 0006729 0007105
Experiment 2 0 degC
Time min 51 M 53 M 54 M
202
7333333 0072103 0007607 0008513
88 0070344 0008018 0008965
1016667 0068594 0008452 0009462
1151667 0068423 0008887 0009854
1288333 0066803 0009266 001028
1423333 0065829 0009635 0010682
156 0064594 0010002 0011061
1695 0063823 0010341 0011471
1831667 0062319 0010702 0011804
1966667 0061394 0010984 0012177
2101667 0060906 0011342 0012486
2238333 0059741 0011585 0012806
2373333 0058765 001182 0013095
251 0058315 0012151 0013445
2645 0057463 001241 0013671
278 0056496 0012685 0013978
2916667 0056066 00129 0014287
3051667 0055037 0013136 001449
3188333 0054482 0013382 0014789
3323333 0053852 0013629 0015023
3458333 0053151 0013804 0015225
3595 0052684 0014054 001548
373 0052192 0014261 0015707
3866667 005156 0014409 001589
4001667 0051008 0014613 0016133
4136667 0050399 0014842 0016311
4273333 0049812 0015017 0016498
4408333 0049557 0015136 0016666
4545 0048743 0015301 0016861
468 0048366 0015482 0017042
203
4816667 0047763 0015635 001723
4951667 0047326 0015831 0017433
5086667 0046947 0015973 0017573
5223333 0046384 0016088 0017747
5358333 0045991 0016243 0017903
5495 0045672 0016393 0018043
563 0045107 0016496 0018225
5766667 0044674 0016691 0018395
5901667 0044423 0016839 0018509
6036667 0044113 0016972 0018683
6173333 0043619 0017086 001884
Experiment 3 25 degC
Time min 51 M 53 M 54 M
3366667 0064314 0009652 0009883
48 0057052 0012118 0012863
615 0051792 0013813 0014922
75 0047939 0015186 0016476
8866667 0044748 0016215 0017819
1021667 0041922 0017079 0018798
1158333 0039664 0017878 0019678
1293333 0037598 0018491 0020463
1428333 0035777 0019052 0021122
1565 0034195 0019558 0021718
17 0032928 0019875 0022181
1836667 0031709 0020362 0022676
1971667 0030632 0020622 0023126
2106667 0029623 0020886 0023404
2243333 0028668 002128 0023818
204
2378333 0027704 0021452 002409
2515 0026937 0021641 0024389
265 0026303 0021884 0024635
2786667 0025572 0022112 0024925
2921667 0024988 0022265 0025126
3056667 0024358 0022417 0025261
3193333 0023747 0022601 0025533
3328333 0023156 0022788 0025713
3463333 0022678 0022896 0025943
36 0022158 0022984 0026042
3735 0021731 0023193 0026254
3871667 0021252 0023299 0026356
4006667 0020811 0023542 0026561
4143333 0020451 0023635 0026706
4278333 0019954 0023675 0026824
4413333 001972 0023743 0026953
455 0019374 0023807 0027033
4685 0019129 0023925 0027167
4821667 0018686 0024057 0027249
4956667 0018359 0024079 0027301
5093333 0018011 0024171 0027439
5228333 0017894 0024265 0027549
5363333 0017535 0024319 0027649
55 0017377 0024477 0027784
5635 001712 0024351 0027716
5771667 0016878 0024502 0027857
Experiment 4 50 degC
Time min 51 M 53 M 54 M
205
335 0044859 0017049 0028158
5066667 0033058 0020402 0034142
6416667 0028533 0021812 0036713
7766667 0025543 0022842 0038521
9133333 0022916 00235 0039813
105 0021041 0024107 004121
1185 0019498 0024602 0041829
132 0018156 0025096 0042681
1456667 0016918 0025264 0043145
1591667 0015895 0025503 0043496
1728333 0015031 0025778 0043978
1863333 0014386 0025935 0044504
20 0013754 0026166 0044669
2135 0013006 0026135 0045027
227 0012731 002645 004525
2406667 0012071 0026529 0045439
2541667 0011723 0026593 0045892
2678333 0011273 0026724 0046128
2813333 001075 0026737 004605
295 0010443 0026863 0046276
3085 0010126 0026964 0046178
3221667 0009967 0027158 0046613
3356667 0009483 00272 0046695
3493333 0009351 0027183 0047223
3628333 0009066 0027134 0047014
3763333 0008787 0027312 0047229
39 0008496 0027291 0047245
4035 000833 0027346 0047363
4171667 000802 0027313 0047267
4306667 0007943 0027459 0047585
206
4443333 0007797 0027504 0047612
4578333 0007612 0027442 0047469
4713333 0007363 0027731 0047777
485 0007162 0027549 0047689
4985 0007122 0027588 0047921
512 0006956 0027672 0048034
5256667 0006869 0027621 0047948
5391667 0006654 002781 0048184
5528333 0006511 0027703 0048181
5663333 0006367 0027739 0048193
5798333 0006367 0027751 0048241
752 PfBr
7521 Synthesis of PfBr material
To synthesise the PfBr material the synthesis reported by Tian and
Menard was approximately followed[249] To a suspension of magnesium turnings
(92 g 382 mmol) in anhydrous THF (5 mL) in a nitrogen atmosphere was added
05 mL of bromobenzene at room temperature to initiate the reaction The
reaction vessel was cooled to 0 degC using an ice bath and a solution of
bromobenzene in THF (12 M 270 mL) was added dropwise at 0 degC The reaction
medium was allowed to reach room temperature and stirred vigorously for 2
hours To this solution was added 9-fluorenone (301 g 186 mmol) in small
portions left to stir at room temperature for 1 hour The reaction was quenched
with dropwise addition of hydrochloric acid (1 M 100 mL) at 0 degC The solution
was extracted with Et2O (3 x 150 mL) and the combined organic layer was
washed with brine dried over MgSO4 filtered and concentrated under reduced
pressure to yield PfOH (426 g 89 ) NMR IR and mass spectroscopy analysis
confirmed the identity of the material
To prepare PfBr PfOH (361 g 140 mmol) was dissolved in toluene (150
mL) and aqueous HBr (48 ww 50 mL) was added at room temperature This
suspension was stirred vigorously at room temperature for 48 hours with the
vessel wrapped in foil to reduce light The mixture was extracted with toluene (3
207
x 100 mL) then the combined organic layer was washed with brine dried over
MgSO4 filtered and concentrated under reduced pressure to afford the crude
product The product was then recrystallised with hexane to afford PfBr (39 g 87
) 13C NMR IR and HPLC analysis confirmed the identity and purity of the
material as shown in Figure 753 Figure 754 and Figure 755 respectively
Figure 753 A 13C NMR confirming the presence of the PfBr material compared to literature
values to identify the material[249]
208
Figure 754 IR analysis of the PfBr material showing the absence of a hydroxy peak from any
residual PfOH
Figure 755 HPLC analysis of the PfBr material at 254 nm indicating that a pure product is
present
7522 Kinetic experiments
Three kinetic experiments were run at different temperatures 30 degC 35
degC and 40 degC For the first experiment at 30 degC alanine methyl ester
hydrochloride (0940 g 0007 mol) biphenyl (0195 g 0001 mol) and potassium
phosphate (35 g 0017 mol) were added to 5050 acetonitriledichloromethane
(375 mL) in a vessel A solution was then prepared of PfBr (0958 g 0003 mol)
in 5050 acetonitriledichloromethane (375 mL) and added to the reaction
vessel A sample was then immediately taken via HPLC then the stopwatch was
started to track the time of each injection This first HPLC serves as the artificial
209
zero time point then each subsequent HPLC injection followed every ~10
minutes thereafter
For the second experiment at 35 degC alanine methyl ester hydrochloride
(0977 g 0007 mol) biphenyl (0199 g 0001 mol) and potassium phosphate
(35 g 0017 mol) were added to 5050 acetonitriledichloromethane (375 mL)
in a vessel A solution was then prepared of PfBr (1017 g 0003 mol) in 5050
acetonitriledichloromethane (375 mL) and added to the reaction vessel A
sample was then immediately taken via HPLC then the stopwatch was started
to track the time of each injection This first HPLC serves as the artificial zero
time point then each subsequent HPLC injection followed every ~10 minutes
thereafter
For the third experiment at 40 degC alanine methyl ester hydrochloride
(0841 g 0006 mol) biphenyl (0219 g 0001 mol) and potassium phosphate
(35 g 0017 mol) were added to 5050 acetonitriledichloromethane (375 mL)
in a vessel A solution was then prepared of PfBr (1064 g 0003 mol) in 5050
acetonitriledichloromethane (375 mL) and added to the reaction vessel A
sample was then immediately taken via HPLC then the stopwatch was started
to track the time of each injection This first HPLC serves as the artificial zero
time point then each subsequent HPLC injection followed every ~10 minutes
thereafter
7523 HPLC analysis
All HPLC analysis was conducted using an Agilent 1100 series HPLC
instrument fitted with a Sigma Ascentis Express C18 reverse phase column (5cm
x 46mm 27 microm) Biphenyl was used as an internal standard The column
temperature was 40 degC and the HPLC method is shown
Time min A (water 01
TFA)
B (acetonitrile
01 TFA) Flow rate mL min-1
000 80 20 1
700 15 85 1
800 15 85 1
810 80 20 1
210
An example HPLC chromatogram during a kinetic experiment is shown in
Figure 756
Figure 756 An example HPLC chromatogram at 230 nm during a kinetic experiment in the
PfBr case study
7524 Raw data
Experiment 1 30 degC
Time min 57 M 58 M
0 0029401 0009756
95 0028029 0011516
195 0026429 0013131
29 0024664 0014922
40 0022779 0016856
50 0021252 0019153
605 0019363 0020372
71 0017813 0022065
83 001612 0023823
Experiment 2 35 degC
Time min 57 M 58 M
0 0036314 0006684
95 0030494 0011469
20 0028083 001372
315 0025271 0016536
41 0023355 0018562
211
51 0021259 0020741
625 0017572 0023705
Experiment 3 40 degC
Time min 57 M 58 M
0 0037032 0005772
105 0029931 0013994
205 0026302 0017446
305 0022947 002101
40 0020038 0023665
505 0017687 0025741
605 0016003 0027979
753 Maleic acid
7531 Example NMR
An example NMR spectrum is shown in Figure 754 where the peaks of
each species are highlighted
212
Figure 757 An example NMR spectrum from the maleic acid case study
7532 Raw data
Experiment 1 40 degC
Time min 513 M 515 M 516 M
0 0761 0 0
120 066207 0097408 0002283
240 0554769 0201665 0004947
360 0485518 0265589 0009893
Experiment 2 50 degC
Time min 513 M 515 M 516 M
0 0404344 0003268 0
325 0364451 0037657 186E-05
605 0346181 0071026 0000373
875 0319523 0095447 0001659
1225 0299017 0113343 0003225
2175 0234143 01661 0006264
2885 0204502 0198537 0009507
4175 015883 0230601 0015846
6875 0107378 0276833 0028336
13425 0052198 0313931 0053689
17825 0033649 0310389 0063196
28375 001799 0307033 0083516
Experiment 3 50 degC
Time min 513 M 515 M 516 M
0 0787537 0007088 0
28 0706604 0088537 565E-04
60 0625073 0164707 0002563
213
95 0556919 0226165 0006126
118 0530477 0271021 0007904
148 0480567 0308812 0011678
178 0426661 0316753 001425
208 0405376 035592 0020026
242 0384453 0382377 0021991
298 0344452 0431289 0029072
358 0299951 0456885 0034314
613 0205957 0541791 0061416
1306 0092916 0582232 0105274
1549 0076529 0596801 0119691
1768 0063259 0597105 0130915
Experiment 4 55 degC
Time min 513 M 515 M 516 M
0 0687045 0103644 0000811
30 0597449 019108 297E-03
60 0531145 0252908 0007448
90 0479052 0301502 0010947
168 0365378 0402913 0023209
228 031788 0443385 0030235
283 028467 0469404 0037426
348 0221288 0520375 0049837
408 0200913 0533579 0057007
Experiment 4 60 degC
Time min 513 M 515 M 516 M
0 0738693 0014307 0
60 0442764 0296682 136E-02
214
120 0335085 0389301 0029367
180 0265809 0447282 0040662
240 0224394 0475143 0053463
360 0117468 0551196 0084336
480 0070029 0575292 0107679
1320 0015813 0538395 0198792
76 Computational setup
761 Chapter 2 - 3
For all computation in Chapter 2 - 3 MATLAB 2018a was used on a
desktop computer with a 4-core Intel i5-2310 processor
762 Chapter 4 - 5
For all computation in Chapter 4 - 5 MATLAB 2020a was used on a
custom built laptop with an 8-core AMD Ryzen 7 4800H processor
Chapter 8 References
1 Miyaura N K Yamada and A Suzuki A new stereospecific cross-coupling by the palladium-catalyzed reaction of 1-alkenylboranes with 1-alkenyl or 1-alkynyl halides Tetrahedron Letters 1979 20(36) p 3437-3440
2 Sonogashira K Y Tohda and N Hagihara A convenient synthesis of acetylenes catalytic substitutions of acetylenic hydrogen with bromoalkenes iodoarenes and bromopyridines Tetrahedron Letters 1975 16(50) p 4467-4470
3 Wittig G and W Haag Uumlber Triphenyl‐phosphinmethylene als olefinbildende Reagenzien (II Mitteil 1) Chemische Berichte 1955 88(11) p 1654-1666
4 Baumann M et al A Perspective on Continuous Flow Chemistry in the Pharmaceutical Industry Organic Process Research amp Development 2020
5 Noeacutel T Flow into the Chemistry Curriculum Chemistry World 2019 6 Reizman BJ and KF Jensen Feedback in flow for accelerated reaction
development Accounts of Chemical Research 2016 49(9) p 1786-1796
7 Plutschack MB et al The Hitchhikerrsquos Guide to Flow Chemistry Chemical Reviews 2017 117(18) p 11796-11893
215
8 Granda JM et al Controlling an organic synthesis robot with machine learning to search for new reactivity Nature 2018 559(7714) p 377-381
9 Peela NR IC Lee and DG Vlachos Design and fabrication of a high-throughput microreactor and its evaluation for highly exothermic reactions Industrial amp Engineering Chemistry Research 2012 51(50) p 16270-16277
10 Rivera NR et al Investigation of a Flow Step Clogging Incident A Precautionary Note on the Use of THF in Commercial-Scale Continuous Process Organic Process Research amp Development 2019 23(11) p 2556-2561
11 Chapman MR et al Simple and versatile laboratory scale CSTR for multiphasic continuous-flow chemistry and long residence times Organic Process Research amp Development 2017 21(9) p 1294-1301
12 Guan F et al A universal reactor platform for batch and flow application to homogeneous and heterogeneous hydrogenation Reaction Chemistry amp Engineering 2020 5(10) p 1903-1908
13 Muumlller G et al Continuous chemistry in microreaction systems for practical use Chimia International Journal for Chemistry 2006 60(9) p 618-622
14 Pennemann H et al Benchmarking of microreactor applications Organic Process Research amp Development 2004 8(3) p 422-439
15 Schwalbe T V Autze and G Wille Chemical synthesis in microreactors Chimia-Zurich 2002 56(11) p 636-646
16 Fletcher PD et al Micro reactors principles and applications in organic synthesis Tetrahedron 2002 58(24) p 4735-4757
17 Haswell SJ and P Watts Green chemistry synthesis in micro reactors Green Chemistry 2003 5(2) p 240-249
18 Hessel V and H Loumlwe Organic synthesis with microstructured reactors Chemical Engineering Technology Industrial Chemistry‐Plant Equipment‐Process Engineering‐Biotechnology 2005 28(3) p 267-284
19 Wilson NG and T McCreedy On-chip catalysis using a lithographically fabricated glass microreactormdashthe dehydration of alcohols using sulfated zirconia Chemical Communications 2000(9) p 733-734
20 Wiles C et al 1 4-Addition of enolates to α β-unsaturated ketones within a micro reactor Lab on a Chip 2002 2(2) p 62-64
21 Wegner J S Ceylan and A Kirschning Flow chemistryndasha key enabling technology for (multistep) organic synthesis Advanced Synthesis Catalysis 2012 354(1) p 17-57
22 Nagaki A et al Lithiation of 1 2‐Dichloroethene in Flow Microreactors
Versatile Synthesis of Alkenes and Alkynes by Precise Residence‐Time Control Angewandte Chemie International Edition 2012 51(13) p 3245-3248
23 Mason BP et al Greener approaches to organic synthesis using microreactor technology Chemical Reviews 2007 107(6) p 2300-2318
24 Newman SG and KF Jensen The role of flow in green chemistry and engineering Green Chemistry 2013 15(6) p 1456-1472
25 Riva E et al Reaction of Grignard reagents with carbonyl compounds under continuous flow conditions Tetrahedron 2010 66(17) p 3242-3247
216
26 Baumann M and IR Baxendale The synthesis of active pharmaceutical ingredients (APIs) using continuous flow chemistry Beilstein Journal of Organic Chemistry 2015 11(1) p 1194-1219
27 Bogdan AR et al The continuous‐flow synthesis of ibuprofen Angewandte Chemie International Edition 2009 48(45) p 8547-8550
28 Sheldon RA Catalysis the key to waste minimization Journal of Chemical Technology amp Biotechnology International Research in Process Environmental amp Clean Technology 1997 68(4) p 381-388
29 Kummer A T Varga and L Nagy Semi-batch reactor control with NMPC avoiding thermal runaway Computers and Chemical Engineering 2020 134 p 106694
30 Kao C-S and K-H Hu Acrylic reactor runaway and explosion accident analysis Journal of Loss Prevention in the Process Industries 2002 15(3) p 213-222
31 Fabiano B et al A perspective on Seveso accident based on cause-consequences analysis by three different methods Journal of Loss Prevention in the Process Industries 2017 49 p 18-35
32 Malet-Sanz L and F Susanne Continuous flow synthesis A pharma perspective Journal of Medicinal Chemistry 2012 55(9) p 4062-4098
33 Kunz U and T Turek Flow through reactors for organic chemistry directly electrically heated tubular mini reactors as an enabling technology for organic synthesis Beilstein Journal of Organic Chemistry 2009 5(1) p 70
34 Kappe CO Controlled microwave heating in modern organic synthesis Angewandte Chemie International Edition 2004 43(46) p 6250-6284
35 Yoshida Ji A Nagaki and T Yamada Flash chemistry fast chemical synthesis by using microreactors Chemistry - A European Journal 2008 14(25) p 7450-7459
36 van der Linden JJ et al Investigation of the Moffattminus Swern oxidation in a continuous flow microreactor system Organic Process Research amp Development 2008 12(5) p 911-920
37 Cutler AH MJ Antal Jr and M Jones Jr A critical evaluation of the plug-flow idealization of tubular-flow reactor data Industrial amp Engineering Chemistry Research 1988 27(4) p 691-697
38 Lebl R et al Scalable continuous flow hydrogenations using PdAl2O3-coated rectangular cross-section 3D-printed static mixers Catalysis Today 2020
39 Jolley KE MR Chapman and AJ Blacker A general and atom-efficient continuous-flow approach to prepare amines amides and imines via reactive N-chloramines Beilstein Journal of Organic Chemistry 2018 14(1) p 2220-2228
40 Hessel V Novel process windowsndashgate to maximizing process intensification via flow chemistry Chemical Engineering Technology Industrial Chemistry-Plant Equipment-Process Engineering-Biotechnology 2009 32(11) p 1655-1681
41 Bogdan AR and NW Sach The Use of Copper Flow Reactor Technology for the Continuous Synthesis of 1 4‐Disubstituted 1 2 3‐Triazoles Advanced Synthesis Catalysis 2009 351(6) p 849-854
42 Hornung CH et al A microcapillary flow disc reactor for organic synthesis Organic Process Research amp Development 2007 11(3) p 399-405
217
43 Acke DR and CV Stevens Study of the Baylisminus Hillman reaction in a microreactor environment first continuous production of Baylisminus Hillman adducts Organic Process Research amp Development 2006 10(3) p 417-422
44 McQuade DT and PH Seeberger Applying flow chemistry Methods materials and multistep synthesis J Org Chem 2013 78(13) p 6384-6389
45 Razzaq T and CO Kappe Continuous Flow Organic Synthesis under High‐TemperaturePressure Conditions ChemistryndashAn Asian Journal 2010 5(6) p 1274-1289
46 Hartman RL Managing solids in microreactors for the upstream continuous processing of fine chemicals Organic Process Research amp Development 2012 16(5) p 870-887
47 Reichardt C Solvent effects in organic chemistry 1979 Verlag Chemie 48 Reichardt C and T Welton Solvents and solvent effects in organic
chemistry 2011 John Wiley amp Sons 49 Singh D and PL Dhepe An efficient catalytic transfer hydrogenation-
hydrodeoxygenation of lignin derived monomers Investigating catalyst properties-activity correlation Catalysis Communications 2021 149 p 106220
50 Baxendale IR et al Multistep synthesis using modular flow reactors BestmannndashOhira reagent for the formation of alkynes and triazoles Angewandte Chemie 2009 121(22) p 4077-4081
51 Alam MP et al C O bond formation in a microfluidic reactor high yield S N Ar substitution of heteroaryl chlorides Tetrahedron letters 2016 57(19) p 2059-2062
52 Gutmann B et al On the Fischer Indole Synthesis of 7-Ethyltryptophol Mechanistic and Process Intensification Studies under Continuous Flow Conditions Organic Process Research amp Development 2013 17(2) p 294-302
53 Marre S Y Roig and C Aymonier Supercritical microfluidics Opportunities in flow-through chemistry and materials science The Journal of Supercritical Fluids 2012 66 p 251-264
54 Savage PE Organic chemical reactions in supercritical water Chemical reviews 1999 99(2) p 603-622
55 Adschiri T et al Green materials synthesis with supercritical water Green Chemistry 2011 13(6) p 1380-1390
56 Munshi P and S Bhaduri Supercritical CO 2 a twenty-first century solvent for the chemical industry Current Science (00113891) 2009 97(1)
57 Eckert CA et al Sustainable reactions in tunable solvents The Journal of Physical Chemistry B 2004 108(47) p 18108-18118
58 ONeil A and JJ Watkins Fabrication of device nanostructures using supercritical fluids MRS bulletin 2005 30(12) p 967-975
59 Romang AH and JJ Watkins Supercritical fluids for the fabrication of semiconductor devices emerging or missed opportunities Chemical reviews 2010 110(1) p 459
60 Marre S F Cansell and C Aymonier Tailor-made surface properties of particles with a hydrophilic or hydrophobic polymer shell mediated by supercritical CO2 Langmuir 2008 24(1) p 252
218
61 Cansell F and C Aymonier Design of functional nanostructured materials using supercritical fluids The Journal of Supercritical Fluids 2009 47(3) p 508-516
62 Chamberlain TW et al Catalytic nanoreactors in continuous flow hydrogenation inside single-walled carbon nanotubes using supercritical CO 2 Chemical Communications 2014 50(40) p 5200-5202
63 Devetta L et al Kinetic experiments and modeling of a three-phase catalytic hydrogenation reaction in supercritical CO 2 Catalysis Today 1999 48(1) p 337-345
64 Han X and M Poliakoff Continuous reactions in supercritical carbon dioxide problems solutions and possible ways forward Chemical Society Reviews 2012 41(4) p 1428-1436
65 Licence P et al Chemical reactions in supercritical carbon dioxide from laboratory to commercial plant Green Chemistry 2003 5(2) p 99-104
66 Leitner W Supercritical carbon dioxide as a green reaction medium for catalysis Accounts of chemical research 2002 35(9) p 746-756
67 McHugh M and V Krukonis Supercritical fluid extraction principles and practice 2013 Elsevier
68 Hitzler MG et al Selective catalytic hydrogenation of organic compounds in supercritical fluids as a continuous process Organic Process Research amp Development 1998 2(3) p 137-146
69 Cason JP and CB Roberts Metallic copper nanoparticle synthesis in AOT reverse micelles in compressed propane and supercritical ethane solutions The Journal of Physical Chemistry B 2000 104(6) p 1217-1221
70 Hyde JR et al Continuous catalytic reactions in supercritical fluids Applied Catalysis A General 2001 222(1) p 119-131
71 Hoffmann N Photochemical reactions of aromatic compounds and the concept of the photon as a traceless reagent Photochemical amp Photobiological Sciences 2012 11(11) p 1613-1641
72 Hoffmann N Photochemical reactions as key steps in organic synthesis Chemical Reviews 2008 108(3) p 1052
73 Knowles JP LD Elliott and KI Booker-Milburn Flow photochemistry Old light through new windows Beilstein journal of organic chemistry 2012 8 p 2025
74 Hook BD et al A practical flow reactor for continuous organic photochemistry The Journal of organic chemistry 2005 70(19) p 7558-7564
75 Schuster EM and P Wipf Photochemical flow reactions Israel Journal of Chemistry 2014 54(4) p 361-370
76 Yoshida J-i et al Modern strategies in electroorganic synthesis Chemical reviews 2008 108(7) p 2265-2299
77 Watts K A Baker and T Wirth Electrochemical synthesis in microreactors Journal of Flow Chemistry 2014 4(1) p 2-11
78 Horii D T Fuchigami and M Atobe A new approach to anodic substitution reaction using parallel laminar flow in a micro-flow reactor Journal of the American Chemical Society 2007 129(38) p 11692-11693
79 Horii D et al A novel electrosynthetic system for anodic substitution reactions by using parallel laminar flow in a microflow reactor Chemistry-A European Journal 2008 14(33) p 10382-10387
219
80 ZNIDARŠIC-PLAZL P Enzymatic microreactors utilizing non-aqueous media Chimica Oggi-Chemistry Today 2014 32 p 1
81 Rao NN et al Continuous biocatalytic processes Organic Process Research amp Development 2009 13(3) p 607-616
82 Babich L et al Continuous‐Flow Reactor‐Based Enzymatic Synthesis
of Phosphorylated Compounds on a Large Scale Chemistry-A European Journal 2012 18(21) p 6604-6609
83 Jas G and A Kirschning Continuous flow techniques in organic synthesis Chemistry-A European Journal 2003 9(23) p 5708-5723
84 Chen P et al A practical high through-put continuous process for the synthesis of chiral cyanohydrins The Journal of organic chemistry 2002 67(23) p 8251-8253
85 Liu Z et al Combined biosynthetic pathway for de novo production of UDP‐galactose catalysis with multiple enzymes immobilized on agarose
beads ChemBioChem 2002 3(4) p 348-355 86 Kobayashi S H Ishitani and S Nagayama Lanthanide triflate catalyzed
imino Diels-Alder reactions convenient syntheses of pyridine and quinoline derivatives Synthesis 1995 1995(09) p 1195-1202
87 Usutani H et al Generation and reactions of o-bromophenyllithium without benzyne formation using a microreactor Journal of the American Chemical Society 2007 129(11) p 3046-3047
88 Britton J and CL Raston Multi-step continuous-flow synthesis Chemical Society Reviews 2017 46(5) p 1250-1271
89 Snead DR and TF Jamison A three‐minute synthesis and purification
of ibuprofen Pushing the limits of continuous‐flow processing Angewandte Chemie International Edition 2015 54(3) p 983-987
90 Sahoo HR JG Kralj and KF Jensen Multistep Continuous‐Flow Microchemical Synthesis Involving Multiple Reactions and Separations Angewandte Chemie 2007 119(30) p 5806-5810
91 Hartman RL et al Multistep microchemical synthesis enabled by microfluidic distillation Angewandte Chemie International Edition 2010 49(5) p 899-903
92 Gloumlckner S et al The rapid synthesis of oxazolines and their heterogeneous oxidation to oxazoles under flow conditions Organic amp biomolecular chemistry 2015 13(1) p 207-214
93 Roberge DM et al Microreactor technology a revolution for the fine chemical and pharmaceutical industries Chemical engineering amp technology 2005 28(3) p 318-323
94 Exarchou V et al LC-UV-solid-phase extraction-NMR-MS combined with a cryogenic flow probe and its application to the identification of compounds present in Greek oregano Analytical Chemistry 2003 75(22) p 6288-6294
95 Benito-Lopez F et al Optical fiber-based on-line UVVis spectroscopic monitoring of chemical reaction kinetics under high pressure in a capillary microreactor Chemical Communications 2005(22) p 2857-2859
96 Mozharov S et al Improved method for kinetic studies in microreactors using flow manipulation and noninvasive Raman spectrometry Journal of the American Chemical Society 2011 133(10) p 3601-3608
97 Song H and RF Ismagilov Millisecond kinetics on a microfluidic chip using nanoliters of reagents Journal of the American Chemical Society 2003 125(47) p 14613-14619
220
98 Martinuzzi I et al Reaction mechanism for glycerol dehydration in the gas phase over a solid acid catalyst determined with on-line gas chromatography Chemical Engineering Science 2014 116 p 118-127
99 Moret S et al Microwave assisted saponification (MAS) followed by on-line liquid chromatography (LC)ndashgas chromatography (GC) for high-throughput and high-sensitivity determination of mineral oil in different cereal-based foodstuffs Food chemistry 2016 196 p 50-57
100 Grunwaldt J-D and BS Clausen Combining XRD and EXAFS with on-line catalytic studies for in situ characterization of catalysts Topics in Catalysis 2002 18(1) p 37-43
101 De Beer T et al In‐line and real‐time process monitoring of a freeze drying process using Raman and NIR spectroscopy as complementary process analytical technology (PAT) tools Journal of pharmaceutical sciences 2009 98(9) p 3430-3446
102 Ward H and FE Sistare On-line determination and control of the water content in a continuous conversion reactor using NIR spectroscopy Analytica chimica acta 2007 595(1) p 319-322
103 Cervera-Padrell AE et al Monitoring and control of a continuous Grignard reaction for the synthesis of an active pharmaceutical ingredient intermediate using inline NIR spectroscopy Organic Process Research amp Development 2012 16(5) p 901-914
104 Bristow TW et al On-line monitoring of continuous flow chemical synthesis using a portable small footprint mass spectrometer Journal of The American Society for Mass Spectrometry 2014 25(10) p 1794-1802
105 Roscioli KM et al Real time pharmaceutical reaction monitoring by electrospray ion mobility-mass spectrometry International Journal of Mass Spectrometry 2013 336 p 27-36
106 Mathieson JS et al Continuous parallel ESI-MS analysis of reactions carried out in a bespoke 3D printed device Beilstein journal of nanotechnology 2013 4 p 285
107 Robert J and A JohnaacuteBlacker Online quantitative mass spectrometry for the rapid adaptive optimisation of automated flow reactors Reaction Chemistry amp Engineering 2016 1(1) p 96-100
108 Browne DL et al Continuous flow reaction monitoring using an on‐line miniature mass spectrometer Rapid Communications in Mass Spectrometry 2012 26(17) p 1999-2010
109 Zhang J et al Design and scaling up of microchemical systems a review Annual review of chemical and biomolecular engineering 2017 8 p 285-305
110 Rasheed M and T Wirth Fast optimisation of a Diels-Alder reaction in a flow microreactor by in-line HPLC analysis Chemistry Today 2011 29(3) p 56
111 Welch CJ et al Online analysis of flowing streams using microflow HPLC Organic Process Research amp Development 2009 13(5) p 1022-1025
112 Carter CF et al ReactIR flow cell a new analytical tool for continuous flow chemical processing Organic Process Research amp Development 2010 14(2) p 393-404
113 Malet-Sanz L et al Preparation of arylsulfonyl chlorides by chlorosulfonylation of in situ generated diazonium salts using a
221
continuous flow reactor Organic amp biomolecular chemistry 2010 8(23) p 5324-5332
114 Carter CF et al The continuous flow synthesis of butane-2 3-diacetal protected building blocks using microreactors Organic amp biomolecular chemistry 2010 8(7) p 1588-1595
115 Smith CJ et al A fully automated multistep flow synthesis of 5-amino-4-cyano-1 2 3-triazoles Organic amp biomolecular chemistry 2011 9(6) p 1938-1947
116 Floyd TM MA Schmidt and KF Jensen Silicon micromixers with infrared detection for studies of liquid-phase reactions Industrial amp engineering chemistry research 2005 44(8) p 2351-2358
117 Carter CF et al Synthesis of acetal protected building blocks using flow chemistry with flow IR analysis preparation of butane-2 3-diacetal tartrates Organic amp biomolecular chemistry 2009 7(22) p 4594-4597
118 Sans V et al A self optimizing synthetic organic reactor system using real-time in-line NMR spectroscopy Chemical science 2015 6(2) p 1258-1264
119 Maiwald M et al Quantitative high-resolution on-line NMR spectroscopy in reaction and process monitoring Journal of Magnetic Resonance 2004 166(2) p 135-146
120 Maiwald M et al Quantitative on-line high-resolution NMR spectroscopy in process engineering applications Analytical and bioanalytical chemistry 2003 375(8) p 1111-1115
121 Dalitz F et al Process and reaction monitoring by low-field NMR spectroscopy Progress in nuclear magnetic resonance spectroscopy 2012 60 p 52-70
122 Silva Elipe MV and RR Milburn Monitoring chemical reactions by low‐field benchtop NMR at 45 MHz pros and cons Magnetic Resonance in Chemistry 2016 54(6) p 437-443
123 Goldbach M et al Preparation of Grignard reagents from magnesium metal under continuous flow conditions and on-line monitoring by NMR spectroscopy Tetrahedron Letters 2016 57(1) p 122-125
124 Houben C and AA Lapkin Automatic discovery and optimization of chemical processes Current Opinion in Chemical Engineering 2015 9 p 1-7
125 Cox BG Modern liquid phase kinetics 1994 Oxford University Press 126 Perrin CL Linear or nonlinear least-squares analysis of kinetic data
Journal of Chemical Education 2017 94(6) p 669-672 127 Michaelis L and ML Menten Die kinetik der invertinwirkung 2007
Universitaumltsbibliothek Johann Christian Senckenberg 128 Johnson KA A century of enzyme kinetic analysis 1913 to 2013 FEBS
Letters 2013 587(17) p 2753-2766 129 Lineweaver H and D Burk The determination of enzyme dissociation
constants Journal of the American Chemical Society 1934 56(3) p 658-666
130 Nielsen CD-T and J Bureacutes Visual kinetic analysis Chemical Science 2019 10(2) p 348-353
131 Blackmond DG Reaction progress kinetic analysis a powerful methodology for mechanistic studies of complex catalytic reactions Angewandte Chemie International Edition 2005 44(28) p 4302-4320
222
132 Rosner T et al Kinetic studies of Heck coupling reactions using palladacycle catalysts experimental and kinetic modeling of the role of dimer species Journal of the American Chemical Society 2001 123(9) p 1848-1855
133 Nielsen LP et al Mechanistic investigation leads to a synthetic improvement in the hydrolytic kinetic resolution of terminal epoxides Journal of the American Chemical Society 2004 126(5) p 1360-1362
134 Baxter RD et al Mechanistic rationalization of unusual kinetics in Pd-catalyzed CndashH olefination Journal of the American Chemical Society 2012 134(10) p 4600-4606
135 Blackmond DG Kinetic profiling of catalytic organic reactions as a mechanistic tool Journal of the American Chemical Society 2015 137(34) p 10852-10866
136 Bureacutes J A simple graphical method to determine the order in catalyst Angewandte Chemie International Edition 2016 55(6) p 2028-2031
137 Bureacutes J Variable time normalization analysis General graphical elucidation of reaction orders from concentration profiles Angewandte Chemie International Edition 2016 55(52) p 16084-16087
138 Mathew JS et al Investigations of Pd-catalyzed ArX coupling reactions informed by reaction progress kinetic analysis The Journal of Organic Chemistry 2006 71(13) p 4711-4722
139 Streuff J et al Mechanism of the tiIII-catalyzed acyloin-type umpolung a catalyst-controlled radical reaction Journal of the American Chemical Society 2015 137(45) p 14396-14405
140 Lin S and EN Jacobsen Thiourea-catalysed ring opening of episulfonium ions with indole derivatives by means of stabilizing non-covalent interactions Nature Chemistry 2012 4(10) p 817
141 Noda H et al Catalytic asymmetric synthesis of CF 3-substituted tertiary propargylic alcohols via direct aldol reaction of α-N 3 amide Chemical Science 2017 8(4) p 3260-3269
142 Lundberg H et al Mechanistic elucidation of zirconium-catalyzed direct amidation Journal of the American Chemical Society 2017 139(6) p 2286-2295
143 Vasilenko V CK Blasius and LH Gade One-Pot Sequential Kinetic Profiling of a Highly Reactive Manganese Catalyst for Ketone Hydroboration Leveraging σ-Bond Metathesis via Alkoxide Exchange Steps Journal of the American Chemical Society 2018 140(29) p 9244-9254
144 Franceschini G and S Macchietto Model-based design of experiments for parameter precision State of the art Chemical Engineering Science 2008 63(19) p 4846-4872
145 Galvanin F S Macchietto and F Bezzo Model-based design of parallel experiments Industrial amp Engineering Chemistry Research 2007 46(3) p 871-882
146 Waldron C et al Model-based design of transient flow experiments for the identification of kinetic parameters Reaction Chemistry amp Engineering 2020 5(1) p 112-123
147 Von Stosch M et al Hybrid semi-parametric modeling in process systems engineering Past present and future Computers and Chemical Engineering 2014 60 p 86-101
223
148 de Juan A et al Combining hard-and soft-modelling to solve kinetic problems Chemometrics Intelligent Laboratory Systems 2000 54(2) p 123-141
149 de Carvalho AR et al Comparison of PLS and kinetic models for a second-order reaction as monitored using ultraviolet visible and mid-infrared spectroscopy Talanta 2006 68(4) p 1190-1200
150 Fath V et al Efficient Kinetic Data Acquisition and Model Prediction Continuous Flow Microreactors Inline FT-IR Spectroscopy and Self-modeling Curve Resolution Organic Process Research amp Development 2020
151 Toch K JW Thybaut and GB Marin A systematic methodology for kinetic modeling of chemical reactions applied to n‐hexane hydroisomerization AIChE Journal 2015 61(3) p 880-892
152 Yang S-T X Liu and Y Zhang Metabolic engineeringndashapplications methods and challenges in Bioprocessing for Value-Added Products from Renewable Resources 2007 Elsevier p 73-118
153 Vasquez E and T Eldredge Process modeling for hydrocarbon fuel conversion in Advances in Clean Hydrocarbon Fuel Processing 2011 Elsevier p 509-545
154 Paul S V Kurin and S Whiteson Fast Efficient Hyperparameter Tuning for Policy Gradient Methods in Advances in Neural Information Processing Systems 2019
155 Wistuba M N Schilling and L Schmidt-Thieme Scalable gaussian process-based transfer surrogates for hyperparameter optimization Machine Learning 2018 107(1) p 43-78
156 Lerman P Fitting segmented regression models by grid search Journal of the Royal Statistical Society Series C 1980 29(1) p 77-84
157 Huang C-YR C-Y Lai and K-TT Cheng Fundamentals of algorithms in Electronic Design Automation 2009 Elsevier p 173-234
158 Boyd SP and L Vandenberghe Convex optimization 2004 Cambridge university press p 1-16
159 Vasiljević D Comparison of optimization algorithms in Classical and Evolutionary Algorithms in the Optimization of Optical Systems 2002 Springer p 83-88
160 Inuiguchi M and J Ramık Possibilistic linear programming a brief review of fuzzy mathematical programming and a comparison with stochastic programming in portfolio selection problem Fuzzy Sets amp Systems 2000 111(1) p 3-28
161 Beacutenichou M et al Experiments in mixed-integer linear programming Mathematical Programming 1971 1(1) p 76-94
162 Kuhn HW and AW Tucker Nonlinear programming in Traces and emergence of nonlinear programming 2014 Springer p 247-258
163 Bregman LM The relaxation method of finding the common point of convex sets and its application to the solution of problems in convex programming USSR Computational Mathetmatics and Mathematical Physics 1967 7(3) p 200-217
164 Frank M and P Wolfe An algorithm for quadratic programming Naval Research Logistics Quarterly 1956 3(1‐2) p 95-110
165 Drummond LG and BF Svaiter A steepest descent method for vector optimization Journal of Computational amp Applied Mathematics 2005 175(2) p 395-414
224
166 Clayton AD et al Algorithms for the self-optimisation of chemical reactions Reaction Chemistry amp Engineering 2019 4(9) p 1545-1554
167 Spendley W GR Hext and FR Himsworth Sequential application of simplex designs in optimisation and evolutionary operation Technometrics 1962 4(4) p 441-461
168 Nelder JA and R Mead A simplex method for function minimization The Computer Journal 1965 7(4) p 308-313
169 Byrd RH JC Gilbert and J Nocedal A trust region method based on interior point techniques for nonlinear programming Mathematical Programming 2000 89(1) p 149-185
170 Waltz RA et al An interior algorithm for nonlinear optimization that combines line search and trust region steps Mathematical Programming 2006 107(3) p 391-408
171 Whitley D A genetic algorithm tutorial Statistics amp Computing 1994 4(2) p 65-85
172 Brochu E VM Cora and N De Freitas A tutorial on Bayesian optimization of expensive cost functions with application to active user modeling and hierarchical reinforcement learning preprint arXiv10122599 2010
173 Tsu J VHG Diacuteaz and MJ Willis Computational approaches to kinetic model selection Computers and Chemical Engineering 2019 121 p 618-632
174 de la Mare PBD Reaction Mechanism Encyclopaeligdia Britannica 2008 [cited 2020 April 13] Available from httpswwwbritannicacomsciencereaction-mechanism
175 Carey FA and RJ Sundberg Study and Description of Organic Reaction Mechanisms Advanced Organic Chemistry Part A Structure amp Mechanisms 2000 p 187-261
176 Willis MJ and M von Stosch Inference of chemical reaction networks using mixed integer linear programming Computers and Chemical Engineering 2016 90 p 31-43
177 Aris R and R Mah Independence of chemical reactions Industrial Engineering Chemistry Fundamentals 1963 2(2) p 90-94
178 Bonvin D and D Rippin Target factor analysis for the identification of stoichiometric models Chemical Engineering Science 1990 45(12) p 3417-3426
179 Amrhein M B Srinivasan and D Bonvin Target factor analysis of reaction data Use of data pre-treatment and reaction-invariant relationships Chemical Engineering Science 1999 54(5) p 579-591
180 Georgakis C and R Lin Stoichiometric Modeling of Complex Pharmaceutical Reactions in Proceedings of the Annual AIChE meeting in Cincinnati OH November 2005
181 Brendel M D Bonvin and W Marquardt Incremental identification of kinetic models for homogeneous reaction systems Chemical Engineering Science 2006 61(16) p 5404-5420
182 Bhatt N et al Incremental identification of reaction systemsmdashA comparison between rate-based and extent-based approaches Chemical Engineering Science 2012 83 p 24-38
183 Burnham SC et al Inference of chemical reaction networks Chemical Engineering Science 2008 63(4) p 862-873
225
184 Crampin EJ S Schnell and PE McSharry Mathematical and computational techniques to deduce complex biochemical reaction mechanisms Progress in Biophysics amp Molecular Biology 2004 86(1) p 77-112
185 Searson DP et al Inference of chemical reaction networks using hybrid s-system models Chemical Product amp Process Modelling 2007 2(1)
186 Srividhya J et al Reconstructing biochemical pathways from time course data Proteomics 2007 7(6) p 828-838
187 Searson DP MJ Willis and A Wright Reverse Engineering Chemical Reaction Networks from Time Series Data Statistical Modelling of Molecular Descriptors in QSARQSPR 2014 2(12)
188 Koza JR et al Automatic computational discovery of chemical reaction networks using genetic programming in Computational Discovery of Scientific Knowledge 2007 Springer p 205-227
189 Hii CJ AR Wright and MJ Willis Utilizing a genetic algorithm to elucidate chemical reaction networks An experimental case study International Journal of Chemical Engineering Applications 2014 5(6) p 516
190 Chellaboina V et al Modeling and analysis of mass-action kinetics IEEE Control Systems Magazine 2009 29(4) p 60-78
191 Sayikli C and EZ Bagci Limitations of using mass action kinetics method in modeling biochemical systems illustration for a second order reaction in International Conference on Computational Science and Its Applications 2011 Springer
192 Furusjouml E O Svensson and L-G Danielsson Estimation of kinetic parameters from non-isothermal batch experiments monitored by in situ vibrational spectroscopy Chemometrics Intelligent Laboratory Systems 2003 66(1) p 1-14
193 Pagano RL et al Cure kinetic parameter estimation of thermosetting resins with isothermal data by using particle swarm optimization European Polymer Journal 2008 44(8) p 2678-2686
194 Zhang Y-Y and J-H Liu Kinetic study of enantioselective hydrolysis of (R S)-ketoprofen ethyl ester using immobilized T laibacchii lipase Biochemical Engineering Journal 2011 54(1) p 40-46
195 VanBuren V L Cassimeris and DJ Odde Mechanochemical model of microtubule structure and self-assembly kinetics Biophysical Journal 2005 89(5) p 2911-2926
196 Gao D Y Xiao and A Varma Guaiacol hydrodeoxygenation over platinum catalyst reaction pathways and kinetics Industrial Engineering Chemistry Research 2015 54(43) p 10638-10644
197 Changi S TM Brown and PE Savage Reaction kinetics and pathways for phytol in high-temperature water Chemical Engineering Journal 2012 189 p 336-345
198 Zhang Y et al One-pot Enzymatic Synthesis of Enantiopure 1 3-oxathiolane by Trichosporon Laibachii Lipase and Kinetic Model Organic Process Research amp Development 2020
199 Villaverde AF et al Benchmarking optimization methods for parameter estimation in large kinetic models Bioinformatics 2019 35(5) p 830-838
200 Akaike H Fitting autoregressive models for prediction Annals of the Institute of Statistical Mathematics 1969 21(1) p 243-247
226
201 Hurvich CM and C-L Tsai Regression and time series model selection in small samples Biometrika 1989 76(2) p 297-307
202 Burnham KP and DR Anderson A practical information-theoretic approach Model Selection and Multimodel Inference Vol 2 49-96 2002 New York Springer
203 Gholamipour-Shirazi A and C Rolando Alkylation of substituted benzoic acids in a continuous flow microfluidic microreactor kinetics and linear free energy relationships Organic Process Research amp Development 2012 16(5) p 811-818
204 Niemeier JK et al Application of kinetic modeling and competitive solvent hydrolysis in the development of a highly selective hydrolysis of a nitrile to an amide Organic Process Research amp Development 2014 18(3) p 410-416
205 Hartridge H and FJW Roughton A method of measuring the velocity of very rapid chemical reactions Proceedings of the Royal Society of London Series A Containing Papers of a Mathematical Physical Character 1923 104(726) p 376-394
206 Gibson QH Rapid mixing Stopped flow Methods in Enzymology 1969 16 p 187-228
207 Seong GH J Heo and RM Crooks Measurement of enzyme kinetics using a continuous-flow microfluidic system Analytical Chemistry 2003 75(13) p 3161-3167
208 Rozich AF and DJ Castens Inhibition kinetics of nitrification in continuous-flow reactors Water Pollution Control Federation 1986 p 220-226
209 Christensen M et al Development of an automated kinetic profiling system with online HPLC for reaction optimization Reaction Chemistry amp Engineering 2019 4(9) p 1555-1558
210 Johnson KA Rapid quench kinetic analysis of polymerases adenosinetriphosphatases and enzyme intermediates Contemporary Enzyme Kinetics Mechanism Reliable Lab Solutions 2009 p 407
211 Probstein RF Physicochemical hydrodynamics an introduction 2005 John Wiley amp Sons
212 Konermann L Monitoring reaction kinetics in solution by continuous-flow methods the effects of convection and molecular diffusion under laminar flow conditions Journal of Physical Chemistry A 1999 103(36) p 7210-7216
213 Konermann L et al Acid-induced denaturation of myoglobin studied by time-resolved electrospray ionization mass spectrometry Biochemistry 1997 36(21) p 6448-6454
214 Konermann L B Collings and D Douglas Cytochrome c folding kinetics studied by time-resolved electrospray ionization mass spectrometry Biochemistry 1997 36(18) p 5554-5559
215 Zechel DL et al Pre-steady state kinetic analysis of an enzymatic reaction monitored by time-resolved electrospray ionization mass spectrometry Biochemistry 1998 37(21) p 7664-7669
216 Zhou X R Medhekar and MD Toney A continuous-flow system for high-precision kinetics using small volumes Analytical Chemistry 2003 75(15) p 3681-3687
217 Jensen KF BJ Reizman and SG Newman Tools for chemical synthesis in microsystems Lab on a Chip 2014 14(17) p 3206-3212
227
218 Hartman RL JP McMullen and KF Jensen Deciding whether to go with the flow evaluating the merits of flow reactors for synthesis Angewandte Chemie International Edition 2011 50(33) p 7502-7519
219 Baxendale IR L Brocken and CJ Mallia Flow chemistry approaches directed at improving chemical synthesis Green Processing Synthesis 2013 2(3) p 211-230
220 Gutmann B D Cantillo and CO Kappe Continuous‐flow technologymdasha tool for the safe manufacturing of active pharmaceutical ingredients Angewandte Chemie International Edition 2015 54(23) p 6688-6728
221 Bedore MW et al Aminolysis of epoxides in a microreactor system a continuous flow approach to β-amino alcohols Organic Process Research amp Development 2010 14(2) p 432-440
222 Zaborenko N et al Kinetic and scale-up investigations of epoxide aminolysis in microreactors at high temperatures and pressures Organic Process Research amp Development 2011 15(1) p 131-139
223 Monteiro JL et al Continuous Flow Homolytic Aromatic Substitution with Electrophilic Radicals A Fast and Scalable Protocol for Trifluoromethylation Chemistry - A European Journal 2017 23(1) p 176-186
224 Nagaki A D Ichinari and J-i Yoshida Three-component coupling based on flash chemistry Carbolithiation of benzyne with functionalized aryllithiums followed by reactions with electrophiles Journal of the American Chemical Society 2014 136(35) p 12245-12248
225 Hone CA et al Rapid multistep kinetic model generation from transient flow data Reaction Chemistry amp Engineering 2017 2(2) p 103-108
226 Valera FE et al The Flowrsquos the Thinghellip Or Is It Assessing the Merits of Homogeneous Reactions in Flask and Flow Angewandte Chemie International Edition 2010 49(14) p 2478-2485
227 Moore JS and KF Jensen ldquoBatchrdquo kinetics in flow online IR analysis and continuous control Angewandte Chemie International Edition 2014 53(2) p 470-473
228 Haas CP et al Automated generation of photochemical reaction data by transient flow experiments coupled with online HPLC analysis Reaction Chemistry amp Engineering 2020
229 Schaber SD et al Design execution and analysis of time-varying experiments for model discrimination and parameter estimation in microreactors Organic Process Research amp Development 2014 18(11) p 1461-1467
230 Aroh KC and KF Jensen Efficient kinetic experiments in continuous flow microreactors Reaction Chemistry amp Engineering 2018 3(1) p 94-101
231 Gomez MV et al Determination of kinetic parameters within a single nonisothermal on-flow experiment by nanoliter NMR spectroscopy Analytical Chemistry 2015 87(20) p 10547-10555
232 Waldron C et al An autonomous microreactor platform for the rapid identification of kinetic models Reaction Chemistry amp Engineering 2019 4(9) p 1623-1636
233 Hone CA et al Definitive screening designs for multistep kinetic models in flow Reaction Chemistry amp Engineering 2019 4(9) p 1565-1570
228
234 Holmes N et al Online quantitative mass spectrometry for the rapid adaptive optimisation of automated flow reactors Reaction Chemistry amp Engineering 2016 1(1) p 96-100
235 Levenspiel O Chemical reaction engineering Industrial amp Engineering Chemistry Research 1999 38(11) p 4140-4143
236 McMullen JP and KF Jensen Rapid determination of reaction kinetics with an automated microfluidic system Organic Process Research amp Development 2011 15(2) p 398-407
237 Nagy KD et al Mixing and dispersion in small-scale flow systems Organic Process Research amp Development 2012 16(5) p 976-981
238 Afonso CA et al Comprehensive Organic Chemistry Experiments for the Laboratory Classroom 2016 Royal Society of Chemistry
239 Fluorochem 2019 27062019] Available from httpwwwfluorochemcoukProductsProductcode=303261
240 Ashworth IW et al Where has my acid gone Understanding the self-catalyzed esterification of maleic acid in methanol during salt formation Organic Process Research amp Development 2012 16(10) p 1646-1651
241 Gilbert JC EG McKinley and D-R Hou The nature of cyclopentyne from different precursors Tetrahedron 1997 53(29) p 9891-9902
242 Takaki K et al Intermolecular hydrophosphination of alkynes and related carbonminus carbon multiple bonds catalyzed by organoytterbiums The Journal of Organic Chemistry 2003 68(17) p 6554-6565
243 Berthelot DJ-C et al Heterocyclic amides as modulators of TRPA1 2013 Google Patents
244 Binch H et al Aminopyridine derivatives having aurora a selective inhibitory action 2013 Google Patents
245 Lood CS et al Synthesis of Chiral (Indol-2-yl) methanamines and Insight into the Stereochemistry Protecting Effects of the 9-Phenyl-9-fluorenyl Protecting Group European Journal of Organic Chemistry 2015 3793 p 3805
246 Poisson J-F A Orellana and AE Greene Stereocontrolled synthesis of (minus)-kainic acid from trans-4-hydroxy-L-proline The Journal of Organic Chemistry 2005 70(26) p 10860-10863
247 Lood C M Nieger and A Koskinen Enantiospecific gram scale synthesis of (S)-eleagnine Tetrahedron 2015 71(30) p 5019-5024
248 9-Bromo-9-phenylfluorene Sigma Aldrich Available from httpswwwsigmaaldrichcomcatalogproductaldrich368873 [27092020]
249 Tian Z and F Menard Synthesis of Kainoids and C4 Derivatives The Journal of Organic Chemistry 2018 83(11) p 6162-6170
250 9-Fluorenone Sigma Aldrich Available from httpswwwsigmaaldrichcomcatalogproductaldrichf1506 [27092020]