automated discovery of relationships, models, and
TRANSCRIPT

METHODSpublished: 11 December 2020
doi: 10.3389/fevo.2020.530135
Frontiers in Ecology and Evolution | www.frontiersin.org 1 December 2020 | Volume 8 | Article 530135
Edited by:
Miguel A. Fortuna,
Estación Biológica de Doñana
(EBD), Spain
Reviewed by:
Carlos J. Melián,
Swiss Federal Institute of Aquatic
Science and Technology, Switzerland
Shai Pilosof,
Ben-Gurion University of the
Negev, Israel
*Correspondence:
Pedro Cardoso
Specialty section:
This article was submitted to
Models in Ecology and Evolution,
a section of the journal
Frontiers in Ecology and Evolution
Received: 28 January 2020
Accepted: 23 November 2020
Published: 11 December 2020
Citation:
Cardoso P, Branco VV, Borges PAV,
Carvalho JC, Rigal F, Gabriel R,
Mammola S, Cascalho J and
Correia L (2020) Automated Discovery
of Relationships, Models, and
Principles in Ecology.
Front. Ecol. Evol. 8:530135.
doi: 10.3389/fevo.2020.530135
Automated Discovery ofRelationships, Models, andPrinciples in Ecology
Pedro Cardoso 1,2*, Vasco V. Branco 1,3, Paulo A. V. Borges 2, José C. Carvalho 1,2,4,
François Rigal 2,5, Rosalina Gabriel 2, Stefano Mammola 1,6, José Cascalho 7 and
Luís Correia 3
1 Laboratory for Integrative Biodiversity Research (LIBRe), Finnish Museum of Natural History Luomus, University of Helsinki,
Helsinki, Finland, 2 cE3c – Centre for Ecology, Evolution and Environmental Changes/Azorean Biodiversity Group,
Departamento de Ciências Agrárias, Universidade dos Açores, Angra do Heroísmo, Portugal, 3 Laboratório de Sistemas
Informáticos de Grande Escala, Faculdade de Ciências, Universidade de Lisboa, Lisbon, Portugal, 4Molecular and
Environmental Centre - Centre of Molecular and Environmental Biology, Department of Biology, University of Minho, Braga,
Portugal, 5 Institut Des Sciences Analytiques et de Physico Chimie pour L’environnement et les Materiaux UMR5254, Comité
National de la Recherche Scientifique - University de Pau et des Pays de l’Adour - E2S UPPA, Pau, France, 6Molecular
Ecology Group (MEG), Water Research Institute, National Research Council, Verbania Pallanza, Italy, 7Departamento de
Ciências Agrárias, Núcleo de Investigação e Desenvolvimento em e-Saúde (NIDes), Angra do Heroísmo, Portugal
Ecological systems are the quintessential complex systems, involving numerous
high-order interactions and non-linear relationships. The most used statistical modeling
techniques can hardly accommodate the complexity of ecological patterns and
processes. Finding hidden relationships in complex data is now possible using massive
computational power, particularly by means of artificial intelligence and machine learning
methods. Here we explored the potential of symbolic regression (SR), commonly used
in other areas, in the field of ecology. Symbolic regression searches for both the formal
structure of equations and the fitting parameters simultaneously, hence providing the
required flexibility to characterize complex ecological systems. Although the method
here presented is automated, it is part of a collaborative human–machine effort and
we demonstrate ways to do it. First, we test the robustness of SR to extreme levels
of noise when searching for the species-area relationship. Second, we demonstrate
how SR can model species richness and spatial distributions. Third, we illustrate how
SR can be used to find general models in ecology, namely new formulas for species
richness estimators and the general dynamic model of oceanic island biogeography.
We propose that evolving free-form equations purely from data, often without prior
human inference or hypotheses, may represent a very powerful tool for ecologists and
biogeographers to become aware of hidden relationships and suggest general theoretical
models and principles.
Keywords: artificial intelligence, ecological complexity, evolutionary computation, genetic programming, species
richness estimation, species-area relationship, species distribution modeling, symbolic regression
INTRODUCTION
Complexity is a term often used to characterize systems with numerous components interacting inways such that their collective behavior is difficult to predict, but where emergent properties giverise to patterns, more or less simple but seldom linear (Table 1) (Holland, 1995; Mitchell, 2009).Complex systems science is therefore an effort to understand non-linear systems with multiple

Cardoso et al. Automated Discovery in Ecology
TABLE 1 | Glossary of terms.
Artificial Intelligence (AI)–A scientific field concerned with the automation
of activities we associate with human thinking (Russell et al., 2010).
Big data–Very large amount of structured or unstructured data, hard to
model with general statistical techniques but with the potential to be mined
for information.
Complex system–A system in which a large network of components
organize, without any central controller and simple although non-linear rules
of operation, into a complex collective behavior that creates patterns, uses
information, and, in some cases, evolves, and learns (Mitchell, 2009).
General model–An equation that is found to be useful for multiple
datasets, often but not necessarily, derived from a general principle. In most
cases the formal structure of equations is kept fixed, while some
parameters must be fitted for each individual dataset.
General principle–Refers to concepts or phenomenological descriptions
of processes and interactions (Evans et al., 2013). May not have direct
translation to any general model, but be a purely conceptual abstraction.
Genetic programming (GP)–A biologically-inspired method for getting
computers to automatically create a computer program to solve a given
problem (Koza, 1992). It is a type of evolutionary algorithm, where each
solution to be tested (individual in a population of possible solutions) is a
computer program.
Pareto front–A curve connecting a set of best solutions in a multi-objective
optimization problem. If several conflicting objectives are sought (e.g.,
minimize both error and complexity of formulas), the Pareto front allows
visualizing the set of best solutions (Smits and Kotanchek, 2005).
Symbolic regression (SR)–A function discovery approach for modeling of
multivariate data. It is a special case of genetic programming, one where
possible solutions are equations instead of computer programs.
connected components and how “the whole is more thanthe sum of the parts” (Holland, 1998). Biological systemsprobably are among the most complex (Solé and Goodwin,2000), and among them, ecological systems are the quintessentialcomplex systems (Anand et al., 2010). These are composed ofindividuals from different species, interacting and exchangingenergy in multiple ways, furthermore, relating with the physicalenvironment at different spatial and temporal scales in non-linear relationships. Consequently, ecology is dominated byidiosyncratic results, with most ecological processes beingcontingent on the spatial and temporal scales in which theyoperate. This makes it difficult to identify recurrent patterns,knowing also that pattern does not necessarily identify process(Lawton, 1996; Dodds, 2009; Passy, 2012). The most usedexploratory (e.g., principal component analysis) and statisticalmodeling techniques (e.g., linear and non-linear regressions)can hardly reflect the complexity of ecological patterns andprocesses, often failing to find meaningful relationships in data.More flexible techniques, such as generalized additive models(GAMs), usually do not allow an easy interpretation of resultsand particularly of putative causal relationships (e.g., Sugiharaet al., 2012). For ecological data, we require more flexible androbust, yet amenable to full interpretation, analytical methods,which can eventually lead to the discovery of general principlesand models.
The aim of any ecological principle is to provide a robustmodel for exploring, describing, and predicting ecological
processes regardless of taxon identity and geographic region(Lawton, 1996; Dodds, 2009). Finding a recurrently highgoodness-of-fit for a model to an ecological pattern for most taxaand ecosystems is usually a compelling evidence of a mechanisticprocess controlling that pattern. When general principles aretranslated into robust models, general statistical methods aremostly abandoned in favor of these, of which only few examplesexist in ecology (Data Sheet 1). Such general, widely applicableequations are mostly found by intellectual tour de force. Yet,they are only the tip of the iceberg, usually incorporating few ofthe variables increasingly available to ecologists and that couldpotentially explain such patterns.
The automation of techniques for collecting and storingecological and related data, with increasing spatial and temporalresolutions, has become one of the central themes in ecology andbioinformatics. Yet, automated and flexible ways to synthesizesuch complex and big data were mostly lacking until recently(Martin et al., 2018; Chen et al., 2019; Desjardins-Proulx et al.,2019). Finding hidden relations within such data is now possibleusing massive computational power. New computer-intensivemethods have been developed or are now available or possible(Reshef et al., 2011), including the broad field of artificialintelligence (AI) or machine learning (ML) which have produceda variety of approaches (Lu, 2019). Artificial intelligence includesa series of evolution-inspired techniques, brought together in thesub-field of evolutionary computation, of which the most studiedand well-known probably are genetic algorithms (Holland, 1975).Genetic programming, namely in the form of symbolic regression(SR) (Koza, 1992), is a derivation of genetic algorithms thatsearches the space of mathematical equations without anyconstraints on their form. Hence, it provides the requiredflexibility to represent complex systems as presented by manyecological systems (Figure 1). Contrarily to traditional statisticaltechniques, symbolic regression searches for both the formalstructure of equations and the fitting parameters simultaneously(Schmidt and Lipson, 2009). Finding the structure of equationsis especially useful to discover general models, providing insightsinto the processes and eventually leading to the discovery of newand yet undiscovered principles. Fitting the parameters providesinsight into the raw data and allow for specific predictions.Successful examples on the use of SR in ecology include modelingof land-use change (Manson, 2005; Manson and Evans, 2007),effects of climate change on populations (Tung et al., 2009; Larsenet al., 2014), community distribution (Larsen et al., 2012; Yaoet al., 2014), predicting micro-organismal blooms (Muttil andLee, 2005; Muttil and Chau, 2006; Jagupilla et al., 2015; Tromaset al., 2017), deriving vegetation indices (Almeida et al., 2015),forecasting the trophic evolution of lakes (Bertoni et al., 2016),using parasites as biological tags (Barrett et al., 2005), and evento revisit classical ecological models such as the Lotka–Volterrapredator–prey equation (Martin et al., 2018; Chen et al., 2019).
The goal of this work is to explain, test, and show theusefulness of SR in uncovering hidden relationships withintypical ecological datasets. To illustrate this, we used five casestudies reflecting typical analytical problems faced by ecologists.In the first example, (i) we test the robustness of SR when findingthe power law applied to the species-area relationship (SAR) with
Frontiers in Ecology and Evolution | www.frontiersin.org 2 December 2020 | Volume 8 | Article 530135

Cardoso et al. Automated Discovery in Ecology
FIGURE 1 | Schematic representation of the symbolic regression workflow.
The basic representation is a parse-tree where building blocks such as
variables (in this case: x1, x2), parameters (integers or real numbers), and
operators (e.g., +, –, ×, ÷) are connected forming functions (in parenthesis
under the first line of trees). Initial equations are generated by randomly linking
different building blocks. Equations are combined through crossover, giving
rise to new equations with characteristics from both parents (arrows linking the
first and second rows of trees). Equations with better fitness (e.g., R2) have
higher probabilities of recombining. To avoid loss of variability, a mutation step
is added after crossover (arrows linking the second and third rows of trees).
After multiple generations, evolution stops and a set of free-form equations
best reflecting the input data is found.
extreme levels of noise, even beyond the high levels typical ofecological datasets. In the next two examples, we demonstratehow SR can deal with complex datasets, namely to model (ii)species richness; and (iii) species spatial distributions. Finally, weillustrate how SR can be used to find general models in ecology,by using it to develop new formulas for (iv) species richnessestimation; and v) the general dynamic model of oceanic islandbiogeography (GDM).
GENERAL METHODOLOGY
Symbolic regression works as a computational parallel tothe evolution of species. A population of initial equations isgenerated randomly by combining different building blocks, suchas the variables of interest (independent explanatory variables),algebraic operators (e.g., +, –, ÷, ×), analytic function types(exponential, log, power, etc.), constants and other ways tocombine the data (e.g., Boolean or decision operators) (Figure 1).Being random, these initial equations almost invariably failin describing the patterns or phenomena of interest, butsome equations are slightly better than others. All are thencombined through crossover, giving rise to new equations withcharacteristics from both parents. Equations with better fitness—as estimated using a chosen statistical measure such as R2 orAkaike’s Information Criterion (AIC; Akaike, 1974)—have ahigher probability of recombining. To avoid new equations beingbounded by initially selected building blocks or quickly losingvariability along the evolutionary process, a mutation step (acting
FIGURE 2 | Example of a Pareto front depicting error vs. complexity. This
example reflects a symbolic regression search of the best species–area
relationship for native spiders in the Azores (Portugal). The second formula is
clearly the most promising, with both high accuracy (low error) and low
complexity. In many occasions a single formula is not clearly best, in which
case weights can be given to each of them through indices that simultaneously
positively weight accuracy and negatively weight complexity (such as AIC or
BIC) and/or multiple formulas presented as possible outcomes.
on any building block) is added to the process after crossover.After multiple generations, an acceptable level of accuracy bysome of the equations is often attained and the researcher stopsthe process.
For this work we used the software Eureqa (Nutonian, Inc)(Schmidt, 2015), which provides an intuitive interface suitablealso for non-expert SR users (Dubcáková, 2011). Although acommercial version is available, we used the freely available testversion for all analyses. For each run, the software outputs alist of equations along an error/complexity Pareto-front (Smitsand Kotanchek, 2005), with the most accurate equation for eachlevel of complexity being shown (Figure 2). For the SR searchwe used only algebraic and analytic operators (+, –, ÷, ×, log,power) in all examples below, so that outputs could bemost easilyinterpreted. The goodness-of-fit was evaluated using R2 or AICc,depending on the question (see below). The Pareto-front oftenpresents an “elbow,” where near-minimum error meets near-minimum complexity. The equation in this inflection is closer tothe origin of both axes and is a good starting point for furtherinvestigation—if both axes are in comparable qualitative scales.Often, however, this inflection point is not obvious, and a singleformula is not clearly best. In such cases, weights can be givento each of them through indices that positively weight accuracyand negatively weight complexity, such as AICc (Akaike, 1974).However, in all cases it is important to check all formulas alongthe Pareto-front. Often equations ormodels thatmake immediatesense to the specific question may not be detected by theseautomated methods.
Each of the five case studies was analyzed independently andusing different approaches to test the performance of SR againstother methods. We often opted to use fully independent datasetsfor three reasons. First, we were looking for general formulas,
Frontiers in Ecology and Evolution | www.frontiersin.org 3 December 2020 | Volume 8 | Article 530135

Cardoso et al. Automated Discovery in Ecology
which should be tested against fully independent data. Second, itwas a much more powerful and convincing way to demonstratethemethod than using subsets of the same data, which necessarilyhave some common ground that facilitates the job of anymethod.Third, our datasets, as typical for many in ecology, often had veryfew observations, making it hard to do sub-setting in few cases.
CASE-STUDIES
Finding the Species-Area Relationship(SAR) With Extreme Levels of NoiseTypical ecological datasets not only have few data points, butthese are prone to varying levels of noise. Noise can be due tonatural phenomena, such as spillover from neighboring regions,unpredictable weather events, etc., lack of the most appropriatedata to model the phenomena, or simply errors in measuring orsampling. Testing any novel method to its robustness to differentsources and levels of noise is therefore imperative.
One of the most studied examples of SARs is their applicationto island biogeography (ISAR). The shape of ISARs has beenmodeled by many functions, but three of the simplest seem tobe preferred in most cases, the power, exponential, and linearmodels (Triantis et al., 2012) (Data Sheet 1). The power modelin particular includes island area (A) and two fitting parameters,c (the intercept) and z (the scaling of richness with area)(Data Sheet 1). Here we created 30 fictional islands each onecorresponding to one of the 30 possible combinations resultingfrom five different areas (10, 100, 1000, 10,000, and 100,000 km2),two typical values for c (1 and 10), and three typical values for z(0.2, 0.3, and 0.4). We then simulated sampling from these 30islands, each with a sampled richness equal to the multiplicationof the true richness value by five different levels of noise asgiven by the standard deviation of a sampling from a normaldistribution with mean = 1 and sd = 0, 0.1, 0.2, 0.4, and 0.8.The theoretical richness of each island was then multiplied by10 simulations of each noise level using this approach, providinga total of 50 search trials (Data Sheet 2). We must emphasizethat with sd = 0.8 the noise was extreme and unreasonable,with for example islands predicted to have 100 species presentinganything between 0 and 199 species after noise was added. Weevaluated the ability of SR to develop the power law by countingat each noise level how many times the usual formulation anda derivation without the intercept c were found among the 10searches per level.
Our simulations using SR were able to find the power-law ofthe SAR even with the most extreme scenarios (Data Sheet 2).From 100% success rate with sd = 0 or 0.1, to 70% with sd =
0.2, 50% with sd = 0.4, and 40% with sd = 0.8. If we include thesimpler formulation with no intercept, success rate was 100, 100,100, 90, and 80%, respectively for sd= 0, 0.1, 0.2, 0.4, and 0.8.
Modeling Species RichnessModeling and mapping the species richness of high diversitytaxa at regional to large scales is often impossible withoutextrapolation from sampled to non-sampled sites. Here, weused an endemic arthropod dataset collected in Terceira Island,Azores. Fifty-two sites were sampled using pitfall traps for
epigean arthropods (Cardoso et al., 2009), 13 in each of fourland-use types: natural forest, exotic forest, semi-natural pasture,and intensively managed pasture. In this problem, given the sizeof the dataset, we used a 5-fold cross validation. We explainedand predicted species richness per site using elevation, slope,annual average temperature, annual precipitation, and an indexof disturbance with values ranging from 0 (absence of humanpresence) to 100 (dense urban environment) (Cardoso et al.,2013). For SR we ran each fold five times tominimize the risk thatthe formulas found represented local optima. We then reportedthe average and range of R2 and AICc of the five partitions forboth the training and test data.
As the response variable was count data, Generalized LinearModels (GLM) and Generalized Additive Models (GAM) witha Poisson error structure and a log link were used. We usedthe package MuMIn (Barton, 2015) and the R environment (RCore Team, 2015) for multi-model inference based on AICc(Hurvich and Tsai, 1989) values, using all variables plus allpossible interactions for GLM. For fitting GAM, we used packagegam (Hastie, 2015). The R2 goodness of fit was used as the fitnessmeasure. For each run of the SR (25 in total) we picked theformula at the inflection point of the Pareto-front (Data Sheet 2).Both R2 and AICc were used to compare GLM and GAMwith SRon the test datasets.
The model selected by GLM in all five k-folds was:
S = e(a+bH -cP - dD)
where H = altitude, P = precipitation, D = disturbance; a, b,c, and d are fitting parameters with mean a = 1.894 (range:1.116–2.577), mean b= 0.00419 (range: 0.00360–0.00574), meanc = 0.000972 (range: 0.000726–0.001212), and mean d =
0.0251 (range: 0.0118–0.0331). The mean training R2 = 0.529(range: 0.469–0.573) and mean training AICc = 104.151 (range:103.055–105.634). The mean testing R2 = 0.528 (range: 0.313–0.770) and mean testing AICc= 45.340 (range: 41.913–48.513).
The results of GAM were similar to the GLM, the algorithmselecting the most parsimonious formulation equivalent to aGLM. The SR results performed considerably better than GLMor GAM with a much simpler formula using a single variable(Disturbance) and much better training and testing results, with23 out of 25 formulas chosen being in the form:
S = (a/D)− b
where a and b were fitting parameters with mean a = 140.787(range: 134.700–145.775) and mean b = 1.325 (range: 1.078–1.483). The mean training R2 = 0.603 (range: 0.576–0.644)and mean training AICc = 52.631 (range: 47.982–56.985).The mean testing R2 = 0.601 (range: 0.449–0.737) and meantesting AICc = 19.088 (range: 13.042–23.432). We shouldemphasize the simplicity of interpretation of this formula,indicating that species richness essentially was inversely relatedwith disturbance.
Modeling Species DistributionsSpecies distribution modeling (SDM) is one of the most widelyused correlative statistical approaches to biodiversity assessment,
Frontiers in Ecology and Evolution | www.frontiersin.org 4 December 2020 | Volume 8 | Article 530135

Cardoso et al. Automated Discovery in Ecology
FIGURE 3 | Predicted distribution of two Azorean arthropods using three modeling methods. Observed locations (white dots) and predicted distribution (dark green
areas) of Alestrus dolosus (Coleoptera, Elateridae) and Canariphantes acoreensis (Araneae, Linyphiidae) in the island of Terceira (Azores, Portugal) using logistic
regression, maximum entropy, and symbolic regression.
for example to fill gaps in our knowledge on individualspecies distributions, predict species response to climate change,and the spread of invasive species (Araújo et al., 2019). Asa case study, we modeled the potential distribution of twoendemic Azorean species in Terceira Island: the rare forest click-beetle Alestrus dolosus (Crotch) (Coleoptera, Elateridae) andthe abundant but mostly forest-restricted spider Canariphantesacoreensis (Wunderlich) (Araneae, Linyphiidae). We comparedthe performance of logistic regressions (GLM with a binomialerror structure) and maximum entropy models (Maxent; Phillipset al., 2006) in predicting the distribution of the two species,to that of SR. GLM and MaxEnt are two of the most widelyused approaches for SDM (Elith et al., 2006). Given the intrinsicdifferences betweenmethods, we had to use different backgrounddatasets (Data Sheet 3). Maxent used the environmental maps ofthe islands with a resolution of 100m, from where it extractedpseudo-absences. We then converted the probabilistic potentialdistribution maps to presence/absence using the maximumvalue of training sensitivity plus specificity as the thresholdas recommended by Liu et al. (2005). Logistic regression andSR used presence/absence data from the 52 sampled sites. Weconducted multi-model inference of logistic regression based onAICc values. In the SR run we included a step function, so thatpositive and negative values were converted to presence andabsence (binary output), respectively. Absolute error, reflectingthe number of incorrect classifications, was used as the fitnessmeasure. As inflection points of the Pareto fronts were clear,the best SR formula for each species was chosen based onthem (Data Sheet 2). Given the scarcity of occurrences of speciesin the dataset (from 10 to 35% of the data points) we opted
for a balanced split of 50% for training and test sets. In allcases only the training data (26 sites) were used to obtain themodels. Logistic GLM, Maxent, and SR were compared in theirperformance for predicting presence and absence of species onthe 26 test sites using the Sensitivity, Specificity, and True SkillStatistic (TSS) (Allouche et al., 2006).
The potential distribution models were relatively similarfor C. acoreensis but show marked differences for A. dolosus(Figure 3). Symbolic regression outperformed both other modelsfor A. dolosus and was as good as Maxent for C. acoreensis,with both outperforming logistic regression (Table 2). The SRmodels were not only the best, presenting maximum valuesfor TSS, but were also the easiest to interpret. A. dolosus waspredicted to have adequate environmental conditions in allareas above 614m elevation, being restricted to pristine nativeforest. Canariphantes acoreensis could potentially be present inall areas with disturbance values below 41.3, occurring not onlyin native forest but also in adjacent semi-natural grassland andhumid exotic forest. The logistic regression and Maxent modelsused a large number of explanatory variables for A. dolosus yetperformed worse on the test data than did SR (Table 2).
Developing Species Richness EstimatorsSeveral asymptotic functions have been used to estimate speciesrichness (Soberón and Llorente, 1993), including the Clenchfunction (Clench, 1979), the negative exponential function, andthe rational function (Ratkowsky, 1990) (Data Sheet 1). We usedSR to rediscover or eventually find novel asymptotic modelsthat would outperform them. Two independent datasets wereused resulting from exhaustive and standardized sampling for
Frontiers in Ecology and Evolution | www.frontiersin.org 5 December 2020 | Volume 8 | Article 530135
Cardoso et al. Automated Discovery in Ecology
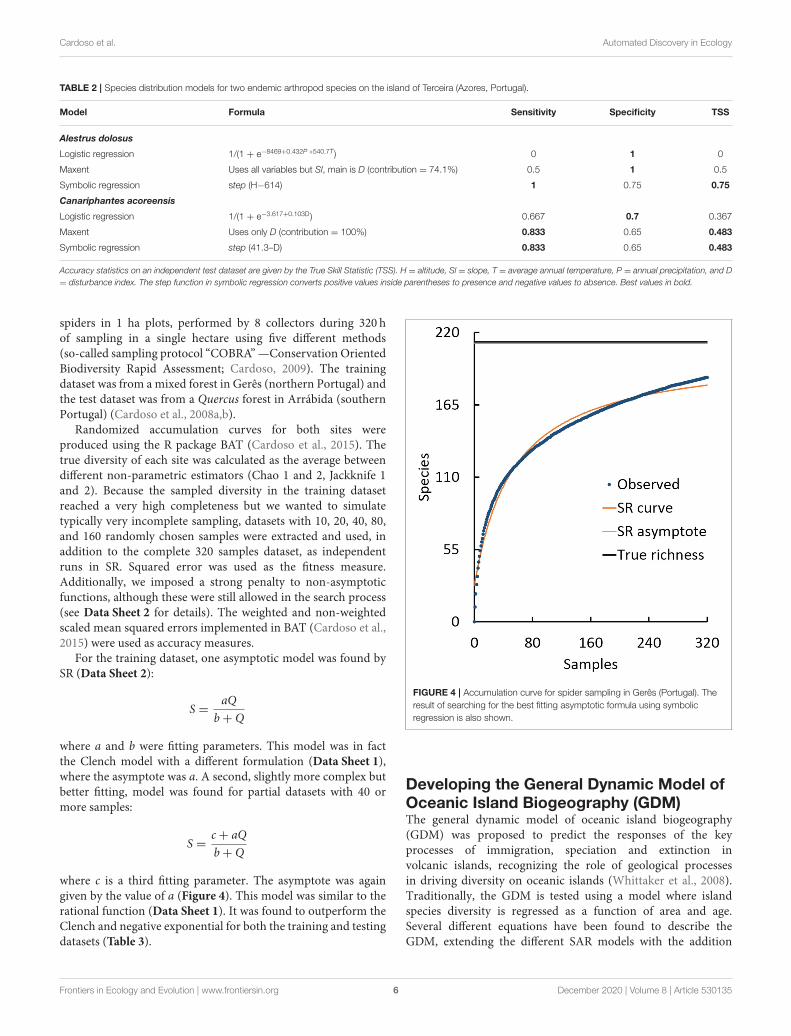
TABLE 2 | Species distribution models for two endemic arthropod species on the island of Terceira (Azores, Portugal).
Model Formula Sensitivity Specificity TSS
Alestrus dolosus
Logistic regression 1/(1 + e−8469+0.432P +540.7T) 0 1 0
Maxent Uses all variables but Sl, main is D (contribution = 74.1%) 0.5 1 0.5
Symbolic regression step (H−614) 1 0.75 0.75
Canariphantes acoreensis
Logistic regression 1/(1 + e−3.617+0.103D) 0.667 0.7 0.367
Maxent Uses only D (contribution = 100%) 0.833 0.65 0.483
Symbolic regression step (41.3–D) 0.833 0.65 0.483
Accuracy statistics on an independent test dataset are given by the True Skill Statistic (TSS). H = altitude, Sl = slope, T = average annual temperature, P = annual precipitation, and D
= disturbance index. The step function in symbolic regression converts positive values inside parentheses to presence and negative values to absence. Best values in bold.
spiders in 1 ha plots, performed by 8 collectors during 320 hof sampling in a single hectare using five different methods(so-called sampling protocol “COBRA”—Conservation OrientedBiodiversity Rapid Assessment; Cardoso, 2009). The trainingdataset was from amixed forest in Gerês (northern Portugal) andthe test dataset was from a Quercus forest in Arrábida (southernPortugal) (Cardoso et al., 2008a,b).
Randomized accumulation curves for both sites wereproduced using the R package BAT (Cardoso et al., 2015). Thetrue diversity of each site was calculated as the average betweendifferent non-parametric estimators (Chao 1 and 2, Jackknife 1and 2). Because the sampled diversity in the training datasetreached a very high completeness but we wanted to simulatetypically very incomplete sampling, datasets with 10, 20, 40, 80,and 160 randomly chosen samples were extracted and used, inaddition to the complete 320 samples dataset, as independentruns in SR. Squared error was used as the fitness measure.Additionally, we imposed a strong penalty to non-asymptoticfunctions, although these were still allowed in the search process(see Data Sheet 2 for details). The weighted and non-weightedscaled mean squared errors implemented in BAT (Cardoso et al.,2015) were used as accuracy measures.
For the training dataset, one asymptotic model was found bySR (Data Sheet 2):
S =aQ
b+ Q
where a and b were fitting parameters. This model was in factthe Clench model with a different formulation (Data Sheet 1),where the asymptote was a. A second, slightly more complex butbetter fitting, model was found for partial datasets with 40 ormore samples:
S =c+ aQ
b+ Q
where c is a third fitting parameter. The asymptote was againgiven by the value of a (Figure 4). This model was similar to therational function (Data Sheet 1). It was found to outperform theClench and negative exponential for both the training and testingdatasets (Table 3).
FIGURE 4 | Accumulation curve for spider sampling in Gerês (Portugal). The
result of searching for the best fitting asymptotic formula using symbolic
regression is also shown.
Developing the General Dynamic Model ofOceanic Island Biogeography (GDM)The general dynamic model of oceanic island biogeography(GDM) was proposed to predict the responses of the keyprocesses of immigration, speciation and extinction involcanic islands, recognizing the role of geological processesin driving diversity on oceanic islands (Whittaker et al., 2008).Traditionally, the GDM is tested using a model where islandspecies diversity is regressed as a function of area and age.Several different equations have been found to describe theGDM, extending the different SAR models with the addition
Frontiers in Ecology and Evolution | www.frontiersin.org 6 December 2020 | Volume 8 | Article 530135

Cardoso et al. Automated Discovery in Ecology
TABLE 3 | Comparison of three asymptotic equations used to estimate spider
species richness in two forest sites.
Model Raw accuracy Weighted accuracy
Gerês (training)
Observed 0.113 0.037
Clench 0.055 0.018
Negative exponential 0.115 0.049
Rational function 0.045 0.012
Arrábida (testing)
Observed 0.103 0.031
Clench 0.038 0.010
Negative exponential 0.092 0.037
Rational function 0.032 0.008
See Data Sheet 1 for formulas. Raw accuracy is the scaled mean squared error
considering the entire observed accumulation curve (each formula was fitted to the curves
using 4–320 samples) and weighted accuracy is this value weighted by the sampling effort
at each point in the curve (where effort is the ratio between number of individuals and
observed species richness). Note that lower values (in bold) are better as they reflect the
deviation from a perfect estimator.
of a polynomial term using island age and its square (TT2),depicting the island’s ontogeny. The first to be proposed was anextension of the exponential model (Whittaker et al., 2008), thepower model extensions following shortly after (Fattorini, 2009;Steinbauer et al., 2013).
Our objective was to test if we could re-discover or eventuallyrefine existing models for the ISAR and GDM from data alone.We used the Azores and Canary Islands spiders (Cardoso et al.,2010) as training data. To independently test the generality ofmodels arising from spider data, we used bryophyte data from thesame archipelagos (Aranda et al., 2014). The area and maximumtime since emergence of each island were used as explanatoryvariables and the native species richness per island as the responsevariables (Data Sheet 4). The R2 value was used as the fitnessmeasure. The best SAR and GDM equations found by SR werechosen based on the inspection of the Pareto front (Data Sheet 2)but looking also for interpretability of the models. These werethen compared with the existing models using AICc and the Rpackage BAT (Cardoso et al., 2015).
For the Azorean spiders, the best fitting previous model (bothhighest R2 and lowest AICc) for the ISAR was the exponentialmodel (Table 4). The SR run discovered roughly the same model,indicating, however, that the intercept (c term) was addingunnecessary complexity. A similar ranking of models was verifiedfor bryophytes in the same region, revealing the robustness of thenew model.
For the Canary Islands, the best model for spiders was a linearfunction of area:
S = 75+ 0.047A
(R2 = 0.364, AICc = 65.631). Although it was easy to interpret,the explained variance was relatively low. The SR run reached amuch higher explanatory power:
S = 112− 1.002A
(R2 = 0.806, AICc = 57.320). In this case though, the equationwas over-fitting to the few available data (7 data points), as thisfunction was erratic creating a biologically indefensible model.The reason the ISAR was hard to model for the Canary Islandsspiders was because we were missing the major component Time(Cardoso et al., 2010). This was depicted by the GDM, of whichthe best of the current equations was found to be the powermodel described by Fattorini (2009) (Table 4). Nevertheless,using SR we were able to find an improved, yet undescribed,model (Table 4). This represented a general model expanding thelinear SAR:
S = c + zA + XT – yT2
When tested with Canarian bryophytes, this new formulation wssalmost as good as the power model (Table 4).
DISCUSSION
Symbolic regression has the advantage over most standardregression methods (e.g., GLM) of being more flexible, allowinga good fitting to data with better interpretability, since results arein the form of mathematical formulas. GLMs and other similartechniques assume linear relations between variables or requirea priori knowledge on the form of the relation (e.g., quadratic,cubic, interactions between variables, etc.).
SR also has one or more advantages over other, commonlyused, highly flexible regression (e.g., GAMs) or machine learningtechniques (e.g., neural-networks): (1) numerical, ordinal, andcategorical variables are easily combined; (2) redundant variablesare usually eliminated in the search process and only the mostimportant are retained if anti-bloat measures (intended to reducethe complexity of equations) are used. Incidentally, this alsoreleases the user from the problem of dealing with collinearity(Dormann et al., 2013); (3) the evolved equations are human-readable and interpretable; and (4) solutions are easily applied tonew data.
Using SR, we were able to “distill” free-form equations andmodels that not only consistently outperform but are moreintelligible than the ones resulting from rigid methods, such asGLM, or “black-boxes,” such as Maxent. This was the case forboth species richness and distribution models.
We were also able to re-discover and refine equations forestimating species richness based on sampling curves and theISAR and GDM from data alone. All the examples presentedin this work suggest that evolving free-form equations purelyfrom data, often without prior human inference or hypotheses,may represent an under-explored but very powerful tool forecologists and biogeographers, allowing the finding of hiddenrelationships in data and suggesting new ideas to formulategeneral theoretical principles.
The idea that SR is a powerful tool for reverse-engineeringecological theory from data is not new. Many examples reviewedin the introduction suggest that different authors across disparatedisciplines understand this date back to the early 2000s. Recently,the potential of SR in ecology was discussed in two essays thatshowed how SR can be used to develop classic demographic time
Frontiers in Ecology and Evolution | www.frontiersin.org 7 December 2020 | Volume 8 | Article 530135

Cardoso et al. Automated Discovery in Ecology
TABLE 4 | Species area relationship (SAR) models for Azorean taxa and General Dynamic Models (GDM) of oceanic island biogeography for Canarian taxa.
Model Formula R2 AICc
SAR Azorean Spiders (training)
Power S = 13.379A0.438 0.642 32.505
Exponential S = 0.549 + 4.538 logA 0.780 28.102
Linear S = 19.357 + 0.017A 0.435 36.604
SR S = 4.641 logA 0.780 23.319
SAR Azorean Bryophytes (testing)
Power S = 181.625A0.803 0.666 78.085
Exponential S = −27.824 + 57.114 logA 0.728 76.208
Linear S = 196.215 + 0.259A 0.617 79.295
SR S = 51.889 logA 0.722 71.617
GDM Canarian Spiders (training)
Whittaker S = −185.589 + 41.732 logA + 17.776T – 1.022T2 0.873 110.350
Fattorini logS = 2.585 + 0.281 logA + 0.157T – 0.009T2 0.941 105.025
Steinbauer logS = 3.367 + 0.098 logA + 1.502 logT – 0.454 logT2 0.814 113.007
SR S = 42.283 + 0.051A + 17.379T – T2 0.952 61.505
GDM Canarian Bryophytes (testing)
Whittaker S = −176.599 + 66.602 logA + 21.361T – 1.620T2 0.773 125.214
Fattorini logS = 4.544 + 0.137 logA + 0.126T – 0.009T2 0.803 124.217
Steinbauer logS = 5.136 + 0.017 logA + 1.063 logT – 0.382logT2 0.612 128.963
SR S = 192.660 + 0.075A + 20.702T – 1.576T2 0.785 124.841
S = native species richness; A = area of the island; T = maximum time of emergence. Best models are indicated in bold.
series from data (Martin et al., 2018; Chen et al., 2019). Yet, ourstudy is the first to bring together all these disparate applications,demonstrating the versatility of this tool by applying it to a rangeof diverse ecological and evolutionary problems, both theoreticaland practical. These results suggest that the true potential for theuse of SR in ecology and evolution is yet to be fulfilled.
From Particular to General PrinciplesScientific fields such as physics rarely rely on general statisticalinference methods such as linear regression for hypothesistesting. The complexity of ecology made such methods animperative in most cases. Symbolic regression not only allowsthe discovery of relationships specific to particular datasets, butalso the finding of general models, globally applicable to multiplesystems of particular nature, as we tried to exemplify. SR hasthe significant advantage of generating a variety of expressionsfrom the given function set. For example, other methods maybe configured to fit a polynomial to the data, but the user hasto specify the degree. In SR, the power function in additionto the four basic arithmetic operations, allows the generationof unlimited degree polynomials, therefore providing a widerexploration of the solution space.
As mentioned, SR is designed to optimize both the form ofthe equations and the fitting parameters simultaneously. Thefitting parameters usually are specific to each dataset, but theform may give clues toward general principles. For example, allarchipelagos will follow an ISAR, even if each archipelago willhave its own c and z values. Although this aspect has not beenexplored in this study, we suggest two ways of finding generalprinciples. First, as was hinted by our estimators’ example, one
may independently analyse multiple datasets from the same typeof systems. From each dataset, one or multiple equations mayarise. Many of these will be similar in form even if the fittingparameters are different. Terms repeated in several equationsalong the Pareto front or with different datasets tend to bemeaningful (Schmidt and Lipson, 2009). We may then try to fitthe most promising forms to all datasets optimizing the fittingparameters to each dataset and look for which forms seem tohave general value over all data. Second, one may simultaneouslyanalyse multiple datasets from the same type of systems but witha change to the general SR implementation. Instead of optimizingboth form and fitting parameters, the algorithm may focus onfinding the best form, with fitting parameters being optimizedduring the evaluation step of the evolution for each datasetindependently. This parameter optimization could be done withstandard methods such as quasi-newton or simplex (Nocedaland Wright, 1999). To our knowledge, this approach has yetto be implemented, but it would allow finding general modelsand possibly principles, independently of the idiosyncrasies ofeach dataset.
The Need for Human InferenceMany data mining techniques are regarded, and rightly so, as“black boxes.” SR is transparent in this regard, as variablesare related through human-interpretable formulas. This isparticularly important if the goal is to find equations with bothpredictive and explanatory power, building the bridge betweenfinding the pattern and explaining the driving process, or if ageneral principle is to be suggested.
Frontiers in Ecology and Evolution | www.frontiersin.org 8 December 2020 | Volume 8 | Article 530135

Cardoso et al. Automated Discovery in Ecology
Our results show that an automated discovery system canidentify meaningful relationships in ecological data. Yet, asshown by our Canary Island spider SAR model, some equationsmight be very accurate but overfit the data. As with anyrelationship finding, either automated or human, correlationdoes not imply causation, and spurious relationships are not onlypossible but probable given complex enough data.
Although the method here presented is automated, it is partof a collaborative human–machine effort. The possibility ofexploiting artificial intelligence working together with humanexpertise can be traced back to Engelbart (1962), where theterm “augmented intelligence” was coined to designate suchcollaboration. It has been subsequently developed and extendedto teamwork involving one or more artificial intelligence agentstogether with one or (many) more humans, in diverse domainssuch as robotic teams (Yanco et al., 2004) or collective intelligencefor evolutionary multi-objective optimization (Cinalli et al.,2015). In ecological problems, human knowledge may play afundamental role: (1) in the beginning of the process, whenselecting input variables, building blocks and SR parameters; and(2) in the interpretation and validation of equations. The choiceof equations along a machine-generated Pareto front should alsotake advantage of human expert knowledge to identify the mostinteresting models to explain the data. The researcher mightthen decide to disregard, accept, or check equation validity usingother methods.
A priori KnowledgeTo some extent, it is possible to select a priori the type ofmodels the algorithm will search for by selecting the functionsto include in the function set. The choice of the function setis very important. A function set lacking a relevant functionfor the model may delay evolution or prevent it from finding aproper solution altogether. A way to take advantage of humanexpert knowledge is to seed the initial population of expressionswith some we know are related with the problem. For example,when searching for the GDM we could have given the algorithmmultiple forms of the ISAR to seed the search process. This isa directive approach and must be done in a parsimonious way,to avoid directing evolution too strongly, possibly trapping it ina local minimum. Such an approach should be complementedwith random expressions in the initial population to createthe necessary pool material for evolution to well explore thesolution space. Therefore, a priori knowledge in SR has a strongerinfluence than in other inference methods, such as Bayesian,where a less adequate prior may be overcome by enough data.
Fine-Tuning the ProcessThe number of options in SR is immense. Population size ispositively correlated with variability of models and how well thesearch space is explored, but might considerably slow the search.Mutation rates are also positively correlated with variability, butrates that are too high might prevent the algorithm convergingon the best models. The fitness measure depends on the specificproblem and on the type of noise in the data.
The number of generations to let the search run is entirelydependent on the problem complexity and time available. Oftenthe algorithm reaches some equation that makes immediate senseto the researcher and the process can be immediately stoppedfor further analysis of results. Sometimes several competingequations seem to make sense but are not entirely convincing,in which case some indicators can be used as a stop rule, suchas high values of stability and maturity of the evolution process(Schmidt, 2015).
The speed with which evolution occurs is extremelyvariable, depending on factors including the complexity of therelationships, having the appropriate variables and buildingblocks and the level of noise in the data. Fortunately, the processis easily adaptable to parallel computing, as many candidatefunctions can be evaluated simultaneously, allowing the use ofmultiple cores and even computer clusters to speed the searchof equations.
CaveatsThe SR approach is fully data-driven. This means it requireshigh-quality data if meaningful relationships are to be found.Also, it makes no a priori assumptions, so the final resultmight make no (obvious) sense, leading to spurious inferences,particularly if data are scarce or poor-quality, or if the rightbuilding blocks are not provided. Additionally, SR suffers fromthe same limitations of evolutionary algorithms in general.In many cases the algorithm may get stuck in local minimaof the search space, requiring time (or even a restart withdifferent parameters) to find the global minimum. Finally,SR suffers from the problem of bloat, which consists onan excessive growth of the expressions. There are mitigatingapproaches, like introducing a penalty for long expressionsin the fitness function, or doing a posteriori symbolicanalysis and simplification. However, bloat is still a problemunder research.
Nevertheless, the fact that SR produces human legibleexpressions turns out to be useful even in the case of verylarge expressions. The expert eye can usually distinguish relevantfragments from a variety of unmeaningful segments of longexpressions. And those relevant fragments often spur newthoughts and experiments.
The Automation of Science?The methods here presented can be powerful additions totheoretical and experimental ecology, even if new conceptualhypotheses have to be created to accommodate the newequations. Such models could even be the only available meansof investigating complex ecological systems when experimentsare not feasible or datasets get too big/complex to model,using traditional statistical techniques (e.g., Tromas et al.,2017).
This family of techniques has led several authors tosuggest the “automation of science” (King et al., 2009),where computers are able to advance hypotheses, test them,and reach conclusions in largely unassisted processes. Thisfalls into the realm of exploiting knowledge (or symbolic)
Frontiers in Ecology and Evolution | www.frontiersin.org 9 December 2020 | Volume 8 | Article 530135

Cardoso et al. Automated Discovery in Ecology
driven AI together with data driven AI, or also automatedmachine learning an approach that recently began to gainmomentum (e.g., Zhuang et al., 2017). SR potential is highin this automated science avenue since it bridges well fromdata to symbolic representations. What is clear already isits capability of producing formulas that help researchers tofocus on initially imperceptible but interesting relationshipswithin datasets and therefore SR may guide the process ofhypothesis creation.
DATA AVAILABILITY STATEMENT
Eureqa scripts and Pareto front are available in Data Sheet 2.Data for Case study Modeling species richness are in Cardosoet al. (2013). Train and test datasets used for species distributionmodeling are in Data Sheet 3. Dataset used in the case studyDeveloping species richness estimators are available in the Rpackage BAT (Cardoso et al., 2015). Dataset used in casestudy Developing the general dynamic model of oceanic islandbiogeography (GDM) are derived from Aranda et al. (2014) andCardoso et al. (2010) seeData Sheet 4.
AUTHOR CONTRIBUTIONS
PC conceived the original idea and led the writing of themanuscript with LC. PC and VB performed the analyseswith contributions from LC, JCC, and FR. PB and RGcontributed with data. All authors contributed to the writing ofthe manuscript.
FUNDING
PC and VB were supported by Kone Foundation. PB andFR were partly funded by the project FCT-PTDC/BIA-BIC/119255/2010 - Biodiversity on oceanic islands: toward aunified theory. LC was supported by FCT through LASIGEResearch Unit, ref. UIDB, UIDP/00408/2020. SM acknowledgessupport from the European Commission through Horizon 2020Marie Skłodowska-Curie Actions (MSCA) individual fellowships(Grant no. 882221).
ACKNOWLEDGMENTS
We thanked Robert Whittaker, Stano Pekár, Michael Lavine,and Otso Ovaskainen for comments on earlier versions ofthe manuscript; Carla Gomes and Ronan Le Bras for fruitfuldiscussions around AI and ecology.
SUPPLEMENTARY MATERIAL
The Supplementary Material for this article can be foundonline at: https://www.frontiersin.org/articles/10.3389/fevo.2020.530135/full#supplementary-material
Data Sheet 1 | Examples of general principles in ecology and of some of the
respective statistical models.
Data Sheet 2 | Data and settings used for all Symbolic Regression analyses in the
paper (Eureqa file: http://www.nutonian.com/products/eureqa/).
Data Sheet 3 | Train and test databases used for species distribution modeling.
Data Sheet 4 | Species, area, and age for each Canarian Island.
REFERENCES
Akaike, H. (1974). New look at statistical-model identification. Ieee T. Automat.
Contr. 19, 716–723. doi: 10.1109/TAC.1974.1100705
Allouche, O., Tsoar, A., and Kadmon, R. (2006). Assessing the accuracy of species
distribution models: prevalence, kappa and the true skill statistic (TSS). J. Appl.
Ecol. 43, 1223–1232. doi: 10.1111/j.1365-2664.2006.01214.x
Almeida, J., dos Santos, J. A., Miranda, W. O., Alberton, B., Morellato,
L. P. C., and Torres, R. D. (2015). Deriving vegetation indices for
phenology analysis using genetic programming. Ecol. Inform. 26, 61–69.
doi: 10.1016/j.ecoinf.2015.01.003
Anand, M., Gonzalez, A., Guichard, F., Kolasa, J., and Parrott, L. (2010). Ecological
systems as complex systems: challenges for an emerging science. Diversity 2,
395–410. doi: 10.3390/d2030395
Aranda, S. C., Gabriel, R., Borges, P. A. V., Santos, A. M. C., de Azevedo,
E. B., Patino, J., et al. (2014). Geographical, temporal and environmental
determinants of bryophyte species richness in the Macaronesian islands. PLoS
ONE 9:e101786. doi: 10.1371/journal.pone.0101786
Araújo, M. B., Anderson, R. P., Barbosa, A.M., Beale, C. M., Dormann, C. F., Early,
R., et al. (2019). Standards for distribution models in biodiversity assessments.
Sci. Adv. 5:eaat4858. doi: 10.1126/sciadv.aat4858
Barrett, J., Kostadinova, A., and Raga, J. A. (2005). Mining parasite
data using genetic programming. Trends Parasitol. 21, 207–209.
doi: 10.1016/j.pt.2005.03.007
Barton, K. (2015). MuMIn: Multi-Model Inference. Available online at: https://
CRAN.R-project.org/package=MuMIn (accessed September, 2020).
Bertoni, R., Bertoni, M., Morabito, G., Rogora, M., and Callieri, C. (2016). A non-
deterministic approach to forecasting the trophic evolution of lakes. J. Limnol.
75, 242–252. doi: 10.4081/jlimnol.2016.1374
Cardoso, P. (2009). Standardization and optimization of arthropod
inventories—the case of Iberian spiders. Biodivers. Conserv. 18, 3949–3962.
doi: 10.1007/s10531-009-9690-7
Cardoso, P., Aranda, S. C., Lobo, J. M., Dinis, F., Gaspar, C., and Borges, P. A. V.
(2009). A spatial scale assessment of habitat effects on arthropod communities
of an oceanic island. Acta Oecol. 35, 590–597. doi: 10.1016/j.actao.2009.05.005
Cardoso, P., Arnedo, M. A., Triantis, K. A., and Borges, P. A. V. (2010). Drivers of
diversity inMacaronesian spiders and the role of species extinctions. J. Biogeogr.
37, 1034–1046. doi: 10.1111/j.1365-2699.2009.02264.x
Cardoso, P., Gaspar, C., Pereira, L. C., Silva, I., Henriques, S. S., da Silva, R. R., et al.
(2008a). Assessing spider species richness and composition in Mediterranean
cork oak forests. Acta Oecol. 33, 114–127. doi: 10.1016/j.actao.2007.10.003
Cardoso, P., Rigal, F., and Carvalho, J. C. (2015). BAT - Biodiversity Assessment
Tools, an R package for the measurement and estimation of alpha and beta
taxon, phylogenetic and functional diversity. Methods Ecol. Evol. 6, 232–236.
doi: 10.1111/2041-210X.12310
Cardoso, P., Rigal, F., Fattorini, S., Terzopoulou, S., and Borges, P. A. V. (2013).
Integrating Landscape disturbance and indicator species in conservation
studies. PLoS ONE 8:e63294. doi: 10.1371/journal.pone.0063294
Cardoso, P., Scharff, N., Gaspar, C., Henriques, S. S., Carvalho, R., Castro, P. H.,
et al. (2008b). Rapid biodiversity assessment of spiders (Araneae) using semi-
quantitative sampling: a case study in a Mediterranean forest. Insect Conserv.
Diver. 1, 71–84. doi: 10.1111/j.1752-4598.2007.00008.x
Chen, Y., Angulo, M. T., and Liu, Y. Y. (2019). Revealing complex
ecological dynamics via symbolic regression. Bioessays 41:1900069.
doi: 10.1002/bies.201900069
Cinalli, D., Martí, L., Sanchez-Pi, N., and Garcia, A. C. B. (2015). “Collective
preferences in evolutionary multi-objective optimization: techniques
and potential contributions of collective intelligence,” in 30th Annual
Frontiers in Ecology and Evolution | www.frontiersin.org 10 December 2020 | Volume 8 | Article 530135

Cardoso et al. Automated Discovery in Ecology
ACM Symposium on Applied Computing (New York, NY), 133–138.
doi: 10.1145/2695664.2695926
Clench, H. (1979). How to make regional lists of butterflies: some thoughts. J.
Lepid. Soc. 33, 216–231.
Desjardins-Proulx, P., Poisot, T., and Gravel, D. (2019). Artificial intelligence
and synthesis in ecology and evolution. Front. Ecol. Evol. 7:402.
doi: 10.3389/fevo.2019.00402
Dodds, W. K. (2009). Laws, Theories and Patterns in Ecology. Berkeley, CA:
University of California Press. doi: 10.1525/california/9780520260405.001.0001
Dormann, C. F., Elith, J., Bacher, S., Buchmann, C., Carl, G., Carré, G.,
et al. (2013). Collinearity: a review of methods to deal with it and
a simulation study evaluating their performance. Ecography 3, 27–46.
doi: 10.1111/j.1600-0587.2012.07348.x
Dubcáková, R. (2011). Eureqa: software review. Genet. Program. Evol. M. 12,
173–178. doi: 10.1007/s10710-010-9124-z
Elith, J., Graham, C. H., Anderson, R. P., Dudik, M., Ferrier, S., Guisan, A.,
et al. (2006). Novel methods improve prediction of species’ distributions from
occurrence data. Ecography 29, 129–151. doi: 10.1111/j.2006.0906-7590.04
596.x
Engelbart, D. (1962). Augmenting Human Intellect: A Conceptual Framework.
Summary Report AFOSR-3233. Stanford Research Institute, Menlo Park, CA,
United States. doi: 10.21236/AD0289565
Evans, M. R., Grimm, V., Johst, K., Knuuttila, T., de Langhe, R., Lessells, C. M.,
et al. (2013). Do simple models lead to generality in ecology? Trends Ecol. Evol.
28, 578–583. doi: 10.1016/j.tree.2013.05.022
Fattorini, S. (2009). On the general dynamic model of oceanic island
biogeography. J. Biogeogr. 36, 1100–1110. doi: 10.1111/j.1365-2699.2009.02
083.x
Hastie, T. (2015). gam: Generalized Additive Models. Available online at: https://
CRAN.R-project.org/package=gam (accessed September, 2020).
Holland, J. H. (1975).Adaptation in Natural and Artificial Systems: An Introductory
Analysis With Applications to Biology, Control, and Artificial Intelligence. Ann
Arbor, MI: University of Michigan Press.
Holland, J. H. (1995). Hidden Order: How Adaptation Builds Complexity. Reading,
MA: Addison-Wesley.
Holland, J. H. (1998). Emergence: From Chaos to Order. Reading, MA: Addison-
Wesley.
Hurvich, C. M., and Tsai, C. L. (1989). Regression and time series model selection
in small samples. Biometrika 76, 297–307. doi: 10.1093/biomet/76.2.297
Jagupilla, S. C. K., Vaccari, D. A., Miskewitz, R., Su, T. L., and Hires,
R. I. (2015). Symbolic regression of upstream, stormwater, and tributary
E. coli concentrations using river flows. Water Environ. Res. 87, 26–34.
doi: 10.1002/j.1554-7531.2015.tb00138.x
King, R. D., Rowland, J., Oliver, S. G., Young, M., Aubrey, W., Byrne,
E., et al. (2009). The automation of science. Science 324, 85–89.
doi: 10.1126/science.1165620
Koza, J. R. (1992). Genetic Programming : On the Programming of Computers by
Means of Natural Selection. Cambridge, MA: MIT Press.
Larsen, P. E., Cseke, L. J., Miller, R. M., and Collart, F. R. (2014). Modeling
forest ecosystem responses to elevated carbon dioxide and ozone using artificial
neural networks. J. Theor. Biol. 359, 61–71. doi: 10.1016/j.jtbi.2014.05.047
Larsen, P. E., Field, D., and Gilbert, J. A. (2012). Predicting bacterial community
assemblages using an artificial neural network approach. Nat. Methods 9,
621–625. doi: 10.1038/nmeth.1975
Lawton, J. H. (1996). Patterns in ecology. Oikos 75, 145–147. doi: 10.2307/3546237
Liu, C. R., Berry, P. M., Dawson, T. P., and Pearson, R. G. (2005). Selecting
thresholds of occurrence in the prediction of species distributions. Ecography
28, 385–393. doi: 10.1111/j.0906-7590.2005.03957.x
Lu, Y. (2019). Artificial intelligence: a survey on evolution, models, applications
and future trends. J. Manag. Anal. 6, 1–29. doi: 10.1080/23270012.2019.1570365
Manson, S. M. (2005). Agent-based modeling and genetic programming
for modeling land change in the Southern Yucatan Peninsular Region
of Mexico. Agr. Ecosyst. Environ. 111, 47–62. doi: 10.1016/j.agee.2005.
04.024
Manson, S. M., and Evans, T. (2007). Agent-based modeling of deforestation in
southern Yucatan, Mexico, and reforestation in the Midwest United States.
Proc. Natl. Acad. Sci. U.S.A. 104, 20678–20683. doi: 10.1073/pnas.070
5802104
Martin, B. T., Munch, S. B., and Hein, A. M. (2018). Reverse-engineering
ecological theory from data. P Roy. Soc. B-Biol. Sci. 285:20180422.
doi: 10.1098/rspb.2018.0422
Mitchell, M. (2009). Complexity: A Guided Tour. Oxford England, New York, NY:
Oxford University Press.
Muttil, N., and Chau, K. (2006). Neural network and genetic programming
for modelling coastal algal blooms. Int. J. Environ. Pollut. 28, 223–238.
doi: 10.1504/IJEP.2006.011208
Muttil, N., and Lee, J. H. W. (2005). Genetic programming for analysis and
real-time prediction of coastal algal blooms. Ecol. Model. 189, 363–376.
doi: 10.1016/j.ecolmodel.2005.03.018
Nocedal, J., and Wright, S. J. (1999). Numerical Optimization. New York, NY:
Springer. doi: 10.1007/b98874
Passy, S. I. (2012). A hierarchical theory of macroecology. Ecol. Lett. 15, 923–934.
doi: 10.1111/j.1461-0248.2012.01809.x
Phillips, S. J., Anderson, R. P., and Schapire, R. E. (2006). Maximum entropy
modeling of species geographic distributions. Ecol. Model. 190, 231–259.
doi: 10.1016/j.ecolmodel.2005.03.026
R Core Team (2015). R: A Language and Environment for Statistical Computing.
Vienna: R Foundation for Statistical Computing.
Ratkowsky, D. A. (1990). Handbook of Nonlinear Regression Models. New York,
NY: M. Dekker.
Reshef, D. N., Reshef, Y. A., Finucane, H. K., Grossman, S. R., McVean, G.,
Turnbaugh, P. J., et al. (2011). Detecting novel associations in large data sets.
Science 334, 1518–1524. doi: 10.1126/science.1205438
Russell, S. J., Norvig, P., and Davis, E. (2010). Artificial Intelligence: A Modern
Approach, 3rd Edn. Upper Saddle River, NJ: Prentice Hall.
Schmidt, M., and Lipson, H. (2009). Distilling free-form natural laws from
experimental data. Science 324, 81–85. doi: 10.1126/science.1165893
Schmidt, M. L. H. (2015). Eureqa. Available online at: https://www.nutonian.com/
(accessed September, 2020).
Smits, G. F., and Kotanchek, M. (2005). “Pareto-front exploitation in symbolic
regression,” in Genetic Programming Theory and Practice II, eds U.-M.
O’Reilly, T. Yu, R. Riolo, and B. Worzel (Boston, MA: Springer), 283–299.
doi: 10.1007/0-387-23254-0_17
Soberón, J., and Llorente, J. (1993). The use of species accumulation
functions for the prediction of species richness. Conserv. Biol. 7, 480–488.
doi: 10.1046/j.1523-1739.1993.07030480.x
Solé, R. V., and Goodwin, B. C. (2000). Signs of Life: How Complexity Pervades
Biology. New York, NY: Basic Books.
Steinbauer, M. J., Klara, D., Field, R., Reineking, B., and Beierkuhnlein, C. (2013).
Re-evaluating the general dynamic theory of oceanic island biogeography.
Front. Biogeogr. 5, 185–194. doi: 10.21425/F5FBG19669
Sugihara, G., May, R., Ye, H., Hsieh, C. H., Deyle, E., Fogarty, M., et al.
(2012). Detecting causality in complex ecosystems. Science 338, 496–500.
doi: 10.1126/science.1227079
Triantis, K. A., Guilhaumon, F., and Whittaker, R. J. (2012). The island
species-area relationship: biology and statistics. J. Biogeogr. 39, 215–231.
doi: 10.1111/j.1365-2699.2011.02652.x
Tromas, N., Fortin, N., Bedrani, L., Terrat, Y., Cardoso, P., Bird, D., et al. (2017).
Characterizing and predicting cyanobacterial blooms in an 8-year amplicon
sequencing time course. ISME J. 11, 1746–1763. doi: 10.1038/ismej.2017.58
Tung, C. P., Lee, T. Y., Yang, Y. C. E., and Chen, Y. J. (2009). Application of
genetic programming to project climate change impacts on the population
of Formosan Landlocked Salmon. Environ. Modell. Softw. 24, 1062–1072.
doi: 10.1016/j.envsoft.2009.02.012
Whittaker, R. J., Triantis, K. A., and Ladle, R. J. (2008). A general
dynamic theory of oceanic island biogeography. J. Biogeogr. 35, 977–994.
doi: 10.1111/j.1365-2699.2008.01892.x
Yanco, H. A., Drury, J. L., and Scholtz, J. (2004). Beyond usability evaluation:
analysis of human-robot interaction at a major robotics competition. Hum-
Comput. Interact. 19, 117–149. Available online at: https://www.nist.gov/
publications/beyond-usability-evaluation-analysis-human-robot-interaction-
major-robotics-competition
Yao, M. J., Rui, J. P., Li, J. B., Dai, Y. M., Bai, Y. F., Hedenec, P., et al. (2014).
Rate-specific responses of prokaryotic diversity and structure to nitrogen
deposition in the Leymus chinensis steppe. Soil Biol. Biochem. 79, 81–90.
doi: 10.1016/j.soilbio.2014.09.009
Frontiers in Ecology and Evolution | www.frontiersin.org 11 December 2020 | Volume 8 | Article 530135

Cardoso et al. Automated Discovery in Ecology
Zhuang, Y., Wu, F., Chen, C., and Pan, Y. (2017). Challenges and opportunities:
from big data to knowledge in AI 2.0. Front. Inform. Tech. El. 18, 3–14.
doi: 10.1631/FITEE.1601883
Conflict of Interest: The authors declare that the research was conducted in the
absence of any commercial or financial relationships that could be construed as a
potential conflict of interest.
Copyright © 2020 Cardoso, Branco, Borges, Carvalho, Rigal, Gabriel, Mammola,
Cascalho and Correia. This is an open-access article distributed under the terms
of the Creative Commons Attribution License (CC BY). The use, distribution or
reproduction in other forums is permitted, provided the original author(s) and the
copyright owner(s) are credited and that the original publication in this journal
is cited, in accordance with accepted academic practice. No use, distribution or
reproduction is permitted which does not comply with these terms.
Frontiers in Ecology and Evolution | www.frontiersin.org 12 December 2020 | Volume 8 | Article 530135