automated optimal balancing of traffic volume …docs.trb.org/prp/14-3565.pdf · automated optimal...
TRANSCRIPT
AutomatedOptimalBalancingofTrafficVolumeDataforLargeAccess‐ControlledHighwayNetworksandFreeway‐to‐FreewayInterchanges
JohnW.Shaw,PE(CorrespondingAuthor)ResearcherTrafficOperations&SafetyLaboratoryUniversityofWisconsin1415EngineeringDriveMadison,WI53706Phone:(414)227‐[email protected]&EnvironmentalEngineeringUniversityofWisconsin1204EngineeringHall1415EngineeringDriveMadison,WI53706Phone:(608)265‐[email protected](4342+2Figures×250+3Tables×250)=5592words
TRB 2014 Annual Meeting Paper revised from original submittal.
Shaw & Noyce TRB 93rd Annual Meeting Paper 14‐3565 1
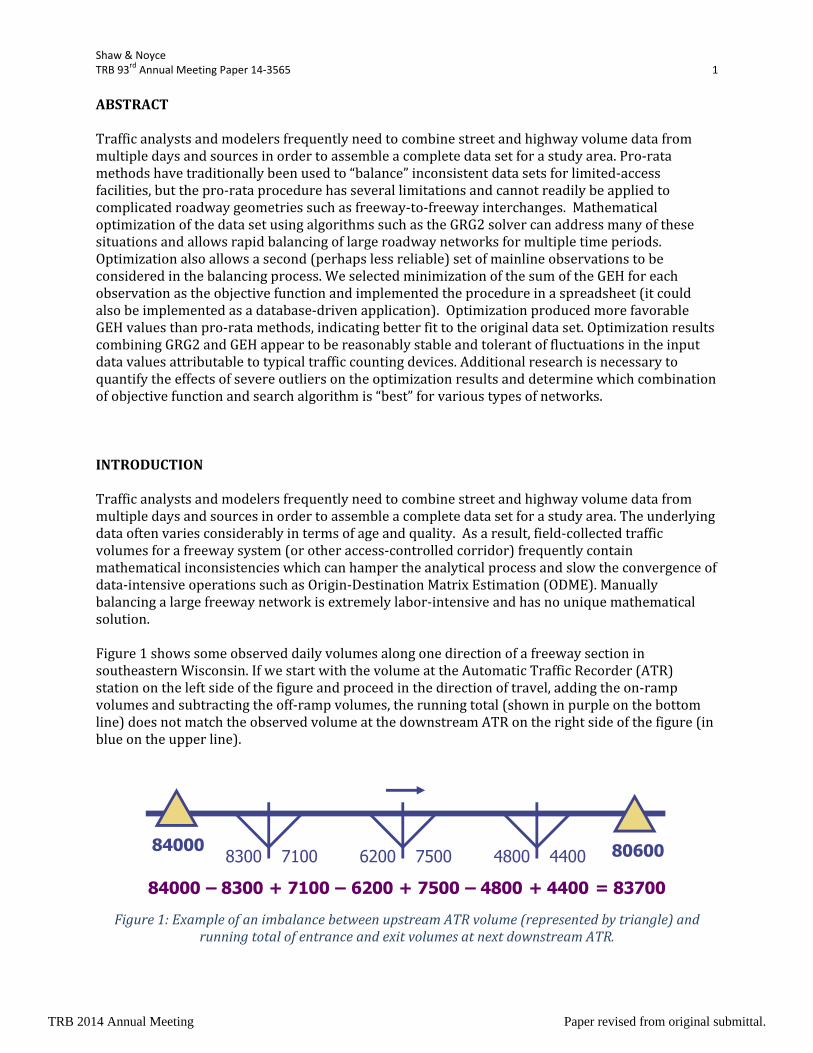
ABSTRACTTrafficanalystsandmodelersfrequentlyneedtocombinestreetandhighwayvolumedatafrommultipledaysandsourcesinordertoassembleacompletedatasetforastudyarea.Pro‐ratamethodshavetraditionallybeenusedto“balance”inconsistentdatasetsforlimited‐accessfacilities,butthepro‐rataprocedurehasseverallimitationsandcannotreadilybeappliedtocomplicatedroadwaygeometriessuchasfreeway‐to‐freewayinterchanges.MathematicaloptimizationofthedatasetusingalgorithmssuchastheGRG2solvercanaddressmanyofthesesituationsandallowsrapidbalancingoflargeroadwaynetworksformultipletimeperiods.Optimizationalsoallowsasecond(perhapslessreliable)setofmainlineobservationstobeconsideredinthebalancingprocess.WeselectedminimizationofthesumoftheGEHforeachobservationastheobjectivefunctionandimplementedtheprocedureinaspreadsheet(itcouldalsobeimplementedasadatabase‐drivenapplication).OptimizationproducedmorefavorableGEHvaluesthanpro‐ratamethods,indicatingbetterfittotheoriginaldataset.OptimizationresultscombiningGRG2andGEHappeartobereasonablystableandtolerantoffluctuationsintheinputdatavaluesattributabletotypicaltrafficcountingdevices.Additionalresearchisnecessarytoquantifytheeffectsofsevereoutliersontheoptimizationresultsanddeterminewhichcombinationofobjectivefunctionandsearchalgorithmis“best”forvarioustypesofnetworks.INTRODUCTIONTrafficanalystsandmodelersfrequentlyneedtocombinestreetandhighwayvolumedatafrommultipledaysandsourcesinordertoassembleacompletedatasetforastudyarea.Theunderlyingdataoftenvariesconsiderablyintermsofageandquality.Asaresult,field‐collectedtrafficvolumesforafreewaysystem(orotheraccess‐controlledcorridor)frequentlycontainmathematicalinconsistencieswhichcanhampertheanalyticalprocessandslowtheconvergenceofdata‐intensiveoperationssuchasOrigin‐DestinationMatrixEstimation(ODME).Manuallybalancingalargefreewaynetworkisextremelylabor‐intensiveandhasnouniquemathematicalsolution.Figure1showssomeobserveddailyvolumesalongonedirectionofafreewaysectioninsoutheasternWisconsin.IfwestartwiththevolumeattheAutomaticTrafficRecorder(ATR)stationontheleftsideofthefigureandproceedinthedirectionoftravel,addingtheon‐rampvolumesandsubtractingtheoff‐rampvolumes,therunningtotal(showninpurpleonthebottomline)doesnotmatchtheobservedvolumeatthedownstreamATRontherightsideofthefigure(inblueontheupperline).
Figure1:ExampleofanimbalancebetweenupstreamATRvolume(representedbytriangle)andrunningtotalofentranceandexitvolumesatnextdownstreamATR.
840008300 7100 6200 7500 4800 4400 80600
84000 – 8300 + 7100 – 6200 + 7500 – 4800 + 4400 = 83700
TRB 2014 Annual Meeting Paper revised from original submittal.
Shaw & Noyce TRB 93rd Annual Meeting Paper 14‐3565 2
TheinconsistencieshighlightedinFigure1ariseprimarilyfromthefactthatthenetworkwasnotcountedsimultaneously.Instead,thefigurerepresentstypicalWisconsindatacollectionpractice:acombinationofannualaveragesfrommainlineATRs(continuouscounts)and48‐hourrampcountscollectedonvariousdaysusingportablepneumatictubecounters.Alocationsuchasthismightalsohaveshort‐durationmainlinecounts,volumesfromFreewayTrafficManagementSystem(FTMS)sensors,toll‐tagreaderdata,weigh‐in‐motionstations,intersectionturningmovementcounts,etc.Sincedataiscollectedatdifferenttimeswithvarioustechnologies(anddifferingquality‐acceptancecriteria),itmustbeadjustedor"balanced"toobtainamathematicallyconsistentdataset.Thispaperdiscussesaprocedureforbalancingtrafficvolumedataforanaccess‐controlledfacilitysuchasafreeway.Ifdirectionaldataisavailable,balancingcouldalsobeappliedtoarterialsorothernon‐access‐controlledfacilities,providedthattrafficgeneratorssuchassidestreetsandmajordrivewaysaretreatedinamannersimilarto"ramps"inthediscussionthatfollows.GOALSOFTHEBALANCINGPROCESSOurprimaryapplicationsforthebalanceddataareHCMcapacityanalysis,workzonetrafficplanning,andODmatrixestimationformicrosimulationmodeling(wherepriorexperienceindicatedthatbalancingtheinputdataresultedinfasterconvergenceandreducedtheriskofoscillationbetweenconflictingnumericaltargets).Thereforeourgoalsincludethefollowing:
Computebalancedvolumesforallaccess‐controlledroadwaygeometries,includingfreeway‐to‐freewayinterchanges(systeminterchanges)andfrontageroadsystems,aswellasordinaryfreewaysegments.
Facilitatesimultaneousbalancingofallaccess‐controlledfacilitiesinalargenetwork(i.e.multi‐countyregionsorstatewide).
Supportbalancingovermultipletimeperiods,e.g.12months×24hours×4daytypes(weekday,Friday,Saturday,Sunday).
Utilizeaspreadsheetoradatabaseapplication,withoutrequiringexternaltoolssuchasatraveldemandforecastingmodel.
ReconciledatafromallavailablesourcesincludingATRs,FTMSsensors,andshort‐durationcounts.
Imputemissingdataforshortsegmentssuchasbetweenrampsatadiamondinterchange. Tempertheeffectsofoutliers(suchascountscollectedonnon‐representativedays)and
errorssuchasequipmentproblems. Utilizeprior‐yeardataasasurrogateincaseofdetectorfailureorsimilarcircumstances. Provideanindicatorofpossiblesensorproblems.
PREVIOUSAUTOMATEDBALANCINGMETHODSSeveralauthorshaveaddressedthequestionofbalancingturningmovementcountdataalonganarterialcorridor.Hauer,etal(1)developedatechniqueforsolvingandbalancingturningmovementvolumesbasedonaninitialestimateofturningproportionssuppliedbytheuser.ThemethodwasfurtherelaboratedbyLin&Rasp(2)anddevelopedintoaspreadsheetapplicationcalledTURNS5fortheFloridaDepartmentofTransportation(3).Ren&Rahman(4)appliedafuzzylogicapproachtotheproblemofforecastingfutureturningmovementcounts,givenamainline
TRB 2014 Annual Meeting Paper revised from original submittal.
Shaw & Noyce TRB 93rd Annual Meeting Paper 14‐3565 3
forecastandanexistingturningpattern.Xin(5)developedadesktopapplicationcalledArtBalTforbalancingexistingintersectionturningmovementcountsalongashortarterialcorridor(upto6typicalintersections)by“proportioningtheextralinkvolume(i.e.thevolumedifferencebetweenthetotalinflowandtotaloutflowofalink)amonganymovementsthatcanbechanged.”Liao(6)expandedXin’slogictoallowpro‐ratabalancingalonga“lineararterialnetworkwithvirtuallynointersectionsizelimit.”Acaveattothesemethodsisthepotentialexistenceofunmonitoredaccesspointsbetweenintersections,potentiallyviolatingtheassumedequalitybetweenupstreamoutputvolumesanddownstreaminputvolumes.Inthecontextofaccess‐controlledfacilities,the2001FHWATrafficMonitoringGuide(TMG)(7)suggeststheuseofapro‐rataadjustmentprocessforfreewaymainlinebalancing.IntheTMGprocedure,pairsofATRsareselectedandusedas“anchorpoints”;countsattheanchorsareassumedtobeaccurateandpro‐ratarampvolumeadjustmentsaremadeinordertobalancevolumesalongthesegment.
(1)
| |
(2)
Where:, =Mainlinevolumesatanchorpoints
=Observedvolumeonrampi(>0forentrancerampsand<0forexitramps)
=Observedvolumeonrampj(>0forentrancerampsand<0forexitramps)
=Adjustedvolumeonrampi(>0forentrancerampsand<0forexitramps)
=Adjustedvolumeonrampj(>0forentrancerampsand<0forexitramps)
InTable1,ColumnCshowsthewaytheTMG’spro‐ratamethoddistributestheimbalanceof+3100vehiclesfromtheFigure1data(inthiscasethe3.1%mainlineimbalanceresultsinan8.1%adjustmenttoeachentranceandexitramp).Xin(5)utilizedthismethodinadesktopdata‐preparationapplicationcalledTradaX.Themethodwasalsoutilizedonaregionalscaleinanunpublishedspreadsheet‐basedtoolcalledBALTdevelopedbyNam&OrnekfortheSoutheastWisconsinFreewaySystemOperationalAssessment.Inthemid1990sZhaoetal(8)developedatrafficdatareconciliationsystemfortheConnecticutDOT.TheiralgorithmfocusesprimarilyontheuseofbalancingtechniquestoimputetrafficvolumesforunmonitoredmainlinelinkswhenthereareasmallnumberofATRsservingasanchorpointsandafullsetofcountsforfreewayramps.Inaddition,theyprovidedlogicusingleastsquaresregressiontoresolvediscrepanciesatmainlinecountstationswhereredundantdataisavailable.Asignificantlimitationoftheirmethodisthattheobjectivefunctionrequiresanaprioriestimateofthevariance(orstandarddeviation)ofeachsite’svolumes,andassumesthattheerrorsarenormallydistributed,whichisnotalwaysthecase.
TRB 2014 Annual Meeting Paper revised from original submittal.
Shaw & Noyce TRB 93rd Annual Meeting Paper 14‐3565 4
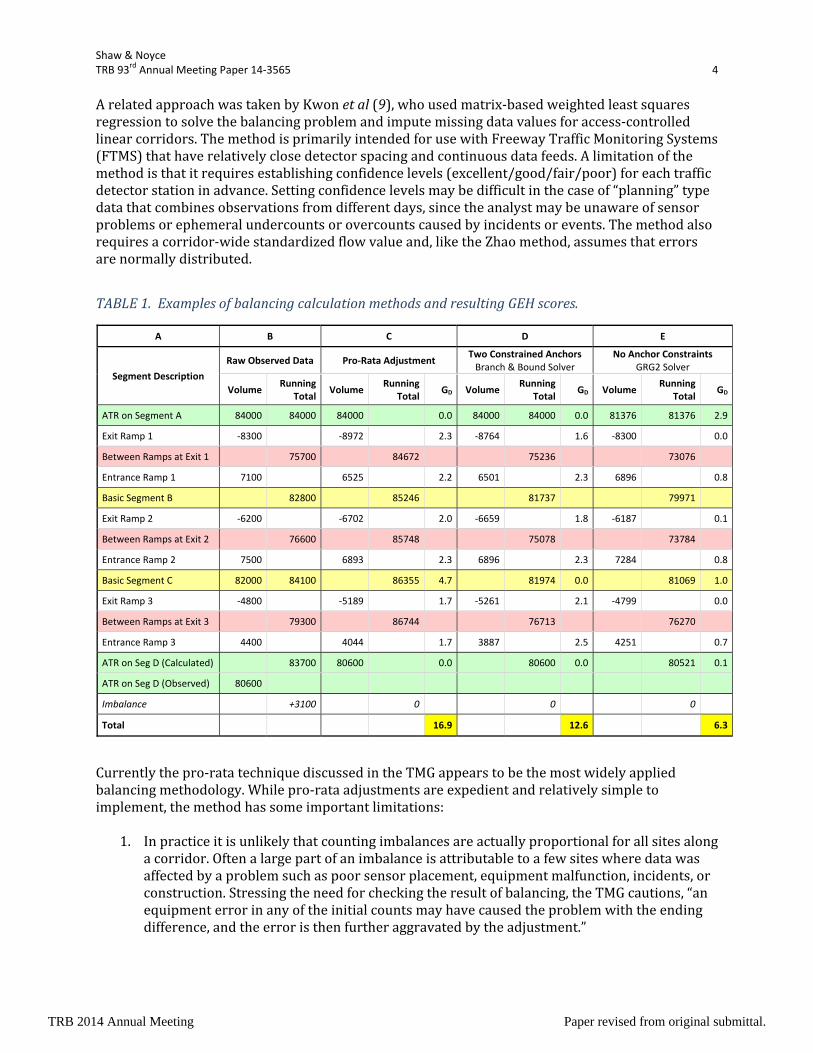
ArelatedapproachwastakenbyKwonetal(9),whousedmatrix‐basedweightedleastsquaresregressiontosolvethebalancingproblemandimputemissingdatavaluesforaccess‐controlledlinearcorridors.ThemethodisprimarilyintendedforusewithFreewayTrafficMonitoringSystems(FTMS)thathaverelativelyclosedetectorspacingandcontinuousdatafeeds.Alimitationofthemethodisthatitrequiresestablishingconfidencelevels(excellent/good/fair/poor)foreachtrafficdetectorstationinadvance.Settingconfidencelevelsmaybedifficultinthecaseof“planning”typedatathatcombinesobservationsfromdifferentdays,sincetheanalystmaybeunawareofsensorproblemsorephemeralundercountsorovercountscausedbyincidentsorevents.Themethodalsorequiresacorridor‐widestandardizedflowvalueand,liketheZhaomethod,assumesthaterrorsarenormallydistributed.
TABLE1.ExamplesofbalancingcalculationmethodsandresultingGEHscores.
A B C D E
Segment Description
Raw Observed Data Pro‐Rata Adjustment Two Constrained Anchors Branch & Bound Solver
No Anchor ConstraintsGRG2 Solver
Volume Running
Total Volume
Running Total
GD VolumeRunning
TotalGD Volume
Running Total
GD
ATR on Segment A 84000 84000 84000 0.0 84000 84000 0.0 81376 81376 2.9
Exit Ramp 1 ‐8300 ‐8972 2.3 ‐8764 1.6 ‐8300 0.0
Between Ramps at Exit 1 75700 84672 75236 73076
Entrance Ramp 1 7100 6525 2.2 6501 2.3 6896 0.8
Basic Segment B 82800 85246 81737 79971
Exit Ramp 2 ‐6200 ‐6702 2.0 ‐6659 1.8 ‐6187 0.1
Between Ramps at Exit 2 76600 85748 75078 73784
Entrance Ramp 2 7500 6893 2.3 6896 2.3 7284 0.8
Basic Segment C 82000 84100 86355 4.7 81974 0.0 81069 1.0
Exit Ramp 3 ‐4800 ‐5189 1.7 ‐5261 2.1 ‐4799 0.0
Between Ramps at Exit 3 79300 86744 76713 76270
Entrance Ramp 3 4400 4044 1.7 3887 2.5 4251 0.7
ATR on Seg D (Calculated) 83700 80600 0.0 80600 0.0 80521 0.1
ATR on Seg D (Observed) 80600
Imbalance +3100 0 0 0
Total 16.9 12.6 6.3
Currentlythepro‐ratatechniquediscussedintheTMGappearstobethemostwidelyappliedbalancingmethodology.Whilepro‐rataadjustmentsareexpedientandrelativelysimpletoimplement,themethodhassomeimportantlimitations:
1. Inpracticeitisunlikelythatcountingimbalancesareactuallyproportionalforallsitesalongacorridor.Oftenalargepartofanimbalanceisattributabletoafewsiteswheredatawasaffectedbyaproblemsuchaspoorsensorplacement,equipmentmalfunction,incidents,orconstruction.Stressingtheneedforcheckingtheresultofbalancing,theTMGcautions,“anequipmenterrorinanyoftheinitialcountsmayhavecausedtheproblemwiththeendingdifference,andtheerroristhenfurtheraggravatedbytheadjustment.”
TRB 2014 Annual Meeting Paper revised from original submittal.
Shaw & Noyce TRB 93rd Annual Meeting Paper 14‐3565 5
2. Thepro‐rataprocessplaces100%confidenceintheanchorpointdata.Inpractice,evenwhenATRsareusedasanchorsthedataisnotcompletelyaccurate,especiallyassensorsdegradewithage.
3. TheTMGrecommendsthattherebenomorethan5interchangesbetweenanchors,butthisisnotalwaysfeasibleduetolimitedATRinfrastructure(especiallyinruralareas).
4. Thepro‐rataprocessisdifficulttoimplementforcomplicatedroadwaygeometries,suchasfreeway‐to‐freewayinterchanges(whereeachrampaffectsthreeormorecomputations).Frontageroadsthatre‐jointhemainlinealsopresentcomputationalchallenges.
5. Thepro‐rataprocessrequiresanATRstationorothertrustedobservationateachendofsectionthatisbeinganalyzed.Suchdatamaynotexist,forexample,atstub‐endsofthenetworkorjurisdictionalboundaries.
6. Thepro‐rataprocesscannottakeadvantageofnon‐anchorobservationsonbasicroadwaysegments.Consequentlyitcannotuseadditionaldatathathelpsclarifywhichofthemanypossiblesolutionsisthemostappropriate.
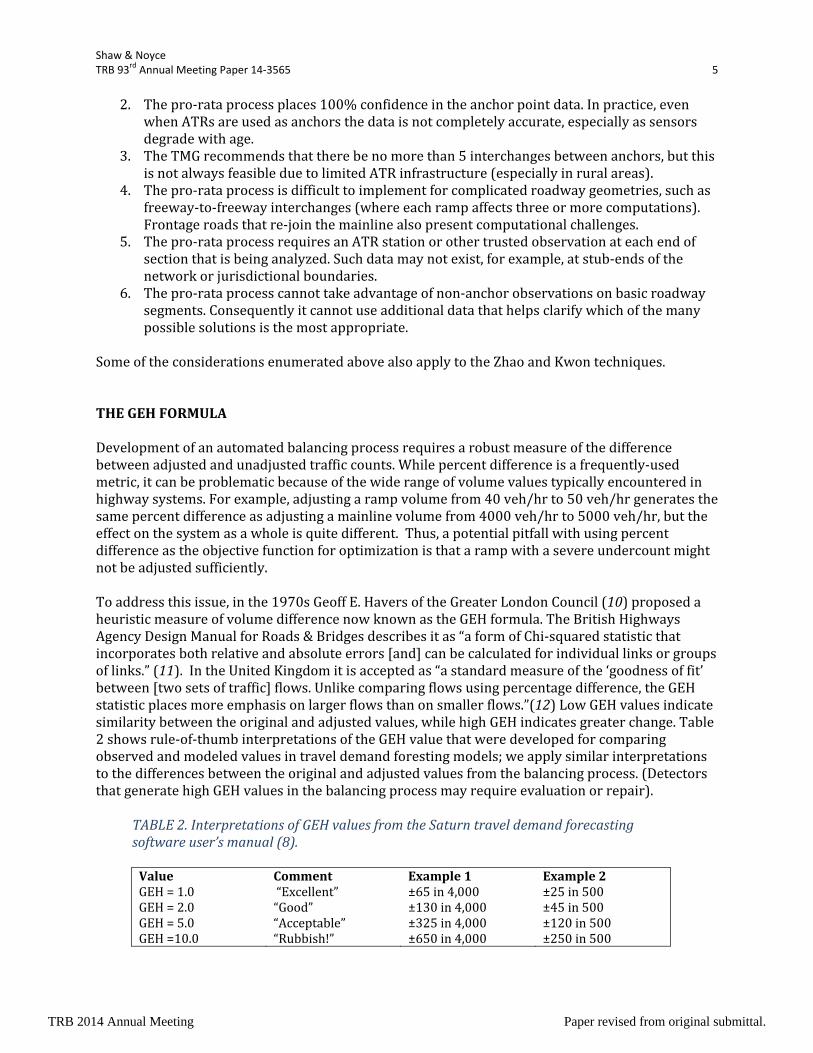
SomeoftheconsiderationsenumeratedabovealsoapplytotheZhaoandKwontechniques.THEGEHFORMULADevelopmentofanautomatedbalancingprocessrequiresarobustmeasureofthedifferencebetweenadjustedandunadjustedtrafficcounts.Whilepercentdifferenceisafrequently‐usedmetric,itcanbeproblematicbecauseofthewiderangeofvolumevaluestypicallyencounteredinhighwaysystems.Forexample,adjustingarampvolumefrom40veh/hrto50veh/hrgeneratesthesamepercentdifferenceasadjustingamainlinevolumefrom4000veh/hrto5000veh/hr,buttheeffectonthesystemasawholeisquitedifferent.Thus,apotentialpitfallwithusingpercentdifferenceastheobjectivefunctionforoptimizationisthatarampwithasevereundercountmightnotbeadjustedsufficiently.Toaddressthisissue,inthe1970sGeoffE.HaversoftheGreaterLondonCouncil(10)proposedaheuristicmeasureofvolumedifferencenowknownastheGEHformula.TheBritishHighwaysAgencyDesignManualforRoads&Bridgesdescribesitas“aformofChi‐squaredstatisticthatincorporatesbothrelativeandabsoluteerrors[and]canbecalculatedforindividuallinksorgroupsoflinks.”(11).IntheUnitedKingdomitisacceptedas“astandardmeasureofthe‘goodnessoffit’between[twosetsoftraffic]flows.Unlikecomparingflowsusingpercentagedifference,theGEHstatisticplacesmoreemphasisonlargerflowsthanonsmallerflows.”(12)LowGEHvaluesindicatesimilaritybetweentheoriginalandadjustedvalues,whilehighGEHindicatesgreaterchange.Table2showsrule‐of‐thumbinterpretationsoftheGEHvaluethatweredevelopedforcomparingobservedandmodeledvaluesintraveldemandforestingmodels;weapplysimilarinterpretationstothedifferencesbetweentheoriginalandadjustedvaluesfromthebalancingprocess.(DetectorsthatgeneratehighGEHvaluesinthebalancingprocessmayrequireevaluationorrepair).
TABLE2.InterpretationsofGEHvaluesfromtheSaturntraveldemandforecastingsoftwareuser’smanual(8).
ValueGEH=1.0GEH=2.0GEH=5.0GEH=10.0
Comment“Excellent”“Good”“Acceptable”“Rubbish!”
Example1±65in4,000±130in4,000±325in4,000±650in4,000
Example2±25in500±45in500±120in500±250in500
TRB 2014 Annual Meeting Paper revised from original submittal.
Shaw & Noyce TRB 93rd Annual Meeting Paper 14‐3565 6
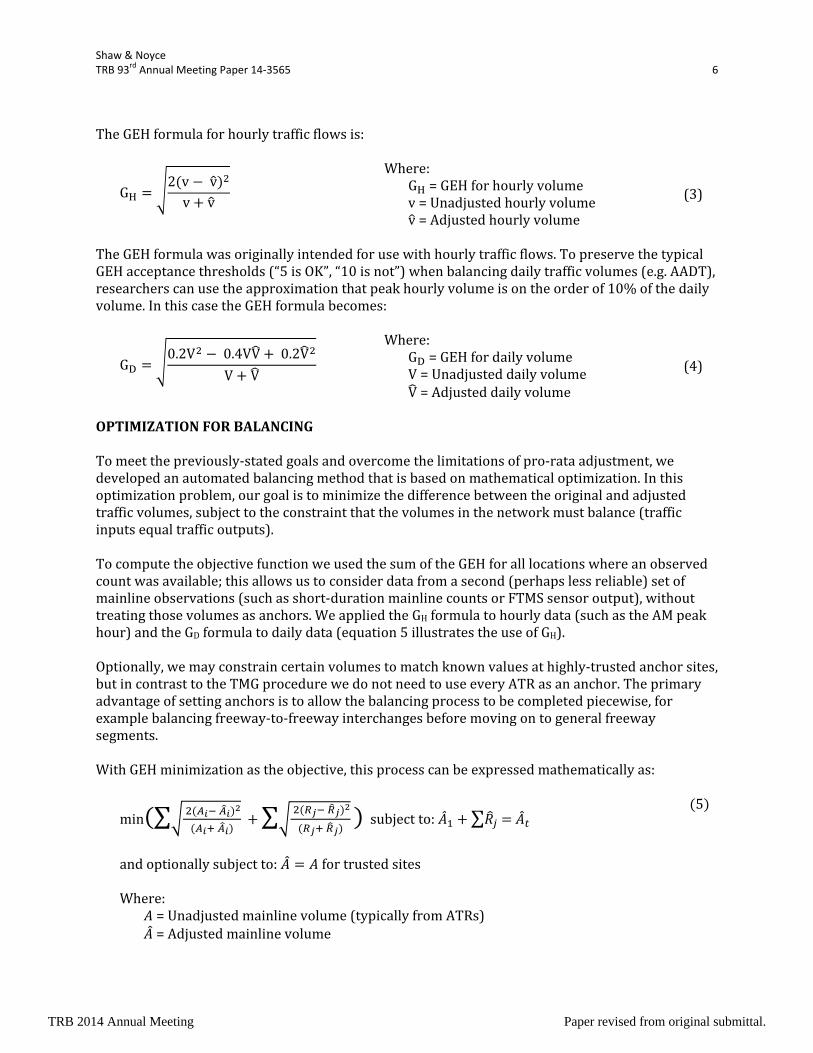
TheGEHformulaforhourlytrafficflowsis:
G2 v vv v
Where:G =GEHforhourlyvolumev=Unadjustedhourlyvolumev=Adjustedhourlyvolume
(3)
TheGEHformulawasoriginallyintendedforusewithhourlytrafficflows.TopreservethetypicalGEHacceptancethresholds(“5isOK”,“10isnot”)whenbalancingdailytrafficvolumes(e.g.AADT),researcherscanusetheapproximationthatpeakhourlyvolumeisontheorderof10%ofthedailyvolume.InthiscasetheGEHformulabecomes:
G0.2V 0.4VV 0.2V
V V
Where:G =GEHfordailyvolumeV=UnadjusteddailyvolumeV=Adjusteddailyvolume
(4)
OPTIMIZATIONFORBALANCINGTomeetthepreviously‐statedgoalsandovercomethelimitationsofpro‐rataadjustment,wedevelopedanautomatedbalancingmethodthatisbasedonmathematicaloptimization.Inthisoptimizationproblem,ourgoalistominimizethedifferencebetweentheoriginalandadjustedtrafficvolumes,subjecttotheconstraintthatthevolumesinthenetworkmustbalance(trafficinputsequaltrafficoutputs).TocomputetheobjectivefunctionweusedthesumoftheGEHforalllocationswhereanobservedcountwasavailable;thisallowsustoconsiderdatafromasecond(perhapslessreliable)setofmainlineobservations(suchasshort‐durationmainlinecountsorFTMSsensoroutput),withouttreatingthosevolumesasanchors.WeappliedtheGHformulatohourlydata(suchastheAMpeakhour)andtheGDformulatodailydata(equation5illustratestheuseofGH).Optionally,wemayconstraincertainvolumestomatchknownvaluesathighly‐trustedanchorsites,butincontrasttotheTMGprocedurewedonotneedtouseeveryATRasananchor.Theprimaryadvantageofsettinganchorsistoallowthebalancingprocesstobecompletedpiecewise,forexamplebalancingfreeway‐to‐freewayinterchangesbeforemovingontogeneralfreewaysegments.WithGEHminimizationastheobjective,thisprocesscanbeexpressedmathematicallyas:
min ∑
∑
subjectto: ∑
andoptionallysubjectto: fortrustedsites
5
Where:=Unadjustedmainlinevolume(typicallyfromATRs)
=Adjustedmainlinevolume
TRB 2014 Annual Meeting Paper revised from original submittal.
Shaw & Noyce TRB 93rd Annual Meeting Paper 14‐3565 7
=Unadjustedrampvolume =Adjustedrampvolume
t=StationIDatterminusoftheanalysissectionIMPLEMETINGTHEBALANCINGPROCESSProceduralStepsThemainstepsinthisprocessareasfollows:
1. Importingtherawdatafromvarioustrafficdatabases.2. Computingtheimbalanceintheimporteddatasetbymeansofrunningtotals.3. Adjustingthecountsusingmathematicaloptimization,subjecttotheconstraintthatthe
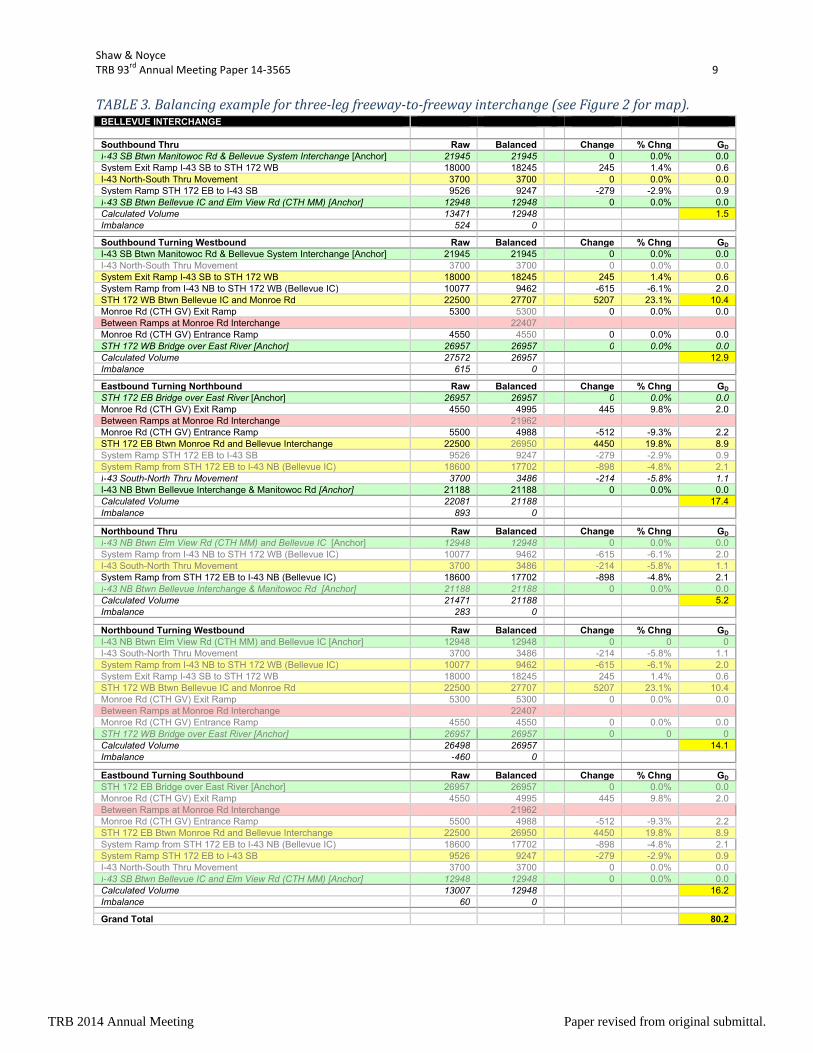
imbalancemustbezero.Weimplementedvolumebalancinginaspreadsheetforthefreewaysystemsinsomerelativelylargemetropolitanareas(i.e.metroMilwaukeeandmetroGreenBay).Amainframeapplicationthatcandirectlyaccesstherawtrafficdataalsowarrantsconsideration,especiallyifbalancingofmultipletimeperiodsorverylargeareasisdesired.Ineithercase,anoptimizationalgorithmneedstobeavailable.Forspreadsheet‐basedbalancingweusedtheSolveradd‐inforMicrosoftExcel,whichusestheGeneralizedReducedGradient(GRG2)algorithmforoptimizingnonlinearproblemsandtheBranch&Bound(B&B)methodforoptimizingintegerproblems(13).InourdatasetstheGRG2algorithmtendedtoproduceresultsmorequicklythantheB&Bmethod,butGRG2hadagreaterchanceofstoppingonalocalminimum(insteadoftheglobalminimum).OutputExamplesTheresultsofoptimizingtheFigure1datasetareshowninColumnsDandEofTable1.Forillustrativepurposes,itisassumedthata48‐hourmainlinecountwasavailableinSegmentC,withanobservedaveragedailyvolumeof82,000(sinceitisincludedintheGEHcalculationsthissupplementalobservationinfluencestheoptimization).ColumnDshowstheresultswiththeB&BalgorithmandtheconstraintthatbothATRsaretreatedasunchangeableanchorsthatmustexactlymatchtheoriginalobservations(asinthepro‐ratamethod).Comparedtothepro‐ratamethod,totalGDforthisfreewaysectiondropsfrom16.9to12.6(averageGDdropsfrom1.9to1.4).ColumnEshowstheresultofrelaxingtheanchorconstraintandusingtheGRG2algorithm;inthiscasetotalGDdropsto4.4(averageGDdropsto0.5).InbothcasestheoriginalunadjustedvolumeswereusedasthetrialsolutionandGEHminimizationwasusedastheobjectivefunction.Table3showstheresultsofaGRG2basedoptimizationforathree‐legfreeway‐to‐freewayinterchangelocatednearBellevue,Wisconsin.ATRsitesidentifiedbygreenshadingweretreatedasunchangeableanchors.Greytextidentifiesvaluesthatappearinthecalculationsasecond(orthird)timebecausetheyinvolvetwo(ormore)legsoftheinterchange.Thisproblemcannotbesolvedusingthepro‐ratamethod,butanoptimization‐basedsolutionisfeasible.Thetablereflectssomerealitiesofthis2006dataset:the“raw”I‐43North‐to‐SouthandSouth‐to‐Norththroughmovementsareestimatesbecausenorelevantfielddatawasavailable,buttheoptimizationrefinestheseestimatesaspartoftheprocessofestablishingamathematicallyconsistentvolumeset.AdditionalConsiderationsIfacorridorconsistsonlyofserviceinterchangesandordinaryfreewaysegments,eachtraveldirectioncanbebalancedseparately.Ifthestudyareaincludesfreeway‐to‐freewayinterchanges,theentireareamustbebalancedsimultaneously.(Specialcaremustbetakenwhencodingfreeway‐
TRB 2014 Annual Meeting Paper revised from original submittal.

Shaw & Noyce TRB 93rd Annual Meeting Paper 14‐3565 8
to‐freewaymovementstoassurethattheadjustedvolumesareconsistentforallroutesinvolvingthatmovement.)Theprocedureistolerantofalimitedamountofmissingorsurrogatecountdata.Forexample,mostWisconsinfreewayshavecountsonrampsandbasicfreewaysegments,butnotontheshortsegmentsbetweenrampsataninterchange,andthissituationiseasilyaccommodatedasintheTable1example.Theprocessisalsoreasonablytolerantoftheuseofolddataasasurrogatewhensomeofthenewerdataisunavailable(forexample,combiningcurrentmainlinecountswithacombinationofoldandnewrampcounts).Nevertheless,therearesomeinstanceswherebalancingisthwartedbyincompletedata.Forexample,ifanexitsplitsintotwodownstreamrampsandonlyoneofthemhasbeencounted,themissingramp'svolumemustbecollectedinordertodeterminethetotalvolume(withoutthisdatathebalancingprocesscanproducemisleadingresultsorfailentirely).
Figure2.MapofI‐43&WIS172Interchange,Bellevue,Wisconsin
TRB 2014 Annual Meeting Paper revised from original submittal.
Shaw & Noyce TRB 93rd Annual Meeting Paper 14‐3565 9
TABLE3.Balancingexampleforthree‐legfreeway‐to‐freewayinterchange(seeFigure2formap).BELLEVUE INTERCHANGE Southbound Thru Raw Balanced Change % Chng GD
I-43 SB Btwn Manitowoc Rd & Bellevue System Interchange [Anchor] 21945 21945 0 0.0% 0.0System Exit Ramp I-43 SB to STH 172 WB 18000 18245 245 1.4% 0.6I-43 North-South Thru Movement 3700 3700 0 0.0% 0.0System Ramp STH 172 EB to I-43 SB 9526 9247 -279 -2.9% 0.9I-43 SB Btwn Bellevue IC and Elm View Rd (CTH MM) [Anchor] 12948 12948 0 0.0% 0.0Calculated Volume 13471 12948 1.5Imbalance 524 0
Southbound Turning Westbound Raw Balanced Change % Chng GD
I-43 SB Btwn Manitowoc Rd & Bellevue System Interchange [Anchor] 21945 21945 0 0.0% 0.0I-43 North-South Thru Movement 3700 3700 0 0.0% 0.0System Exit Ramp I-43 SB to STH 172 WB 18000 18245 245 1.4% 0.6System Ramp from I-43 NB to STH 172 WB (Bellevue IC) 10077 9462 -615 -6.1% 2.0STH 172 WB Btwn Bellevue IC and Monroe Rd 22500 27707 5207 23.1% 10.4Monroe Rd (CTH GV) Exit Ramp 5300 5300 0 0.0% 0.0Between Ramps at Monroe Rd Interchange 22407 Monroe Rd (CTH GV) Entrance Ramp 4550 4550 0 0.0% 0.0STH 172 WB Bridge over East River [Anchor] 26957 26957 0 0.0% 0.0Calculated Volume 27572 26957 12.9Imbalance 615 0
Eastbound Turning Northbound Raw Balanced Change % Chng GD
STH 172 EB Bridge over East River [Anchor] 26957 26957 0 0.0% 0.0Monroe Rd (CTH GV) Exit Ramp 4550 4995 445 9.8% 2.0Between Ramps at Monroe Rd Interchange 21962 Monroe Rd (CTH GV) Entrance Ramp 5500 4988 -512 -9.3% 2.2STH 172 EB Btwn Monroe Rd and Bellevue Interchange 22500 26950 4450 19.8% 8.9System Ramp STH 172 EB to I-43 SB 9526 9247 -279 -2.9% 0.9System Ramp from STH 172 EB to I-43 NB (Bellevue IC) 18600 17702 -898 -4.8% 2.1I-43 South-North Thru Movement 3700 3486 -214 -5.8% 1.1I-43 NB Btwn Bellevue Interchange & Manitowoc Rd [Anchor] 21188 21188 0 0.0% 0.0Calculated Volume 22081 21188 17.4Imbalance 893 0
Northbound Thru Raw Balanced Change % Chng GD
I-43 NB Btwn Elm View Rd (CTH MM) and Bellevue IC [Anchor] 12948 12948 0 0.0% 0.0System Ramp from I-43 NB to STH 172 WB (Bellevue IC) 10077 9462 -615 -6.1% 2.0I-43 South-North Thru Movement 3700 3486 -214 -5.8% 1.1System Ramp from STH 172 EB to I-43 NB (Bellevue IC) 18600 17702 -898 -4.8% 2.1I-43 NB Btwn Bellevue Interchange & Manitowoc Rd [Anchor] 21188 21188 0 0.0% 0.0Calculated Volume 21471 21188 5.2Imbalance 283 0
Northbound Turning Westbound Raw Balanced Change % Chng GD
I-43 NB Btwn Elm View Rd (CTH MM) and Bellevue IC [Anchor] 12948 12948 0 0 0I-43 South-North Thru Movement 3700 3486 -214 -5.8% 1.1System Ramp from I-43 NB to STH 172 WB (Bellevue IC) 10077 9462 -615 -6.1% 2.0System Exit Ramp I-43 SB to STH 172 WB 18000 18245 245 1.4% 0.6STH 172 WB Btwn Bellevue IC and Monroe Rd 22500 27707 5207 23.1% 10.4Monroe Rd (CTH GV) Exit Ramp 5300 5300 0 0.0% 0.0Between Ramps at Monroe Rd Interchange 22407 Monroe Rd (CTH GV) Entrance Ramp 4550 4550 0 0.0% 0.0STH 172 WB Bridge over East River [Anchor] 26957 26957 0 0 0Calculated Volume 26498 26957 14.1Imbalance -460 0
Eastbound Turning Southbound Raw Balanced Change % Chng GD
STH 172 EB Bridge over East River [Anchor] 26957 26957 0 0.0% 0.0Monroe Rd (CTH GV) Exit Ramp 4550 4995 445 9.8% 2.0Between Ramps at Monroe Rd Interchange 21962 Monroe Rd (CTH GV) Entrance Ramp 5500 4988 -512 -9.3% 2.2STH 172 EB Btwn Monroe Rd and Bellevue Interchange 22500 26950 4450 19.8% 8.9System Ramp from STH 172 EB to I-43 NB (Bellevue IC) 18600 17702 -898 -4.8% 2.1System Ramp STH 172 EB to I-43 SB 9526 9247 -279 -2.9% 0.9I-43 North-South Thru Movement 3700 3700 0 0.0% 0.0I-43 SB Btwn Bellevue IC and Elm View Rd (CTH MM) [Anchor] 12948 12948 0 0.0% 0.0Calculated Volume 13007 12948 16.2Imbalance 60 0
Grand Total 80.2
TRB 2014 Annual Meeting Paper revised from original submittal.
Shaw & Noyce TRB 93rd Annual Meeting Paper 14‐3565 10
VALIDATIONWhilevalidationofthismethodologyisdifficultbecausethe“true”trafficvolumesforanunbalanceddatasetareinherentlyunknown,weconductedsomesensitivitytestingtoexplorethestabilityoftheoptimization.ExpectedLevelsofInputDataVariationIn2011McGowen&Sanderson(14)comparedvolumeresultsfrompneumatictubetrafficcounterswithmanualcountsandoutputfromportablemagenetometers;theyreportedthatfordailytrafficvolumes,“thetotalerroroftheroadtubecountswaslessthan4percent.”OlderBritishresearchsummarizedinDMRB(15)providesasimilarassessment,“thecurrentbest‘working’estimateoftheaccuracyofmeasurementinthenumberofvehiclesthatpassedanautomatictrafficcounteristhatthe95%confidenceintervalofacountoflongerthan12hoursdurationisontheorderof±5%ofthetotalcount.Thisassumesthatthecounterwasinstalledandmaintainedtothestandardslaiddowninthe‘ManualofAutomaticTrafficCountingPractice.’”SensitivityTestResultsUsingtheGRG2solverandtreatingthebalancedBellevuedatafromTable3asthe“groundtruth”,weincreasedanddecreasedtheinputobservedvalueforoneofthefreeway‐to‐freewayramps(STH172EBtoI‐43SB)by‐5%and+5%;inbothcasestheoptimizationrestoredthevolumestotheirpreviousvalues.Wealsoappliedsimulatedrandomfluctuationsintherangeof‐5%to+5%tonineinputvolumesintheBellevuedataset.Amongst10simulationruns,theGDbetweentheoriginalvaluesandthere‐optimized“withfluctuation”valuesrangedfrom0.0to2.2(average0.6);theRMSEbetweentheoriginalandre‐optimizedvalueswas3%.Therefore,theoptimizationprocessappearstobereasonablyconsistentandstable,atleastiftheinputdatasetisfreeofsevereoutliers.CONCLUSIONSAutomatedtrafficvolumecountbalancingusingmathematicaloptimizationcanbeappliedsuccessfullytoresolvedatadiscrepanciesinaccess‐controlledcorridorsandnetworks.GEHvaluesaregenerallylowerthantheresultsofthe“standard”pro‐rataprocedurerecommendedinthe2001TrafficMonitoringGuide,indicatingbetterfittotheoriginaldataset.Ingeneralthereisnouniquesolutiontotheoptimizationproblem,sotheresultswilldifferdependingontheoptimizationalgorithmsandobjectivefunctionthatareselected.WefoundthatcombiningaGEHbasedobjectivewithaGRG2searchproducedstableresults.AshortcomingofGRG2isthatitissensitivetothetrialsolutionandsometimesselectsalocaloptimumratherthantheglobaloptimum.AdditionalresearchisnecessarytodeterminewhetheraGEH‐basedobjectivefunctionandaGRG2searchisthe“best”combinationforallnetworks.Furtherworkisnecessarytoquantifytheeffectsofsevereoutliersontheoptimizationresults.ACKNOWLEDGEMENTSTheauthorswishtoacknowledgetheongoingsupportandassistanceoftheWisconsinDepartmentofTransportationandcolleaguesattheUniversityofWisconsinTrafficOperations&SafetyLaboratory.SpecialthankstoProf.AlanHorowitzoftheUniversityofWisconsin‐MilwaukeeandtothedevelopersoftheoriginalBALTtool,Mr.ErtanOrnek,andDr.DoNam.
TRB 2014 Annual Meeting Paper revised from original submittal.
Shaw & Noyce TRB 93rd Annual Meeting Paper 14‐3565 11
REFERENCES 1 Hauer,E.,E.Pagitsas,andB.T.Shin(1981).EstimationofTurningFlowsfromAutomatic
Counts,TransportationResearchRecord795.TransportationResearchBoard,Washington,DC.2 Lin,P&Rasp,J(1983).“AShort‐CountMethodfortheEstimationofTrafficTuringMovements”,
FloridaStateUniversityDepartmentofStatistics,FSUStatisticsReportM673,Tallahassee,FL.3 FloridaDOT(2012),“ProjectTrafficForecastingHandbook”,Chapter6,pp.6‐98.Florida
DepartmentofTransportation,Tallahassee,FL.4 Ren,J.&Rahman,A,(2009),“AutomaticallyBalancingIntersectionVolumesinaHighway
Network.”12thTRBTransportationPlanningApplicationsConference,TransportationResearchBoard,Washington,DC.
5 Xin,W.,Hourdos,J.,andMichalpopoulos,P.(2006).“StreamliningtheTrafficModelingProcess
forImplementaionintheTwinCitiesFreewayNetwork–PhaseIIFinalReport”.MinnesotaDepartmentofTransportation,StPaulMN.
6 Liao,C.andDavis,G.(2006).“BusSignalPriorityBasedonGPSandWirelessCommunications
PhaseI‐SimulationStudy”.UniversityofMinnesotaCenterforTransportationStudies,Minneapolis,MN.
7 FederalHighwayAdministration(2001),“TrafficMonitoringGuide,”Section3,pp3‐42to3‐49.
Washington,DC.
8 Zhao,M.,Garrick,N.,Achenie,L.,andPaladagu,S.,(1997).“DataReconciliationBasedTrafficCountAnalysisSystem”.UniversityofConnecticutTransportationInstitute,Storrs,CT.
9 Kwon,J.,Petty,K.,Shieh,E.,Kopelias,P.,Papandreou,K.(2007).“AnAutomaticMethodfor
ImputingandBalancingLinkTrafficCounts”TRB87thAnnualMeetingCompendiumofPapersCD,TransportationResearchBoardoftheNationalAcademies,Washington,DC,2008.
10 VanVliet,D(2013).“SaturnSoftwareUser’sManual(v11.2),”Chapter15,pp15‐13.Epsom,Surrey,UK.
11 HighwaysAgency(1996),“DesignManualforRoads&Bridges,”Volume12,Section2,Chapter
4.4.42,pp4/28“TrafficAppraisalofRoadsSchemes:TrafficAppraisalAdvice:ValidationAcceptabilityGuidelines.”BritishCrowncopyright.
12 TransportforLondon(2010),“TrafficModellingGuidelinesVersion3.0”AppendixIII,pp179.
London,UK.13MicrosoftCorporationsoftwaresupportwebsite,“SolverUsesGeneralizedReducedGradient
Algorithm.”http://support.microsoft.com/kb/82890accessed2013‐07‐13.
14McGowen,P&Sanderson,M.(2011).“AccuracyofPneumaticRoadTubeCounters”,InstituteofTransportationEngineersWesternDistrictAnnualMeeting,InstituteofTransportationEngineers,Washington,DC.
TRB 2014 Annual Meeting Paper revised from original submittal.

Shaw & Noyce TRB 93rd Annual Meeting Paper 14‐3565 12
15 HighwaysAgency(1991),DesignManualforRoads&Bridges,Volume12,Section1,Chapter
10.3,pp10‐7“TrafficAppraisalManual:EstimatingtheAccuracyofGroundCounts.”BritishCrowncopyright.
TRB 2014 Annual Meeting Paper revised from original submittal.