automatic analysis of the difference image for unsupervised change detection
TRANSCRIPT

IEEE TRANSACTIONS ON GEOSCIENCE AND REMOTE SENSING, VOL. 38, NO. 3, MAY 2000 1171
Automatic Analysis of the Difference Image forUnsupervised Change Detection
Lorenzo Bruzzone, Member, IEEE,and Diego Fernàndez Prieto, Student Member, IEEE,
Abstract—One of the main problems related to unsupervisedchange detection methods based on the “difference image” lies inthe lack of efficient automatic techniques for discriminating be-tween changed and unchanged pixels in the difference image. Suchdiscrimination is usually performed by using empirical strategiesor manual trial-and-error procedures, which affect both the accu-racy and the reliability of the change-detection process. To over-come such drawbacks, in this paper, we propose two automatictechniques (based on the Bayes theory) for the analysis of the dif-ference image. One allows an automatic selection of the decisionthreshold that minimizes the overall change detection error prob-ability under the assumption that pixels in the difference imageare independent of one another. The other analyzes the differenceimage by considering the spatial-contextual information includedin the neighborhood of each pixel. In particular, an approach basedon Markov Random Fields (MRF’s) that exploits interpixel classdependency contexts is presented. Both proposed techniques re-quire the knowledge of the statistical distributions of the changedand unchanged pixels in the difference image. To perform an unsu-pervised estimation of the statistical terms that characterize thesedistributions, we propose an iterative method based on the Expec-tation-Maximization (EM) algorithm. Experimental results con-firm the effectiveness of both proposed techniques.
Index Terms—Change detection, change vector analysis, differ-ence image, multitemporal images, remote sensing.
I. INTRODUCTION
I N THE past few years, there has been a growing interest inthe development of automatic change-detection techniques
for the analysis of multitemporal remote sensing images [1]–[6].This interest stems from the wide range of applications in whichchange detection methods can be used, like environmental mon-itoring [7], agricultural surveys [5], urban studies [1], forestmonitoring [2], [8], [9], etc.
Usually, change detection involves the analysis of two regis-tered multispectral remote sensing images acquired in the samegeographical area at two different times. Such an analysis aimsat identifying land cover changes that have occurred in the studyarea between the two times considered. In the remote sensing lit-erature, two main approaches to the change-detection problemhave been proposed: the supervised approach and the unsuper-vised approach [5], [10]. The former is based on supervised clas-sification methods, which require the availability of a multitem-poral ground truth in order to derive a suitable training set for the
Manuscript received January 26, 1999; revised October 25, 1999. This workwas supported by the Italian Space Agency (ASI), Ispra, Italy.
L. Bruzzone is with the University of Trento, Trento, Italy (e-mail:[email protected]).
D. F. Prieto is with the Department of Biophysical and Electronic Engi-neering, University of Genoa, Genoa, Italy.
Publisher Item Identifier S 0196-2892(00)04130-9.
learning process of the classifiers. The latter performs changedetection by making a direct comparison of the two multispec-tral images considered, without relying on any additional infor-mation. Although the supervised approach exhibits some advan-tages over the unsupervised one (e.g., capability to explicitlyrecognize the kinds of land cover transitions that have occurred,robustness to the different atmospheric and light conditions atthe two acquisition times, ability to process multisensor/multi-source images [5]), the generation of an appropriate multitem-poral ground truth is usually a difficult and expensive task. Con-sequently, the use of effective unsupervised change-detectionmethods is fundamental in many applications in which a groundtruth is not available.
In this paper, we focus on one of the most widely used typesof unsupervised change-detection techniques, which are basedon the so-called “difference image” [10], [11]. These techniquesprocess the two multispectral images acquired at two differentdates (or vegetation indexes [10], principal components [10],etc., derived from such images) in order to generate a furtherimage. The computed difference image is such that the valuesof the pixels associated with land cover changes present valuessignificantly different from those of the pixels associated withunchanged areas. Changes are then identified by analyzing (e.g.,thresholding) the difference image. For example, the univariateimage differencing technique [10], [11] generates the differenceimage by subtracting, pixel by pixel, a single spectral band of thetwo multispectral images under analysis. The choice of the spec-tral band depends on the specific type of change to be detected.An analogous concept is applied by the widely used changevector analysis (CVA) technique. In this case, several spectralchannels are used at each time. For each pair of correspondingpixels, a “spectral change vector” is computed as the differencebetween the feature vectors at the two times. Then, the pixelvalues in the difference image are associated with the modulesof the spectral change vectors. It follows that unchanged pixelspresent small gray-level values, whereas changed pixels presentrather large values. Other techniques, like image ratioing, pro-duce the difference image by computing the ratio, instead of thedifference, between multitemporal images [10].
In spite of their relative simplicity and widespread use, theaforementioned change-detection methods exhibit a majordrawback: a lack of automatic and nonheuristic techniquesfor the analysis of the difference image. In fact, in classicaltechniques, such an analysis is performed by thresholdingthe difference image according to empirical strategies [12] ormanual trial-and-error procedures, which significantly affectthe reliability and accuracy of the final change-detection map.In particular, the most widely used approach to the selection of
0196–2892/00$10.00 © 2000 IEEE

1172 IEEE TRANSACTIONS ON GEOSCIENCE AND REMOTE SENSING, VOL. 38, NO. 3, MAY 2000
the decision threshold is based on the assumption (reasonablebut not always verified) that only a few changes occurred inthe study area between the two dates considered. Under thishypothesis, the density function of the pixel values in thedifference image can be confused with the density functionof the unchanged pixels. According to this assumption, pixelshaving gray-level values significantly different from the meanof the density function of the difference image are labeled aschanged. In particular, the decision threshold is fixed atfrom the mean value of the difference image, being thestandard deviation of the density function of the pixel valuesin the difference image and being a real number derived bya trial-and-error procedure. In this context, the selection ofthe parameter strongly depends on the end-user’s subjectivecriteria, which may lead to unreliable change-detection results.In addition, such a selection usually requires several trials andhence, a nonnegligible computation time [13], [14].
In this paper, we define the problem of the analysis of thedifference image for unsupervised change detection in terms ofthe Bayes decision theory. The application of this theory re-quires the estimations of thea priori probabilities and of theconditional density functions for the classes associated with theunchanged and changed pixels in the difference image. To thisend, we present an approach (based on the Expectation-Maxi-mization algorithm [15]–[17]) that allows such estimations to beperformed in an unsupervised way. Within this framework, twoautomatic techniques for the analysis of the difference image arepresented that overcome the main problems inherent in classicaltechniques. One assumes that the gray-level values of the pixelsin the difference image are independent of one another. Underthis assumption, the Bayes rule for minimum error is applied inorder to select, in an automatic way, the decision threshold thatminimizes the overall error probability in the change-detectionprocess. The other technique considers the spatial-contextual in-formation contained in the difference image in order to increasethe accuracy of the final change-detection map. In particular, anapproach based on Markov Random Fields (MRF’s) is proposedthat exploits the interpixel class dependence to model the priorprobabilities of classes.
In order to assess the effectiveness of both proposed tech-niques, we carried out experiments on two different data sets.One was a real multitemporal data set composed of two multi-spectral images acquired by the Thematic Mapper sensor of theLandsat 5 satellite. The other was a synthetic data set generatedto evaluate the robustness of the proposed techniques againstdifferent levels of noise.
This paper is organized into eight sections. The next sectionintroduces the formulation of the unsupervised change-detec-tion problem in terms of the Bayes theory. In particular, an au-tomatic method for the unsupervised estimation of the statis-tical terms required by the Bayesian approach is presented. Sec-tion III addresses the automatic selection of the minimum errorthreshold, under the assumption that pixels in the differenceimage are independent of one another. Section IV deals with thecontext-based approach to the analysis of the difference image.The data sets used in the experiments are detailed in Section V,together with the experiments carried out. The results obtainedin the real and synthetic data sets are reported in Sections VI
and VII, respectively. Finally, conclusions are drawn in SectionVIII.
II. A PPROACH TO THEUNSUPERVISEDESTIMATION OF
STATISTICAL TERMS ASSOCIATED WITHCLASSES IN THE
DIFFERENCEIMAGE
Let us consider two multispectral images, andof size acquired in the same geographical area attwo different times, and . Let us assume that such im-ages have been coregistered [18], [19] and that the possibledifferences in the light and atmospheric conditions at thetwo times have been corrected [20]. Let be a randomvariable in the range , and let it repre-sent the values of the pixels in the difference image
obtained by applyingthe CVA technique to and . For the sake of simplicity,the two proposed techniques will be presented in the context ofthe CVA method. However, a generalization to other methodsbased on the difference image is straightforward.
A. Basic Rationale
Unlike classical unsupervised methods used in remotesensing applications, our approach involves formulating theproblem of the analysis of the difference image for changedetection in terms of the Bayesian decision theory. Within thisframework, we aim at discriminating between two oppositeclasses, and , associated with unchanged and changedpixels, respectively. In order to analyze the difference imageon the basis of the Bayes theory, the main problems to besolved are the estimations of both the probability densityfunctions and and thea priori probabilities
and of the classes and , respectively [21].Generally, these terms are estimated by using supervised ap-proaches that require the availability of a multitemporal groundtruth. However, as we deal with an unsupervised approach,the estimation process cannot be performed on the basis of atraining set.
In this paper, we propose an unsupervised method for esti-mating the aforesaid statistical terms. In particular, the methodassumes that the probability density function computedon the pixel values in the difference image can be modeledas a mixture density distribution consisting of two density com-ponents associated with the classesand , respectively, i.e.,
(1)
Under this assumption, the unsupervised estimations of, , , and can be performed by
using the EM algorithm.
B. Estimations of , , , and bythe EM Algorithm
The EM algorithm is a general approach to maximum-likeli-hood (ML) estimation for incomplete data problems [15]–[17],[22]. It consists of an expectation step and a maximization step,which are iterated until convergence. The expectation step iscomputed with respect to the unknown underlying variables,using the current estimates of the parameters, and is conditioned

BRUZZONE AND PRIETO: AUTOMATIC ANALYSIS OF DIFFERENCE IMAGE 1173
by observations. The maximization step provides new estimatesof the parameters.
We propose using the EM algorithm to estimate the values ofthe a priori probabilities and and the values ofthe parameters that characterize the density functionsand . Let us assume that both andcan be modeled by Gaussian distributions (this is a reasonableassumption for many applications involving images acquired bypassive sensors). In this context, the density function associatedwith the class can be described by the meanand the vari-ance . Analogously, the density function associated with theclass can be described by the meanand the variance . Itis possible to prove that the equations for estimating the afore-mentioned statistical terms for the class are the following[17]:
(2)
(3)
(4)
where the superscriptsand denote the values of the param-eters at the current and next iterations, respectively. Analogousequations are used to estimate the prior probability and the meanand variance values of the conditional density function associ-ated with the class .
The estimates are obtained by starting from initial valuesof the considered statistical terms and by iterating the aboveequations until convergence. It is possible to prove that, ateach iteration, the estimated parameters provide an increasein the log-likelihood function , where
. At convergence, a localmaximum of the log-likelihood function is reached [15], [16].
The initial values of the estimates can be determined by ex-ploiting the intrinsic characteristics of the difference image ob-tained with the CVA technique. In particular, a subset ofpixels likely to belong to and a subset of pixels likelyto belong to can be obtained by applying two thresholds,and , to the right and left extremes of the histogram ofthe difference image (see Fig. 1). We expressand as
and , where is the middlevalue of (i.e., ), and
is the initialization parameter that defines the rangearound in which pixels cannot be easily identified as eitherchanged or unchanged. Then the sets
and are used to computethe initial estimates of the statistical parameters associated withthe classes and , respectively.
Fig. 1. Schematic representation of the thresholding strategy applied to thedifference-image histogramh(X) for the initialization of the EM algorithm.
The previously described formulation of the EM algorithmallows one to estimate the statistical parameters associated withboth classes and under the assumption of Gaussian dis-tributions. However, it is worth noting that more general ap-proaches to estimating the mixture component parameters mightbe adopted. In particular, we recall the semiparametric and non-parametric approaches presented in [22] and the generalizedmixture estimation technique proposed in [23].
The estimates obtained by the EM algorithm at convergencecan be exploited to analyze the difference image with the tech-niques described in the next two sections.
III. A NALYSIS OF THE DIFFERENCEIMAGE UNDER THE
ASSUMPTION OFINDEPENDENTPIXEL VALUES
In this section, an automatic technique aimed at selecting thedecision threshold that minimizes the error probability in thechange-detection process is presented. This technique was de-veloped under the assumption that pixel values are independentof one another.
Under the hypothesis of interpixel independence and ac-cording to the Bayes rule for minimum error, each pixelin the difference image should be assigned to the classthat maximizes the posterior conditional probability, i.e.,
(5)
Applying this criterion to solve the change-detection problemis equivalent to thresholding the difference image at the MLboundary between the classes and . Therefore, on thebasis of the estimates of the statistical terms obtained by the EMalgorithm, the optimum threshold value can be estimated bysolving the following equation with respect to the variable:
(6)
which, in the Gaussian case, is equivalent to solving the fol-lowing quadratic equation:
(7)

1174 IEEE TRANSACTIONS ON GEOSCIENCE AND REMOTE SENSING, VOL. 38, NO. 3, MAY 2000
It is worth noting that the accuracy of the threshold valuewas obtained and therefore, the precision of the final change-de-tection map depends on the accuracies of the estimates providedby the EM algorithm.
IV. A NALYSIS OF THE DIFFERENCEIMAGE BY CONSIDERING
SPATIAL-CONTEXTUAL INFORMATION
In this section, we describe an automatic technique that, un-like the most widely used approaches to change detection, ex-plicitly considers spatial-contextual information for the analysisof the difference image. Such a technique is based on the as-sumption that the changes to be identified are large enough tobe detected by the sensor used. Under this hypothesis, a pixelbelonging to the class is likely to be surrounded by pixelsbelonging to the same class. Therefore, an efficient use of thisinterpixel class dependence may yield more reliable and accu-rate change-detection results.
Let the set with be composedof all the possible sets of labels in the difference image,where with
is a generic set of labels in . By taking into accountthe spatial-contextual information, the Bayes rule for minimumerror, as defined in (5), can be rewritten as the selection of a set
that maximizes the following rule:
arg max
arg max (8)
where is the prior model for the class labels, andis the joint density function of the pixel values
in the difference image given the set of labels. The max-imization of (8) requires the estimations of both and
, which are very complex tasks. A simplification ofthe problem can be achieved if we model the spatial-contextualinformation in a local spatial neighborhood. This is rathera reasonable approach if we consider the interpixel classdependence as the interactions between pixel classes decreaserapidly as the distances between pixels increase. In this context,we propose the use of an MRF approach to model the spatialcontext in the prior model for the class labels . Infact, MRF’s provide a methodological framework that allowsthe interpixel class dependence to be fully exploited. As afurther simplification of the problem, we assume the followingconditional independence:
(9)
A. Description of the Considered MRF Model
In order to formulate the problem by using MRF’s, it is neces-sary to introduce the concept of a spatial neighborhood systemdefining set . Let us define the neighbor system of the pixelwith coordinates as , .Although it is possible to use various spatial neighborhood sys-tems, in this paper, we consider a second-order spatial neighbor-hood system (see Fig. 2). Therefore, in our case, ,
, , and .
Fig. 2. Second-order neighborhood system defining set used by the consideredMRF approach.
The Markov modeling of the conditional distribution of thepixel label given the pixel labels elsewhere, is expressedas [24]–[26]
(10)
where is the Gibbs energy function, and is a normal-izing factor. , is givenby [24]–[26]
(11)
where is the Kronecker delta function, which can be ex-pressed as
ifif
(12)
and is a constant that tunes the influence of the spatial-con-textual information on the change-detection process. It is worthnoting that (11) can be regarded as a simplification of the moregeneral clique potential notation adopted by many authors[27]–[29]. For more detailed descriptions of MRF’s and of thespecific model adopted in this paper, we refer the reader to[24]–[29].
B. Generation of the Change-Detection Map
According to (8), the generation of the final change-detec-tion map involves the labeling of all the pixels in the differenceimage so that, under the aforementioned assumptions, the pos-terior probability is maximized. In terms of the Markovian ap-proach, this is equivalent to the minimization of the followingenergy function [24]–[26]:
(13)
On the one hand, the energy term describes the inter-pixel class dependence, which is determined according to (11).On the other hand, the term represents the statistics

BRUZZONE AND PRIETO: AUTOMATIC ANALYSIS OF DIFFERENCE IMAGE 1175
of the gray levels in the difference image under the assumptionof conditional independence, as defined in (9). In the Gaussiancase, the energy term can be written as
(14)
where and are theestimates obtained by the EM algorithm under the assumptionof independence.
Generally, the minimization of (13) is carried out by usingan iterative algorithm (e.g., the simulated annealing algorithm[27]). In this paper, we suggest using a simple and fast approachbased on Besag’s iterated conditional modes (ICM) algorithm,which has been proved to converge to a local minimum of theenergy function [30]. According to this strategy, thethat min-imizes (13) is obtained by the following algorithm.
1) For all pixels , initialize with theclass that minimizes the noncontextual energy function
.2) For all pixels , update to the class
that minimizes (13).3) Repeat step 2 until convergence is reached.
V. DESCRIPTIONS OFDATA SETS AND EXPERIMENTS
In order to assess the effectiveness of the proposed techniquesfor the analysis of the difference image, we considered two dif-ferent data sets: a real multitemporal data set corresponding tothe geographical area of the Island of Elba, Italy, and a syn-thetic data set artificially generated to evaluate the robustnessof the proposed techniques to noise. In the following, both thedata sets and the carried out experiments are detailed.
A. Data Set Related to the Island of Elba
The first of the two data sets used in the experiments con-sisted of two multispectral images acquired by the Landsat-5Thematic Mapper (TM) sensor in the western part of the Islandof Elba in August 1994 and September 1994. The area selectedfor the experiments was a section (414326 pixels) of the twoscenes acquired by the TM sensor. As an example of the im-ages used, Fig. 3(a) and (b) show channel 4 of the August andSeptember images, respectively. As is readily apparent (see theupper left parts of the images), a wildfire destroyed a notableportion of the vegetation in the aforesaid area between the twodates considered. The available ground truth concerning the lo-cation of the wildfire was used to prepare a “reference map” [seeFig. 3(c)] useful to assess change-detection errors. Such a mapwas refined by a manual analysis of the remote sensing imagesconsidered.
The September image was registered to the August one. Theanalyses of the histograms of both images did not reveal anysignificant difference in the light conditions at the times of thetwo acquisitions. Therefore, no correction algorithms were ap-plied. The noise affecting the intensity values of the images wasreduced by applying a simple running mean filtering (33window size) to both images.
Fig. 3. Images of the Island of Elba, Italy, utilized in the experiments. (a) Band4 of the Landsat TM image acquired in August 1994, (b) band 4 of the LandsatTM image acquired in September 1994, and (c) ground-truth map of the changedarea used as a reference map in the experiments.
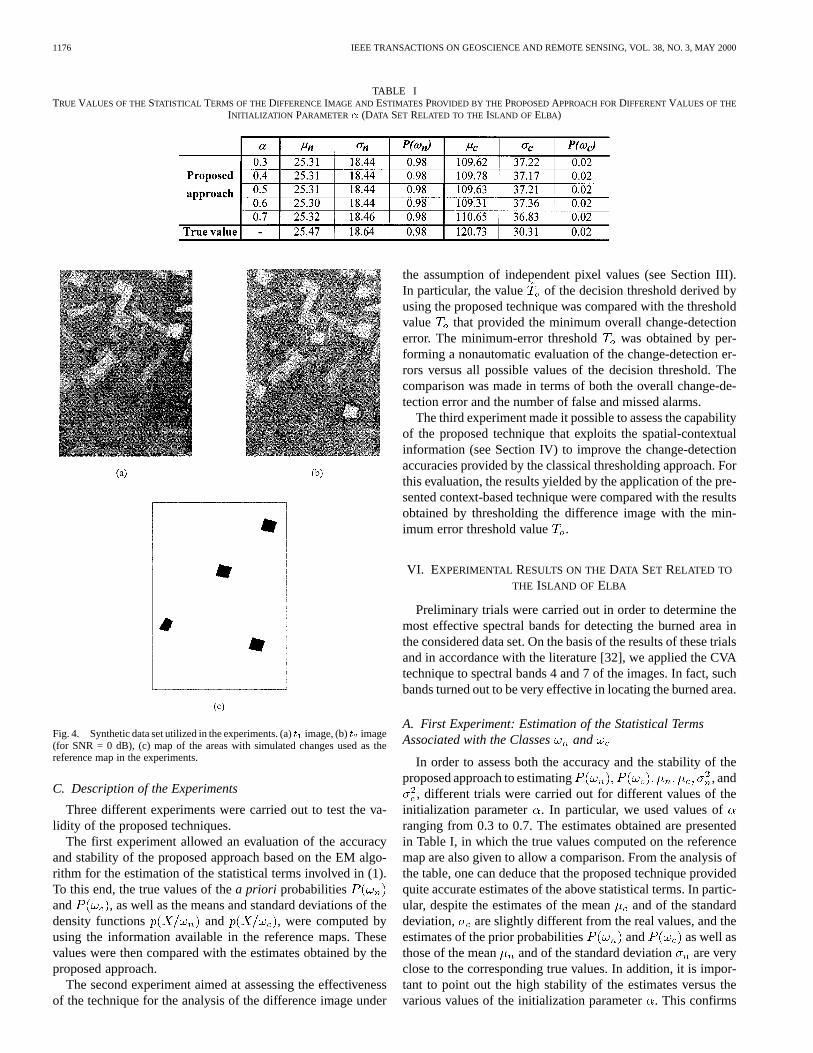
B. Synthetic Data Set
The second data set was artificially generated in order to con-trol the noise affecting the difference image. This allowed usto assess more accurately the robustness of the proposed tech-niques against different levels of noise. The data set was ob-tained by the procedure described in the following. An image ac-quired by the Daedalus 1268 Airborne Thematic Mapper (ATM)multispectral scanner [31] was used as the reference image. Inparticular, a section (250 350 pixels) of a scene acquired inan agricultural area near the village of Feltwell, U.K., was se-lected (for the sake of simplicity, only band 5 of the ATM wasconsidered). This image was assumed to be theimage of thedata set (i.e., the image acquired at time). The image wasartificially generated from the reference one. In particular, a firstversion of the image was obtained by inserting some changesin the image in order to simulate land cover variations. Thenthe histogram of the resulting image was slightly shifted to sim-ulate different light conditions in the two images. Finally, fiveversions of the image were generated by adding different re-alizations of zero-mean Gaussian noise to theimage (the fivevalues of the SNR used were 10, 5, 2, 1, and 0 dB). For sim-plicity, we assumed the spatial independence of the noise com-ponents in the images.
According to the previously described procedure, we ob-tained five pairs of images. Each pair was composed of theimage and one of the images (characterized by a specificvalue of the SNR). As an example, Fig. 4(a) and (b) show the
image and the image for an SNR 0 dB, respectively.The map of the areas with simulated changes is presented inFig. 4(c).
1176 IEEE TRANSACTIONS ON GEOSCIENCE AND REMOTE SENSING, VOL. 38, NO. 3, MAY 2000
TABLE ITRUE VALUES OF THESTATISTICAL TERMS OF THEDIFFERENCEIMAGE AND ESTIMATES PROVIDED BY THE PROPOSEDAPPROACH FORDIFFERENTVALUES OF THE
INITIALIZATION PARAMETER � (DATA SET RELATED TO THE ISLAND OF ELBA)
Fig. 4. Synthetic data set utilized in the experiments. (a)t image, (b)t image(for SNR = 0 dB), (c) map of the areas with simulated changes used as thereference map in the experiments.
C. Description of the Experiments
Three different experiments were carried out to test the va-lidity of the proposed techniques.
The first experiment allowed an evaluation of the accuracyand stability of the proposed approach based on the EM algo-rithm for the estimation of the statistical terms involved in (1).To this end, the true values of thea priori probabilitiesand , as well as the means and standard deviations of thedensity functions and , were computed byusing the information available in the reference maps. Thesevalues were then compared with the estimates obtained by theproposed approach.
The second experiment aimed at assessing the effectivenessof the technique for the analysis of the difference image under
the assumption of independent pixel values (see Section III).In particular, the value of the decision threshold derived byusing the proposed technique was compared with the thresholdvalue that provided the minimum overall change-detectionerror. The minimum-error threshold was obtained by per-forming a nonautomatic evaluation of the change-detection er-rors versus all possible values of the decision threshold. Thecomparison was made in terms of both the overall change-de-tection error and the number of false and missed alarms.
The third experiment made it possible to assess the capabilityof the proposed technique that exploits the spatial-contextualinformation (see Section IV) to improve the change-detectionaccuracies provided by the classical thresholding approach. Forthis evaluation, the results yielded by the application of the pre-sented context-based technique were compared with the resultsobtained by thresholding the difference image with the min-imum error threshold value .
VI. EXPERIMENTAL RESULTS ON THEDATA SET RELATED TO
THE ISLAND OF ELBA
Preliminary trials were carried out in order to determine themost effective spectral bands for detecting the burned area inthe considered data set. On the basis of the results of these trialsand in accordance with the literature [32], we applied the CVAtechnique to spectral bands 4 and 7 of the images. In fact, suchbands turned out to be very effective in locating the burned area.
A. First Experiment: Estimation of the Statistical TermsAssociated with the Classes and
In order to assess both the accuracy and the stability of theproposed approach to estimating , and
, different trials were carried out for different values of theinitialization parameter . In particular, we used values ofranging from 0.3 to 0.7. The estimates obtained are presentedin Table I, in which the true values computed on the referencemap are also given to allow a comparison. From the analysis ofthe table, one can deduce that the proposed technique providedquite accurate estimates of the above statistical terms. In partic-ular, despite the estimates of the meanand of the standarddeviation, are slightly different from the real values, and theestimates of the prior probabilities and as well asthose of the mean and of the standard deviation are veryclose to the corresponding true values. In addition, it is impor-tant to point out the high stability of the estimates versus thevarious values of the initialization parameter. This confirms

BRUZZONE AND PRIETO: AUTOMATIC ANALYSIS OF DIFFERENCE IMAGE 1177
Fig. 5. Histogram of the difference image corresponding to the data setrelated to the Island of Elba. For the sake of comparison, the estimates of thedistributions of both classes! and! obtained by the EM algorithm aresuperimposed(� = 0:7). The histogram was normalized in order to permit adirect comparison with the estimated distributions of the classes.
that the initialization phase is not critical for the proposed ap-proach.
Additional information about the accuracies of the estimatesobtained by the EM algorithm can be derived from the anal-ysis of Fig. 5, which shows both the histogram of the differenceimage and the density functions of the classesand for
(the histogram was normalized to allow a direct com-parison with the estimated density functions). As can be seen,the density functions of the classes derived by the EM algorithmresulted in a fairly reasonable approximation of the distributionof the difference image. This confirms the effectiveness of theproposed technique. It is worth noting that a more accurate es-timate of the density function of the class could be obtainedwith nonparametric or semiparametric mixture density estima-tion techniques [22], [23]. However, the levels of complexityinherent in these approaches do not seem to be justified in thepresent case.
A deeper insight into the behavior of the EM algorithm ismade possible by Fig. 6, which presents the trend of each esti-mate provided by the proposed technique (for ) versusthe number of algorithm iterations for the class. As can beseen, the estimates evolve from wrong initial values to accuratefinal ones in only six iterations (similar behaviors were shownby the estimates of the class .
B. Second Experiment: Analysis of the Difference ImageUnder the Assumption of Independent Pixel Values
In this experiment, the decision threshold estimated bythe technique described in Section III was compared with theminimum-error threshold derived by a manual trial-and-errorprocedure. Thanks to the stability of the EM algorithm, the esti-mates given in Table I for different values resulted in the samevalue (i.e., 82) of the decision threshold. This value was veryclose to the minimum-error threshold which, in this case, wasequal to 84. As a consequence, our technique involved an overallchange-detection error (i.e., 438 pixels) that was very close tothe minimum one (i.e., 424 pixels).
A better understanding of the results obtained can begained by the analysis of Fig. 7. In this figure, the trends ofthe overall error, false alarms, and missed alarms versus the
Fig. 6. Estimates of the statistical terms provided by the proposed approach(for � = 0:7) versus the number of iterations of the EM algorithm for the class! (data set related to the Island of Elba).
Fig. 7. Behaviors of the change-detection errors (overall error, missed alarms,and false alarms) versus the decision threshold for the data set related to theIsland of Elba. The minimum-error thresholdT was found for a gray-levelvalue equal to 84.
decision-threshold value are plotted. The optimum thresholdvalue corresponds to the point at which the curve of the overallerror reaches the minimum value. As one can see, the decisionthreshold derived with the proposed technique correspondsto a value on the overall-error curve that is very close to the
1178 IEEE TRANSACTIONS ON GEOSCIENCE AND REMOTE SENSING, VOL. 38, NO. 3, MAY 2000
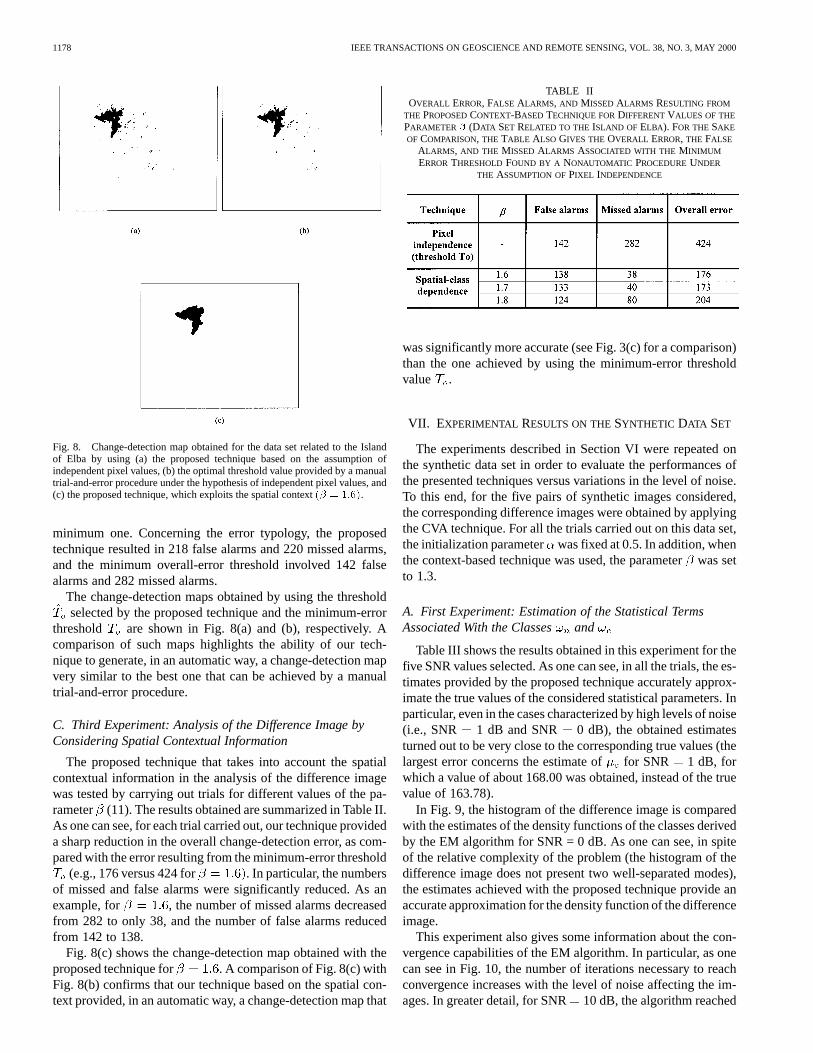
Fig. 8. Change-detection map obtained for the data set related to the Islandof Elba by using (a) the proposed technique based on the assumption ofindependent pixel values, (b) the optimal threshold value provided by a manualtrial-and-error procedure under the hypothesis of independent pixel values, and(c) the proposed technique, which exploits the spatial context(� = 1:6).
minimum one. Concerning the error typology, the proposedtechnique resulted in 218 false alarms and 220 missed alarms,and the minimum overall-error threshold involved 142 falsealarms and 282 missed alarms.
The change-detection maps obtained by using the thresholdselected by the proposed technique and the minimum-error
threshold are shown in Fig. 8(a) and (b), respectively. Acomparison of such maps highlights the ability of our tech-nique to generate, in an automatic way, a change-detection mapvery similar to the best one that can be achieved by a manualtrial-and-error procedure.
C. Third Experiment: Analysis of the Difference Image byConsidering Spatial Contextual Information
The proposed technique that takes into account the spatialcontextual information in the analysis of the difference imagewas tested by carrying out trials for different values of the pa-rameter (11). The results obtained are summarized in Table II.As one can see, for each trial carried out, our technique provideda sharp reduction in the overall change-detection error, as com-pared with the error resulting from the minimum-error threshold
(e.g., 176 versus 424 for . In particular, the numbersof missed and false alarms were significantly reduced. As anexample, for , the number of missed alarms decreasedfrom 282 to only 38, and the number of false alarms reducedfrom 142 to 138.
Fig. 8(c) shows the change-detection map obtained with theproposed technique for . A comparison of Fig. 8(c) withFig. 8(b) confirms that our technique based on the spatial con-text provided, in an automatic way, a change-detection map that
TABLE IIOVERALL ERROR, FALSE ALARMS, AND MISSEDALARMS RESULTING FROM
THE PROPOSEDCONTEXT-BASED TECHNIQUE FORDIFFERENTVALUES OF THE
PARAMETER � (DATA SET RELATED TO THE ISLAND OF ELBA). FOR THESAKE
OF COMPARISON, THE TABLE ALSO GIVES THE OVERALL ERROR, THE FALSE
ALARMS, AND THE MISSEDALARMS ASSOCIATED WITH THEMINIMUM
ERRORTHRESHOLDFOUND BY A NONAUTOMATIC PROCEDUREUNDER
THE ASSUMPTION OFPIXEL INDEPENDENCE
was significantly more accurate (see Fig. 3(c) for a comparison)than the one achieved by using the minimum-error thresholdvalue .
VII. EXPERIMENTAL RESULTS ON THESYNTHETIC DATA SET
The experiments described in Section VI were repeated onthe synthetic data set in order to evaluate the performances ofthe presented techniques versus variations in the level of noise.To this end, for the five pairs of synthetic images considered,the corresponding difference images were obtained by applyingthe CVA technique. For all the trials carried out on this data set,the initialization parameter was fixed at 0.5. In addition, whenthe context-based technique was used, the parameterwas setto 1.3.
A. First Experiment: Estimation of the Statistical TermsAssociated With the Classes and
Table III shows the results obtained in this experiment for thefive SNR values selected. As one can see, in all the trials, the es-timates provided by the proposed technique accurately approx-imate the true values of the considered statistical parameters. Inparticular, even in the cases characterized by high levels of noise(i.e., SNR 1 dB and SNR 0 dB), the obtained estimatesturned out to be very close to the corresponding true values (thelargest error concerns the estimate offor SNR 1 dB, forwhich a value of about 168.00 was obtained, instead of the truevalue of 163.78).
In Fig. 9, the histogram of the difference image is comparedwith the estimates of the density functions of the classes derivedby the EM algorithm for SNR = 0 dB. As one can see, in spiteof the relative complexity of the problem (the histogram of thedifference image does not present two well-separated modes),the estimates achieved with the proposed technique provide anaccurate approximation for the density function of the differenceimage.
This experiment also gives some information about the con-vergence capabilities of the EM algorithm. In particular, as onecan see in Fig. 10, the number of iterations necessary to reachconvergence increases with the level of noise affecting the im-ages. In greater detail, for SNR10 dB, the algorithm reached

BRUZZONE AND PRIETO: AUTOMATIC ANALYSIS OF DIFFERENCE IMAGE 1179
TABLE IIITRUE VALUES OF THESTATISTICAL TERMS OF THEDIFFERENCEIMAGES AND ESTIMATES PROVIDED BY THE PROPOSEDAPPROACH FORDIFFERENTSNR VALUES
(SYNTHETIC DATA SET): (a) CLASS! PARAMETERS AND (b) CLASS! PARAMETERS
Fig. 9. Histogram of the difference image corresponding to the synthetic dataset (SNR = 0 dB). For the sake of comparison, the estimates of the distributionsof both classes! and! obtained by the EM algorithm are superimposed.The histogram was normalized in order to permit a direct comparison with theestimated distributions of the classes.
convergence in only three iterations, whereas the number of it-erations increased up to 26 for SNR0 dB.
B. Second Experiment: Analysis of the Difference ImageUnder the Assumption of Independent Pixel Values
Thanks to the accuracy of the estimates provided by the pro-posed technique in the previous experiment, all the trials carriedout for the different SNR values considered resulted in a deci-sion threshold value very close to the corresponding min-imum-error threshold . In particular, the largest error was in-curred for SNR 0 dB, for which the estimated threshold wasequal to 144, whereas the minimum-error threshold was foundto be equal to 142. As a consequence, the overall change-detec-tion error involved in the proposed technique (i.e., 940 pixels)was comparable to the minimum one (i.e., 899 pixels). In greater
Fig. 10. Number of iterations of the EM algorithm to reach convergence versusthe SNR.
detail, the proposed technique (for SNR0 dB) resulted in 839and 101 missed and false alarms, respectively, whereas the min-imum overall error involved 733 missed alarms and 166 falsealarms.
Fig. 11(a) and (b) show the change-detection maps achievedby using the decision threshold (selected with the proposedtechnique) and the minimum-error threshold, respectively,for SNR 0 dB. A comparative analysis of these images pointsout that, as occurred for the data set related to the Island of Elba,the two maps are very similar also for this data set. This confirmsthe reliability of the proposed automatic technique.
C. Third Experiment: Analysis of the Difference Image byConsidering Spatial Contextual Information
The results obtained in this experiment (see Table IV) pointout the validity of the presented context-based technique. In par-ticular, also on this data set and in all the trials carried out, theoverall change-detection error was reduced, as compared with

1180 IEEE TRANSACTIONS ON GEOSCIENCE AND REMOTE SENSING, VOL. 38, NO. 3, MAY 2000
TABLE IVOVERALL ERROR, FALSE ALARMS, AND MISSEDALARMS RESULTING FROM THEPROPOSEDCONTEXT-BASED TECHNIQUE FORDIFFERENTSNR VALUES
(SYNTHETIC DATA SET). FOR THE SAKE OF COMPARISON, THE TABLE ALSO GIVES THE OVERALL ERROR, THE FALSE ALARMS, AND THE MISSEDALARMS
ASSOCIATED WITH THEMINIMUM -ERRORTHRESHOLDFOUND BY A NONAUTOMATIC PROCEDUREUNDER THEASSUMPTION OFPIXEL INDEPENDENCE
Fig. 11. Change-detection map obtained for the synthetic data set (SNR= 0 dB) by using (a) the proposed technique based on the assumption ofindependent pixel values, (b) the optimal threshold value provided by a manualtrial-and-error procedure under the hypothesis of independent pixel values, and(c) the proposed technique that exploits the spatial context.
the one incurred when using the corresponding minimum-errorthreshold under the pixel-independence assumption (the re-duction is sharper for an increasing level of noise). For example,for SNR = 0 dB, the overall error made with the context-basedtechnique was equal to 157 pixels, whereas the error made forthe minimum error threshold was found to be equal to 889pixels. In greater detail, the number of missed alarms decreasedfrom 733 to 152, and the number of false alarms was reducedfrom 166 to 5.
Fig. 11(c) shows the change-detection map resulting from theapplication of the proposed context-based technique in the caseof SNR = 0 dB. A comparative analysis of Fig. 11(b) and (c) andFig. 4(c) confirms the effectiveness of this technique, which pro-vides a change-detection map that is more accurate and signif-icantly less noisy than the one achieved for the minimum-errorthreshold .
VIII. C ONCLUSIONS
In this paper, two techniques for the analysis of the differ-ence image in unsupervised change-detection problems havebeen proposed. Such techniques, unlike classical ones, performan automatic analysis of the difference image by exploiting the-oretically well-founded methods.
From a methodological viewpoint, the main innovation of thispaper lies in the formulation of the unsupervised change-detec-tion problem in terms of the Bayesian decision theory. In partic-ular, we have proposed an iterative technique (based on the EMalgorithm) that allows unsupervised estimations of thea prioriprobabilities and density functions associated with changed andunchanged pixels in the difference image. Such estimates makeit possible to apply supervised methods in the context of un-supervised change detection. Within this framework, two auto-matic techniques for the analysis of the difference image havebeen presented.
The first technique is based on the assumption that the pixelsin the difference image are independent of one another. Underthis assumption, it allows the automatic selection of the deci-sion-threshold value that minimizes the overall change-detec-tion error probability. It is worth noting that, thanks to the avail-ability of the estimates provided by the EM algorithm, other de-cision strategies could also be adopted for the selection of thethreshold (e.g., the Bayes rule for minimum cost [33], [34]).
The second technique performs the analysis of the differ-ence image by using an MRF approach that exploits the inter-pixel class dependency context in order to improve the accuracyof the final change-detection map. For the sake of simplicity,a simple method for the MRF modeling has been used, eventhough more complex MRF models might be exploited (e.g.,hierarchical MRF’s [28] and detail-preserving MRF’s [35]). Inaddition, more sophisticated MRF approaches might be adoptedin order to further increase the accuracy and the degree of au-tomation (e.g., automatic selection of the parameter) of the

BRUZZONE AND PRIETO: AUTOMATIC ANALYSIS OF DIFFERENCE IMAGE 1181
presented technique [36], [37]. Further research should be con-ducted to test the potential improvements associated with suchapproaches.
The experimental results reported in this paper confirm theeffectiveness of both presented techniques. Such effectivenessdepends mainly on the accuracy and the stability provided bythe EM algorithm in estimating the statistical terms of the dif-ference image. Thanks to this accuracy, the decision-thresholdvalues provided by the proposed technique based on the pixel-independence assumption turned out to be very close to theoptimum ones for both considered data sets. This resulted inchange-detection maps comparable to those provided by thecorresponding minimum-error threshold. Further improve-ments in the change-detection accuracies were obtained by theproposed method, which exploits spatial-contextual informationin the change-detection process. This method proved very effec-tive even on images affected by high levels of noise.
As a final remark, it is worth noting that we have formulatedthe EM algorithm under the assumption that the conditional den-sity functions of classes can be modeled by Gaussian distribu-tions. In several change-detection applications involving the useof images acquired by passive sensors, this assumption seems tobe a reasonable approximation. However, when the number ofdifferent typologies of land cover changes to be identified in-creases or when active sensors are used instead of passive ones,the Gaussian model might turn out to be inappropriate. In thesecases, more general approaches to the mixture density estima-tion problem [22], [23], [38] may represent powerful tools inobtaining accurate estimates of the density functions associatedwith changed and unchanged pixels.
ACKNOWLEDGMENT
The authors are grateful to the anonymous referees for theirconstructive criticism.
REFERENCES
[1] K. R. Merril and L. Jiajun, “A comparison of four algorithms for changedetection in an urban environment,”Remote Sens. Environ., vol. 63, pp.95–100, 1998.
[2] T. Hame, I. Heiler, and J. San Miguel-Ayanz, “An unsupervised changedetection and recognition system for forestry,”Int. J. Remote Sensing,vol. 19, no. 6, pp. 1079–1099, 1998.
[3] R. D. Johnson and E. S. Kasischke, “Change vector analysis: A tech-nique for the multispectral monitoring of land cover condition,”Int. J.Remote Sensing, vol. 19, no. 3, pp. 411–426, 1998.
[4] X. Dai and S. Khorram, “The effects of image misregistration on theaccuracy of remotely sensed change detection,”IEEE Trans. Geosci.Remote Sensing, vol. 36, pp. 1566–1577, Sept. 1998.
[5] L. Bruzzone and S. B. Serpico, “An iterative technique for the detec-tion of land-cover transitions in multitemporal remote-sensing images,”IEEE Trans. Geosci. Remote Sensing, vol. 35, pp. 858–867, July 1997.
[6] L. Bruzzone and D. F. Prieto, “An adaptive parcel-based technique forunsupervised change detection,”Int. J. Remote Sensing, vol. 21, no. 4,pp. 817–822, 2000.
[7] P. S. Chavez, Jr. and D. J. MacKinnon, “Automatic detection ofvegetation changes in the southwestern united states using remotelysensed images,”Photogramm. Eng. Remote Sensing, vol. 60, no. 5, pp.1285–1294, 1994.
[8] M. E. Jakubauskas, K. P. Lulla, and P. W. Mausel, “Assessment of veg-etation change in a fire-altered landscape,”Photogramm. Eng. RemoteSensing, vol. 56, no. 3, pp. 371–377, 1990.
[9] S. Gopal and C. Woodcock, “Remote sensing of forest change usingartificial neural networks,”IEEE Trans. Geosci. Remote Sensing, vol.34, pp. 398–404, 1996.
[10] A. Singh, “Digital change detection techniques using remotely-senseddata,”Int. J. Remote Sensing, vol. 10, no. 6, pp. 989–1003, 1989.
[11] T. Fung, “An assessment of TM imagery for land-cover change detec-tion,” IEEE Trans. Geosci. Remote Sensing, vol. 28, no. 12, pp. 681–684,1990.
[12] T. Fung and E. LeDrew, “The determination of optimal threshold levelsfor change detection using various accuracy indices,”Photogramm. Eng.Remote Sensing, vol. 54, no. 10, pp. 1449–1454, 1988.
[13] M. L. Stauffer and R. L. McKinney, Landsat Image Differencing as anAutomated Land Cover Change Detection Technique, Computer Sci-ence Corp., Silver Springs, MD, 1978.
[14] A. Singh, “Tropical forest monitoring using digital Landsat data innortheastern India,” Ph.D. dissertation, University of Reading, Reading,U.K., 1984.
[15] A. P. Dempster, N. M. Laird, and D. B. Rubin, “Maximum likelihoodfrom incomplete data via the EM algorithm,”J. Roy. Statist. Soc., vol.39, no. 1, pp. 1–38, 1977.
[16] T. K. Moon, “The expectation-maximization algorithm,”Signal Pro-cessing Mag., vol. 13, no. 6, pp. 47–60, 1996.
[17] A. P. Redner and H. F. Walker, “Mixture densities, maximum likelihoodand the EM algorithm,”SIAM Review, vol. 26, no. 2, pp. 195–239, 1984.
[18] J. R. G. Townshend, C. O. Justice, and C. Gurney, “The impact of mis-registration on change detection,”IEEE Trans. Geosci. Remote Sensing,vol. 30, pp. 1054–1060, Sept. 1992.
[19] L. Bruzzone and S. B. Serpico, “Detection of changes in re-motely-sensed images by the selective use of multi-spectral informa-tion,” Int. J. Remote Sensing, vol. 18, no. 18, pp. 3883–3888, 1997.
[20] P. S. Chavez, Jr., “Radiometric calibration of Landsat Thematic Mappermultispectral images,”Photogramm. Eng. Remote Sensing, vol. 55, no.9, pp. 1285–1294, 1989.
[21] K. Fukunaga, Introduction to Statistical Pattern Recognition, 2nded. London, U.K.: Academic, 1990.
[22] B. M. Shahshahani and D. A. Landgrebe, “The effect of unlabeledsamples in reducing the small size problem and mitigating the Hughesphenomenon,”IEEE Trans. Geosci. Remote Sensing, vol. 32, pp.1087–1095, Sept. 1994.
[23] Y. Delignon, A. Marzouki, and W. Pieczynski, “Estimation of general-ized mixture and its application in image segmentation,”IEEE Trans.Image Processing, vol. 6, pp. 1364–1375, Oct. 1997.
[24] R. Chellapa and A. Jain,Markov Random Fields: Theory and Applica-tions. New York: Academic, 1993.
[25] R. C. Dubes and A. K. Jain, “Random field models in image analysis,”J. Appl. Statist., vol. 16, pp. 131–163, 1989.
[26] E. Rignot and R. Chellappa, “Segmentation of polarimetric syntheticaperture radar data,”IEEE Trans. Image Processing, vol. 1, pp. 281–300,Mar. 1992.
[27] S. Geman and D. Geman, “Stochastic relaxation, Gibbs distributions,and the Bayesian restoration of images,”IEEE Trans. Pattern Anal. Ma-chine Intell., vol. PAMI-6, no. 6, pp. 721–741, 1984.
[28] C. S. Regazzoni, F. Arduini, and G. Vernazza, “A multilevel GMRF-based approach to image segmentation and restoration,”Signal Pro-cessing, vol. 34, pp. 43–67, 1993.
[29] A. H. S. Solberg, A. K. Jain, and T. Taxt, “Fusion of multitemporalsatellite images and GIS data for land-use classification,”IEEE Trans.Geosci. Remote Sensing, vol. 32, pp. 768–778, July 1994.
[30] J. Besag, “On the statistical analysis of dirty pictures,”J. Roy. Statist.Soc. B, vol. 48, pp. 259–302, 1986.
[31] L. Bruzzone and D. F. Prieto, “A technique for the selection of kernel-function parameters in RBF neural networks for classification of re-mote-sensing images,”IEEE Trans. Geosci. Remote Sensing, vol. 37,pp. 1179–1184, Mar. 1999.
[32] E. M. Pereira and A. W. Setzer, “Spectral characteristics of fire scars inLandsat-5 TM images of Amazonia,”Int. J. Remote Sensing, vol. 14, no.11, 1993.
[33] L. Bruzzone and D. F. Prieto, “A Bayesian approach to automatic changedetection,” inProc. IEEE 1999 Int. Geoscience and Remote SensingSymp. (IGARSS’99), Hamburg, Germany, July 1999, pp. 1816–1818.
[34] L. Bruzzone, “An approach based on the Bayes rule for minimum costto feature selection and classification of remote-sensing images,”IEEETrans. Geosci. Remote Sensing, vol. 38, pp. 429–438, Jan. 2000.
[35] P. C. Smits and S. G. Dellepiane, “Synthetic aperture radar image seg-mentation by a Detail Preserving Markov Random Field Approach,”IEEE Trans. Geosci. Remote Sensing, vol. 35, no. 4, pp. 844–857, 1997.
[36] S. Lakshmanan and H. Derin, “Simultaneous parameter estimation andsegmentation of Gibbs Random Fields using Simulated Annealing,”IEEE Trans. Geosci. Remote Sensing, vol. 11, no. 8, pp. 799–813, 1989.

1182 IEEE TRANSACTIONS ON GEOSCIENCE AND REMOTE SENSING, VOL. 38, NO. 3, MAY 2000
[37] B. Chalmond, “An iterative Gibbsian technique for reconstruction ofm-ary images,”Pattern Recognit., vol. 22, no. 6, pp. 747–762, 1989.
[38] C. E. Priebe and D. J. Marchette, “Adaptive mixture density estimation,”Pattern Recognit., vol. 26, no. 5, pp. 771–785, 1993.
Lorenzo Bruzzone (S’95–M’99) received the“Laurea” (M.S.) degree in electronic engineeringand the Ph.D. degree in telecommunications, bothfrom the University of Genoa, Genoa, Italy, inNovember 1993 and June 1998, respectively.
Since June 1998, he has been a PostdoctoralResearcher at the University of Genoa. He was theScientific Coordinator of the activites on remotesensing image analysis carried out by the SignalProcessing and Telecommunications Group, Depart-ment of Biophysical and Electronic Engineering,
University of Genoa. Since February 2000, he has been an Assistant Professorof telecommunications with the University of Trento, Trento, Italy, where heteaches electrical telecommunications. His main research contributions are inthe area of remote sensing image processing and recognition. In particular,his interests include feature extraction and selection, classification, changedetection, and data fusion. He conducts and supervises research on these topicswithin the frameworks of several national and international projects. Since1999, he has been Evaluator of Project Proposals within the Fifth FrameworkProgramme of the European Commission. He is the author or co-author of morethan 60 scientific publications and a referee for the international journals IEEETRANSACTIONS ONGEOSCIENCE ANDREMOTE SENSING, IEEE TRANSACTIONS
ON IMAGE PROCESSING, IEEE TRANSACTIONS ONNEURAL NETWORKS, IEEETRANSACTIONS ONSYSTEMS, MAN, AND CYBERNETICS, International Journalof Remote Sensing, andSignal Processing.
Dr. Bruzzone ranked first place in the Student Prize Paper Competition ofthe 1998 IEEE International Geoscience and Remote Sensing Symposium.He received the recognition of the IEEE TRANSACTIONS ON GEOSCIENCE
AND REMOTE SENSING as Best Reviewer in 1999. Since 1998, he has servedon the Scientific Committee of the EUROPTO International Conferences on“Signal and Image Processing for Remote Sensing.” He is a member of theInternational Association for Pattern Recognition (IAPR).
Diego Fernàndez Prieto(S’99) received the B.S. degree in physics from theUniversity of Santiago de Compostela, Spain, in 1994. He received the M.B.A.degree in business administration from the University of Deusto, Spain, andthe M.E.B.A from the University of Kent, U.K., both in 1997. He is currentlypursuing the Ph.D. degree in the Department of Biophysical and Electronic En-gineering, University of Genoa, Genoa, Italy.
In 1994 and 1996, he was involved in the activities of the Istituto per laMatematica Applicata (I.M.A), National Research Council (C.N.R), Genoa,Italy, where he studied parallel-computing applications for the GeographicInformation System (G.I.S). His main research activity is in the area of theremote sensing image processing and recognition. In particular, his currentinterests include neural networks for classification purposes, incrementallearning, data fusion, and change detection techniques.
Mr. Prieto is a Member of the International Association of Pattern Recog-nition (IAPR) and the Asociaciòn Española de Teledetecciòn (AET). He is aReviewer for the journal IEEE TRANSACTIONS ONGEOSCIENCE ANDREMOTE
SENSING.