automatic aorta segmentation and valve landmark detection in c-arm ct ... · automatic aorta...
TRANSCRIPT

Automatic Aorta Segmentation and Valve
Landmark Detection in C-Arm CT for
Transcatheter Aortic Valve Implantation
Yefeng Zheng1, Matthias John2, Rui Liao1, Alois Nottling2, Jan Boese2, Jorg
Kempfert3, Thomas Walther3, Gernot Brockmann4, and Dorin Comaniciu1
1Image Analytics and Informatics, Siemens Corporation, Corporate Research and Technology, Princeton, USA2Siemens AG, Healthcare Sector, Forchheim, Germany
3Department of Cardiac Surgery, Kerckoff Klinik Heart Center, Bad Nauheim, Germany4Department of Cardiovascular Surgery, German Heart Center, Munich, Germany
Corresponding Author: Yefeng Zheng
E-mail: [email protected]
Phone: 1-609-734-3642
Fax: 1-609-734-6565
Note: A video clip captured during clinical evaluation has also been submitted as supplementary material,
showing the application of our system on a real patient.

SUBMITTED TO IEEE TRANSACTIONS ON MEDICAL IMAGING 2
Abstract
Transcatheter aortic valve implantation (TAVI) is a minimally invasive procedure to treat severe
aortic valve stenosis. As an emerging imaging technique, C-arm CT plays a more and more important
role in TAVI on both pre-operative surgical planning (e.g., providing 3D valve measurements) and intra-
operative guidance (e.g., determining a proper C-arm angulation). Automatic aorta segmentation and
aortic valve landmark detection in a C-arm CT volume facilitate the seamless integration of C-arm
CT into the TAVI workflow and improve the patient care. In this paper, we present a part-based aorta
segmentation approach, which can handle structural variation of the aorta in case that the aortic arch and
descending aorta are missing in the volume. The whole aorta model is split into four parts: aortic root,
ascending aorta, aortic arch, and descending aorta. Discriminative learning is applied to train a detector
for each part separately to exploit the rich domain knowledge embedded in an expert-annotated dataset.
Eight important aortic valve landmarks (three hinges, three commissures, and two coronary ostia) are
also detected automatically with an efficient hierarchical approach. Our approach is robust under all kinds
of variations observed in a real clinical setting, including changes in the field-of-view, contrast agent
injection, scan timing, and aortic valve regurgitation. Taking about 1.1 seconds to process a volume, it is
also computationally efficient. Under the guidance of the automatically extracted patient-specific aorta
model, the physicians can properly determine the C-arm angulation and deploy the prosthetic valve.
Promising outcomes have been achieved in real clinical applications.
Index Terms
Aorta Segmentation, Aortic Valve Landmark Detection, C-arm CT, Transcatheter Aortic Valve
Implantation
I. INTRODUCTION
The open-heart aortic valve replacement is an effective method to treat severe aortic valve
disease. With 50,000 procedures performed annually, it is the most common valvular heart
surgery in the United States [1]. However, at least 30% of patients cannot tolerate the surgical
trauma due to the advanced age or the presence of various comorbidities [2]. Transcatheter aortic
valve implantation (TAVI) is an emerging, less invasive procedure to treat severe aortic valve
stenosis, where the prosthetic valve is inserted and deployed using a catheter through a small
puncture of the femoral artery (the transfemoral approach) or a small cut at the heart apex (the
transapical approach). After the first in-human TAVI case performed in 2002, the procedure has
been adopted rapidly, especially after the approval for commercial use in Europe in 2007, with
June 10, 2012 DRAFT

SUBMITTED TO IEEE TRANSACTIONS ON MEDICAL IMAGING 3
Fig. 1. The anatomy of the aortic valve with aortic hinges indicated by red arrows, aortic commissures indicated by purple
arrows, and left/right coronary ostium indicated by the green/blue arrow, respectively. Note: The third aortic commissure is at
the back of the valve and blocked in this view.
more than 30,000 TAVI procedures performed in the world so far [3]. TAVI has already accounted
for more than 20% of aortic valve replacement procedures in Germany [4]. It is expected to
grow fast in the United States too after the recent approval for commercial use in November
2011. The recent randomized trails show that TAVI significantly reduces the mortality rate for a
patient who is too sick or weak to be a candidate for surgical valve replacement, compared to the
current standard medical therapy [2]. For a high-risk patient who can still tolerate the surgical
valve replacement, TAVI has comparable outcomes to the open-heart surgical procedure [5].
Before the surgery, several important parameters of the aortic valve (see Fig. 1 for the aortic
valve anatomy) need to be measured for surgical planning. For example, the distance between the
coronary ostia and the aortic valve hinge plane (the lowest level of the valve cusps) is a critical
parameter for patient selection since a short distance increases the risk of blocking coronary
circulation after valve deployment. The diameter of aortic valve annulus needs to be measured
accurately to select a prosthetic valve with an appropriate size. Fluoroscopy is currently the main
working-horse imaging modality for TAVI (see Fig. 2), where real-time images are captured on
a C-arm system to provide guidance to physicians [6]. The aortic root structure is normally
June 10, 2012 DRAFT

SUBMITTED TO IEEE TRANSACTIONS ON MEDICAL IMAGING 4
(a) (b) (c)
Fig. 2. Transapical aortic valve implantation under X-ray guidance. (a) An angiographic C-arm system able to acquire
interventional 3D CT images in an operating room. (b) Contrast injection via a pigtail catheter (the white arrow) immediately
prior to valve (the red arrow) deployment. (c) Implanted valve.
indistinguishable from the background (Fig. 2c), therefore, whenever necessary, the contrast
agent is applied to temporarily enhance the valve structure (Fig. 2b) for a short period. However,
the contrast agent is toxic and its usage should be minimized. Overlaying a patient-specific aorta
model extracted from 3D images onto real-time fluoroscopy provides valuable visual guidance to
the physician. Computed tomography (CT) is often used to provide the necessary 3D geometric
measurements in pre-operative surgical planning. However, CT images are rarely used intra-
operatively during valve implantation because 2D/3D overlay (or registration) of data captured
from different imaging devices is quite difficult.
C-arm CT has recently emerged as a new imaging technique with the following advantages,
compared to conventional CT. Since both the 3D volume and 2D fluoroscopic images are
captured on the same device, overlay of the 3D patient-specific aorta model onto a 2D image is
straightforward and accurate (except for relatively small cardiac and respiratory motion). Comment 14Please
refer to Section V for more detail about the 2D/3D overlay of the aorta model. Therefore, besides
providing the 3D valve measurements as CT, C-arm CT can be easily integrated into the intra-
operative TAVI workflow to provide visual guidance. Furthermore, since C-arm CT is scanned
shortly before the valve deployment (instead of days before as conventional CT), it better reflects
the current state of the patient’s anatomy.
In this paper, we propose robust and efficient methods for automatic aorta segmentation and
aortic valve landmark detection in C-arm CT for TAVI, as shown in Fig. 3. Besides providing
June 10, 2012 DRAFT
SUBMITTED TO IEEE TRANSACTIONS ON MEDICAL IMAGING 5
Aortic Valve Area = 453.79 mm2
Aortic Valve Diameter = 24.04 mm Ostia Distance = 20.62 mm Left Ostium-Hinge Distance = 9.46 mm Right Ostium-Hinge Distance = 13.23 mm
(a) (b) (c) (d)
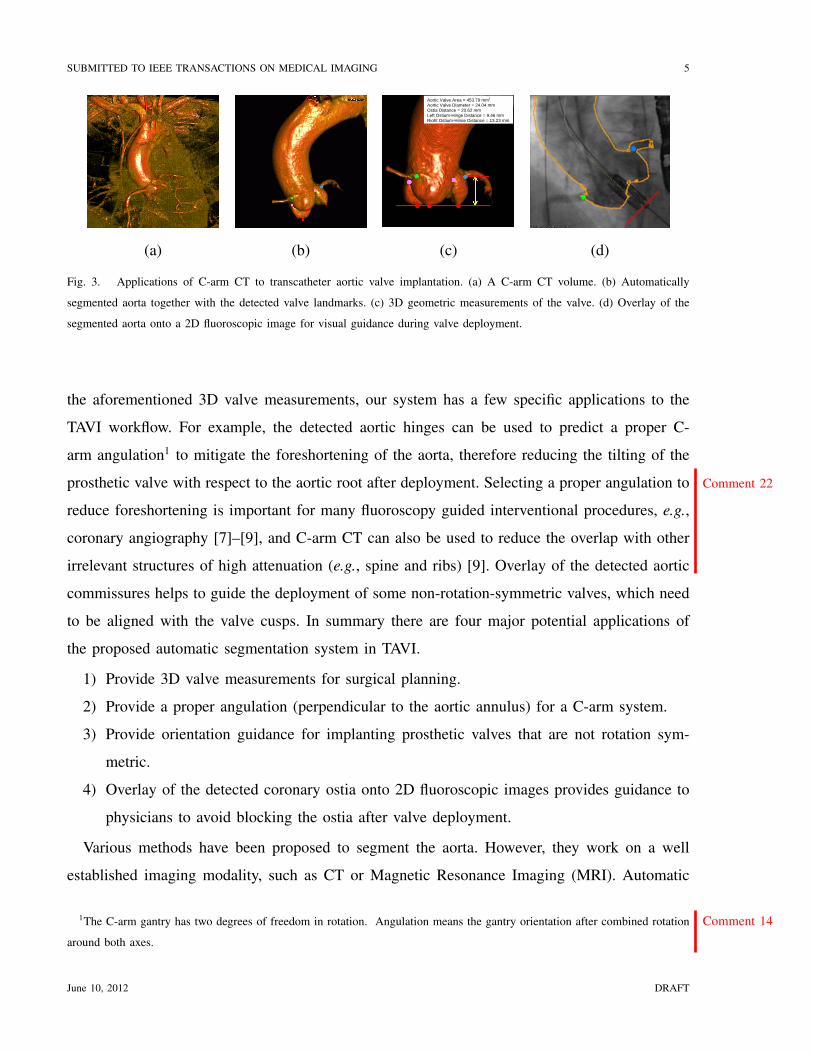
Fig. 3. Applications of C-arm CT to transcatheter aortic valve implantation. (a) A C-arm CT volume. (b) Automatically
segmented aorta together with the detected valve landmarks. (c) 3D geometric measurements of the valve. (d) Overlay of the
segmented aorta onto a 2D fluoroscopic image for visual guidance during valve deployment.
the aforementioned 3D valve measurements, our system has a few specific applications to the
TAVI workflow. For example, the detected aortic hinges can be used to predict a proper C-
arm angulation1 to mitigate the foreshortening of the aorta, therefore reducing the tilting of the
prosthetic valve with respect to the aortic root after deployment. Comment 22Selecting a proper angulation to
reduce foreshortening is important for many fluoroscopy guided interventional procedures, e.g.,
coronary angiography [7]–[9], and C-arm CT can also be used to reduce the overlap with other
irrelevant structures of high attenuation (e.g., spine and ribs) [9]. Overlay of the detected aortic
commissures helps to guide the deployment of some non-rotation-symmetric valves, which need
to be aligned with the valve cusps. In summary there are four major potential applications of
the proposed automatic segmentation system in TAVI.
1) Provide 3D valve measurements for surgical planning.
2) Provide a proper angulation (perpendicular to the aortic annulus) for a C-arm system.
3) Provide orientation guidance for implanting prosthetic valves that are not rotation sym-
metric.
4) Overlay of the detected coronary ostia onto 2D fluoroscopic images provides guidance to
physicians to avoid blocking the ostia after valve deployment.
Various methods have been proposed to segment the aorta. However, they work on a well
established imaging modality, such as CT or Magnetic Resonance Imaging (MRI). Automatic
1The C-arm gantry has two degrees of freedom in rotation. Comment 14Angulation means the gantry orientation after combined rotation
around both axes.
June 10, 2012 DRAFT

SUBMITTED TO IEEE TRANSACTIONS ON MEDICAL IMAGING 6
segmentation of the aorta in a C-arm CT volume is far more challenging. First, the image
quality from different clinical sites varies quite a lot since C-arm CT is too new to have a well
accepted scanning protocol. We also observed significant variations inside the same clinical site
since physicians were testing different scanning parameters (e.g., the amount of contrast agent
and timing of the image acquisition). Conventional image processing techniques, e.g., intensity-
based thresholding, region growing, and the watershed method, are usually not robust under such
large variations. We propose to use machine learning techniques to exploit the rich information
embedded in an expert-annotated dataset. Second, the field-of-view varies quite a lot for C-arm
CT. For example, the aortic arch and descending aorta may be captured in some volumes, but
missing in others. To address this challenge, we propose a part-based aorta model. The whole
aorta is split into four parts: aortic root, ascending aorta, aortic arch, and descending aorta. Using
the part-based model, the whole aorta does not need to be fully present. Depending on the parts
that can be detected, different workflows can be exploited, therefore, a large structural variation
can be elegantly handled.
Aortic valve landmarks play an important role in the surgical planning and visual guidance
for TAVI. However, there is very limited work on automatic aortic valve landmark detection,
except coronary ostium detection in CT angiography (CTA) for coronary analysis [10]–[14]. In
this work, we detect eight important aortic valve landmarks (three hinges, three commissures,
and two coronary ostia). Independent detection of each landmark [15] is not robust since some
landmarks are barely visible due to imaging noise and the washout of contrast agent. The detected
landmarks may be inconsistent in their relative positioning due to the lack of constraints in
independent detection.
In this paper, we propose to use a hierarchical approach by first detecting a global object
comprised with all eight valve landmarks. The global object is detected efficiently using the
marginal space learning (MSL) method [16]. From the position, orientation, and scale of this
global object, we can infer the rough position of individual landmarks. Each landmark is then
refined in a small region under the guidance of its own specific landmark detector. There is no
standard way to define the pose of the global object and an ad hoc solution is by no means
optimal. We propose an optimization based method to define global object pose to minimize the
error of the inferred landmark position. Besides the improved robustness, our approach is also
more efficient than the independent detection scheme [15].
June 10, 2012 DRAFT

SUBMITTED TO IEEE TRANSACTIONS ON MEDICAL IMAGING 7
Full automation, robustness, and efficiency are the keys for the success of a system in a real
day-to-day clinical utilization. Our approach is robust under all kinds of variations observed in a
real clinical setting, including changes in the field-of-view, contrast agent injection, scan timing,
and aortic valve regurgitation. Taking about 1.1 seconds to process a volume on a computer
with 2.33 GHz quad-core processors and 3 GB memory, it is much more computationally
efficient than the previous work [12], [17], [18]. Automation and segmentation speed may be
less of a concern for pre-operative surgical planning, but extremely important for an intra-
operative application. The patient is lying on the table with many medical devices inserted (e.g.,
transesophageal echocardiographic transducer and various catheters). The whole surgery team
(including interventional cardiologists, cardiac surgeons, nurses, and technicians, etc.) may be
halted, waiting for the segmentation result. In such a clinical setting, an efficient, automatic
segmentation system is highly appreciated, being much easier to be seamlessly integrated into
the workflow. Under the guidance of our system, promising outcomes have been achieved
in real clinical applications. To the best of our knowledge, this is the first work to apply
automatic segmentation to C-arm CT for TAVI, and our preliminary results have been published
as conference papers [19], [20].
Comment 11The proposed methods are built upon our previous work on MSL [16], which is applied to
detect/segment the aortic root, aortic arch, and the global valve landmark object. However, besides
the novel application to the TAVI procedure, this work also presents two major contributions to
the detection/segmentation techniques. First, using a part-based aorta model, MSL is extended
to segment the aorta under large structural variations due to the limited field-of-view. Second, a
novel method is proposed to reduce the shape initialization error. After estimating the pose of the
global valve landmark object using MSL, a mean shape (composed with eight valve landmarks)
is aligned to the estimated pose to generate the initial position of the landmarks. In this work,
we propose an optimization based method to determine the best mean shape from a training set
so that the landmark initialization error is minimized. This technique can be extended for better
initialization of other non-rigid structures, e.g., heart chambers and livers.
The remaining of the paper is organized as follows. The related work on aorta segmentation
and aortic valve landmark detection is reviewed in Section II. The part-based aorta modeling
and segmentation is presented in Section III, followed by detailed description of the proposed
aortic valve landmark detection method in Section IV. In Section V, we briefly describe how
June 10, 2012 DRAFT

SUBMITTED TO IEEE TRANSACTIONS ON MEDICAL IMAGING 8
the automatic detection/segmentation is integrated in the TAVI workflow. Quantitative evaluation
is performed in Section VI for the aorta segmentation, aortic valve landmark detection, and the
3D valve measurements derived from the automatic segmentation. Furthermore, the accuracy of
the imaging guidance is evaluated. This paper concludes with Section VII for discussions of the
future work.
II. RELATED WORK
There is far more prior work on aorta segmentation than valve landmark detection, while the
latter is dominated by the detection of coronary ostia for coronary analysis. Aorta segmentation
is primarily used for aortic aneurysm analysis [21]–[33] and coronary analysis [10]–[14], though
it can also be applied for aortic calcium detection [34], connective tissue disorder detection [17],
blood flow quantification [35], and pulse wave velocity measurement [36], etc. Only recently,
we see its application on TAVI [6], [18], [37]. Most of the proposed methods focus on one
part of the aorta, e.g., the descending aorta for aneurysm analysis and the ascending aorta for
coronary analysis. CT and MRI are the major imaging modalities of the aorta, with only a few
exceptions using ultrasound [38] and C-arm CT [6], [37]. With a tubular shape, the aorta can
be detected and segmented using generic tubular structure segmentation approaches [39]–[41]
as those applied to a coronary artery, which mainly use various vesselness filters to enhance
and extract the centerline, followed by lumen segmentation. Since the aorta is a much bigger
structure than a coronary artery, more efficient methods (e.g., region growing, active contours,
and level sets) have been proposed to segment the lumen directly without extracting the centerline
first [10], [17].
Aortic aneurysm analysis (including aneurysm detection, segmentation, measurement, stent
simulation, and virtual endoscopy) is a major application of aorta segmentation in previous work.
Accurate segmentation of the aorta (including the lumen and thrombus outer wall) facilitates the
measuring of the maximum aneurysm diameter and thrombus volume, which are critical for a
physician to decide if the patient should be treated immediately or can still be on monitoring [33].
Normally, CT angiography (CTA) is the imaging modality and only the abdominal or thoracic
part of the descending aorta is segmented. The intersection of the descending aorta with a CT
image slice has an elliptic shape, which is relative easy to track along slices. Compared to the
thrombus outer wall, the lumen is much easier to segment in contrasted CTA images. However,
June 10, 2012 DRAFT

SUBMITTED TO IEEE TRANSACTIONS ON MEDICAL IMAGING 9
most algorithms are not fully automatic and a user still needs to click at least one or two points
to initialize the segmentation [24], [25]. Thrombus segmentation needs more interactive user
corrections [24] or to be constrained by the segmented lumen [25].
The ascending aorta is often segmented on CTA images to detect coronary ostia, therefore
providing seeds for the following coronary artery centerline extraction and lumen segmentation.
Many methods require at least one user click inside the aorta to initialize the segmentation. For
example, in [10], starting from a user clicked point, the aorta is segmented using a slice-by-slice
region growing algorithm. It is possible to detect the intersection of the ascending aorta on each
slice using a Hough transform based circle detector, therefore making the whole procedure fully
automatic [13]. To avoid leakage into the left ventricle, some heuristic rules have to be exploited
to stop the region growing or circle tracking [10], [13]. To improve computational efficiency,
the Hough transform is performed only once in [14] to detect a seed point, followed by region
growing based tracing. Tek et al. [12] proposed a significantly different method for automatic
aorta segmentation. The left ventricle is segmented first and used to constrain the search for the
aorta. Since the left ventricle is segmented too, the whole procedure is time consuming, taking
about 6.2 s on a computer with a 2.8 GHz CPU.
Magnetic resonance imaging (MRI) is another important imaging modality of the aorta to
detect the connective tissue disorder [17], and to measure the aorta elasticity [42], blood flow [35],
and pulse wave velocity [36], etc. In these applications the whole aorta is often presented in
the volume and need to be segmented, therefore the tortuous aortic arch needs to be handled
properly [42]. Zhao et al. [17] proposed a semi-automatic method to segment the aorta in cine MR
images. Starting from user specified seed points, a fast marching method is applied to provide
an initial segmentation. The optimal surface method incorporating the motion information is
developed to refine the segmentation.
Most of the previous methods are semi-automatic (a user needs to click at least one point [17])
and slow (taking up to 450 s to process one volume [40]). Furthermore, the previous work
on aorta segmentation focuses on a relatively consistent imaging protocol with much fewer
variations than ours. For example, a roughly same portion of the aorta is captured and the usage
of contrast agent is consistent, resulting in stable image characteristics. However, our C-arm
CT data exhibit large variations in both contrast agent injection and field-of-view (resulting in
June 10, 2012 DRAFT

SUBMITTED TO IEEE TRANSACTIONS ON MEDICAL IMAGING 10
missing aorta part in a volume). Comment 16In the robust active shape model (ASM) methods, the missing
part can be treated as outliers, which are detected based on random sub-sampling [43], [44] or
checking the ratio of inter-landmark distances [45]. However, the robust estimation methods have
an implicit assumption that the majority of the landmarks are inliers. Therefore, the performance
starts to break down quickly when the outlier ratio is more than 50% [45]. In our application,
more than half of the aorta is often missing from a volume. Specific to aorta segmentation, the
method proposed by Peters et al. [46], [47] can also handle variation in the field-of-view, where
the segmented heart chambers are used to predict the initial aorta position. Therefore, one can
determine which part of the aorta is presented in the volume and process it properly. However, in
our application, we cannot rely on the segmentation of heart chambers since they are normally
not contrasted in C-arm CT for TAVI, therefore difficult to segment.
Previous work on aortic valve landmark detection focuses on coronary ostia in CTA for
coronary analysis. The process starts from segmenting the ascending aorta and a coronary artery
is detected as a thin tubular structure attached to the aorta. The position of the attachment
is taken as the detected ostium. For example, the largest connected components on each side
of the aortic root are picked as the left and right coronary arteries in [10]. However, simple
connected component analysis is not robust under imaging noise, resulting in a success rate of
only 57%. Alternatively, coronary centerlines can be tracked from the aorta surface in order
to detect coronary ostia [12]. Since the computationally expensive centerline tracing algorithm
needs to run on the whole aorta surface, it is more time consuming. Compared to coronary
ostium detection, there is less work on the detection of other aortic valve landmarks, i.e., the
aortic hinges and commissures in this case. Ionasec et al. [48] presented a comprehensive aortic
valve model, which includes all eight valve landmarks. Since the trajectory of the landmarks
in the whole dynamic sequence is detected holistically, the detection accuracy on a static 3D
volume is not clear. In their early work [15], the landmarks are detected independently to each
other in a static volume. Independent detection of multiple landmarks is time consuming and
may result in unrealistic geometric configurations due to the lack of constraints.
With the rapid adoption of TAVI, recently, we see some work on aorta segmentation for TAVI
surgical planning [6], [18], [37], [49], [50]. For example in [18], the cardiac chambers and the
aorta are segmented in pre-operative CT, and a more detailed aortic valve model is proposed
and integrated into the heart model. The initial position of coronary ostia is predicted from the
June 10, 2012 DRAFT

SUBMITTED TO IEEE TRANSACTIONS ON MEDICAL IMAGING 11
Result
3D Volume Object Detection Using Marginal Space Learning
Position Estimation
Position-Orientation Estimation
Position-Orientation-Scale
Estimation
Non-rigid Deformation Estimation
Fig. 4. Diagram of marginal space learning based non-rigid object detection and segmentation [16].
segmented aortic valve, followed by model-based adaptation for the final detection. More closely
related to our work, Gessat et al. [6], [37] proposed a semi-automatic method on pre-operative
C-arm CT for TAVI surgical planning. The aorta is segmented using a region growing method
starting from a user specified point. The coronary ostia and aortic hinges are manually labeled.
The extracted aorta model is then manually aligned and overlaid onto intra-operative fluoroscopy
to provide guidance. In our approach, all these steps are fully automatic and can be finished in
about one second. Since the segmentation is performed on intra-operative C-arm CT, the overlay
of the aorta model to fluoroscopy is also automatic using the intrinsic C-arm coordinate system.
III. PART-BASED AORTA SEGMENTATION
In this section, we first give a brief introduction of our generic 3D object detection and
segmentation method using marginal space learning (MSL) [16], which is used to segment the
aortic root and aortic arch. We then present our part-based aorta detection and segmentation
method in detail.
A. Marginal Space Learning for 3D Object Segmentation
Recently, we proposed marginal space learning (MSL) [16] as an efficient and robust method
for 3D anatomical structure detection and segmentation in medical images. Here, we give a brief
overview of MSL and interested readers are referred to [16] for more details. Our technique is
based on recent advances in learning discriminative models to exploit rich information embedded
in a large expert-annotated database. We formulate the segmentation as a two-step learning
problem: anatomical structure localization and boundary delineation.
Object localization (or detection) is a prerequisite for an automatic segmentation system and
discriminative learning based approaches have proved to be efficient and robust for solving 2D
June 10, 2012 DRAFT

SUBMITTED TO IEEE TRANSACTIONS ON MEDICAL IMAGING 12
object detection problems [51]. In these methods, object detection is formulated as a classification
problem: whether an image block contains the target object or not. The object pose parameter
space is quantized into a large set of discrete hypotheses and exhaustive search is used to pick
the best hypothesis. To be specific, each hypothesis is tested by the the trained classifier to get a
detection score and the hypothesis with the largest score is taken as the final detection result. To
accurately localize a 3D object, nine pose parameters need to be estimated (three for translation,
three for orientation, and three for anisotropic scaling). With the exponential increase of potential
pose parameter combinations, exhaustive search is not practical for 3D object detection. The
idea of MSL is not to learn a classifier directly in the full similarity transformation space but
to incrementally learn classifiers on marginal spaces. In our case, we split the estimation into
three steps: position estimation, position-orientation estimation, and position-orientation-scale
estimation. After each step, we only keep a small number of promising hypotheses, therefore,
the pose parameter space is pruned significantly to increase the detection efficiency.
After objection detection, we get the position, orientation, and scale of the object. The mean
shape is aligned to the estimated transformation to get a rough estimate of the object shape. We
then deform the shape to fit the object boundary. Active shape models (ASM) [52] are widely
used to deform an initial estimate of a non-rigid shape under the guidance of image evidences
and shape prior. The non-learning based generic boundary detector in the original ASM [52] is
not robust under complex background or weak edges. We use a learning based method to exploit
more image evidences to achieve robust boundary detection. Fig. 4 shows the system diagram
for MSL based non-rigid object detection and segmentation.
MSL provides a generic framework for automatic object detection and segmentation. Its
efficiency can be further boosted by exploiting the prior constraints among the pose parameters in
the marginal spaces [53], resulting in detection speed of less than a second for most applications.
MSL has been successfully applied to many 3D anatomical structure detection and segmentation
problems in all major medical imaging modalities [53], e.g., livers in abdominal CT, and heart
chambers in both CT and ultrasound images.
B. System Diagram for Part-Based Aorta Segmentation
Due to the variation in the field-of-view, the aorta in a C-arm CT volume has no consistent
structure, therefore, our MSL based approach cannot be applied directly. In this paper, we propose
June 10, 2012 DRAFT

SUBMITTED TO IEEE TRANSACTIONS ON MEDICAL IMAGING 13
Fig. 5. A part-based aorta model. The whole aorta is split into four parts, namely aortic root, ascending aorta, aortic arch, and
descending aorta.
No Root Has Arch
No Arch
Output Mesh
3D Volume
Rejected
Ascending Aorta
Tracking
Descending Aorta
Tracking
Ascending Aorta
Tracking Boundary
Refinement
Aortic Arch
Detection
Aortic Root
Detection
Fig. 6. System diagram for part-based aorta segmentation.
a part-based aorta model (as shown in Fig. 5) by splitting the whole aorta into four parts: aortic
root, ascending aorta, aortic arch, and descending aorta. The aortic root and aortic arch are
consistent in anatomy, therefore, we can apply MSL to train two separate detectors with one
for each. The length of the ascending and descending aorta parts varies, therefore we use a
tracking-based method to handle this variation. Fig. 6 shows the system diagram of the proposed
part-based aorta segmentation method. We first detect the aortic root since it should always be
present in the volume. The aortic arch detector is then applied. If the aortic arch is not presented,
June 10, 2012 DRAFT

SUBMITTED TO IEEE TRANSACTIONS ON MEDICAL IMAGING 14
(a) (b) (c) (d)
Fig. 7. Aortic root segmentation results under the variations of contrast agent and aortic valve regurgitation.
therefore, not detected, the descending aorta is often also missing in the volume 2. We track
the ascending aorta starting from the aortic root until the top volume border. If the aortic arch
is detected, we track the ascending aorta starting the aortic root until the arch. We also track
the descending aorta downward from the arch if the arch is detected. After tracking, we get the
centerline of the whole aorta and a tube is synthesized as an initial rough estimate of the shape.
We then adjust each mesh point along the surface normal to an optimal position, which has
the largest response from a learning-based boundary detector. Generic mesh smoothing [54] is
applied to enforce the smoothness constraint. Mesh point adjustment and mesh smoothing can
be iterated a few times to improve the boundary delineation accuracy.
C. Aortic Root Segmentation
In anatomy, the aortic root refers to the aorta segment between the aortic hinges and the
sinotubular junction. Previous non-model-based approaches [10], [13], [14] have difficulty to
exactly delineate the boundary between the aortic root and the left ventricular outflow tract
(LVOT) since they are fully connected and both contrasted in CTA. In C-arm CT the contrast
agent is directly applied to the aortic root, therefore, the boundary is clear if the aortic valve
is fully closed. However, due to the aortic valve regurgitation, the contrast agent may leak into
the LVOT in about 20-30% of cases. The amount of leakage varies depending on the severity
of the regurgitation, which creates an extra challenge to an automatic segmentation method. As
2 Comment 17Volumes with missing aortic arch are reconstructed with slice size of 256×256 pixels, instead of 512×512 pixels. The slice
resolution is roughly the same, resulting in a much smaller trans-axial field-of-view. Therefore, the descending aorta is also
outside the volume.
June 10, 2012 DRAFT

SUBMITTED TO IEEE TRANSACTIONS ON MEDICAL IMAGING 15
a consistent anatomy, the aortic root is segmented using MSL in our system by fitting a surface
mesh model into the data. Fig. 7 shows the aortic root segmentation results on a few data,
demonstrating the robustness of MSL under the variations of contrast agent and aortic valve
regurgitation. The contrast of the first volume is strong (though with some imaging artifacts
presented around the aortic root), while the second volume has quite weak contrast. The amount
of regurgitation also varies quite a lot from no regurgitation (Fig. 7a) to severe regurgitation
(Fig. 7d).
D. Aortic Arch Segmentation
The aortic arch is missing in about half of our dataset due to the limited field-of-view of the C-
arm CT, therefore, the missing or presence of the aortic arch needs to be detected automatically.
Since the aorta has a tubular shape, the intersection perpendicular to its centerline is close to
a circle. A tracking based approach is often used to trace the circular shape, which works well
on the ascending and descending aorta parts. However, the aorta centerline orientation needs
to be estimated and updated robustly during the tracking of the bending arch [42]. Otherwise,
a tracking error may be propagated to the following slices, resulting in a failure (e.g., tracing
into the supra-aortic arteries or the nearby pulmonary artery). In this paper, we treat the aortic
arch as a holistic anatomical structure. In our part-based aorta model (Fig. 5), the aortic arch is
defined as the part from the top of the aorta to the axial slice where the intersection of the aorta
diverges into two separated parts. As the case of the aortic root, MSL is applied to detect and
segment the aortic arch. By segmenting the bending aortic root and arch with a model based
approach, the remaining parts are much easier to handle. Since the intersection of the ascending
and descending aorta parts to an axial slice is close to a circle, it can be tracked efficiently
without estimating the centerline orientation.
E. Tracking of Ascending and Descending Aorta Parts
The length of the visible ascending and descending aorta parts varies significantly from volume
to volume. Consequently, we propose to use a tracking technique to deal with this variation.
Instead of using a time-consuming Hough transform based circle detector [13], [14], we use
machine learning technique to train a 2D circle detector on an axial image slice using 2D Haar
wavelet features [51]. The tracking of the ascending aorta starts from the top of the aortic root
June 10, 2012 DRAFT

SUBMITTED TO IEEE TRANSACTIONS ON MEDICAL IMAGING 16
(a)
(b)
Fig. 8. Aorta boundary refinement. (a) Initial synthesized tubular mesh after tracking the ascending and descending aorta parts.
(b) Final segmentation after boundary refinement. The first three columns show three orthogonal cuts of the volume and the last
column shows the corresponding 3D meshes.
and is performed slice by slice, moving toward the patient’s head. The detected circle on a slice
is propagated to the next slice and the circle detector is applied in a neighborhood of 6×6 mm2
around the initial estimate. For an image slice containing the ascending aorta, normally, the
detector may find multiple circle candidates around the true position. We pick the one closest
to the circle on the previous slice. If the aortic arch is detected in the volume, the tracking
procedure stops on the slice touching the aortic arch. Otherwise, it stops when no aortic circles
are detected or it reaches the top volume border. Tracking of the descending aorta is quite similar.
It starts from the aortic arch, moves toward the patient’s abdomen, and stops on the slice with
no aortic circles detected.
F. Aorta Boundary Refinement
After tracking the ascending and descending aorta parts, we get the centerline of the whole
aorta. Comment 19A generalized-cylinder model is synthesized as an initial estimate of the aorta shape and
the radius at each centerline point is set to the radius of the detected circle. Fig. 8a shows the
June 10, 2012 DRAFT

SUBMITTED TO IEEE TRANSACTIONS ON MEDICAL IMAGING 17
(a) (b) (c) (d)
Fig. 9. Automatic aorta segmentation on a few example volumes. (a) Good contrast in the whole aorta. (b) Severe aortic valve
regurgitation. (d) Low contrast. (d) Contrast agent is almost washed out due to bad timing.
synthesized tube after tracking. The initialization is close to the true aorta boundary, however, a
circle does not fit the boundary exactly. A learning based boundary detector is exploited for final
boundary delineation. Interested readers are referred to [16] for more details of the learning based
boundary detector. One difference to the boundary delineation of the aortic root or arch is that we
cannot use the ASM to enforce prior shape constraint since the aorta is not consistent in structure
due to the variation in the field-of-view. Instead, a generic mesh smoothing technique [54] is
used to achieve a smooth surface for the segmented aorta. To be specific, a two-step iterative
approach is used.
1) Use the learning-based boundary detector to adjust each mesh point along the surface
normal to the optimal position where the response of the boundary detector is the largest.
2) Apply generic mesh smoothing.
The above two steps are repeated a couple of times to improve the boundary delineation accuracy.
Fig. 8b shows the result after boundary refinement. More examples of the aorta segmentation
results are shown in Fig. 9.
Note that, almost all previous work uses bottom-up approaches [11], [17], [39], [40], [42] to
track the aorta centerline to handle variations. They are neither automatic nor robust to noisy
images. In comparison, we use the top-down MSL [16] to detect the aortic root and arch, and use
bottom-up tracking to detect ascending and descending aorta parts, which have large variations
in length. Our system is a nice combination of both approaches.
June 10, 2012 DRAFT

SUBMITTED TO IEEE TRANSACTIONS ON MEDICAL IMAGING 18
IV. AORTIC VALVE LANDMARK DETECTION
Besides segmenting the aorta, we detect eight aortic valve landmarks (see Fig. 1), i.e., three
aortic hinges, three aortic commissures, and left and right coronary ostia, since they are important
in both surgical planning and providing visual guidance during valve deployment. Though it is
possible to detect each landmark independently [15], the detection results may be inconsistent in
geometry. It also wastes computation power by ignoring the strong geometric constraint among
the landmarks. We propose an efficient hierarchical approach by first detecting a global object
comprised with all eight valve landmarks. From the position, orientation, and scale of this global
object, we can infer the rough position of individual landmarks. Each landmark is then refined
in a small region (e.g., a cube of 10 mm centered on the initial position) under the guidance of
its own specific landmark detector.
A. Optimal Mean Shape for Accurate Shape Initialization
Similar to aortic root detection, we use marginal space learning (MSL) [16] to efficiently
detect the position, orientation, and scale of the global landmark object. For a learning based
method, we need to specify the ground truth of object pose for each training volume, therefore, a
learning algorithm can learn the implicit relationship between the image and object pose, which
is later used to infer the correct pose from an unseen volume. However, there is no standard
way to define the pose of the global object containing eight landmarks. After detecting the
global landmark object, we align the mean shape (which is the average shape of the training set
after global transformation has been compensated) to the global pose to get an initial estimate
of each individual landmark’s position. This initialization needs to be accurate. Otherwise, the
final boundary evolution may get stuck in a wrong position due to the complication of the
surrounding tissues. The mean shape is generally calculated as an average of the normalized
shapes in an object-centered coordinate system. Therefore, the optimal mean shape and optimal
pose definition are closely related. In [16], the orientation of a heart chamber is defined by its
long axis; the position and scale are determined by the oriented bounding box of the chamber
surface mesh. Although working well in applications with relatively small shape variations, the
mean shape derived using the oriented-bounding-box based method is not optimal at all.
In this paper, we present an approach to searching for an optimal mean shape m that can
represent the whole population well. A group of training shapes, M1,M2, . . . ,MN are supposed
June 10, 2012 DRAFT

SUBMITTED TO IEEE TRANSACTIONS ON MEDICAL IMAGING 19
to be given and each shape is represented by J points M ji , j = 1, . . . , J (J = 8 for the aortic valve
landmarks). The optimal mean shape m should minimizes the residual errors after alignment,
m = arg minm
N∑i=1
‖Ti(m)−Mi‖2 . (1)
Here, Ti is the corresponding transformation from the mean shape m to each individual shape
Mi. This procedure is called generalized Procrustes analysis [55] in the literature. An iterative
approach can be used to search for the optimal solution. We first randomly pick an example
shape as a mean shape. We then align each shape to the current mean shape. The average of
the aligned shapes (the simple average of the corresponding points) is calculated as a new mean
shape. The iterative procedure converges to a locally optimal solution after a few iterations.
The similarity transformation with isotropic scaling is often used as the transformation T .
However, MSL can efficiently estimate anisotropic scales of an object. By removing more
deformations, the shape space after alignment is more compact and the mean shape can represent
the whole population more accurately. Therefore, we use an anisotropic similarity transforma-
tion to represent the transformation between two shapes, i.e., T represents translation (T =
[X, Y, Z]′), rotation (represented as a rotation matrix R), and anisotropic scaling (Sx, Sy, Sz).
The transformation of a 3D point P is
T (P ) = R
Sx 0 0
0 Sy 0
0 0 Sz
P + T. (2)
The optimal T to align two shapes m and M is
T , R, S = arg minT,R,S
J∑j=1
∥∥∥∥∥∥∥∥∥
R
Sx 0 0
0 Sy 0
0 0 Sz
mj + T
−M j
∥∥∥∥∥∥∥∥∥2
. (3)
Suppose there is a common scale s = (Sx + Sy + Sz)/3, and let S ′x = Sx/s, S ′y = Sy/s, and
S ′z = Sz/s. Equation (3) can be re-written as
T , R, S = arg minT,R,S
J∑j=1
∥∥∥∥∥∥∥∥∥
Rs
S ′x 0 0
0 S ′y 0
0 0 S ′z
mj + T
−M j
∥∥∥∥∥∥∥∥∥2
. (4)
June 10, 2012 DRAFT

SUBMITTED TO IEEE TRANSACTIONS ON MEDICAL IMAGING 20
Since there are no closed-form solutions for estimating the anisotropic similarity transforma-
tion, we propose a two-step iterative approach to searching for the optimal transformation.
1) Starting from the given anisotropicity (S ′x, S′y, S
′z), we estimate the similarity transformation
with isotropic scaling, (T,R, s).
2) With the given similarity transformation (T,R, s), we update the anisotropicity (S ′x, S′y, S
′z).
In the first step, at beginning, we can assume the scaling is isotropic, S ′x = 1, S ′y = 1, and S ′z = 1.
The isotropic similarity transformation can be estimated using a closed-form solution [55, p. 84].
After some mathematical derivations, we find that the second step also has a closed form solution
as follows,
S ′x =
∑Jj=1 m
j(x)Qj(x)∑Jj=1m
j(x)2S ′y =
∑Jj=1m
j(y)Qj(y)∑Jj=1 m
j(y)2S ′z =
∑Jj=1m
j(z)Qj(z)∑Jj=1 m
j(z)2, (5)
where
Qj =1
sR−1(M j − T ). (6)
Since each step reduces the residual shape error after alignment, the process converges. In practice
it converges quickly in 3-5 iterations.
With a module solving the anisotropic similarity transformation between two shapes, we can
plug it into the generalized Procrustes analysis method to search for the optimal mean shape m.
Besides the optimal mean shape, the optimal alignment Ti from the mean shape to each training
shape is also obtained. The transformation parameters of the optimal alignment provide the pose
ground truth that MSL can learn to estimate.
B. Unique Mean Shape for Aortic Valve Landmarks
The optimal mean shape m is not unique. Any translation, rotation, and scaling of m is also
an optimum since the transformation of the mean shape can be compensated by the individual
transformation Ti. We remove the unnecessary flexibility of the mean shape using the oriented-
bounding-box based approach [16] as follows. We first define a unique orientation. Suppose
three aortic hinges are denoted as H1, H2, and H3; three aortic commissures are denoted as
C1, C2, and C3; and Ol and Or represent the left and right coronary ostium, respectively. Let
Hc = (H1 + H2 + H3)/3 be the mass center of three aortic hinges and Cc = (C1 + C2 + C3)/3
June 10, 2012 DRAFT

SUBMITTED TO IEEE TRANSACTIONS ON MEDICAL IMAGING 21
(a) (b)
Fig. 10. The aligned of aortic valve landmarks and mean shape (represented as big circles) using (a) the oriented-bounding-box
based approach [16] and (b) the proposed optimization approach.
be the mass center of three aortic commissures. The z axis is defined as a unit vector pointing
from the hinge center Hc to the commissure center Cc
z =Cc −Hc
‖Cc −Hc‖. (7)
The x axis is derived as follows
x1 =Or −Ol
‖Or −Ol‖, (8)
x2 = (z × x1)× z, (9)
x =x2
‖x2‖. (10)
Here, initial axis x1 is defined as a unit vector pointing from the left coronary ostium Ol to the
right coronary ostium Or. We then rotate the x1 axis inside the plane spanned by the x1 and
z axes to make it perpendicular to the z axis, arriving axis x2. The final x axis is achieved by
normalizing x2 to a unit vector. The y axis is then a cross product of the z and x axes, y = z×x.
After defining the orientation of the global shape, we calculate an oriented bounding box for
the eight landmarks. We set the origin of the object-centered coordinate system to the center of
the box. We scale the bounding box anisotropically to make it a cube of 1 mm in length. The
June 10, 2012 DRAFT

SUBMITTED TO IEEE TRANSACTIONS ON MEDICAL IMAGING 22
Fig. 11. The aortic valve landmark detection results on two example data with red dots for the hinges, purple for the commissures,
blue for the left coronary ostium, and green for the right coronary ostium. Each row shows three orthogonal cuts of a volume.
optimal mean shape m is tightly bounded in the cube. After each iteration of the generalized
Procrustes analysis, m is normalized using the above procedure, therefore uniquely defined. We
would like to emphasize that such normalization of the mean shape m does not change its
optimality, but helps to achieve a unique solution.
C. Efficient Hierarchical Aortic Valve Landmark Detection
On our evaluation dataset with 278 volumes Comment 21(see Section VI-A), the mean landmark error
(the Euclidean distance defined in Equation (3)) inferred from the aligned mean shape is about
2.77 mm using the oriented-bounding-box based approach. The Procrustes analysis converges
after three iterations, the mean landmark error is significantly reduced to 1.90 mm. It clearly
shows that the optimal mean shape derived using the proposed method can better represent the
whole shape population. Figs. 10a and b show the distribution of the aligned landmarks using
the oriented-bounding-box based approach and the proposed optimization approach, respectively.
June 10, 2012 DRAFT
SUBMITTED TO IEEE TRANSACTIONS ON MEDICAL IMAGING 23
It is clear that the distribution is more compact using the proposed method.
After inferring the initial landmark position from the pose of the detected global object, each
landmark is then refined in a small region (e.g., a cube of 10 mm centered on the initial position)
under the guidance of its own specific landmark detector. Trained with the probabilistic boosting
tree classifier, our landmark detector is similar to the detector used by Ionasec et al. [48], but
using the steerable features [16] that can be efficiently extracted from the original volume. On
the contrary, the method of Ionasec et al. needs to resample the original volume to an isotropic
resolution (e.g., 1 mm) to use the Haar wavelet features. Fig. 11 shows the detected aortic valve
landmarks after local refinement on two example volumes.
V. WORKFLOW INTEGRATION FOR TRANSCATHETER AORTIC VALVE IMPLANTATION
In this section, we describe the integration of the automatic aorta segmentation and aortic
valve landmark detection into the transcatheter aortic valve implantation (TAVI) workflow. We
follow the steps the system performs during the valve deployment and discuss the potential
user interactions. All described components have been integrated into an angiographic C-arm
system (Artis zee/zeego with Siemens syngo Workplace, Erlangen, Germany). Right before the
implantation, the physician starts to obtain a 3D C-arm CT volume of the aortic root by acquiring
a rotational 2D image sequence of 200o over 5 seconds on the C-arm system. Via a pigtail
catheter, 15-25 ml contrast agent (diluted to 75 ml) is injected over 5 seconds (with a 1-second
X-ray delay) into the aortic root. To minimize the respiratory motion artifact, the physicians
temporally stop mechanical ventilation to the patient. Furthermore, rapid ventricular pacing 3
is applied to a heart rate that yields no effective heart pumping and minimal blood flow. This
allows using a relatively small amount of contrast agent, compared to approximately 80 ml for a
conventional CT and approximately 15 ml for a single 2D angiogram [56]. After the rotational
run is finished on the C-arm system, all of the following steps 1-5 are started and performed
fully automatically.
1. Reconstructing 3D CT volume from acquired rotational image sequence.
The 3D volume is reconstructed based on a software available with the angiographic C-arm
system [57], which takes about 12 seconds.
3 Comment 6Rapid pacing is regarded as a safe procedure by many physicians. However, a few physicians have concern that rapid pacing
may peel off some cardiac calcifications into the blood circulation, raising the risk of strokes.
June 10, 2012 DRAFT
SUBMITTED TO IEEE TRANSACTIONS ON MEDICAL IMAGING 24
2. Segmenting the aorta and detecting the aortic valve landmarks from 3D volume.
The proposed method is applied to segment the aorta and detect eight aortic valve landmarks:
the aortic hinges that are the lowest points of aortic root cusps (to support finding a C-arm
angulation perpendicular to the aortic root), the coronary artery ostia (which have to stay
open after prosthesis implantation), and the aortic commissures where the cusps meet (to help
orienting anatomically designed valve prostheses). The aorta centerline is also calculated from
the segmented aorta mesh. This process is quite fast, taking about one second.
3. Deriving additional structures from detected landmarks.
We derive a circle parallel to the plane spanned by the three aortic hinges (see red circle
in the bottom-right quadrant of Fig. 12). Visually, this perpendicularity circle degenerates to a
straight line if and only if the three aortic hinges are aligned (see Fig. 13a), which corresponds
to a perpendicular angulation for valve implantation. It is important to avoid tilting of the
deployed prosthetic valve with respect to the aortic root (i.e., the centerline of the prosthetic
valve should be aligned accurately to the centerline of the aortic root) to minimize the post-
procedure complications (e.g., valvular regurgitation and aortic root rupture) [3]. The tilting
inside the imaging plane is relatively easy to correct by the physician during prosthetic valve
positioning under the guidance of fluoroscopy. The out-of-plane tilting is avoided if both the
aortic root and the prosthetic valve have no foreshortening on the imaging plane. The metal
frame of a prosthetic valve is clearly visible under fluoroscopy, therefore can be adjusted to
avoid tilting by checking the top or bottom ring of the prosthesis (see Fig. 13b). However, it is
much more difficult to find a proper angulation for the aortic root. As soft tissue, the aortic root is
not visible under fluoroscopy and contrast agent needs to be injected to check the foreshortening.
Previously, multiple iterations of adjustments need to be performed, composed with 1) injecting
contrast to check the foreshortening, 2) determining the next angulation to try, and 3) rotating
the C-arm to that angulation. Using our system, the physician can perform virtual rotations to
get a proper angulation (on which the derived perpendicularity circle degenerates into a straight
line) and, once done, the C-arm can automatically rotate to the selected angulation. Additionally,
contrast injections for perpendicularity checks can be avoided in this process.
To estimate the likelihood for the coronary ostia to stay open after implantation, the physician
wants to measure their distance to the aortic hinge plane. We create a ruler orthogonal to that
plane (see the red ruler in the top-right quadrant of Fig. 12). We decided to show a ruler instead of
June 10, 2012 DRAFT

SUBMITTED TO IEEE TRANSACTIONS ON MEDICAL IMAGING 25
Fig. 12. A screen shot of our prototype. Detected landmarks (coronary ostia in blue and green, commissures in purple, hinges
in red, centerline in yellow) and derived structures (perpendicularity circle and ruler in red) are shown in 3D volume rendering
and three orthogonal intersection planes with 15 mm slice thickness. The panel in the lower right shows the user interface we
added to the existing system.
numbers, because this makes the measurement process transparent to the physician and allows
for user compensation of the measurement in case of mis-detected landmarks. The coronary
artery dilates to a funnel shape around its ostium, with a diameter up to 5 mm. Comment 5Traditionally,
the ostium landmark is put at the center of the funnel shape (as we did in this work), while some
physicians may prefer to put the ostium landmark at the bottom edge close to the aortic hinge
plane to get a more conservative distance measurement. A ruler gives the physicians flexibility
to adjust the measurement based on their own preference.
4. Extract interior of segmented aortic shape out of 3D volume for volume rendering.
The interior of the segmented aorta is extracted from the volume and visualized with volume
rendering. Visualization of coronary arteries is also important, but automatic segmentation is
difficult. To make them visible without segmenting them explicitly, we add voxels within 15
June 10, 2012 DRAFT

SUBMITTED TO IEEE TRANSACTIONS ON MEDICAL IMAGING 26
mm (determined heuristically) to each detected coronary ostium into volume visualization.
5. Computing optimized volume rendering transfer function parameters.
We want to avoid letting the user find manually the appropriate volume rendering parameters
copt for transfer function center and wopt for transfer function width. Therefore, they are calculated
automatically based on the voxel intensities,
copt = fc,inmin + fc,outmout + fc,offset, (11)
wopt = fw,inmin + fw,outmout + fw,offset. (12)
Here, mout (min) is a volume specific value and is determined by the mean intensity of all
voxels outside (inside) the boundary of the segmented aorta with a fixed distance to it. The six
parameters fc,in, fc,out, fw,offset, fw,in, fw,out, fw,offset are tuned on a few training data.
6. Landmark verification or correction.
The automatically detected valve landmarks need to be verified by the physicians, and corrected
if necessary (though it rarely happens in practice). To give the physicians a good initial view,
the volume is centered and zoomed based on the position of the two detected coronary ostia and
as many landmarks as possible are shown on the three orthogonal volume intersection planes
(see Fig. 12).
If landmark positions and visualization are satisfactory, the physician can perform the following
steps:
7. Rotating 3D volume to an appropriate C-arm angulation.
Every rotation of the volume rendering view corresponds to a C-arm angulation (up to in-
plane rotation). Therefore, using the displayed perpendicularity circle or the commissures, the
physician can virtually choose a view that corresponds to an appropriate C-arm angulation. The
system then allows automatically rotating the C-arm to that angulation.
8. Overlay of 3D structures onto fluoroscopic images.
The live overlay (see Fig. 13a) of the rendered 3D visualization onto fluoroscopic images is
based on software available with the angiographic C-arm system. The 3D volume is inherently
registered to the fluoroscopic images because both images are acquired on the same system.
Comment 23The information of any further C-arm rotations and table movements is fed to our application
and the overlay can be dynamically adapted. The adaptation step is purely based on the machine
June 10, 2012 DRAFT

SUBMITTED TO IEEE TRANSACTIONS ON MEDICAL IMAGING 27
coordinate system, therefore, it is robust and fast. However, it does not compensate patient and
cardiac motions, which is part of our future work.
VI. EXPERIMENTS
In this section, we quantitatively evaluate the accuracy of aorta segmentation and aortic valve
landmark detection on a large diverse C-arm CT dataset. Effectiveness of the C-arm CT based
imaging guidance system in the real TAVI workflow is also evaluated, including the aorta model
overlay accuracy and the tilting of the deployed prosthetic valve.
A. Evaluation of Aorta Segmentation and Valve Landmark Detection
We collected a dataset of 319 C-arm CT volumes from 276 patients from 11 clinical sites
over the world (mainly from Germany, Australia, Japan, Canada, and USA). Most patients have
only one C-arm CT volume. Comment 13If the image quality of the first C-arm CT is not good enough,
the physicians may perform another C-arm CT scan. It normally happens on the first few cases
from a new clinical site with limited experience in C-arm CT. Therefore, those patients may
have up to three volumes with variations in contrast agent injection and scan timing. In our
early collection, 15 patients also have a C-arm CT right right after the prosthesis deployment
for post-deployment evaluation, e.g., measuring valve regurgitation. Six patients have prosthetic
valves implanted from previous open-chest surgery. The aortic hinges of the native valve have
been destroyed on all these post-deployment C-arm CT. The size of each slice in a volume is
256× 256 or 512× 512 pixels. A volume contains around 200-300 slices. The image resolution
is isotropic and varies from volume to volume in the range of [0.70, 0.84] mm.
A four-fold cross-validation is performed to evaluate our algorithm. The whole dataset is
randomly split into four roughly equal sets. Three sets are used to train the system and the
remaining set is reserved for testing. The configuration is rotated, until each set has been tested
once.
The aorta segmentation accuracy is measured using the symmetric point-to-mesh distance [16].
For each point on a mesh, we search for the closest point on the other mesh to calculate
the minimum distance. We calculate the point-to-mesh distance from the detected mesh to the
ground-truth and vice versa to make the measurement symmetric. The contrast agent gradually
fades out along the descending aorta, therefore the length of the segmented aorta may differ
June 10, 2012 DRAFT

SUBMITTED TO IEEE TRANSACTIONS ON MEDICAL IMAGING 28
TABLE I
AORTIC VALVE LANDMARK DETECTION ERRORS BASED ON A FOUR-FOLD CROSS-VALIDATION ON 278 VOLUMES. THE
MEAN, STANDARD DEVIATION (STD), AND MEDIAN OF THE ERRORS ARE REPORTED (MEASURED IN MILLIMETERS).
Aortic Hinges Coronary Ostia Aortic Commissures
Mean STD Median Mean STD Median Mean STD Median
After Global Pose Estimation 3.38 1.27 3.16 4.26 1.78 4.01 3.35 1.31 3.18
After Local Refinement 2.09 1.18 1.82 2.07 1.53 1.61 2.17 1.31 1.88
from the manual annotation since it is difficult to determine consistently where the segmentation
should stop. When we calculate the error between the segmented mesh and the ground truth, we
exclude the extra distal part of the descending aorta from evaluation. On average, the length of
the excluded part is about 35 mm, which corresponds to about 15% of the descending aorta. The
mean segmentation error of the remaining aorta is 1.08 mm, with a standard deviation of 0.56
mm. Fig. 9 shows aorta segmentation results on a few volumes. The proposed method is robust
under the variations of the field-of-view, contrast agent, scan timing, and valve regurgitation.
We also quantitatively evaluate the valve landmark detection accuracy. Comment 1
Comment 13
The post-deployment
C-arm CT (15 volumes) is excluded since the native aortic hinges have been destroyed and the
aortic commissures have been significantly deformed. The patients (six volumes) with prosthetic
valves implanted from previous open-chest surgery are excluded for the same reason. We also
exclude a few volumes (20 volumes) with extremely poor image quality that the landmarks
cannot be identified even by an expert (though the aorta can be successfully segmented on these
volumes). Fig. 7b shows an example volume excluded in the evaluation of landmark detection.
For these patients, a second C-arm CT scan with better image quality is available, which is used
to guide the TAVI procedure.
A four-fold cross-validation is performed on the remaining 278 volumes for aortic valve
landmark detection. The landmark detection accuracy is measured using the Euclidean distance
from the detected landmark to the ground truth. Table I shows the detection errors. After global
landmark object pose estimation, we can get a good initial estimate of the landmark position.
The mean errors range from 3.35 to 4.26 mm for different landmarks. Compared to the aortic
hinges and commissures, the initial coronary ostia have a larger mean error of 4.26 mm due to
June 10, 2012 DRAFT

SUBMITTED TO IEEE TRANSACTIONS ON MEDICAL IMAGING 29
TABLE II
ERRORS OF SELECTED AUTOMATIC 3D MEASUREMENTS BASED ON A FOUR-FOLD CROSS-VALIDATION ON 278 VOLUMES,
INCLUDING THE ERROR OF THE DISTANCE MEASUREMENT (IN MILLIMETERS) FROM CORONARY OSTIA TO THE AORTIC
HINGE PLANE, AND THE ANGLE (IN DEGREES) BETWEEN THE DETECTED AND TRUE AORTIC HINGE PLANE NORMALS.
Left Ostium to Hinge Dist. Right Ostium to Hinge Dist. Hinge Plane Normal
Mean STD Median Mean STD Median Mean STD Median
Measurement Errors 2.10 1.86 1.73 2.51 2.03 2.11 3.68o 3.61o 2.73o
the larger variations in the origin of a coronary artery. After local refinement for each landmark,
the error is significantly reduced. For example, the mean error of the aortic hinges reduces from
3.38 mm to 2.09 mm. The coronary ostia achieve the largest reduction in detection error, from
4.26 mm to 2.07 mm. Again, we have difficulty to compare our accuracy directly against the
errors reported in the literature since different imaging modalities are involved. Fig. 11 shows
the detected valve landmarks in two typical volumes.
Multiple 3D valve measurements can be derived from the segmentation results. Due to the
space limit, we only evaluate the error in measuring the distance from the left and right coronary
ostia to the aortic hinge plane. As shown in Table II, the mean error for measuring the left
coronary ostium to hinge plane distance is 2.10 mm. The right coronary ostium has a larger
mean error of 2.51 mm. The overall distance measurement error is only slightly larger than
the landmark detection errors (2.07 mm for the coronary ostia and 2.09 mm for the aortic
hinges). The aortic hinge plane normal (calculated from the detected aortic hinges) plays an
important role in selecting a proper C-arm angulation, which can affect the tilting of the deployed
prosthetic valve. Therefore, it needs to be estimated accurately. We calculate the angle between
the estimated hinge plane normal and its true value derived from the ground truth. Comment 4As shown in
Table II, the mean angle is 3.68o. A tilting error of 5o is regarded by physicians as almost perfect
(Section VI-B). Our error is within this range, therefore can meet the clinical requirement.
Regarding the segmentation accuracy, we cannot compare our error with those reported in the
literature directly because they used different datasets captured from different imaging modalities.
Most of the previous aorta segmentation methods did not present a quantitative evaluation of the
segmentation accuracy [6], [11], [14], [21], [36], [38] or reported in different error criteria [29],
June 10, 2012 DRAFT

SUBMITTED TO IEEE TRANSACTIONS ON MEDICAL IMAGING 30
Comment 24TABLE III
COMPARISON WITH PREVIOUS AORTA SEGMENTATION METHODS WITH REPORTED QUANTITATIVE MESH ERRORS.
Modality Patients/Subjects Volumes Resolution (mm3) Automatic Speed Mesh
Error
Zhao et al. [17] MRI 10416-25 volumes
/subject1.5× 1.5× 1.5 to2.0× 2.0× 2.0 No
5 min/subject 1.55 mm
Bruijne et al. [40] CT 232 volumes
/subject 0.448× 0.448× 2.0 No450 s
/volume 1.4 mma
Waechter et al. [18] CT 201 volume/subject N/A Yes N/A 0.5 mmb
Proposed MethodC-arm
CT 276319 volumes
in total0.70-0.84isotropic Yes
0.8 s/volume 1.08 mm
a If an aortic aneurysm presents, the outer wall of the aneurysm is segmented, which is more difficult than the aorta lumen.b The mesh error includes the aortic root and the valve leaflets.
[31], [35], [42]. Table III lists the reported aorta mesh errors available in the literature. Roughly,
our accuracy is comparable to the state-of-the-art, e.g., 1.55 mm reported in [17] on 104 MRI
datasets, 1.4 mm reported in [40] on 23 CT datasets, and 0.5 mm reported in [18] on 20 CT
datasets. Most of the previous work on aortic valve landmark detection focus on coronary ostia
to initialize the tracing of coronary arteries in CTA [10]–[14]. In that application, the detection
accuracy is measured as how many coronary arteries have been successfully traced and no
quantitative distance measurements are reported. In [15], all eight aortic valve landmarks are
detected and the overall landmark detection error is 2.28 mm on CT data, which is comparable
to ours. Comment 3In [18], Waechter et al. reported smaller errors in aorta segmentation and valve landmark
detection. For example, the detection error of the left and right coronary ostia are 1.0 mm to
1.2 mm, respectively, resulting is correspondingly smaller 3D measurement errors (0.6 mm to
0.9 mm for ostia-to-hinge-plane distance and 1.8o for hinge plane normal error). The errors are
evaluated on a small CT dataset with 20 volumes and one volume with failed coronary ostium
detection is excluded. For comparison, we do not exclude any detection outliers. Normally, a
cardiac CT has a higher resolution (often around 0.3-0.4 mm for in-slice resolution) than our C-
arm CT (0.70-0.84 mm). Unfortunately, Waechter et al. did not report the volume resolution of
their dataset. If standard high-resolution cardiac CT is used in [18] and the errors are measured
in voxels, our accuracy in aorta segmentation and landmark detection is comparable to [18].
Our approach is computationally efficient, taking about 1.1 seconds (0.8 seconds for aorta
June 10, 2012 DRAFT
SUBMITTED TO IEEE TRANSACTIONS ON MEDICAL IMAGING 31
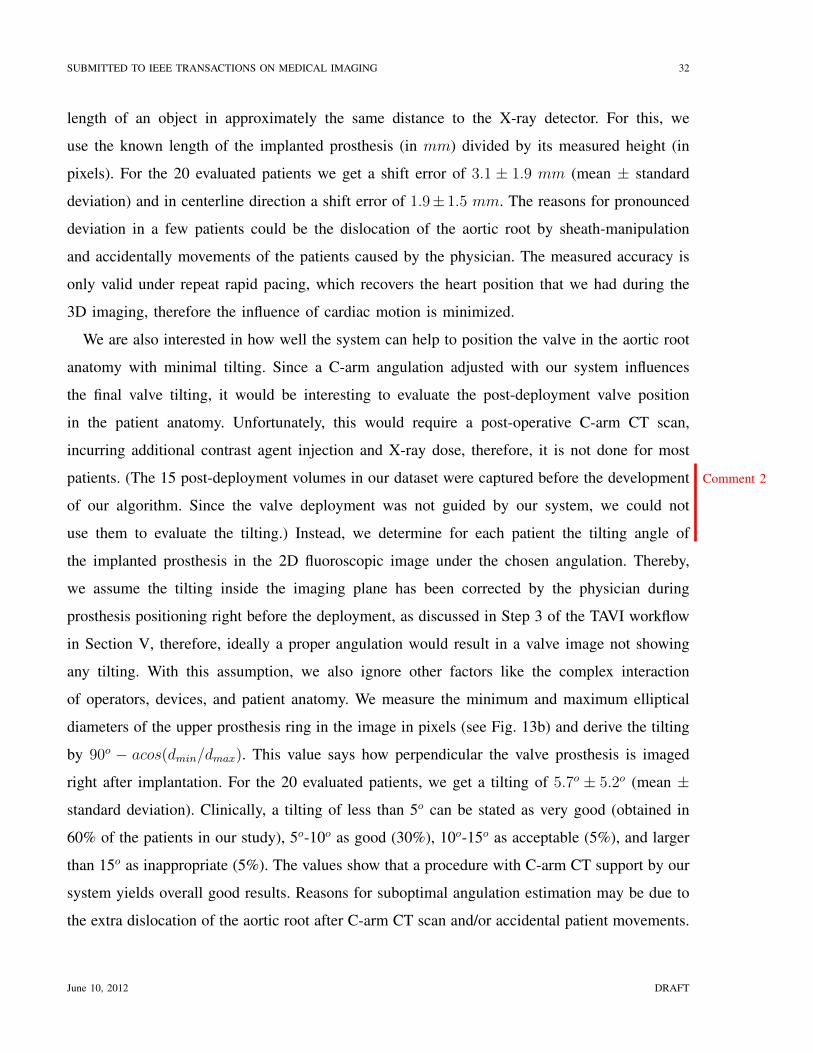
(a) (b) Comment 25
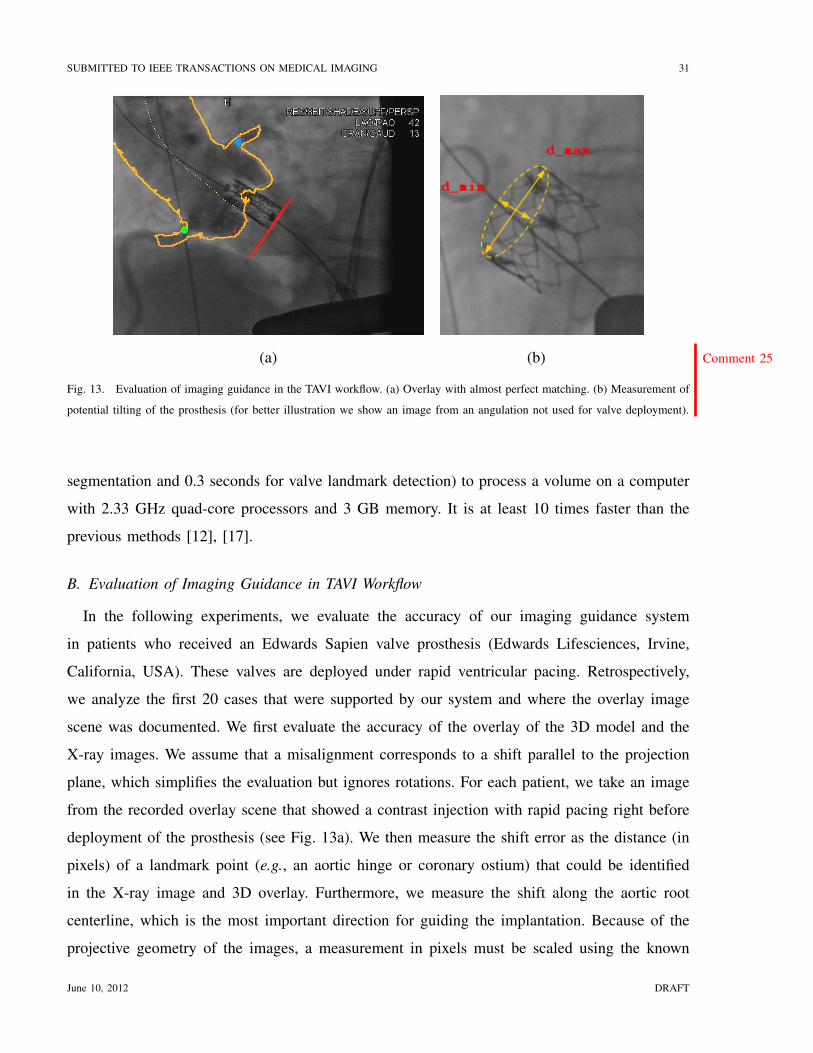
Fig. 13. Evaluation of imaging guidance in the TAVI workflow. (a) Overlay with almost perfect matching. (b) Measurement of
potential tilting of the prosthesis (for better illustration we show an image from an angulation not used for valve deployment).
segmentation and 0.3 seconds for valve landmark detection) to process a volume on a computer
with 2.33 GHz quad-core processors and 3 GB memory. It is at least 10 times faster than the
previous methods [12], [17].
B. Evaluation of Imaging Guidance in TAVI Workflow
In the following experiments, we evaluate the accuracy of our imaging guidance system
in patients who received an Edwards Sapien valve prosthesis (Edwards Lifesciences, Irvine,
California, USA). These valves are deployed under rapid ventricular pacing. Retrospectively,
we analyze the first 20 cases that were supported by our system and where the overlay image
scene was documented. We first evaluate the accuracy of the overlay of the 3D model and the
X-ray images. We assume that a misalignment corresponds to a shift parallel to the projection
plane, which simplifies the evaluation but ignores rotations. For each patient, we take an image
from the recorded overlay scene that showed a contrast injection with rapid pacing right before
deployment of the prosthesis (see Fig. 13a). We then measure the shift error as the distance (in
pixels) of a landmark point (e.g., an aortic hinge or coronary ostium) that could be identified
in the X-ray image and 3D overlay. Furthermore, we measure the shift along the aortic root
centerline, which is the most important direction for guiding the implantation. Because of the
projective geometry of the images, a measurement in pixels must be scaled using the known
June 10, 2012 DRAFT
SUBMITTED TO IEEE TRANSACTIONS ON MEDICAL IMAGING 32
length of an object in approximately the same distance to the X-ray detector. For this, we
use the known length of the implanted prosthesis (in mm) divided by its measured height (in
pixels). For the 20 evaluated patients we get a shift error of 3.1 ± 1.9 mm (mean ± standard
deviation) and in centerline direction a shift error of 1.9± 1.5 mm. The reasons for pronounced
deviation in a few patients could be the dislocation of the aortic root by sheath-manipulation
and accidentally movements of the patients caused by the physician. The measured accuracy is
only valid under repeat rapid pacing, which recovers the heart position that we had during the
3D imaging, therefore the influence of cardiac motion is minimized.
We are also interested in how well the system can help to position the valve in the aortic root
anatomy with minimal tilting. Since a C-arm angulation adjusted with our system influences
the final valve tilting, it would be interesting to evaluate the post-deployment valve position
in the patient anatomy. Unfortunately, this would require a post-operative C-arm CT scan,
incurring additional contrast agent injection and X-ray dose, therefore, it is not done for most
patients. Comment 2(The 15 post-deployment volumes in our dataset were captured before the development
of our algorithm. Since the valve deployment was not guided by our system, we could not
use them to evaluate the tilting.) Instead, we determine for each patient the tilting angle of
the implanted prosthesis in the 2D fluoroscopic image under the chosen angulation. Thereby,
we assume the tilting inside the imaging plane has been corrected by the physician during
prosthesis positioning right before the deployment, as discussed in Step 3 of the TAVI workflow
in Section V, therefore, ideally a proper angulation would result in a valve image not showing
any tilting. With this assumption, we also ignore other factors like the complex interaction
of operators, devices, and patient anatomy. We measure the minimum and maximum elliptical
diameters of the upper prosthesis ring in the image in pixels (see Fig. 13b) and derive the tilting
by 90o − acos(dmin/dmax). This value says how perpendicular the valve prosthesis is imaged
right after implantation. For the 20 evaluated patients, we get a tilting of 5.7o ± 5.2o (mean ±
standard deviation). Clinically, a tilting of less than 5o can be stated as very good (obtained in
60% of the patients in our study), 5o-10o as good (30%), 10o-15o as acceptable (5%), and larger
than 15o as inappropriate (5%). The values show that a procedure with C-arm CT support by our
system yields overall good results. Reasons for suboptimal angulation estimation may be due to
the extra dislocation of the aortic root after C-arm CT scan and/or accidental patient movements.
June 10, 2012 DRAFT

SUBMITTED TO IEEE TRANSACTIONS ON MEDICAL IMAGING 33
VII. CONCLUSION AND FUTURE WORK
In this paper, we presented a fully automatic aorta segmentation and valve landmark detection
system in C-arm CT with applications to transcatheter aortic valve implantation (TAVI). The
system is very fast and on average, taking only 1.1 seconds to process a volume. It is fully
automatic and robust under all kinds of variations observed in a real clinical setting, including
changes in the field-of-view, contrast agent injection, scan timing, and aortic valve regurgitation.
In practice, landmark adjustments are only rarely done by the user. The initial clinical trials
have demonstrated the usefulness of our system in the TAVI workflow, e.g., providing a proper
angulation to avoid large tilting of a prosthetic valve after deployment. Hundreds of TAVI
procedures have been performed under the guidance of our system and live demos on real patients
have been presented at several clinical conferences [58]–[60]. Please refer to the supplemental
video for the application of our system in a real TAVI procedure.
A valuable extension of our system would be the integration of pre-operative conventional
CT images into the TAVI workflow. Our segmentation approach is generic, therefore can be
extended easily to other imaging modalities by simple retraining, without any manual parameter
tuning. A similar automatic detection and segmentation system has been built on cardiac CT data
for surgical planning. Robust 2D/3D registration of the CT model onto real-time fluoroscopy is
required to use CT for visual guidance. An automatic registration algorithm has been proposed
and the preliminary results are promising [61]. Currently, it is under system integration for
clinical evaluation.
REFERENCES
[1] F.T. Billings, S.K. Kodali, and J.S. Shanewise, “Transcatheter aortic valve implantation: Anesthetic considerations,”
Anesthesia and Analgesia, vol. 108, no. 5, pp. 1453–1462, 2009.
[2] M.B. Leon, C.R. Smith, M. Mack, and et al., “Transcatheter aortic-valve implantation for aortic stenosis in patients who
cannot undergo surgery,” The New England Journal of Medicine, vol. 363, no. 17, pp. 1597–1607, 2010.
[3] P. Schoenhagen, J. Hausleiter, S. Achenbach, M.Y. Desai, and E.M. Tuzcu, “Computed tomography in the evaluation for
transcatheter aortic valve implantation (TAVI),” Cardiovascular Diagnosis and Therapy, vol. 1, no. 1, pp. 44–56, 2011.
[4] M.J. Mack, “Does transcatheter aortic valve implantation mean the end of surgical aortic valve replacement?” Texas Heart
Institute Journal, vol. 37, no. 6, pp. 658–659, 2010.
[5] C.R. Smith, M.B. Leon, M.J. Mack, and et al., “Transcatheter versus surgical aortic-valve replacement in high-risk patients,”
The New England Journal of Medicine, vol. 364, no. 23, pp. 2187–2198, 2011.
[6] M. Gessat, D.R. Merk, V. Falk, T. Walther, S. Jacobs, A. Nottling, and O. Burgert, “A planning system for transapical
aortic valve implantation,” in Proc. of SPIE Medical Imaging, vol. 7261, 2009.
June 10, 2012 DRAFT

SUBMITTED TO IEEE TRANSACTIONS ON MEDICAL IMAGING 34
[7] S.-Y. J. Chen, J.D. Carroll, and J.C. Messenger, “Quantitative analysis of reconstructed 3-D coronary arterial tree and
intracoronary devices,” IEEE Trans. Medical Imaging, vol. 21, no. 7, pp. 724–740, 2002.
[8] O. Wink, R. Kemkers, S.-Y. J. Chen, and J.D. Carroll, “Intra-procedural coronary intervention planning using hybrid
3-dimensional reconstruction techniques,” Academic Radiology, vol. 10, no. 12, pp. 1433–1441, 2003.
[9] J.A. Garcia, B. Movassaghi, I.P. Casserly, A.J. Klein, S.-Y. J. Chen, J.C. Messenger, A. Hansgen, O. Wink, B.M. Groves,
and J.D. Carroll, “Determination of optimal viewing regions for X-ray coronary angiography based on a quantitative
analysis of 3D reconstructed models,” Int. J. Cardiovascular Imaging, vol. 25, no. 5, pp. 455–462, 2009.
[10] A. Hennemuth, T. Boskamp, D. Fritz, C. Kuhnel, S. Bock, D. Rinck, M. Scheuering, and H.-O. Peitgen, “One-click
coronary tree segmentation in CT angiographic images,” in Proc. Computer Assisted Radiology and Surgery, 2005, pp.
317–321.
[11] S.C. Saur, C. Kuhnel, T. Boskamp, G. Szkely, and P. Cattin, “Automatic ascending aorta detection in CTA datasets,” in
Proc. Workshop Bildverarbeitung fur der Medizin, 2008, pp. 323–327.
[12] H. Tek, M.A. Gulsun, S. Laguitton, L. Grady, D. Lesage, and G. Funka-Lea, “Automatic coronary tree modeling,” The
Insight Journal, 2008.
[13] C. Wang and O. Smedby, “An automatic seeding method for coronary artery segmentation and skeletonization in CTA,”
The Insight Journal, 2008.
[14] S. Wang, L. Fu, Y. Yue, Y. Kang, and J. Liu, “Fast and automatic segmentation of ascending aorta in MSCT volume data,”
in Proc. Int’l Conf. Image and Signal Processing, 2009, pp. 1–5.
[15] R. Ionasec, B. Georgescu, E. Gassner, S. Vogt, O. Kutter, M. Scheuering, N. Navab, and D. Comaniciu, “Dynamic model-
driven quantification and visual evaluation of the aortic valve from 4D CT,” in Proc. Int’l Conf. Medical Image Computing
and Computer Assisted Intervention, 2008, pp. 686–694.
[16] Y. Zheng, A. Barbu, B. Georgescu, M. Scheuering, and D. Comaniciu, “Four-chamber heart modeling and automatic
segmentation for 3D cardiac CT volumes using marginal space learning and steerable features,” IEEE Trans. Medical
Imaging, vol. 27, no. 11, pp. 1668–1681, 2008.
[17] F. Zhao, H. Zhang, A. Wahle, M.T. Thomas, A.H. Stolpen, T.D. Scholz, and M. Sonka, “Congenital aortic disease: 4D
magnetic resonance segmentation and quantitative analysis,” Medical Image Analysis, vol. 13, no. 3, pp. 483–493, 2009.
[18] I. Waechter, R. Kneser, G. Korosoglou, J. Peters, N.H. Bakker, R.v.d. Boomen, and J. Weese, “Patient specific models for
planning and guidance of minimally invasive aortic valve implantation,” in Proc. Int’l Conf. Medical Image Computing
and Computer Assisted Intervention, 2010, pp. 526–533.
[19] Y. Zheng, M. John, R. Liao, J. Boese, U. Kirschstein, B. Georgescu, S.K. Zhou, J. Kempfert, T. Walther, G. Brockmann,
and D. Comaniciu, “Automatic aorta segmentation and valve landmark detection in C-arm CT: Application to aortic valve
implantation,” in Proc. Int’l Conf. Medical Image Computing and Computer Assisted Intervention, 2010, pp. 476–483.
[20] M. John, R. Liao, Y. Zheng, A. Nottling, J. Boese, U. Kirschstein, J. Kempfert, and T. Walther, “System to guide
transcatheter aortic valve implantations based on interventional 3D C-arm CT imaging,” in Proc. Int’l Conf. Medical
Image Computing and Computer Assisted Intervention, 2010, pp. 375–382.
[21] S. Loncaric, M. Subasic, and E. Sorantin, “3-D deformable model for aortic aneurysm segmentation from CT images,” in
Proc. Annual Int’l Conf. of the IEEE Engineering in Medicine and Biology Society, 2000, pp. 398–401.
[22] M. Subasic, D. Kovacevic, S. Loucaric, and E. Sorantin, “Segmentation of abdominal aortic aneurysm using deformable
models,” in Proc. of East West Vision, 2002, pp. 61–66.
[23] M. de Bruijne, B. van Ginneken, W.J. Niessen, M. Loog, and M.A. Viergever, “Model-based segmentation of abdominal
June 10, 2012 DRAFT

SUBMITTED TO IEEE TRANSACTIONS ON MEDICAL IMAGING 35
aortic aneurysms in CTA images,” in Proc. of SPIE Medical Imaging, vol. 5032, 2003, pp. 1560–1571.
[24] M. de Bruijne, B. van Ginneken, M.A. Viergever, and W.J. Niessen, “Interactive segmentation of abdominal aortic
aneurysms in CTA images,” Medical Image Analysis, vol. 8, no. 2, pp. 127–138, 2004.
[25] S.D. Olabarriaga, J.-M. Rouet, M. Fradkin, M. Breeuwer, and W.J. Niessen, “Segmentation of thrombus in abdominal
aortic aneurysms from CTA with non-parametric statistical grey level appearance modeling,” IEEE Trans. Medical Imaging,
vol. 24, no. 4, pp. 477–485, 2005.
[26] K.J. Kirchberg, A. Wimmer, and C.H. Lorenz, “Modeling the human aorta for MR-driven real-time virtual endoscopy,” in
Proc. Int’l Conf. Medical Image Computing and Computer Assisted Intervention, 2006, pp. 470–477.
[27] T. Kovacs, P. Cattin, H. Alkadhi, S. Wildermuth, and G. Szekel, “Automatic segmentation of the vessel lumen from 3D
CTA images of aortic dissection,” in Proc. Workshop Bildverarbeitung fur der Medizin, 2006, pp. 161–165.
[28] ——, “Automatic segmentation of the aortic dissection membrane from 3D CTA images,” in Proc. Medical Imaging and
Augmented Reality, 2006, pp. 317–324.
[29] V. Galante, C. Corsi, F. Veronesi, V. Russo, R. Fattori, and C. Lamberti, “Dynamic characterization of aorta morphology
and function in presence of an aneurysm,” in Proc. Computers in Cardiology, vol. 34, 2007, pp. 765–678.
[30] J. Egger, T. O’Donnel, C. Hopfgartner, and B. Freisleben, “Graph-based tracking method for aortic thrombus segmentation,”
in Proc. European Conference of the International Federation for Medical and Biological Engineering, 2008, pp. 584–587.
[31] J. Egger, B. Freisleben, R. Setser, R. Renapuraar, C. Biermann, and T. O’Donnel, “Aorta segmentation for stent simulation,”
in Proc. MICCAI Workshop on Cardiovascular Interventional Imaging and Biophysical Modeling, 2009.
[32] J. Dehmeshki, H. Amin, M. Ebadian-Dehkordi, A. Jouannic, and S. Qanadi, “Automatic detection, segmentation
and quantification of abdominal aortic aneurysm using computed tomography angiography,” in Proc. Medical Image
Understanding and Analysis, 2009.
[33] C. Kauffmann, A. Tang, A. Dugas, E. Therasse, V. Oliva, and G. Soulez, “Clinical validation of a software for quantitative
follow-up of abdominal aortic aneurysm maximal diameter and growth by CT angiography,” European Journal of Radiology,
vol. 77, pp. 502–508, 2011.
[34] U. Kurkure, O.C. Avila-Montes, and I.A. Kahadiaris, “Automated segmentation of thoracic aorta in non-contrast CT
images,” in Proc. IEEE Int’l Sym. Biomedical Imaging, 2008, pp. 29–32.
[35] A.O. Al-Agamy, N.F. Osman, and A.S. Fahmy, “Segmentation of ascending and descending aorta from magnetic resonance
flow images,” in Cairo International Biomedical Engineering Conference, 2010, pp. 41–44.
[36] S.S. Giri, Y. Ding, Y. Nishijima, A. Pedraza-Toscano, P.M. Burns, R.L. Hamlin, and O.P. Simonetti, “Automated and
accurate measurement of aortic pulse wave velocity using magnetic resonance imaging,” in Proc. Computers in Cardiology,
vol. 34, 2007, pp. 661–664.
[37] M.E. Karar, M. Gesset, T. Walther, O. Falk, and O. Burgert, “Towards a new image guidance system for assisting transapical
minimally invasive aortic valve implantation,” in Proc. Annual Int’l Conf. of the IEEE Engineering in Medicine and Biology
Society, 2009, pp. 3645–3648.
[38] K. Krissian, J. Ellsmere, K. Vosburgh, R. Kikinis, and C.-F. Westin, “Multiscale segmentation of the aorta in 3D ultrasound
images,” in Proc. Annual Int’l Conf. of the IEEE Engineering in Medicine and Biology Society, 2003, pp. 638–641.
[39] T. Behrens, K. Rohr, and H.H. Stiehl, “Robust segmentation of tubular structures in 3-D medical images by parametric
object detection and tracking,” IEEE Trans. Syst., Man, Cybern. B, vol. 33, no. 14, pp. 554–561, 2003.
[40] M. de Bruijne, B. van Ginneken, M.A. Viergever, and W.J. Niessen, “Adapting active shape models for 3D segmentation
of tubular structures in medical images,” in Proc. Information Processing in Medical Imaging, 2003, pp. 136–147.
June 10, 2012 DRAFT

SUBMITTED TO IEEE TRANSACTIONS ON MEDICAL IMAGING 36
[41] D. Lesage, E.D. Angelini, I. Bloch, and G. Funka-Lea, “A review of 3D vessel lumen segmentation techniques: Models,
features and extraction schemes,” Medical Image Analysis, vol. 13, no. 6, pp. 819–845, 2009.
[42] D. Rueckert, P. Burger, S.M. Forbat, R.D. Mohiaddin, and G.Z. Yang, “Automatic tracking of the aorta in cardiovascular
MR images using deformable models,” IEEE Trans. Medical Imaging, vol. 16, no. 5, pp. 581–590, 1997.
[43] M. Rogers and J. Graham, “Robust active shape model search,” in Proc. European Conf. Computer Vision, 2002, p. ??,
298.
[44] S. Sun, C. Bauer, and R. Beichel, “Automated 3-D segmentation of lungs with lung cancer in CT data using a novel robust
active shape model approach,” IEEE Trans. Medical Imaging, vol. 31, no. 2, pp. 449–460, 2012.
[45] K. Lekadir, R. Merrifield, and G.-Z. Yang, “Outlier detection and handling for robust 3-D active shape model search,”
IEEE Trans. Medical Imaging, vol. 26, no. 2, pp. 212–222, 2007.
[46] J. Peters, O. Ecabert, C. Lorenz, J. von Berg, M.J. Walker, T.B. Ivanc, M. Vembar, M.E. Olszewski, and J. Weese,
“Segmentation of the heart and major vascular structures in cardiovascular CT images,” in Proc. of SPIE Medical Imaging,
vol. 6914, 2008.
[47] O. Ecabert, J. Peters, M.J. Walker, T. Ivanc, C. Lorenz, J. von Berg, J. Lessick, M. Vembar, and J. Weese, “Segmentation
of the heart and great vessels in CT images using a model-based adaptation framework,” Medical Image Analysis, vol. 15,
no. 6, pp. 863–876, 2011.
[48] R.I. Ionasec, I. Viogt, B. Georgescu, Y. Wang, H. Houle, F. Vega-Higuera, N. Navab, and D. Comaniciu, “Patient-specific
modeling and quantification of the aortic and mitral valves from 4D cardiac CT and TEE,” IEEE Trans. Medical Imaging,
vol. 29, no. 9, pp. 1636–1651, 2010.
[49] M.V. Navkar, E. Yeniaras, D.J. Shah, N.V. Tsekos, and Z. Deng, “Extracting geometric features of aortic valve annulus
motion from dynamic MRI for guiding interventions,” in Proc. IEEE Int’l Sym. Biomedical Imaging, 2011, pp. 1302–1305.
[50] H.E. Karar, M. John, D. Holzhey, V. Falk, F. Mohr, and O. Burgert, “Model-updated image-guided minimally invasive
off-pump transcatheter aortic valve implantation,” in Proc. Int’l Conf. Medical Image Computing and Computer Assisted
Intervention, 2011.
[51] P. Viola and M. Jones, “Rapid object detection using a boosted cascade of simple features,” in Proc. IEEE Conf. Computer
Vision and Pattern Recognition, 2001, pp. 511–518.
[52] T.F. Cootes, C.J. Taylor, D.H. Cooper, and J. Graham, “Active shape models—their training and application,” Computer
Vision and Image Understanding, vol. 61, no. 1, pp. 38–59, 1995.
[53] Y. Zheng, B. Georgescu, H. Ling, S.K. Zhou, M. Scheuering, and D. Comaniciu, “Constrained marginal space learning
for efficient 3D anatomical structure detection in medical images,” in Proc. IEEE Conf. Computer Vision and Pattern
Recognition, 2009, pp. 194–201.
[54] G. Taubin, “Optimal surface smoothing as filter design,” in Proc. European Conf. Computer Vision, 1996, pp. 283–292.
[55] I.L. Dryden and K.V. Mardia, Statistical Shape Analysis. John Wiley, Chichester, 1998.
[56] J. Kempfert, V. Falk, G. Schuler, A. Linke, D.R. Merk, F.W. Mohr, and T. Walther, “Dyna-CT during minimally invasive
off-pump transapical aortic valve implantation,” Ann Thorac Surg., vol. 88, no. 6, p. 2041, 2009.
[57] M. Zellerhoff, B. Scholz, E.-P. Ruehrnschopf, and T. Brunner, “Low contrast 3D reconstruction from C-arm data,” in Proc.
of SPIE Medical Imaging, vol. 5745, 2005.
[58] 23rd Annual Meeting of European Association for Cardio-Thoracic Surgery, Vienna, Austria, October 17-21 2009.
[59] 59th Annual Scientific Session of American College of Cardiology, Atlanta, Georgia, USA, March 13-16 2010.
June 10, 2012 DRAFT

SUBMITTED TO IEEE TRANSACTIONS ON MEDICAL IMAGING 37
[60] 23rd Annual Scientific Symposium of Transcatheter Cardiovascular Therapeutics, San Francisco, California, USA,
November 7-11 2011.
[61] S. Miao, R. Liao, and Y. Zheng, “A hybrid method for 2-D/3-D registration between 3-D volumes and 2-D angiography
for trans-catheter aortic valve implantation (TAVI),” in Proc. IEEE Int’l Sym. Biomedical Imaging, 2011, pp. 1215–1218.
June 10, 2012 DRAFT