automatic detection of left and right ventricles from cta
TRANSCRIPT

Automatic detection of left and right ventriclesfrom CTA enables efficient alignment of anatomywith myocardial perfusion dataMarina Piccinelli, Emory UniversityTracy L. Faber, Emory UniversityChesnal D. Arepalli, Emory UniversityVikram Appia, Georgia Institute of TechnologyJakob Vinten-Johansen, Emory UniversitySusan L. Schmarkey, Emory UniversityRussell Folks, Emory UniversityErnest Garcia, Emory UniversityAnthony Yezzi, Georgia Institute of Technology
Journal Title: Journal of Nuclear CardiologyVolume: Volume 21, Number 1Publisher: Springer Verlag (Germany) | 2014-02-01, Pages 96-108Type of Work: Article | Post-print: After Peer ReviewPublisher DOI: 10.1007/s12350-013-9812-1Permanent URL: https://pid.emory.edu/ark:/25593/rwgzv
Final published version: http://dx.doi.org/10.1007/s12350-013-9812-1
Copyright information:© American Society of Nuclear Cardiology 2013.
Accessed January 15, 2022 2:51 PM EST

Automatic Detection of Left and Right Ventricles from CTA Enables Efficient Alignment of Anatomy with Myocardial Perfusion Data
Marina Piccinelli1, Tracy L. Faber1,†, Chesnal D. Arepalli1, Vikram Appia2, Jakob Vinten-Johansen3, Susan L. Schmarkey3, Russell D. Folks1, Ernest V. Garcia1, and Anthony Yezzi2
1Department of Radiology and Imaging Sciences, Emory University, Atlanta, GA, US
2Electrical Engineering, Georgia Institute of Technology, Atlanta, GA, US
3Division of Cardiothoracic Surgery, Emory University, Atlanta, GA, US
Abstract
Background—Accurate alignment between cardiac CT angiographic studies (CTA) and nuclear
perfusion images is crucial for improved diagnosis of coronary artery disease. This study evaluated
in an animal model the accuracy of a CTA fully automated biventricular segmentation algorithm, a
necessary step for automatic and thus efficient PET/CT alignment.
Methods and Results—Twelve pigs with acute infarcts were imaged using Rb-82 PET and 64-
slice CTA. Post-mortem myocardium mass measurements were obtained. Endocardial and
epicardial myocardial boundaries were manually and automatically detected on the CTA and both
segmentations used to perform PET/CT alignment. To assess the segmentation performance,
image-based myocardial masses were compared to experimental data; the hand-traced profiles
were used as a reference standard to assess the global and slice-by-slice robustness of the
automated algorithm in extracting myocardium, LV and RV. Mean distances between the
automated and the manual 3D segmented surfaces were computed. Finally, differences in rotations
and translations between the manual and automatic surfaces were estimated post PET/CT
alignment. The largest, smallest, and median distances between interactive and automatic surfaces
averaged 1.2±2.1, 0.2±1.6, and 0.7±1.9mm. The average angular and translational differences in
CT/PET alignments were 0.4°, −0.6° and −2.3° about x, y and z axes, and 1.8, −2.1, and 2.0 mm in
x, y and z directions.
Corresponding Author. Marina Piccinelli, PhD, Department of Radiology and Imaging Sciences, 101 Woodruff Circle, Room 1203C, Emory University, Atlanta 30322, Georgia, US, [email protected], Telephone: +1 404.727.6113, Fax: +1 404.727.3488.†Dr. Tracy L. Faber, this project’s principal investigator, passed away on March 24, 2012.
NEW KNOWLEDGE GAINEDThe automated segmentation of the myocardium from CTA acquisitions allows in a single display reliable fusion of anatomical CTA information and physiological myocardial perfusion information.
Conflicts of InterestSome of the authors (EG, RF, TF) receive royalties from the sale of the Emory Cardiac Toolbox and have equity positions with Syntermed, Inc., which markets ECTb. The terms of these arrangements have been reviewed and approved by Emory University in accordance with its conflict of interest policies.The remaining authors do not have any conflicts of interest.
HHS Public AccessAuthor manuscriptJ Nucl Cardiol. Author manuscript; available in PMC 2017 January 03.
Published in final edited form as:J Nucl Cardiol. 2014 February ; 21(1): 96–108. doi:10.1007/s12350-013-9812-1.
Author M
anuscriptA
uthor Manuscript
Author M
anuscriptA
uthor Manuscript

Conclusions—Our automatic myocardial boundary detection algorithm creates surfaces from
CTA that are similar in accuracy and provide similar alignments with PET as those obtained from
interactive tracing. Specific difficulties in a reliable segmentation of the apex and base regions will
require further improvements in the automated technique.
INTRODUCTION
In recent years, three-dimensional (3D) fusion of multislice CT angiography (CTA) and
myocardial perfusion imaging (MPI) for the assessment of coronary artery disease (CAD)
has proven its incremental diagnostic value over the two modalities separately considered
(1–5). Myocardial perfusion imaging (MPI) with either PET or SPECT is an established
method for the assessment of the functional significance of coronary stenosis (6,7), while
CTA provides the complementary morpho-anatomical information on the heart structure, the
coronary tree configuration and the location of stenosis, information that is otherwise
unavailable to the physician (8,9). By visually fusing these two types of knowledge,
clinicians are provided with tools to better interpret complex situations of multiple perfusion
defects, to identify the direct cause of abnormalities and conversely, to spare patients
unnecessary invasive exams in case of non-critical lesions (4,5,10).
A number of technical issues have to be addressed for this integration to become a reliable
and efficient tool for everyday use in a clinical environment. In a previous work published
by our group (11), an algorithm for the automated alignment of MPI and CTA images
obtained from different scanners was presented. Both left (LV) and right (RV) ventricles
were manually identified on the two datasets, binary images were created and successively
aligned using mutual information principles (12). Since the reference standard remains
manual registration, a comparison of automated versus interactive alignments was conducted
and no significant differences were observed.
A crucial prerequisite for the proposed alignment algorithm is the availability of myocardial
tomograms from the CTA and MPI images. Manual tracings are considered the reference
standard, but exhibit the fundamental drawback of being time-consuming and more
importantly operator-dependent. While tools for automated quantitative MPI are readily
available (6,7,13), researchers have been working for decades on efficient methods to
segment cardiac CT (or MR) (14,15,16). Promising methodologies for the automated
extraction of complex anatomical structures rely on the use of model-based segmentation
algorithms and on their capability of incorporating prior information about the features of
the object to be delineated (17,18). Following this approach, a level set region-based
algorithm for the automated detection of LV and RV edges was developed (19,20). The
segmentation is constrained by local shape priors retrieved from the statistical analysis of a
training datasets and was successfully tested on synthetic images as well as on cardiac
acquisitions for myocardium extraction in both 3 and 4D.
With the final rationale of proposing a completely automated procedure for 3D image
fusion, the aim of this work was two-fold: first the accuracy of the proposed automated edge
detection algorithm was assessed in an animal model on a set of contrast-enhanced CTA
images; manual segmentation was also performed by an expert user and considered as the
Piccinelli et al. Page 2
J Nucl Cardiol. Author manuscript; available in PMC 2017 January 03.
Author M
anuscriptA
uthor Manuscript
Author M
anuscriptA
uthor Manuscript

reference standard for the myocardium delineation of both LV and RV. Secondly, perfusion
images were aligned to the CTA acquisitions by means of our published second-generation
biventricular fusion technique (11) using both the automatically segmented and the manually
traced myocardial contours. Differences in translations and rotations between the two
resulting alignments were estimated, with the registration of the manual tracings taken as the
reference standard.
MATERIAL AND METHODS
Animal Selection and Preparation
Twelve female Yorkshire cross farm-bred pigs were obtained from North Carolina; their
average weight ranged 35–40 kg. Before image acquisitions acute myocardial infarcts were
created in either the left anterior descending artery (LAD) or left circumflex artery (LCX)
vascular territories of each animal by means of a previously described angiographic
technique (21). The animals were transported to the scanner room and intubated.
Appropriate animal care was provided according to norms/standard protocols approved at
our Institution, i.e. Institutional Animal care and Use Committee (IACUC) of Emory
University. Vascular accesses at the femoral artery and the femoral vein were created and the
perfusion defects produced by administering a predefined number of 25µm sterile
microspheres to embolize the target microvasculature (21). After the intervention, the
animals were first stabilized and successively imaged by both positron emission tomography
(PET) for perfusion analysis and CTA for morpho-anatomical assessment.
Imaging Acquisitions
PET Imaging—PET imaging was performed before the CT study. The animal was placed
on the table in the supine position. A transmission scan was performed using the CT portion
of a CT/PET scanner. Immediately afterwards, a resting IV injection of 50mCi Rb-82 was
given. Each animal was then scanned using the acquisition protocols described for patients
in the PET guidelines of the American Society of Nuclear Cardiology (22). All PET images
were reconstructed using iterative techniques with attenuation correction.
CTA Imaging—Immediately after PET, the animal was taken for a CTA examination.
According to our institutional protocol, the animal was placed in a supine position, head-first
position on the scanner gantry. A three-lead ECG was used and no heart rate controlling
medications or nitroglycerin were used during the examination. For injection of contrast, an
IV access was secured through the existing catheter in the femoral vein and a bi-phasic
injection protocol with dual-head power injector was used. Non-ionic iodinated contrast
(Isovue 370 mg·mL−1, Bracco) was used for both bolus test and angiographic examination.
For bolus test, pure contrast of about 20 ml was injected at a rate of 5 mL·second−1 followed
by contrast-saline mix (30% contrast + 70% saline) of about 30 mL. For the CTA study, the
amount of undiluted contrast to be administered at the rate of 5 mL·second−1 was calculated
on the base of the peak enhancement obtained by the previous bolus test technique.
Thereafter a saline flush of 30 mL of contrast-saline mix for 6 seconds at 5 mL·second−1
was given. Time to peak enhancement ranged between 9 and 11 seconds, accounting for a
total amount of contrast injected ranging between 70 and 90 mL.
Piccinelli et al. Page 3
J Nucl Cardiol. Author manuscript; available in PMC 2017 January 03.
Author M
anuscriptA
uthor Manuscript
Author M
anuscriptA
uthor Manuscript

A retrospective ECG triggered dual-source CT (Somaton Definition, Siemens Medical
Systems, Forchheim, Germany) was used to perform the cardiac CT examinations with tube
modulation technique. CTA began with respiratory termination with a cranio-caudal
acquisition and the following parameters: gantry rotation time of 0.33 second; tube voltage
of 120 Kvp; tube current of 400–500 mAs; adaptable pitch based on the animal heart rate;
detector collimation 2 × 32; image slice thickness of 0.75 mm with reconstruction increment
of 0.4 mm single-segment reconstruction algorithm, which would result in a temporal
resolution of 83 ms medium-to-smooth (B26f) kernel. All CTA datasets were reconstructed
at best diastole and best systole; a different phase was selected if motion artifacts were
noticed. In plane image resolution ranged between 0.19 × 0.19 to 0.49 × 0.49 mm. Image
datasets were finally processed on a separate workstation (ADW 4.2 General Electric
Medical System, Milwaukee, WI).
CTA Myocardial Segmentation
As a proof of concept and since no ventricular function was performed on the base of the
CTA images, only one dataset between the acquired best systole and best diastole phase was
chosen and used to test the performance of the algorithms, including comparing automatic to
manually extracted volumes in this non-standard phase. All selected CTA datasets were
resampled to obtain isotropic voxel dimensions of 1.0 × 1.0 × 1.0 mm.
Interactive manual tracings of the epicardium and endocardium were carried out for all the
animals by means of in-house developed software for each CTA acquisition. LV and RV
were both delineated by an expert user.
Automatic myocardial segmentation was also performed in each case according to the level
set model-based algorithm developed by our collaborators (19,20). The mathematical and
technical details of the algorithms can be retrieved in the referenced papers and do not
represent the focus of the present manuscript; here, we only briefly describe the main steps
of this automated procedure. A set of the same 12 pigs CTA studies were used as training
images and were manually segmented by expert users in order to identify myocardial edges
and characterize their shape variations. The leave-one-out method of training was then
implemented in processing each of the pigs’ studies prospectively. This process consisted in
training the automatic segmentation algorithm with 11 animal studies and applying the
training to extract the contours of the 12th pig not included in the training set. This design
was repeated for each pig. A crucial task of the level set model-based approach was also to
identify and accordingly label different regions of the object to be segmented, i.e. the
myocardium, depending on the amount of useful information contained in these regions. As
low contrast issues may prevent a clear delineation of the edges separating the myocardium
from surrounding tissues or, for some acquisitions, from the blood pool, the definition of
these target masks allows the algorithm to differently weight during the segmentation the
areas with fuzzy or corrupted boundaries from those with greater reliability (e.g. the RV
myocardium is more difficult to segment that the LV one). A level set formulation (17) was
used to represent both the training shapes and the reliability masks, and local Principal
Component Analysis (PCA) was performed on both sets to obtain shape priors and mask
priors within each image region. The actual segmentation was eventually achieved in two
Piccinelli et al. Page 4
J Nucl Cardiol. Author manuscript; available in PMC 2017 January 03.
Author M
anuscriptA
uthor Manuscript
Author M
anuscriptA
uthor Manuscript

steps. First the segmenting curve was evolved under the effects of a linear combination of
local shape and mask priors in each region; successively the resulting curves were combined
to obtain a global hybrid segmentation curve that evolved on the entire image domain.
From this automatic process 3D meshes were generated representative of the biventricular
myocardium. Similar 3D meshes were generated from the hand-traced data. Figure 1
illustrates an example of a mesh generated from the hand traced procedure and compares it
to the automated mesh for one of the analyzed CT image sets.
PET Myocardial Segmentation
In a separate independent process, the LV chamber was identified from the PET images
using endocardial and epicardial boundaries generated by our previously published
automated methods, which are part of the Emory Cardiac Toolbox (ECTb) (13, 23). Briefly,
mid-myocardial LV points are obtained from the maximal count quantification algorithm
and endo/epi LV surfaces are modeled at a fixed distance from these locations.
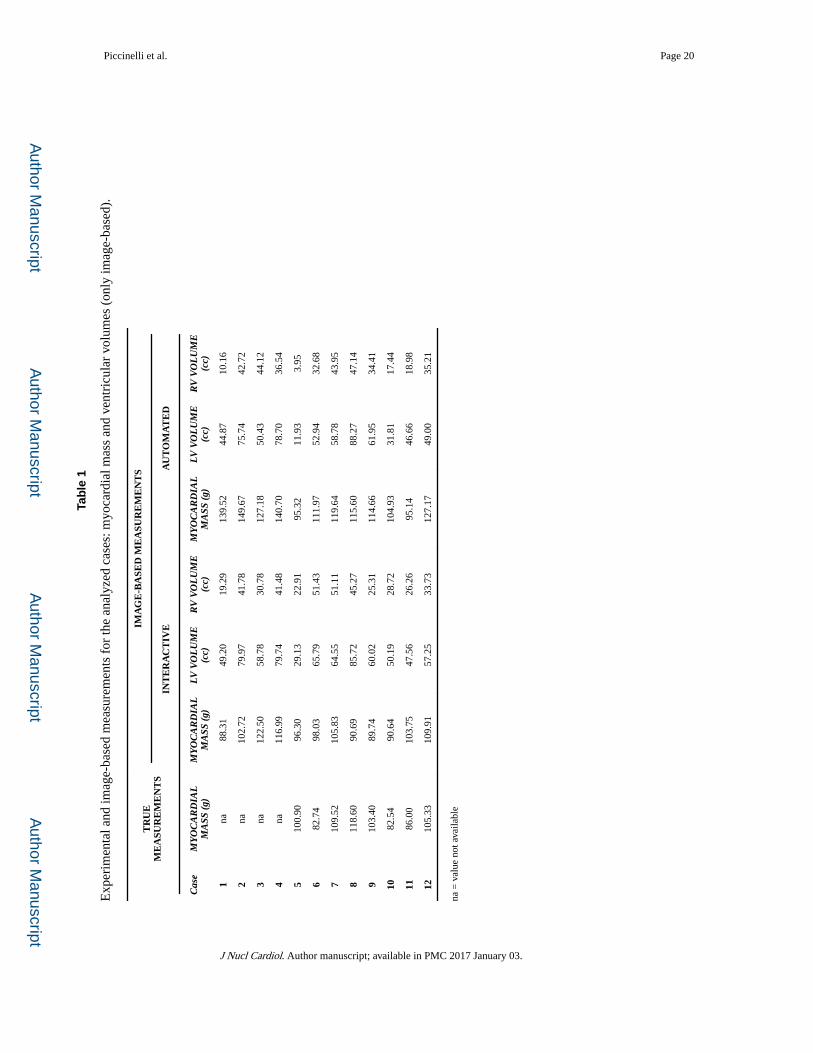
Myocardial Mass and Ventricle Volumes Extraction
Experimental Mass Measures—After the imaging procedures were completed, post-
mortem ventricular mass measures were obtained separately for LV and RV in 8 out of 12
pigs to validate the automatic and manual CT boundaries detection. In 4 cases the
measurements were not available: 2 pigs died on the scanning table and in the remaining 2
the area of infarct was either not large enough to be accurately measured or not visible at all.
Their hearts were consequently not excised and mass measurements were not included in the
present study.
Image-Based Measures—For each case two 3D binary mask images were created, one
representing the heart manual segmentation and one the automated. The masks covered the
same volume of interest, had the same dimensions and spatial resolution and were
consequently directly comparable. Myocardium total volumes and masses were computed
for the two segmentation modalities, the mass being calculated as the volume multiplied by
a density factor of 1.05 g·mL−1 (13). Since both epicardial and endocardial boundaries were
extracted, LV and RV total volumes were also computed to assess the algorithm robustness
with respect to blood pools identification. In addition to global masses and volumes, slice-
by-slice measures of myocardium mass, RV and LV volumes were computed
Comparison of Segmentation Techniques—The performance of the two
segmentation techniques was assessed for the 8 available cases by comparing total
myocardial image-based masses to experimental measures. For each couple of comparisons
– true versus interactive and true versus automated – paired Student’s t test, Pearson
correlation, Bland-Altman analysis and standard estimation error (SEE) computation were
performed. The image-based results were also compared to each other in terms of total
myocardium masses as well as of LV and RV volumes with the same statistical techniques.
Slice-by-slice agreement of myocardium mass and ventricles volume was assessed by means
of Pearson’s correlation within each case and for all the slices. Whenever applied a P value =
0.5 was used as threshold for statistical significance.
Piccinelli et al. Page 5
J Nucl Cardiol. Author manuscript; available in PMC 2017 January 03.
Author M
anuscriptA
uthor Manuscript
Author M
anuscriptA
uthor Manuscript

To further evaluate the accuracy of the automatically detected mesh with respect to hand-
traced ones, a boundary error was defined as the point-to-point distance between the two 3D
surface meshes created on the basis of the planar profiles (23). Particularly, the largest, the
smallest and the median distances between interactive and automatic endocardial and
epicardial surfaces were calculated.
PET/CT Automatic Alignment
Our automatic technique for CT and MPI fusion has been previously described and tested
(11). Briefly, once the LV/RV endo/epi structure was segmented on CTA acquisitions, a
binary mask was created, the left and right ventricles separated and the short axis identified
on the CTA acquisition based on the LV chamber symmetry axis. PET LV short-axis binary
images were also provided by the ECTb techniques and an initial rigid alignment performed
between the LV CTA and LV PET masks. The re-oriented CTA mask with both left and right
ventricles was then used to mask the original MPI and eliminate bright extracardiac objects.
The resulting MPI was finally aligned to the short-axis CT according to mutual information
principles. In Figure 2 the case example used in Figure 1 is displayed to exhibit the final
result of PET/CT alignment according to the proposed algorithms; the manually segmented
mask was employed.
The fusion of the CT to the PET acquisition was completed twice for each animal, once
using the hand-traced profiles and once with the automatically extracted ones. Since the
manual segmentation is considered the reference standard, the PET/CT alignment performed
with the hand-traced mask was considered as the reference as well (11). Differences in
alignment due to the use of the automatically segmented CTA myocardium instead of the
manual ones were evaluated in terms of rotations around x, y and z axes and translations in
the x, y and z directions between the two aligned CTs.
RESULTS
CT Automatic versus Manual Segmentation
Manual and automated segmentations were performed for all 12 CTA acquisitions. In most
of the cases the best systolic phase was selected for the subsequent image processing steps
after evaluation of a CTA expert. From the binary images, 3D triangulated meshes were
created so that two endocardial and two epicardial surfaces were available for each case. The
boundary distance error between automated and hand-traced meshes after alignment in all
12 animals exhibited maximum, minimum and median values of 1.2 ± 2.1, 0.2 ± 1.6, and 0.7
± 1.9 mm, respectively.
Experimental measures for the myocardial mass were available in 8 cases, while image-
based myocardial mass and ventricular volumes were computed for all 12 cases. In Table 1
all the measurements are reported. In Figure 3, left scatter plots and linear regression lines
are displayed for the comparisons between true measures versus image-based and for the
automatic versus interactive correlation for the myocardial mass determination. Pearson’s
coefficients and P values were as follows: RTrue vs Interactive = 0.029, P value = 0.93, SEE =
7.20; RTrue vs Automated = 0.52, P value < 0.05, SEE = 9.08; R Interactive vs Automated = 0.32; P
Piccinelli et al. Page 6
J Nucl Cardiol. Author manuscript; available in PMC 2017 January 03.
Author M
anuscriptA
uthor Manuscript
Author M
anuscriptA
uthor Manuscript
value < 0.05, SEE = 15.85. Figure 4 (left) displays scatter plots and correlation for right and
left ventricular volume identification between the two segmentation modalities. For the LV
measurements RInteractive vs Automated = 0.96, P value < 0.05, SEE = 5.59, while for the RV,
RInteractive vs Automated = 0.72, P value = 0.17, SEE = 9.59. Bland-Altman analysis was
performed to further assess to level of agreement of image-based results with experimental
measures and between the two segmentation modalities (Figure 3 (right for myocardial
mass) and Figure 4 (right for ventricular volumes)).
Stronger correlations between image-based measures were determined when slice-by-slice
comparisons were considered. In Figure 5A–C (top) myocardial mass and ventricular
volumes are plotted by pooling together all image slices for all cases. Pearson’s coefficients
were for the myocardial mass, the LV and RV volumes respectively 0.88, 0.98 and 0.85;
SEEs were respectively 0.48, 0.14 and 0.24. Qualitative and quantitative comparison of
slice-by-slice agreement also showed that major discrepancies between interactive and
automated profiles were present at the hearts' base and apex. Each couple of masks was
separated in two domains: one for slices associated with the heart base and apex, and one for
the central portion of the organ; apex and base segments were identified as 10% of total
heart slices at the bottom and 10% at the top of the images. In Figure 5A–C, the apex and
base slices (middle) and the central slices (bottom) are plotted separately. Pearson’s
coefficients were for the myocardial mass Rcentral = 0.73, SEE = 0.39 and Rapex/base = 0.23,
SEE = 0.64; for the LV volume Rcentral = 0.96, SEE = 0.16 and Rapex/base = 0.27, SEE =
0.12; for the RV volume Rcentral = 0.83, SEE = 0.26 and Rapex/base = 0.34, SEE = 0.50.
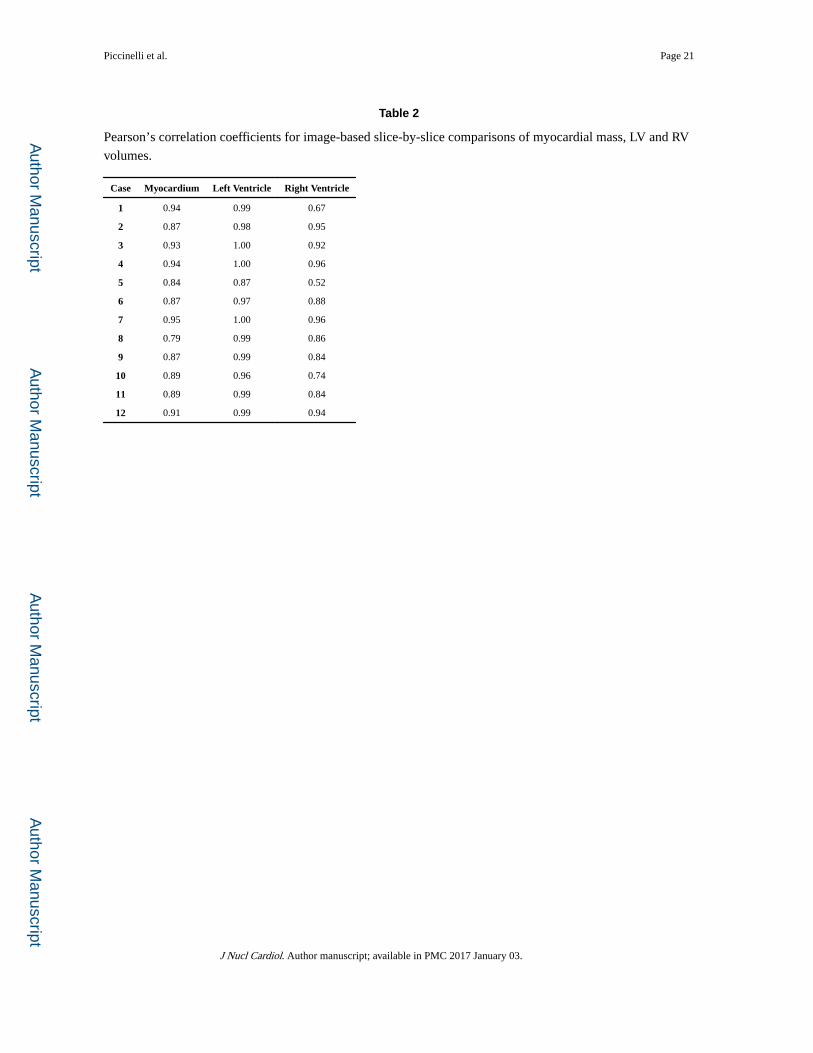
Slice-by-slice comparisons were performed also within each case. Table 2 provides the
Pearson’s coefficients for myocardium, LV and RV for each case. In Figure 6 for some of
the analyzed cases, automated versus interactive profiles extracted from different segments
of the heart extension, i.e. from the apex, the central portion and the base, are displayed as
examples: in Figure 6A, B different levels of agreement are shown at the apex, commonly
good in the middle and rather poor at the base; Figure 6C shows case #5 for which the
agreement was rather poor along the whole image extension. In this particular case, image
artifacts were in fact visible along the whole CT acquisition affecting the automated
algorithm performance.
PET/CT Alignment with Automatic versus Manual Segmentation
The alignment of PET and CT images was successfully performed for each case using both
the automatically detected myocardial mesh and the hand-traced mesh. Figure 7 qualitatively
compares for one of the analyzed cases oblique angle tomographic orientations of the results
of aligning the PET cardiac count distribution with the hand-traced (top) CT mesh and with
the automatically detected CT myocardial mesh. For a more quantitative assessment, Table 3
reports the differences in terms of rotations around the X, Y and Z and translation in X, Y
and Z directions between the two alignments for all 12 animals.
DISCUSSION
Despite the continuous improvement in non-invasive imaging techniques, the reference
standard for the clinical assessment of CAD still relies on invasive testing such as coronary
Piccinelli et al. Page 7
J Nucl Cardiol. Author manuscript; available in PMC 2017 January 03.
Author M
anuscriptA
uthor Manuscript
Author M
anuscriptA
uthor Manuscript

arteriography. The usefulness of image fusion of CTA and nuclear perfusion for the creation
of a more complete picture of the patient’s heart condition that could avoid invasive
procedure may be widely accepted and recognized, but due to the lack of automation for
some of the necessary image processing steps, the clinical application of multimodality
image frameworks is still limited and requires additional efforts towards robustness and
accuracy.
In this study, we determined in an animal model the favorable accuracy of the automated
detection of biventricular myocardial surfaces from CTA acquisitions (20) as compared to
manual tracings taken as reference standard. and their usage for the automated alignment of
CT myocardial images with PET myocardial perfusion by way of our previously developed
algorithms for multimodality image registration (11). The reliability of the automatic
segmentation was determined by comparing the radial boundary differences between the
automatically extracted myocardial surfaces to those hand-traced by an expert, while the
accuracy of the registration of the automatic segmentation was assessed in terms of rotation
and translation between these CT surfaces after alignment with PET studies.
Different sets of comparisons were performed. The use of an animal model allowed us to
obtain myocardial masses from the animal excised organs and to directly compare them to
the image-based results. The comparison of the image-based myocardial masses with the
true values eventually exhibited rather poor correlations (Figure 3) as compared also with
published literature particularly when CT is compared to MRI [24, 25]. A number of reasons
may have contributed to these results: the limited number of cases affecting the power of the
performed statistical analysis and particularly the objective difficulty of defining a clear cut
through the base of the heart that would match the same VOI on the images. This hypothesis
is supported by the markedly improved slice-by-slice comparison of automated vs
interactive results (Figure 5) over total myocardial or ventricular results for both mass and
volumes (Figures 3,4). Automated versus interactive total myocardial masses also did not
strongly correlate; a deeper analysis of the results showed a strong effect of the base location
as independently determined by the user and the automated algorithm on the total masses
(Figure 3). However, higher accuracy was observed in the extraction of LV and RV borders -
in this case the manual segmentation was used as “truth” - with higher correlations between
the computed volumes, particularly for the LV (Figure 4), which is also a crucial feature in
the alignment procedure.
To further investigate the agreement between image-based results single corresponding
slices' segmentation were compared. Figure 5 (top) displays the higher correlation between
the masses and volumes extracted by the two image-based modalities when all the slices are
pooled together for the myocardium, the LV and the RV respectively. Figure 6 shows
examples to substantiate the observation of a higher discrepancy in the segmentation results
at the base and the apex of the heart that can greatly affect the total mass measures. Figure 5
(middle and bottom) also exemplifies these results in distinct correlation plots for apex/base
and central image portions. Analogously, slice-by-slice comparisons showed higher
correlation also within each case (Table 2).
Piccinelli et al. Page 8
J Nucl Cardiol. Author manuscript; available in PMC 2017 January 03.
Author M
anuscriptA
uthor Manuscript
Author M
anuscriptA
uthor Manuscript
From the results obtained it is clear that this automatic CT segmentation algorithm is not
ready for clinical applications where an accurate measurement of myocardial mass is
needed. The accurate measurement of myocardial mass is quite challenging because of the
requirement that LV-endo, LV epi, RV-endo and RV-epi contours are accurately defined from
apex to base. Our results show that the segmentation algorithm in the present formulation is
very sensitive to locations such as the base and the apex where partial volume effects or
irregularities in the anatomical structures are crucial. The degree of difficulties of the
automated algorithm in accurately segmenting the apex and the base of the heart were not
anticipated before this study and improvement of this task will be the subject of further
development.
Nevertheless, our results indicate that this automatic CT segmentation algorithm is as ready
for the fusion of PET/CT imagery as the manual segmentation of CT cardiac images. This is
particularly true since the definition of reliable myocardial masks used in the global
segmentation procedure uses the a priori information that accounts for giving more weight to
the more reliable regions during the alignment process. Our results show (Fig. 7) excellent
correlations for the LV volumes and thus the LV endocardial boundary definition, followed
by good correlations of myocardial mass not including the base or apex, followed by good
correlation for RV volumes and thus the RV endocardial boundary. The relative reliability of
these regions is very similar to those obtained by our collaborators when validating other
automatic myocardial delineation algorithms using shape segmentation with region growing
and PCA (24). Moreover, the small errors in rotation and translation between the manual and
automatic methods post PET/CTA alignment shown in Table 3 confirm the appropriateness
of replacing the manual CT contours with the automatic ones for PET/CT alignment
applications. These registration errors are comparable to the errors reported by other
techniques (26,27).
A limitation of this work is that it used the alignment of the interactively hand-traced CTA
biventricular mesh as a reference standard. Although these surfaces were defined by an
expert in pig CT anatomy [TF], manual methods are subjective. Previously, we determined
and reported in a study using six patients that the error difference between two interactive
alignments was similar to the error difference between the automatic and interactive
alignments (11). We could have chosen to compare our automatic CT contours to those from
other automated methods (28,29). This was not done for a number of reasons. A large
number of different segmentation solutions have indeed been proposed through the years to
extract myocardial profiles from both CT and MR acquisitions. Still no methodology has
emerged as a definitive reference for comparisons’ sake; moreover, none of them have been
validated to detect contours from pigs’ hearts. But more importantly, the long-term goal of
this project is automatic nuclear/CT cardiac fusion and thus the determination of the
alignment error of our automatic CT surfaces was of paramount importance. Nevertheless,
the comparison of the LV and RV mass determined from hand-traced CT, automatic CT
mesh generation and post-mortem mass measurement served as an independent measure of
the accuracy of the automatically determined biventricular myocardium from CTA.
Another limitation, as we have previously pointed out (11), is that this validation was
performed using only static, motion-blurred perfusion images rather than a gated MPI study
Piccinelli et al. Page 9
J Nucl Cardiol. Author manuscript; available in PMC 2017 January 03.
Author M
anuscriptA
uthor Manuscript
Author M
anuscriptA
uthor Manuscript
extracted from the same R-R time interval as in the contrast CT image set. This limitation
contributes to the error of the automatic alignment. Part of the reason for using the static
perfusion distribution is that the alignment method requires the RV information that is often
poorly resolved in the gated MPI individual frames. Analogously, only one phase between
best systole and best diastole acquisitions commonly acquired was used to validate the
segmentation algorithms and the fusion procedure. Nevertheless, the use of multimodality
alignment using the same R-R time interval in the aligned modalities is a subject of
continuing research by our team. The process of gated information from both MPI and CTA
will additionally benefit from the availability of automated segmentation algorithms.
Finally, although the automatic alignment algorithm only requires an average of 42 seconds
on a standard PC to register the MPI and CTA, the manual tracing of the biventricular
myocardium from a contrast CT image set required approximately 25 minutes depending on
the study and the experience of the user. This manual-operation has made the routine clinical
use of this type of image fusion impractical. The results from this animal study offers
promise that the coupling of our automatic contrast CT edge detection technique and our
automatic alignment procedure may eventually allow the creation of a single framework for
a completely automated fusion of CTA and MPI, from the identification of the heart to the
final fusion and display of images and surfaces. Although we recognize that the fusion
procedure can only be applied to those cases for which both MPI and a CT with contrast are
available, a significant portion of patients with dubious or unclear diagnosis can benefit from
these techniques and possibly avoid unnecessary invasive treatments or dangerous
misdiagnosis. This work is indeed an important step in making the availability of the
diagnostically rich fused cardiac PET/CTA or SPECT/CTA routinely available in the clinical
practice.
CONCLUSIONS
Our automatic myocardial boundary detection algorithm created left and right ventricular,
endocardial and epicardial surfaces from CTA cardiac images that are similar in accuracy
compared to corresponding hand-traced surfaces. Moreover, the automated alignment of
these automatically detected CTA surfaces with the PET surfaces are similar in accuracy to
the automated alignment using hand-traced CTA surfaces. Further improvements to the
automated segmentation algorithm will be implemented and tested in a follow-up study
involving a larger patient cohort.
Acknowledgments
Research Support
This work was supported in part by NIH grant R01-HL-085417 from NHLBI and by the EMTech Bio Collaborative Grant program.
References
1. Gaemperli O, Schepis T, Kalff V, Namdar M, Valenta I, Stefani L, et al. Validation of a new cardiac image fusion software for three-dimensional integration of myocardial perfusion SPECT and stand-
Piccinelli et al. Page 10
J Nucl Cardiol. Author manuscript; available in PMC 2017 January 03.
Author M
anuscriptA
uthor Manuscript
Author M
anuscriptA
uthor Manuscript

alone 64-slice CT angiography. Eur J Nucl Med Mol Imaging. 2007; 34:1097–1106. [PubMed: 17245532]
2. Santana CA, Garcia EV, Faber TL, Sirineni GKR, Esteves FP, Sanyal R, et al. Diagnostic performance of fusion of myocardial perfusion imaging (MPI) and computed tomography coronary angiography. J Nucl Cardiol. 2009; 16:201–211. [PubMed: 19156478]
3. Kajander S, Joutsiniemi E, Saraste M, Pietila M, Ukkonen H, Saraste A, et al. Cardiac positron emission tomography/computed tomography imaging accurately detects anatomically and functionally significant coronary artery disease. Circulation. 2010; 122:603–613. [PubMed: 20660808]
4. Sato A, Nozato T, Hikita H, Miyazaki S, Takahashi Y, Kuwahara T, et al. Incremental value of combining 64-slice computed tomography angiography with stress nuclear myocardial perfusion imaging to improve non-invasive detection of coronary artery disease. J Nucl Cardiol. 2010; 17:19–26. [PubMed: 19777317]
5. Faber TL, Santana CA, Garcia EV, Candell-Riera J, Folks RD, Peifer JW, et al. Three-dimensional fusion of coronary arteries with myocardial perfusion distributions: clinical validation. J Nucl Med. 2004; 45:745–753. [PubMed: 15136621]
6. Garcia EV, Faber TL, Cooke CD, Folks RD, Chen J, Santana C. The increasing role of quantification in nuclear cardiology: The Emory approach. J Nucl Cardiol. 2007; 14:420–432. [PubMed: 17679051]
7. Germano G, Kavanagh PB, Slomka PJ, Van Kriekinge SD, Pollard G, Berman DS. Quantitation in gated perfusion SPECT imaging: the Cedars-Sinai approach. J Nucl Cardiol. 2007; 14:433–454. [PubMed: 17679052]
8. Schoepf UJ, Becker CR, Ohnesorge BM, Yucel EK. CT of coronary artery disease. Radiology. 2004; 232:18–37. [PubMed: 15220491]
9. Mowatt G, Cook JA, Hillis GS, Walker S, Fraser C, Jia X, Waugh N. 64-Slice computed tomography angiography in the diagnosis and assessment of coronary artery disease: systematic review and meta-analysis. Heart. 2008; 94:1386–1393. [PubMed: 18669550]
10. Schindler TH, Magosaki N, Jeserich M, Oser U, Krause T, Fisher R, et al. Fusion imaging: combined visualization of 3D reconstructed coronary artery tree and 3D myocardial scintigraphic image in coronary artery disease. Int J Card Imaging. 1999; 15:357–368. [PubMed: 10595402]
11. Faber TL, Santana CA, Piccinelli M, Nye JA, Votaw JR, Garcia EV, Haber E. Automatic alignment of myocardial perfusion images with contrast-enhanced cardiac computed tomography. IEEE Trans Nucl Science. 2011; 58:2296–2302.
12. Wells WM, Viola P, Atsumi H, Nakajima S, Kikinis R. Multi-modal volume registration by maximization of mutual information. Medical Image Analysis. 1996; 1:35–51. [PubMed: 9873920]
13. Faber TL, Cooke CD, Folks RD, Vansant JP, Nichols KJ, DePuey EG, Pettigrew RI, Garcia EV. Left ventricular function and perfusion from gated SPECT perfusion images: An integrated method. J Nucl Med. 1999; 40:650–659. [PubMed: 10210225]
14. McInerney T, Terzopoulos D. Deformable models in medical image analysis: A survey. IEEE Trans Med Imag. 1996; 1:91–108.
15. Paragios N. A variational approach for the segmentation of the left ventricle in cardiac image analysis. Int J Comp Vision. 2002; 50:345–362.
16. Petitjean C, Dacher JN. A review of segmentation methods in short axis cardiac MR images. Med Image Analysis. 2011; 15:169–184.
17. Tsai A, Yezzi A, Wells W, Tempany C, Tucker D, Fan A et at. A shape-based approach to the segmentation of medical imagery using level sets. IEEE Trans Med Imag. 2003; 22:137–154.
18. Heimann T, Meinzer HP. Statistical shape models for 3D medical segmentation: A review. Med Image Analysis. 2009; 13:543–563.
19. Appia VV, Ganapathy B, Abufadel A, Yezzi A, Faber TL. A regions of confidence based approach to enhance segmentation with shape priors. Proc SPIE. 2010; 18
20. Appia, VV.; Ganapathy, B.; Yezzi, A.; Faber, TL. Localized principal component analysis based curve evolution: a divide and conquer approach; IEEE International Conference on Computer Vision; 2011.
Piccinelli et al. Page 11
J Nucl Cardiol. Author manuscript; available in PMC 2017 January 03.
Author M
anuscriptA
uthor Manuscript
Author M
anuscriptA
uthor Manuscript

21. Halkos ME, Zhao ZQ, Kerendi F, Wang NP, Jiang R, Schmarkey LS, et al. Intravenous infusion of mesenchymal stem cells enhances regional perfusion and improves ventricular function in a porcine model of myocardial infarction. Basic Res Cardiol. 2008; 103:525–536. [PubMed: 18704259]
22. Machac J, Bacharach SL, Bateman TM, Bax JJ, Beanlands R, Bengel F, et al. Positron emission tomography myocardial perfusion and glucose metabolism imaging. J Nucl Cardiol. 2006; 13:e121–e151. [PubMed: 17174789]
23. Faber TL, Cooke CD, Peifer JW, Pettigrew RI, Vansant JP, Leyendecker JR, Garcia EV. Three-dimensional displays of left ventricular epicardial surface from standard cardiac SPECT perfusion quantification techniques. J Nucl Med. 1995; 36:697–703. [PubMed: 7699467]
24. Florentine MS, Grosskreutz CL, Chang W, Hartnett JA, Dunn VD, Ehrhardt JC, Fleagle SR, Collins SM, Marcus ML, Skorton DJ. Measurements of left ventricle mass in vivo using gated nuclear magnetic resonance imaging. J Am Coll Cardiol. 1986; 8:107–112. [PubMed: 3711505]
25. Bruners P, Mahnken AH, Knackstedt C, Luhmann N, Spuntrup E, Das M, Hohl C, Wildberger JE, Schmitz-Rode T, Gunther RW, Muhlenbruch G. Assessment of global left and right ventricular function using dual-source computer tomography (DSCT) in comparison to MRI. An experimental study in a porcine model. Investigative Radiology. 2007; 42:756–764. [PubMed: 18030198]
26. Zhu L, Appia V, Yezzi A, Arepalli C, Faber T, Stillman A, Tannembaum A. Automatic delineation of the myocardial wall from CT images via shape segmentation and variational region growing. IEEE Transactions on Biomedical Engineering. 2013 Jun 4. epub ahead of print.
27. Woo J, Slomka PJ, Dey D, Cheng VY, Hong BW, Ramesh A, et al. Geometric feature-based multimodal image registration of contrast-enhanced cardiac CT with gated myocardial perfusion SPECT. Med Phys. 2009; 32:5467–5479.
28. van Assen HC, Danilouchkine MG, Dirksen MS, Reiber JHC, Lelieveldt BPF. A 3D active shape model driven by fuzzy inference: Application to cardiac CT and MR. IEEE Trans Inf Technol Biomed. 2008; 12:595–605. [PubMed: 18779074]
29. Ecabert O, Peters J, Schramm H, Lorenz C, von Berg J, Walker MJ, et al. Automatic model-based segmentation of the heart in CT images. IEEE Trans Med Imag. 2008; 27:1189–1201.
Piccinelli et al. Page 12
J Nucl Cardiol. Author manuscript; available in PMC 2017 January 03.
Author M
anuscriptA
uthor Manuscript
Author M
anuscriptA
uthor Manuscript

Figure 1. Three-dimensional views of cardiac meshes generated from hand-traced (top) and
automatically detected (bottom) CT myocardial boundaries from one of the animal
experiments.
Piccinelli et al. Page 13
J Nucl Cardiol. Author manuscript; available in PMC 2017 January 03.
Author M
anuscriptA
uthor Manuscript
Author M
anuscriptA
uthor Manuscript
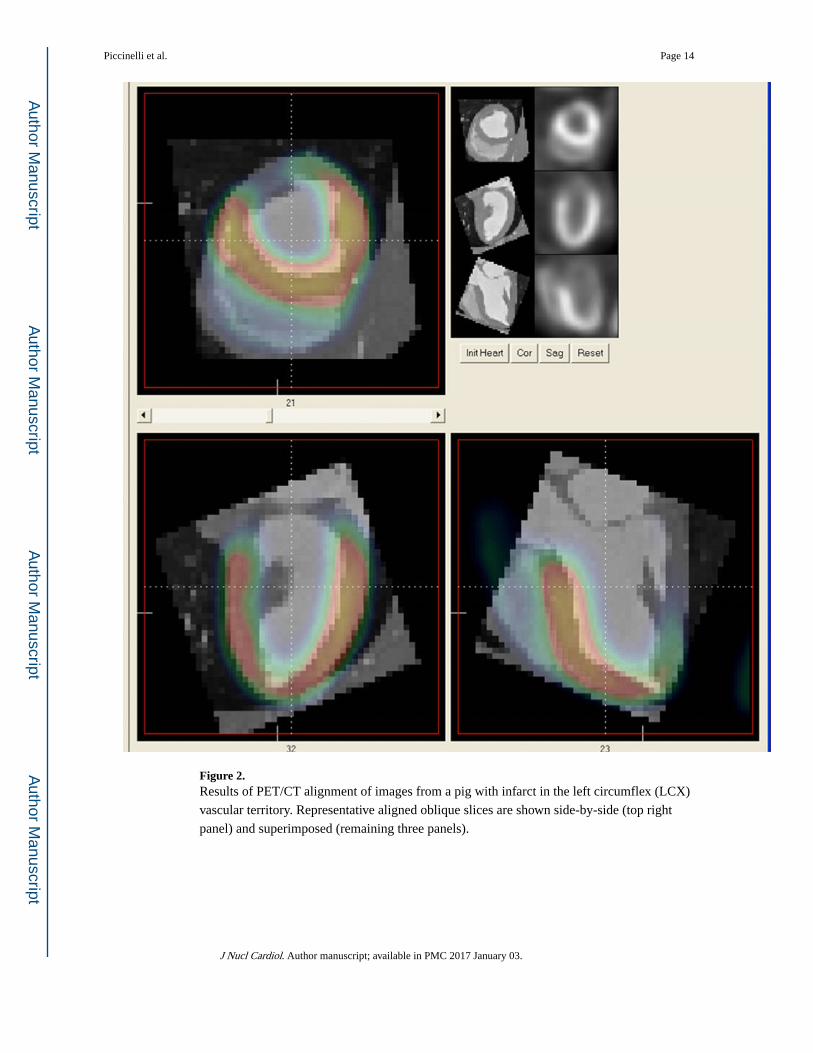
Figure 2. Results of PET/CT alignment of images from a pig with infarct in the left circumflex (LCX)
vascular territory. Representative aligned oblique slices are shown side-by-side (top right
panel) and superimposed (remaining three panels).
Piccinelli et al. Page 14
J Nucl Cardiol. Author manuscript; available in PMC 2017 January 03.
Author M
anuscriptA
uthor Manuscript
Author M
anuscriptA
uthor Manuscript

Figure 3. Left column, display of scatter plot, linear regression line and Pearson correlation coefficient
for true versus interactive (top), true versus automated (middle) and interactive versus
automated (bottom) myocardial mass measures; right column, Bland-Altman plots for the
assessment of measurements agreement for true versus interactive (top), true versus
automated (middle) and interactive versus automated myocardial masses.
Piccinelli et al. Page 15
J Nucl Cardiol. Author manuscript; available in PMC 2017 January 03.
Author M
anuscriptA
uthor Manuscript
Author M
anuscriptA
uthor Manuscript

Figure 4. Left column, comparison of image-based measures for LV and RV volumes; regression line
and Pearson correlation coefficients also reported. Right column, Bland-Altman plots for
measurements agreement assessment.
Piccinelli et al. Page 16
J Nucl Cardiol. Author manuscript; available in PMC 2017 January 03.
Author M
anuscriptA
uthor Manuscript
Author M
anuscriptA
uthor Manuscript

Figure 5. Slice-by-slice comparison of interactive versus automated myocardial mass (A), LV (B) and
RV (C) volumes. Top: all slices from all cases plotted; Middle: bottom 10% of total slices
representing the heart apex and top 10% of total slices representing the heart base; Bottom:
slices from the central portion. Linear regression lines also reported.
Piccinelli et al. Page 17
J Nucl Cardiol. Author manuscript; available in PMC 2017 January 03.
Author M
anuscriptA
uthor Manuscript
Author M
anuscriptA
uthor Manuscript

Figure 6. Examples of interactive (red) versus automated (blue) segmented profiles for selected slice
in the apex (top), at the center (middle) and at the base (bottom) of the heart with
corresponding CTA slice. Various degrees of agreement are evidenced at the apex; usually
good agreement on the center portion of the VOI and relatively poor consistency at the base.
Piccinelli et al. Page 18
J Nucl Cardiol. Author manuscript; available in PMC 2017 January 03.
Author M
anuscriptA
uthor Manuscript
Author M
anuscriptA
uthor Manuscript

Figure 7. Oblique angle tomograms showing representative short axis (SA), horizontal long axis
(HLA) and vertical long axis (VLA) orientations of the results of aligning the PET cardiac
count distribution with the hand-traced (top) and automatically detected (bottom) CT
myocardial meshes from the results shown in figures 1 and 2.
Piccinelli et al. Page 19
J Nucl Cardiol. Author manuscript; available in PMC 2017 January 03.
Author M
anuscriptA
uthor Manuscript
Author M
anuscriptA
uthor Manuscript
Author M
anuscriptA
uthor Manuscript
Author M
anuscriptA
uthor Manuscript
Piccinelli et al. Page 20
Tab
le 1
Exp
erim
enta
l and
imag
e-ba
sed
mea
sure
men
ts f
or th
e an
alyz
ed c
ases
: myo
card
ial m
ass
and
vent
ricu
lar
volu
mes
(on
ly im
age-
base
d).
TR
UE
ME
ASU
RE
ME
NT
S
IMA
GE
-BA
SED
ME
ASU
RE
ME
NT
S
INT
ER
AC
TIV
EA
UT
OM
AT
ED
Cas
eM
YO
CA
RD
IAL
MA
SS (
g)M
YO
CA
RD
IAL
MA
SS (
g)L
V V
OL
UM
E(c
c)R
V V
OL
UM
E(c
c)M
YO
CA
RD
IAL
MA
SS (
g)L
V V
OL
UM
E(c
c)R
V V
OL
UM
E(c
c)
1na
88.3
149
.20
19.2
913
9.52
44.8
710
.16
2na
102.
7279
.97
41.7
814
9.67
75.7
442
.72
3na
122.
5058
.78
30.7
812
7.18
50.4
344
.12
4na
116.
9979
.74
41.4
814
0.70
78.7
036
.54
510
0.90
96.3
029
.13
22.9
195
.32
11.9
33.
95
682
.74
98.0
365
.79
51.4
311
1.97
52.9
432
.68
710
9.52
105.
8364
.55
51.1
111
9.64
58.7
843
.95
811
8.60
90.6
985
.72
45.2
711
5.60
88.2
747
.14
910
3.40
89.7
460
.02
25.3
111
4.66
61.9
534
.41
1082
.54
90.6
450
.19
28.7
210
4.93
31.8
117
.44
1186
.00
103.
7547
.56
26.2
695
.14
46.6
618
.98
1210
5.33
109.
9157
.25
33.7
312
7.17
49.0
035
.21
na =
val
ue n
ot a
vaila
ble
J Nucl Cardiol. Author manuscript; available in PMC 2017 January 03.
Author M
anuscriptA
uthor Manuscript
Author M
anuscriptA
uthor Manuscript
Piccinelli et al. Page 21
Table 2
Pearson’s correlation coefficients for image-based slice-by-slice comparisons of myocardial mass, LV and RV
volumes.
Case Myocardium Left Ventricle Right Ventricle
1 0.94 0.99 0.67
2 0.87 0.98 0.95
3 0.93 1.00 0.92
4 0.94 1.00 0.96
5 0.84 0.87 0.52
6 0.87 0.97 0.88
7 0.95 1.00 0.96
8 0.79 0.99 0.86
9 0.87 0.99 0.84
10 0.89 0.96 0.74
11 0.89 0.99 0.84
12 0.91 0.99 0.94
J Nucl Cardiol. Author manuscript; available in PMC 2017 January 03.

Author M
anuscriptA
uthor Manuscript
Author M
anuscriptA
uthor Manuscript
Piccinelli et al. Page 22
Table 3
PET/CTA alignment differences. Hand-traced versus automatic CTA profiles.
n=12 X Y Z
Rotation (°) 0.4 −0.6 −2.3
Translation (mm) 1.8 −2.1 2.0
J Nucl Cardiol. Author manuscript; available in PMC 2017 January 03.