automatic grit removal system
TRANSCRIPT
IMPLEMENTATION OF AN INNOVATIVE, SEVERE DUTY, GRIT REMOVAL SYSTEM AT THE BLUE PLAINS ADVANCED WASTEWATER TREATMENT PLANT
IN WASHINGTON, D.C.
Vince Maillard*, Thor Young**, Walt Bailey***, Tony Ramos*** * Stearns & Wheler, LLC
4201 Northview Drive, Suite 404 Bowie, MD 20716
**Stearns & Wheler, LLC
***District of Columbia Water and Sewer Authority ABSTRACT The District of Columbia Water and Sewer Authority’s Blue Plains Advanced Wastewater Treatment Plant has headworks facilities capable of treating an average daily design flow of 370 million gallons per day (mgd) and a design peak flow of over 1.0 billion gallons per day (1,000 mgd). The facilities are prone to very heavy grit loads during wet weather events, and the facilities are forced to schedule and rely on outside vactor contractors to remove grit from their process. Excess grit frequently washes into the primary clarifiers and sludge processes, causing further damage and failures downstream. The key item in the design of the upgrade to the plant’s grit removal facilities included a completely automated, heavy-duty, custom-made traveling bridge grit removal system. The bridges are cog-wheel driven, constructed of Type 304 stainless steel, and are powered via festooned power cable system. Bridges are operated by VFDs, and in conjunction with track limit switches, are able to travel at various distances, directions, and speeds according to the current plant operating conditions. The control system employs a variety of additional instrumentation and features that provide for a safe, reliable, and efficient grit removal process, even during wet weather events. Each bridge supports two, dual heavy-duty submersible pump/suction plate systems, that continuously remove settled grit from the tanks and transfer to the grit dewatering processes. Conceptual studies were performed to quantify and characterize the grit encountered at the plant. Pilot testing results provided critical design information for the grit pumps, and allowed the innovative design of the grit pump suction plate and plow concept. Observations from numerous plant visits were also addressed in the specialty design of the system. This paper presents the innovative design features of the traveling bridge grit removal system, pilot and factory testing information and results, and field testing results obtained thus far in construction. KEYWORDS Grit, Preliminary Treatment, Traveling Bridges, Wet Weather
1952
WEFTEC®.06
Copyright 2006 Water Environment Foundation. All Rights Reserved©
INTRODUCTION The District of Columbia Water and Sewer Authority’s (WASA) Blue Plains Advanced Wastewater Treatment Plant serves the District of Columbia and surrounding metropolitan areas of Maryland and Virginia. The facility is designed for an average daily flow of 370 million gallons per day (mgd), but the preliminary treatment processes are designed for a peak flow of 1,076 mgd. Preliminary treatment facilities include influent pumping, screening and grit removal processes for the plant’s east and west sides. The existing grit removal processes at Blue Plains consist of sixteen aerated grit chambers, four of which are located in the west facility (Grit Chamber Building No. 1), with the other twelve located in the east facility (Grit Chamber Building No. 2). The existing grit chamber design criteria are shown in Table 1. Table 1 – Existing Grit Chamber Design
PARAMETER GRIT CHAMBER BLDG NO.1 (WEST)
GRIT CHAMBER BLDG NO.2 (EAST)
No. Grit Chambers 4 12 Dimensions (l x w x h) 75ft x 20.5ft x 10-ft 70ft x 20ft x 15.7-ft Design Avg Q 148 MGD 222 MGD Peak Q 296 MGD 780 MGD Detention Time @ Peak 3 min 3.5 min
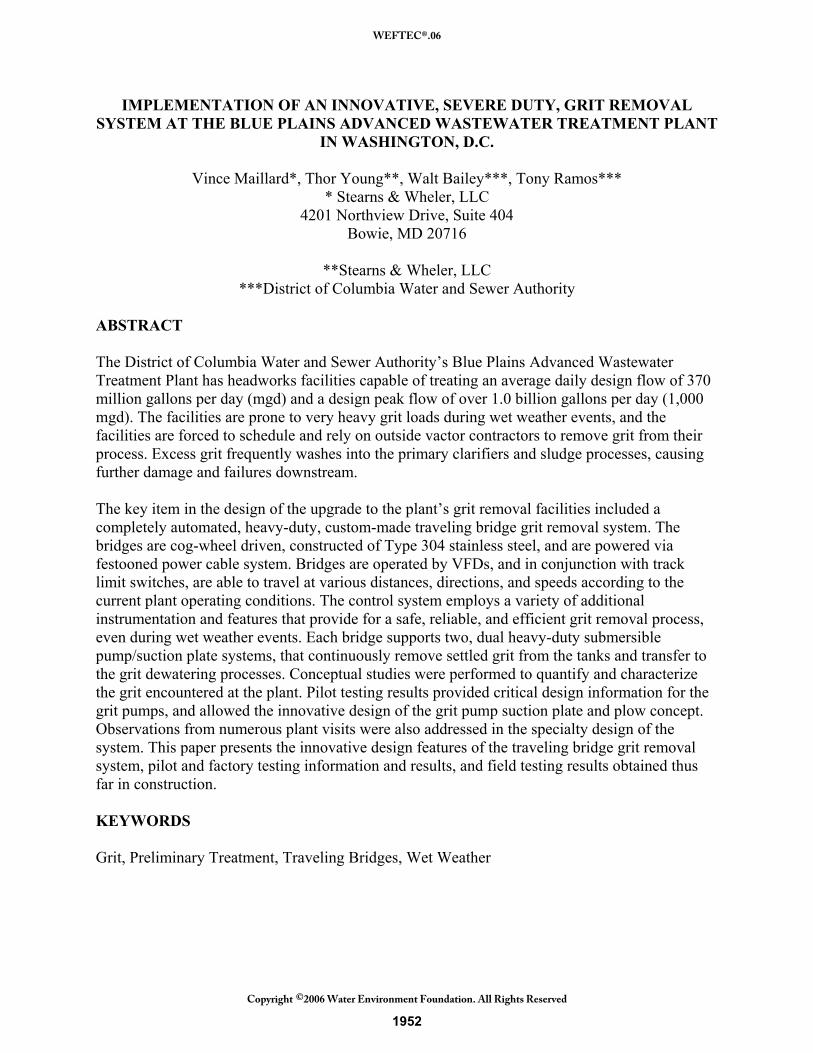
Both grit removal facilities are preceded by fine screening. On the east side (refer to Figure 1), screening occurs within a separate facility and the screened effluent is pumped to the grit influent channel in Grit Chamber Building No. 2 (GCB2) via nine influent pump forcemains. In Grit Chamber Building No. 1 (GCB1), screening occurs within the same facility with four fine screens. Screened effluent is discharged to a common grit influent channel prior to distributing to the four aerated grit chambers. Grit chamber effluent from both facilities is routed to their respective primary clarifiers. Figure 1 – Grit Chamber Building No. 2 Flow Schematic
Grit Chamber Effluent to Primary Clarifiers
Pumped Grit Chamber Influent
Sluice Gate
Influent Channel
Aerated Grit Chamber
Effluent Weir
Grit Settles
1953
WEFTEC®.06
Copyright 2006 Water Environment Foundation. All Rights Reserved©
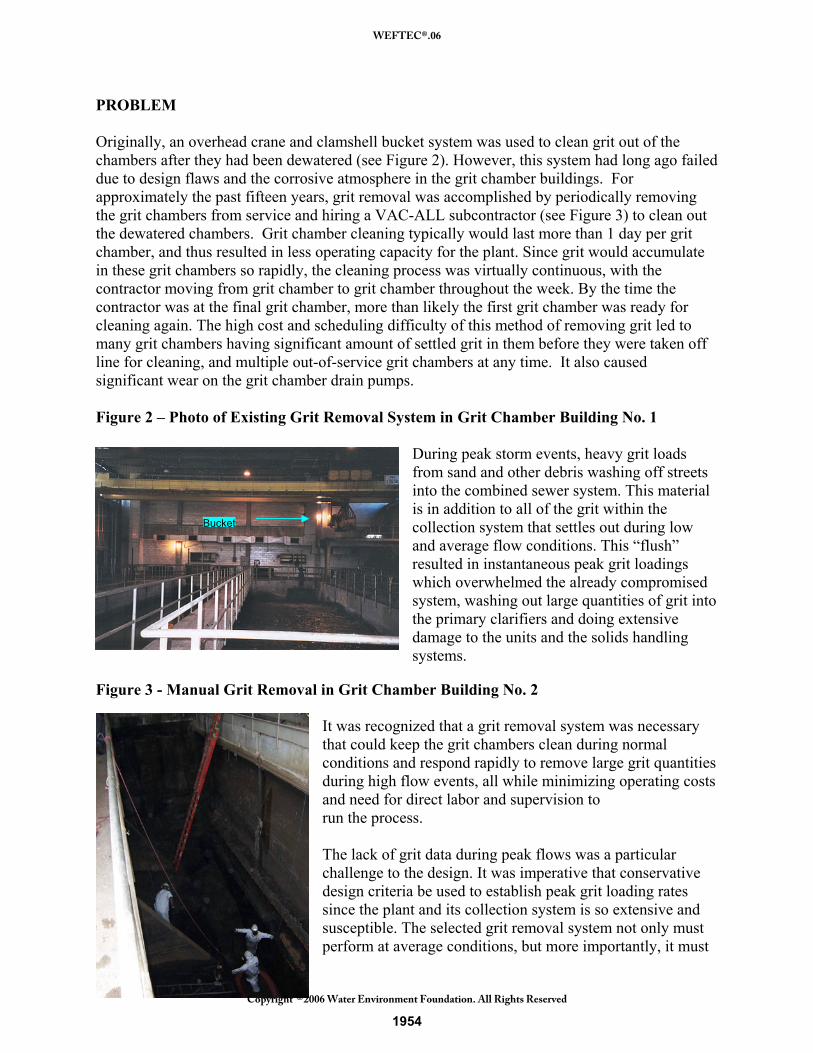
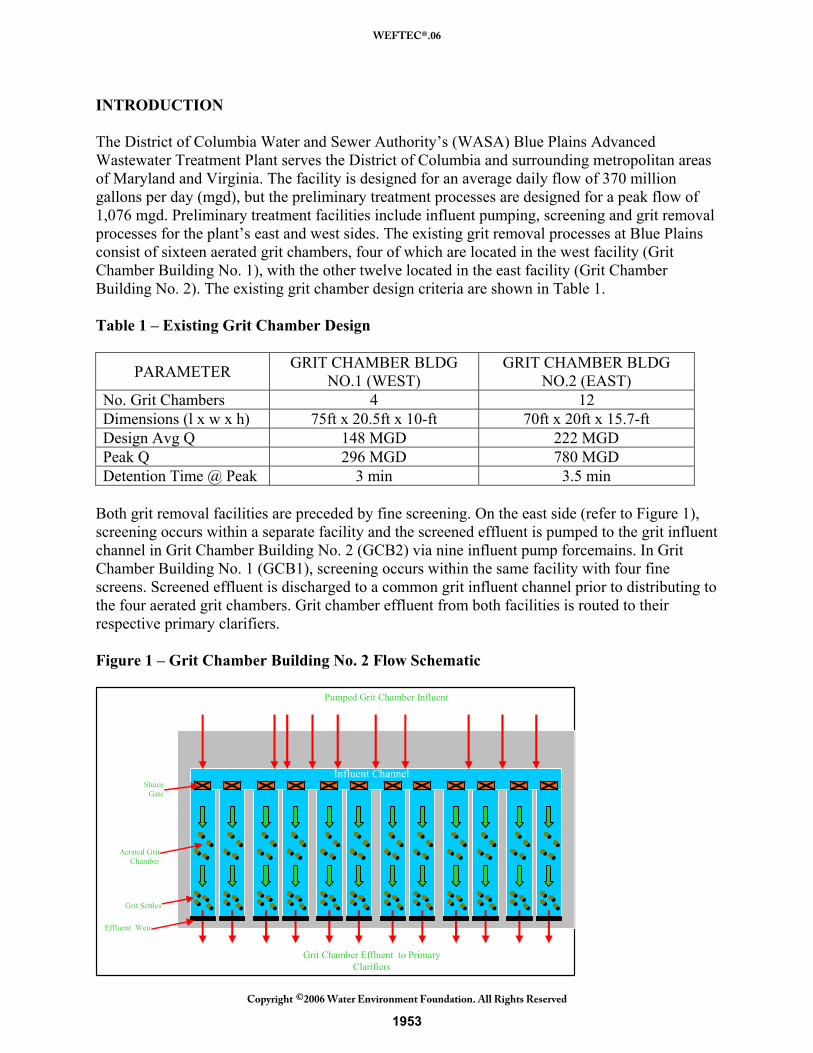
PROBLEM Originally, an overhead crane and clamshell bucket system was used to clean grit out of the chambers after they had been dewatered (see Figure 2). However, this system had long ago failed due to design flaws and the corrosive atmosphere in the grit chamber buildings. For approximately the past fifteen years, grit removal was accomplished by periodically removing the grit chambers from service and hiring a VAC-ALL subcontractor (see Figure 3) to clean out the dewatered chambers. Grit chamber cleaning typically would last more than 1 day per grit chamber, and thus resulted in less operating capacity for the plant. Since grit would accumulate in these grit chambers so rapidly, the cleaning process was virtually continuous, with the contractor moving from grit chamber to grit chamber throughout the week. By the time the contractor was at the final grit chamber, more than likely the first grit chamber was ready for cleaning again. The high cost and scheduling difficulty of this method of removing grit led to many grit chambers having significant amount of settled grit in them before they were taken off line for cleaning, and multiple out-of-service grit chambers at any time. It also caused significant wear on the grit chamber drain pumps. Figure 2 – Photo of Existing Grit Removal System in Grit Chamber Building No. 1
During peak storm events, heavy grit loads from sand and other debris washing off streets into the combined sewer system. This material is in addition to all of the grit within the collection system that settles out during low and average flow conditions. This “flush” resulted in instantaneous peak grit loadings which overwhelmed the already compromised system, washing out large quantities of grit into the primary clarifiers and doing extensive damage to the units and the solids handling systems.
Figure 3 - Manual Grit Removal in Grit Chamber Building No. 2
It was recognized that a grit removal system was necessary that could keep the grit chambers clean during normal conditions and respond rapidly to remove large grit quantities during high flow events, all while minimizing operating costs and need for direct labor and supervision to run the process. The lack of grit data during peak flows was a particular challenge to the design. It was imperative that conservative design criteria be used to establish peak grit loading rates since the plant and its collection system is so extensive and susceptible. The selected grit removal system not only must perform at average conditions, but more importantly, it must
Bucket
1954
WEFTEC®.06
Copyright 2006 Water Environment Foundation. All Rights Reserved©
be designed for flexibility to operate during peak grit loading conditions. Peak grit loading design criteria is discussed later in this paper. OBJECTIVE The design team recognized that a grit removal system was necessary which could keep the grit chambers clean during normal conditions and respond rapidly to remove large grit quantities during high flow events, all while minimizing operating costs and need for direct labor and supervision to run the process. The main goals that the design needed to address included: Table 2 – Design Goals for Grit Removal Upgrade
GOAL REASON
Reliability Must not only operate during average conditions, but must demonstrate ability to operate at peak grit loading conditions, when the plant needs it the most
Redundancy System needs to have built-in redundancy to ensure key equipment failures do not prevent the grit removal system from continuing to operate
Efficiency Process should take advantage of the volume available within the existing tanks and be able to remove as much of settled grit as possible
Limited Operator Attention
Process cannot require significant operator attention that could be better spent elsewhere within the plant, especially during peak events
Operational Flexibility
System should be adjustable, both in automatic and manual modes, to allow the system to operate as intended by Plant Operations
Ability to Remove Large Quantities of Grit
The system must be able to remove grit as quickly as it enters the facility. Typical systems are not capable of accommodating peak events for a combined sewer facility of this size.
Prior to the design phase, a study phase was completed with the main objective of the quantifying and characterizing the nature of the grit received at the plant. Determination of the actual grit yield for each facility, and an understanding of the nature of sedimentation within the existing tanks were important goals of this study to help establish design criteria for the proposed process. The design phase would use this information to implement a custom-designed grit removal system that would address the Authority’s concerns over reliability, lack of redundancy, poor removal efficiency, high operator attention, and limited operational flexibility with the standard
1955
WEFTEC®.06
Copyright 2006 Water Environment Foundation. All Rights Reserved©
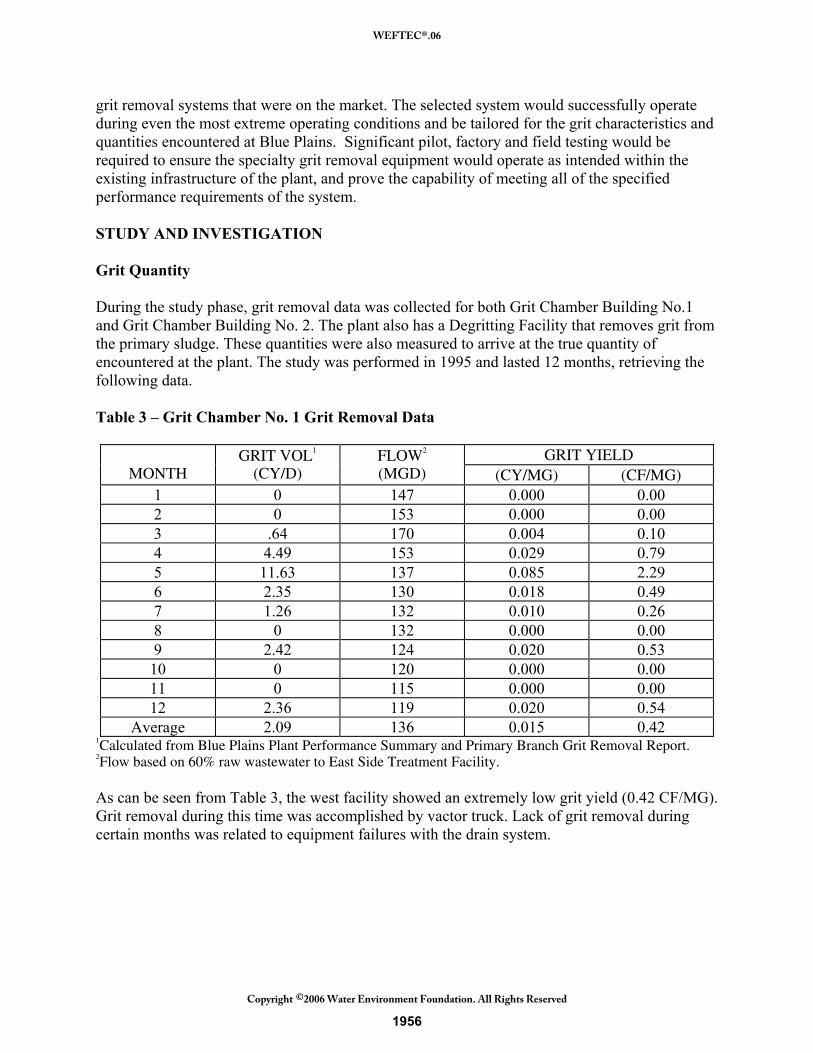
grit removal systems that were on the market. The selected system would successfully operate during even the most extreme operating conditions and be tailored for the grit characteristics and quantities encountered at Blue Plains. Significant pilot, factory and field testing would be required to ensure the specialty grit removal equipment would operate as intended within the existing infrastructure of the plant, and prove the capability of meeting all of the specified performance requirements of the system. STUDY AND INVESTIGATION Grit Quantity During the study phase, grit removal data was collected for both Grit Chamber Building No.1 and Grit Chamber Building No. 2. The plant also has a Degritting Facility that removes grit from the primary sludge. These quantities were also measured to arrive at the true quantity of encountered at the plant. The study was performed in 1995 and lasted 12 months, retrieving the following data. Table 3 – Grit Chamber No. 1 Grit Removal Data
GRIT YIELD
MONTH GRIT VOL1
(CY/D) FLOW2 (MGD) (CY/MG) (CF/MG)
1 0 147 0.000 0.00 2 0 153 0.000 0.00 3 .64 170 0.004 0.10 4 4.49 153 0.029 0.79 5 11.63 137 0.085 2.29 6 2.35 130 0.018 0.49 7 1.26 132 0.010 0.26 8 0 132 0.000 0.00 9 2.42 124 0.020 0.53 10 0 120 0.000 0.00 11 0 115 0.000 0.00 12 2.36 119 0.020 0.54
Average 2.09 136 0.015 0.42 1Calculated from Blue Plains Plant Performance Summary and Primary Branch Grit Removal Report. 2Flow based on 60% raw wastewater to East Side Treatment Facility. As can be seen from Table 3, the west facility showed an extremely low grit yield (0.42 CF/MG). Grit removal during this time was accomplished by vactor truck. Lack of grit removal during certain months was related to equipment failures with the drain system.
1956
WEFTEC®.06
Copyright 2006 Water Environment Foundation. All Rights Reserved©
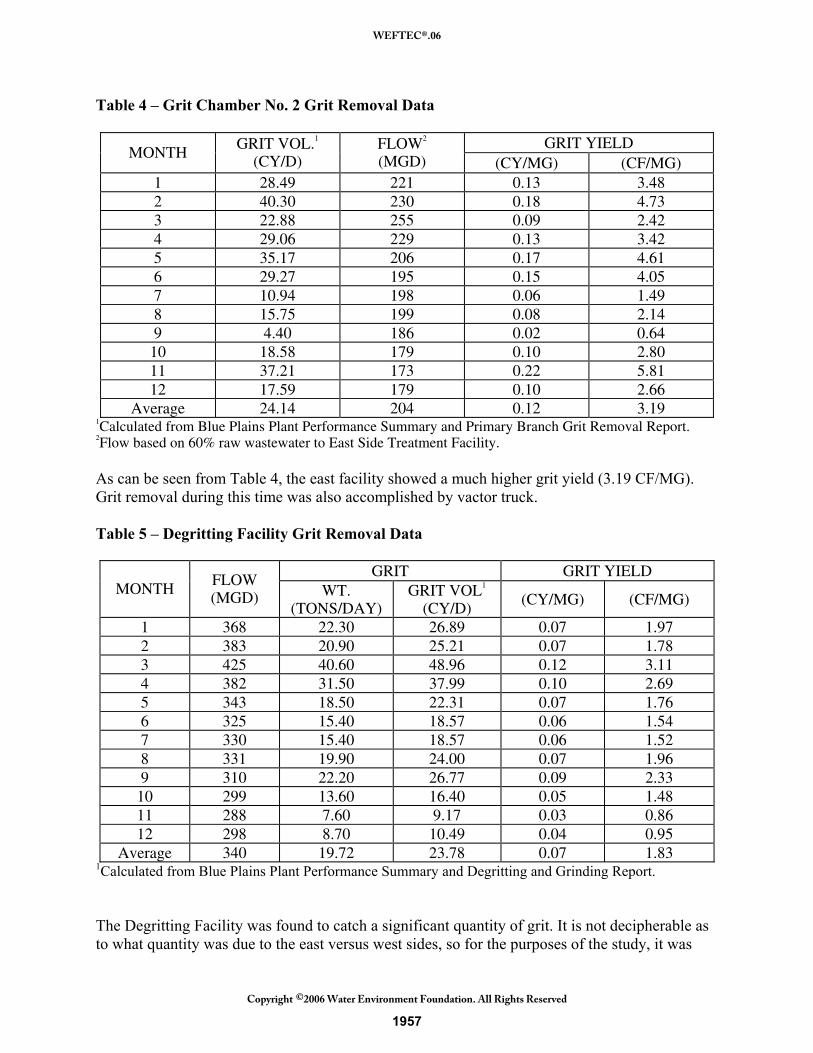
Table 4 – Grit Chamber No. 2 Grit Removal Data
GRIT YIELD MONTH
GRIT VOL.1
(CY/D) FLOW2 (MGD) (CY/MG) (CF/MG)
1 28.49 221 0.13 3.48 2 40.30 230 0.18 4.73 3 22.88 255 0.09 2.42 4 29.06 229 0.13 3.42 5 35.17 206 0.17 4.61 6 29.27 195 0.15 4.05 7 10.94 198 0.06 1.49 8 15.75 199 0.08 2.14 9 4.40 186 0.02 0.64 10 18.58 179 0.10 2.80 11 37.21 173 0.22 5.81 12 17.59 179 0.10 2.66
Average 24.14 204 0.12 3.19 1Calculated from Blue Plains Plant Performance Summary and Primary Branch Grit Removal Report. 2Flow based on 60% raw wastewater to East Side Treatment Facility. As can be seen from Table 4, the east facility showed a much higher grit yield (3.19 CF/MG). Grit removal during this time was also accomplished by vactor truck. Table 5 – Degritting Facility Grit Removal Data
GRIT GRIT YIELD MONTH FLOW
(MGD) WT. (TONS/DAY)
GRIT VOL1 (CY/D)
(CY/MG) (CF/MG)
1 368 22.30 26.89 0.07 1.97 2 383 20.90 25.21 0.07 1.78 3 425 40.60 48.96 0.12 3.11 4 382 31.50 37.99 0.10 2.69 5 343 18.50 22.31 0.07 1.76 6 325 15.40 18.57 0.06 1.54 7 330 15.40 18.57 0.06 1.52 8 331 19.90 24.00 0.07 1.96 9 310 22.20 26.77 0.09 2.33 10 299 13.60 16.40 0.05 1.48 11 288 7.60 9.17 0.03 0.86 12 298 8.70 10.49 0.04 0.95
Average 340 19.72 23.78 0.07 1.83 1Calculated from Blue Plains Plant Performance Summary and Degritting and Grinding Report. The Degritting Facility was found to catch a significant quantity of grit. It is not decipherable as to what quantity was due to the east versus west sides, so for the purposes of the study, it was
1957
WEFTEC®.06
Copyright 2006 Water Environment Foundation. All Rights Reserved©
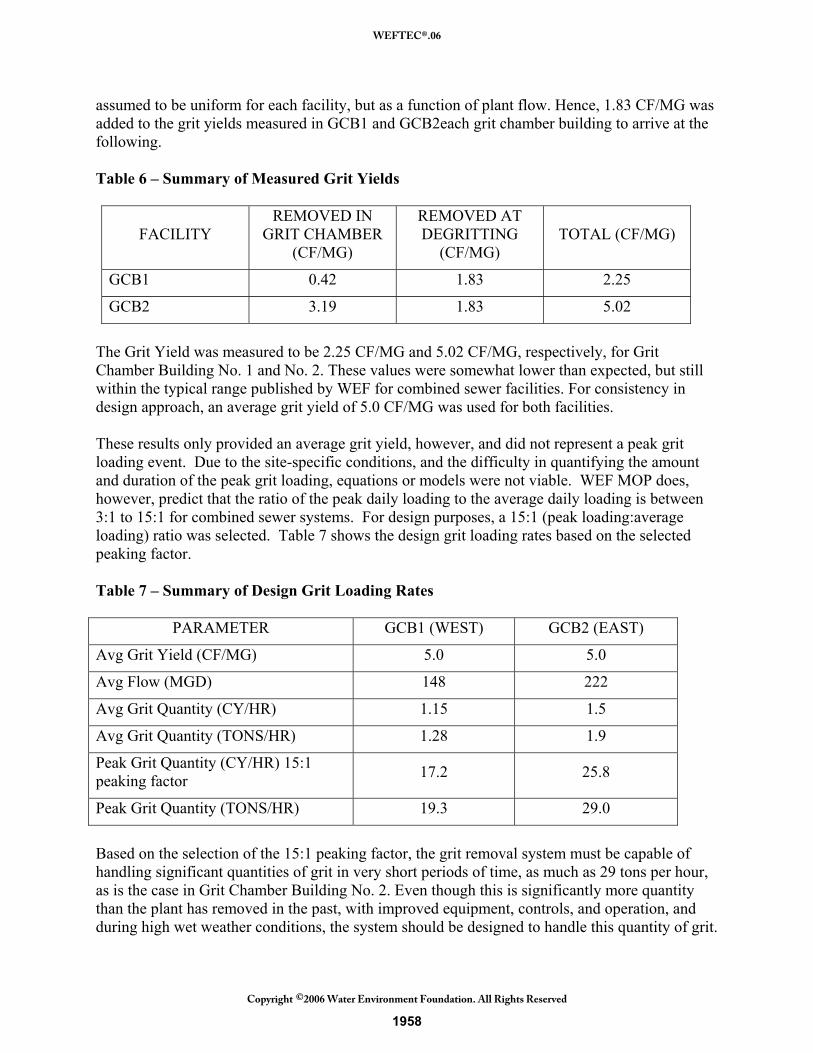
assumed to be uniform for each facility, but as a function of plant flow. Hence, 1.83 CF/MG was added to the grit yields measured in GCB1 and GCB2each grit chamber building to arrive at the following. Table 6 – Summary of Measured Grit Yields
FACILITY REMOVED IN
GRIT CHAMBER (CF/MG)
REMOVED AT DEGRITTING
(CF/MG) TOTAL (CF/MG)
GCB1 0.42 1.83 2.25
GCB2 3.19 1.83 5.02
The Grit Yield was measured to be 2.25 CF/MG and 5.02 CF/MG, respectively, for Grit Chamber Building No. 1 and No. 2. These values were somewhat lower than expected, but still within the typical range published by WEF for combined sewer facilities. For consistency in design approach, an average grit yield of 5.0 CF/MG was used for both facilities. These results only provided an average grit yield, however, and did not represent a peak grit loading event. Due to the site-specific conditions, and the difficulty in quantifying the amount and duration of the peak grit loading, equations or models were not viable. WEF MOP does, however, predict that the ratio of the peak daily loading to the average daily loading is between 3:1 to 15:1 for combined sewer systems. For design purposes, a 15:1 (peak loading:average loading) ratio was selected. Table 7 shows the design grit loading rates based on the selected peaking factor. Table 7 – Summary of Design Grit Loading Rates
PARAMETER GCB1 (WEST) GCB2 (EAST)
Avg Grit Yield (CF/MG) 5.0 5.0
Avg Flow (MGD) 148 222
Avg Grit Quantity (CY/HR) 1.15 1.5
Avg Grit Quantity (TONS/HR) 1.28 1.9
Peak Grit Quantity (CY/HR) 15:1 peaking factor 17.2 25.8
Peak Grit Quantity (TONS/HR) 19.3 29.0
Based on the selection of the 15:1 peaking factor, the grit removal system must be capable of handling significant quantities of grit in very short periods of time, as much as 29 tons per hour, as is the case in Grit Chamber Building No. 2. Even though this is significantly more quantity than the plant has removed in the past, with improved equipment, controls, and operation, and during high wet weather conditions, the system should be designed to handle this quantity of grit.
1958
WEFTEC®.06
Copyright 2006 Water Environment Foundation. All Rights Reserved©
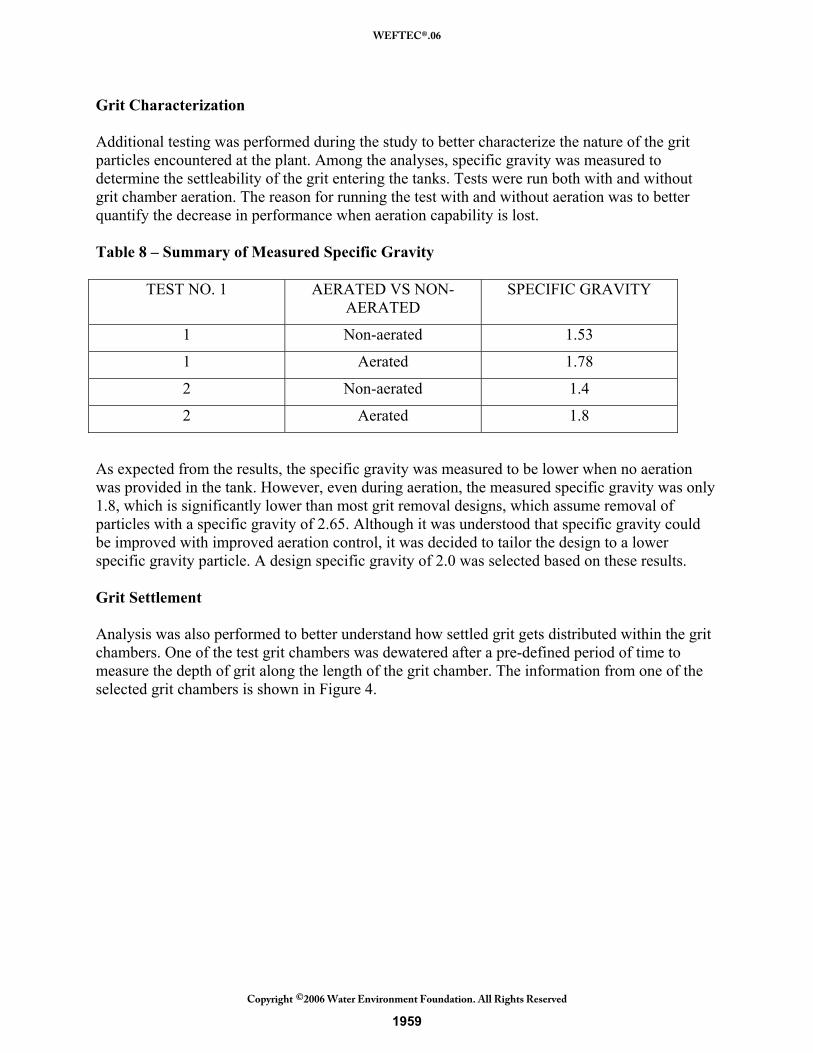
Grit Characterization Additional testing was performed during the study to better characterize the nature of the grit particles encountered at the plant. Among the analyses, specific gravity was measured to determine the settleability of the grit entering the tanks. Tests were run both with and without grit chamber aeration. The reason for running the test with and without aeration was to better quantify the decrease in performance when aeration capability is lost. Table 8 – Summary of Measured Specific Gravity
TEST NO. 1 AERATED VS NON-AERATED
SPECIFIC GRAVITY
1 Non-aerated 1.53
1 Aerated 1.78
2 Non-aerated 1.4
2 Aerated 1.8
As expected from the results, the specific gravity was measured to be lower when no aeration was provided in the tank. However, even during aeration, the measured specific gravity was only 1.8, which is significantly lower than most grit removal designs, which assume removal of particles with a specific gravity of 2.65. Although it was understood that specific gravity could be improved with improved aeration control, it was decided to tailor the design to a lower specific gravity particle. A design specific gravity of 2.0 was selected based on these results. Grit Settlement Analysis was also performed to better understand how settled grit gets distributed within the grit chambers. One of the test grit chambers was dewatered after a pre-defined period of time to measure the depth of grit along the length of the grit chamber. The information from one of the selected grit chambers is shown in Figure 4.
1959
WEFTEC®.06
Copyright 2006 Water Environment Foundation. All Rights Reserved©
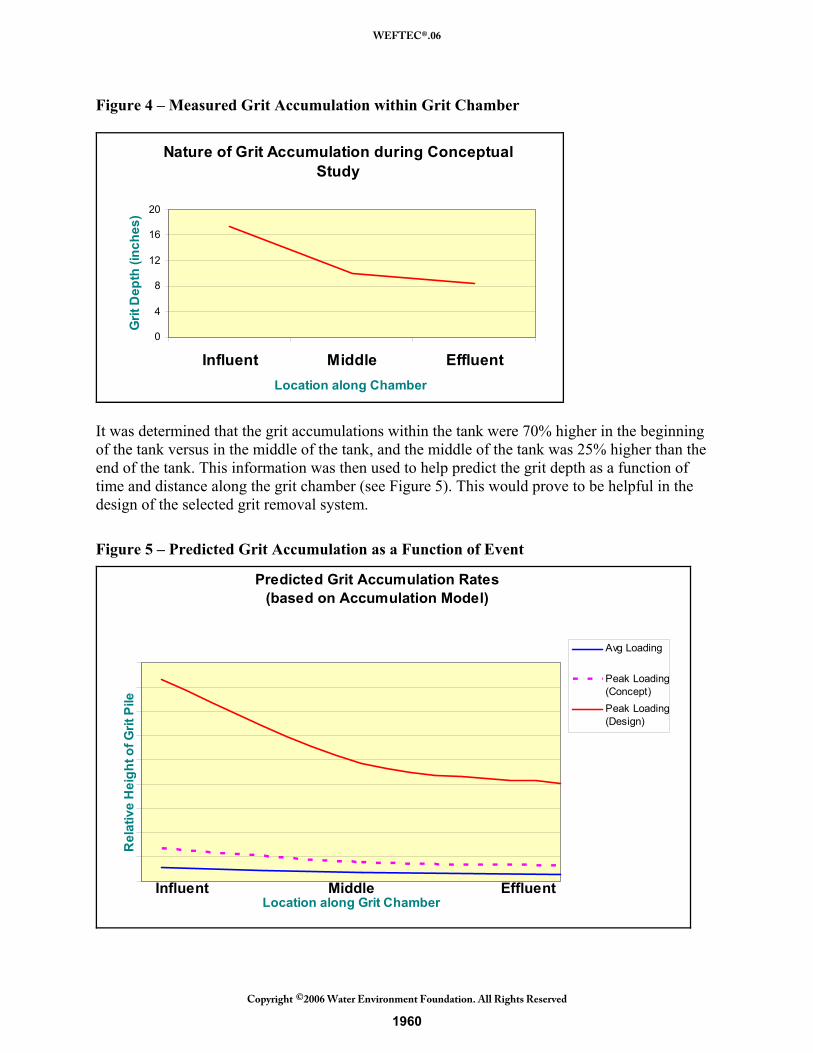
Figure 4 – Measured Grit Accumulation within Grit Chamber
Nature of Grit Accumulation during Conceptual Study
0
4
8
12
16
20
Influent Middle EffluentLocation along Chamber
Grit
Dep
th (i
nche
s)
It was determined that the grit accumulations within the tank were 70% higher in the beginning of the tank versus in the middle of the tank, and the middle of the tank was 25% higher than the end of the tank. This information was then used to help predict the grit depth as a function of time and distance along the grit chamber (see Figure 5). This would prove to be helpful in the design of the selected grit removal system.
Figure 5 – Predicted Grit Accumulation as a Function of Event
Predicted Grit Accumulation Rates(based on Accumulation Model)
Location along Grit Chamber
Rel
ativ
e H
eigh
t of G
rit P
ile
Avg Loading
Peak Loading(Concept)Peak Loading(Design)
Influent EffluentMiddle
1960
WEFTEC®.06
Copyright 2006 Water Environment Foundation. All Rights Reserved©
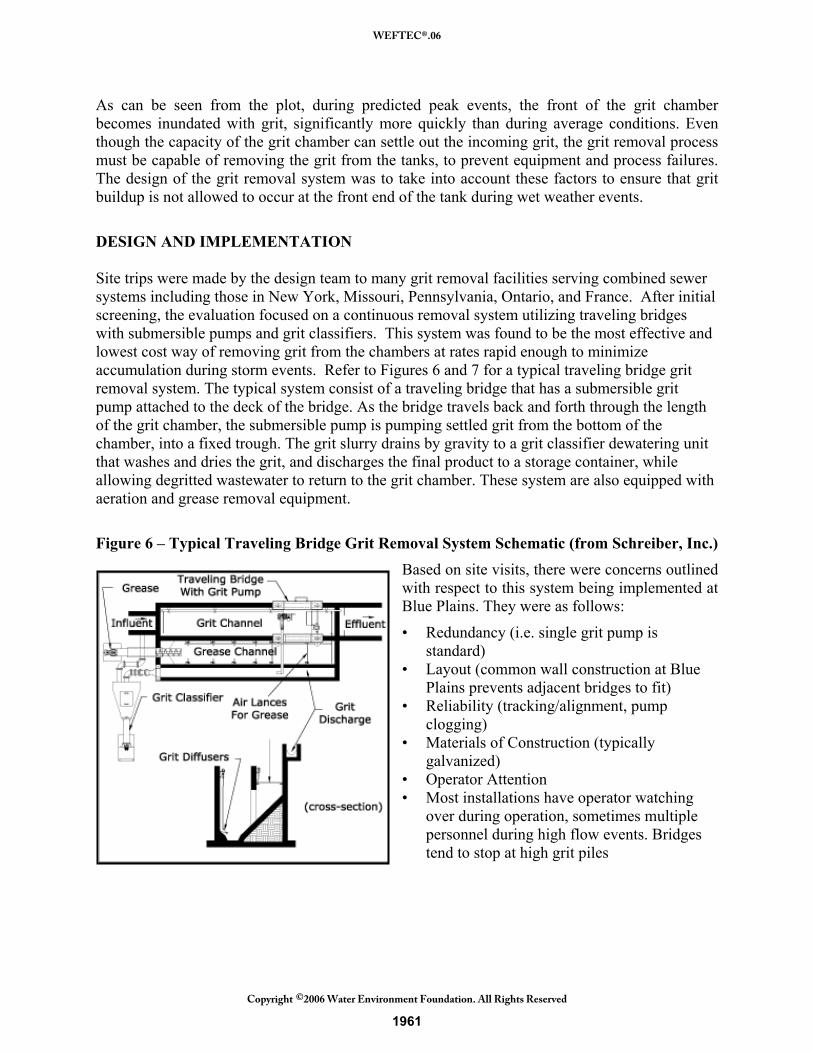
As can be seen from the plot, during predicted peak events, the front of the grit chamber becomes inundated with grit, significantly more quickly than during average conditions. Even though the capacity of the grit chamber can settle out the incoming grit, the grit removal process must be capable of removing the grit from the tanks, to prevent equipment and process failures. The design of the grit removal system was to take into account these factors to ensure that grit buildup is not allowed to occur at the front end of the tank during wet weather events.
DESIGN AND IMPLEMENTATION Site trips were made by the design team to many grit removal facilities serving combined sewer systems including those in New York, Missouri, Pennsylvania, Ontario, and France. After initial screening, the evaluation focused on a continuous removal system utilizing traveling bridges with submersible pumps and grit classifiers. This system was found to be the most effective and lowest cost way of removing grit from the chambers at rates rapid enough to minimize accumulation during storm events. Refer to Figures 6 and 7 for a typical traveling bridge grit removal system. The typical system consist of a traveling bridge that has a submersible grit pump attached to the deck of the bridge. As the bridge travels back and forth through the length of the grit chamber, the submersible pump is pumping settled grit from the bottom of the chamber, into a fixed trough. The grit slurry drains by gravity to a grit classifier dewatering unit that washes and dries the grit, and discharges the final product to a storage container, while allowing degritted wastewater to return to the grit chamber. These system are also equipped with aeration and grease removal equipment.
Figure 6 – Typical Traveling Bridge Grit Removal System Schematic (from Schreiber, Inc.) Based on site visits, there were concerns outlined with respect to this system being implemented at Blue Plains. They were as follows:
• Redundancy (i.e. single grit pump is standard)
• Layout (common wall construction at Blue Plains prevents adjacent bridges to fit)
• Reliability (tracking/alignment, pump clogging)
• Materials of Construction (typically galvanized)
• Operator Attention • Most installations have operator watching
over during operation, sometimes multiple personnel during high flow events. Bridges tend to stop at high grit piles
1961
WEFTEC®.06
Copyright 2006 Water Environment Foundation. All Rights Reserved©
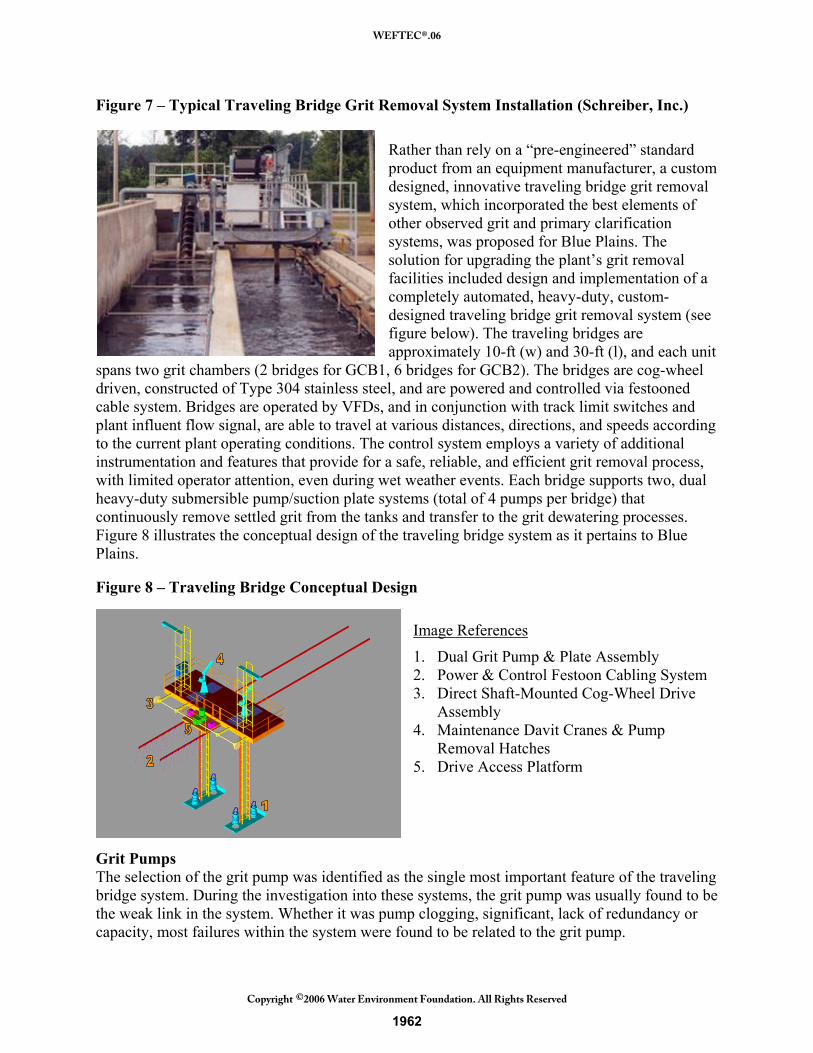
Figure 7 – Typical Traveling Bridge Grit Removal System Installation (Schreiber, Inc.)
Rather than rely on a “pre-engineered” standard product from an equipment manufacturer, a custom designed, innovative traveling bridge grit removal system, which incorporated the best elements of other observed grit and primary clarification systems, was proposed for Blue Plains. The solution for upgrading the plant’s grit removal facilities included design and implementation of a completely automated, heavy-duty, custom-designed traveling bridge grit removal system (see figure below). The traveling bridges are approximately 10-ft (w) and 30-ft (l), and each unit
spans two grit chambers (2 bridges for GCB1, 6 bridges for GCB2). The bridges are cog-wheel driven, constructed of Type 304 stainless steel, and are powered and controlled via festooned cable system. Bridges are operated by VFDs, and in conjunction with track limit switches and plant influent flow signal, are able to travel at various distances, directions, and speeds according to the current plant operating conditions. The control system employs a variety of additional instrumentation and features that provide for a safe, reliable, and efficient grit removal process, with limited operator attention, even during wet weather events. Each bridge supports two, dual heavy-duty submersible pump/suction plate systems (total of 4 pumps per bridge) that continuously remove settled grit from the tanks and transfer to the grit dewatering processes. Figure 8 illustrates the conceptual design of the traveling bridge system as it pertains to Blue Plains. Figure 8 – Traveling Bridge Conceptual Design
Image References
1. Dual Grit Pump & Plate Assembly 2. Power & Control Festoon Cabling System 3. Direct Shaft-Mounted Cog-Wheel Drive
Assembly 4. Maintenance Davit Cranes & Pump
Removal Hatches 5. Drive Access Platform
Grit Pumps The selection of the grit pump was identified as the single most important feature of the traveling bridge system. During the investigation into these systems, the grit pump was usually found to be the weak link in the system. Whether it was pump clogging, significant, lack of redundancy or capacity, most failures within the system were found to be related to the grit pump.
1962
WEFTEC®.06
Copyright 2006 Water Environment Foundation. All Rights Reserved©
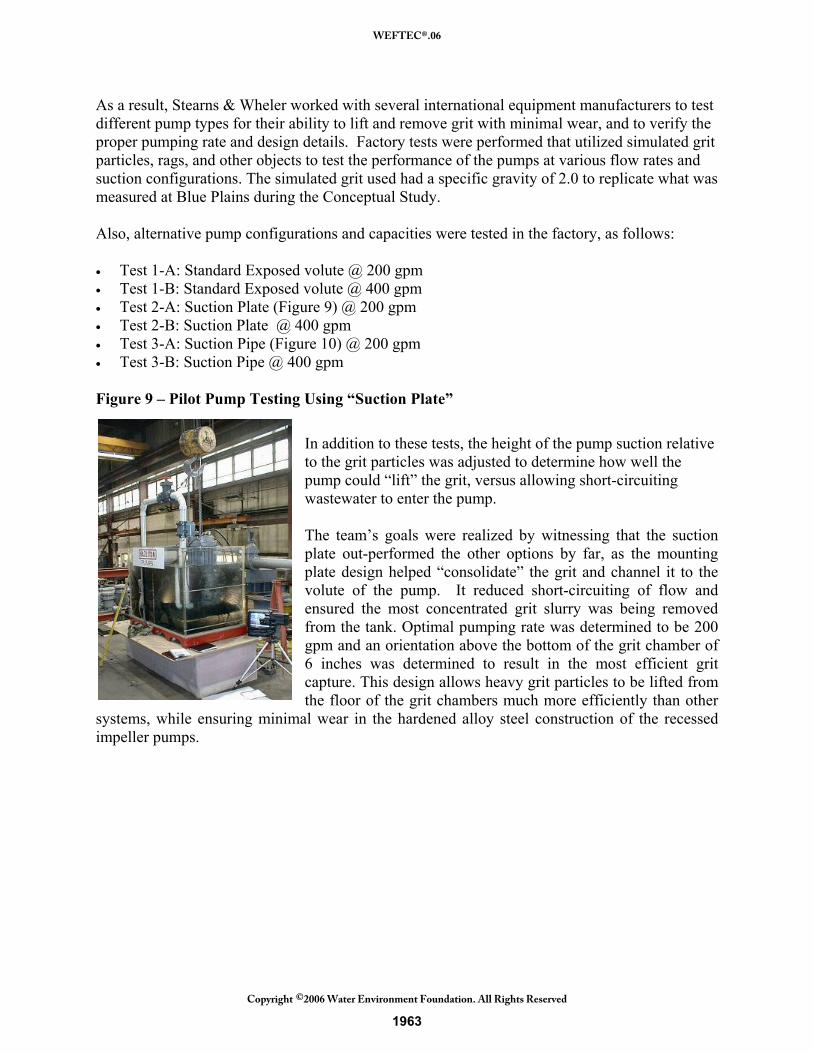
As a result, Stearns & Wheler worked with several international equipment manufacturers to test different pump types for their ability to lift and remove grit with minimal wear, and to verify the proper pumping rate and design details. Factory tests were performed that utilized simulated grit particles, rags, and other objects to test the performance of the pumps at various flow rates and suction configurations. The simulated grit used had a specific gravity of 2.0 to replicate what was measured at Blue Plains during the Conceptual Study. Also, alternative pump configurations and capacities were tested in the factory, as follows: • Test 1-A: Standard Exposed volute @ 200 gpm • Test 1-B: Standard Exposed volute @ 400 gpm • Test 2-A: Suction Plate (Figure 9) @ 200 gpm • Test 2-B: Suction Plate @ 400 gpm • Test 3-A: Suction Pipe (Figure 10) @ 200 gpm • Test 3-B: Suction Pipe @ 400 gpm Figure 9 – Pilot Pump Testing Using “Suction Plate”
In addition to these tests, the height of the pump suction relative to the grit particles was adjusted to determine how well the pump could “lift” the grit, versus allowing short-circuiting wastewater to enter the pump. The team’s goals were realized by witnessing that the suction plate out-performed the other options by far, as the mounting plate design helped “consolidate” the grit and channel it to the volute of the pump. It reduced short-circuiting of flow and ensured the most concentrated grit slurry was being removed from the tank. Optimal pumping rate was determined to be 200 gpm and an orientation above the bottom of the grit chamber of 6 inches was determined to result in the most efficient grit capture. This design allows heavy grit particles to be lifted from the floor of the grit chambers much more efficiently than other
systems, while ensuring minimal wear in the hardened alloy steel construction of the recessed impeller pumps.
1963
WEFTEC®.06
Copyright 2006 Water Environment Foundation. All Rights Reserved©
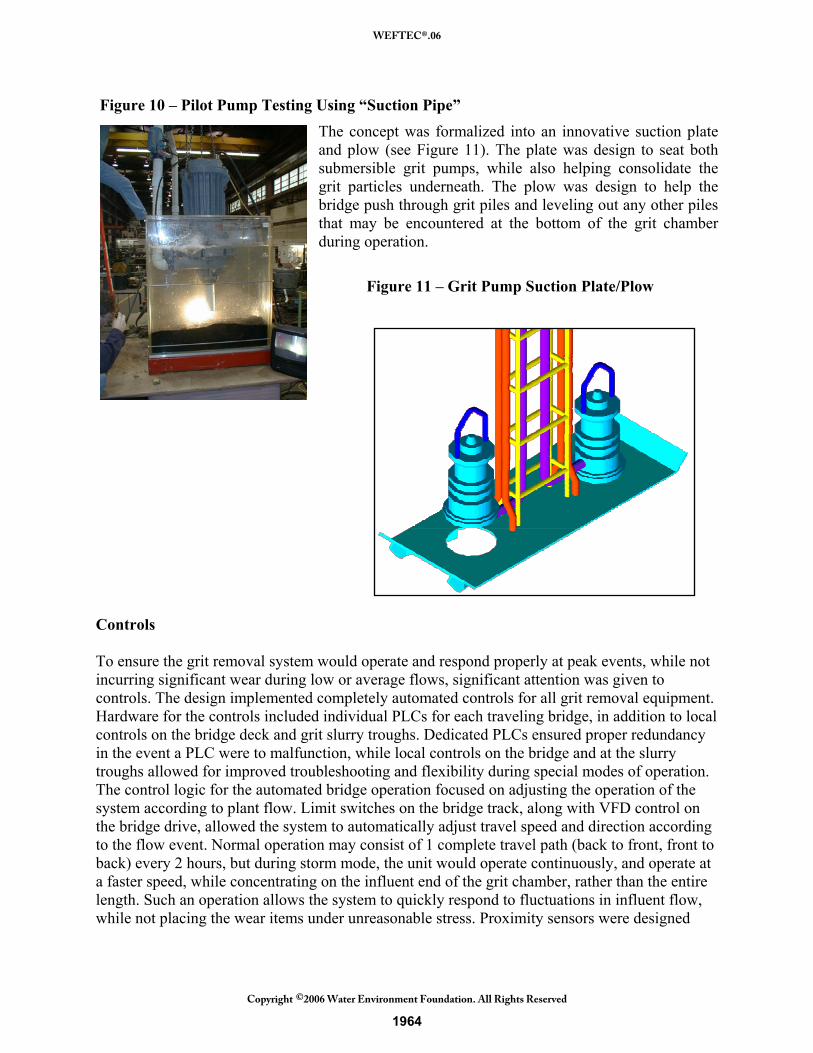
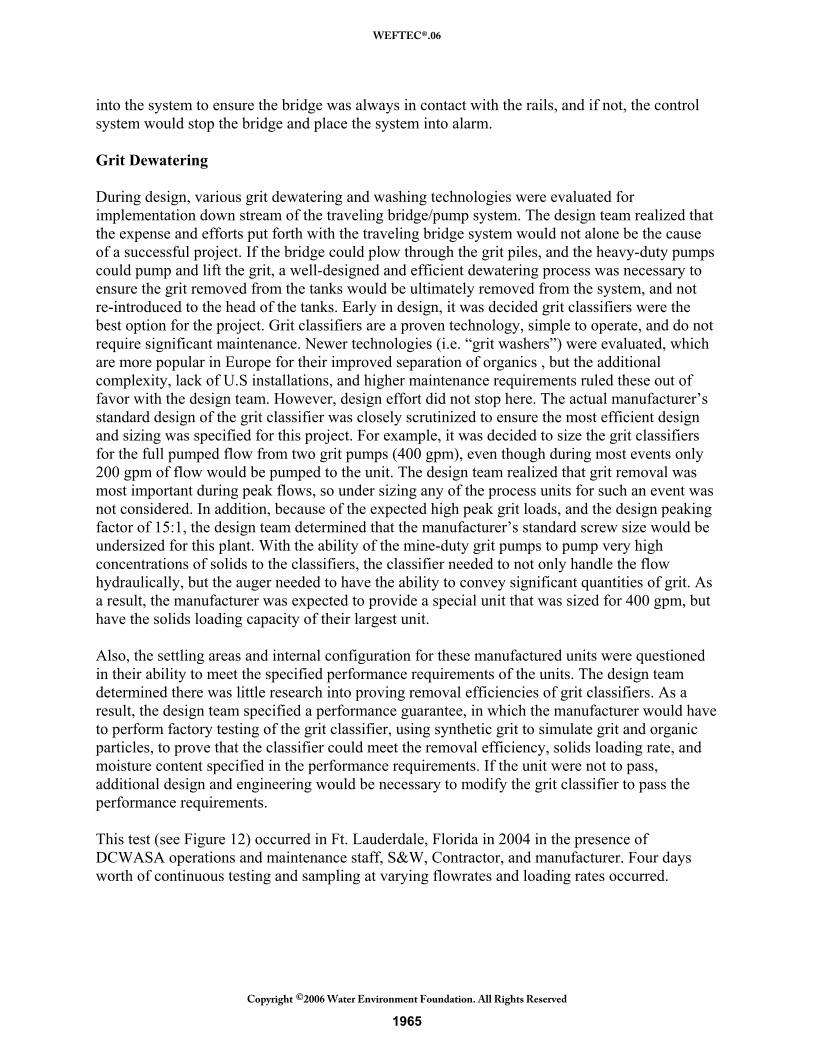
Figure 10 – Pilot Pump Testing Using “Suction Pipe” The concept was formalized into an innovative suction plate and plow (see Figure 11). The plate was design to seat both submersible grit pumps, while also helping consolidate the grit particles underneath. The plow was design to help the bridge push through grit piles and leveling out any other piles that may be encountered at the bottom of the grit chamber during operation.
Figure 11 – Grit Pump Suction Plate/Plow
Controls To ensure the grit removal system would operate and respond properly at peak events, while not incurring significant wear during low or average flows, significant attention was given to controls. The design implemented completely automated controls for all grit removal equipment. Hardware for the controls included individual PLCs for each traveling bridge, in addition to local controls on the bridge deck and grit slurry troughs. Dedicated PLCs ensured proper redundancy in the event a PLC were to malfunction, while local controls on the bridge and at the slurry troughs allowed for improved troubleshooting and flexibility during special modes of operation. The control logic for the automated bridge operation focused on adjusting the operation of the system according to plant flow. Limit switches on the bridge track, along with VFD control on the bridge drive, allowed the system to automatically adjust travel speed and direction according to the flow event. Normal operation may consist of 1 complete travel path (back to front, front to back) every 2 hours, but during storm mode, the unit would operate continuously, and operate at a faster speed, while concentrating on the influent end of the grit chamber, rather than the entire length. Such an operation allows the system to quickly respond to fluctuations in influent flow, while not placing the wear items under unreasonable stress. Proximity sensors were designed
1964
WEFTEC®.06
Copyright 2006 Water Environment Foundation. All Rights Reserved©
into the system to ensure the bridge was always in contact with the rails, and if not, the control system would stop the bridge and place the system into alarm. Grit Dewatering During design, various grit dewatering and washing technologies were evaluated for implementation down stream of the traveling bridge/pump system. The design team realized that the expense and efforts put forth with the traveling bridge system would not alone be the cause of a successful project. If the bridge could plow through the grit piles, and the heavy-duty pumps could pump and lift the grit, a well-designed and efficient dewatering process was necessary to ensure the grit removed from the tanks would be ultimately removed from the system, and not re-introduced to the head of the tanks. Early in design, it was decided grit classifiers were the best option for the project. Grit classifiers are a proven technology, simple to operate, and do not require significant maintenance. Newer technologies (i.e. “grit washers”) were evaluated, which are more popular in Europe for their improved separation of organics , but the additional complexity, lack of U.S installations, and higher maintenance requirements ruled these out of favor with the design team. However, design effort did not stop here. The actual manufacturer’s standard design of the grit classifier was closely scrutinized to ensure the most efficient design and sizing was specified for this project. For example, it was decided to size the grit classifiers for the full pumped flow from two grit pumps (400 gpm), even though during most events only 200 gpm of flow would be pumped to the unit. The design team realized that grit removal was most important during peak flows, so under sizing any of the process units for such an event was not considered. In addition, because of the expected high peak grit loads, and the design peaking factor of 15:1, the design team determined that the manufacturer’s standard screw size would be undersized for this plant. With the ability of the mine-duty grit pumps to pump very high concentrations of solids to the classifiers, the classifier needed to not only handle the flow hydraulically, but the auger needed to have the ability to convey significant quantities of grit. As a result, the manufacturer was expected to provide a special unit that was sized for 400 gpm, but have the solids loading capacity of their largest unit. Also, the settling areas and internal configuration for these manufactured units were questioned in their ability to meet the specified performance requirements of the units. The design team determined there was little research into proving removal efficiencies of grit classifiers. As a result, the design team specified a performance guarantee, in which the manufacturer would have to perform factory testing of the grit classifier, using synthetic grit to simulate grit and organic particles, to prove that the classifier could meet the removal efficiency, solids loading rate, and moisture content specified in the performance requirements. If the unit were not to pass, additional design and engineering would be necessary to modify the grit classifier to pass the performance requirements. This test (see Figure 12) occurred in Ft. Lauderdale, Florida in 2004 in the presence of DCWASA operations and maintenance staff, S&W, Contractor, and manufacturer. Four days worth of continuous testing and sampling at varying flowrates and loading rates occurred.
1965
WEFTEC®.06
Copyright 2006 Water Environment Foundation. All Rights Reserved©
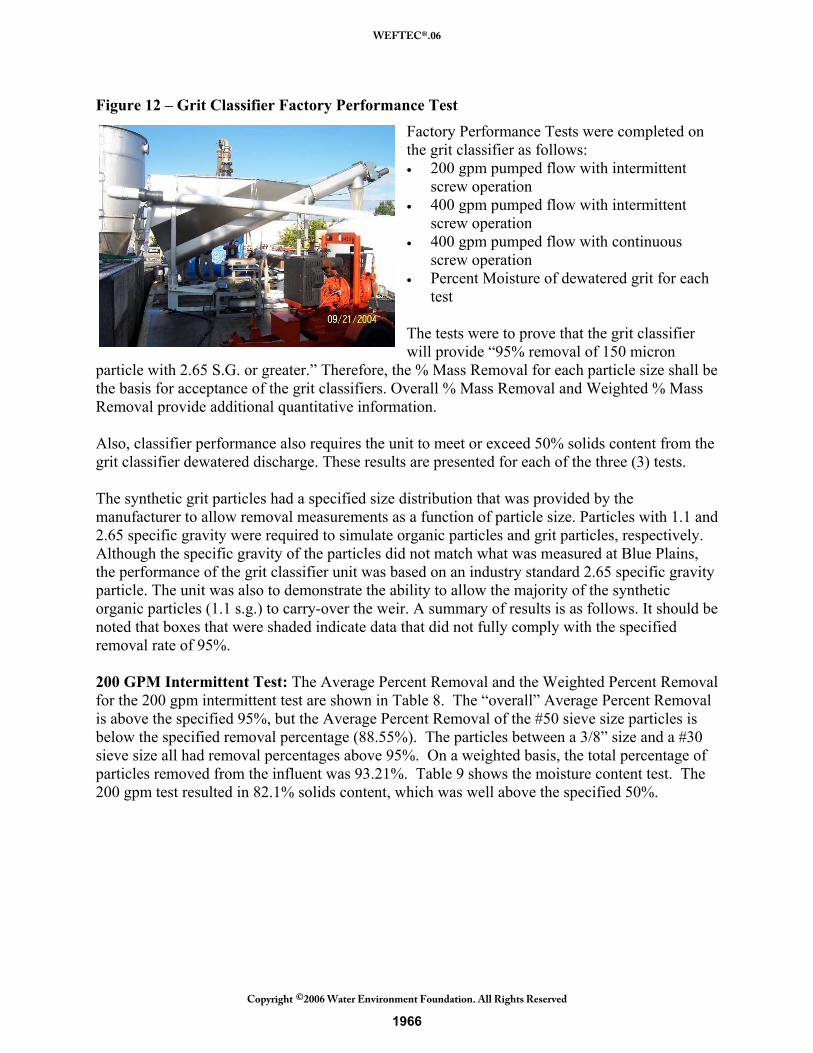
Figure 12 – Grit Classifier Factory Performance Test Factory Performance Tests were completed on the grit classifier as follows: • 200 gpm pumped flow with intermittent
screw operation • 400 gpm pumped flow with intermittent
screw operation • 400 gpm pumped flow with continuous
screw operation • Percent Moisture of dewatered grit for each
test The tests were to prove that the grit classifier will provide “95% removal of 150 micron
particle with 2.65 S.G. or greater.” Therefore, the % Mass Removal for each particle size shall be the basis for acceptance of the grit classifiers. Overall % Mass Removal and Weighted % Mass Removal provide additional quantitative information.
Also, classifier performance also requires the unit to meet or exceed 50% solids content from the grit classifier dewatered discharge. These results are presented for each of the three (3) tests. The synthetic grit particles had a specified size distribution that was provided by the manufacturer to allow removal measurements as a function of particle size. Particles with 1.1 and 2.65 specific gravity were required to simulate organic particles and grit particles, respectively. Although the specific gravity of the particles did not match what was measured at Blue Plains, the performance of the grit classifier unit was based on an industry standard 2.65 specific gravity particle. The unit was also to demonstrate the ability to allow the majority of the synthetic organic particles (1.1 s.g.) to carry-over the weir. A summary of results is as follows. It should be noted that boxes that were shaded indicate data that did not fully comply with the specified removal rate of 95%. 200 GPM Intermittent Test: The Average Percent Removal and the Weighted Percent Removal for the 200 gpm intermittent test are shown in Table 8. The “overall” Average Percent Removal is above the specified 95%, but the Average Percent Removal of the #50 sieve size particles is below the specified removal percentage (88.55%). The particles between a 3/8” size and a #30 sieve size all had removal percentages above 95%. On a weighted basis, the total percentage of particles removed from the influent was 93.21%. Table 9 shows the moisture content test. The 200 gpm test resulted in 82.1% solids content, which was well above the specified 50%.
1966
WEFTEC®.06
Copyright 2006 Water Environment Foundation. All Rights Reserved©
Table 8 - 200 GPM Intermittent Test: Percent Removal of 2.65 specific gravity particles
Sieve Size 3/8” 4 8 16 30 50 100 Overall Average % Removal
100.00% 100.00% 100.00% 94.68% 99.75% 88.55% 95.84% 96.97% Average
Weighted % Removal
0.550% 0.550% 1.21% 1.90% 11.39% 39.29% 38.21% 93.10% Total
Table 9 - 200 GPM Intermittent Test: Solids Content Percent Solids
82.1% 400 GPM Intermittent Test: The Average Percent Removal and the Weighted Percent Removal for the 400 gpm intermittent test are shown in Table 10. The “overall” Average Percent Removal is above the specified 95%, but the Average Percent Removal of the #50 and #100 sieve size particles are below the specified removal percentage (91.56% and 82.20% in lieu of 95%). The particles between a 3/8” size and a #30 sieve size all had removal percentages above 95%. On a weighted basis, the total percentage of particles removed from the influent was 92.76%. Table 11 shows the moisture content test. The 400 gpm test resulted in 85.1% solids content. The overall results of the 200 gpm test and the 400 gpm test showed a slight increase in grit removal with the decreased flow (97% vs. 95.5%). Since there was more detention time at 200 gpm, more of the smaller particles were allowed to settle. Table 10 - 400 GPM Intermittent Test: Percent Removal 2.65 specific gravity particles
Sieve Size 3/8” 4 8 16 30 50 100 Overall Average % Removal
100.00% 100.00% 100.00% 95.04% 97.67% 91.56% 82.20% 95.21% Average
Weighted % Removal
0.550% 0.550% 1.21% 1.91% 11.15% 40.63% 36.76% 92.76% Total
Table 11 - 400 GPM Intermittent Test: Solids Content
Percent Solids 85.1%
400 GPM Continuous Test: The Average Percent Removal and the Weighted Percent Removal for the 400 gpm continuous test are shown in Table 12. The “overall” Average Percent Removal is above the specified 95%, but the Average Percent Removal of the #16, 30, 50, and 100 sieve size particles are below the specified removal percentage (93.06%, 94.51%, 87.16%, and 93.67%). The particles between a 3/8” size and a #8 sieve size all had removal percentages above 95%. On a weighted basis, the total percentage of particles removed from the influent was
1967
WEFTEC®.06
Copyright 2006 Water Environment Foundation. All Rights Reserved©
90.98%. Table 13 shows the moisture content test. The 400 gpm continuous test resulted in 76.5% solids content. The overall results of the 400 gpm continuous test showed less removal and a slightly wetter sample than the 400 gpm intermittent test. This result was expected because the continuous running of the auger causes more resuspension of the grit. Also, the continuous running of the auger does not allow the grit to air dry after removal. Table 12 - 400 GPM Continuous Test: Percent Removal 2.65 specific gravity particles
Sieve Size 3/8” 4 8 16 30 50 100 Overall Average % Removal
100.00% 100.00% 100.00% 93.06% 94.51% 87.16% 93.67% 95.48% Average
Weighted % Removal
0.550% 0.550% 1.21% 1.87% 10.79% 38.67% 37.34% 90.98% Total
Table 13 - 400 GPM Continuous Test: Solids Content
Percent Solids 76.5%
The conclusions that were made is that “overall” Average Removal Percentages of the 200 gpm and 400 gpm intermittent tests met the specified 95% removal. Although this “overall” Average Removal Percentage meets the requirements, certain sieve sizes (“shaded” boxes) did not individually meet the 95% removal requirement. However, considering the use of synthetic grit as the simulated grit slurry, and possible laboratory error in performing the particle size analysis, the shop tests were favorable and recommended for installation at Blue Plains. The 1.1 specific gravity particles were not measured and separated like the 2.65 specific gravity particles. Since there were no measurable performance requirements for organic particles, only qualitative observations were made. These observations noted that the majority of these 1.1 specific gravity particles did carryover the effluent weir as intended. Some of these lighter particles became entrained into the larger particles, especially at lower pumping rates. There were some interesting operational observations that were made during the testing that proved relevant to Blue Plains. First, there was no significant decrease in performance when the 400 gpm intermittent test was run versus the 200 gpm intermittent test. As shown in the results, both tests exceeded 95% overall removal of 150 micron and larger particles. Also, the performance of the 400 gpm continuous test was comparable to the 400 gpm intermittent test (both had overall removals in excess of 95%). However, the continuous test did result in a 10% higher moisture content of the grit discharge. This moisture content is expected to be even higher for actual grit. During storm events, the 400 gpm continuous run could be the preferred mode of operation; however, due to excess equipment wear and the reduction in quality of the dewatered grit, the classifier should be operated on a intermittent basis (i.e. timer controlled) during normal operation. A 10% or greater increase in moisture content could have a significant impact on odor, storage capacity, and hauling costs.
1968
WEFTEC®.06
Copyright 2006 Water Environment Foundation. All Rights Reserved©
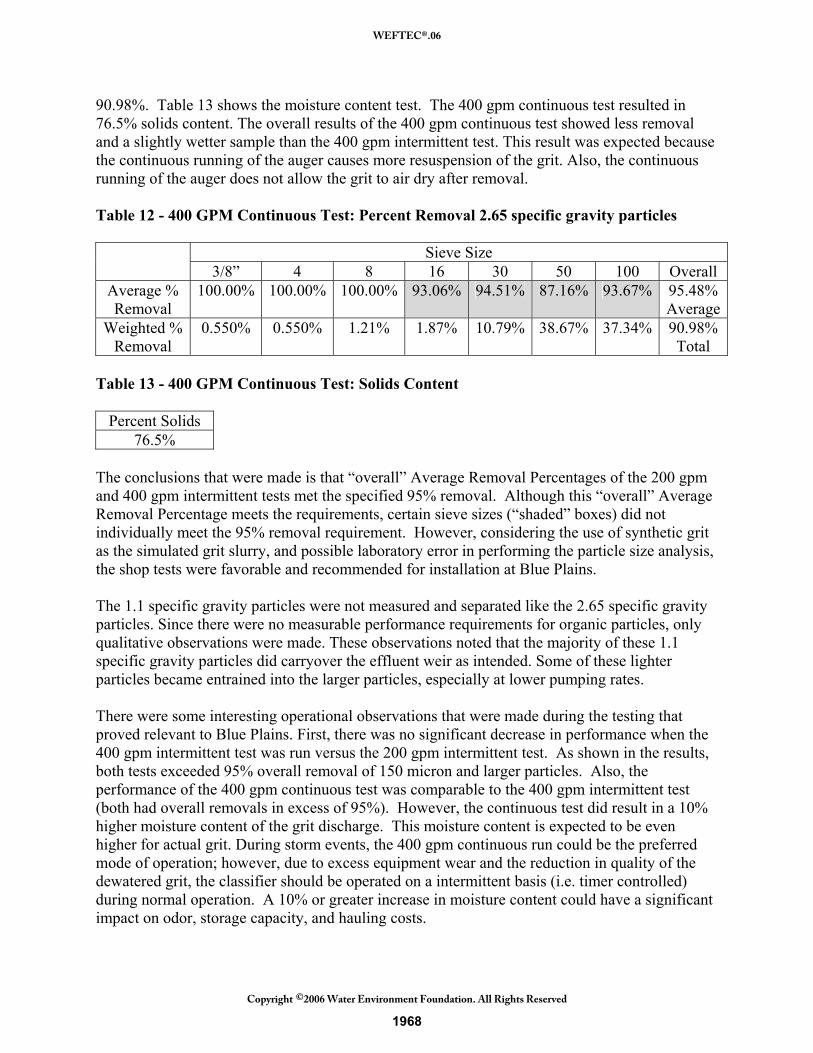
INSTALLATION, STARTUP AND TESTING To summarize the equipment involved (see Figure 13) in the grit removal system, each traveling bridge spans two aerated grit chambers, and there are four submersible pumps mounted on each traveling bridge. Davit cranes on the traveling bridge allow removal and replacement of grit pumps. The pumps discharge to two parallel overhead grit slurry troughs. There are walkways at each trough to allow observation of the grit slurry as it is discharged from the pump. Each trough sluices the grit slurry to a grit classifier dewatering unit. The dewatered grit discharged from the classifiers is carried by a series of toughing belt conveyors to a separate loading facility, where the grit is automatically loaded evenly throughout the set of four roll-off containers or two tractor trailers, using reversible shuttle conveyors. Level sensors are used to ensure the grit is evenly loaded in the storage containers, and scales were designed just outside of the loading facility to ensure the hauling trucks were within the legal weight. Figure 13 – New Grit Chamber Building No. 2 Process Flow Schematic
Figure 14 – Traveling Bridge installation in Grit Chamber Building No. 1
GGrriitt CChhaammbbeerr EEfffflluueenntt
PPuummppeedd GGrriitt CChhaammbbeerr IInnfflluueenntt
IInnfflluueenntt CChhaannnneell
GGrriitt TTrroouugghh
GGrriitt CCllaassssiiffiieerr
GGrriitt C
TTrraavveelliinngg BBrriiddggee aanndd GGrriitt PPuummppss
TToo GGrriitt LLooaaddiinngg FFaacciilliittyy
1969
WEFTEC®.06
Copyright 2006 Water Environment Foundation. All Rights Reserved©
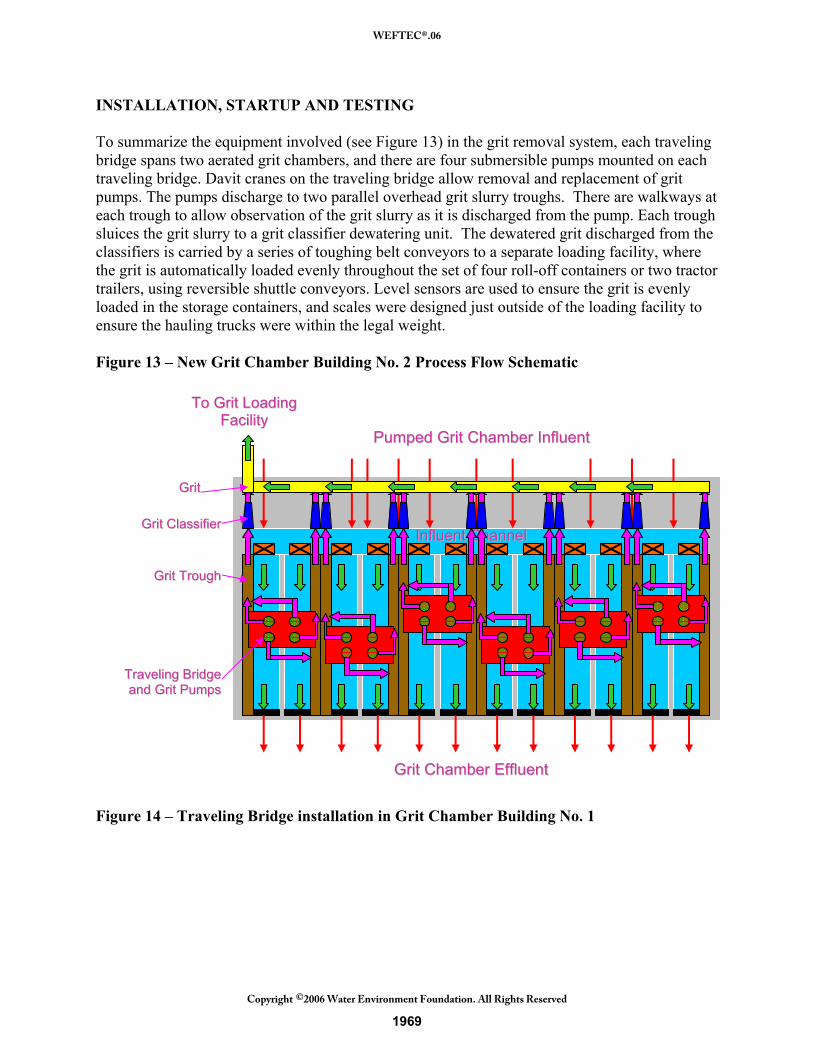
Design was completed in 2001, while construction started in January of 2003. Scheduled final completion for the West Facility (figure above) is Fall of 2006, while scheduled final completion for the East Facility is late 2007. All equipment is installed and has undergone startup testing in Grit Chamber Building No. 1 (see Figures 14 and 15). Field Performance Testing started in March of 2006 and is expected to go through July. In Grit Chamber Building No. 2, 3 traveling bridge systems are installed, with 3 remaining. Field performance
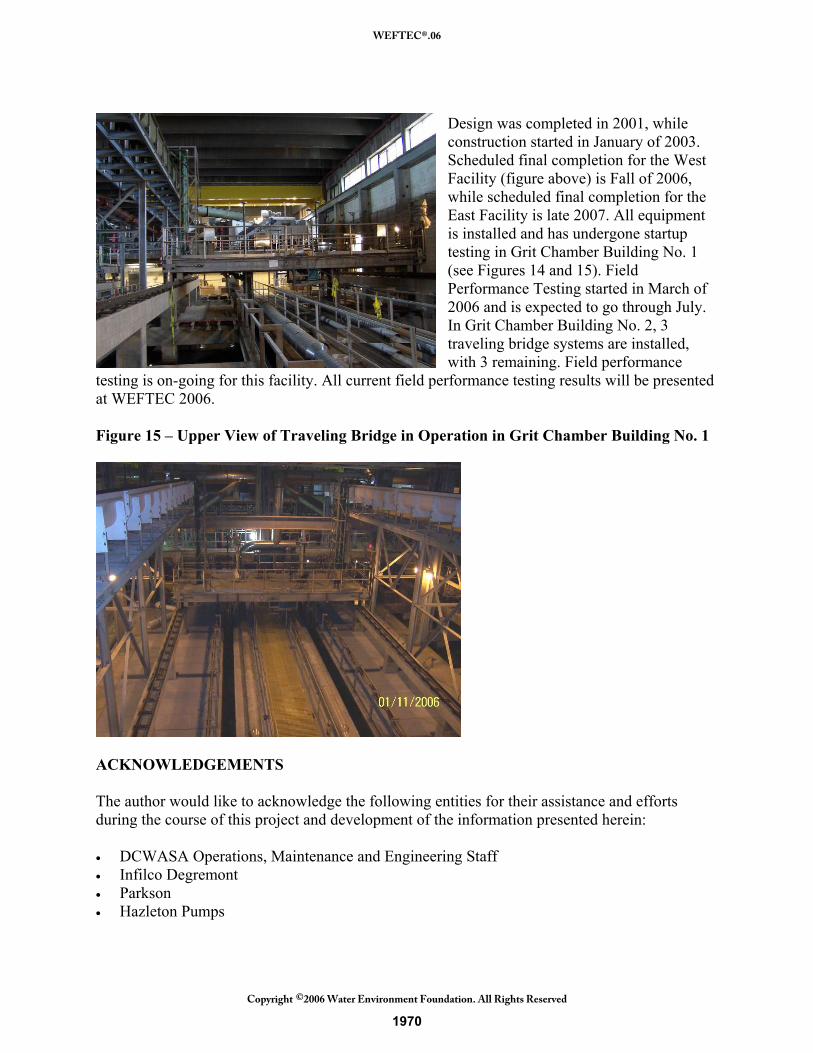
testing is on-going for this facility. All current field performance testing results will be presented at WEFTEC 2006. Figure 15 – Upper View of Traveling Bridge in Operation in Grit Chamber Building No. 1
ACKNOWLEDGEMENTS The author would like to acknowledge the following entities for their assistance and efforts during the course of this project and development of the information presented herein: • DCWASA Operations, Maintenance and Engineering Staff • Infilco Degremont • Parkson • Hazleton Pumps
1970
WEFTEC®.06
Copyright 2006 Water Environment Foundation. All Rights Reserved©