automatic measurement algorithms and methods for...
TRANSCRIPT
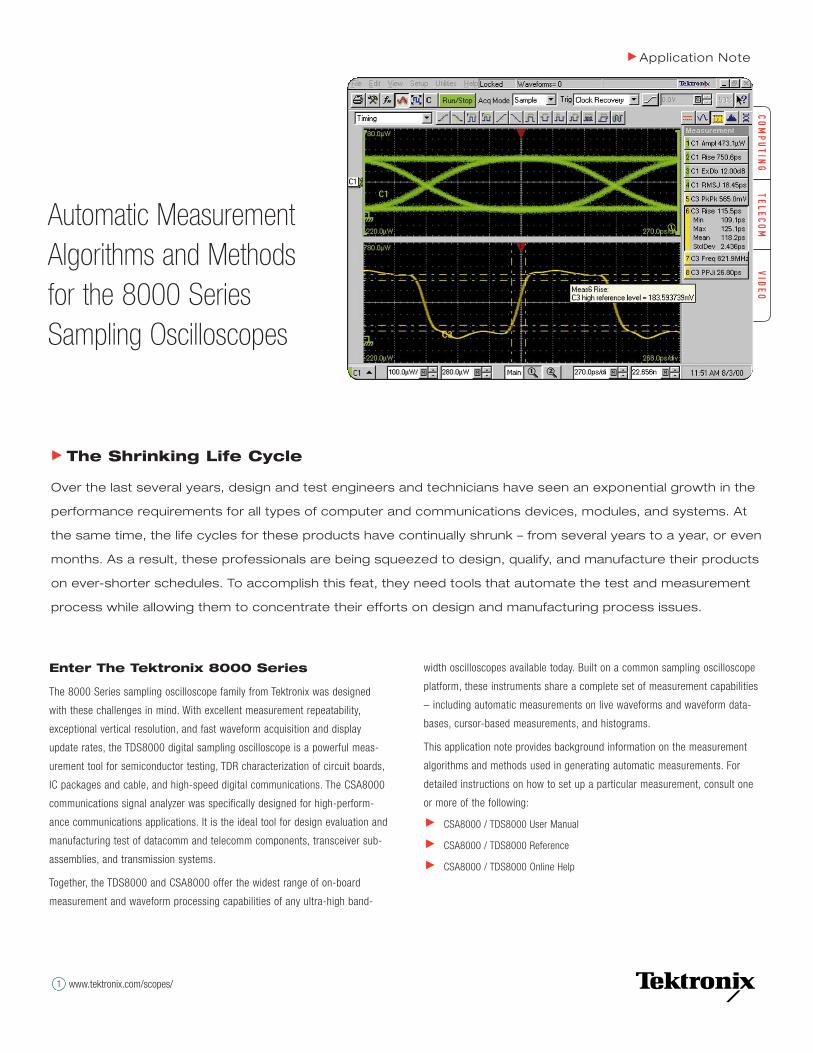
Automatic MeasurementAlgorithms and Methodsfor the 8000 SeriesSampling Oscilloscopes
Over the last several years, design and test engineers and technicians have seen an exponential growth in the
performance requirements for all types of computer and communications devices, modules, and systems. At
the same time, the life cycles for these products have continually shrunk – from several years to a year, or even
months. As a result, these professionals are being squeezed to design, qualify, and manufacture their products
on ever-shorter schedules. To accomplish this feat, they need tools that automate the test and measurement
process while allowing them to concentrate their efforts on design and manufacturing process issues.
Application Note
www.tektronix.com/scopes/1
Enter The Tektronix 8000 Series
The 8000 Series sampling oscilloscope family from Tektronix was designed
with these challenges in mind. With excellent measurement repeatability,
exceptional vertical resolution, and fast waveform acquisition and display
update rates, the TDS8000 digital sampling oscilloscope is a powerful meas-
urement tool for semiconductor testing, TDR characterization of circuit boards,
IC packages and cable, and high-speed digital communications. The CSA8000
communications signal analyzer was specifically designed for high-perform-
ance communications applications. It is the ideal tool for design evaluation and
manufacturing test of datacomm and telecomm components, transceiver sub-
assemblies, and transmission systems.
Together, the TDS8000 and CSA8000 offer the widest range of on-board
measurement and waveform processing capabilities of any ultra-high band-
width oscilloscopes available today. Built on a common sampling oscilloscope
platform, these instruments share a complete set of measurement capabilities
– including automatic measurements on live waveforms and waveform data-
bases, cursor-based measurements, and histograms.
This application note provides background information on the measurement
algorithms and methods used in generating automatic measurements. For
detailed instructions on how to set up a particular measurement, consult one
or more of the following:
CSA8000 / TDS8000 User Manual
CSA8000 / TDS8000 Reference
CSA8000 / TDS8000 Online Help
The Shrinking Life Cycle
Available Automatic Measurement Types
8000 Series sampling oscilloscopes support a wide variety of automatic meas-
urements. Over 40 measurements are supported in one of four categories:
Amplitude, Timing, Area, and Statistical Data-based Measurements. These
measurements, along with the ability to control all of the measurement param-
eters associated with them, allow users to quickly analyze the performance of
the device-under-test and assists them in quickly identifying and correcting
design and/or manufacturing flaws. (For a detailed description of the measure-
ments supported, see Appendix A.)
Source Waveforms for AutomaticMeasurements
In order to provide automated measurements on the wide assortment of signals
that users need to examine, the 8000 Series sampling oscilloscopes support a
variety of measurement algorithms appropriate for these signals.
Given that the 8000 Series oscilloscopes acquire data using sequential equiva-
lent-time sampling, one of two conditions must be satisfied in order to get a
stable display of waveform data:
1. The acquired signal must be repetitive and triggered on a signal synchronous to
the input signal; or
2. The acquired signals must have a fixed clock rate and be triggered on a signal
that is synchronous to that rate.
Signals which meet condition 1, above, are referred to as deterministic signals,
while those which meet condition 2 are referred to as random signals.
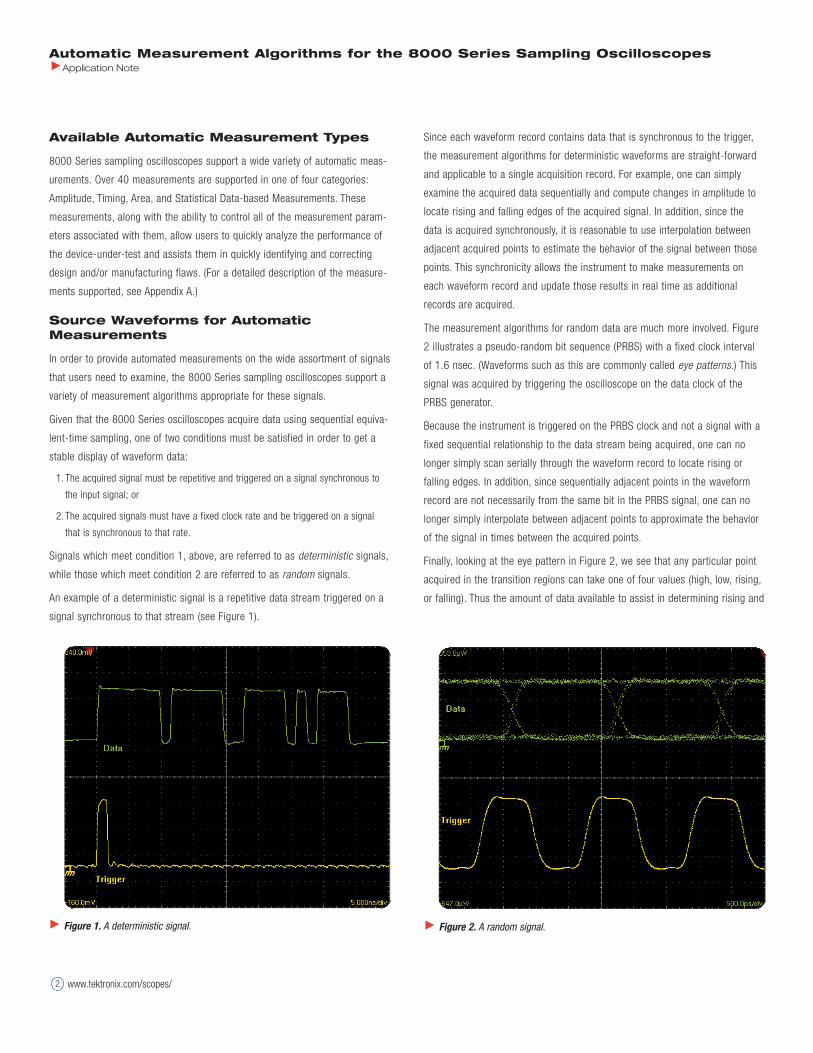
An example of a deterministic signal is a repetitive data stream triggered on a
signal synchronous to that stream (see Figure 1).
Since each waveform record contains data that is synchronous to the trigger,
the measurement algorithms for deterministic waveforms are straight-forward
and applicable to a single acquisition record. For example, one can simply
examine the acquired data sequentially and compute changes in amplitude to
locate rising and falling edges of the acquired signal. In addition, since the
data is acquired synchronously, it is reasonable to use interpolation between
adjacent acquired points to estimate the behavior of the signal between those
points. This synchronicity allows the instrument to make measurements on
each waveform record and update those results in real time as additional
records are acquired.
The measurement algorithms for random data are much more involved. Figure
2 illustrates a pseudo-random bit sequence (PRBS) with a fixed clock interval
of 1.6 nsec. (Waveforms such as this are commonly called eye patterns.) This
signal was acquired by triggering the oscilloscope on the data clock of the
PRBS generator.
Because the instrument is triggered on the PRBS clock and not a signal with a
fixed sequential relationship to the data stream being acquired, one can no
longer simply scan serially through the waveform record to locate rising or
falling edges. In addition, since sequentially adjacent points in the waveform
record are not necessarily from the same bit in the PRBS signal, one can no
longer simply interpolate between adjacent points to approximate the behavior
of the signal in times between the acquired points.
Finally, looking at the eye pattern in Figure 2, we see that any particular point
acquired in the transition regions can take one of four values (high, low, rising,
or falling). Thus the amount of data available to assist in determining rising and
Figure 1. A deterministic signal.
Automatic Measurement Algorithms for the 8000 Series Sampling OscilloscopesApplication Note
www.tektronix.com/scopes/2
Figure 2. A random signal.

falling edges for automated measurements is one-quarter of that available for
deterministic waveforms.
For these and other reasons, an 8000 Series sampling oscilloscope uses a dif-
ferent set of algorithms when making measurements on random waveforms
than it uses with deterministic waveforms. Unfortunately, it is very difficult for
the instrument to determine whether a particular acquired waveform contains
random or deterministic data. Lacking this information, the measurement sys-
tem assumes the waveform is deterministic unless informed otherwise. (Users
can specify the type of data being acquired – deterministic or random – via the
Signal Type control in the Source tab of the Measurement setup dialog. Specify
Pulse for deterministic data or Eye for random data.)
Waveform Databases as MeasurementSources
An additional factor that affects how measurements are made on a signal is
whether the measurements are made on the live signal or on a Waveform
Database. 8000 Series Sampling Oscilloscopes provide two waveform databas-
es that can be used to accumulate waveform data.
A waveform database is a three-dimensional accumulation of a source wave-
form as it is continuously acquired. In addition to the standard amplitude and
timing information, a waveform database has a third dimension of count. The
count represents the number of times a specific waveform point (time and
amplitude) has been acquired
Having gathered data over many waveform acquisition cycles, the instrument
can then use statistical measurement algorithms to return measurement
results on a much larger data sample than available in a single acquisition
cycle. In addition, since the data in a waveform database is not cleared when
acquisition is stopped and restarted, one can choose additional measurements
to make after the data has been acquired.
Setting the Use Wfm Database control in the Source tab of the Measurement
setup dialog causes the selected measurement to be made on the accumulated
data in a waveform database rather than on live data. (See the instrument doc-
umentation or on-line help for further information on waveform databases.)
Topline and Baseline Level Determination
The levels that the automatic measurement system derives as High (Topline)
and Low (Baseline) for a waveform influence the fidelity of many automated
measurements. Depending on the type of waveform being measured, the
instrument will use one of three methods for determining these levels.
1. Mode (of Histogram) – For this method of High and Low level derivation, the
instrument will select the most common value either above or below the midpoint
(depending on whether it is determining the High or Low level). This is done using
histograms on the acquired waveform. Since this statistical approach ignores
short-term aberrations (overshoot, ringing, and so on), Mode, is the best method
for examining pulses. Figure 3 shows graphically the High level for a pulse deter-
mined using the Mode of Histogram method. Also shown is a histogram corre-
sponding to that taken to determine this value.
2. Min-Max – This method uses the highest and lowest values of the waveform
record as its High and Low values. This setting is best for examining waveforms
that have no large, flat portions at a common value, such as sine and triangle
waveforms – almost any deterministic waveform except for pulses (see Figure 4).
3. Mean – For this method of High and Low level derivation, the instrument will set
the reference levels to the mean of the waveform either above or below the mid-
point (depending on whether it is determining the High or Low level). This is done
using histograms on the acquired waveform.
Automatic Measurement Algorithms for the 8000 Series Sampling OscilloscopesApplication Note
www.tektronix.com/scopes/ 3
Figure 3. High level determined using the Mode method. Figure 4. Min/Max method.
Automatic Measurement Algorithms for the 8000 Series Sampling OscilloscopesApplication Note
www.tektronix.com/scopes/4
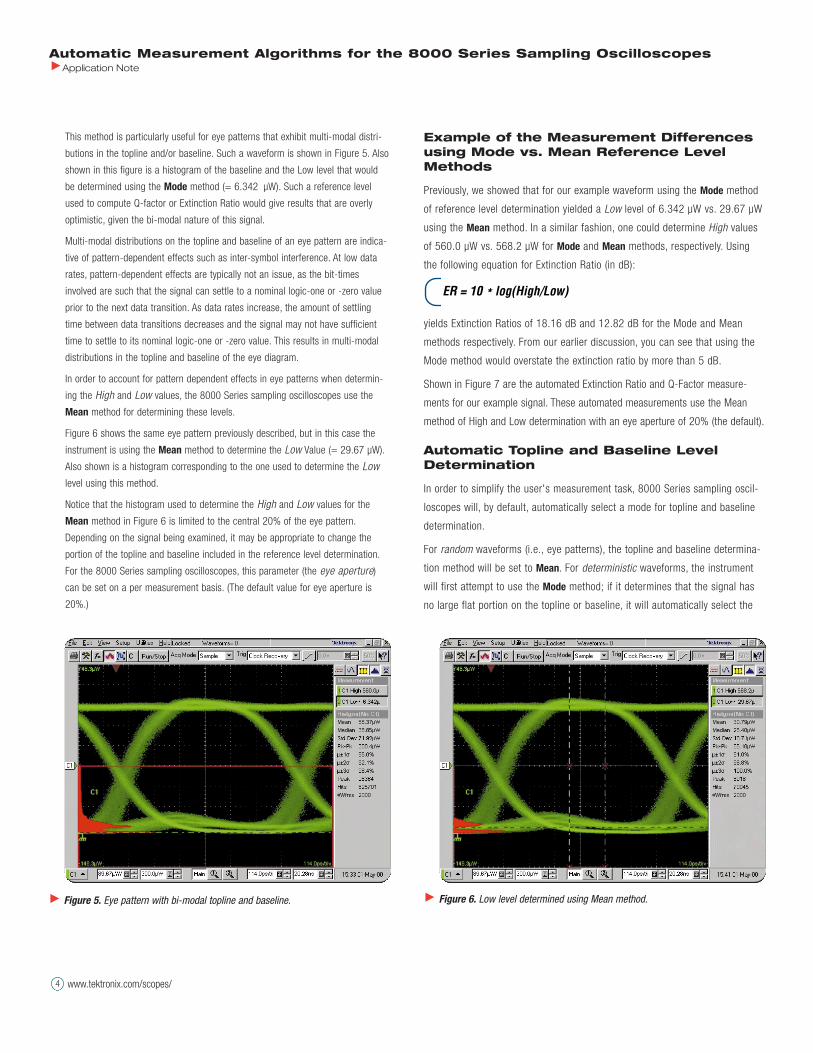
This method is particularly useful for eye patterns that exhibit multi-modal distri-
butions in the topline and/or baseline. Such a waveform is shown in Figure 5. Also
shown in this figure is a histogram of the baseline and the Low level that would
be determined using the Mode method (= 6.342 µW). Such a reference level
used to compute Q-factor or Extinction Ratio would give results that are overly
optimistic, given the bi-modal nature of this signal.
Multi-modal distributions on the topline and baseline of an eye pattern are indica-
tive of pattern-dependent effects such as inter-symbol interference. At low data
rates, pattern-dependent effects are typically not an issue, as the bit-times
involved are such that the signal can settle to a nominal logic-one or -zero value
prior to the next data transition. As data rates increase, the amount of settling
time between data transitions decreases and the signal may not have sufficient
time to settle to its nominal logic-one or -zero value. This results in multi-modal
distributions in the topline and baseline of the eye diagram.
In order to account for pattern dependent effects in eye patterns when determin-
ing the High and Low values, the 8000 Series sampling oscilloscopes use the
Mean method for determining these levels.
Figure 6 shows the same eye pattern previously described, but in this case the
instrument is using the Mean method to determine the Low Value (= 29.67 µW).
Also shown is a histogram corresponding to the one used to determine the Low
level using this method.
Notice that the histogram used to determine the High and Low values for the
Mean method in Figure 6 is limited to the central 20% of the eye pattern.
Depending on the signal being examined, it may be appropriate to change the
portion of the topline and baseline included in the reference level determination.
For the 8000 Series sampling oscilloscopes, this parameter (the eye aperture)
can be set on a per measurement basis. (The default value for eye aperture is
20%.)
Example of the Measurement Differencesusing Mode vs. Mean Reference LevelMethods
Previously, we showed that for our example waveform using the Mode method
of reference level determination yielded a Low level of 6.342 µW vs. 29.67 µW
using the Mean method. In a similar fashion, one could determine High values
of 560.0 µW vs. 568.2 µW for Mode and Mean methods, respectively. Using
the following equation for Extinction Ratio (in dB):
yields Extinction Ratios of 18.16 dB and 12.82 dB for the Mode and Mean
methods respectively. From our earlier discussion, you can see that using the
Mode method would overstate the extinction ratio by more than 5 dB.
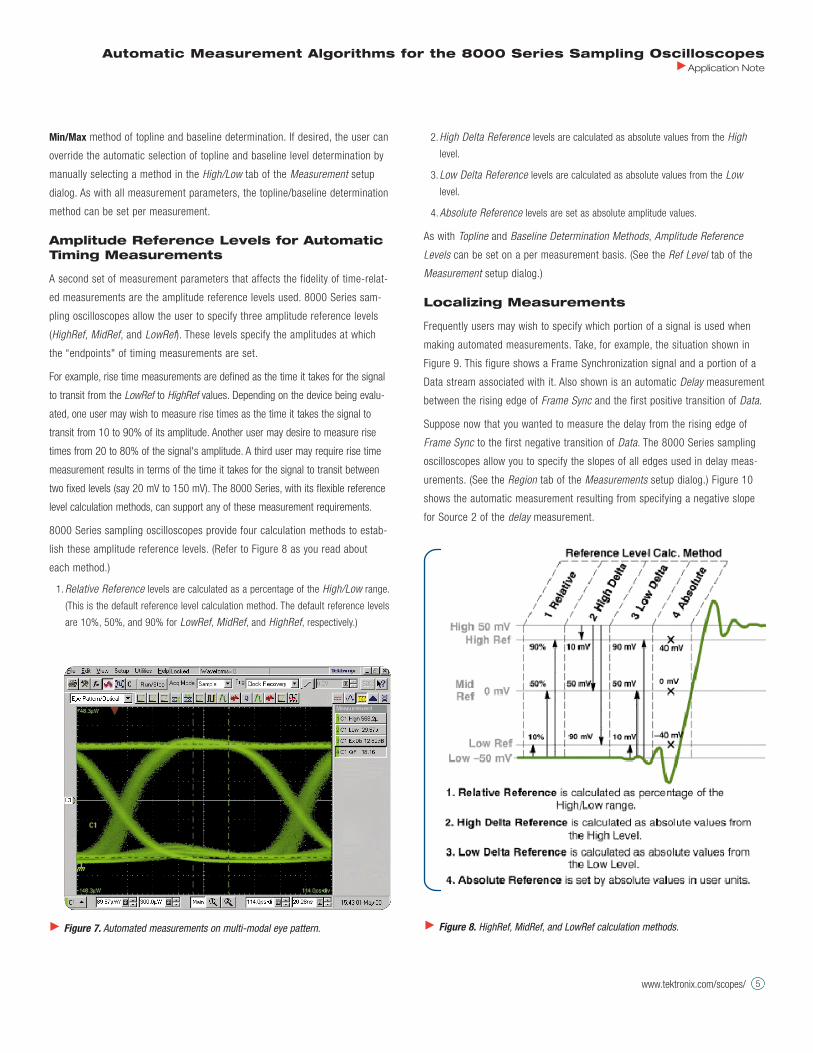
Shown in Figure 7 are the automated Extinction Ratio and Q-Factor measure-
ments for our example signal. These automated measurements use the Mean
method of High and Low determination with an eye aperture of 20% (the default).
Automatic Topline and Baseline LevelDetermination
In order to simplify the user's measurement task, 8000 Series sampling oscil-
loscopes will, by default, automatically select a mode for topline and baseline
determination.
For random waveforms (i.e., eye patterns), the topline and baseline determina-
tion method will be set to Mean. For deterministic waveforms, the instrument
will first attempt to use the Mode method; if it determines that the signal has
no large flat portion on the topline or baseline, it will automatically select the
ER = 10 * log(High/Low)
Figure 5. Eye pattern with bi-modal topline and baseline. Figure 6. Low level determined using Mean method.
Automatic Measurement Algorithms for the 8000 Series Sampling OscilloscopesApplication Note
www.tektronix.com/scopes/ 5
Min/Max method of topline and baseline determination. If desired, the user can
override the automatic selection of topline and baseline level determination by
manually selecting a method in the High/Low tab of the Measurement setup
dialog. As with all measurement parameters, the topline/baseline determination
method can be set per measurement.
Amplitude Reference Levels for AutomaticTiming Measurements
A second set of measurement parameters that affects the fidelity of time-relat-
ed measurements are the amplitude reference levels used. 8000 Series sam-
pling oscilloscopes allow the user to specify three amplitude reference levels
(HighRef, MidRef, and LowRef). These levels specify the amplitudes at which
the “endpoints" of timing measurements are set.
For example, rise time measurements are defined as the time it takes for the signal
to transit from the LowRef to HighRef values. Depending on the device being evalu-
ated, one user may wish to measure rise times as the time it takes the signal to
transit from 10 to 90% of its amplitude. Another user may desire to measure rise
times from 20 to 80% of the signal's amplitude. A third user may require rise time
measurement results in terms of the time it takes for the signal to transit between
two fixed levels (say 20 mV to 150 mV). The 8000 Series, with its flexible reference
level calculation methods, can support any of these measurement requirements.
8000 Series sampling oscilloscopes provide four calculation methods to estab-
lish these amplitude reference levels. (Refer to Figure 8 as you read about
each method.)
1.Relative Reference levels are calculated as a percentage of the High/Low range.
(This is the default reference level calculation method. The default reference levels
are 10%, 50%, and 90% for LowRef, MidRef, and HighRef, respectively.)
2.High Delta Reference levels are calculated as absolute values from the High
level.
3. Low Delta Reference levels are calculated as absolute values from the Low
level.
4.Absolute Reference levels are set as absolute amplitude values.
As with Topline and Baseline Determination Methods, Amplitude Reference
Levels can be set on a per measurement basis. (See the Ref Level tab of the
Measurement setup dialog.)
Localizing Measurements
Frequently users may wish to specify which portion of a signal is used when
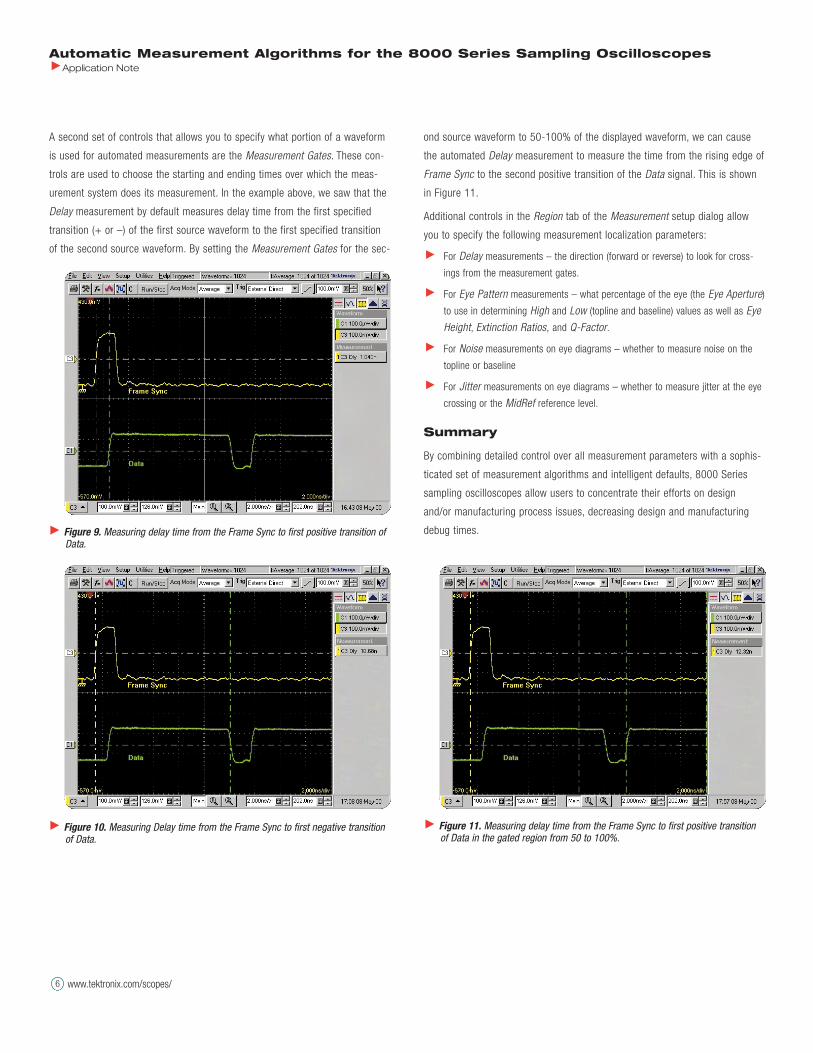
making automated measurements. Take, for example, the situation shown in
Figure 9. This figure shows a Frame Synchronization signal and a portion of a
Data stream associated with it. Also shown is an automatic Delay measurement
between the rising edge of Frame Sync and the first positive transition of Data.
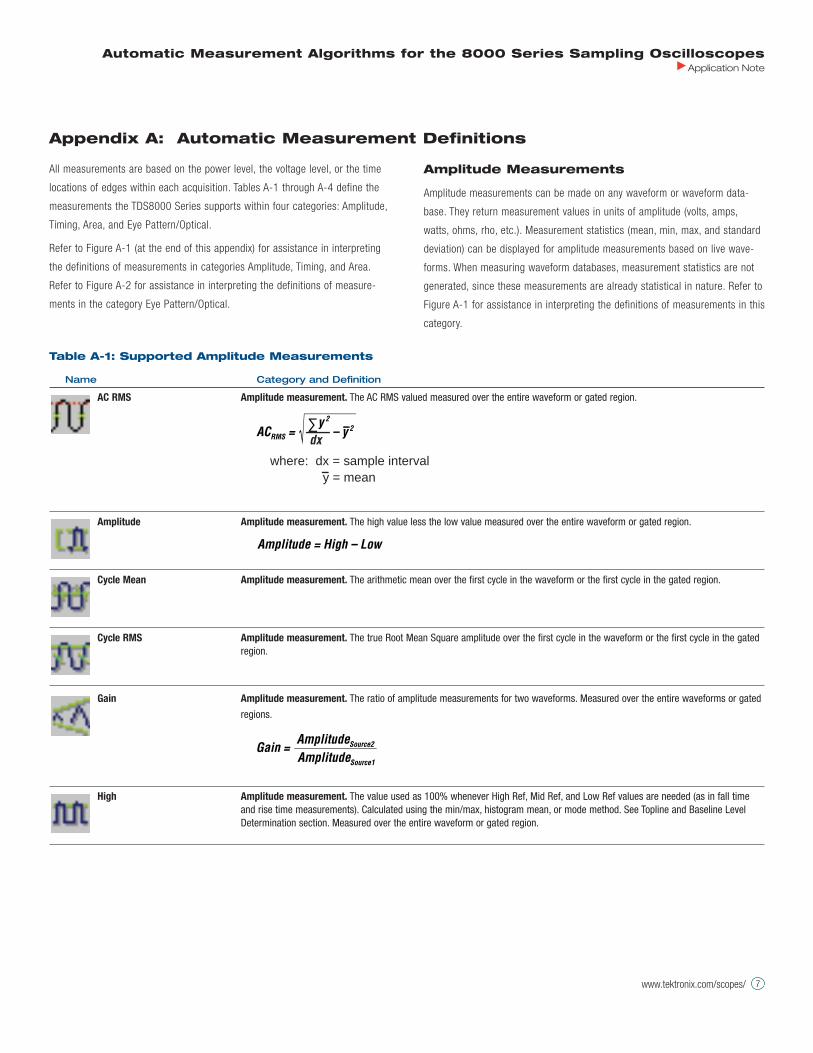
Suppose now that you wanted to measure the delay from the rising edge of
Frame Sync to the first negative transition of Data. The 8000 Series sampling
oscilloscopes allow you to specify the slopes of all edges used in delay meas-
urements. (See the Region tab of the Measurements setup dialog.) Figure 10
shows the automatic measurement resulting from specifying a negative slope
for Source 2 of the delay measurement.
Figure 7. Automated measurements on multi-modal eye pattern. Figure 8. HighRef, MidRef, and LowRef calculation methods.
Automatic Measurement Algorithms for the 8000 Series Sampling OscilloscopesApplication Note
www.tektronix.com/scopes/6
A second set of controls that allows you to specify what portion of a waveform
is used for automated measurements are the Measurement Gates. These con-
trols are used to choose the starting and ending times over which the meas-
urement system does its measurement. In the example above, we saw that the
Delay measurement by default measures delay time from the first specified
transition (+ or –) of the first source waveform to the first specified transition
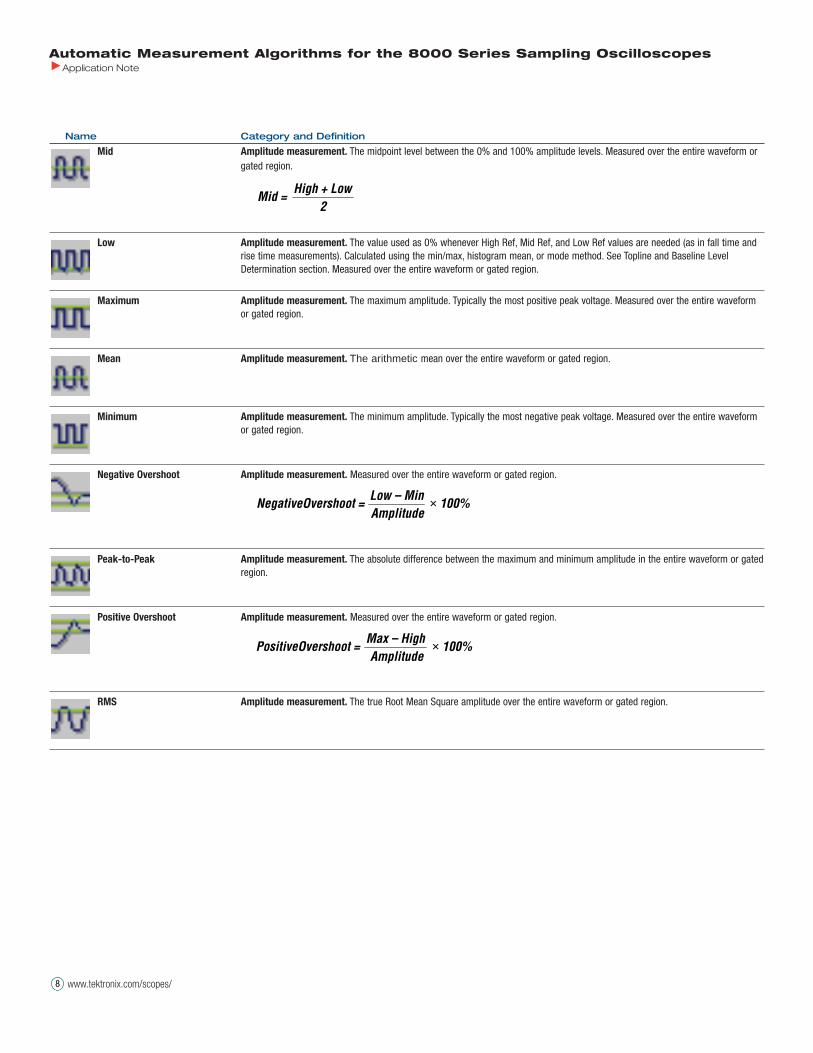
of the second source waveform. By setting the Measurement Gates for the sec-
ond source waveform to 50-100% of the displayed waveform, we can cause
the automated Delay measurement to measure the time from the rising edge of
Frame Sync to the second positive transition of the Data signal. This is shown
in Figure 11.
Additional controls in the Region tab of the Measurement setup dialog allow
you to specify the following measurement localization parameters:
For Delay measurements – the direction (forward or reverse) to look for cross-
ings from the measurement gates.
For Eye Pattern measurements – what percentage of the eye (the Eye Aperture)
to use in determining High and Low (topline and baseline) values as well as Eye
Height, Extinction Ratios, and Q-Factor.
For Noise measurements on eye diagrams – whether to measure noise on the
topline or baseline
For Jitter measurements on eye diagrams – whether to measure jitter at the eye
crossing or the MidRef reference level.
Summary
By combining detailed control over all measurement parameters with a sophis-
ticated set of measurement algorithms and intelligent defaults, 8000 Series
sampling oscilloscopes allow users to concentrate their efforts on design
and/or manufacturing process issues, decreasing design and manufacturing
debug times.
Figure 10. Measuring Delay time from the Frame Sync to first negative transitionof Data.
Figure 11. Measuring delay time from the Frame Sync to first positive transitionof Data in the gated region from 50 to 100%.
Figure 9. Measuring delay time from the Frame Sync to first positive transition ofData.
Automatic Measurement Algorithms for the 8000 Series Sampling OscilloscopesApplication Note
www.tektronix.com/scopes/ 7
All measurements are based on the power level, the voltage level, or the time
locations of edges within each acquisition. Tables A-1 through A-4 define the
measurements the TDS8000 Series supports within four categories: Amplitude,
Timing, Area, and Eye Pattern/Optical.
Refer to Figure A-1 (at the end of this appendix) for assistance in interpreting
the definitions of measurements in categories Amplitude, Timing, and Area.
Refer to Figure A-2 for assistance in interpreting the definitions of measure-
ments in the category Eye Pattern/Optical.
Amplitude Measurements
Amplitude measurements can be made on any waveform or waveform data-
base. They return measurement values in units of amplitude (volts, amps,
watts, ohms, rho, etc.). Measurement statistics (mean, min, max, and standard
deviation) can be displayed for amplitude measurements based on live wave-
forms. When measuring waveform databases, measurement statistics are not
generated, since these measurements are already statistical in nature. Refer to
Figure A-1 for assistance in interpreting the definitions of measurements in this
category.
Appendix A: Automatic Measurement Definitions
Table A-1: Supported Amplitude Measurements
Name Category and Definition
AC RMS Amplitude measurement. The AC RMS valued measured over the entire waveform or gated region.
Amplitude Amplitude measurement. The high value less the low value measured over the entire waveform or gated region.
Cycle Mean Amplitude measurement. The arithmetic mean over the first cycle in the waveform or the first cycle in the gated region.
Cycle RMS Amplitude measurement. The true Root Mean Square amplitude over the first cycle in the waveform or the first cycle in the gatedregion.
Gain Amplitude measurement. The ratio of amplitude measurements for two waveforms. Measured over the entire waveforms or gated
regions.
High Amplitude measurement. The value used as 100% whenever High Ref, Mid Ref, and Low Ref values are needed (as in fall timeand rise time measurements). Calculated using the min/max, histogram mean, or mode method. See Topline and Baseline LevelDetermination section. Measured over the entire waveform or gated region.
Source1
Source2
AmplitudeAmplitude
Gain =
Amplitude = High – Low
ACRMS = ∑y 2
– y 2
dx
where: dx = sample intervaly = mean
Automatic Measurement Algorithms for the 8000 Series Sampling OscilloscopesApplication Note
www.tektronix.com/scopes/88
Mid Amplitude measurement. The midpoint level between the 0% and 100% amplitude levels. Measured over the entire waveform orgated region.
Low Amplitude measurement. The value used as 0% whenever High Ref, Mid Ref, and Low Ref values are needed (as in fall time andrise time measurements). Calculated using the min/max, histogram mean, or mode method. See Topline and Baseline LevelDetermination section. Measured over the entire waveform or gated region.
Maximum Amplitude measurement. The maximum amplitude. Typically the most positive peak voltage. Measured over the entire waveformor gated region.
Mean Amplitude measurement. The arithmetic mean over the entire waveform or gated region.
Minimum Amplitude measurement. The minimum amplitude. Typically the most negative peak voltage. Measured over the entire waveformor gated region.
Negative Overshoot Amplitude measurement. Measured over the entire waveform or gated region.
Peak-to-Peak Amplitude measurement. The absolute difference between the maximum and minimum amplitude in the entire waveform or gatedregion.
Positive Overshoot Amplitude measurement. Measured over the entire waveform or gated region.
RMS Amplitude measurement. The true Root Mean Square amplitude over the entire waveform or gated region.
× 100%Amplitude
Max – HighPositiveOvershoot =
× 100%AmplitudeLow – Min
NegativeOvershoot =
2High + Low
Mid =
Name Category and Definition
Automatic Measurement Algorithms for the 8000 Series Sampling OscilloscopesApplication Note
www.tektronix.com/scopes/ 9
Area Measurements
Area measurements can be made on any waveform or waveform database.
They return measurement values in units of amplitude times time (volt-sec,
watt-sec, etc.). Measurement statistics (mean, min, max, and standard devia-
tion) can be displayed for Area measurements based on live waveforms. When
measuring waveform databases, measurement statistics are not generated,
since these measurements are already statistical in nature. Refer to Figure A-1
for assistance in interpreting the definitions of measurements in this category.
Table A-2: Supported Area Measurements
Name Category and Definition
Area Area measurement. The area over the entire waveform or gated region in vertical units times horizontal units, such as volt-sec-onds and watt-seconds. Area measured above ground is positive; area below ground is negative. Algorithm follows:
if Start = End then return the (interpolated) value at Start
Otherwise,
Cycle Area Area measurement. The area over the first cycle in the waveform, or the first cycle in the gated region, vertical units times horizon-tal units, such as volt-seconds and watt-seconds. Area measured above ground is positive; area below ground is negative.
∫End
Start
Waveform(t)dtArea =
Automatic Measurement Algorithms for the 8000 Series Sampling OscilloscopesApplication Note
www.tektronix.com/scopes/1010
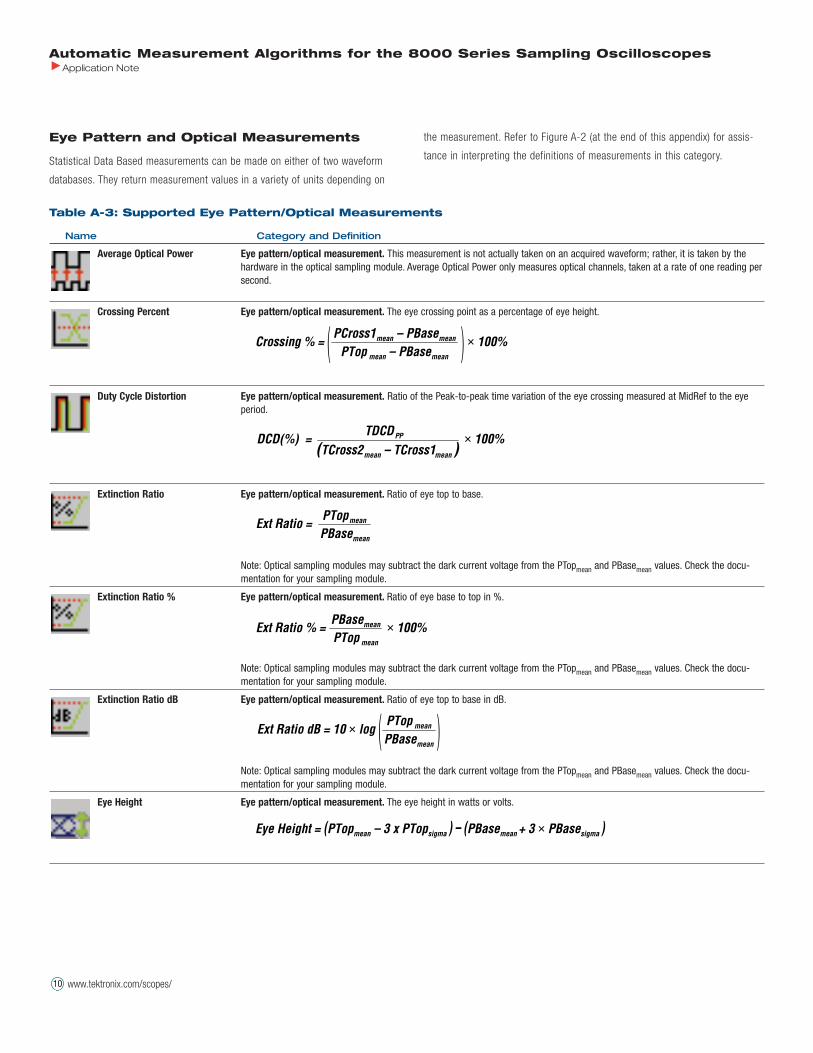
Eye Pattern and Optical Measurements
Statistical Data Based measurements can be made on either of two waveform
databases. They return measurement values in a variety of units depending on
the measurement. Refer to Figure A-2 (at the end of this appendix) for assis-
tance in interpreting the definitions of measurements in this category.
Table A-3: Supported Eye Pattern/Optical Measurements
Name Category and Definition
Average Optical Power Eye pattern/optical measurement. This measurement is not actually taken on an acquired waveform; rather, it is taken by thehardware in the optical sampling module. Average Optical Power only measures optical channels, taken at a rate of one reading persecond.
Crossing Percent Eye pattern/optical measurement. The eye crossing point as a percentage of eye height.
Duty Cycle Distortion Eye pattern/optical measurement. Ratio of the Peak-to-peak time variation of the eye crossing measured at MidRef to the eyeperiod.
Extinction Ratio Eye pattern/optical measurement. Ratio of eye top to base.
Note: Optical sampling modules may subtract the dark current voltage from the PTopmean and PBasemean values. Check the docu-mentation for your sampling module.
Extinction Ratio % Eye pattern/optical measurement. Ratio of eye base to top in %.
Note: Optical sampling modules may subtract the dark current voltage from the PTopmean and PBasemean values. Check the docu-mentation for your sampling module.
Extinction Ratio dB Eye pattern/optical measurement. Ratio of eye top to base in dB.
Note: Optical sampling modules may subtract the dark current voltage from the PTopmean and PBasemean values. Check the docu-mentation for your sampling module.
Eye Height Eye pattern/optical measurement. The eye height in watts or volts.
Eye Height = (PTopmean – 3 x PTopsigma ) – (PBasemean + 3 × PBasesigma )
Ext Ratio dB = 10 × log ( )mean
mean
PBasePTop
Ext Ratio % = × 100%mean
mean
PTopPBase
Ext Ratio =mean
mean
PBasePTop
DCD(%) = × 100%mean )mean
PP
– TCross1(TCross2TDCD
Crossing % = ( ) × 100%–
–
meanmean
meanmean
PBasePTopPBasePCross1
Automatic Measurement Algorithms for the 8000 Series Sampling OscilloscopesApplication Note
www.tektronix.com/scopes/ 11
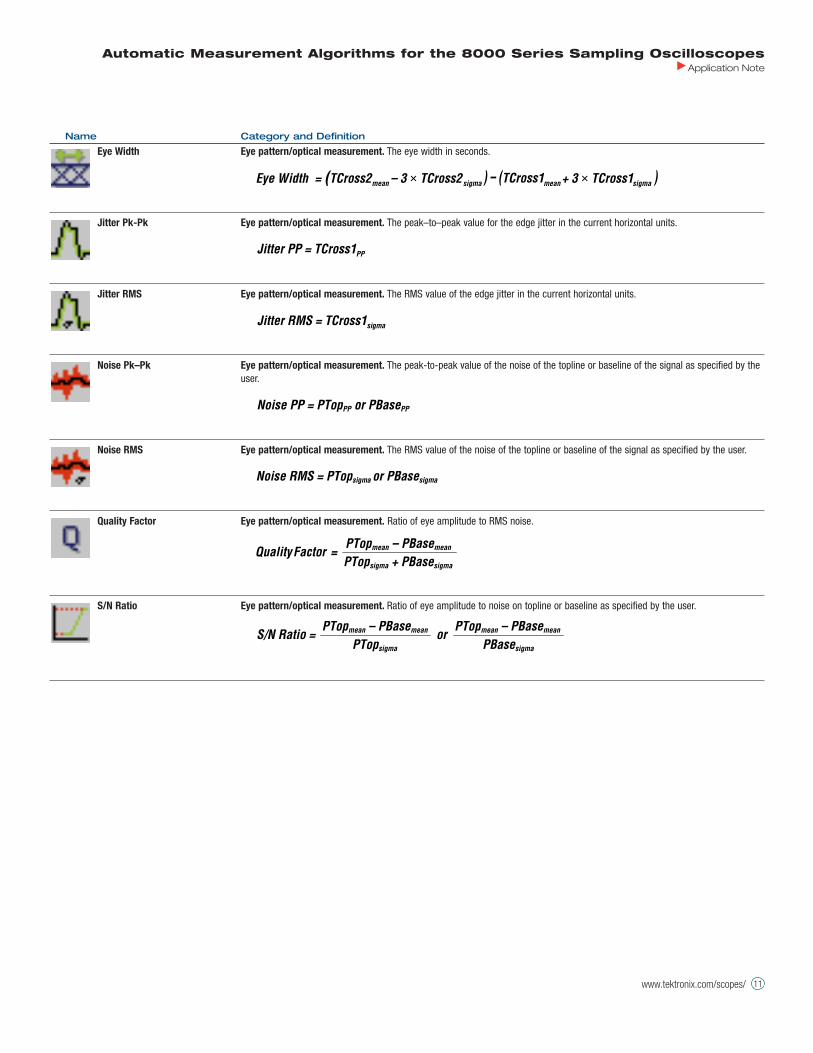
Eye Width Eye pattern/optical measurement. The eye width in seconds.
Jitter Pk-Pk Eye pattern/optical measurement. The peak–to–peak value for the edge jitter in the current horizontal units.
Jitter RMS Eye pattern/optical measurement. The RMS value of the edge jitter in the current horizontal units.
Noise Pk–Pk Eye pattern/optical measurement. The peak-to-peak value of the noise of the topline or baseline of the signal as specified by theuser.
Noise RMS Eye pattern/optical measurement. The RMS value of the noise of the topline or baseline of the signal as specified by the user.
Quality Factor Eye pattern/optical measurement. Ratio of eye amplitude to RMS noise.
S/N Ratio Eye pattern/optical measurement. Ratio of eye amplitude to noise on topline or baseline as specified by the user.
S/N Ratio =PTopsigma
PTopmean – PBasemean or PBasesigma
PTopmean – PBasemean
Quality Factor =PTopsigma + PBasesigma
PTopmean – PBasemean
Noise RMS = PTopsigma or PBasesigma
Noise PP = PTopPP or PBasePP
Jitter RMS = TCross1sigma
Jitter PP = TCross1PP
) – (TCross1 )sigmameansigmamean – 3 × TCross2Eye Width = (TCross2 + 3 × TCross1
Name Category and Definition

Automatic Measurement Algorithms for the 8000 Series Sampling OscilloscopesApplication Note
www.tektronix.com/scopes/12
Timing Measurements
Timing measurements can be made on any waveform or waveform database.
They return measurement values in units of time (seconds or bits).
Measurement statistics (mean, min, max, and standard deviation) can be dis-
played for Timing measurements based on live waveforms. When measuring
waveform databases, measurement statistics are not generated, since these
measurements are already statistical in nature. Refer to Figure A-1 for assis-
tance in interpreting the definitions of measurements in this category.
Table A-4: Supported Timing Measurements
Name Category & Definition
Burst Width Timing measurement. The duration of a burst. It is the time from the 1st Mid Ref crossing in the burst to the last. Measured overthe entire waveform or gated region.
Delay Timing measurement. The time between the Mid Ref crossings of two different traces or the gated region of the traces.
Fall Time Timing measurement. The time taken for the falling edge of the first pulse in the waveform or gated region to fall from a High Refvalue (default = 90%) to a Low Ref value (default =10%) of its final value.
Frequency Timing measurement. The frequency taken for the first cycle in the waveform or in the gated region. The reciprocal of the period.Measured in Hertz (Hz) where 1 Hz = 1 cycle per second.
Negative Crossing Timing measurement. The distance between the trigger and the first negative crossing of the Mid Ref (default 50%) amplitudepoint for a pulse. Measured over the first pulse in the waveform or in the gated region.
Negative Duty Cycle Timing measurement. The ratio of the negative pulse width to the signal period expressed as a percentage. Measured over thefirst cycle in the waveform or in the gated region.
Negative Width Timing measurement. Measured over the first negative pulse in the waveform or in the gated region. Distance (time) between MidRef (default 50%) amplitude points of a negative pulse.
Period Timing measurement. Time it takes for the first complete signal cycle to complete in the waveform or in the gated region. Thereciprocal of frequency. Measured in seconds.
Phase Timing measurement. The amount one waveform leads or lags another in time. Expressed in degrees, where 360° comprise onewaveform cycle.
Positive Crossing Timing measurement. The distance between the trigger and the first positive crossing of the Mid Ref (default 50%) amplitude pointfor a pulse. Measured over the first pulse in the waveform or in the gated region.
× 100%Period
NegativeWidthNegativeDutyCycle =
Automatic Measurement Algorithms for the 8000 Series Sampling OscilloscopesApplication Note
www.tektronix.com/scopes/ 13
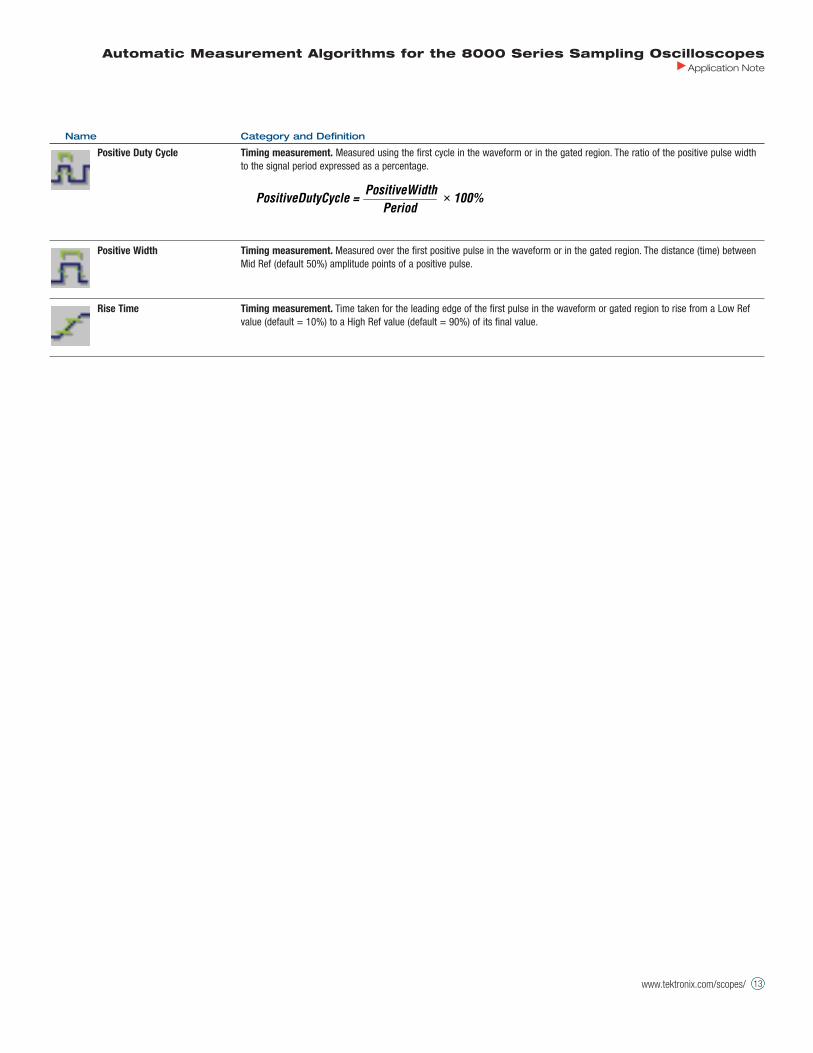
Positive Duty Cycle Timing measurement. Measured using the first cycle in the waveform or in the gated region. The ratio of the positive pulse widthto the signal period expressed as a percentage.
Positive Width Timing measurement. Measured over the first positive pulse in the waveform or in the gated region. The distance (time) betweenMid Ref (default 50%) amplitude points of a positive pulse.
Rise Time Timing measurement. Time taken for the leading edge of the first pulse in the waveform or gated region to rise from a Low Refvalue (default = 10%) to a High Ref value (default = 90%) of its final value.
× 100%Period
PositiveWidthPositiveDutyCycle =
Name Category and Definition
Automatic Measurement Algorithms for the 8000 Series Sampling OscilloscopesApplication Note
www.tektronix.com/scopes/1414141414
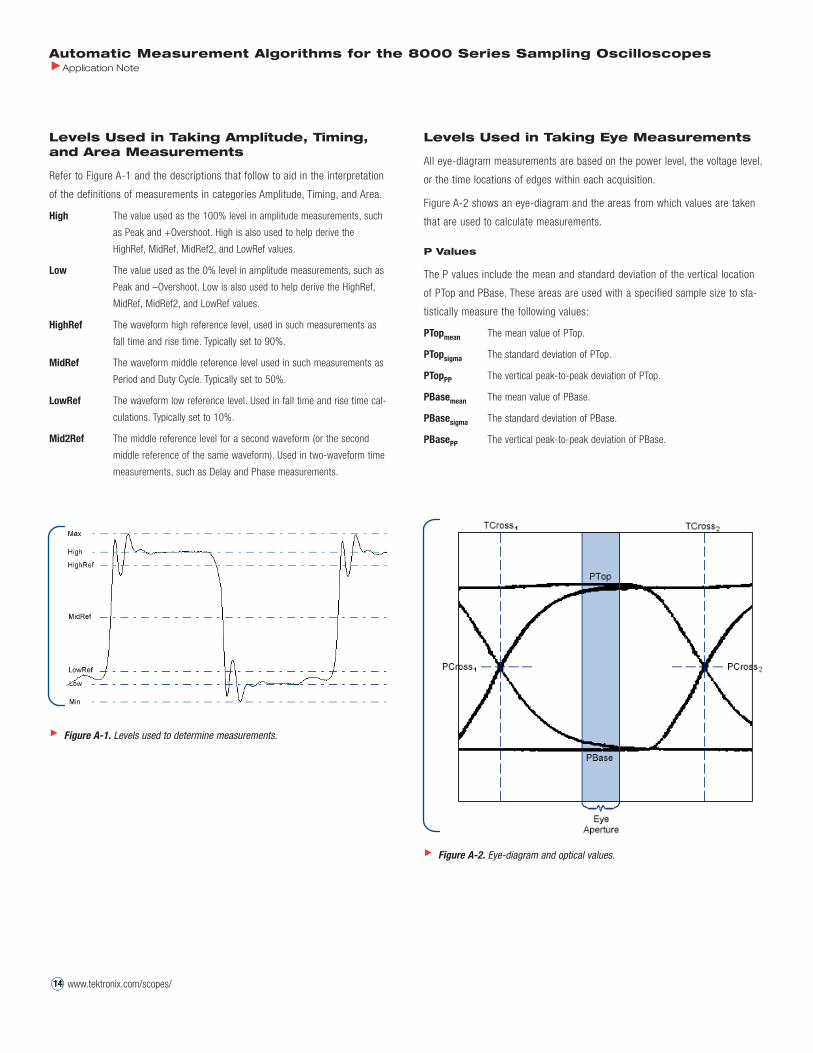
Levels Used in Taking Amplitude, Timing,and Area Measurements
Refer to Figure A-1 and the descriptions that follow to aid in the interpretation
of the definitions of measurements in categories Amplitude, Timing, and Area.
High The value used as the 100% level in amplitude measurements, such
as Peak and +Overshoot. High is also used to help derive the
HighRef, MidRef, MidRef2, and LowRef values.
Low The value used as the 0% level in amplitude measurements, such as
Peak and –Overshoot. Low is also used to help derive the HighRef,
MidRef, MidRef2, and LowRef values.
HighRef The waveform high reference level, used in such measurements as
fall time and rise time. Typically set to 90%.
MidRef The waveform middle reference level used in such measurements as
Period and Duty Cycle. Typically set to 50%.
LowRef The waveform low reference level. Used in fall time and rise time cal-
culations. Typically set to 10%.
Mid2Ref The middle reference level for a second waveform (or the second
middle reference of the same waveform). Used in two-waveform time
measurements, such as Delay and Phase measurements.
Levels Used in Taking Eye Measurements
All eye-diagram measurements are based on the power level, the voltage level,
or the time locations of edges within each acquisition.
Figure A-2 shows an eye-diagram and the areas from which values are taken
that are used to calculate measurements.
P Values
The P values include the mean and standard deviation of the vertical location
of PTop and PBase. These areas are used with a specified sample size to sta-
tistically measure the following values:
PTopmean The mean value of PTop.
PTopsigma The standard deviation of PTop.
PTopPP The vertical peak-to-peak deviation of PTop.
PBasemean The mean value of PBase.
PBasesigma The standard deviation of PBase.
PBasePP The vertical peak-to-peak deviation of PBase.
Figure A-1. Levels used to determine measurements.
Figure A-2. Eye-diagram and optical values.
Automatic Measurement Algorithms for the 8000 Series Sampling OscilloscopesApplication Note
www.tektronix.com/scopes/ 15
All of these values are limited to the region specified by the eye aperture. The
eye aperture defaults to the center 20% of the interval from TCross1 to TCross2
but is user settable from 0% to 100% of that interval. (In the Measurement
Setup dialog box, first select an eye measurement; then select the Region tab.)
T1 Values
The T1 values are vertical and horizontal values associated with the leftmost
crossing point. These areas are used to establish the following values:
TCross1mean The horizontal mean of the left crossing point at TCross1.
TCross1sigma The horizontal standard deviation of the left crossing point at TCross1.
TCross1PP The horizontal peak-to-peak deviation of the left crossing point at
TCross1.
PCross1mean The vertical mean of the left crossing point at PCross1.
T2 Values
The T2 values are vertical and horizontal values associated with the rightmost
crossing point. These areas are used to establish the following values:
TCross2mean The horizontal mean of the right crossing point at TCross2.
TCross2sigma The horizontal standard deviation of the right crossing point at
TCross2.
TCross2PP The horizontal peak-to-peak deviation of the right crossing point at
TCross2.
DCD Values
The DCD values are horizontal values associated with the leftmost crossing
point at MidRef level (default = 50%) of the eye height. These areas are used
to establish the DCDPP, the horizontal peak-to-peak deviation of the left cross-
ing point at MidRef level of the eye.
Automatic Measurement Algorithms for the 8000 Series Sampling OscilloscopesApplication Note
www.tektronix.com/scopes/1616161616
For Further InformationTektronix maintains a comprehensive, constantly expanding collection ofapplication notes, technical briefs and other resources to help engineersworking on the cutting edge of technology.
Please visit “Resources For You” on our Web site at www.tektronix.com
Contact Tektronix:
ASEAN Countries (65) 356-3900
Australia & New Zealand 61 (2) 9888-0100
Austria, Central Eastern Europe,
Greece, Turkey, Malta & Cyprus +43 2236 8092 0
Belgium +32 (2) 715 89 70
Brazil and South America 55 (11) 3741-8360
Canada 1 (800) 661-5625
Denmark +45 (44) 850 700
Finland +358 (9) 4783 400
France & North Africa +33 1 69 86 81 81
Germany + 49 (221) 94 77 400
Hong Kong (852) 2585-6688
India (91) 80-2275577
Italy +39 (2) 25086 501
Japan (Sony/Tektronix Corporation) 81 (3) 3448-3111
Mexico, Central America, & Caribbean 52 (5) 666-6333
The Netherlands +31 23 56 95555
Norway +47 22 07 07 00
People’s Republic of China 86 (10) 6235 1230
Republic of Korea 82 (2) 528-5299
South Africa (27 11) 651-5222
Spain & Portugal +34 91 372 6000
Sweden +46 8 477 65 00
Switzerland +41 (41) 729 36 40
Taiwan 886 (2) 2722-9622
United Kingdom & Eire +44 (0)1344 392000
USA 1 (800) 426-2200
From other areas, contact: Tektronix, Inc.Export Sales, P.O. Box 500, M/S 50-255,
Beaverton, Oregon 97077-0001, USA 1 (503) 627-6877
Copyright © 2000, Tektronix, Inc. All rights reserved. Tektronix products are covered by U.S. and foreign patents, issued and pending. Information in this publication supersedes that in all previously published material. Specification and price change privileges reserved. TEKTRONIX and TEK are registered trademarks of Tektronix, Inc. All other trade names referenced are the service marks,trademarks or registered trademarks of their respective companies.
0700 TD/XBS 85W-13562-0