automatic number plate recognition - open access … number plate recognition (anpr) is a mass...
TRANSCRIPT

International Journal of Advancements in Technology http://ijict.org/ ISSN 0976-4860
Vol 2, No 3 (July 2011) ©IJoAT 408
Automatic Number Plate Recognition
S.Kranthi, K.Pranathi, A.Srisaila
Information Technology, VR SiddharthaEngineering College,Vijayawada, India
[email protected], [email protected], [email protected]
Abstract
Automatic Number Plate Recognition (ANPR) is a mass surveillance system that
captures the image of vehicles and recognizes their license number. ANPR can be assisted in the
detection of stolen vehicles. The detection of stolen vehicles can be done in an efficient manner
by using the ANPR systems located in the highways. This paper presents a recognition method in
which the vehicle plate image is obtained by the digital cameras and the image is processed to get
the number plate information. A rear image of a vehicle is captured and processed using various
algorithms. In this context, the number plate area is localized using a novel „feature-based
number plate localization‟ method which consists of many algorithms. But our study mainly
focusing on the two fast algorithms i.e., Edge Finding Method and Window Filtering Method for
the better development of the number plate detection system
Keywords: Pre-processing, Number plate localization, Character segmentation, Character
recognition.
1. Introduction
Most of the number plate localization algorithms merge several procedures, resulting in
long computational (and accordingly considerable execution) time (this may be reduced by
applying less and simpler algorithms). The results are highly dependent on the image quality,
since the reliability of the procedures severely degrades in the case of complex, noisy pictures
that contain a lot of details. Unfortunately the various procedures barely offer remedy for this
problem, precise camera adjustment is the only solution. This means that the car must be
photographed in a way that the environment is excluded as possible and the size of the number
plate is as big as possible. Adjustment of the size is especially difficult in the case of fast cars,
since the optimum moment of exposure can hardly be guaranteed. Number Plate Localization on
the Basis of Edge Finding: The algorithms rely on the observation that number plates usually
appear as high contrast areas in the image (black-and-white or black-and-yellow). First, the
original car image in color is converted to black and white image grayscale image as shown in
figure 1.
Fig 1: Original Image Filtered Image (FIR)

International Journal of Advancements in Technology http://ijict.org/ ISSN 0976-4860
Vol 2, No 3 (July 2011) ©IJoAT 409
The original image is converted to grayscale image which is in high contrast as shown above.
Now, we need to identify the location of the number plate horizontally in which row it‟s present.
The letters and numbers are placed in the same row (i.e. at identical vertical levels) resulting in
frequent changes in the horizontal intensity. This provides the reason for detecting the horizontal
changes of the intensity, since the rows that contain the number plate are expected to exhibit
many sharp variations. The Horizontal intensity graph is as follows, with the peaks indicating
high contrast regions in the image:
Figure 2: Sum of Filtered Rows
The algorithm first determines the extent of intensity variation for each row, while in the second
step it selects the adjacent rows which exhibit the biggest changes. Number plates are highly
probable to be in these rows. The horizontal position of the number plate must also be
determined, which is done by using the previously determined values that characterize the
changes. The variations are the highest at the letters (black letters on white background);
therefore this is where the rate of change within a row is expected to be the highest. Sum of
Filtered columns: The vertical position of the number plate must be found in the second step by
using a picture obtained by band pass filtering. Having summed up the results of filtering for
each row (sum of filtered rows) the vertical position of the number plate is determine on the basis
of the statistical properties of the individual rows. To provide a fast algorithm simply the row
featuring the highest amplitude is selected (the number plate is most likely to be located there)
Figure 3: Sum of Columns in the current Band
Prior to summing up the values, the results can be further improved by applying band pass
limiting in the area concerned in both horizontal and vertical directions.
Figure 4: Sum of columns after horizontal and vertical filtering
In certain cases the number plate may be split up into several independent regions and also false
results may occur. Therefore, the probable position must be selected from these in the last step.

International Journal of Advancements in Technology http://ijict.org/ ISSN 0976-4860
Vol 2, No 3 (July 2011) ©IJoAT 410
Figure 5: Possible Parts of Plate (Candidate Regions)
Figure shows that many areas appear close to each other at the place of the number plate, while
the false results are located further. The areas close to each other are merged. This requires the
definition of a maximum distance which is estimated on the basis of the expected size of the
number plate. The real number plate is selected from the remaining areas by post processing
methods. Two simple procedures are applied: Analysis of the boundary ratios and the extent of
the areas. Investigation of the boundary ratios relies on the fact that the ratio of the horizontal and
vertical sizes of a number plate falls in a predefined interval. If the found number plate does not
fulfill these criteria, the search process must be continued in another place. In the case of area
evaluation, those regions are eliminated that are too small to process or are too big, even if they
fulfill the boundary ratio requirement. If still more possible areas remain, the one featuring the
highest specific brightness is selected because number plates usually contain a lot of sharp
changes.
Figure 6: Number plate identified by simple edge search.
2. Number Plate Localization on the Basis of Window Filtering:
The drawback of the above solution (Edge Finding Methodology) is that after the filtering
also additional areas of high intensity appear besides the number plate. If the image contains a lot
of details and edges (example: complex background) the further areas. As a result, the SFR curve
exhibits a smaller increment at the number plate and the edges in the surrounding areas may
sometimes be more dominant.
Fig 7: Car Image after morphological operations and removing noise
International Journal of Advancements in Technology http://ijict.org/ ISSN 0976-4860
Vol 2, No 3 (July 2011) ©IJoAT 411
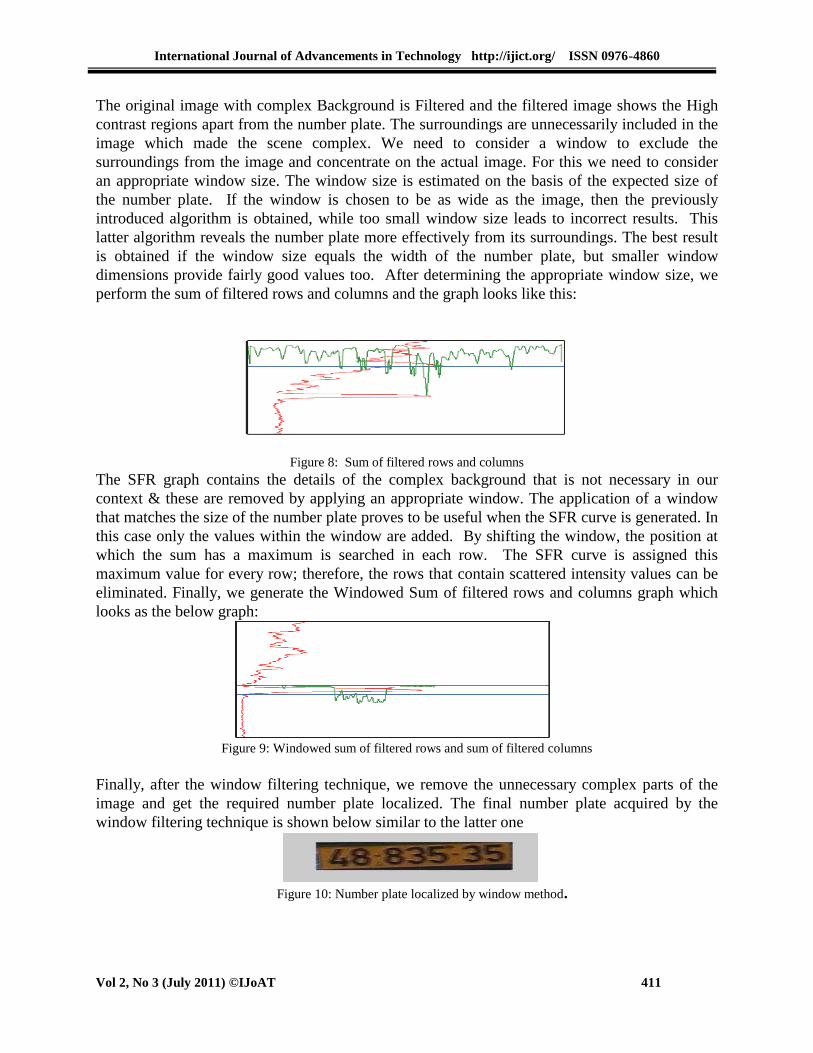
The original image with complex Background is Filtered and the filtered image shows the High
contrast regions apart from the number plate. The surroundings are unnecessarily included in the
image which made the scene complex. We need to consider a window to exclude the
surroundings from the image and concentrate on the actual image. For this we need to consider
an appropriate window size. The window size is estimated on the basis of the expected size of
the number plate. If the window is chosen to be as wide as the image, then the previously
introduced algorithm is obtained, while too small window size leads to incorrect results. This
latter algorithm reveals the number plate more effectively from its surroundings. The best result
is obtained if the window size equals the width of the number plate, but smaller window
dimensions provide fairly good values too. After determining the appropriate window size, we
perform the sum of filtered rows and columns and the graph looks like this:
Figure 8: Sum of filtered rows and columns
The SFR graph contains the details of the complex background that is not necessary in our
context & these are removed by applying an appropriate window. The application of a window
that matches the size of the number plate proves to be useful when the SFR curve is generated. In
this case only the values within the window are added. By shifting the window, the position at
which the sum has a maximum is searched in each row. The SFR curve is assigned this
maximum value for every row; therefore, the rows that contain scattered intensity values can be
eliminated. Finally, we generate the Windowed Sum of filtered rows and columns graph which
looks as the below graph:
Figure 9: Windowed sum of filtered rows and sum of filtered columns
Finally, after the window filtering technique, we remove the unnecessary complex parts of the
image and get the required number plate localized. The final number plate acquired by the
window filtering technique is shown below similar to the latter one
Figure 10: Number plate localized by window method.

International Journal of Advancements in Technology http://ijict.org/ ISSN 0976-4860
Vol 2, No 3 (July 2011) ©IJoAT 412
3. Proposed Study and Implementation
The General Proposed system for the detection of number plates is as shown in figure 11
(a).
Figure 11(a): The General Proposed system
The proposed method for the localization of license plate consists of the steps explained in the
figure 11(b) as a flowchart:
Fig 11: Proposed license plate localization method
3.1. Image acquisition
3.1.1 Introduction to images
An image is a matrix with X rows and Y columns. It is represented as function say f(x, y)
of intensity values for each color over a 2D plane. 2D points, pixel coordinates in an image, can
be denoted using a pair of values. The image is stored as a small squared regions or number of
picture elements called pixels as shown in the following figure:

International Journal of Advancements in Technology http://ijict.org/ ISSN 0976-4860
Vol 2, No 3 (July 2011) ©IJoAT 413
Figure 12: (a) image matrix (b) gray scale image matrix (c) binary image matrix (d) colored image with rgb
representation
In digital image, pixels contain color value and each pixel uses 8 bits (0 to 7 bits). Most
commonly, image has three types of representation gray scale image, Binary image and colored
image as shown in figure 8 (b), (c), (d) respectively. Gray scale image, figure (b), calculates the
intensity of light and it contains 8 bits (or one Byte or 256 values i.e. 28 = 256). Each pixel in the
gray scale image represents one of the 256 values, in particular the value 0 represents black, 255
represents the white and the remaining values represents intermediate shades between black and
white. The images with only two colors (black and white) are different to these gray scale
images. Those two colored images are called binary images (c). So binary representation of the
images does not contains shades between black and white. Color images, (d) are often built of
several stacked color channels, each of them representing value levels of the given channel. For
example, RGB images are composed of three independent channels for red, green and blue as
primary color components. The color image contains 24 bits or 3 bytes and each byte has 256
values from 0 to 255.
3.1.2 Process of acquisition
Image acquisition is the process of obtaining an image from the camera. This is the first
step of any vision based systems. In our current research we acquire the images using a digital
camera placed by the road side facing towards the incoming vehicles .Here our aim is to get the
frontal image of vehicles which contains license plate. The remaining stages of the system works
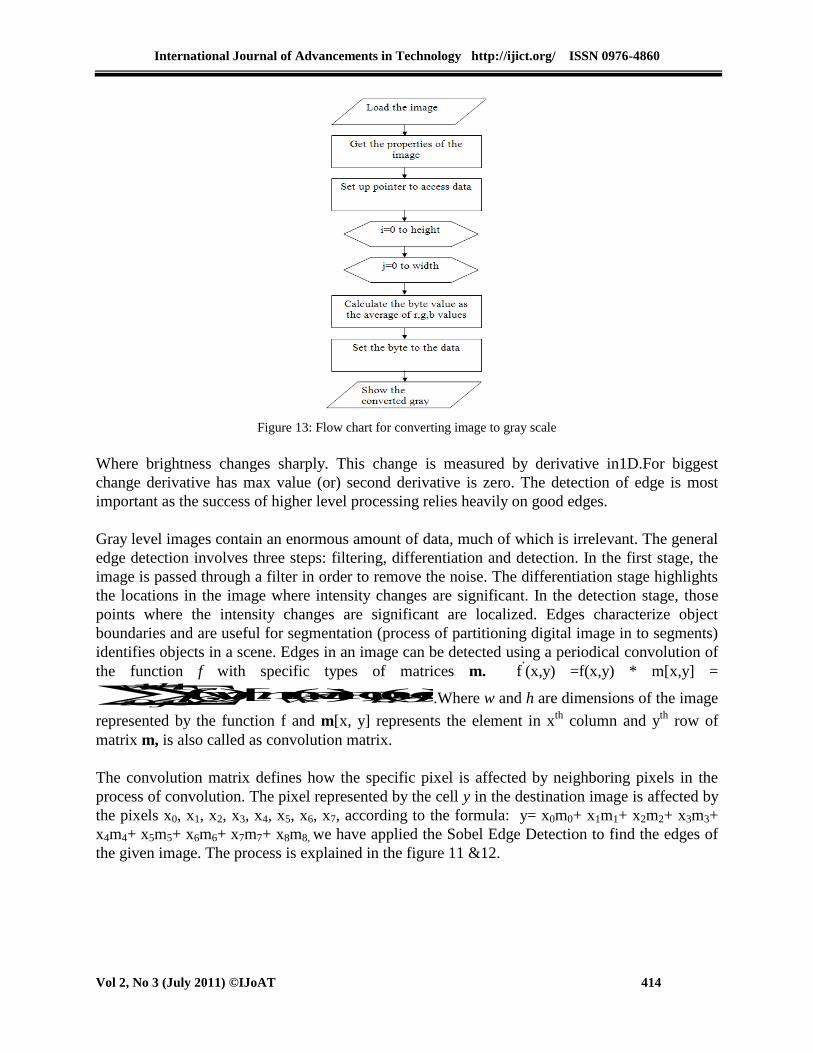
in offline mode. Grayscale image: After acquiring the image, the very next step is to derive the
gray scale image. Pseudo code to convert an image to a grayscale:
STEP1 : Load the image
STEP2 : Retrieve the properties of image like width, height and nchannels
STEP3: Get the pointer to access image data
STEP4: For each height and for each width of the image, convert image to grayscale by
calculating average of r,g,b channels of the imageconvert to grayscale manually
STEP5 : Display the image after converting to grayscale
The flowchart shown in the following figure describes the algorithm to convert an image to gray
scale image.
International Journal of Advancements in Technology http://ijict.org/ ISSN 0976-4860
Vol 2, No 3 (July 2011) ©IJoAT 414
Figure 13: Flow chart for converting image to gray scale
Where brightness changes sharply. This change is measured by derivative in1D.For biggest
change derivative has max value (or) second derivative is zero. The detection of edge is most
important as the success of higher level processing relies heavily on good edges.
Gray level images contain an enormous amount of data, much of which is irrelevant. The general
edge detection involves three steps: filtering, differentiation and detection. In the first stage, the
image is passed through a filter in order to remove the noise. The differentiation stage highlights
the locations in the image where intensity changes are significant. In the detection stage, those
points where the intensity changes are significant are localized. Edges characterize object
boundaries and are useful for segmentation (process of partitioning digital image in to segments)
identifies objects in a scene. Edges in an image can be detected using a periodical convolution of
the function f with specific types of matrices m. f‟(x,y) =f(x,y) * m[x,y] =
1
0
1
0)](mod),([mod).,(
w
i
h
j hw jyixmyxf .Where w and h are dimensions of the image
represented by the function f and m[x, y] represents the element in xth
column and yth
row of
matrix m, is also called as convolution matrix.
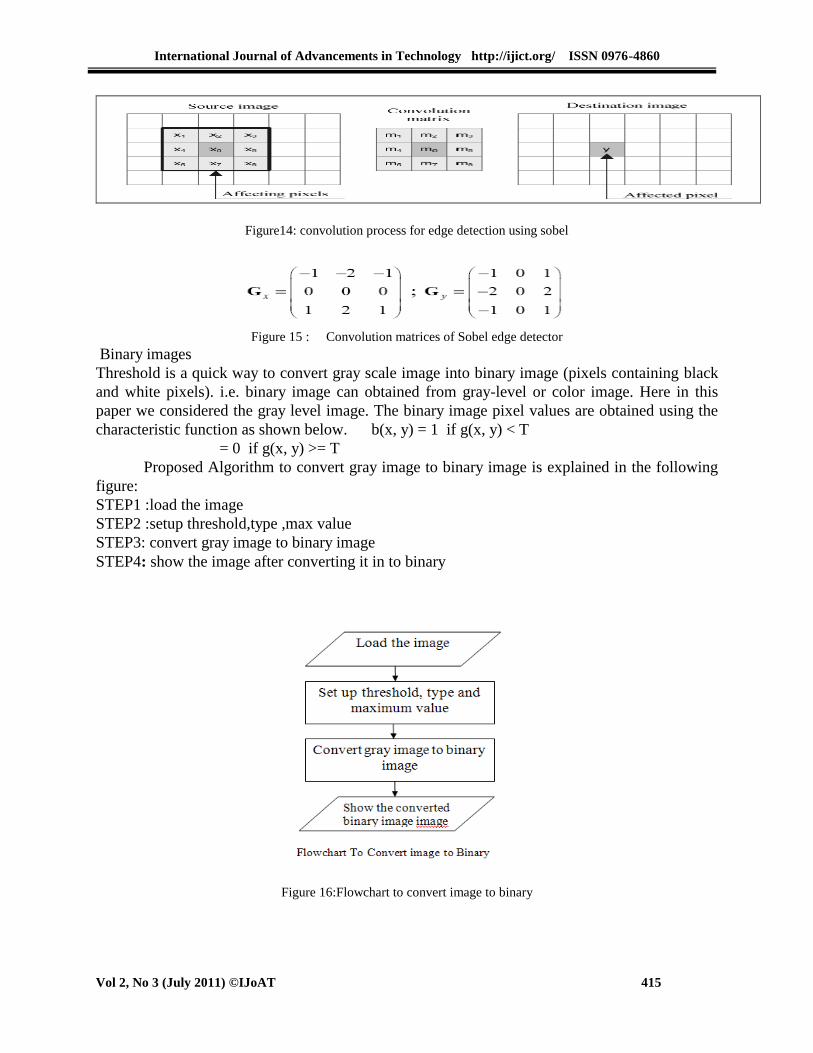
The convolution matrix defines how the specific pixel is affected by neighboring pixels in the
process of convolution. The pixel represented by the cell y in the destination image is affected by
the pixels x0, x1, x2, x3, x4, x5, x6, x7, according to the formula: y= x0m0+ x1m1+ x2m2+ x3m3+
x4m4+ x5m5+ x6m6+ x7m7+ x8m8, we have applied the Sobel Edge Detection to find the edges of
the given image. The process is explained in the figure 11 &12.
International Journal of Advancements in Technology http://ijict.org/ ISSN 0976-4860
Vol 2, No 3 (July 2011) ©IJoAT 415
Figure14: convolution process for edge detection using sobel
Figure 15 : Convolution matrices of Sobel edge detector
Binary images
Threshold is a quick way to convert gray scale image into binary image (pixels containing black
and white pixels). i.e. binary image can obtained from gray-level or color image. Here in this
paper we considered the gray level image. The binary image pixel values are obtained using the
characteristic function as shown below. b(x, y) = 1 if g(x, y) < T
= 0 if g(x, y) >= T
Proposed Algorithm to convert gray image to binary image is explained in the following
figure:
STEP1 :load the image
STEP2 :setup threshold,type ,max value
STEP3: convert gray image to binary image
STEP4: show the image after converting it in to binary
Figure 16:Flowchart to convert image to binary

International Journal of Advancements in Technology http://ijict.org/ ISSN 0976-4860
Vol 2, No 3 (July 2011) ©IJoAT 416
Connected components
Connected components labeling scans an image and groups its pixels into components based
on pixel connectivity, i.e. all pixels in a connected component share similar pixel intensity
values and are in some way connected with each other. Once all groups have been determined,
each pixel is labeled with a gray level or a color (color labeling) according to the component it
was assigned to. After the Localization of the number plate of the vehicle involved, we need to
recognize the number plate into a standard form. The vehicular number plates maybe of Non-
standard forms and may vary in their fonts.
3.2. Image Processing
3.2.1 Pre- Processing: The pre-processing is the first step in number plate recognition. It consists
the following major stages: 1.Binarization, 2.Noise Removal
Binarization: The input image is initially processed to improve its quality and
prepare it to next stages of the system. First, the system will convert RGB images
to gray-level images.
Noise Removal: In this noise removal stage we are going to remove the noise of the
image i.e., while preserving the sharpness of the image. After the successful
Localization of the Number Plate, we go on with Optical Character Recognition
which involves the Segmentation, Feature extraction and Number plate Recognition.
3.3 Character Segmentation
Segmentation is one of the most important processes in the automatic number plate
recognition, because all further steps rely on it. If the segmentation fails, a character can be
improperly divided into two pieces, or two characters can be improperly merged together. We
can use a horizontal projection of a number plate for the segmentation, or one of the more
sophisticated methods, such as segmentation using the neural networks. In this segmentation we
use two types of segmentation: 1. Horizontal segmentation 2. Vertical segmentation. First we
have performed vertical segmentation on the number plate then the characters are vertically
segmented. After performing vertical segmentation we have to perform horizontal segmentation
by doing this we get character from the plate.
3.4 Character Recognition
We have to recognize the characters we should perform feature extraction which is the
basic concept to recognize the character. The feature extraction is a process of transformation of
data from a bitmap representation into a form of descriptors, which are more suitable for
computers. The recognition of character should be invariant towards the user font type, or
deformations caused by a skew. In addition, all instances of the same character should have a
similar description. A description of the character is a vector of numeral values, so called
descriptors or patterns.

International Journal of Advancements in Technology http://ijict.org/ ISSN 0976-4860
Vol 2, No 3 (July 2011) ©IJoAT 417
Flow chart of the OCR process:
Figure 17: flow chart of the OCR process
4. Proposed Algorithm and Implementation
4.1 Character segmentation:
This is the second major part of the License Plate detection algorithm. There are many
factors that cause the character segmentation task difficult, such as image noise, plate frame,
rivet, space mark, and plate rotation and illumination variance. We here propose the algorithm
that is quite robust and gives significantly good results on images having the above mentioned
problems. The Steps involved in character Segmentation are:
Preprocessing: Preprocessing is very important for the good performance of character
segmentation. Our preprocessing consists of conversion to grayscale and binarization
using a object enhancement technique. The steps involved are: Conversion to Grayscale,
Binarization. Compared with the usual methods of image binarization, this algorithm uses
the information of intensity and avoids the abruption and conglutination of characters that
are the drawbacks of usual image binarization techniques.
Object enhancement algorithm: The quality of plate images varies much in different
capture conditions. Illumination variance and noise make it difficult for character
segmentation. Then some image enhancement should be adopted to improve the quality
of images. As we all know, the image enhancement methods of histogram equalization
and gray level scaling have some side effects. They may have the noise enhanced as well.
For character segmentation, only the character pixels need to be enhanced and the
background pixels should be weakened at the same time. In fact, a license plate image
contains about 20% character pixels. So these 20% character pixels need to be enhanced
and the rest pixels need to be weakened. It is called object enhancement. The object
enhancement algorithm consists of two steps: Firstly, gray level of all pixels is scaled into
the range of 0 to 100 and compared with the original range 0 to 255, the character pixels

International Journal of Advancements in Technology http://ijict.org/ ISSN 0976-4860
Vol 2, No 3 (July 2011) ©IJoAT 418
and the background pixels are both weakened. Secondly, sorting all pixels by gray level
in descending order and multiply the gray level of the top 20% pixels by 2.55. Then most
characters pixels are enhanced while background pixels keep weakened. The following
figure shows the result of object enhancement. It can be seen from the figure that after
object enhancement the contrast of peaks and valleys of the projection is more significant
than the original.
Figure 18: (a) original image (b) object enhanced image
4.2 Horizontal Segmentation:
For this we calculate the horizontal and vertical projections of intensity. Then we find the
local minima for horizontal projection. Based on the threshold calculated from the above local
minima‟s, we find x locations of the segmented regions. In order to locate the right and left edges
of license plate from candidate region, the vertical projection after mathematical morphology
deal is changed into binary image. The arithmetic for doing this is: F = Image between i & l
.
Where, fT (1, i) is the vertical projection after mathematical morphology, T is the
threshold. Then scan the function of fT (1, i) and register the potions where values change from 0
to 1 and from 1 to 0 in stack1 and stack2 respectively. So the candidate position of the left and
right edge of the license plate are in stack1 (1,i) and stack2(1,i) respectively, and the candidate‟s
width of the license plate is calculated by:
- stack1 (1, i)
These give the coordinates of the potentially candidates regions. Merging and removing the
Horizontal segments: Based on thresholds found by experiments we merge two segments if they
happen to be very close and the segments having width less than a specified threshold are
dropped.

International Journal of Advancements in Technology http://ijict.org/ ISSN 0976-4860
Vol 2, No 3 (July 2011) ©IJoAT 419
4.3 Finding Vertical bounds:
For each of the horizontal segments we follow the same procedure as discussed above to
get the vertical bounds. Result - The following is the image obtained on performing character
segmentation on the extracted license plate from im1.jpg
Figure 19: Character Segmented Number Plate “im1.jpg”
5. Optical Character Recognition
OCR is the mechanical or electronic translation of images of handwritten or typewritten
text (usually captured by a scanner) into machine-editable text. The procedure consists of two
important steps, training and recognition. Training: The program is first trained with a set of
sample images for each of the characters to extract the important features based on which the
recognition operation would be performed. Our program is trained on a set of 10 characters with
10 samples of each.
5.1. Preprocessing:
Before preparing the template for each of the characters for further use, we need to do
some processing on the images. The following are the operations that are performed:
Binarization, Inversion of intensity of the characters. Finding the connected component that
represents the character. Finding the smallest rectangle enclosing this connected component.
Normalization of the image to size 15 X 15. - Storing the intensity values using the below
mentioned algorithm for each of the characters.
5.2. Creating the template:
In order to create the template for each character we do the following operation. For every
white pixel we insert the value 1 and for every black pixel 0. We do this for all the 10 training
samples for each character and calculate the weights to get the template.
Fig 20: Empty template Template after one sample of “B”

International Journal of Advancements in Technology http://ijict.org/ ISSN 0976-4860
Vol 2, No 3 (July 2011) ©IJoAT 420
5.3. Character Recognition:
Preprocessing: The image obtained after segmentation is Grayscale. Follow the
preprocessing steps used for the training of the characters. Calculate the score for each of
the characters: We calculate the matching score of the segmented character from the
templates of the character stored by the following algorithm. We compare the pixel
values of the matrix of segmented character and the template matrix, and for every match
we add 1 to the matching score and for every mis-match we decrement 1. This is done
for all 225 pixels. The match score is generated for every template and the one which
gives the highest score is taken to be the recognized character. Character sets used for
training the OCR: This is contained in a directory named “OCR_Training_Data”
Figure 21: Segmented Number Plate
The output of OCR on the segmented license plate shown above is:
Figure 22: Output for im1.jpg
In order to locate the right and left edges of license plate from candidate region, the vertical
projection after mathematical morphology deal should be changed into binary image. The
arithmetic is:
Where fT (1, i) is the vertical projection after mathematical morphology, T is the threshold.
Obviously, the key problem of getting binary image is how to choose the threshold. In the
algorithm proposed in this paper, the threshold is calculated by where aver is the
average value of fT (1, i) and t is weight parameter. We use t =1.23. Then scan the function of fT
(1,i) and register the potions where values change from 0 to 1 and from 1 to 0 in stack1 and
stack2 respectively. So the candidate position of the left and right edge of the license plate are in
stack1 (1,i) and stack2(1,i) respectively, and the candidate‟s width of the license plate is
calculated by : Width (1, i) = stack2(1, i) - stack1(1, i).

International Journal of Advancements in Technology http://ijict.org/ ISSN 0976-4860
Vol 2, No 3 (July 2011) ©IJoAT 421
5.4 Extract License Plate:
From the above steps, we can get the row and column position of the license plate.
Implemented algorithm at times gives more than 1 license plate on detection.
Figure 23: Im5.jpg Figure 24: After binarization and noise removal
Figure 25: Candidate Regions
Figure 26: Extracted License Plate Figure 27: Segmented Number Plate
6. End output
Recognized Number plate of the vehicle
Figure 28: Output of OCR on Segmented License Plate
7. Conclusion
This paper presents a recognition method in which the vehicle plate image is obtained by
the digital cameras and the image is processed to get the number plate information. A rear image
of a vehicle is captured and processed using various algorithms. Further we are planning to study
about the characteristics involved with the automatic number plate system for better
performance.

International Journal of Advancements in Technology http://ijict.org/ ISSN 0976-4860
Vol 2, No 3 (July 2011) ©IJoAT 422
References
[1] Feng Yang, Zheng Ma “Vehicle License Plate location Based on Histogramming and
Mathematical Morphology “, 2005.
[2] Tran Duc Duan, Duong Anh Duc, Tran Le Hong Du “Combining Hough Transform and
Contour Algorithm for detecting Vehicles. License-Plates”, October 2004
[3] Tran Duc Duan, Tran Le Hong Du, Tran Vinh Phuoc, Nguyen Viet Hoang “Building an
Automatic Vehicle License-Plate Recognition System “, Febraury 2005
[4] CheokMan, Kengchung “A High Accurate Macau License Plate Recognition System”,
2008
[5] R Thuy Tuong Nguyen, Xuan Dai Pham and Jae Wook Jeon”Rectangular Object
Tracking Based on Standard Hough Transform “, February, 2009
[6] Yungang Zhang Changshui Zhang “A New Algorithm for Character Segmentation of
License Plate”, June 2003
[7] Wenjing Jia, Huaifeng Zhang, and Xiangjian He Mean Shift for” Accurate Number Plate
Detection”, July 2005