automatic parallelization: a comparison of cray … automatic parallelization: a comparison of cray...
TRANSCRIPT
1
Automatic Parallelization:A Comparison of CRAY fpp and KAI KAP/CRAY
RND-90-010
Douglas M. Pase1
Katherine E. FletcherComputer Sciences Corporation
NASA Ames Research CenterMoffett Field, CA 94035
Abstract
In this report we examine two existing commercial parallelizing code restructurers: theCRAY Autotasking2 facility and Kuck and Associates' KAP/CRAY. In particular we mea-sure their ability to vectorize and parallelize 25 scientific benchmarks for a CRAY Y-MPsupercomputer. We measure the overall code performance, the speedup gained by paral-lelizing codes with these products, and the overhead used in the parallel execution of eachbenchmark.
Introduction
Many different ideas about the abilities of parallelizing tools have been put forward overthe years. Some claim that existing programs are inappropriate for parallel execution be-cause the programming model used (the Von Neumann model) is inherently sequential, andsuch codes should be rewritten using either languages designed to express parallelism, orsequential languages with parallel extensions added. Others claim that the codes them-selves are adequate, and that code restructuring tools will be able to provide the needed par-allelism without the expense of relearning programming techniques and rewritingapplications. Still others think that the problem of parallelizing existing codes is not im-possible, but it is too complex for automatic tools. For them, interactive code restructuringtools seem to be the way to go.
In this report we explore the second assertion, that is, that existing "dusty deck" programscontain sufficient parallelism, at least for moderately parallel machines, and that it is rea-sonable to expect a sophisticated compiler to find it. To examine this question, we comparethe performance of two of the most sophisticated commercially available code restructur-ers: CRAY fpp, and Kuck and Associates KAP/CRAY. Performance is measured on a par-allel vector supercomputer—an 8-processor CRAY Research, Inc., Y-MP.
Both tools were designed to be used either as automatic code restructuring tools, or as"batch mode" restructurers. We make no attempt to evaluate either tool as a batch tool, thatis, we do not manually improve the code based on what the restructurer was or was not able
1. This work was supported by NASA Contract No. NAS2-12961 while the authors were employed by Com-puter Sciences Corporation under contract to the Numerical Aerodynamic Simulation Division at NASAAmes Research Center.2. UNIX is a trademark of AT&T. CRAY, CRAY Y-MP, CFT77, CF77, Autotasking, and UNICOS aretrademarks of Cray Research, Inc.

2
to do. We put all benchmarks through one or both parallelizers and compile the result with-out further modification. The only exception to this rule is that we correct errors when therestructured code fails to execute correctly. All vectorization and parallelization (CDIRand CMIC) directives originally in the benchmarks were also removed prior to their use.
Benchmarks were selected from both public sources and sources private to NAS. Thebenchmarks reflect as fair a representation of production codes as possible. The publiccodes include the Perfect Benchmark Suite [1], Livermore Loops, and the NAS Kernels.
Hardware Environment
All codes were executed on a CRAY Research, Inc., Y-MP. Benchmarks were executed indedicated time, that is, no other programs were allowed to use the machine while timingswere taking place. In this way no external factors, such as memory bank conflicts with oth-er programs, were allowed to interfere with benchmark performance. In addition, all inter-mediate I/O was sent to the Solid-State Device (SSD) instead of rotating storage, to reducethe impact of I/O on performance. Important Y-MP hardware characteristics are summa-rized in Table 1. CPU functional units are described in Table 2, and Y-MP register struc-ture is given in Table 3.A more complete description of the Y-MP hardware system may be found in [2].

3
Number of CPUs: 8Clock Period: 6.0 nsInstruction Buffer Size: 512 16-bit parcels
(4 buffers)Memory size: 128 million 64-bit words
(2 ** 30 bytes)Memory access time: 17 clock periods (107 ns)Memory bank cycle time: 5 clock periods (30 ns)Number of memory banks: 256Number of memory ports/CPU: 4 (2 read, 1 write, 1 I/O)Solid-State Device: 256 million words
200 Mwords/sec transfer(4 ports @ 50 Mw/s each)
Table 1 — Y-MP Hardware Features
Address Functional Units AddMultiply
Scalar Functional Units Integer AddShiftLogicalPopulation/Parity/Lead 0
Vector Functional Units Integer AddShiftLogical (2)Population/Parity
Vector/Scalar Functional Units Floating Point AddFloating Point MultiplyReciprocal Approximation
Table 2 — CPU Functional Units
Address (A) 8 32-bit RegistersIntermediate Address (B) 64 32-bit RegistersVector (V) 8 Registers of 64 elements
each, 64 bits per elementScalar (S) 8 64-bit RegistersIntermediate Scalar (T) 64 32-bit Registers
Table 3 — Y-MP Register Structure
Software Environment
All benchmarks were written in Fortran for a serial vector supercomputer. Translationfrom serial code to parallel code was performed by CRAY fpp, or Kuck and AssociatesKAP/CRAY, or both.Benchmarks were translated from Fortran code with embedded microtasking directives toFortran with calls to the CRAY parallel library by the utility fmp. The resulting code wasthen compiled by

4
Fortran to Microtasked Fortran CRAY fpp 4.0.1KAP/CRAY1.01
Microtasked Ftn to parallel code CRAY fmp4.0.1Fortran Compiler CFT774.0.1Operating System UNICOS5.1.10Libraries UNICOS5.1.10
Table 4 — Software System Versions
the CRAY cft77 Fortran compiler. The version numbers for each of the products are givenin Table 4.
The Microtasking parallel environment is supported through special calls to the CRAY par-allel library. Microtasking supports a model of parallel programming known asSingle Pro-gram, Multiple Data, or SPMD. The idea is that when a program is executed each processwill execute the same program, but on different data. Also, each process executes indepen-dently of other processes so they need not take the same amount of time to execute, noreven execute the same sequence of instructions.
At the beginning of the execution of a parallel program, slave processes are created andplaced in a "parked" state. While in this state they accrue "semaphore wait time." Otherprocesses can use the CPUs while the slaves are in this state, but the slaves have a high pri-ority when they are unparked and return to the run queue. Once running, the slaves resumeaccumulating "user time."
Parallel regions in the program are placed within CMIC$ PARALLEL and CMIC$ ENDPARALLEL directives. The directives may be conditional or unconditional. When a par-allel region is entered, the master process unparks the slave processes, which are returnedto the run queue. Each process then executes the same segment of code in parallel with theothers. If the code segment is a parallel loop, iterations of the loop are divided into blockswhich are distributed across the available processes. Iteration distribution is done one iter-ation per processor. At the end of the parallel region, all slave processes are parked onceagain. Table 5 summarizes the overhead involved with managing the parallel execution forboth master and slave processes in clock periods (CPs), and the rough equivalent in instruc-tions.

5
MASTER:Get CPUs 50-100 msec ( 2-4 million instr.)Unpark slaves 175 CPs ( 44 instructions)Get Iteration 25 CPs ( 6 instructions)END PARALLEL 30 CPs ( 7 instructions)
SLAVE:Unpark Slaves 200 CPs ( 50 instructions)Get Iteration 25 CPs ( 6 instructions)END PARALLEL 30 CPs ( 7 instructions)Repark Slaves 75 CPs ( 19 instructions)
Table 5 — Parallel System Overhead
CRAY Fpp And KAP/CRAY
The set of compiler options used to compile a program can strongly affect its performance.In this study we had to trade off aggressive parallelization against reliability. Aggressiveparallelization held opportunities for greater speedups, but also carried the risk of not func-tioning for all of the codes. As a compromise we used the most aggressive options that alsoworked for a reasonable majority of the codes. For fpp we selected -Wd-e46ijt exceptwhere noted otherwise. This selection enables fpp switches 4, 6, i, j, and t, which mean:
4 Asserts that private array initial values are not needed.
6 Enables automatic inlining of routines that are less than50 source lines in length, and do not call other routines.
i Enables inner loops with variable iteration counts to beautotasked, if analysis warrants it.
j Replaces matrix multiplication loops with a library call.
t Enables aggressive loop exchanges to take place.
We used the default command line switch settings for KAP. The default settings were asfollows:

6
MV=3 Sets the minimum vector length to 3.
MVC=1000 Sets the minimum amount of work in a loop thatKAP will execute in vector-concurrent mode to1000 iterations. Two-version loops are created ifthe loop bounds are unknown. No two-versionloops are generated when mvc=-1 is used.
MC=950 Sets the minimum amount of work in a loop thatwill be concurrentized. Again, two-version loopsare generated when loop bounds are unknown.
P=0 When a program is concurrentized, it is alwayscompiled for an unknown number of processors.
DUST=3 Loop re-rolling is enabled, and certain IF/DO codetransformations are performed.
LM=21000 Sets a crude upper limit on the amount of workKAP will perform in trying to optimize a loop.
O=5 KAP vectorizes any loop where it is legal to do so.Loop interchanges may be applied, even totriangular loops, and
reductions are recognized.Enhanced dependence analysis is used, and KAPattempts to break dependence cycles. Lifetimeanalysis of variables is performed. Arrayexpansion is performed.
UR=16 Loops are unrolled by at most 16 iterations.
UR2=40 Same as UR, but the limit is a measure of "work"within the loop rather than the number ofiterations.
NOEXPAND Local subroutine inlining is inhibited. Using x=aallows KAP to inline some subroutines andfunctions. Exd=-1 restricts inline expansion toroutines which do not contain function orsubroutine references.
Vectorization and parallelization tools rely heavily on techniques for code analysis, prima-rily dependence and loop analysis, and on code transformations. Loop analysis classifiesthe type of loop and the existence of dependence cycles between statements. This informa-tion is used in determining which loop transformations will be legal and beneficial.
Dependence analysis determines whether loop iterations can be executed independently, orwhether reordering them will cause the program to execute incorrectly. Comprehensive de-

7
pendence analysis for all possible array subscript expressions is very time consuming (it isan NP-Complete problem), and therefore must be approximated. Accurate dependenceanalysis at times requires information about how the program is used, i.e., runtime infor-mation. A third factor which may inhibit an accurate analysis is that a dependence may tru-ly exist within a program, but the algorithm in which it occurs may be insensitive to itsviolation and thus the dependence could be ignored.
Once the dependence and loop analyses have been done, loop optimizations may takeplace. Generally the optimizations are different types of loop transformations which en-hance vectorization or parallelization. Many of the code transformations performed by fppand KAP will be described below. A complete description of the fpp code transformationtechniques may be found in [3]. Code transformations which KAP uses are described in[4]. A summary of each may be found in Table 6.
Benchmarks
As mentioned before, benchmarks used in this study were selected from NAS sources andthe Perfect Benchmarks [1]. NAS private codes include 2-D and 3-D aerospace simulationcodes, structural codes, and synthetic benchmarks either developed here or in common useat the NAS facility. NAS private codes include seven Navier-Stokes computational fluiddynamics (CFD) codes, of which four involve chemistry, and one solves a supersonic prob-lem. Of the remaining NAS codes, one solves a structural problem for a high-Mach airframe, and two are synthetic FFT codes. A detailed description of each benchmark is givenin Table 7.
Benchmark memory requirements vary from as little as 110 Kword to as large as 54Mword. The distribution of memory requirements for the various benchmarks is shown inFigure 1. A detailed summary of benchmark characteristics is given in Appendix A.
Code Transformation fpp KAPReduction recognition yes yesRecurrence recognition yes yesTwo version loops yes yesVectorize IF loops yes yesPartial loop vectorization (fission) yes yesLoop collapse yes yesLoop fusion yes noLoop interchange yes yesLoop peeling yes yesLoop unrolling yes yesLoop rerolling yes yesScalar expansion yes yesCode inlining yes yes
Table 6 — Fpp And KAP Code Transformations

8
Figure 1 — Distribution of Benchmark Memory Requirements
Total number of floating point operations vary from 58 million to 78 billion operations.Most of the NAS codes have between 10 and 25 billion floating point operations, while theLivermore Loops, NASKERN, and all but one of the Perfect Benchmarks are much smallerthan that. The largest code is NAS10, the smallest is SPICE.
Given the available floating point units on the Y-MP, the exact mix of floating point addi-tions, multiplications, and reciprocals is critical to achieving maximum performance. Ifthere are significantly more operations of one type than another, some floating point func-tional unit will be left with no work while another will have an excess. More precisely,each functional unit should have enough work to fill the same number of clock periods if itis to achieve maximum overlap. One should note, however, that scheduling conflicts andprogram dependences can further inhibit overlap even when the number of each type of op-eration is balanced. The next figure shows

9
1 is a general purpose 3-D fluid flow solver for high angle-NAS01 of-attack problems. It uses an implicit finite difference
scheme for solving the viscid, unsteady flow about a sphere.It employs approximate factorization with flux-split
differencing in the solution.
2 simulates the incompressible laminar fluid flow around aNAS02 single post mounted between two plates. The Navier-Stokes
equations are solved in three dimensions by an approximatefactorization algorithm, using pseudocompressibility to solve
the pressure field.
3 computes the decimal expansion of the mathematical constantNAS03 π. The core of this program uses highly vectorizable fast
Fourier transforms (FFTs).
4 repeatedly computes forward and reverse FFTs on pseudorandomNAS04 data. The FFTs are highly vectorizable. With hand-inserted
vectorization directives, both NAS03 and NAS04 are capableof 150 to 160 million floating point operations per second
(MFLOPS) on a single Y-MP CPU.
5 gives a time-accurate 3-D simulation of the mixing ofNAS05 reactive fluids. Pseudospectral methods are used to compute
the derivatives, and fluid flow incompressibility ismodified by adding terms to account for variable density in
the fluid.
6 gives a time-accurate solution to a 3-D Navier-StokesNAS06 problem. The code sweeps entire planes, performing a
Gaussian elimination of conserved quantities at each cell.
7 uses a fast, accurate, Choleski method for solving 16,000NAS07 linear equations. The test case used is the structural
analysis of an air frame under high-Mach conditions.
8 solves a 2-D Navier-Stokes problem with terms included toNAS08account for reactive chemistry.
9 solves a supersonic 2-D Navier-Stokes problem.NAS09
10 solves a 2-D Navier-Stokes problem involving chemistry.NAS10
11 executes 24 common synthetic Fortran kernel loops. TheMFLOP90 loops range in complexity from easily vectorized, to very
difficult. (This code is also known as the LivermoreLoops.)
12 7 kernel routines often used in CFD calculations. TheyNASKERN include an MxM matrix multiply, a 2-D complex FFT, Choleski
factorization, a vectorized block tri-diagonal solver,Gaussian elimination, a vortex generator, and a penta-
diagonal matrix solver.
Table 7 — Benchmark Descriptions

10
13 a fluid dynamics code used to study air pollution.AMD Its computational kernel relies heavily on FFTs.
14 solves a 2-D supersonic reentry fluid dynamics problem usingARC2Da sparse linear system solver and a fast elliptic solver.
15 a molecular dynamics simulation of a nucleic acid. ThisBDNAcode uses an ordinary differential equation (ODE) solver.
16 performs a structural dynamics analysis for an engineering DY-FESM design problem. It uses a sparse linear system solver, a
nonlinear algebraic system solver, and an ODE solver.
17 solves a 2-D transonic flow fluid dynamics problem. ItsFLO52 computational kernel uses a multigrid scheme with an ODE
solver.
18 performs a molecular dynamics simulation of liquid water,MDG using an ODE solver.
19 solves a signal processing problem involving seismicMG3Dmigration. The code uses both FFTs and ODE solvers.
20 2-D fluid dynamics simulation of a section of ocean. ThisOCEANsolver uses primarily FFTs.
21 lattice gauge solution to a quantum chromodynamics problem.QCD A Monte Carlo scheme is used in the solution.
22 another fluid dynamics code—this code performs a weather SPEC77simulation using FFTs and rapid elliptic problem solvers.
23 simulates electronic circuits using sparse linear solversSPICEand ODE solvers.
24 another signal processing code—this code performs missileTRACK tracking using convolution as the primary mathematical
technique.
25 uses integral transforms to solve a 2-electron problem from TRFDmolecular dynamics.
Table 7 — Benchmark Descriptions (cont.)
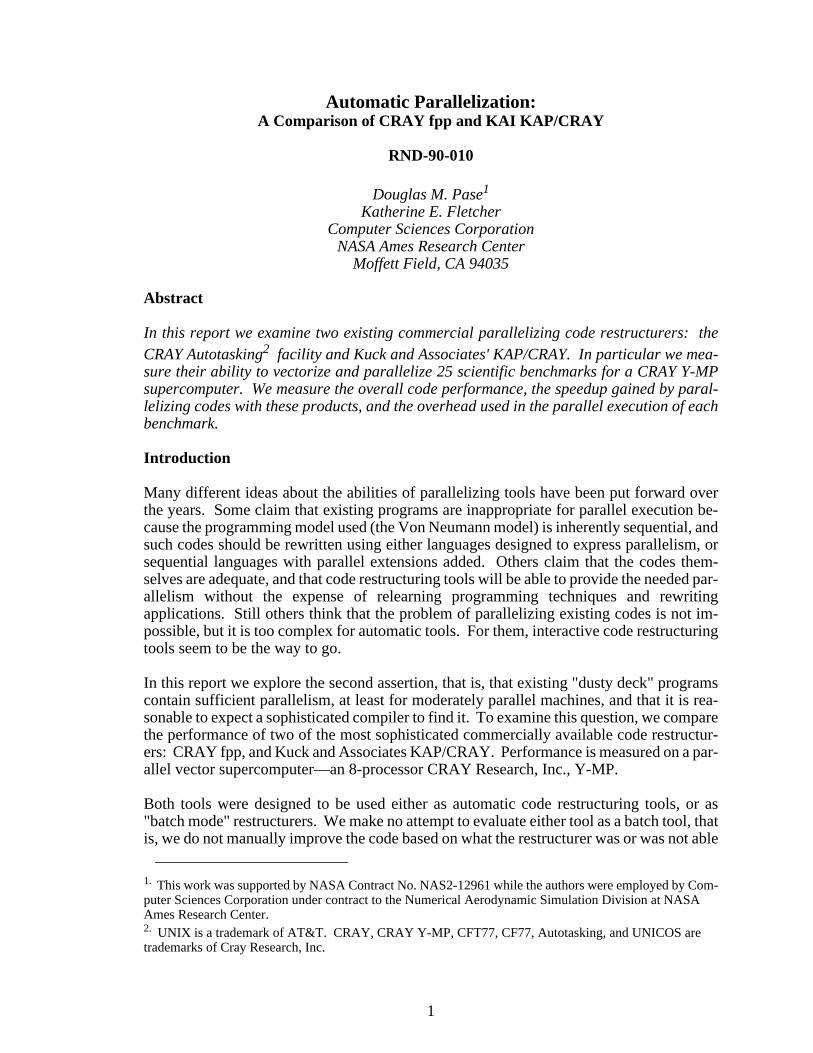
the percent of clock periods occupied by floating point adds, multiplications, and recipro-cals. A full divide requires three multiplies and a reciprocal. Figure 2 clearly shows thatthese benchmarks are fairly well balanced as far as the additions and multiplies are con-cerned, but the reciprocal unit is somewhat underutilized.
11
Figure 2 — FLOP Balance Normalized By CPs
Benchmark I/O requirements were very low, with only a few exceptions. Sixteen bench-marks required less than 1 Mbyte, four used between 1 and 10 Mbytes, and only one(MG3D) used more than 100 Mbytes of I/O. As mentioned earlier, all I/O was mapped tothe SSD rather than going out to a rotating disk. Using the SSD reduced the actual timespent in I/O to a minimum.
The benchmarks showed a wide mix of performance when compiled with default vector-ization (Figure 3). The codes that have the best performance (over 100 MFLOPS) are allCFD codes that do not use FFTs as solvers (including both 2-D and 3-D codes), kernelsfrom CFD codes (NASKERN), and a molecular dynamics code which employs an ODEsolver (BDNA). The FFT based codes, among others, have a relatively moderate level ofperformance.
Compilation Expense
Code optimizations can only come at the expense of code analysis. Sometimes the analysisis inexpensive, sometimes it is not. The analysis necessary for vectorization is generally asubset of that required for parallelization. In order to provide a basis for comparison, Fig-ure 4 gives the compilation times, in seconds, for each

12
Figure 3 — Default Vectorization Performance
of the benchmarks using only the default CRAY optimizations. All program compilationtimes are given in Appendix B.
As can be seen from the chart, all codes compiled fairly quickly, even the larger codes likeQCD (number 23 in the chart). The question is whether enhanced vectorization or paral-lelization adds significantly

13
Figure 4 — Compile Times with Default Vectorization
to the compile time. In a research environment like NAS, codes are constantly being mod-ified and recompiled. Thus features that take too long will go unused unless they also sig-nificantly shorten the execution time. The following charts show how enhancedvectorization and parallelization increase the compilation time. The shortened executiontime will be treated in the next two sections.
The next chart (Figure 5) gives the ratio of enhanced vector compile times (Cv) to defaultcompile times (Cd). From the chart it is clear that fpp adds little to compilation times (about23%), but KAP/CRAY adds significantly (112% on the average). In one case (NAS09)KAP adds over 350%, boosting the compile time from 38 to 173 seconds, or about threeminutes. Even though this is much more time, it is not an intolerable amount of time towait for a compilation.
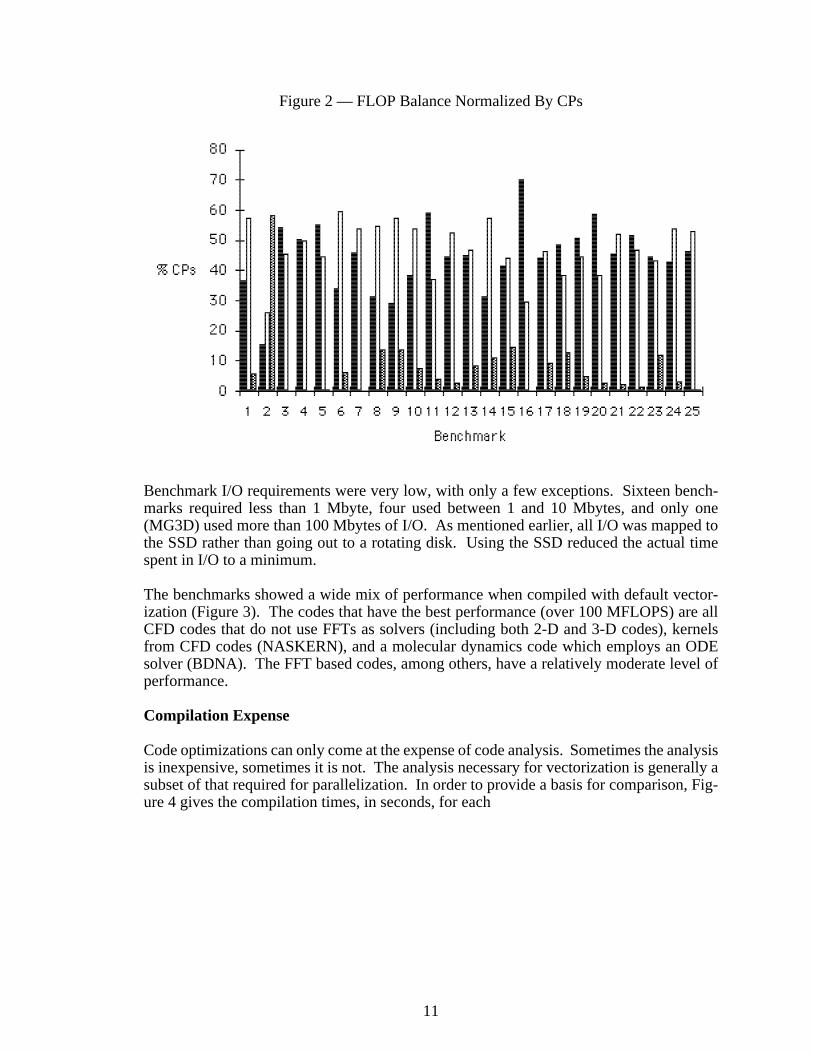
Figure 6 shows the expense of compilation using automatic parallelization. The results aresimilar but more exaggerated than for enhanced vectorization, since the analysis for paral-lelization is more extensive. For parallelization the average compilation time for fpp isabout 3.2 times the default compilation time, while the average KAP time is only a littleworse than fpp (3.78). The range for parallel compiles, however, is much larger. Fpp rang-es from 48% to 429% more time than default vectorization, while KAP ranges from 88%more to 600% more compile time. The longest KAP compile time is just under 400 seconds(6.5 minutes), which could be tiresome to wait for if it happened too frequently.
Figure 5 — Enhanced Vector Compilation Time Expense
14
Figure 6 — Parallel Compilation Expense
Enhanced Vectorization
The CRAY Fortran compiler, cft77, vectorizes some types of loop constructs, but in orderto keep the compilation time to a minimum it generally uses only those optimizations thatare both fast and frequently effective. Fpp, on the other hand, performs a more extensiveanalysis and therefore has greater potential for improving code performance. Figure 7shows the performance of all benchmarks, in millions of floating point operations per sec-ond (MFLOPS), after enhanced vectorization has been used. Appendix C contains perfor-mance information for each of the benchmarks under both default and enhancedvectorizations.
From the chart it appears that there is little change in benchmark performance. Those codesthat do well without enhanced vectorization also do well with it, and those that do poorlywithout are not much improved. Figure 8 summarizes the actual speedups (default vector-ization elapsed time divided by enhanced vectorization elapsed time) observed for the in-dividual benchmarks.
Figure 8 seems to indicate that the speedups cluster about 1.00 (i.e., no speedup at all), andindeed this is the case. The average speedup achieved by fpp is 1.02, which is not as goodas one might expect. Fpp gained some improvement for 12 of the 25 codes, or just less thanhalf of the benchmarks. We were hoping for at least 25% improvement but none of thecodes did even that well, although two

15
Figure 7 — Enhanced Vector MFLOPS
codes were close. The median speedup was 1.00, the minimum 0.84 (16% slower than noenhanced vectorization), and the best speedup was 1.24. The KAP average was only slight-ly better but the median was the same as fpp's. Statistics for fpp, KAP, and both are sum-marized in Table 8.
Figure 8 — Speedup from Enhanced Vectorization

16
fpp KAP BothCodes Improved 12 10 17Median Speedup 1.00 1.00 1.03
Average Speedup 1.02 1.03 1.09Minimum Speedup 0.84 0.89 0.83Maximum Speedup 1.24 1.53 1.96
Table 8 — Enhanced Vectorization Speedup Statistics
Combining KAP and fpp had some interesting results. The minimum speedup was 0.83—worse than either fpp or KAP alone, but all other statistics showed some improvement. Themedian increased to 1.03—slightly better than either KAP or fpp alone, while the averagespeedup was significantly improved. Fully 17 of the 25 codes showed some improvement,and the best speedup was nearly a factor of two over the default vectorization. The follow-ing chart (Figure 9) gives the distribution of speedups for fpp only (black column), KAPonly (white column), and both (grey column).
The four codes which benefitted most from enhanced vectorization used FFTs as a majorpart of their computation. Unfortunately, at least one of the FFTs (NAS04) performed wellbelow what it was capable of, even with enhanced vectorization. As a separate experiment,NAS04 was hand optimized by inserting compiler directives above loops which wereknown to be vectorizable. In every case the apparent dependencies were known to be false— no true dependencies were violated at any time. The elapsed time of
Figure 9 — Enhanced Vectorization Speedup Distributionthe new code was 89.28 seconds, which corresponds to 160.81 MFLOPS, a speedup of 2.89over the default compiler optimizations, or a factor of 2.55 faster than the original code us-ing enhanced vectorization.
Parallelization
The primary motivation for using parallel processors in scientific work is to increase the

17
computational power available to a user. Unfortunately, one's ability to exploit that powerdepends on the quantity and granularity of parallelism within the program, and the over-head one must pay to start, suspend, synchronize, and terminate parallel tasks. Figure 10shows the raw performance of each of the benchmarks using 4 CPUs in its execution. Per-formance information for the parallel execution of each of the benchmarks is included inAppendix C.
If a program has sufficient parallelism one can expect the speedup to be close to the numberof available processors. Figure 11 shows the speedup obtained by using fpp, KAP/CRAY,and both with four CPUs in dedicated time.
Figure 10 — 4 CPU MFLOPS

18
Figure 11 — 4 CPU Speedups
The speedup is calculated using enhanced vectorization as the basis for comparison eventhough it did not always improve the execution time. Given symbolically, then-processorspeedup is defined here as
SS( ,n) = F(TS(,v),TS(,n))whereTv andTn are the enhanced vector andn-CPU elapsed times, respectively.
This figure shows widely scattered speedups for the benchmarks. It is not too surprisingthat some codes would parallelize better than others, nor even that the overhead of attempt-ing to parallelize some codes would be greater than the benefits, yielding a speedup lessthan one. It is valuable to note, however, that many of the codes did show some improve-ment: 15 benchmarks compiled with fpp showed some improvement over enhanced vec-torization, 20 improved with KAP, and 17 improved when both fpp and KAP/CRAY wereused. The benchmark performance statistics for the 4 CPU runs are summarized in the Ta-ble 9. The distribution of speedups is given in Figure 12.

19
fpp KAP BothCodes Improved 15 20 17Median Speedup 1.14 1.10 1.07
Average Speedup 1.41 1.42 1.48Minimum Speedup 0.65 0.91 0.66Maximum Speedup 2.88 2.90 2.99
Table 9 — 4 CPU Speedup Statistics
The FFT codes which improved significantly under enhanced vectorization did not im-prove as much as might be expected under parallelization. This is in part because even afterenhanced vectorization they were relatively poor performers—under 100 MFLOPS on asingle CPU. The improvement seen with 4 CPUs matches the improvement gained underenhanced vectorization. The semaphore wait time for these codes is very close to 75%.This indicates that the improvements did not come from parallelization, but rather from theenhanced vectorization which is also present with the parallelization.
The codes which performed well under parallelization were 2-D CFD codes and one 3-DCFD code that didnot use FFTs in their computational kernel. Each of these codes werein the 100 to 200 MFLOPS range, but the fact that these codes are 2-D CFD codes is moreimportant than their initial high performance. Other codes displayed equally high perfor-mance under enhanced vectorization but did not perform as well under parallelization.
Figure 12 — 4 CPU Speedup Distribution
A separate experiment was conducted in which NAS04 was hand optimized, as it was forenhanced vectorization. The result was that its elapsed time dropped to 51.84 seconds, with101.43 seconds of CPU time on 4 CPUs. This corresponds to 276.93 MFLOPS, or morethan 4 times better than any execution without hand optimization.
If one compares the 4-CPU distribution against the enhanced vectorization speedup distri-bution, it is readily apparent that they are similar, in that the majority of the codes show less

20
than a 50% improvement. They also differ in that a greater number of benchmarks showan improvement greater than 50% (i.e., a speedup greater than 1.50). Another differenceis that the codes which make up the high end of vectorized codes are FFTs, where the CFDcodes were improved by parallelization and FFTs were not.
Each of the benchmarks was also run with 8 CPUs to see how the performance would differfrom 4 CPUs. The raw performance (in MFLOPS) is given in Figure 13. Figure 14 showsthe speedup gained by using 8 CPUs. The statistics are summarized in Table 10, and thedistribution of speedups is given in Figure 15.
Figure 13 — 8 CPU MFLOPS

21
Figure 14 — 8 CPU Speedups
The 8 CPU speedup scatter plot (Figure 14) shows several things of interest. It shows thatthe codes which improved the most with 8 CPUs were the same codes that improved themost with 4 CPUs, namely, CFD codes. It is also clear that the efficiency is dropping rap-idly with an increasing number of CPUs. Parallel efficiency is defined as
ES( ,n) = F(SS( ,n),n) = F(TS( ,v),n TS( ,n))
(For example, the 8-CPU efficiency isTv/(8*T8)). The best efficiencies obtained by the 4CPU runs were close to 75%, the equivalent of using 3 out of 4 CPUs. The highest 8 CPUefficiencies were lower—about 50%, or the equivalent of using 4 CPUs out of 8. Essen-tially, we had to double the number of CPUs in order to buy that additional 25% improve-ment.

22
Figure 15 — 8 CPU Speedup Distribution
Parallelism and Overhead
Fpp and KAP/CRAY exploit parallelism found in program loops. When nested loops areencountered it is generally more effective to vectorize the inner loops and distribute outerloop iterations across the available processors. Vectorization should never be sacrificed forthe sake of large grain parallelism, because of the low initial overhead and the high poten-tial gain vectorization offers. Data dependencies may interfere with both the vectorizationand parallelization of loops. If the loop is large and highly vectorizable, it is often parallel-izable.
Given the speedup and the number of processors, we can calculate the effective parallelfraction of a code. Amdahl's Law says that then-processor speedup (Sn) is related to thefraction of the operations which can be performed in parallel (p) and the number of proces-sors (n) by the equation
SS( ,n) = F(1,1-p+F(p,n))
Amdahl's Law assumes that the parallel operations can be exploited without incurring anypenalty, and the operations are continuous rather than discrete. In MIMD systems neitherassumption is true,

23
fpp KAP BothCodes Improved 15 17 17Median Speedup 1.18 1.06 1.06
Average Speedup 1.59 1.53 1.63Minimum Speedup 0.64 0.87 0.66Maximum Speedup 4.24 4.23 4.40
Table 10 — 8 CPU Speedup Statistics
but the assumption of no overhead is most important. The microtasking library incurs over-head in creating, suspending, restarting, synchronizing, and terminating parallel tasks. Theoverhead incurred within a code will depend on the number of processors used, and thenumber, size, and structure of each loop. Thus Amdahl's Law would have to have a termto account for parallel overhead which varied with the conditions of execution. However,if the overhead varies only slightly with the number of processors, one can at least obtaintheeffective parallel fraction, which will give some indication of a code's parallel perfor-mance, by solving Amdahl's Law forp.
p = F(n,(n-1))B(1 - F(1,SS( ,n))) = F(n,(n-1))B(1 - F(TS( ,n),TS( ,v)))
The next chart (Figure 16) shows the effective parallel fraction for each of the benchmarksusing 4 CPUs. When we report values of the parallel fractionp for a given program, wewill generally present it as a percentage, e.g.,p=0.43 would be reported as 43%. Noticealso that the parallelism is negative if the application is slowed by parallelization. This canoccur when the overhead of initiating and terminating a parallel task is larger than the ben-efit gained.
The overhead forn processors is defined here as
Overhead = 100 F((UserS( ,n)+SysS( ,n))-(UserS( ,v)+SysS( ,v)),(UserS( ,v)+SysS( ,v)))
whereUser andSys are the user and system times, respectively, for then-CPU parallel runs(n) or the enhanced vector runs (v). Overhead for the 4 CPU runs is shown in Figure 17.
Loops that vectorize well do so because the iterations, or at least parts of the iterations, canbe executed independently. If there is enough independent work in these loops, the itera-tions can be divided between multiple processors for a net gain in speed. How much workis "enough" is determined by the overhead involved in starting up the parallel processorsand dividing the loop iterations. This overhead is in addition to what a serial version of thesame program would do, so it necessarily increases the work load of the machine.
Very long loops permit the overhead to be amortized over many iterations, which improvesthe overall performance of the code. The lengths of the dominant loops were measured forseveral codes, and the results are recorded in Table 11. Loop lengths are measured in iter-ations. (Recall that NAS04 is an FFT code, while the others are CFD codes.) The parallelfraction for NAS04 is from the automatically parallelized version. The hand optimized ver-sion has a parallel fraction of 55%.

24
Figure 16 — % Parallelism in 4 CPU Runs
Figure 17 — % Overhead in 4 CPU Runs
The overhead is especially important to the throughput of a machine. A 100% overheadmeans that as much time is being spent maintaining parallelism as is accomplishing usefulwork. It also means the throughput could be reduced by 50%. The overhead is very high

25
for many codes, most of which do not parallelize well. Not surprisingly, the codes whichdo parallelize well have low levels of overhead. If only the high performance codes wereused (those with speedups greater than 2.00), the average overhead would be around 20%.This would reduce the potential throughput by about 17% over serial execution. This mightbe acceptable if there are enough idle CPU cycles, in which case the result could be a short-er average turnaround time for jobs in the machine.
Code Name Loop Length Parallel FractionNAS04 60 5 %NAS01 100 63 %NASKERN 256 42 %NAS06 1,000 88 %NAS08 11,000 81 %NAS10 26,500 79 %
Table 11 — Loop Lengths and Parallel Fractions
26
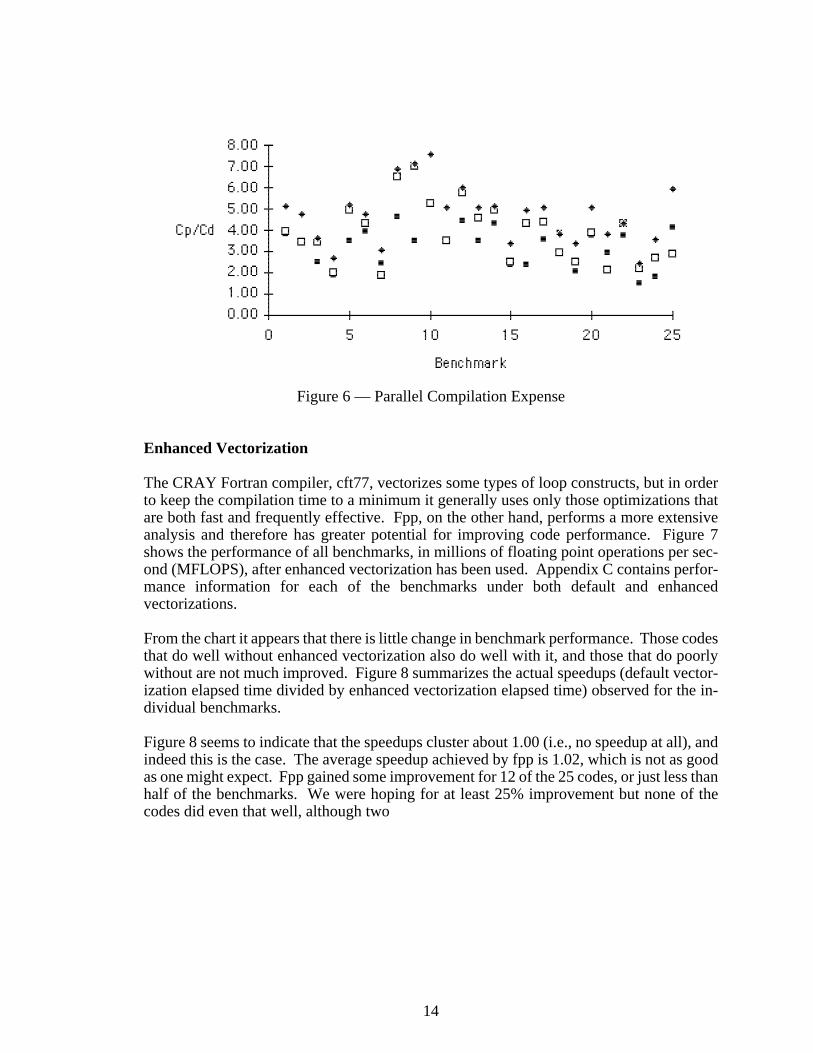
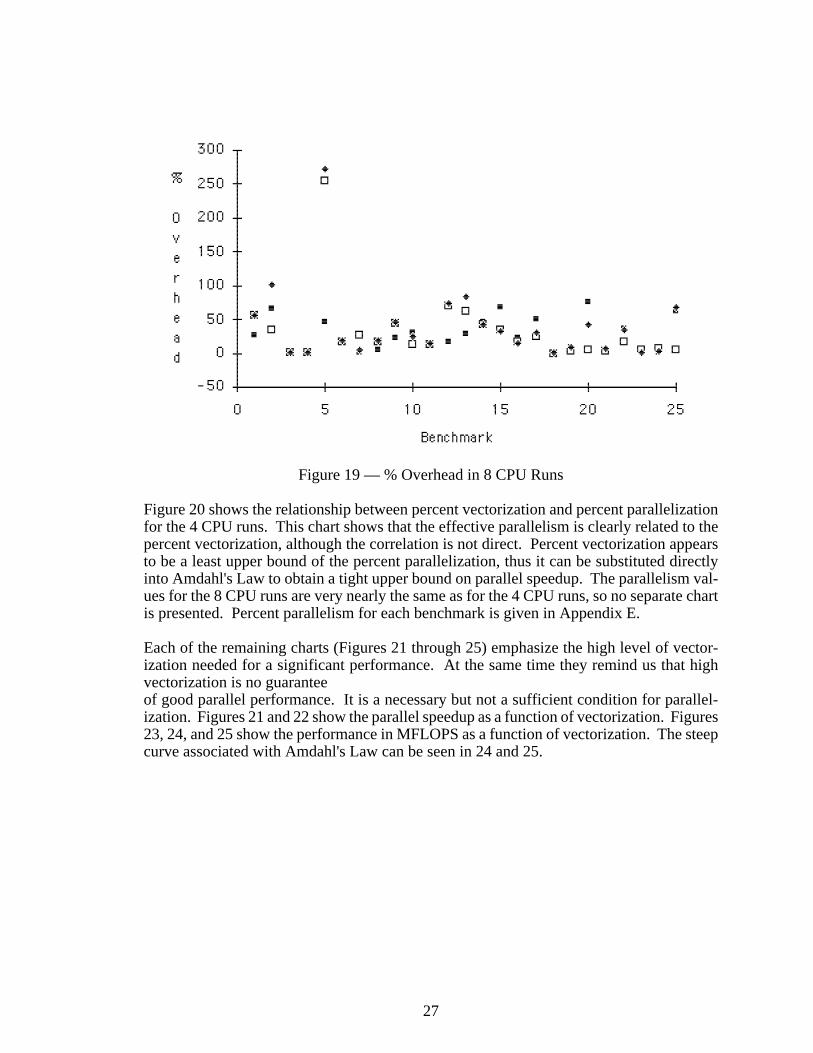
As mentioned before, the overhead does vary with the number of CPUs used. Some of thepoorly parallelizing codes suffer substantial increases in overhead when going to 8 CPUs,but that doesn't matter much since such codes would probably not be used in their parallelform. The highly parallel codes, however, add approximately 15% overhead by going from4 CPUs to 8. The effective parallelism and overhead for the 8 CPU runs are shown in Fig-ures 18 and 19.
Percent Vectorization
While it is possible, in theory, to parallelize some poorly vectorized code, no evidence wasfound in this study that would indicate such was taking place. This may be because suchopportunities might not exist within the selected benchmarks, or because the tools them-selves might not be set up to do that. While high vectorization levels seem to be requiredin order to parallelize a program, it is not a guarantee of success. Several codes, e.g. NAS05and NASKERN, had higher levels of vectorization than their levels of parallelization wouldsuggest. (Percent vectorization for each benchmark is calculated in Appendix D.)
Figure 18 — Parallelism in 8 CPU Runs
27
Figure 19 — % Overhead in 8 CPU Runs
Figure 20 shows the relationship between percent vectorization and percent parallelizationfor the 4 CPU runs. This chart shows that the effective parallelism is clearly related to thepercent vectorization, although the correlation is not direct. Percent vectorization appearsto be a least upper bound of the percent parallelization, thus it can be substituted directlyinto Amdahl's Law to obtain a tight upper bound on parallel speedup. The parallelism val-ues for the 8 CPU runs are very nearly the same as for the 4 CPU runs, so no separate chartis presented. Percent parallelism for each benchmark is given in Appendix E.
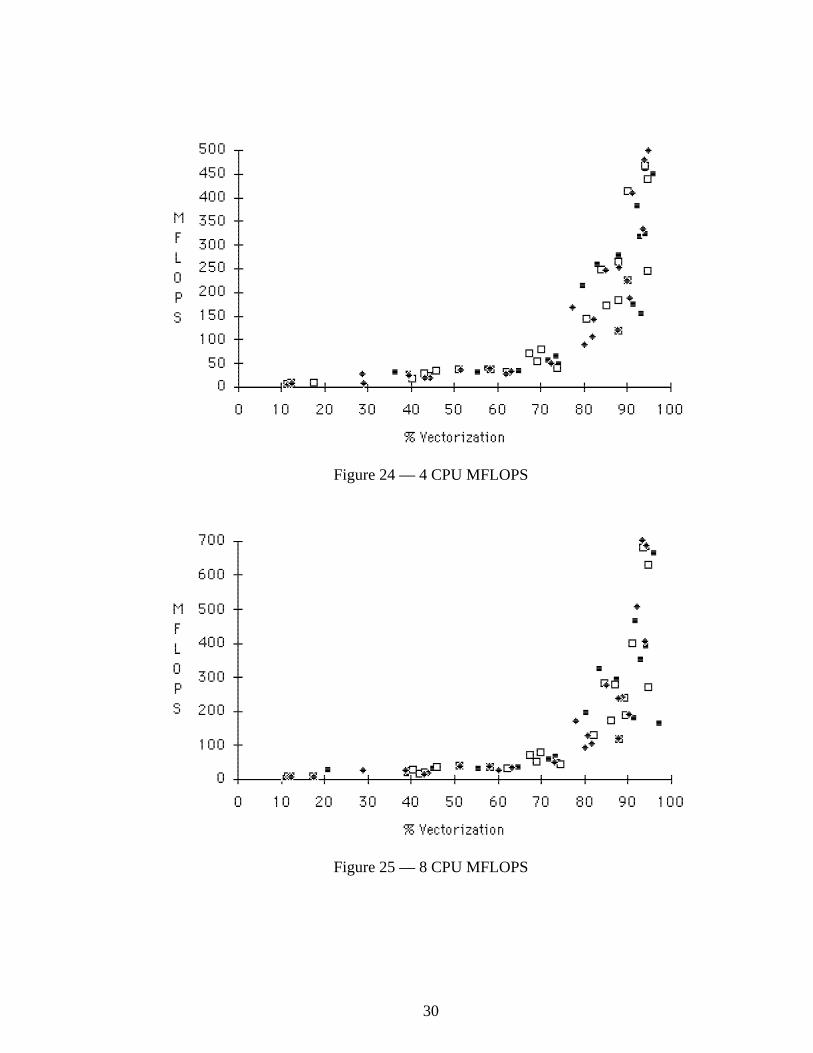
Each of the remaining charts (Figures 21 through 25) emphasize the high level of vector-ization needed for a significant performance. At the same time they remind us that highvectorization is no guaranteeof good parallel performance. It is a necessary but not a sufficient condition for parallel-ization. Figures 21 and 22 show the parallel speedup as a function of vectorization. Figures23, 24, and 25 show the performance in MFLOPS as a function of vectorization. The steepcurve associated with Amdahl's Law can be seen in 24 and 25.

28
Figure 20 — 4 CPU % Parallelism vs. % Vectorization
Figure 21 — 4 CPU Speedup vs. % Vectorization

29
Figure 22 — 8 CPU Speedup vs. % Vectorization
Figure 23 — Enhanced Vectorization
30
Figure 24 — 4 CPU MFLOPS
Figure 25 — 8 CPU MFLOPS

31
Compilation Problems
Neither fpp nor KAP were completely free of problems. KAP had more problems than didfpp, probably because the writers of fpp had greater access to the system, particularly fmp,the program which translates microtasking directives into CRAY library calls. All of thebugs we discovered in both products were annoyances, but could be tolerated using a sim-ple work around. None were so serious as to render the product unusable, and all seemedto be fixable with no more than a moderate amount of effort. Below we give a brief sum-mary of the bugs we found.
● KAP incorrectly declares CDIR$ SHORTLOOP on some variable length loops,which may give either incorrect results or a floating point exception.
● KAP leaves DATA statements within CMIC$ PARALLEL sections, whichcauses CRAY Autotasking to fail during compilation. One might argue that DATAstatements may not legally occur where CMIC directives are allowed, but neitherdoes KAP flag it as an error. Either moving DATA statements to the beginning ofa routine or flagging them as being out of place would be acceptable.
● KAP occasionally uses KAP-generated indexing functions or arrays, but doesn'tprovide a definition for them. This causes undefined external references to occurin the program.
● KAP does not always provide SHARED or PRIVATE declarations for array in-dex variables it introduces into the program. Parallel programs are very sensitiveto whether certain variables are private or shared, and fmp is not able to decidewhich mode is correct.
● Fpp does not always distinguish between comments that are compiler directivesand those that are not. As a result, fpp sometimes rearranges microtasking direc-tives which should be left in place.
Conclusions
Using fpp to enhance the vectorization does not significantly slow down the compilationprocess. It added, on the average, only 23% to the compilation times of our benchmarksuite. On the other hand, neither does it significantly improve its performance. The FFTcodes improved the most, but the best improvement was only 24%.
In contrast, using KAP for enhanced vectorization does slow program compilation downconsiderably, adding on the average 112%, and sometimes as much as 350% to the compi-lation time. To its credit, it does speed up FFTs significantly. In two cases, FFT bench-marks were improved by approximately 50%. Combining fpp with KAP brought about aneven greater improvement—almost 100%. Like fpp, though, non-FFT codes did not no-ticeably improve.
Both KAP and fpp substantially slowed the compilation time when they were used for au-tomatic parallelization, and KAP was usually only a little slower than fpp. Both improvedthe performance of CFD codes, especially the 2-D CFD codes. Used together, the improve-

32
ment was a factor of 2.5 to 3.0 using 4 CPUs, and from 2.5 to 4.5 on 8 CPUs. Neither fppnor KAP had a significant performance edge over the other.
Neither KAP nor fpp were able to uncover sufficient parallelism in CFD codes for highlyparallel execution. Parallelism ran about 60% to 90% which would correspond to maxi-mum speedups of 2.5 to 10, given 1) an infinite supply of parallel hardware, and 2) noincrease in the overhead to use it. As good as this is, we anticipate far greater levels of par-allelism (95% to 99.9%) will be needed to take advantage of future parallel hardware. Theoverhead required to maintain parallel execution was relatively large, and reducing thismight significantly improve these values.
Parallel efficiency was much higher for 4 CPU runs (75%) than for 8 CPU runs (50%), pri-marily due to Amdahl's Law and the modest amount of parallelism found in the programs.It is a corollary to Amdahl's Law that the efficiency will always be higher for the 4 CPUruns than the 8 CPU runs. It is because of the moderate levels of parallelism that the par-allel efficiency differs so greatly.
Overhead from parallelization was high, to the extent that widespread parallelization couldsignificantly reduce a system's throughput in a production environment. Overhead was es-pecially high for codes that did not parallelize well. Overhead for the CFD codes on 4CPUs averaged approximately 15% to 20%. On 8 CPUs the average increased to about25%.
Program vectorization and Amdahl's Law determine an upper bound on speed improve-ments due to parallelization. Parallelized codes are highly vectorized codes, but a high lev-el of vectorization does not guarantee that a code will also parallelize. The need for highlevels of vectorization grows dramatically as the number of CPUs increases.
Because the levels of parallelism KAP and fpp found in even the best codes were muchlower than desired, we conclude that such tools will probably not be able to find sufficientparallelism without human assistance. In our opinion the ideal tool for parallelizing Fortranprograms would have:
● Extensive dependence analysis — this has been a traditional area of focus, andallows the tool to distinguish, albeit imperfectly, between code which is paralleliz-able and code that must remain sequential. Both KAP and fpp seem to do quite wellat this. The most obvious problem was that in order to correctly determine that cer-tain dependences were false, both tools would have needed information about theprogram's runtime behavior, or about its algorithms. More extensive analysis mighthelp some, but it can't use information that isn't there without a programmer's help.
● Extensive code transformation vocabulary — another area of traditional focus,it gives the tool the ability to improve the level of parallelism or the granularity ofparallelism while retaining the original meaning of the program. Again, KAP andfpp seem to do well at this.
● Runtime statistics — allows the tool to steer the user towards the most heavilyused, and therefore most profitably optimized sections of code. It also could retainprogram traces and branch probabilities, which might further assist in choosing ap-

33
propriate code restructuring optimizations.
● Queriable interface — allows the tool to display only the information that theuser wants to see, instead of all information thatmight be relevant. It would be ben-eficial if the interface were sufficiently robust to be able to identify user suppliedpatterns in the code, array indices, and variable usages.
● Analysis facility — indicates the circumstances under which perceived depen-dences arefalse so the programmer can decide whether that section of code is safelyparallelizable.
● Suggestion facility — makes optimization and parallelization suggestions to theuser, and indicates the circumstances under which the suggestions are valid. Thisshould include an understanding of the vectorization and parallelization overheadinvolved, letting the user know when the section of code being parallelized may nothave sufficient work to overcome the expected cost.
Acknowledgements
We would like to thank all those who helped out with the preparation of this report, and asis always the case, there are several who merit special recognition. Robert Bergeron andRussell Carter contributed significantly to the ideas in this report, and steered us away fromnumerous pitfalls in the data gathering. Kuck and Associates generously allowed the useof their software and provided the necessary support, which we appreciate greatly. Last butnot least, Eugene Miya contributed to the philosophical foundations of this work.
References
[1] L. Kipp, "Perfect Benchmarks Documentation, Suite 1," Centerfor Supercomputing Research and Development, University ofIllinois at Urbana-Champaign, Urbana, IL, 1990.
[2] "CRAY Y-MP Computer Systems Functional Description Manual,"HR-4001, CRAY Research, Inc., Mendota Heights, MN, 1988.
[3] "CF77 Compiling System, Volume 4: Parallel Processing Guide,"SG-3074 4.0, CRAY Research, Inc., Mendota Heights, MN, 1990.
[4] "KAP/CRAY User's Guide," Kuck & Associates, Inc., Champaign,IL, 1989.

34
Appendix A — Benchmark Characteristics
This appendix lists several characteristics for each of the benchmarks. They are:
Source lines — number of text lines in the original program, including commentsand blank lines. No compiler directives are included.
Size — total program memory requirements, in megawords (2**20 64-bit words),as obtained by compiling the program for sequential execution by the CRAY For-tran compiler, cft77. Memory size was measured by the UNICOS utility "size".
Floating point adds, multiplies, and reciprocals — total operations in each categoryas measured by the Y-MP hardware performance module (group 0).
Data transferred — total program I/O requirements including all raw and formattedread and write operations. The units are megabytes.

35

36
Appendix B — Compilation Data
This appendix contains the CPU times used to compile each of the programs, both for par-allel and sequential execution. User and system times were recorded from the Unix C-shell"time" facility.

37

38

39

40
Appendix C — Performance Data
This appendix contains the following information:
Elapsed sec — total program elapsed (wall clock) execution time, in seconds, asmeasured by the UNICOS "ja" utility.
CPU sec — program CPU (user) execution time, in seconds, as measured by the"ja" utility.
System sec — program system time, in seconds, also from "ja".
% Vectorization — percentage of program instructions that were vector instruc-tions. This value is calculated in Appendix D.
MFLOPS — millions (10**6) of floating point operations per second. It is calcu-lated by dividing the total floating point operations (recorded in Appendix A) by theelapsed time.
Sem. Wait — semaphore wait time as reported by the hardware performance mon-itor (HPM) group 1. Semaphore wait time indicates the percentage of time CPUsspend in a "parked" state waiting for work to become available.
Con. CPU — average concurrent CPUs as reported by the "ja" facility. It indicatesthe average number of CPUs that are either busy in behalf of the program or idleavailable to do work.
Speedup — multiplication factor of improvement in elapsed time over the defaultvectorization execution elapsed time. Values below 1.00 indicate the performancewas higher with default vectorization.
Instructions — total vector and scalar instructions executed, as recorded by theHPM (group 0).
MIPS — millions (10**6) of instructions executed per second.
CPI — average number of clock periods per instruction, or
CPI = F(Elapsed time,Instructions x 6.0 ns/clock)

41

42

43

44

45

46

47

48

49

50

51

52
Appendix D — Vectorization Data
This appendix contains the calculation of the percent vectorization reported in Appendix C.Block memory reference counts come from the hardware performance monitor (HPM)group 2. All other values come from HPM group 3. Group 3 measurements were obtainedwith avl disabled.
Block memory (a) — block memory transfers (vector loads and stores).
Vector I+L (b) — integer and logical vector instructions.
Vector Float (c) — vector floating point instructions (additions, multiplications andreciprocals).
Jump/Special (d) — branch, conditional, and special instructions.
Scalar FU (e) — scalar functional unit instructions.
Scalar memory (f) — scalar register load and store instructions.
% Vectorization — percent of program instructions that were vector instructions,calculated by
% Vectorization = 100 F(a+b+c,a+b+c+d+e+f)
Avg Len-I+L — average vector length of all integer/logical vector operations.
Avg Len-Float — average vector length of all floating point vector operations.

53

54

55

56

57

58

59

60

61

62

63
Appendix E — Effective Parallel Fraction
This appendix gives the effective parallel fraction for each of the parallel program execu-tions. The formula to compute the parallel fraction is obtained by solving Amdahl's Law,giving
% p = 100 F(n,(n-1))B(1 - F(TS( ,n),TS( ,v)))
whereTn andTv are the elapsed times of then-CPU and vector executions, respectively.

64