automatic protein disulfi de bond mapping of a … · automatic protein disulfi de bond mapping...
TRANSCRIPT
Automatic Protein Disulfi de Bond Mapping of a Monoclonal Antibody Using the Agilent Accurate-Mass Q-TOF LC/MS Platform and BioConfi rm Software Algorithm
Application Note
Authors
David L. Wong, Stephen Madden, and Javier SatulovskyAgilent Technologies, Inc. Santa Clara, CA, USA
Biotherapeutics and Biosimilars
IntroductionMonoclonal antibodies (mAbs) are a very important class of biopharmaceutical molecules with a wide range of therapeutic and diagnostic applications. For mAbs, higher-order structure plays a critical role in effi cacy, and is greatly infl uenced by disulfi de bonds [1]. Drug quality assessment necessitates the determination of disulfi des, including confi rmation of expected linkages and perturbations. Knowledge of disulfi de bonds may infl uence mAb production efforts from candidate selection to formulation. Typically, disulfi de bond mapping presents serious analytical challenges, because many combinations of bonds can be created when the molecule is exposed to stress [2]. We have developed a LC/MS method using an Agilent 1290 Infi nity II UHPLC, an Agilent 6545 Q-TOF/MS, and Agilent MassHunter BioConfi rm B.08.00 software for accurate disulfi de bond mapping. This method can readily be used to map the scrambling of disulfi de bonds in a monoclonal antibody.
2
Each feature was given a Quality Score; a perfect score is 100. The following factors were considered when setting the Quality score:
• Signal-to-noise ratio (S/N)• RT peak shape• RT peak width• Consistency of ion retention time• Mass difference between ion species• Whether it is a single-ion compound
The features found were compared to a theoretically digested Herceptin sequence with post-translational modifi cations, cysteine disulfi de linkages, and sample preparation artifacts. In a typical run, approximately 2,000 putative peptides were found and assigned a Quality Score for the annotation of these sequence characteristics. In addition, the quality of disulfi de bond linkages was assessed using the Bio Score value, which is determined by a formula that allows users to specify the weight given to the MS score and the MS/MS score (determined by various factors, such as peak intensity and matched ions).
Results and DiscussionDisulfi de bond formation is a post-translational process that can affect the structure and function of therapeutic proteins. Incomplete or incorrect disulfi de bond linkages can generate protein misfolding, which will eventually infl uence the drug effi cacy. Therefore, it is critical to confi rm that all disulfi de bond linkages are correct.
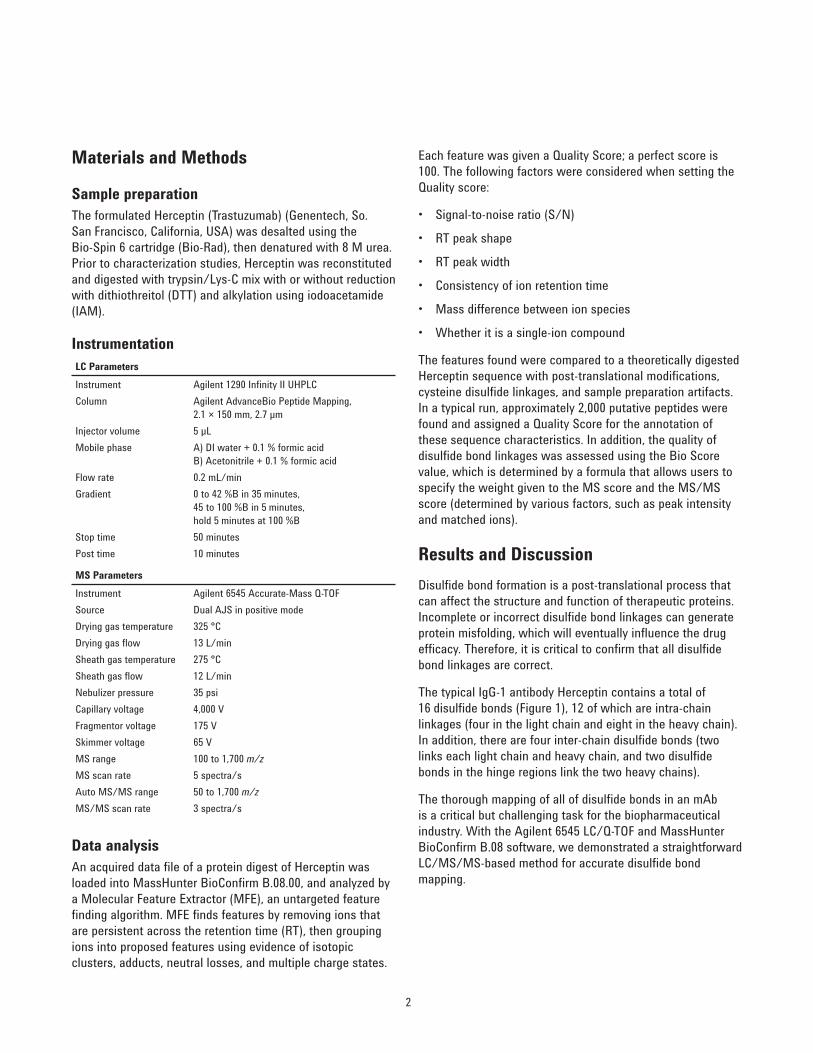
The typical IgG-1 antibody Herceptin contains a total of 16 disulfi de bonds (Figure 1), 12 of which are intra-chain linkages (four in the light chain and eight in the heavy chain). In addition, there are four inter-chain disulfi de bonds (two links each light chain and heavy chain, and two disulfi de bonds in the hinge regions link the two heavy chains).
The thorough mapping of all of disulfi de bonds in an mAb is a critical but challenging task for the biopharmaceutical industry. With the Agilent 6545 LC/Q-TOF and MassHunter BioConfi rm B.08 software, we demonstrated a straightforward LC/MS/MS-based method for accurate disulfi de bond mapping.
Materials and Methods
Sample preparationThe formulated Herceptin (Trastuzumab) (Genentech, So. San Francisco, California, USA) was desalted using the Bio-Spin 6 cartridge (Bio-Rad), then denatured with 8 M urea. Prior to characterization studies, Herceptin was reconstituted and digested with trypsin/Lys-C mix with or without reduction with dithiothreitol (DTT) and alkylation using iodoacetamide (IAM).
LC ParametersInstrument Agilent 1290 Infi nity II UHPLCColumn Agilent AdvanceBio Peptide Mapping,
2.1 × 150 mm, 2.7 μmInjector volume 5 µLMobile phase A) DI water + 0.1 % formic acid
B) Acetonitrile + 0.1 % formic acidFlow rate 0.2 mL/minGradient 0 to 42 %B in 35 minutes,
45 to 100 %B in 5 minutes, hold 5 minutes at 100 %B
Stop time 50 minutesPost time 10 minutes
MS ParametersInstrument Agilent 6545 Accurate-Mass Q-TOFSource Dual AJS in positive modeDrying gas temperature 325 °CDrying gas fl ow 13 L/minSheath gas temperature 275 °CSheath gas fl ow 12 L/minNebulizer pressure 35 psiCapillary voltage 4,000 VFragmentor voltage 175 VSkimmer voltage 65 VMS range 100 to 1,700 m/zMS scan rate 5 spectra/sAuto MS/MS range 50 to 1,700 m/zMS/MS scan rate 3 spectra/s
Instrumentation
Data analysisAn acquired data fi le of a protein digest of Herceptin was loaded into MassHunter BioConfi rm B.08.00, and analyzed by a Molecular Feature Extractor (MFE), an untargeted feature fi nding algorithm. MFE fi nds features by removing ions that are persistent across the retention time (RT), then grouping ions into proposed features using evidence of isotopic clusters, adducts, neutral losses, and multiple charge states.
3
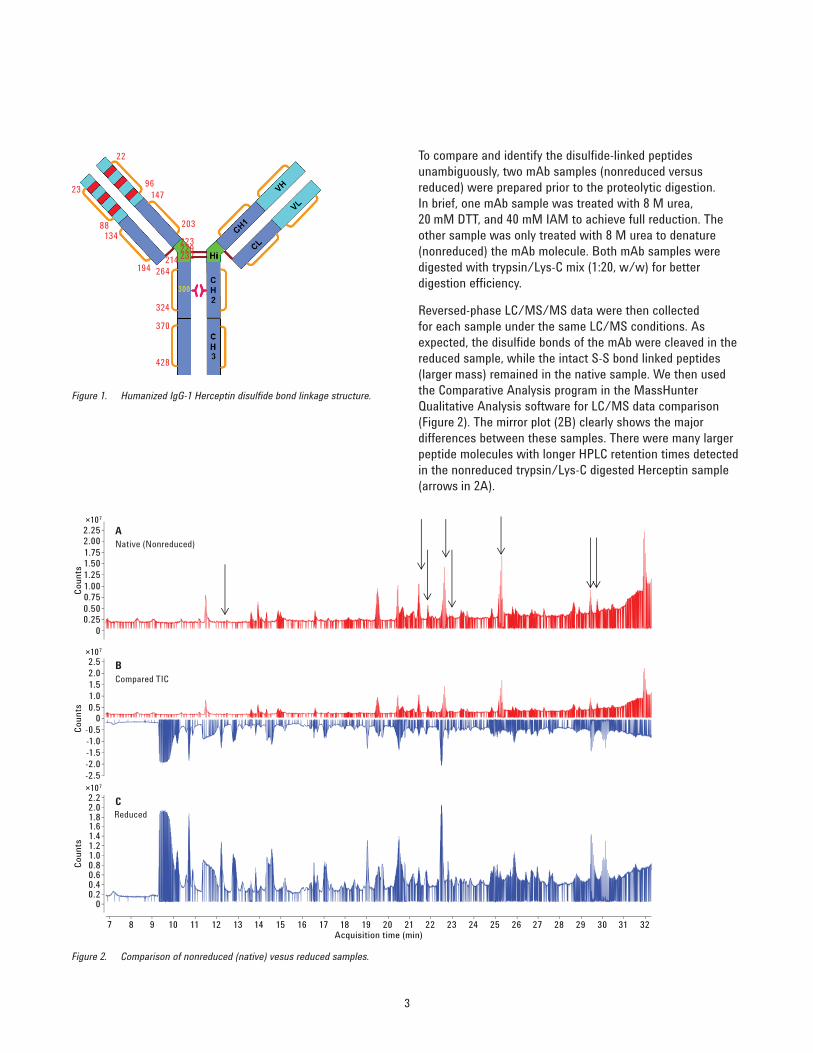
To compare and identify the disulfi de-linked peptides unambiguously, two mAb samples (nonreduced versus reduced) were prepared prior to the proteolytic digestion. In brief, one mAb sample was treated with 8 M urea, 20 mM DTT, and 40 mM IAM to achieve full reduction. The other sample was only treated with 8 M urea to denature (nonreduced) the mAb molecule. Both mAb samples were digested with trypsin/Lys-C mix (1:20, w/w) for better digestion effi ciency.
Reversed-phase LC/MS/MS data were then collected for each sample under the same LC/MS conditions. As expected, the disulfi de bonds of the mAb were cleaved in the reduced sample, while the intact S-S bond linked peptides (larger mass) remained in the native sample. We then used the Comparative Analysis program in the MassHunter Qualitative Analysis software for LC/MS data comparison (Figure 2). The mirror plot (2B) clearly shows the major differences between these samples. There were many larger peptide molecules with longer HPLC retention times detected in the nonreduced trypsin/Lys-C digested Herceptin sample (arrows in 2A).
Figure 1. Humanized IgG-1 Herceptin disulfi de bond linkage structure.
23
88134
194214
324
264
428
370
22
96147
203
223229232
300
Figure 2. Comparison of nonreduced (native) vesus reduced samples.
×107
×107
×107
00.250.500.751.001.251.501.752.002.25
-2.5-2.0-1.5-1.0-0.5
00.51.01.52.02.5
00.20.40.60.81.01.21.41.61.82.02.2
Acquisition time (min)
Coun
tsCo
unts
Coun
ts
7 8 9 10 11 12 13 14 15 16 17 18 19 20 21 22 23 24 25 26 27 28 29 30 31 32
Native (Nonreduced)A
B
CReduced
Compared TIC
4
This algorithm for mapping disulfi de bonds in MassHunter BioConfi rm B.08.00 is also able to discern native state linkages. Scrambled linkages can be eliminated from consideration because they have much lower Quality and Bio scores. Table 1 shows the results where the B22–B96 disulfi de linkage in the heavy chain has been defi ned in the Herceptin sequence with a Bio Score of 67.15. Other disulfi de linkages that received lower Bio scores were likely due to their low MS/MS scores in the fragment ion matching of the large molecules and low abundances for missed cleavage peptides.
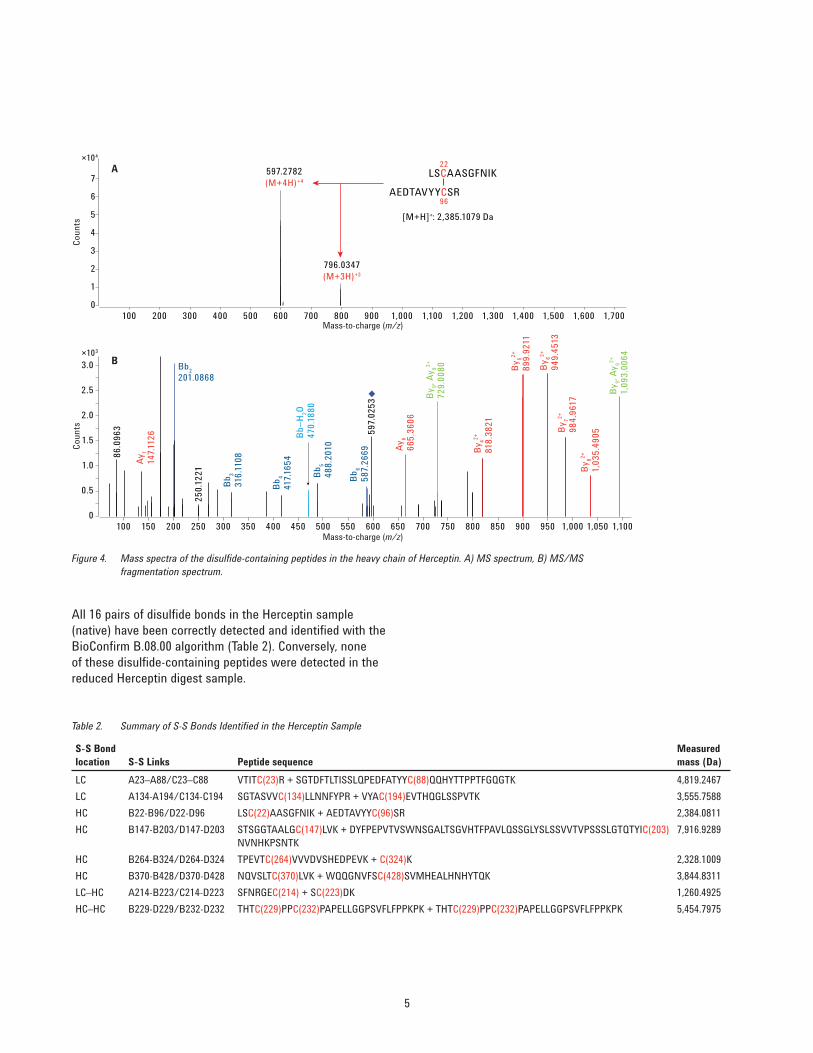
The analyst can examine these graphically for higher confi dence in the mapping results as shown in Figure 4. The peptide sequences and the molecular mass of the disulfi de-linked peptides from the heavy chain of the native Herceptin sample are shown in the top panel. Only the 3+ (m/z 796.0351) and 4+ (m/z 597.2808) ions of the disulfi de-linked peptides were detected. MS/MS spectra are ranked by the number of matching fragments and explanations of the product ions using the peptide sequence. Product ion spectra of the 4+ (m/z 597.2808) precursor ion (B) are labeled with b (blue) and y ions (red).
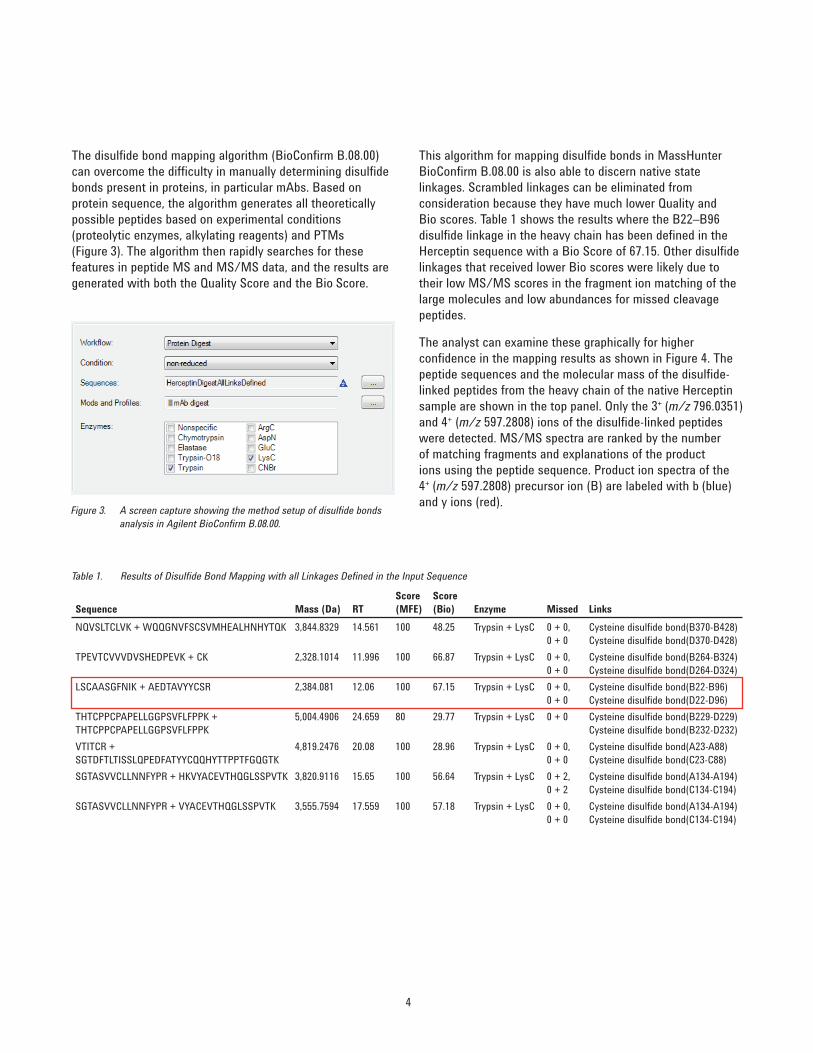
The disulfi de bond mapping algorithm (BioConfi rm B.08.00) can overcome the diffi culty in manually determining disulfi de bonds present in proteins, in particular mAbs. Based on protein sequence, the algorithm generates all theoretically possible peptides based on experimental conditions (proteolytic enzymes, alkylating reagents) and PTMs (Figure 3). The algorithm then rapidly searches for these features in peptide MS and MS/MS data, and the results are generated with both the Quality Score and the Bio Score.
Figure 3. A screen capture showing the method setup of disulfi de bonds analysis in Agilent BioConfi rm B.08.00.
Sequence Mass (Da) RTScore (MFE)
Score (Bio) Enzyme Missed Links
NQVSLTCLVK + WQQGNVFSCSVMHEALHNHYTQK 3,844.8329 14.561 100 48.25 Trypsin + LysC 0 + 0, 0 + 0
Cysteine disulfi de bond(B370-B428)Cysteine disulfi de bond(D370-D428)
TPEVTCVVVDVSHEDPEVK + CK 2,328.1014 11.996 100 66.87 Trypsin + LysC 0 + 0, 0 + 0
Cysteine disulfi de bond(B264-B324)Cysteine disulfi de bond(D264-D324)
LSCAASGFNIK + AEDTAVYYCSR 2,384.081 12.06 100 67.15 Trypsin + LysC 0 + 0, 0 + 0
Cysteine disulfi de bond(B22-B96)Cysteine disulfi de bond(D22-D96)
THTCPPCPAPELLGGPSVFLFPPK + THTCPPCPAPELLGGPSVFLFPPK
5,004.4906 24.659 80 29.77 Trypsin + LysC 0 + 0 Cysteine disulfi de bond(B229-D229)Cysteine disulfi de bond(B232-D232)
VTITCR + SGTDFTLTISSLQPEDFATYYCQQHYTTPPTFGQGTK
4,819.2476 20.08 100 28.96 Trypsin + LysC 0 + 0, 0 + 0
Cysteine disulfi de bond(A23-A88)Cysteine disulfi de bond(C23-C88)
SGTASVVCLLNNFYPR + HKVYACEVTHQGLSSPVTK 3,820.9116 15.65 100 56.64 Trypsin + LysC 0 + 2, 0 + 2
Cysteine disulfi de bond(A134-A194)Cysteine disulfi de bond(C134-C194)
SGTASVVCLLNNFYPR + VYACEVTHQGLSSPVTK 3,555.7594 17.559 100 57.18 Trypsin + LysC 0 + 0, 0 + 0
Cysteine disulfi de bond(A134-A194)Cysteine disulfi de bond(C134-C194)
Table 1. Results of Disulfi de Bond Mapping with all Linkages Defi ned in the Input Sequence
5
Figure 4. Mass spectra of the disulfi de-containing peptides in the heavy chain of Herceptin. A) MS spectrum, B) MS/MS fragmentation spectrum.
×104
×103
0100
100 150 200 250 300 350 400 450 500 550 600 650 700 750 800 850 900 950 1,000 1,050 1,100
200 300 400 500 600
597.2782(M+4H)+4
796.0347
86.0
963
250.
1221
597.0
253
Ay1
147.1
126
Ay6
665.
3606
By42+
818.
3821
By52+
899.
9211
By62+
949.
4513
By72+
984.
9617
By82+
1,03
5.49
05
By9,
Ay93+
729.
0080
By9,
Ay92+
1,09
3.00
64
Bb2201.0868
Bb3
316.
1108
Bb4
417.1
654
Bb5
488.
2010
Bb6
587.
2669
Bb–H
2O47
0.18
80
[M+H]+: 2,385.1079 Da
(M+3H)+3
700 800 900 1,000 1,100 1,200 1,300 1,400 1,500 1,600 1,700
0
0.5
1.0
1.5
2.0
2.5
3.0
1
2
3
4
5
6
7A
B
Coun
tsCo
unts
Mass-to-charge (m/z)
Mass-to-charge (m/z)
96
22LSCAASGFNIK
AEDTAVYYCSR
S-S Bond location S-S Links Peptide sequence
Measured mass (Da)
LC A23–A88/C23–C88 VTITC(23)R + SGTDFTLTISSLQPEDFATYYC(88)QQHYTTPPTFGQGTK 4,819.2467LC A134-A194/C134-C194 SGTASVVC(134)LLNNFYPR + VYAC(194)EVTHQGLSSPVTK 3,555.7588HC B22-B96/D22-D96 LSC(22)AASGFNIK + AEDTAVYYC(96)SR 2,384.0811HC B147-B203/D147-D203 STSGGTAALGC(147)LVK + DYFPEPVTVSWNSGALTSGVHTFPAVLQSSGLYSLSSVVTVPSSSLGTQTYIC(203)
NVNHKPSNTK7,916.9289
HC B264-B324/D264-D324 TPEVTC(264)VVVDVSHEDPEVK + C(324)K 2,328.1009HC B370-B428/D370-D428 NQVSLTC(370)LVK + WQQGNVFSC(428)SVMHEALHNHYTQK 3,844.8311LC–HC A214-B223/C214-D223 SFNRGEC(214) + SC(223)DK 1,260.4925HC–HC B229-D229/B232-D232 THTC(229)PPC(232)PAPELLGGPSVFLFPPKPK + THTC(229)PPC(232)PAPELLGGPSVFLFPPKPK 5,454.7975
Table 2. Summary of S-S Bonds Identifi ed in the Herceptin Sample
All 16 pairs of disulfi de bonds in the Herceptin sample (native) have been correctly detected and identifi ed with the BioConfi rm B.08.00 algorithm (Table 2). Conversely, none of these disulfi de-containing peptides were detected in the reduced Herceptin digest sample.
References1. R. J. Harris. “Heterogeneity of recombinant antibodies:
linking structure to function” Dev. Biol. (Basel) 122, 117-27, PMID: 16375256 (2005).
2. H. Liu, K. May. “Disulfi de bond structures of IgG molecules: Structural variations, chemical modifi cations and possible impacts to stability and biological function” MAbs 4, 17-23 (2012).
For More InformationThese data represent typical results. For more information on our products and services, visit our Web site atwww.agilent.com.
ConclusionsWe have developed and demonstrated an analytical workfl ow that uses an Agilent UHPLC, an Agilent 6545 LC/Q-TOF, and Agilent MassHunter BioConfi rm B.08.00 software for the accurate disulfi de bond mapping of a monoclonal antibody. This workfl ow can rapidly map disulfi de bonds to their locations, and use the MS/MS fragmentation data from the disulfi de-containing peptides to calculate the Quality Score for higher confi dence results. This workfl ow can also be applied to the disulfi de bond scrambling mapping of a monoclonal antibody.
www.agilent.com/chem/bioconfi rmFor Research Use Only. Not for use in diagnostic procedures.
This information is subject to change without notice.
© Agilent Technologies, Inc., 2016Printed in the USAMay 25, 20165991-6951EN