automatic test packet generation - stanford university
TRANSCRIPT

Automatic Test Packet Generation
Hongyi Zeng†‡,Peyman Kazemian†‡, George Varghese∗, Nick McKeown†† {hyzeng,kazemian,nickm}@stanford.edu, Stanford University, Stanford, CA, USA
∗ [email protected], UCSD, La Jolla and Microsoft Research, Mountain View, CA, USA‡ These authors contributed equally to this work
ABSTRACTNetworks are getting larger and more complex; yet adminis-trators rely on rudimentary tools such as ping and tracer-
oute to debug problems. We propose an automated and sys-tematic approach for testing and debugging networks called“Automatic Test Packet Generation” (ATPG). ATPG readsrouter configurations and generates a device-independentmodel. The model is used to generate a minimum set oftest packets to (minimally) exercise every link in the net-work or (maximally) exercise every rule in the network. Testpackets are sent periodically and detected failures trigger aseparate mechanism to localize the fault. ATPG can de-tect both functional (e.g., incorrect firewall rule) and per-formance problems (e.g., congested queue). ATPG comple-ments but goes beyond earlier work in static checking (whichcannot detect liveness or performance faults) or fault local-ization (which only localize faults given liveness results).
We describe our prototype ATPG implementation andresults on two real-world data sets: Stanford University’sbackbone network and Internet2. We find that a smallnumber of test packets suffices to test all rules in these net-works: For example 4000 packets can cover all rules in Stan-ford backbone network while 54 is enough to cover all links.Sending 4000 test packets 10 times per second consumes lesssthan 1% of link capacity. ATPG code and the data sets arepublicly available1 [1].
Categories and Subject DescriptorsC.2.3 [Computer-Communication Networks]: NetworkOperation—Network monitoring ; D.2.5 [Software Engi-neering]: Testing and Debugging—Testing tools
General TermsAlgorithm, Reliability
1Each figure/table in Section 7 (electronic version) is click-able, linking to instructions on reproducing results.
Permission to make digital or hard copies of all or part of this work forpersonal or classroom use is granted without fee provided that copies arenot made or distributed for profit or commercial advantage and that copiesbear this notice and the full citation on the first page. To copy otherwise, torepublish, to post on servers or to redistribute to lists, requires prior specificpermission and/or a fee.Co-NEXT’12, December 10-13, 2012, Nice, France.Copyright 2012 ACM 978-1-4503-1775-7/12/12 ...$15.00.
KeywordsTest Packet Generation, Data Plane Analysis, Network Trou-bleshooting
1. INTRODUCTION
“Only strong trees stand the test of a storm.” —Chinese idiom
It is notoriously hard to debug networks. Every day net-work engineers wrestle with router misconfigurations, fibercuts, faulty interfaces, mis-labeled cables, software bugs,intermittent links and a myriad other reasons that causenetworks to misbehave, or fail completely. Network engi-neers hunt down bugs using the most rudimentary tools (e.g.ping, traceroute, SNMP, and tcpdump), and track downroot causes using a combination of accrued wisdom and in-tuition. Debugging networks is only becoming harder asnetworks are getting bigger (modern data centers may con-tain 10,000 switches, a campus network may serve 50,000users, a 100Gb/s long haul link may carry 100,000 flows),and are getting more complicated (with over 6,000 RFCs,router software is based on millions of lines of source code,and network chips often contain billions of gates). Smallwonder that network engineers have been labeled “mastersof complexity” [28]. Consider two examples:
Example 1. Suppose a router with a faulty line cardstarts dropping packets silently. Alice, who administers 100routers, receives a ticket from several frustrated users com-plaining about connectivity. First, Alice examines each routerto see if the configuration was changed recently, and con-cludes that the configuration was untouched. Next, Aliceuses her knowledge of the topology to triangulate the faultydevice with ping and traceroute. Finally, she calls a col-league to replace the line card.
Example 2. Suppose that video traffic is mapped to aspecific queue in a router, but packets are dropped becausethe token bucket rate is too low. It is not at all clear howAlice can track down such a performance fault using ping
and traceroute.Troubleshooting a network is difficult for three reasons.
First, the forwarding state is distributed across multiplerouters and firewalls and is defined by their forwarding ta-bles, filter rules and other configuration parameters. Second,the forwarding state is hard to observe, because it typicallyrequires manually logging into every box in the network.Third, there are many different programs, protocols and hu-mans updating the forwarding state simultaneously. When
Policy “Group X can
talk to Group Y”
Control Plane
Data plane
A
B
C
Topology Forwarding
Table L
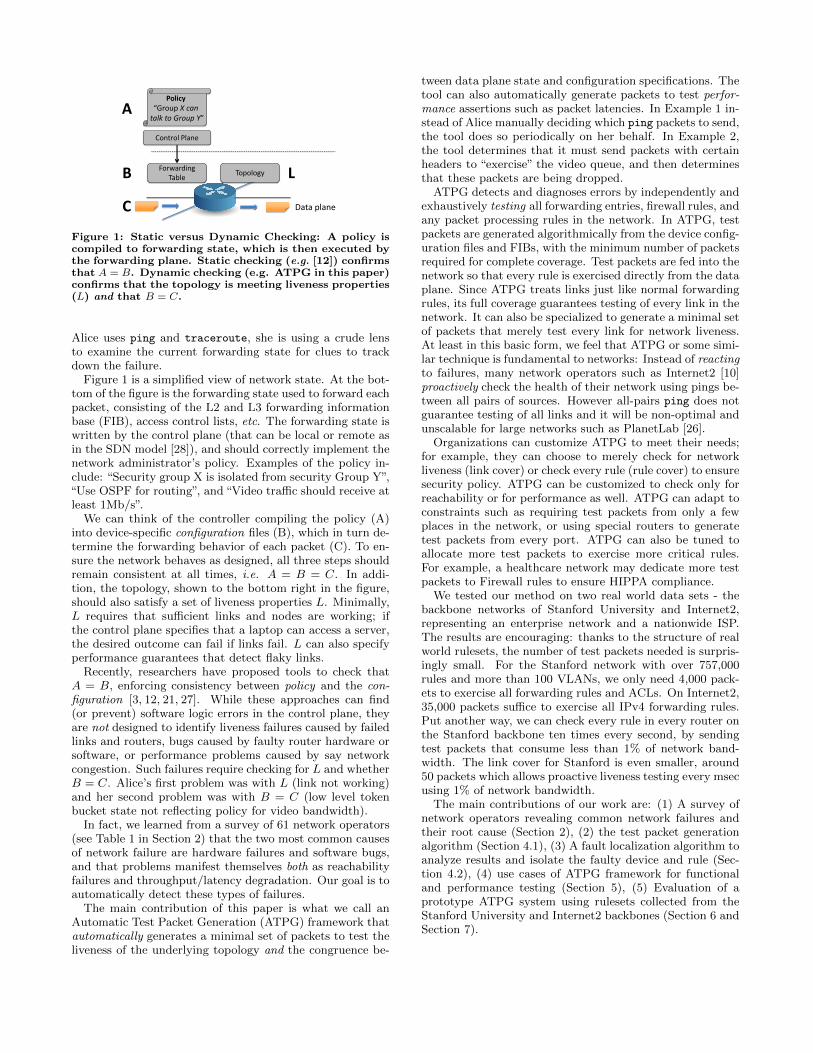
Figure 1: Static versus Dynamic Checking: A policy iscompiled to forwarding state, which is then executed bythe forwarding plane. Static checking (e.g. [12]) confirmsthat A = B. Dynamic checking (e.g. ATPG in this paper)confirms that the topology is meeting liveness properties(L) and that B = C.
Alice uses ping and traceroute, she is using a crude lensto examine the current forwarding state for clues to trackdown the failure.
Figure 1 is a simplified view of network state. At the bot-tom of the figure is the forwarding state used to forward eachpacket, consisting of the L2 and L3 forwarding informationbase (FIB), access control lists, etc. The forwarding state iswritten by the control plane (that can be local or remote asin the SDN model [28]), and should correctly implement thenetwork administrator’s policy. Examples of the policy in-clude: “Security group X is isolated from security Group Y”,“Use OSPF for routing”, and “Video traffic should receive atleast 1Mb/s”.
We can think of the controller compiling the policy (A)into device-specific configuration files (B), which in turn de-termine the forwarding behavior of each packet (C). To en-sure the network behaves as designed, all three steps shouldremain consistent at all times, i.e. A = B = C. In addi-tion, the topology, shown to the bottom right in the figure,should also satisfy a set of liveness properties L. Minimally,L requires that sufficient links and nodes are working; ifthe control plane specifies that a laptop can access a server,the desired outcome can fail if links fail. L can also specifyperformance guarantees that detect flaky links.
Recently, researchers have proposed tools to check thatA = B, enforcing consistency between policy and the con-figuration [3, 12, 21, 27]. While these approaches can find(or prevent) software logic errors in the control plane, theyare not designed to identify liveness failures caused by failedlinks and routers, bugs caused by faulty router hardware orsoftware, or performance problems caused by say networkcongestion. Such failures require checking for L and whetherB = C. Alice’s first problem was with L (link not working)and her second problem was with B = C (low level tokenbucket state not reflecting policy for video bandwidth).
In fact, we learned from a survey of 61 network operators(see Table 1 in Section 2) that the two most common causesof network failure are hardware failures and software bugs,and that problems manifest themselves both as reachabilityfailures and throughput/latency degradation. Our goal is toautomatically detect these types of failures.
The main contribution of this paper is what we call anAutomatic Test Packet Generation (ATPG) framework thatautomatically generates a minimal set of packets to test theliveness of the underlying topology and the congruence be-
tween data plane state and configuration specifications. Thetool can also automatically generate packets to test perfor-mance assertions such as packet latencies. In Example 1 in-stead of Alice manually deciding which ping packets to send,the tool does so periodically on her behalf. In Example 2,the tool determines that it must send packets with certainheaders to “exercise” the video queue, and then determinesthat these packets are being dropped.
ATPG detects and diagnoses errors by independently andexhaustively testing all forwarding entries, firewall rules, andany packet processing rules in the network. In ATPG, testpackets are generated algorithmically from the device config-uration files and FIBs, with the minimum number of packetsrequired for complete coverage. Test packets are fed into thenetwork so that every rule is exercised directly from the dataplane. Since ATPG treats links just like normal forwardingrules, its full coverage guarantees testing of every link in thenetwork. It can also be specialized to generate a minimal setof packets that merely test every link for network liveness.At least in this basic form, we feel that ATPG or some simi-lar technique is fundamental to networks: Instead of reactingto failures, many network operators such as Internet2 [10]proactively check the health of their network using pings be-tween all pairs of sources. However all-pairs ping does notguarantee testing of all links and it will be non-optimal andunscalable for large networks such as PlanetLab [26].
Organizations can customize ATPG to meet their needs;for example, they can choose to merely check for networkliveness (link cover) or check every rule (rule cover) to ensuresecurity policy. ATPG can be customized to check only forreachability or for performance as well. ATPG can adapt toconstraints such as requiring test packets from only a fewplaces in the network, or using special routers to generatetest packets from every port. ATPG can also be tuned toallocate more test packets to exercise more critical rules.For example, a healthcare network may dedicate more testpackets to Firewall rules to ensure HIPPA compliance.
We tested our method on two real world data sets - thebackbone networks of Stanford University and Internet2,representing an enterprise network and a nationwide ISP.The results are encouraging: thanks to the structure of realworld rulesets, the number of test packets needed is surpris-ingly small. For the Stanford network with over 757,000rules and more than 100 VLANs, we only need 4,000 pack-ets to exercise all forwarding rules and ACLs. On Internet2,35,000 packets suffice to exercise all IPv4 forwarding rules.Put another way, we can check every rule in every router onthe Stanford backbone ten times every second, by sendingtest packets that consume less than 1% of network band-width. The link cover for Stanford is even smaller, around50 packets which allows proactive liveness testing every msecusing 1% of network bandwidth.
The main contributions of our work are: (1) A survey ofnetwork operators revealing common network failures andtheir root cause (Section 2), (2) the test packet generationalgorithm (Section 4.1), (3) A fault localization algorithm toanalyze results and isolate the faulty device and rule (Sec-tion 4.2), (4) use cases of ATPG framework for functionaland performance testing (Section 5), (5) Evaluation of aprototype ATPG system using rulesets collected from theStanford University and Internet2 backbones (Section 6 andSection 7).

Category Avg % of ≥ 4Reachability Failure 3.67 56.90%Throughput/Latency 3.39 52.54%Intermittent Connectivity 3.38 53.45%Router CPU High Utilization 2.87 31.67%Congestion 2.65 28.07%Security Policy Violation 2.33 17.54%Forwarding Loop 1.89 10.71%Broadcast/Multicast Storm 1.83 9.62%
(a) Symptoms of network failure.Category Avg % of ≥ 4Switch/Router Software Bug 3.12 40.35%Hardware Failure 3.07 41.07%External 3.06 42.37%Attack 2.67 29.82%ACL Misconfig. 2.44 20.00%Software Upgrade 2.35 18.52%Protocol Misconfiguration 2.29 23.64%Unknown 2.25 17.65%Host Network Stack Bug 1.98 16.00%QoS/TE Misconfig. 1.70 7.41%
(b) Causes of network failure.
Table 1: Ranking of symptoms and causes reported byadministrators (5=most often, 1=least often). The rightcolumn shows the percentage who reported ≥ 4.
<10 20.0%
10-50 35.0%
50-100 10.0%
>100 35.0%
(a)
<5min 3.5%
5-30min 40.4% 30min - 1h
31.6%
1-5h 22.8%
>5h 1.8%
(b)
Figure 2: Reported number of network related ticketsgenerated per month (a) and time to resolve a ticket(b).
2. CURRENT PRACTICETo understand the problems network engineers encounter,
and how they currently troubleshoot them, we invited sub-scribers to the NANOG2 mailing list to complete a surveyin May-June 2012. Of the 61 who responded, 12 administersmall networks (<1k hosts), 23 medium networks (1k-10khosts), 11 large networks (10k-100k hosts) and 12 very largenetworks (>100k hosts). All responses (anonymized) are re-ported in [29], and are summarized in Table 1. The mostrelevant findings are:
Symptoms: Of the six most common symptoms, fourcannot be detected by static checks of the type A = B(throughput/latency, intermittent connectivity, router CPUutilization, congestion) and require ATPG-like dynamic test-ing. Even the remaining two failures (reachability failureand security Policy Violation) may require dynamic testingto detect forwarding plane failures.
Causes: The two most common symptoms (switch androuter software bugs and hardware failure) are best foundby dynamic testing.
Cost of troubleshooting: Two metrics capture the costof network debugging - the number of network-related tickets
2North American Network Operators’ Group.
Category Avg % of ≥ 4ping 4.50 86.67%traceroute 4.18 80.00%SNMP 3.83 60.10%Configuration Version Control 2.96 37.50%netperf/iperf 2.35 17.31%sFlow/NetFlow 2.60 26.92%
Table 2: Tools used by network administrators (5=mostoften, 1=least often).
per month and the average time consumed to resolve a ticket(Figure 2). 35% of networks generate more than 100 ticketsper month. 40.4% of respondents estimate it takes under 30minutes to resolve a ticket. But 24.6% report that it takesover an hour on average.
Tools: Table 2 shows that ping, traceroute and SNMPare by far the most popular tools. When asked what theideal tool for network debugging would be, 70.7% reporteda desire for automatic test generation to check performanceand correctness. Some added a desire for “long running teststo detect jitter or intermittent issues”, “real-time link capac-ity monitoring”, and “monitoring tools for network state”.
In summary, while our survey is small, it supports the hy-pothesis that network administrators face complicated symp-toms and causes; the cost of debugging is nontrivial, due tothe frequency of problems and the time to solve these prob-lems; classical tools such as ping and traceroute are stillheavily used, but administrators desire more sophisticatedtools.
3. NETWORK MODELATPG uses the header space framework — a geometric
model of how packets are processed we described in [12](and used in [27]). In header space, protocol-specific mean-ings associated with headers are ignored: a header is viewedas a flat sequence of ones and zeros. A header is a point(and a flow is a region) in the {0, 1}L space, where L isan upper bound on header length. By using the headerspace framework, we obtain a unified, vendor-independentand protocol-agnostic model of the network3 that simplifiesthe packet generation process significantly.
3.1 DefinitionsThe definitions in this network model are summarized in
Figure 3.Packets: A packet is defined by a (port, header) tuple,
where the port denotes a packet’s position in the networkat any time instant (each physical port in the network isassigned a unique number).
Switch: A switch transfer function, T , models a networkdevice, such as a switch or router. Each network devicecontains a set of forwarding rules (e.g., the forwarding ta-ble) that determine how packets are processed. An arriv-ing packet is associated with exactly one rule by matchingit against each rule in descending order of priority, and isdropped if none match.
Rules: A rule generates a list of one or more outputpackets, corresponding to the output port(s) the packet issent to; and defines how packet fields are modified. The rule
3We have written vendor and protocol-specific parsers totranslate configuration files into header space representa-tions.
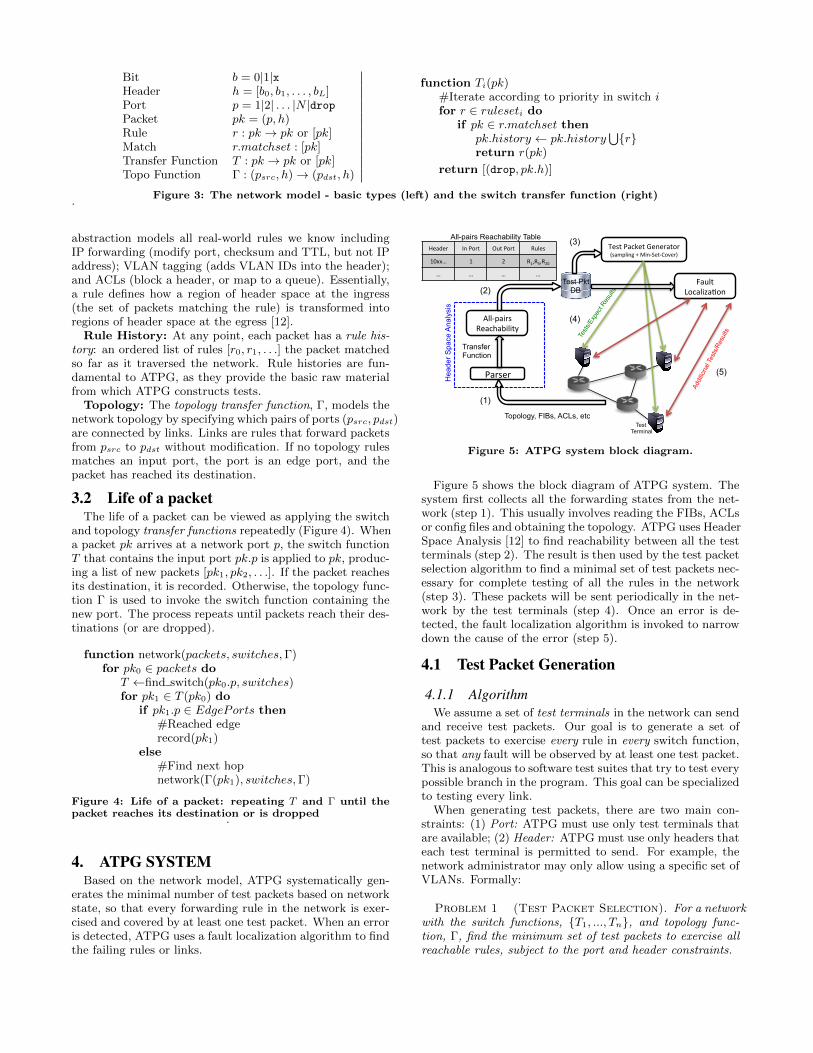
Bit b = 0|1|xHeader h = [b0, b1, . . . , bL]Port p = 1|2| . . . |N |dropPacket pk = (p, h)Rule r : pk → pk or [pk]Match r.matchset : [pk]Transfer Function T : pk → pk or [pk]Topo Function Γ : (psrc, h)→ (pdst, h)
function Ti(pk)#Iterate according to priority in switch ifor r ∈ ruleseti do
if pk ∈ r.matchset thenpk.history ← pk.history
⋃{r}
return r(pk)
return [(drop, pk.h)]
Figure 3: The network model - basic types (left) and the switch transfer function (right).
abstraction models all real-world rules we know includingIP forwarding (modify port, checksum and TTL, but not IPaddress); VLAN tagging (adds VLAN IDs into the header);and ACLs (block a header, or map to a queue). Essentially,a rule defines how a region of header space at the ingress(the set of packets matching the rule) is transformed intoregions of header space at the egress [12].
Rule History: At any point, each packet has a rule his-tory: an ordered list of rules [r0, r1, . . .] the packet matchedso far as it traversed the network. Rule histories are fun-damental to ATPG, as they provide the basic raw materialfrom which ATPG constructs tests.
Topology: The topology transfer function, Γ, models thenetwork topology by specifying which pairs of ports (psrc, pdst)are connected by links. Links are rules that forward packetsfrom psrc to pdst without modification. If no topology rulesmatches an input port, the port is an edge port, and thepacket has reached its destination.
3.2 Life of a packetThe life of a packet can be viewed as applying the switch
and topology transfer functions repeatedly (Figure 4). Whena packet pk arrives at a network port p, the switch functionT that contains the input port pk.p is applied to pk, produc-ing a list of new packets [pk1, pk2, . . .]. If the packet reachesits destination, it is recorded. Otherwise, the topology func-tion Γ is used to invoke the switch function containing thenew port. The process repeats until packets reach their des-tinations (or are dropped).
function network(packets, switches,Γ)for pk0 ∈ packets do
T ←find switch(pk0.p, switches)for pk1 ∈ T (pk0) do
if pk1.p ∈ EdgePorts then#Reached edgerecord(pk1)
else#Find next hopnetwork(Γ(pk1), switches,Γ)
Figure 4: Life of a packet: repeating T and Γ until thepacket reaches its destination or is dropped
.
4. ATPG SYSTEMBased on the network model, ATPG systematically gen-
erates the minimal number of test packets based on networkstate, so that every forwarding rule in the network is exer-cised and covered by at least one test packet. When an erroris detected, ATPG uses a fault localization algorithm to findthe failing rules or links.
Parser
Topology, FIBs, ACLs, etc
Transfer Function
All-‐pairs Reachability
Hea
der S
pace
Ana
lysi
s
Test Pkt DB
Header In Port Out Port Rules
10xx… 1 2 R1,R5,R20
… … … …
All-pairs Reachability Table Test Packet Generator (sampling + Min-‐Set-‐Cover)
Tests
/Exp
ect R
esult
s
Fault LocalizaOon
Addi
tiona
l Tes
ts/R
esul
ts
Test Terminal
(1)
(2)
(3)
(4)
(5)
Figure 5: ATPG system block diagram.
Figure 5 shows the block diagram of ATPG system. Thesystem first collects all the forwarding states from the net-work (step 1). This usually involves reading the FIBs, ACLsor config files and obtaining the topology. ATPG uses HeaderSpace Analysis [12] to find reachability between all the testterminals (step 2). The result is then used by the test packetselection algorithm to find a minimal set of test packets nec-essary for complete testing of all the rules in the network(step 3). These packets will be sent periodically in the net-work by the test terminals (step 4). Once an error is de-tected, the fault localization algorithm is invoked to narrowdown the cause of the error (step 5).
4.1 Test Packet Generation
4.1.1 AlgorithmWe assume a set of test terminals in the network can send
and receive test packets. Our goal is to generate a set oftest packets to exercise every rule in every switch function,so that any fault will be observed by at least one test packet.This is analogous to software test suites that try to test everypossible branch in the program. This goal can be specializedto testing every link.
When generating test packets, there are two main con-straints: (1) Port: ATPG must use only test terminals thatare available; (2) Header: ATPG must use only headers thateach test terminal is permitted to send. For example, thenetwork administrator may only allow using a specific set ofVLANs. Formally:
Problem 1 (Test Packet Selection). For a networkwith the switch functions, {T1, ..., Tn}, and topology func-tion, Γ, find the minimum set of test packets to exercise allreachable rules, subject to the port and header constraints.

We choose test packets using an algorithm we call TestPacket Selection (TPS) algorithm. TPS first finds all theequivalent classes between each pair of available ports. Anequivalent class is a set of packets that exercise the samecombination of rules. It then samples each class to find thetest packets, and finally compresses the resulting set of testpackets to find the minimum covering set.
Step 1: Generate an all-pairs reachability table.We start by determining the complete set of packet headersthat can be sent from each test terminal, to every other testterminal. For each packet header, we find the complete setof rules it exercises along the path. For this, we directlyapply the all-pairs reachability algorithm described in [12]:On every terminal port, we apply an all-x header (a headerwhich has all wildcarded bits) to the transfer function of thefirst hub boxes connected to test terminals. If there is aheader constraint, we apply it here. For example, if we canonly send traffic on VLAN A, then instead of starting withan all-x header, we set the VLAN tag bits to A. We followthe packet through the network using the network functionand record the rule history of each resulting packet usingpk.history. Once this is done for all pairs of terminal ports,we can generate an all-pairs reachability table as shown inTable 3. For each row, the header column is a wildcard ex-pression representing the equivalent class that can reach anegress test terminal from an ingress test terminal. Packetsmatching this header will follow the same set of switch rules,as shown in the right-hand column.
Header Ingress Port Egress Port Rule Historyh1 p11 p12 [r11, r12, . . .]h2 p21 p22 [r21, r22, . . .]... ... ... ...hn pn1 pn2 [rn1, rn2, . . .]
Table 3: All-pairs reachability table: all possible headersfrom every terminal to every other terminal, along withthe rules they exercise.
Figure 6 shows a simple example network and Table 4 isthe corresponding all-pairs reachability table. For example,if we inject all-x test packets at PA, they will pass throughbox A. It forwards packets with dst ip = 10.0/16 to Band those with dst ip = 10.1/16 to C. Box B then for-wards dst ip = 10.0/16, tcp = 80 to PB and box C forwardsdst ip = 10.1/16 to PC . These are reflected in the first tworows of Table 4.
Step 2: Sampling. Next, we need to pick at least onetest packet to exercise every (reachable) rule. In fact, bypicking one packet in an equivalence class, we can test all ofthe rules reached by the class. The simplest scheme is to ran-domly pick one packet per class. This scheme only catchesfaults for which all packets covered by the same rule willexperience the same fault (e.g. a link failure). At the otherextreme, if we want to catch a fault for a specific headerwithin a equivalence class, then we need to test every headerin that class. We discuss these issues, and our fault model,in Section 4.2.
Step 3: Compression. Several of the test packets pickedin Step 2 exercise the same rule. We therefore find theminimum subset of the test packets for which the unionof their rule histories covers all rules in the network. Thecover can be changed to cover all links (for liveness only)or all router queues (for performance only). This is the
rA1: dst_ip=10.0/16 → Port 0 rA2: dst_ip=10.1/16 → Port 1 rA3: dst_ip=10.2/16 → Port 2
rB1: dst_ip=10.2/16 → Port 2 rB2: dst_ip=10.1/16 → Port 1 rB3: dst_ip=10.0/16 → rB4
rB4: tcp=80 → Port 0
PA
0
1
2
PB
PC
0
1
2
0
1
2
rC1: in_port=1 → Port 0,2 rC2: in_port=0,2 → Port 1
A B
C
Figure 6: Example topology with three network devices.
classical Min-Set-Cover problem. While NP-Complete, agreedy O(N2) algorithm provides a very good approxima-tion, where N is the number of test packets. We call theresulting (approximately) minimum set of packets, the reg-ular test packets. The remaining test packets not picked forthe min set are called the reserved test packets. In Table 4,{p1, p2, p3, p4, p5} are regular test packets and {p6} is a re-served test packet. Reserved test packets are useful for faultlocalization (Section 4.2).
4.1.2 PropertiesTPS algorithm has the following useful properties:
Property 1 (Maximum Coverage). The set of testpackets exercise all reachable rules, given the port and headerconstraints.
Proof Sketch: We define a rule to be reachable if it canbe exercised by at least one packet satisfying the header con-straint, and can be received by one of the test terminals. Ifa rule is reachable, it will be in the all-pairs reachability ta-ble, and set cover will pick at least one packet that exercisesthat rule.
Some rules are not reachable. One rule can obscure an-other: for example one IP address prefix might be obscuredby a set of more specific prefixes. Sometimes these are de-liberate (to provide backup when a higher priority rule failsor is removed); sometimes they are due to misconfiguration.
Property 2 (Completeness). For a given set of portand header constraints, the pre-sampled set of test packetsselected by TPS represents all possible tests giving completecoverage with minimum test packets.
Property 3 (Polynomial Runtime). The complexityof finding test packets is O(TDR2) where T is the numberof test terminals, D is the network diameter, and R is thetypical number of rules in each box.
Proof Sketch: As explained in [12], the complexity offinding reachability from one input port to every port in thenetwork is O(DR2). We repeat this process once per testterminal.
4.2 Fault LocalizationATPG picks and periodically sends a set of test packets.
If test packets fail we also need to pinpoint the fault(s) thatcaused the problem.

Header Ingress Port Egress Port Rule Historyp1 dst_ip=10.0/16, tcp=80 PA PB rA1, rB3, rB4, link ABp2 dst_ip=10.1/16 PA PC rA2, rC2, link ACp3 dst_ip=10.2/16 PB PA rB2, rA3, link ABp4 dst_ip=10.1/16 PB PC rB2, rC2, link BCp5 dst_ip=10.2/16 PC PA rC1, rA3, link BC
(p6) dst_ip=10.2/16, tcp=80 PC PB rC1, rB3, rB4, link BC
Table 4: Test packets for the example network depicted in Figure 6. p6 is stored as a reserved packet.
4.2.1 Fault modelA rule fails if its observed behavior is different from what
we expected. We keep track of where rules fail using a resultfunction R. For a particular rule, r, the result function isdefined as
R(r, pk) =
{0 if pk fails at rule r
1 if pk succeeds at rule r
“Success” and “failure” depend on the nature of the rule:A failed forwarding rule means a test packet is not deliveredto its intended output port, whereas a drop rule behavescorrectly when packets are dropped. Similarly, a link failureis a forwarding rule failure in the topology function, and ifan output link is congested, it will be captured by increasedtravel time of a packet.
If we consider all the packets matching a rule, we candivide faults into two categories: action faults and matchfaults. An action fault is when every packet matching therule is processed the wrong way. Examples of action faultsinclude unexpected packet loss, a missing rule, congestion,and mis-wiring. On the other hand, match faults are harderto find because they only affect some of the packets matchingthe rule, for example when a rule matches a header that itshould not match, or a rule misses a header that it shouldmatch. If we want to catch match faults we must samplecarefully, and at least one test packet must exercise eachfaulty region. For example, if a TCAM bit is supposed tobe x, but is “stuck at 1”, then all packets with a 0 at thatlocation will be ignored. To catch the error, we need atleast two packets to exercise the bit: one with 1 and theother with 0.
We will only consider action faults, because they cover alarge number of likely failure conditions, and will be detectedby only one test packet per rule. We leave match faults forfuture work.
We usually can only observe a packet at the edge of thenetwork, and cannot observe it after it has been processedby every rule. Therefore, we define an end-to-end version ofthe result function
R(pk) =
{0 if pk fails
1 if pk succeeds
4.2.2 AlgorithmOur algorithm for pinpointing faulty rules assumes that a
test packet will succeed only if it succeeds at every hop. Forintuition, consider ping - a ping will succeed only when allthe forwarding rules along the path behave correctly. Simi-larly, if a queue is congested, any packets that travel throughit will incur higher latency and may fail an end-to-end test.Formally:
Assumption 1 (Fault propagation). R(pk) = 1 ifand only if ∀r ∈ pk.history, R(r, pk) = 1
To pinpoint a faulty rule, we start by finding the minimumset of potentially faulty rules. Formally:
Problem 2 (Fault Localization). Given a list of (pk0,R(pk0), (pk1,R(pk1), . . . tuples, find all r that satisfies ∃pki,R(pki, r) = 0.
We solve this problem opportunistically and in steps.Step 1: Consider the results from our regular test pack-
ets. For every passing test, place all the rules they exerciseinto the set of passing rules, P . If we similarly define allrules traversed by failing test packets F , then one or moreof the rules in F are in error. Therefore F − P is a set ofsuspect rules.Step 2: We want to make the set of suspect rules as small
as possible by weeding out all the correctly working rules.For this we make use of the reserved packets (which werethe packets eliminated by the Min-Set-Cover). From thereserved packets, we find those whose rule history containsexactly one rule from the suspect set and send them. If thetest packet fails, it shows that the exercised rule is for sure inerror. If it passes, we can remove that rule from the suspectset. We then repeat the same process for the rest of thesuspect set.
Step 3: In most cases we have a small enough suspectset that we can stop here and report them all. However,we can further narrow down the suspect set by sending testpackets that exercise two or more of the rules in the suspectset using Step 2’s technique. If these test packets pass, itshows that none of the exercised rules are in error and we canremove them from the suspect set. If our Fault Propagationassumption holds, the method will not miss any faults, andtherefore will have no false negatives.False positives: The localization method may introduce
false positives, which are left in the suspect set at the endof Step 3. Specifically, one or more rules in the suspect setmay in fact behave correctly.
When two rules are in series and there is no other pathto exercise only one of them, they are indistinguishable; anypacket that exercises one of them will also exercise the other.Hence if only one rule fails, we cannot tell which. This canhappen when, for example, an ACL rule is followed immedi-ately by a forwarding rule, both matching the same header.Indistinguishable rules can be reduced by adding more testterminals. In the extreme, imagine that if we have test ter-minals before and after each rule, with sufficient test pack-ets, we can distinguish every rule. Hence, the deploymentof test terminals not only affects test coverage, but also theaccuracy with which we can pinpoint the fault.
5. USE CASESWe can use ATPG for both functional and performance
testing, including the cases we list below.

R1
R4
R3
R2
header=A → Drop
Header: all-x Header: A
Header: A
Header: A
Header:
Header: A \ C
A \ Bheader=B → Fwd
header=C → Fwd
Figure 7: Generate packets to test drop rules: “flip” therule to a broadcast rule in the analysis.
5.1 Functional testingWe can test the functional correctness of a network by
testing that every reachable forwarding and drop rule in thenetwork is behaving correctly:
Forward rule: A forwarding rule is behaving correctlyif a test packet exercises the rule, and leaves on the correctport with the correct header.
Link rule: A link rule is a special case of a forwardingrule. It can be tested by making sure a test packet passescorrectly over the link without header modifications.
Drop rule: Testing drop rules is harder because we areverifying the absence of received test packets. We need toknow which test packets might reach an egress test terminalif a drop rule was to fail. To find these packets, in theall-pairs reachability analysis we “flip” each drop rule to abroadcast rule in the transfer functions. We do not actuallychange rules in the switches - we simply emulate the failureto identify all the ways a packet could reach the egress testterminals if the drop rule was to fail.
As an example consider Figure 7. To test the drop rule inR2, we inject the all-x test packet at Terminal 1. If the droprule was instead a broadcast rule it would forward the packetto all of its output ports, and the test packets would reachTerminals 2 and 3. Now we sample the resulting equivalentclasses as usual: we pick one sample test packet from A∩Band one from A ∩C. Note that we have to test both A ∩Band A ∩ C because the drop rule may have failed at R2,resulting an unexpected packet to be received at either testterminal 2 (A ∩ C) or test terminal 3 (A ∩B).
Finally, we send and expect the test packets not to appear,since their arrival would indicate a failure of R2’s drop rule.
5.2 Performance testingWe can use ATPG to monitor the performance of links,
queues and QoS classes in the network, and even monitorSLAs.
Congestion: If a queue is congested, packets will expe-rience longer queueing delays. This can be considered as a(performance) fault. ATPG lets us generate one way con-gestion tests to measure the latency between every pair oftest terminals; once the latency passed a threshold, faultlocalization will pinpoint the congested queue, as with reg-ular faults. With appropriate headers, we can test links orqueues as in Alice’s second problem.
Available bandwidth: Similarly, we can measure theavailable bandwidth of a link, or for a particular service
class. ATPG will generate the test packet headers we needto test every link, or every queue, or every service class;we then send a stream of packets with these headers tomeasure the bandwidth. We can use destructive tests, likeiperf/netperf, or more gentle approaches like packet pairsand packet trains [15]. If we know the available bandwidthof a particular service class should not fall below a certainthreshold, when it happens we can use the fault localiza-tion algorithm to triangulate and pinpoint the problematicswitch/queue.
Strict priorities: Likewise, we can determine if twoqueues, or service classes, are in different strict priority classes.If they are, then packets sent in the lower priority classshould never affect the available bandwidth or latency ofpackets in the higher priority class. We can verify the rel-ative priority by generating packet headers to congest thelower class, and verify that the latency and available band-width of the higher class is unchanged. If it is, we use faultlocalization to pinpoint the problem switch/queue.
6. IMPLEMENTATIONWe implemented a prototype system to automatically parse
router configurations and generate a set of test packets forthe network. The code is publicly available [1].
6.1 Test packet generatorThe test packet generator, written in Python, contains a
Cisco IOS configuration parser and a Juniper Junos parser.The data plane information, including router configurations,FIBs, MAC learning tables, and network topologies, is col-lected and parsed through the command line interface (CiscoIOS) or XML files (Junos). The generator then uses the Has-sel [9] header space analysis library to construct switch andtopology functions.
All-pairs reachability is computed using the multiprocessparallel-processing module shipped with Python. Each pro-cess considers a subset of the test ports, and finds all thereachable ports from each one. After reachability tests arecomplete, results are collected and the master process ex-ecutes the Min-Set-Cover algorithm. Test packets and theset of tested rules are stored in a SQLite database.
6.2 Network monitorThe network monitor assumes there are special test agents
in the network that are able to send/receive test packets.The network monitor reads the database and constructs testpackets, and instructs each agent to send the appropriatepackets. Currently, test agents separate test packets by IPProto field and TCP/UDP port number, but other fields,such as IP option, can also be used. If some of the testsfail, the monitor selects additional test packets from reservedpackets to pinpoint the problem. The process repeats untilthe fault has been identified. The monitor uses JSON tocommunicate with the test agents, and uses SQLite’s stringmatching to lookup test packets efficiently.
6.3 Alternate implementationsOur prototype was designed to be minimally invasive, re-
quiring no changes to the network except to add terminalsat the edge. In networks requiring faster diagnosis, the fol-lowing extensions are possible:
Cooperative routers: A new feature could be addedto switches/routers, so that a central ATPG system can in-
struct a router to send/receive test packets. In fact, formanufacturing testing purposes, it is likely that almost ev-ery commercial switch/router can already do this; we justneed an open interface to control them.
SDN-based testing: In a software defined network (SDN)such as OpenFlow [23], the controller could directly instructthe switch to send test packets, and to detect and forwardreceived test packets to the control plane. For performancetesting, test packets need to be time-stamped at the routers.
7. EVALUATION
7.1 Data Sets: Stanford and Internet2We evaluated our prototype system on two sets of net-
work configurations: the Stanford University backbone andthe Internet2 backbone, representing a mid-size enterprisenetwork and a nationwide backbone network respectively.
Stanford Backbone: With a population of over 15,000students, 2,000 faculty, and five /16 IPv4 subnets, Stanfordrepresents a large enterprise network. There are 14 opera-tional zone (OZ) Cisco routers connected via 10 Ethernetswitches to 2 backbone Cisco routers that in turn connectStanford to the outside world. Overall, the network hasmore than 757,000 forwarding entries and 1,500 ACL rules.Data plane configurations are collected through commandline interfaces. Stanford has made the entire configurationrule set public [1].
Internet2: Internet2 is a nationwide backbone networkwith 9 Juniper T1600 routers and 100 Gb/s interfaces, sup-porting over 66,000 institutions in United States. Thereare about 100,000 IPv4 forwarding rules. All Internet2 con-figurations and FIBs of the core routers are publicly avail-able [10], with the exception of ACL rules, which are re-moved for security concerns. Although IPv6 and MPLS en-tries are also available, we only use IPv4 rules in this paper.
7.2 Test Packet GenerationWe ran our ATPG tool on a quad core Intel Core i7 CPU
3.2GHz and 6GB memory, using 8 threads. For a given num-ber of test terminals, we generated the minimum set of testpackets needed to test all the reachable rules in the Stanfordand Internet2 backbones. Table 5 shows the number of testpackets we need to send. For example, the first row tells usthat if we attach test terminals to 10% of the ports, thenwe can test all of the reachable rules (22.2% of the total)by sending 725 test packets. If every edge port can act as atest terminal, then we can test 100% of the rules by send-ing just 3,871 test packets. The “Time” row indicates howlong it takes for our ATPG algorithm to run and tells us thetest packets we need to send — the worst case took aboutan hour (most of the time is spent calculating the all-pairsreachability).
To put these results into perspective, each test for theStanford backbone requires sending about 907 packets perport in the worst case. If these packets were sent over a single1Gb/s link we could test the entire network in less than 1ms(assuming each test packet is 100bytes, not considering thepropagation delay). Put another way, if we test the entireset of forwarding rules ten times every second, we would useless than 1% of the link bandwidth!
Similarly, we can test all the forwarding rules in Internet2by sending 4,557 test packets per port in the worst case.
Even if the test packets were sent over 10Gb/s links, wecould test the entire forwarding rules in less than 0.5ms,or ten times every second using less than 1% of the linkbandwidth.
We also found that for 100% link coverage (instead of rulecoverage), we only need 54 packets for Stanford, and 20 forInternet2.
The table also shows the large benefit gained by compress-ing the number of test packets — in most cases, the totalnumber of test packets is reduced by a factor of 20-100 usingthe minimum set cover algorithm.
Coverage is the ratio of the number of rules exercised tothe total number of reachable rules. Our results shows thatthe coverage grows linearly with the number of test termi-nals available. While it is possible to carefully select theplacement of test terminals to achieve higher coverage, wefind that the benefit is marginal with real data sets.
Rule structure: The reason we need so few test packetsis because of the structure of the rules and the routing. Mostrules are part of an end-to-end route, and so multiple routershold the same rule. Similarly, multiple devices contain thesame ACL or QoS configuration because they are part ofa network wide policy. Therefore the number of distinctregions of header space grow linearly, not exponentially, withthe diameter of the network.
0.2 0.3 0.4 0.5 0.6 0.7 0.8 0.9
1
2 4 6 8 10 12 14 16
CD
F
Recurrence
Stanford
0 0.1 0.2 0.3 0.4 0.5 0.6 0.7 0.8 0.9
1
1 2 3 4 5 6 7 8 9
CD
F
Recurrence
Internet2
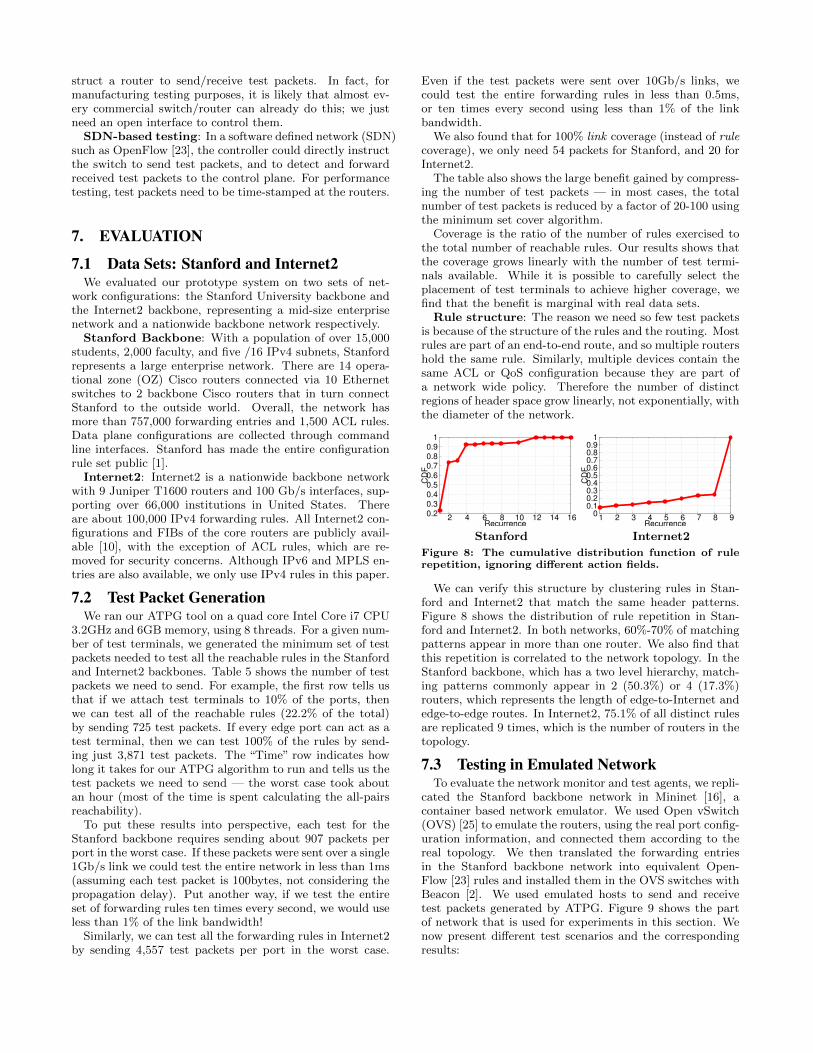
Figure 8: The cumulative distribution function of rulerepetition, ignoring different action fields.
We can verify this structure by clustering rules in Stan-ford and Internet2 that match the same header patterns.Figure 8 shows the distribution of rule repetition in Stan-ford and Internet2. In both networks, 60%-70% of matchingpatterns appear in more than one router. We also find thatthis repetition is correlated to the network topology. In theStanford backbone, which has a two level hierarchy, match-ing patterns commonly appear in 2 (50.3%) or 4 (17.3%)routers, which represents the length of edge-to-Internet andedge-to-edge routes. In Internet2, 75.1% of all distinct rulesare replicated 9 times, which is the number of routers in thetopology.
7.3 Testing in Emulated NetworkTo evaluate the network monitor and test agents, we repli-
cated the Stanford backbone network in Mininet [16], acontainer based network emulator. We used Open vSwitch(OVS) [25] to emulate the routers, using the real port config-uration information, and connected them according to thereal topology. We then translated the forwarding entriesin the Stanford backbone network into equivalent Open-Flow [23] rules and installed them in the OVS switches withBeacon [2]. We used emulated hosts to send and receivetest packets generated by ATPG. Figure 9 shows the partof network that is used for experiments in this section. Wenow present different test scenarios and the correspondingresults:

Stanford (298 ports) 10% 40% 70% 100% Edge (81%)Total Packets 10,042 104,236 413,158 621,402 438,686Regular Packets 725 2,613 3,627 3,871 3,319Packets/Port (Avg) 25.00 18.98 17.43 12.99 18.02Packets/Port (Max) 206 579 874 907 792Time to send (Max) 0.165ms 0.463ms 0.699ms 0.726ms 0.634msCoverage 22.2% 57.7% 81.4% 100% 78.5%Computation Time 152.53s 603.02s 2,363.67s 3,524.62s 2,807.01s
Internet2 (345 ports) 10% 40% 70% 100% Edge (92%)Total Packets 30,387 485,592 1,407,895 3,037,335 3,036,948Regular Packets 5,930 17,800 32,352 35,462 35,416Packets/Port (Avg) 159.0 129.0 134.2 102.8 102.7Packets/Port (Max) 2,550 3,421 2,445 4,557 3,492Time to send (Max) 0.204ms 0.274ms 0.196ms 0.365ms 0.279msCoverage 16.9% 51.4% 80.3% 100% 100%Computation Time 129.14s 582.28s 1,197.07s 2,173.79s 1,992.52s
Table 5: Test packet generation results for Stanford backbone (top) and Internet2 (bottom), against the number ofports selected for deploying test terminals. “Time to send” packets is calculated on a per port basis, assuming 100Bper test packet, 1Gbps link for Stanford and 10Gbps for Internet2.
s3 s5 s2
yoza
s4 s1
boza coza pozb poza roza goza
bbra goza-‐coza boza-‐poza boza-‐coza
Func5onal Tes5ng
Performance Tes5ng UDP Traffic Test Packets
11 12 13 14 15 16 17 18 19 20 21
0 10 20 30 40 50 60
Thro
ughp
ut (M
bps)
Time (s)
poza-yozaroza-yoza
0 50
100 150 200 250 300 350 400 450 500
0 10 20 30 40 50 60
Late
ncy
(ms)
Time (s)
pozb-rozapozb-yoza
Figure 9: A portion of the Stanford backbone networkshowing the test packets used for functional and perfor-mance testing examples in Section 7.3.
Forwarding Error: To emulate a functional error, wedeliberately created a fault by replacing the action of an IPforwarding rule in boza matching on dst ip = 172.20.10.32/27with a drop action (we called this rule Rboza
1 ). As a resultof this fault, test packets from boza to coza with dst ip =172.20.10.33 failed and were not received at coza. Table 6shows two other test packets we used to localize and pin-point the fault. These test packets shown in Figure 9 ingoza − coza and boza − poza are received correctly at theend terminals. From the rule history of the passing and fail-ing packets in Table 3, we deduce that only rule Rboza
1 couldpossibly have caused the problem, as all the other rules ap-pear in the rule history of a received test packet.
Congestion: We detect congestion by measuring the one-way latency of test packets. In our emulation environment,all terminals are synchronized to the host’s clock so the la-
tency can be calculated with a single time-stamp and one-way communication4.
To create congestion, we rate-limited all the links in theemulated Stanford network to 30Mb/s, and create two 20Mb/sUDP flows: poza to yoza at t = 0 and roza to yoza att = 30s, which will congest the link bbra− yoza starting att = 30s. The bottom left graph next to yoza in Figure 9shows the two UDP flows. The queue inside the routerswill build up and test packets will experience longer queu-ing delay. The bottom right graph next to pozb shows thelatency experienced by two test packets, one from pozb toroza and the other one from pozb to yoza. At t = 30s, thebozb − yoza test packet experience a much higher latency,correctly signaling congestion. Since these two test packetsshare the bozb−s1 and s1−bbra links, we can conclude thatthe congestion is not happening in these two links, thereforewe can correctly infer that bbra−yoza is the congested link.
Available Bandwidth: ATPG can also be used to mon-itor available bandwidth. For this experiment, we usedPathload [11], a bandwidth probing tool based on packetpairs/packet trains. We repeated the previous experiment,but decreased the two UDP flows to 10Mb/s, so that the bot-tleneck available bandwidth was 10Mb/s. Pathload reportsthat bozb−yoza has an available bandwidth5 of 11.715Mb/s,bozb−roza has an available bandwidth of 19.935Mb/s, whilethe other (idle) terminals report 30.60Mb/s. Using the sameargument as before, we automatically conclude that bbra−yoza link is the bottleneck link with 10Mb/s available band-width.
Priority: We created priority queues in OVS using Linux’shtb scheduler and tc utilities. We replicated the previously“failed”test case pozb−yoza for high and low priority queuesrespectively.6 Figure 10 shows the result.
We first repeated the congestion experiment. When thelow priority queue is congested (i.e. both UDP flows mappedto low priority queues), only low priority test packets are
4To measure latency in a real network, two-way communica-tion is usually necessary. However, relative change of latencyis sufficient to uncover congestion.5All numbers are the average of 10 repeated measurements.6The Stanford data set does not include the priority settings.
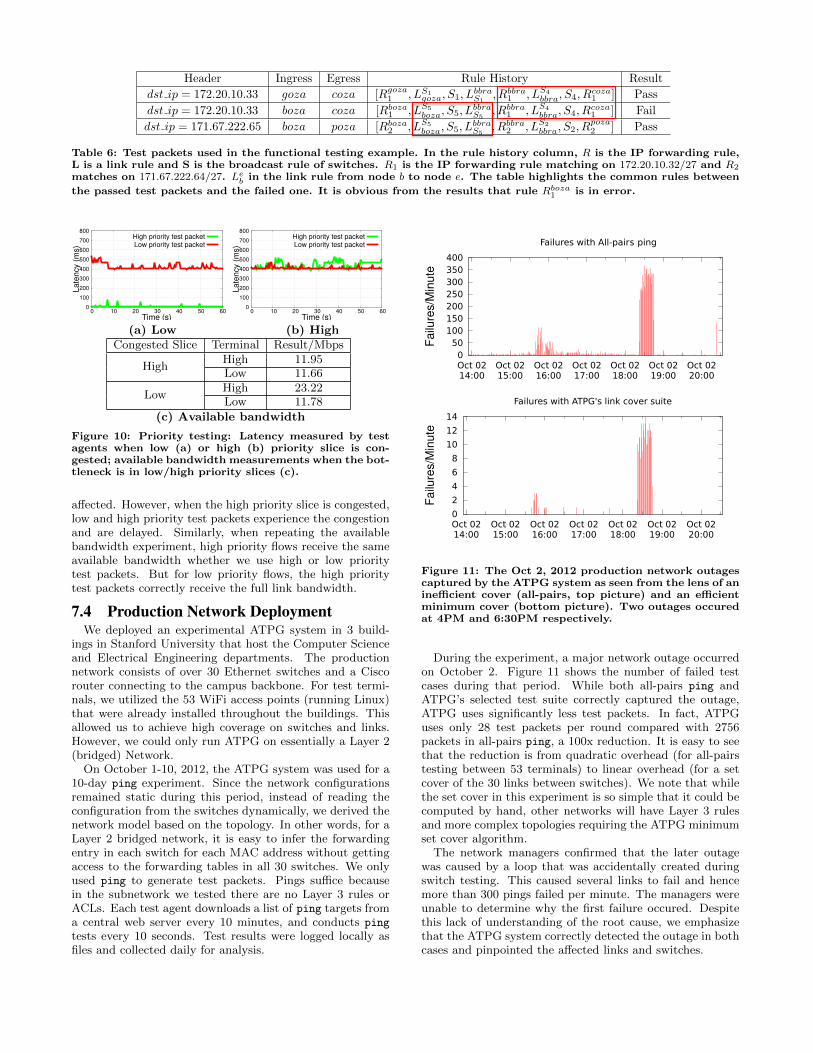
Table 6: Test packets used in the functional testing example. In the rule history column, R is the IP forwarding rule,L is a link rule and S is the broadcast rule of switches. R1 is the IP forwarding rule matching on 172.20.10.32/27 and R2
matches on 171.67.222.64/27. Leb in the link rule from node b to node e. The table highlights the common rules between
the passed test packets and the failed one. It is obvious from the results that rule Rboza1 is in error.
0
100
200
300
400
500
600
700
800
0 10 20 30 40 50 60
Late
ncy
(ms)
Time (s)
High priority test packetLow priority test packet
(a) Low
0
100
200
300
400
500
600
700
800
0 10 20 30 40 50 60
Late
ncy
(ms)
Time (s)
High priority test packetLow priority test packet
(b) HighCongested Slice Terminal Result/Mbps
HighHigh 11.95Low 11.66
LowHigh 23.22Low 11.78
(c) Available bandwidth
Figure 10: Priority testing: Latency measured by testagents when low (a) or high (b) priority slice is con-gested; available bandwidth measurements when the bot-tleneck is in low/high priority slices (c).
affected. However, when the high priority slice is congested,low and high priority test packets experience the congestionand are delayed. Similarly, when repeating the availablebandwidth experiment, high priority flows receive the sameavailable bandwidth whether we use high or low prioritytest packets. But for low priority flows, the high prioritytest packets correctly receive the full link bandwidth.
7.4 Production Network DeploymentWe deployed an experimental ATPG system in 3 build-
ings in Stanford University that host the Computer Scienceand Electrical Engineering departments. The productionnetwork consists of over 30 Ethernet switches and a Ciscorouter connecting to the campus backbone. For test termi-nals, we utilized the 53 WiFi access points (running Linux)that were already installed throughout the buildings. Thisallowed us to achieve high coverage on switches and links.However, we could only run ATPG on essentially a Layer 2(bridged) Network.
On October 1-10, 2012, the ATPG system was used for a10-day ping experiment. Since the network configurationsremained static during this period, instead of reading theconfiguration from the switches dynamically, we derived thenetwork model based on the topology. In other words, for aLayer 2 bridged network, it is easy to infer the forwardingentry in each switch for each MAC address without gettingaccess to the forwarding tables in all 30 switches. We onlyused ping to generate test packets. Pings suffice becausein the subnetwork we tested there are no Layer 3 rules orACLs. Each test agent downloads a list of ping targets froma central web server every 10 minutes, and conducts ping
tests every 10 seconds. Test results were logged locally asfiles and collected daily for analysis.
0 50
100 150 200 250 300 350 400
Oct 0214:00
Oct 0215:00
Oct 0216:00
Oct 0217:00
Oct 0218:00
Oct 0219:00
Oct 0220:00
Failu
res/
Min
ute
0
2
4
6
8
10
12
14
Oct 0214:00
Oct 0215:00
Oct 0216:00
Oct 0217:00
Oct 0218:00
Oct 0219:00
Oct 0220:00
Failu
res/
Min
ute
Failures with ATPG's link cover suite
Failures with All-pairs ping
Figure 11: The Oct 2, 2012 production network outagescaptured by the ATPG system as seen from the lens of aninefficient cover (all-pairs, top picture) and an efficientminimum cover (bottom picture). Two outages occuredat 4PM and 6:30PM respectively.
During the experiment, a major network outage occurredon October 2. Figure 11 shows the number of failed testcases during that period. While both all-pairs ping andATPG’s selected test suite correctly captured the outage,ATPG uses significantly less test packets. In fact, ATPGuses only 28 test packets per round compared with 2756packets in all-pairs ping, a 100x reduction. It is easy to seethat the reduction is from quadratic overhead (for all-pairstesting between 53 terminals) to linear overhead (for a setcover of the 30 links between switches). We note that whilethe set cover in this experiment is so simple that it could becomputed by hand, other networks will have Layer 3 rulesand more complex topologies requiring the ATPG minimumset cover algorithm.
The network managers confirmed that the later outagewas caused by a loop that was accidentally created duringswitch testing. This caused several links to fail and hencemore than 300 pings failed per minute. The managers wereunable to determine why the first failure occured. Despitethis lack of understanding of the root cause, we emphasizethat the ATPG system correctly detected the outage in bothcases and pinpointed the affected links and switches.
8. DISCUSSION
8.1 Overhead and PerformanceThe principal sources of overhead for ATPG are polling
the network periodically for forwarding state and perform-ing all-pairs reachability. While one can reduce overhead byrerunning the offline ATPG calculation less frequently, thisruns the risk of using out-of-date forwarding information.Instead, we reduce overhead in two ways. First, we have re-cently sped up the all-pairs reachability calculation using afast multithreaded/multi-machine header space library. Sec-ond, instead of extracting the complete network state everytime ATPG is triggered, an incremental state updater cansignificantly reduce both the retrieval time and the time tocalculate reachability. We are working on a real-time versionof ATPG system that incorporates both techniques.
Test agents within terminals incur minimal overhead be-cause they need to merely demultiplex test packets addressedto their IP address at a modest rate (say 1 per msec) com-pared to the link speeds most modern CPUs and operatingsystems are capable of receiving (1 Gbps or higher).
8.2 LimitationAs with all testing methodologies, ATPG has limitations:
1) Dynamic boxes: ATPG cannot model boxes whose in-ternal state can be changed by test packets. For example, aNAT that dynamically assigns TCP ports to outgoing pack-ets can confuse the online monitor as the same test packetcan give different results. 2) Non-deterministic boxes:Boxes can load-balance packets based on a hash functionof packet fields, usually combined with a random seed; thisis common in multipath routing such as ECMP. When thehash algorithm and parameters are unknown, ATPG can-not properly model such rules. However, if there are knownpacket patterns that can iterate through all possible out-puts, ATPG can generate packets to traverse every output.3) Invisible rules: A failed rule can make a backup ruleactive, and as a result no changes may be observed by thetest packets. This can happen when, despite a failure, atest packet is routed to the expected destination by otherrules. In addition, an error in a backup rule cannot be de-tected in normal operation. Another example is when twodrop rules appear in a row: the failure of one rule is unde-tectable since the effect will be masked by the other rule. 4)Transient network states: ATPG cannot uncover errorswhose lifetime is shorter than the time between each roundof tests. For example, congestion may disappear before anavailable bandwidth probing test concludes. Finer-grainedtest agents are needed to capture abnormalities of short du-ration. 5) Sampling: ATPG uses sampling when generat-ing test packets. As a result, ATPG can miss match faultssince the error is not uniform across all matching headers. Inthe worst case (when only one header is in error), exhaustivetesting is needed.
9. RELATED WORKWe are unaware of earlier techniques that automatically
generate test packets from configurations. The closest re-lated work we know of are offline tools that check invariantsof different components in networks. On the control plane,NICE [3] attempts to exhaustively cover the code paths sym-bolically in controller applications with the help of simplified
switch/host models. On the data plane, Anteater [21] mod-els invariants as boolean satisfiability problems and checksthem against configurations with a SAT solver. HeaderSpace Analysis [12] uses a geometric model to check reacha-bility, detect loops, and verify slicing. Recently, SOFT [14]is proposed to verify the consistency between different Open-Flow agent implementations that are responsible for bridg-ing control and data planes in the SDN context. ATPG com-plements these checkers by directly testing the data planeand covering a significant set of dynamic or performanceerrors that cannot be otherwise captured.
End-to-end probes have long been used in network diag-nosis. Duffield uses Binary Tomography [5, 6] to detect thesmallest set of failed links that explains end-to-end measure-ments. NetDiagnoser [4] further combines end-to-end probeswith routing data. Researchers also use various models tocorrelate network metrics with network events [13,19,20,22].Recently, mining low-quality, unstructured data, such asrouter configurations and network tickets has attracted in-terest [8, 17, 30]. By contrast, the primary contribution ofATPG is not fault localization, but determining a compactset of end-to-end measurements that can cover every link orevery rule. Further, ATPG is not limited to liveness testingbut can be applied to checking higher level properties suchas performance.
Many approaches to develop a measurement-friendly ar-chitecture are proposed for managing large networks [18,24,31]. It is also suggested that routers should be able to sam-ple the packets for measurement [7]. Our approach is com-plementary to these proposals: ATPG does not dictate thelocations of injecting network probes and how these probesshould be constructed. By incorporating input and portconstraints, ATPG can generate test packets and injectionpoints using existing deployment of measurement devices.
10. CONCLUSIONTesting liveness of a network is a fundamental problem
for ISPs and large data center operators. Sending probesbetween every pair of edge ports is neither exhaustive norscalable. It suffices to find a minimal set of end-to-end pack-ets that traverse each link. Doing this requires a way ofabstracting across device specific configuration files (e.g.,header space), generating headers and the links they reach(e.g., all-pairs reachability), and finally determining a min-imum set of test packets (Min-Set-Cover). Even the funda-mental problem of automatically generating test packets forefficient liveness testing requires techniques akin to ATPG.
ATPG goes much further than liveness testing, however,with the same framework. ATPG can test for reachabilitypolicy (by testing all rules including drop rules) and per-formance health (by associating performance measures suchas latency and loss with test packets). Our implementa-tion also augments testing with a simple fault localizationscheme also constructed using the header space framework.As in software testing, the formal model helps maximize testcoverage with minimum test packets. Our results show thatall forwarding rules in Stanford backbone or Internet2 canbe exercised by a surprisingly small number of test packets(<4,000 for Stanford, and <40,000 for Internet2).
Network managers today use primitive tools such as pingand traceroute. Our survey results indicate that they areeager for more sophisticated tools. Other fields of engi-neering indicate that these demands are not unreasonable:

for example, both the ASIC and software design industriesare buttressed by billion dollar tool businesses that supplytechniques for both static (e.g., design rules) and dynamic(e.g., timing) verification. We hope ATPG is a useful start-ing point for automated dynamic testing of production net-works.
11. ACKNOWLEDGEMENTWe would like to thank our shepherd, Dejan Kostic, and
the anonymous reviewers for their valuable comments. Wethank Johan van Reijendam, Charles M. Orgish, Joe Little(Stanford University) and Thomas C. Knoeller, MatthewP. Davy (Internet2) for providing router configuration setsand sharing their operation experience. This research wasfunded by NSF grants CNS-0832820, CNS-0855268, CNS-1040593, and Stanford Graduate Fellowship.
12. REFERENCES[1] ATPG code repository.
http://eastzone.github.com/atpg/.
[2] Beacon. http://www.beaconcontroller.net/.
[3] M. Canini, D. Venzano, P. Peresini, D. Kostic, andJ. Rexford. A NICE way to test openflow applications.Proceedings of the 9th conference on Symposium onNetworked Systems Design & Implementation, 2012.
[4] A. Dhamdhere, R. Teixeira, C. Dovrolis, and C. Diot.Netdiagnoser: troubleshooting network unreachabilitiesusing end-to-end probes and routing data. In Proceedings ofthe 2007 ACM CoNEXT conference, CoNEXT ’07, pages18:1–18:12, New York, NY, USA, 2007. ACM.
[5] N. Duffield. Network tomography of binary networkperformance characteristics. Information Theory, IEEETransactions on, 52(12):5373 –5388, dec. 2006.
[6] N. Duffield, F. Lo Presti, V. Paxson, and D. Towsley.Inferring link loss using striped unicast probes. InINFOCOM 2001. Twentieth Annual Joint Conference ofthe IEEE Computer and Communications Societies.Proceedings. IEEE, volume 2, pages 915 –923 vol.2, 2001.
[7] N. G. Duffield and M. Grossglauser. Trajectory samplingfor direct traffic observation. IEEE/ACM Trans. Netw.,9(3):280–292, June 2001.
[8] P. Gill, N. Jain, and N. Nagappan. Understanding networkfailures in data centers: measurement, analysis, andimplications. In Proceedings of the ACM SIGCOMM 2011conference, SIGCOMM ’11, pages 350–361, New York, NY,USA, 2011. ACM.
[9] Hassel, the header space library.https://bitbucket.org/peymank/hassel-public/.
[10] The Internet2 Observatory Data Collections.http://www.internet2.edu/observatory/archive/data-collections.html.
[11] M. Jain and C. Dovrolis. End-to-end available bandwidth:measurement methodology, dynamics, and relation with tcpthroughput. IEEE/ACM Trans. Netw., 11(4):537–549,Aug. 2003.
[12] P. Kazemian, G. Varghese, and N. McKeown. Header SpaceAnalysis: static checking for networks. Proceedings of the9th conference on Symposium on Networked SystemsDesign & Implementation, 2012.
[13] R. R. Kompella, J. Yates, A. Greenberg, and A. C. Snoeren.Ip fault localization via risk modeling. In Proceedings of the2nd conference on Symposium on Networked SystemsDesign & Implementation - Volume 2, NSDI’05, pages57–70, Berkeley, CA, USA, 2005. USENIX Association.
[14] M. Kuzniar, P. Peresini, M. Canini, D. Venzano, andD. Kostic. A SOFT way for openflow switchinteroperability testing. In Proceedings of the SeventhCOnference on emerging Networking EXperiments andTechnologies, CoNEXT ’12, 2012.
[15] K. Lai and M. Baker. Nettimer: a tool for measuringbottleneck link, bandwidth. In Proceedings of the 3rdconference on USENIX Symposium on InternetTechnologies and Systems - Volume 3, USITS’01, pages11–11, Berkeley, CA, USA, 2001. USENIX Association.
[16] B. Lantz, B. Heller, and N. McKeown. A network in alaptop: rapid prototyping for software-defined networks. InProceedings of the Ninth ACM SIGCOMM Workshop onHot Topics in Networks, Hotnets ’10, pages 19:1–19:6, NewYork, NY, USA, 2010. ACM.
[17] F. Le, S. Lee, T. Wong, H. S. Kim, and D. Newcomb.Detecting network-wide and router-specificmisconfigurations through data mining. IEEE/ACM Trans.Netw., 17(1):66–79, Feb. 2009.
[18] H. V. Madhyastha, T. Isdal, M. Piatek, C. Dixon,T. Anderson, A. Krishnamurthy, and A. Venkataramani.iplane: an information plane for distributed services. InProceedings of the 7th symposium on Operating systemsdesign and implementation, OSDI ’06, pages 367–380,Berkeley, CA, USA, 2006. USENIX Association.
[19] A. Mahimkar, Z. Ge, J. Wang, J. Yates, Y. Zhang,J. Emmons, B. Huntley, and M. Stockert. Rapid detectionof maintenance induced changes in service performance. InProceedings of the Eighth COnference on emergingNetworking EXperiments and Technologies, CoNEXT ’12,pages 13:1–13:12, New York, NY, USA, 2011. ACM.
[20] A. Mahimkar, J. Yates, Y. Zhang, A. Shaikh, J. Wang,Z. Ge, and C. T. Ee. Troubleshooting chronic conditions inlarge ip networks. In Proceedings of the 2008 ACMCoNEXT Conference, CoNEXT ’08, pages 2:1–2:12, NewYork, NY, USA, 2008. ACM.
[21] H. Mai, A. Khurshid, R. Agarwal, M. Caesar, P. B.Godfrey, and S. T. King. Debugging the data plane withanteater. SIGCOMM Comput. Commun. Rev.,41(4):290–301, Aug. 2011.
[22] A. Markopoulou, G. Iannaccone, S. Bhattacharyya, C.-N.Chuah, Y. Ganjali, and C. Diot. Characterization offailures in an operational ip backbone network. IEEE/ACMTrans. Netw., 16(4):749–762, Aug. 2008.
[23] N. McKeown, T. Anderson, H. Balakrishnan, G. Parulkar,L. Peterson, J. Rexford, S. Shenker, and J. Turner.OpenFlow: enabling innovation in campus networks.SIGCOMM Comput. Commun. Rev., 38:69–74, March2008.
[24] OnTimeMeasure. http://ontime.oar.net/.[25] Open vSwitch. http://openvswitch.org/.
[26] All-pairs ping service for PlanetLab ceased.http://lists.planet-lab.org/pipermail/users/2005-July/001518.html.
[27] M. Reitblatt, N. Foster, J. Rexford, C. Schlesinger, andD. Walker. Abstractions for network update. In Proceedingsof the ACM SIGCOMM 2012 conference, SIGCOMM ’12.ACM, 2012.
[28] S. Shenker. The future of networking, and the past ofprotocols.http://opennetsummit.org/talks/shenker-tue.pdf.
[29] Troubleshooting the Network Survey. http://eastzone.github.com/atpg/docs/NetDebugSurvey.pdf.
[30] D. Turner, K. Levchenko, A. C. Snoeren, and S. Savage.California fault lines: understanding the causes and impactof network failures. SIGCOMM Comput. Commun. Rev.,41(4):–, Aug. 2010.
[31] P. Yalagandula, P. Sharma, S. Banerjee, S. Basu, and S.-J.Lee. S3: a scalable sensing service for monitoring largenetworked systems. In Proceedings of the 2006 SIGCOMMworkshop on Internet network management, INM ’06,pages 71–76, New York, NY, USA, 2006. ACM.