automation, automated synthesis. part 4: batch-type ... · controlled bench-scale batch-type...
TRANSCRIPT

Journal of Automatic Chemistry of Clinical Laboratory Automation, Vol. 8, No. 3 (July-September 1986), pp. 106-121
Automated chemical synthesis. Part 4:Batch-type reactor automation and real-timesoftware design
Daniel F. Chodosh, Kenneth Kamholz, Sidney H.Levinson and Robert RhinesmithSmith Kline & French Laboratories, 1500 Spring Garden Street, Philadelphia,Pennsylvania 19101, USA
The ability to efficiently and comprehensively evaluatesynthetic routes at their earliest stage of development isespecially important in pharmaceutical process researchand development and chemical engineering laboratories[1 and 2]. The evaluation and optimization of typicallycomplex synthetic sequences (involving many reactionparameters) frequently entails bench-scale experimenta-tion of a highly repetitive, manpower-intensive nature.While systems for pilot and production scale batch-typereactor automation are widely [3-6] available mostbench-scale laboratory automation research has beenapplied to continuous-flow reactor schema [7-10]. Often,the first opportunity to design and test automationsoftware is at the pilot scale and, therefore, requires largequantities of developmental chemical materials forexperimentation. These pilot scale studies, undertaken atmore advanced stages of process development, have littleopportunity to affect the prerequisite process discoveryand process research effort. The application of auto-mation technology at earlier stages of the research anddevelopment programme would provide greater opportu-nities to guide synthetic route selection and optimization.Further, the automation models developed at this earlystage could be applied to the subsequent pilot andproduction scale laboratories. The authors’ researchfocuses on the design and construction of a computer-controlled bench-scale batch-type chemical reactor cap-able of self-directing experimentation, reaction optimiza-tion and extensive data acquisition [11-16].
An automated batch-type reactor apparatus must becapable of delivering precise amounts of chemicalreagents and solvents to a vessel, controlling the reactiontime and temperature, and performing on-line chemicalanalyses of the reaction solution. Costly reagents must beconserved; thus a basic design concern is the minimiza-tion of the vessel size. The precision and accuracy ofreagent/solvent delivery systems, temperature controlsystems and the chemical analysis system are, of course,of fundamental concern. Furthermore, to permit unat-tended operation fail-safe features involving hardwareand software self-checking and error trapping mustassure instrument integrity.
A functional block diagram of the automated chemicalsynthesis is presented in figure 1. Real-time control isprovided by a Digital Equipment Corporation (May-nard, Massachusetts, USA) MINC LSI 11/2 computer
system (see below). The MINC computer was selected inpart, for its interface modularity and ease of access tothese interfaces. The computer has been configured with2 x 16 bit digital (i.e. TTL) output, x 16 bit digitalinput, programmable clock, four-channel 12 bit D/A,four-channel 12 bit A/D and preamplifer (for resistance-to-voltage and current-to-voltage signal transduction)interfaces. The TTL signals available through the digitaloutput interfaces, while capable ofinterfacing to semicon-ductor logic, cannot directly couple to devices such asmotors or solenoids. A special optoisolator interface(figure’ 2) has been designed, which provides signaltranslation (TTL----> 120 VAC; TTL---> variable VDC)to permit facile coupling ofnon-TTL ON/OFF devices tothe computer system. The optoisolator interface providesfail-safe default signals to the synthesis apparatus, in theevent offailure ofeither the MINC computer hardware orthe failure of a software driven watch-dog timer. A fulldescription of this interface has been previously reported{17-18].
Temperature control
The temperature control system balances the effects ofresistive heating elements with the heat removed via aninternal glass coil fitted to the reactor vessel throughwhich coolant is circulated. The heating and coolingsystems respond quickly to computer control signals andhave sufficient capacities to effectively respond to thermalanomolies of chemical reactions (exotherms,endotherms). To minimize local heating effects, tworesistance heating elements are employed" the exterior ofthe vessel is coated with a thermal element (ACE Glass,Inc., INSTATHERM, Vineland, NewJersey, USA) thatprovides even heating over a large surface area (c. 40 Wover 440 mm9-) and an immersion heater fitted with agrooved stainless-steel sheath (Watlow, Inc., St. Louis,Minnesota, USA; 60 W over an effective surface area of104mm2). A proportionating heater control circuitallows dynamic control of the heater duty cycle via asingle D/A interface signal (figure 3). The cooling systemis fully automated with control provided for the flow ofcoolant through the internal vessel coils and for thetemperature of the cold bath reservoir (figure 4). Thesesystems and the automation schema we employ havebeen previously described 19].
Liquid trafficking system
To provide accurate and precise manipulation of liquidmaterials over a wide viscosity range, Hamilton DigitalDiluters (Hamilton, Inc., Reno, Nevada, USA) are used;
106

D. F. Chodosh et al. Automated chemical synthesis
SUBSYSTEM 8LOCK DIAGRAM
Figure 1. Functional block diagram ofsynthesis system.
TTL INPUTCPU
WATCHDOG TTL INPUTTIMER
uo"M’EC/( H,
() ,o
H/L SWITCH
Figure 2. Optoisolator interface.
HIr-- TTL HI
TTL lIL ILO TTL LO
HIVAC r"- 120 VAC
VAC
HIVDC F 0-28 VDC
VDC
the logic boards of the units have been completelyredesigned to allow direct control of syringe movementand valving via computer driven TTL signals. Each unitconsists of two independent syringes mated to a commonvalve (figure 5), which simultaneously selects fill or injectpositions for both syringes: SYRINGE (A)-Line (A1),SYRINGE (B)-Line (B1); SYRINGE (A)-Line (a2),SYRINGE (B)-Line (B2) respectively. In the automationdesign the function of this valve has been retained, and, infact, the valve positioning signal is used as the directionselect line for syringe movements (figure 6).
The movements ofthe syringes themselves are completelydecoupled each syringe is driven by a separate hightorque stepper motor, which in turn is directly controlledby TTL signals from the computing system. In thismanner the automation software can determine themaximum syringe velocity (a function of liquid viscosityand syringe size), so as to prevent errors in delivery due toback-pressure effects, and can correctly manipulatesyringes ofdifferent capacities during dilution operations.These units are equipped with strain sensors that preventdamage to the unit when attempting to move past themechanical top-of-travel limit. The logic board makes useof this strain switch signal to decouple the drivepulse-train at the mechanical limit; further, more com-plete advantage of this feature is taken during theinitialization procedure. At initialization, the computersends an exaggerated pulse-train to all syringes, attempt-ing to send each syringe past the actual hardware limit.From their initialized, top-of-travel, positions the auto-mation software then tracks the position ofeach syringe inthe system. The position of the valve is computer selectedby a TTL signal, while actual positioning is controlled by
"-1VOLTS VOLTAGE F’R’E"OuE.CY1
co.vEm.F"EOUE"CY
’0-0H
FREQUENCY
0-oH
10"E-,’ J ’ ,
LINEAB CONTBOL OF DUTY CYCLE FOM TO 100%HIGH BESOLUTION OF CONTROL DUTY CYCLE
Figure 3. Proporionalng ealer control c#cuil.
AUTO/MANUAL24 VDC PULSELINE
ICONTROLLERI; TT HIILO, DIRECTION
RESISTANCE VALVE
6.5 mVldeg CIRCULATOR "DIAREACTION
....,so. ; v..PRE-AMP A/D
RESISTANCE ,Figure 4. Coolant control system.
A1 B1r..............
A21 _r-I Common LLValve B2
j’------1----Syringe A Syringe B
Figure 5. ,Dual syringes with common valve.
hardware on the logic board. The mechanical valveposition is then reported out to the computer system viaTTL signals. The automation software, therefore, pro-vides for the generation of the valve position select signal,a suitable delay to permit settling of the valve to the newmechanical position and verification of the valveposition via sense lines. The software further providesan error handling ability to attempt to ’unstick’ avalve before aborting the experiment in progress. Anelectronic schematic of the syringe logic board is shown infigure 7.
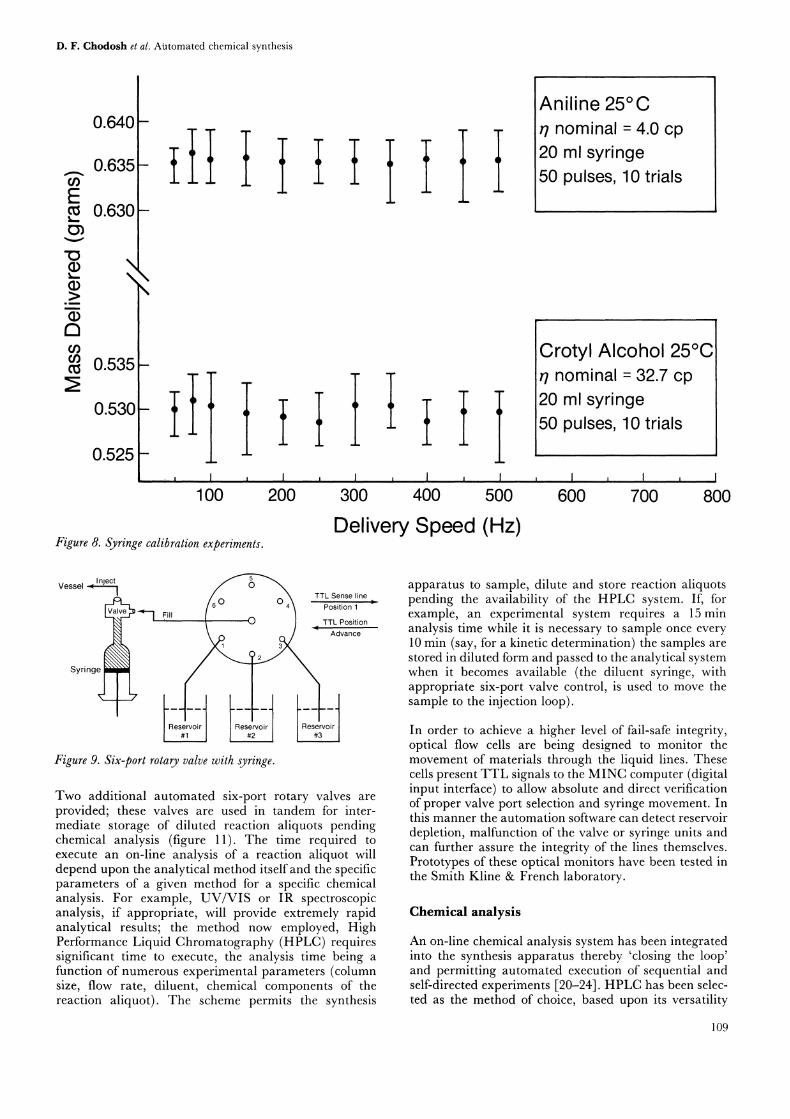
The syringe systems have been tested over a wide range ofliquid viscosities in order to determine the effects ofdelivery speed on accurcy and reproducibility (figure 8).Studies by Smith Kline & French correlate with thevendor’s reports and demonstrate the ability to manipulate
107

D. F. Chodosh et al. Automated chemical synthesis
cPurL PULSE TRAIN ’..n.ru’L ;j
SYRINGEADRIVER LOGIC
DIRECTIONSIGNAL
CPU{HIILO]
VALVE MOTORDRIVER LOGIC
TTL PULSE TRAINSYRIN(EDRIVER LOGIC
Figure 6. Syringe control signals.
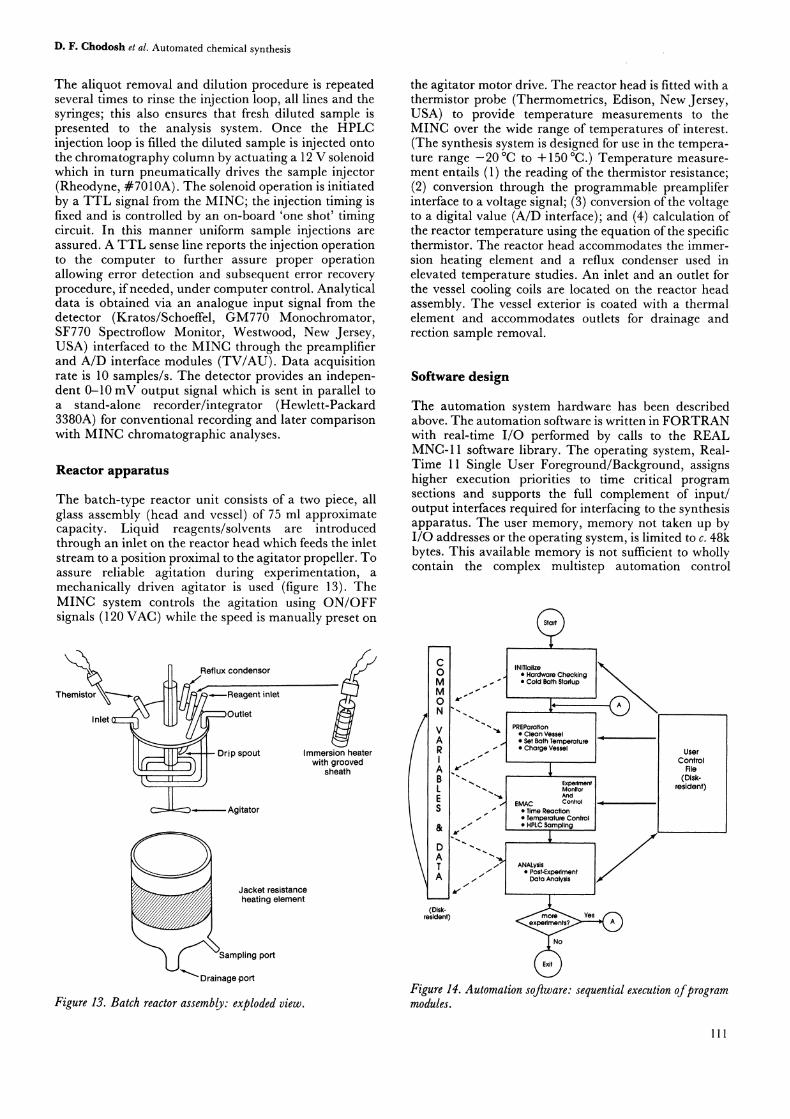
samples with errors in delivery on the order of 0"5%mass delivered over the range of viscosities of interest. Inthe automation scheme four syringes are employed: (1)reagent/solvent delivery to reactor vessel; (2) drainage ofreactor vessel between experiments and during washings;(3) reaction aliquot removal; and (4) diluent delivery foraliquot dilution preceding on-line chemical analysis. Thecapability to select and deliver reagent(s) and solvent(s)is provided with a single syringe through the use of a fullyautomated six-port rotary valve (Rheodyne, Berkeley,California, USA) interposed between the syringe and thereagent/solvent reservoirs (figure 9). The valve is pneu-matically actuated, advancing one position each time aTTL position advance signal (operating a 12 V DCsolenoid) is accepted from the computing system. Therotary valve is fitted with a magnetic armature (figure 10)and an annular ring of six Hall-effect magnetic sensors(Sprague Electric Co., Worchester, Massachusetts,USA). At position 1, a TTL sense signal is driven HIGH
permitting the MINC computer to determine a referenceposition. A search for the reference position is executed inthe start-up initialization and in error recovery proce-dures. During experimentation the automation softwaretracks the valve position from the reference position andthe number of position advances pulses issued.
The initialization procedure assures that the linesbetween the radial rotary valve ports and their respectivereagent/solvent reservoirs are filled and that the ’fill’ linebetween the delivery syringe and the central valve portcontains solvent. In operation, solvent is delivered to thevessel between each reagent delivery step such thatreagents do not mix in the ’fill’ line. The final materialdelivered to the reactor is always solvent so that theapparatus is ready for the washing procedure that followseach experiment. For a two reagent/one solvent experi-ment the delivery sequence entails Reagent A- 1/2Solvent- Reagent B- 1/2 Solvent. Reagent reservoirs aremaintained at reduced temperature as a precautionagainst decomposition.
The application of a second syringe is quite straight-forward. The syringe ’fill’ line connects at the bottom ofthe reaction vessel to the reactor drainage port; thesyringe ’inject’ line simply connects to the waste stream.A passive drain (for example gravity drain) provedunreliable during the early stages of our automationstudies; this active drainage procedure allows more rapidemptying and washing between experimental runs there-by contributing to instrument throughput.
47K
+12
+12.12o 9128 11 +12 4098,,
10 14 16174C107
B8 B7 B6 B5
Hamilton DriverBoard
Stepper Motor+12
microswitch
+12
16
4098
+12
14 15 10
409812
SC-1 1K
A3
SC-2 T2301A
Valve Motor
Figure 7. Electronic schematic: syringe logic board.
108
B3
22K
47K
+12
+1212 1 11+1207,;_.o74C1
,+12 [ i; i[ "; +12
812 Bll B9B10i
Hamilton DriverBoard
Stepper Motor+12
microswitch
D. F. Chodosh et al. Aiatomated chemical synthesis
E
0.64O
0.635
0.630
0.535
0.530
0.525
100 200 3O0 4OO 5O0
Aniline 25 C,’7 nominal- 4.0 cp20 ml syringe50 pulses, 10 trials
Crotyl Alcohol 25Cq nominal- 32.7 cp20 ml syringe50 pulses, 10 trials
,I
6OO 7OO 8OO
Delivery Speed (Hz)Figure 8. Syringe calibration experiments.
InjectVessel
/_ _\ TTL Sense line
Fill [b-’^O .\,.,, Position
Advance
Syringe
Reservoir eservir1I svoir Reservoir es:vFigure 9. Six-port rotary valve with syringe.
Two additional automated six-port rotary valves areprovided; these valves are used in tandem for inter-mediate storage of diluted reaction aliquots pendingchemical analysis (figure 11). The time required toexecute an on-line analysis of a reaction aliquot willdepend upon the analytical method itself and the specificparameters of a given method for a specific chemicalanalysis. For example, UV/VIS or IR spectroscopicanalysis, if appropriate, will provide extremely rapidanalytical results; the method now employed, HighPerformance Liquid Chromatography (HPLC) requiressignificant time to execute, the analysis time being afunction of numerous experimental parameters (columnsize, flow rate, diluent, chemical components of thereaction aliquot). The scheme permits the synthesis
apparatus to sample, dilute and store reaction aliquotspending the availability of the HPLC system. If, forexample, an experimental system requires a 15 minanalysis time while it is necessary to sample once every10 min (say, for a kinetic determination) the samples arestored in diluted form and passed to the analytical systemwhen it becomes available (the diluent syringe, withappropriate six-port valve control, is used to move thesample to the injection loop).
In order to achieve a higher level of fail-safe integrity,optical flow cells are being designed to monitor themovement of materials through the liquid lines. Thesecells present TTL signals to the MINC computer (digitalinput interface) to allow absolute and direct verificationof proper valve port selection and syringe movement. Inthis manner the automation software can detect reservoirdepletion, malfunction of the valve or Syringe units andcan further assure the integrity of the lines themselves.Prototypes of these optical monitors have been tested inthe Smith Kline & French laboratory.
Chemical analysis
An on-line chemical analysis system has been integratedinto the synthesis apparatus thereby ’closing the loop’and permitting automated execution of sequential andself-directed experiments [20-24]. HPLC has been selec-ted as the method of choice, based upon its versatility
109

D. F. Chodosh et al. Automated chemical synthesis
LED Position Display]
NJii_F.F.tt.’..L. sensors
,.,,,,,$,,,.., ,,,,,,,,
= armature
":
..:.=m:...::m:::.: .:::::.. :::::::::::::::::::::
"-:..:::;::.m ::::::::".. ....:::..:..: ::.::: :::: ::::
Manual PosiiionAdvance Switch
Figure 10. Position sensing in rotary valve assembly.
Figure 11. Tandem six-port valve arrangementfor aliquot storage.
and, typically, the availability of certified analyticalprocedures concurrently developed in the course ofchemical R&D programmes. As required, reaction ali-quots are periodically removed from the vessel, dilutedand introduced into the analysis system. A block diagramof this system is presented in figure 12. The samplingsyringe removes a reaction aliquot of sufficient volume toclear the ’fill’ line connecting it to the vessel. Underprogram control the diluent syringe is filled with therequisite volume of diluent for the dilution ratio (V’V)required. (This ratio is calculated from the reagent(s)/product(s) concentration and the predetermined columncharacteristics.) The syringe valve is switched to the’inject’ position; simultaneous movement ofboth syringesdilutes the sample while moving it to the analysis system.Both the speed of movement and the relative syringecapacities are factors in this dilution procedure; theautomation software determines relative speed of move-ment for the syringes based upon their relative capacitiesand the dilution ratio desired. Typically the diluentSyringe capacity is greater (by a factor of 10) than thesampling syringe capacity to facilitate the large dilutionratios often required for HPLC analysis. An algorithmhas been developed that controls the simultaneousmovement of these syringes at different speeds using thesingle programmable clock interface. Although thealgorithm restricts the relative speeds to integer ratios(for example 1: 1, 1:2, 1:3,...), the flexibility of theprocedure is sufficient. A ’pulse buffer’ is constructedconsisting of alternating ON-OFF-ON-OFF-... datavalues. Starting with the first data value in the buffer theprogrammable clock places the next data value into thedigital output register each time the required time periodhas expired (asynchronous data transfer). By ’masking’the ON values in this pulse buffer one syringe speed canbe made an integer multiple of the other. For example, apulse-stream directed to syringe A consisting of (ON-OFF-OFF-OFF-ON-OFF-OFF-OFF...) repeatingvalues will provide an A" B movement ratio of 2. Thatis, for a fixed time period syringe B will receive twice asmany TTL pulses as does syringe A; syringe B, therefore,moves at twice the speed of syringe A.
Inject
Syringe Drives
Figure 12. Functional block diagram ofon-line HPLC analysis system.
C’V’TIR
Waste
110
D. F. Chodosh et al. Automated chemical synthesis
The aliquot removal and dilution procedure is repeatedseveral times to rinse the injection loop, all lines and thesyringes; this also ensures that fresh diluted sample ispresented to the analysis system. Once the HPLCinjection loop is filled the diluted sample is injected ontothe chromatography column by actuating a 12 V solenoidwhich in turn pneumatically drives the sample injector(Rheodyne, #:7010A). The solenoid operation is initiatedby a TTL signal from the MINC; the injection timing isfixed and is controlled by an on-board ’one shot’ timingcircuit. In this manner uniform sample injections areassured. A TTL sense line reports the injection operationto the computer to further assure proper operationallowing error detection and subsequent error recoveryprocedure, if needed, under computer control. Analyticaldata is obtained via an analogue input signal from thedetector (Kratos/Schoeffel, GM770 Monochromator,SF770 Spectroflow Monitor, Westwood, New Jersey,USA) interfaced to the MINC through the preamplifierand A/D interface modules (TV/AU). Data acquisitionrate is 10 samples/s. The detector provides an indepen-dent 0--10 mV output signal which is sent in parallel toa stand-alone recorder/integrator (Hewlett-Packard3380A) for conventional recording and later comparisonwith MINC chromatographic analyses.
Reactor apparatus
The batch-type reactor unit consists of a two piece, allglass assembly (head and vessel) of 75 ml approximatecapacity. Liquid reagents/solvents are introducedthrough an inlet on the reactor head which feeds the inletstream to a position proximal to the agitator propeller. Toassure reliable agitation during experimentation, amechanically driven agitator is used (figure 13). TheMINC system controls the agitation using ON/OFFsignals (120 VAC) while the speed is manually preset on
-’ ’ /eflux condensor
InletOutlet g;-; :_ jIl J ij Dripspout I%thSeraOilvlter
Agitator
Jacket resistanceheating element
Figure 13. Batch reactor assembly: exploded view.
the agitator motor drive. The reactor head is fitted with athermistor probe (Thermometrics, Edison, New Jersey,USA) to provide temperature measurements to theMINC over the wide range of temperatures of interest.(The synthesis system is designed for use in the tempera-ture range -20 C to + 150 C.) Temperature measure-ment entails (1) the reading of the thermistor resistance;(2) conversion through the programmable preampliferinterface to a voltage signal; (3) conversion of the voltageto a digital value (A/D interface); and (4) calculation ofthe reactor temperature using the equation of the specificthermistor. The reactor head accommodates the immer-sion heating element and a reflux condenser used inelevated temperature studies. An inlet and an outlet forthe vessel cooling coils are located on the reactor headassembly. The vessel exterior is coated with a thermal.element and accommodates outlets for drainage andrection sample removal.
Software design
The automation system hardware has been describedabove. The automation software is written in FORTRANwith real-time I/O performed by calls to the REALMNC-11 software library. The operating system, Real-Time 11 Single User Foreground/Background, assignshigher execution priorities to time critical programsections and supports the full complement of input/output interfaces required for interfacing to the synthesisapparatus. The user memory, memory not taken up byI/O addresses or the operating system, is limited to c. 48kbytes. This available memory is not sufficient to whollycontain the complex multistep automation control
iNITlallze0 Hardware CheckingM Cold Bath Startup
fvl0 lN "., /’,.
V PREParationClean Vessel
A set Bath TemperatureR charge vessel User
ControlA " / File
S I Time Reaction| Temperature Control
/ | HPLC Sampling
A "" ANALysisPost-ExperimentA Data Analysis
re(sln’’f’
Figure 14. Automation software: sequential execution ofprogrammodules.
111

D. F. Chodosh et al. Automated chemical synthesis
CRT
Syringe 1’# ml’s to Deliver:
45
I /InteractiveControl File
Builder
Conversion Tables:(40 pulses/ml)
Output
Figure 15. Automation software: building the USER CONTROL FILE.
User ControlFile
INIT Record 1
INlRecord N
PREP rec’s
EMAC rec’s
ANAL rec’s
PREP rec 1
(Disk-resident)
Exp I
software; independent program modules have thereforebeen designed, which, when used sequentially, execute acomplete experiment. The execution sequence of the fourprogram modules in this scheme is shown in figure 14.Since the modules execute independently (effectively,chaining under indirect file control) data variable valuesare not preserved or directly passed between modules.This scheme requires that the operating system supportsindirect control files that enumerate the sequence ofprograms to be executed, and that all data be maintainedon the permanent disk storage device is available to eachprogram module as required. Each module when calledinto execution first reads COMMON data variables fromthe disk into memory and stores the latest values back tothe disk immediately prior to terminating execution.Independent modules can be designed, tested andinserted into the scheme without modification to pre-existing software,
Experimental operating parameters are established in adisk resident USER-CONTROL FILE (cf. figures 14and 15) and are available to all program modules. Theuser assembles information in this control file through theuse of a text editor or via dialogue with an interactiveprogram prior to beginning reactor operation. All sub-sequent experimental operations proceed without dia-logue. Program modules access information, as required,from the USER-CONTROL FILE to direct their activi-
ties. In the file experiments are specified sequentially; aspecific format is used to define a block of data variableswhich enumerate washing instructions, reagent stoi-chiometry, reaction temperature, sampling rate and thenumber of samples to be taken for a specific experiment.The next experiment is sequentially defined in the filewith the identical format. Series of experiments can thenbe configured in the USER-CONTROL FILE forsequential, unattended execution. The synthesis instru-ment terminates all activity and shuts down operation inan orderly fashion when an EOF (end-of-file) is read fromthe file. This manner of operation is appropriate forfactorictl design experiments in which the user is able todelineate all experiments in the series. For a self-directedoptimization (for example Simplex) new experiments areadded to the control file by the ANALysis programmodule based upon the evaluation of precedingexperimental determinations. Reaction operation conti-nues by executing this newly defined experiment; thiscycling continues until a termination condition is met
(limited number of experiments; convergence ofresponseto a preset tolerance).
Given the complex function of each program module it isnot surprising that one would meet with great difficulty indesigning FORTRAN programs to fit the availablecomputer memory. Furthermore, complex functions canusually be divided into a progression of simpler
112
D. F. Chodosh et al. Automated chemical synthesis
PrimitiveProcesses
SYRSTreset
syringe valve
ZSYRzero
syringe
PVLVselect
6 port position
VLVset
coolant valve
SYRNGEmove
syringe
DILUTEtandem
syringe move
INJECTHPLCinject
BATHUPcoolant
bath initialize
STIRagitatorON/OFF
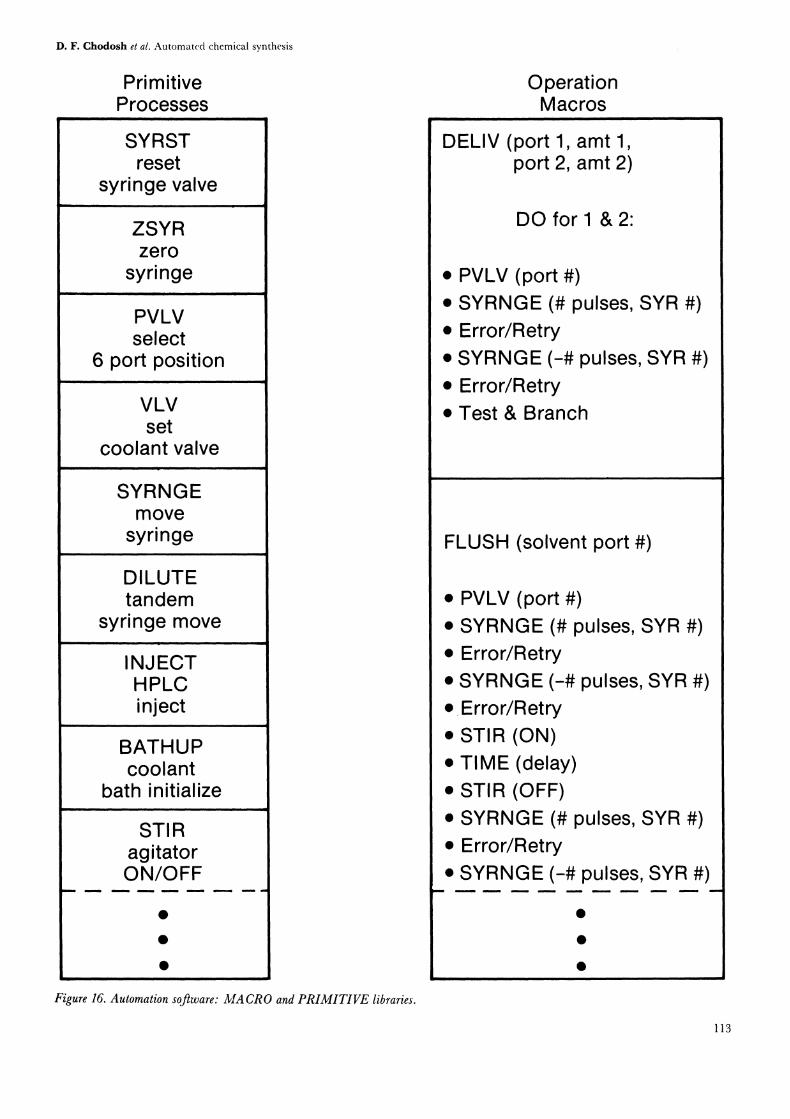
Figure 16. Automation software: MACRO and PRIMITIVE libraries.
OperationMacros
DELIV (port 1, amt 1,port 2, amt 2)
DO for I & 2:
PVLV (port #)SYRNGE (# pulses, SYR #)Error/RetrySYRNGE (-# pulses, SYR #)Error/RetryTest & Branch
FLUSH (solvent port #)
PVLV (port #)SYRNGE (# pulses, SYR #)Error/RetrySYRNGE (-# pulses, SYR #)Error/RetrySTIR (ON)TIME (delay)STIR (OFF)SYRNGE (# pulses, SYR #)Error/RetrySYRNGE (-# pulses, SYR #)
113
D. F. Chodosh et at. Automated chemical synthesis
Memory
I/0 PageRT-11 Operating
System
Indirect command’File
common ataVariables
ProgramModule
(segmented)
OperationMACRO(overlay)
PrimitiveOperation(overlay)
Disk
User-ControlFile
Indirect CommandsFile
Co’mmon DataVariables
ProgramModules
OperationMACROS
Primitives
UtilitySubroutines
ReaI-MNC 11
Event File
Raw Data
Summary Data
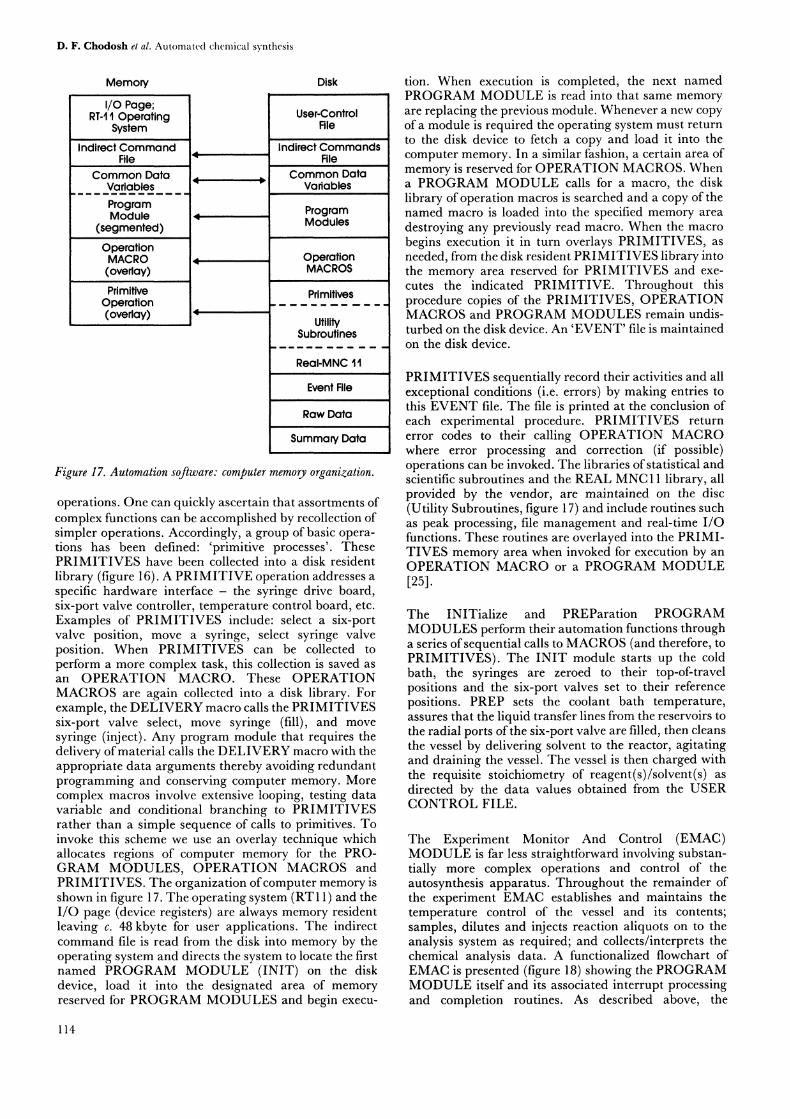
Figure 17. Automation software: computer memory organization.
operations. One can quickly ascertain that assortments ofcomplex functions can be accomplished by recollection ofsimpler operations. Accordingly, a group of basic opera-tions has been defined: ’primitive processes’. ThesePRIMITIVES have been collected into a disk residentlibrary (figure 16). A PRIMITIVE operation addresses aspecific hardware interface- the syringe drive board,six-port valve controller, temperature control board, etc.Examples of PRIMITIVES include: select a six-portvalve position, move a syringe, select syringe valveposition. When PRIMITIVES can be collected toperform a more complex task, this collection is saved asan OPERATION MACRO. These OPERATIONMACROS are again collected into a disk library. Forexample, the DELIVERY macro calls the PRIMITIVESsix-port valve select, move syringe (fill), and movesyringe (inject). Any program module that requires thedelivery ofmaterial calls the DELIVERY macro with theappropriate data arguments thereby avoiding redundantprogramming and conserving computer memory. Morecomplex macros involve extensive looping, testing datavariable and conditional branching to PRIMITIVESrather than a simple sequence of calls to primitives. Toinvoke this scheme we use an overlay technique whichallocates regions of computer memory for the PRO-GRAM MODULES, OPERATION MACROS andPRIMITIVES. The organization ofcomputer memory isshown in figure 17. The operating system (RT11) and theI/O page (device registers) are always memory residentleaving c. 48 kbyte for user applications. The indirectcommand file is read from the disk into memory by theoperating system and directs the system to locate the firstnamed PROGRAM MODULE (INIT) on the diskdevice, load it into the designated area of memoryreserved for PROGRAM MODULES and begin execu-
tion. When execution is completed, the next namedPROGRAM MODULE is read into that same memoryare replacing the previous module. Whenever a new copyof a module is required the operating system must returnto the disk device to fetch a copy and load it into thecomputer memory. In a similar fashion, a certain area ofmemory is reserved for OPERATION MACROS. Whena PROGRAM MODULE calls for a macro, the disklibrary of operation macros is searched and a copy of thenamed macro is loaded into the specified mernory areadestroying any previously read macro. When the macrobegins execution it in turn overlays PRIMITIVES, asneeded, from the disk resident PRIMITIVES library intothe memory area reserved for PRIMITIVES and exe-cutes the indicated PRIMITIVE. Throughout thisprocedure copies of the PRIMITIVES, OPERATIONMACROS and PROGRAM MODULES remain undis-turbed on the disk device. An ’EVENT’ file is maintainedon the disk device.
PRIMITIVES sequentially record their activities and allexceptional conditions (i.e. errors) by making entries tothis EVENT file. The file is printed at the conclusion ofeach experimental procedure. PRIMITIVES returnerror codes to their calling OPERATION MACROwhere error processing and correction (if possible)operations can be invoked. The libraries of statistical andscientific subroutines and the REAL MNC 11 library, allprovided by the vendor, are maintained on the disc(Utility Subroutines, figure 17) and include routines suchas peak processing, file management and real-time I/Ofunctions. These routines are overlayed into the PRIMI-TIVES memory area when invoked for execution by anOPERATION MACRO or a PROGRAM MODULE[5].
The INITialize and PREParation PROGRAMMODULES perform their automation functions througha series ofsequential calls to MACROS (and therefore, to
PRIMITIVES). The INIT module starts up the coldbath, the syringes are zeroed to their top-of-travelpositions and the six-port valves set to their referencepositions. PREP sets the coolant bath temperature,assures that the liquid transfer lines from the reservoirs tothe radial ports of the six-port valve are filled, then cleansthe vessel by delivering solvent to the reactor, agitatingand draining the vessel. The vessel is then charged withthe requisite stoichiometry of reagent(s)/solvent(s) asdirected by the data values obtained from the USERCONTROL FILE.
The Experiment Monitor And Control (EMAC)MODULE is far less straightforward involving substan-tially more complex operations and control of theautosynthesis apparatus. Throughout the remainder ofthe experiment EMAC establishes and maintains thetemperature control of the vessel and its contents;samples, dilutes and injects reaction aliquots on to theanalysis system as required; and collects/interprets thechemical analysis data. A functionalized flowchart ofEMAC is presented (figure 18) showing the PROGRAMMODULE itself and its associated interrupt processingand completion routines. As described above, the
114

D. F. Chodosh et al. Automated chemical synthesis
EMAC HPLC LOOP
No
(Wait)
Reset FlagWrite Raw HPLCData to Disk File
Switch CollectionBuffers
& Reset Counter
Peak-Process50
HPLC Data Points
ReactorTemperature
Control
No,L!
TemperatureControl
INo’
Figure 18. Automation software: EMAC program module flowchart.
sampling rate (10 itz) is established by loading the pro-grammable clock with the appropriate data value. Eachtime the requisite time period expires the clock generatesan ’interrupt’ causing the operating system to suspend
CLOCK DRIVEN INTERRUPT
Return)
Read A/D Channels1-4
Store Data InCurrent
Data Buffer
No
Routine
COMPLETION ROUTINE
Copy HPLC DataFrom
Data Bufferto
Collection Buffer
IncrementCollection Buffer
Counter
[",’ Set Flag
processing of the current PROGRAM MODULE and to
jump into the execution of the interrupt routine. Whenthe processing of the instructions in the interrupt routineis completed execution of the PROGRAM MODUL’E
115
D. F. Chodosh et al. Automated chemical synthesis
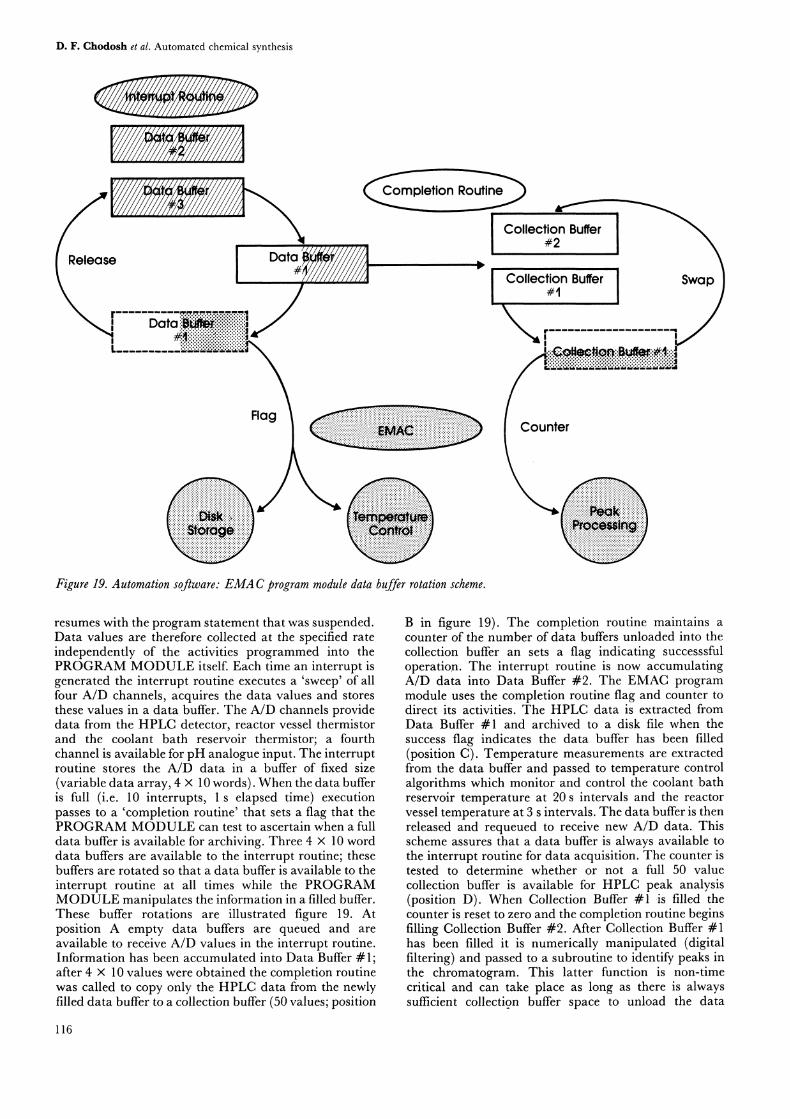
Figure 19. Automation software: EMAC program module data buffer rotation scheme.
resumes with the program statement that was suspended.Data values are therefore collected at the specified rateindependently of the activities programmed into thePROGRAM MODULE itself. Each time an interrupt isgenerated the interrupt routine executes a ’sweep’ of allfour A/D channels, acquires the data values and storesthese values in a data buffer. The A/D channels providedata from the HPLC detector, reactor vessel thermistorand the coolant bath reservoir thermistor; a fourthchannel is available for pH analogue input. The interruptroutine stores the A/D data in a buffer of fixed size(variable data array, 4 x 10 words). When the data bufferis full (i.e. 10 interrupts, s elapsed time) executionpasses to a ’completion routine’ that sets a flag that thePROGRAM MODULE can test to ascertain when a fulldata buffer is available for archiving. Three 4 x 10 worddata buffers are available to the interrupt routine; thesebuffers are rotated so that a data buffer is available to theinterrupt routine at all times while the PROGRAMMODULE manipulates the information in a filled buffer.These buffer rotations are illustrated figure 19. Atposition A empty data buffers are queued and areavailable to receive A/D values in the interrupt routine.Information has been accumulated into Data Buffer # 1;after 4 x 10 values were obtained the completion routinewas called to copy only the HPLC data from the newlyfilled data buffer to a collection buffer (50 values; position
B in figure 19). The completion routine maintains acounter of the number of data buffers unloaded into thecollection buffer an sets a flag indicating successsfuloperation. The interrupt routine is now accumulatingA/D data into Data Buffer #2. The EMAC programmodule uses the completion routine flag and counter todirect its activities. The HPLC data is extracted fromData Buffer # and archived to a disk file when thesuccess flag indicates the data buffer has been filled(position C). Temperature measurements are extractedfrom the data buffer and passed to temperature controlalgorithms which monitor and control the coolant bathreservoir temperature at 20 s intervals and the reactorvessel temperature at 3 s intervals. The data buffer is thenreleased and requeued to receive new A/D data. Thisscheme assures that a data buffer is always available tothe interrupt routine for data acquisition. The counter istested to determine whether or not a full 50 valuecollection buffer is available for HPLC peak analysis(position D). When Collection Buffer #1 is filled thecounter is .reset to zero and the completion routine beginsfilling Collection Buffer #2. After Collection Buffer #has been filled it is numerically manipulated (digitalfiltering) and passed to a subroutine to identify peaks inthe chromatogram. This latter function is non-timecritical and can take place as long as there is alwayssufficient collecti.on buffer space to unload the data
116

D. F. Chodosh et al. Automated chemical synthesis
buffers which participate in the time critical operation(interrupt processing). When the manipulation of thedata contents of Collection Buffer # is completed it canbe swapped with Collection Buffer #2 to continue thiscycle. This rotation of buffers guarantees the availabilityof collection buffer space for the completion routine.
The operation continues until the appropriate termin-ation condition is met: either the specified number ofpeaks have been collected from the chromatogram or thespecified analysis time has elapsed. The ANALysisPROGRAM MODULE is then executed to perform(optionally) any indicated post-processing computations.Execution cycles to the PREP program module for thenext experiment if indicated in the USER CONTROLFILE.
Experimental designs
When one attempts to optimize a given step in a synthesisit is often useful to obtain a stability profile ofthe reactionmixture components. This profile can be constructedthrough a series of experiments which quantitate thecomponent stabilities as a step function of the variousreaction parameters: temperature, concentration andother reaction parameters often including but not limitedto, pH, solvent composition and catalyst. This type ofexperimentation is inherently repetitious and by employ-ing the hardware and software previously described canbe fully automated.
Decomposition rate determinations were performed onthe cephalosporin reaction components I and II.
(TSA Tetrazole Sulfonic Acid)
H0
CO2I
An independently certified HPLC method [26] wasemployed to monitor these decomposition reactions.Preceding the cephalosporin studies; the reproducibilityof the HPLC analysis system was established using aresorcinol (Baker Chemical Co., Phillipsburgh, NewJersey, USA) test system. A standard resorcinol solutionwas introduced into the reaction vessel and repeatedchromatograms Were obtained. The retention times fornine injections (RTmean 3.85 min) varied by less that_+0"01 min (+0.3%). The integrated area (countSmean69 000) showed a standard deviation of 0"33% with amaximum absolute count fluxation of +1% from themean. The small error terms associated with thisanalytical method permits experimental design studies inwhich small changes in reaction parameters result insmall but chemically significant changes in the chemicalcomposition of the reaction mixture. Forty experimentaldeterminations were performed entirely under programcontrol. The procedure followed was"
(1) The reaction vessel was first cleaned by flushingwith solvent and then emptied.(2) Starting material was introduced to the vessel. Asolution of standard concentration of each startingmaterial was prepared, maintained at reduced temper-ature and available to the automated system via the sixport valve assembly. For those experiments whichrequired varying starting material concentrations, theappropriate volume of solvent was delivered via a thirdport to affect the dilution ratio required to attain therequisite concentration ofstarting material. For the pHdependent studies two reservoirs of starting materialbuffered at different pHs were available to the systemand were mixed in the appropriate proportion to yield astarting material solution ofthe required pH. (SolutionpH measurements were confirmed by manual checks.)
(3) The stirred reaction mixture was brought rapidly tothe required temperature. Temperature control duringthe course of experimentation was typically +_0"1 ofthe setpoint.
(4) An initial aliquot was withdrawn and submitted foron-line chemical analysis.
(5) After succeeeding fixed time intervals, selected to
permit several aliquots to be taken over the firsthalf-life of the starting material, aliquot removal andchemical analysis steps were repeated.
(6) The experiment was terminated when either (a) apre-established time period had elapsed, or (b) thechromatogram analysis indicated that the peaks ofmajor interest had decreased in intensity below a
pre-established percentage of their original value.
(7) The EVENT file was listed on the printer alongwith summary reports ofpeak retention times and peak
+ TSAOA+ I,,
CO 2Na SO2
IIareas for all analyses performed. These data files, aswell as the raw HPLC data, were retained on the discfor future report writing and, if necessary, furtheroff-line numerical analysis.
(8) If the USER CONTROL FILE indicated anotherexperiment was to be performed, the entire sequence ofsteps was repeated. In this manner a series ofexperiments could be executed without user interven-tion.
In these initial studies the analysis of the decay rates wereperformed off-line; therefore the ANALysis programmodule was effectively bypassed though it still served to
update cycle counters for subsequent passes through theUSER CONTROL FILE.
Decomposition rates were evaluated with repect to initialconcentration, temperature and pH (table 1). Generally,
117

D. F. Chodosh et al. Automated chemical synthesis
Experimental Design
Exp. # T C pH
5.0123456789
101112131415161718
35.04O.045.050.055.060.060.0
Buffer
0.15 N Acetate
5.0’ ’0.20 N Acetate
60.0 4’8 O115_N Phosphate5.26.86.97.68.2
0.02 Nff
0.010 N II0.025 N II0.030 N_ g0.075 N II0.120 N II0.150 N Ii0.02
# Trials
122222222422111211
19 35.0 5.0 0.15 _N Acetate 0.04 NI20 45.021 55.022 65.0
Table 1. Experimental design.
?0
,In A =o normalized to 1000.15.N.N Acetate Buffer
O.02N__ pH 5.0rn 400 + 556o 45oc x 60C" 50c o 75c
25 50 0 ?5 100 125 150 175 200mLnu%e
Figure 20. LN(A) versus time H.118
D. F. Chodosh et al. Automated chemical synthesis
I0.0
020_N retate B’ufferpH = 5.0T = 60.0C
0.02 0.02 0.04 0.08 0.08InL,La Concenf.r’at,Lon I I
0.10 O.la 0.14 0.16 0.10 0.20(Nor’maLL,,g]
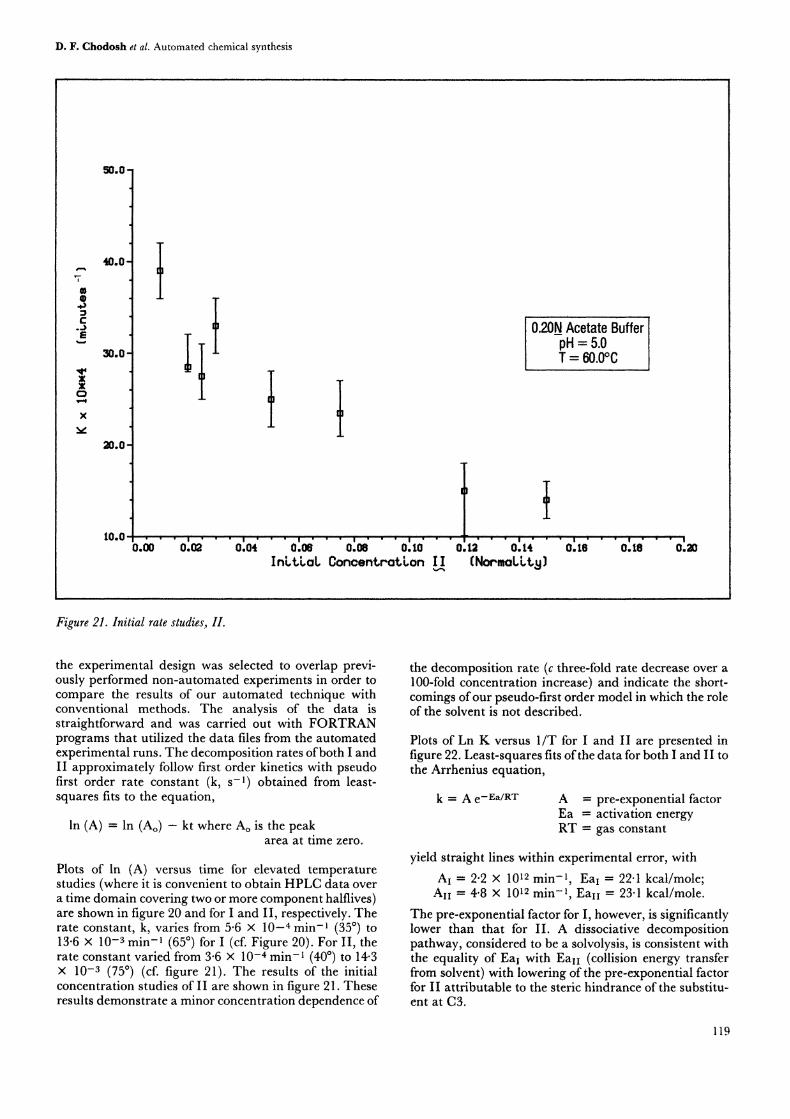
Figure 21. Initial rate studies, H.
the experimental design was selected to overlap previ-ously performed non-automated experiments in order tocompare the results of our automated technique withconventional methods. The analysis of the data isstraightforward and was carried out with FORTRANprograms that utilized the data files from the automatedexperimental runs. The decomposition rates ofboth I andII approximately follow first order kinetics with pseudofirst order rate constant (k, s-) obtained from least-squares fits to the equation,
In (A) In (Ao) kt where Ao is the peakarea at time zero.
Plots of In (A) versus time for elevated temperaturestudies (where it is convenient to obtain HPLC data overa time domain covering two or more component halflives)are shown in figure 20 and for I and II, respectively. Therate constant, k, varies from 5"6 10-4 min- (35) to13"6 10- min- (65) for I (cf. Figure 20). For II, therate constant varied from 3"6 10-4 rain- (40) to 14"3
10- (75) (cf. figure 21). The results of the initialconcentration studies of II are shown in figure 21. Theseresults demonstrate a minor concentration dependence of
the decomposition rate (c three-fold rate decrease over a100-fold concentration increase) and indicate the short-comings ofour pseudo-first order model in which the roleof the solvent is not described.
Plots of Ln K versus 1/T for I and ii are presented infigure 22. Least-squares fits ofthe data for both I and II tothe Arrhenius equation,
k A e-Ea/RT A pre-exponential factorEa activation energyRT gas constant
yie|d straight lines within experimental error, with
AI 2-2 102 min-, Eai 22"t kcal/mole;AII 4"8 102 rain-, Eai = 23.1 kcal/mole.
The pre-exponential factor for I, however, is significantlylower than that for II. A dissociative decompositionpathway, considered to be a solvolysis, is consistent withthe equality of Eal with Eai (collision energy transferfrom solvent) with lowering of the pre-exponential factorfor II attributable to the steric hindrance of the substitu-ent at C3.
119

D. F. Chodosh et al. Automated chemical synthesis
5.0"
3.0
2.0
1.0
0.02.8
o
0.15 cetate Buffer " oE;= 22.1 kcal/mol "". "[] O.02N #, pH 5.O_ ,..,0 ]5N Acetate Buffer-_ etate Buffer_ .
3.0 :3.1 :.2lIT x 103 K
Figure 22. Ln(K) versus 1/T I and H.
I0.0
pH
O.02N I] T 60C0.15__N Phosphate Buffer
Figure 23. H pH-dependent studies.
120

D. F. Chodosh et al. Automated chemical synthesis
The results of the pH dependent studies are presented infigure 23 and indicate the relative insensitivity of thedecomposition kinetics to pH values in the range studied.The rate varies from 23 x 10-1 min- to 38 x 10-4 min-in the pH range 4"8 to 8"2.
Discussion
This research effort focuses on laboratory scale batch-type automation research and fully complements andextends the automation studies of continuous flowreaction designs reported for both laboratory [9 and 10]and pilot [27] scale systems. As new microsensors andspecial microchips [28] become available the design andimplementation timeframe for all such automated reactorschema will be significantly reduced thereby encouragingsuch experimentation. Interestingly enough, theseresearch approaches require the participation of aninterdisciplinary team, bringing together individualswith expertise in the chemical, chemical engineering andcomputer sciences. The building ofsuch teams, in and byitself, has significant implications for research organiz-ations where the team can and should participate in theglobal development of chemical processes from theearliest inception at the laboratory research level throughto the production process.
References
1. WALSER, P. E. and BERTELS, H. A., American Laboratory,(1982), 113.
2. FRAZ.R, J. W., Accounts of Chemical Research, 7 (1974), 141.3. BRODMANN, M. T. and SMXTn, C. L., Chemical Engineering, 83
(1976), 191.4. K.I.DV, J. P., Chemical Engineering Progress, 77 (1981), 33.5. M.RRn’a’, R., Inst. Cont. Sys. 1981 ), 34.6. GAR’ro, R. D., Chemical Engineering Progress, 77 (1981), 44.7. NAOV, G., F.H.R, Z. and PuIoOR, E., Analytica Chimica Acta,
52 (1970), 47.8. SP.LLAN, R. A. and QuIN, J. D., AIChE Workshop in
Industrial Process Control, Tampa, Florida (November1974).
9. FRAZ.R, J. W., RmDO, L. P., BAD, H. R. andPOU.RACKI, C. L., Analytical Chemistry, 51 (1979), 1739.
10. NAKUMARA, R., SAKAMOTO, K., SATO, K., NIIYAMA, H. andECHIGOYA, E., International Chemical Engineering, 24 (1984),536.
11. Wimov, H., SCnAINBAU, J., BucK.Y, Jr., J. T., Lo-gino, G., Hill,J. and Bv.ovv, C. E., Analytical Chimica Acta,11)3 (1978), 469.
12. Cnoosn, D. F., Wiymov, H., Buc..,,,, Jr., J. T., andB.ROFF, C. E., Computers at the bench, Belgian Phar-maceutical Soceity International Conference on Computersin Pharmaceutical Research, Namur, Belgium (November1979).
13. CnODOSH, D. F., 1978 Fall D.E.C.U.S. Symposium, Work-shop of Laboratory Automation, San Francisco (November1978).
14. CnoDosn, D. F., BuckLer, Jr, j. T., L.viso, S. H.,WDZI.COWSKI, F. E., WaR, J. L., WINICOV, H. andB.ROlq% C. E., Automated synthesis: design of thechemical reactor hardware, 1981 Fall D.E.C.U.S. Sympo-sium, Los Angeles (December 1981).
15. DEAN, W. K., HEALD, K.J. and DEMING, S. N., Science, 189(1975), 805.
16. Box, G. E. P., Biometrics, 10 (1964), 16.17. Cnoosn, D. F., WDzicowsi, F. E., SCnAIyaAVU, J. and
B.ROlF, C. E., Journal ofAutomatic Chemistry, 5 (1983), 99.18. Cnoosn, D. F., BucKL.v, Jr., j. T., Loaio, G.,
SCnAIaAVU, J., WDZI.CgOWSI, F. E., WINICOV, H. and.B.ROFr, C. E., MINC interfacing, 1981 Fall D.E.C.U.S.Symposium, Los Angeles (December 1981).
19. CnODOSn, D. F., L.vIso, S. H., W.a.R, J. L., KAUnOLZ,K. and B.OFF, C. E., Journal of Automatic Chemistry, 5(1983), 103.
20. FRAZ.R, J. W., KRAY, A. M., S.Lm, W. and LIM, R.,Analytical Chemistry, 47 (1975), 869.
21. WAa’SO, M. W. and CAR, P. W., Analytical Chemistry, 51(1979), 1835.
22. D.mo, S. N. and MOREA,, S. L., Analytical Chemistry, 45(1973), 278A.
23. H.IDRIX, C., Chemical Technology (1980), 448.24. DMIo, S. N., American Laboratory (1981), 42.25. The CHAINing instruction allows a program to call
another program into execution while preserving a portionof memory to allow variable data values to be transferredbetween the two programs. This feature is available only forprograms executing in the background mode in RT11.
26. FILA, J. and DoooH.a’v, J., private communication.27. L.ORAD, M., RousseI-UCLAF, Romaineville, France,
private communication.28. See: Analytical Chemistry (1985), 57, 1298A.
121