automobile sector - amazon web services
TRANSCRIPT

AUTOMOBILE SECTOR August, 2020
SECTOR UPDATE

2
VIS Credit Rating Company Limited
Global Automobile Industry
Top six countries - Sales & market share in 2019
25 17
4 3 3 3
0%5%10%15%20%25%30%35%
0
5
10
15
20
25
30
China USA Germany India Japan Brazil
Mill
ion
Uni
ts
Car Sales - LHS Market Share - RHS
• Governments around the globe have supported their domestic automobile sector by incentivizing car buyers with subsidies and tax breaks to offset decreased auto sales.
• On the flip side, global pandemic has accelerated the development of both electric and autonomous vehicles.
• Given the global initiatives on stricter emission controls, automakers are beginning to expand their business into electric mobility sector. By 2025, every third new car sold is anticipated to be propelled or assisted by an electric battery.
• Global auto industry expects ~20% year-on-year (YoY) decline in sales in 2020. Prior to advent of Covid-19 pandemic, car sales were projected to reach 80m which has now been revised downwards to 60m.
• Pandemic and the economic recession that was triggered by lockdowns led to an unprecedented turmoil in 2Q’2020. Going forward, recovery in sales is dependent on duration and breadth of the pandemic.
• Amidst the outbreak, many factories were also temporarily shutdown to curb the spread of virus and contain losses.
*Annual Averages **Forecast
Global car sales trend
39
55
78 80 79 75
60
2030405060708090
(1990-1999)*(2000-2015)* 2016 2017 2018 2019 2020**
Mill
ion
Uni
ts

VIS Credit Rating Company Limited
3
Global Automobile Industry
10 10 9
8 7
5 5 4
3 3
2%
4%
6%
8%
10%
12%
14%
16%
2
4
6
8
10
12
VolkswagenGroup
ToyotaGroup
RenaultNissan
Alliance
GeneralMotors
Hyundai-Kia Ford Group HondaMotors
FIAT Chrysler Peugeot(PSA Group)
Mercedes -Daimler
Mill
ion
Uni
ts
Car Sales - LHS Market Share - RHS
• Global automobile industry is expected to witness consolidation as weaker OEMs will not be able survive on their own in this competitive environment after bearing significant losses.
• Covid-19 crisis has affected the consumers long-term buying habits and the same will impact auto industry.
• Auto manufacturers with large dependence on Chinese market have been affected more in the pandemic.
• Toyota is one of the least damaged top 10 auto brands by Covid-19 crisis.
• Emerging markets buy more cars than established markets.
Global light vehicles (Cars + LCVs) sales by top 10 manufacturer groups in 2019

4
VIS Credit Rating Company Limited
Pakistan’s Automobile Industry Se
gmen
ts
Passenger Cars
LCVs & Pickups
Trucks
Farm Tractors
Buses
Motorcycle
• Toyota (Corolla & Yaris) • Suzuki (Alto, Cultus, Wagon R) • Honda (Civic & City) • KIA Picanto (New entrant)
• Toyota (Hilux & Fortuner) • Suzuki Ravi • Honda BRV • KIA Sportage (New Entrant)
• Isuzu • Hino Pak • Master • Nissan
• Millat Tractors • Al Ghazi Tractors • Orient IMT Tractor
• Hino • Master • Isuzu
• Atlas Honda • Suzuki • United Autos • Road Prince
Lead
ers

VIS Credit Rating Company Limited
5
136 135
182
217 215
261 241
110
50
100
150
200
250
300
FY13 FY14 FY15 FY16 FY17 FY18 FY19 FY20
Thou
sand
Uni
ts
Production & Imports Statistics
Cars imported (New & Used)
• Domestic car production grew at a CAGR of ~10% over the past six fiscal years (FY13-19) while weak market demand due to challenging macroeconomic environment (further impacted by Covid-19 pandemic and its consequent lockdowns in 4Q’FY20) led to a sharp decline in production in the outgoing year FY20.
• Due to continuous slowdown in demand, all local auto manufacturers observed several non-production days (NPDs) in order to rationalize operational costs and maintain optimum inventory levels.
• Given stringent import compression policies being pursued by the government, car imports have declined considerably over the last two fiscal years while share of imported cars in overall auto industry has also reduced to 12% (FY19: 15%; FY18: 27%) in FY20.
Domestic car production (Passenger Cars, LCVs, Jeeps & Pickups)
55
30 33
54 59
70
36
13
0
10
20
30
40
50
60
70
80
FY13 FY14 FY15 FY16 FY17 FY18 FY19 FY20
Thou
sand
Uni
ts

6
VIS Credit Rating Company Limited
Sales Statistics Domestic car sales (Passenger Cars, LCVs, Jeeps & Pickups)
• Passenger car sales have reduced by more than one-half on account of significant price hikes and depressed economic activity due to macro economic adjustments and intermittent lockdowns imposed by the government to curb Covid-19 pandemic post March’20.
• Price increase was a function of currency devaluation and imposition of taxes and duties on import of CKD kits and raw materials.
• Share of financing in auto sales has remained depressed (due to high interest rates) over the last two years. Auto financing had grown at a CAGR of ~31% during (2014-2018) but the same increased by only 4% during 2019 which negatively affected auto sales in both commercial (commercial vehicles) as well as the consumer segments (passenger vehicles).
• Pak Suzuki has maintained the leading position (in terms of volume) in passenger car segment for over last 10 years. This is followed by Indus Motors and Honda Atlas Cars.
135 137
180
218 213
259 241
112
0%
10%
20%
30%
40%
50%
60%
70%
-
50
100
150
200
250
300
FY13 FY14 FY15 FY16 FY17 FY18 FY19 FY20
Tho
usan
d U
nits
Locally Manufactured Vehicles - LHS Honda Atlas Cars - RHS Indus Motors - RHS Pak Suzuki - RHS

7
VIS Credit Rating Company Limited
Sales Statistics
• Despite macro economic challenges, launch of Suzuki Alto along with the consumers’ shift towards low priced segment resulted in an increase in share of ‘Upto 800cc’ passenger cars in FY20.
• Given recent decline in interest rate by around 625bps during a 4-month period (from March to June 2020), auto-financing is expected to pick up pace in the medium-term.
• Going forward, demand for auto sales is expected to rebound in 2021 and the same may emanate from rural economy given the recent announcement of agriculture package along with reduction in GIDC (resulting in lower urea prices), higher sugar cane prices (during MY20 season) and aggressive wheat procurement program (support prices have also increased) will provide support to farmers’ liquidity, rural economy and low-income urban segments.
Sales & percentage breakup of local passenger cars
119 118
151 181 186
217 208
96
0%
10%
20%
30%
40%
50%
60%
50
100
150
200
250
FY13 FY14 FY15 FY16 FY17 FY18 FY19 FY20
Thou
sand
Uni
ts
Passenger Cars - LHS 1,300 CC & Above - RHS 1000 CC - RHS Upto 800 CC - RHS

VIS Credit Rating Company Limited
8
Passenger Cars Segment
• Owing to debottlenecking undertaken by Indus Motors, overall capacity of top 3 industry players (Honda Atlas Cars, Indus Motors & Pak Suzuki) has increased to 266K per annum. Nevertheless, utilization level has declined in the outgoing fiscal year.
• Indus Motors has maintained an edge over its competitors in terms of capacity utilization whereas Pak Suzuki has the largest capacity in local OEMs segment.
• Competition Commission of Pakistan (CCP) describe Pakistan’s automobile industry as uncompetitive; however, with new entrants in race, it is expected that competition will enhance and industry will witness a shift in market structure in the long term.
• Absence of incentives for existing players in AIDP-II will dent long term competitive dynamics in favor of new entrants.
Capacity utilization of top 3 industry players Average localization levels of top 3 auto manufacturers
60%
40% 35%
Pak Suzuki Indus Motors Honda Atlas Cars0%
20%
40%
60%
80%
100%
120%
140%
2013 2014 2015 2016 2017 2018 2019
Honda Atlas Cars Pak Suzuki Indus Motors Industry

VIS Credit Rating Company Limited
9
Cost Structure & Key Business Risk Factors
Major dependence on currencies G.P margins & Steel prices (Hot Rolled Coil)
• Major input costs for automobile manufacturers are: - Imported raw material (high foreign exchange risk) - Steel prices (Hot rolled coil – base steel product used in car manufacturing)
• Following the US-China trade war, steel prices in the international market have remained depressed which favors the auto industry. However, significant rupee devaluation in the last two years has off-set the impact of weak HRC prices.
• Cyclicality in sales due to slow down in GDP growth and frequent policy changes are key business risk factors.
• Long-term demand outlook for automobile sales is considered favorable given low motorization rate (18 vehicles per 1000 people) and projected rise in per capita income.
-
1
2
3
4
5
6
- 20 40 60 80
100 120 140 160 180 200
2013 2014 2015 2016 2017 2018 2019
Malaysian Ringgit - LHS U.S. Dollar - LHSEuro - LHS Japnese Yen - RHSThai Baht - RHS
400
450
500
550
600
650
700
02468
101214161820
FY13 FY14 FY15 FY16 FY17 FY18 FY19Honda Atlas Cars - LHS Pak Suzuki - LHSIndus Motors - LHS HRC Prices (USD/Ton) - RHS
10
VIS Credit Rating Company Limited
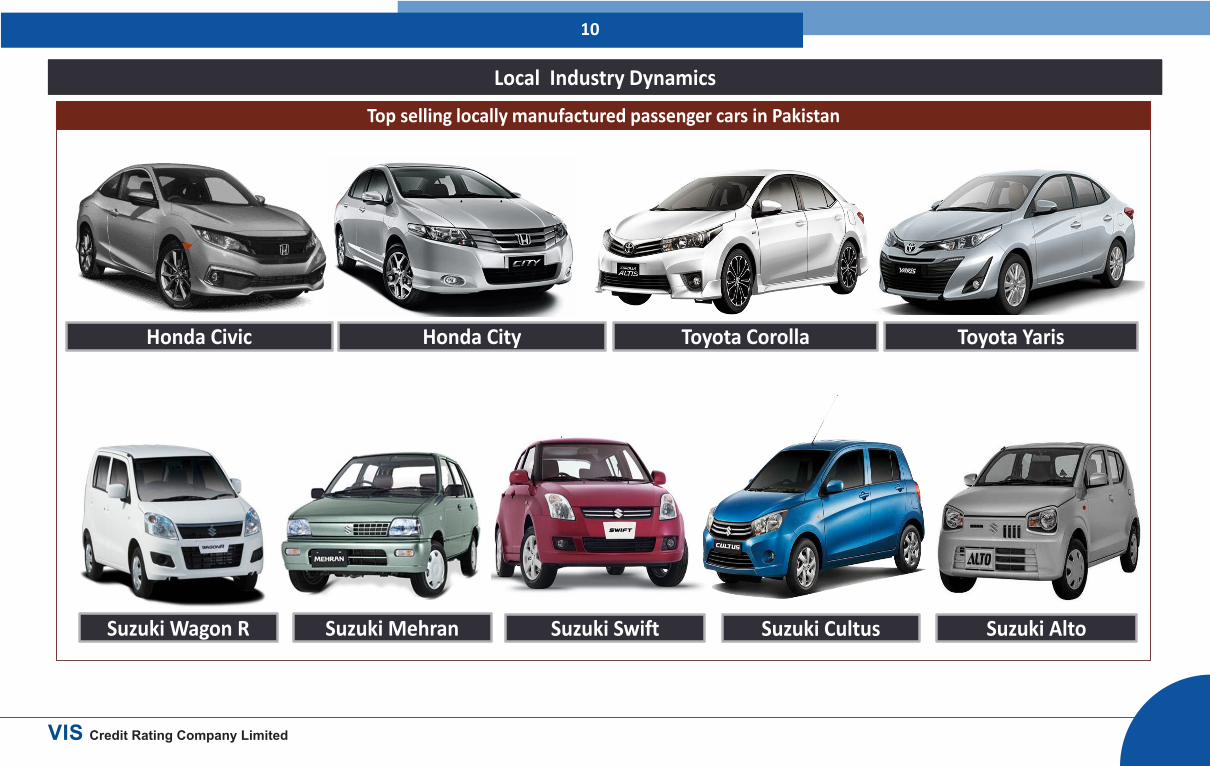
Local Industry Dynamics
Toyota Corolla Honda Civic Honda City
Top selling locally manufactured passenger cars in Pakistan
Suzuki Wagon R Suzuki Mehran Suzuki Swift Suzuki Cultus
Toyota Yaris
Suzuki Alto

11
VIS Credit Rating Company Limited
Local Industry Dynamics
Top selling locally manufactured LCVs, Jeeps & Pick-Ups
Suzuki Ravi Pickup
Toyota Fortuner Toyota Hilux Honda BRV
JAC Pickup

12
VIS Credit Rating Company Limited
New Entrants
Sportage Picanto
KIA – Lucky Motors
Project Status: Greenfield
C.O.D: Sept’2019
Capacity: 25,000 – 30,000 units
Product Type: PC, SUV/MPV & CV
Shareholding:
- KIA Motors Corporation (70%) - Lucky Cement (30%)
Products launched
Grand Carnival
• KIA Lucky Motors received an impressive response from the market on Picanto and Sportage.
• As per the data source, KIA is booking 1.5K to 2K cars per months. If this momentum continues, estimated annuals sales will be reported at 18K to 24K units.
• The company is planning to launch 2-4 new models before June, 2021 to avail low tax benefits of the automotive policy (2016 – 2021).
• KIA has a tax holiday period of 10 years.
13
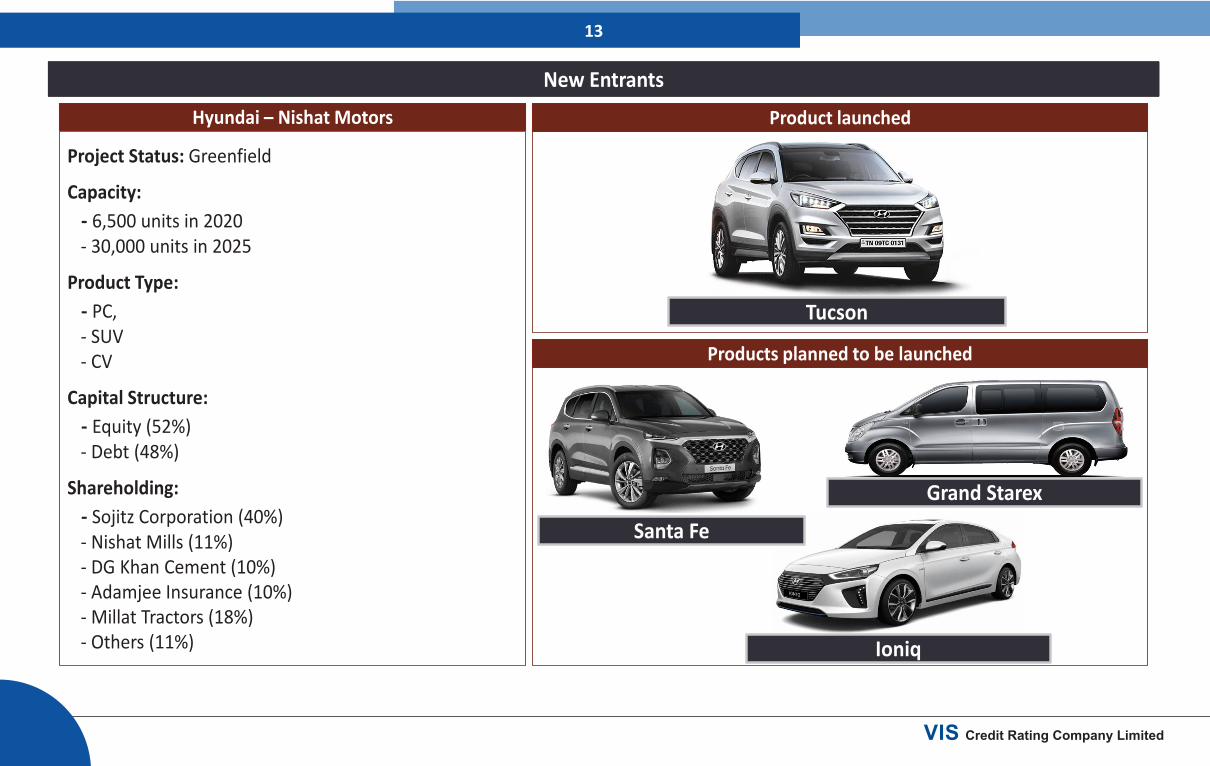
New Entrants Hyundai – Nishat Motors
Project Status: Greenfield
Capacity:
- 6,500 units in 2020 - 30,000 units in 2025
Product Type:
- PC, - SUV - CV
Capital Structure:
- Equity (52%) - Debt (48%)
Shareholding:
- Sojitz Corporation (40%) - Nishat Mills (11%) - DG Khan Cement (10%) - Adamjee Insurance (10%) - Millat Tractors (18%) - Others (11%)
Product launched
Tucson
Products planned to be launched
Ioniq
Santa Fe
Grand Starex
VIS Credit Rating Company Limited

14
VIS Credit Rating Company Limited
Commercial Vehicle Segment
Commercial vehicles sold (Buses & Trucks)
• Domestic commercial vehicle sales also reduced by half in FY20 vis-à-vis previous year in view of slow down in GDP and depressed trading activity due to Covid-19 pandemic.
• Besides shrinking of overall automobile industry pie, share of commercial vehicle segment in overall auto sales has also reduced over the last two years.
• Hino Pak retained its market leadership position (in terms of volume) till FY18 when Isuzu overtook to become the market leader.
Production capacity (FY18)
2.5
3.2 4.7
6.6
8.6
10.1
6.8 3.6
0%
10%
20%
30%
40%
50%
60%
-
2
4
6
8
10
12
FY13 FY14 FY15 FY16 FY17 FY18 FY19 FY20
Thou
sand
s Uni
ts
Buses & Trucks Sold - LHS Hino - RHSNissan - RHS Master - RHSIsuzu - RHS
7.8
5.0 4.8 5.0 4.7 4.9
0%
20%
40%
60%
80%
100%
120%
-
1.0
2.0
3.0
4.0
5.0
6.0
7.0
8.0
9.0
Hino Pak Master Isuzu
Thou
sand
s Uni
ts
Capacity - LHS Production - LHS Utilization -RHS

15
Commercial Vehicle Segment
Top selling brands of Trucks & Buses
Master Motors
Hino Pak
Isuzu
VIS Credit Rating Company Limited

16
VIS Credit Rating Company Limited
Auto Development Policy (2016 – 2021)
Particular Greenfield Investment Brownfield Investment
Definition
Installation of new and independent automotive assembly and manufacturing facilities by an investor for the production of vehicles of a make not already
being assembled/manufactured in Pakistan
Revival of an existing assembly and/or manufacturing facilities, that is non-operational or closed before July 01, 2013 and the make is not in production in Pakistan since
that date. Revival may be undertaken either independently by original owners or new investors or
under JV agreement with foreign principal or by foreign principal independently through purchase of plant
Plant Duty free import of plant & machinery for assembly/ manufacturing on a one time basis -
Test Models Import of 100 vehicles of the same variant in CBU
form at 50% of the prevailing duty for test marketing after groundbreaking of the project
-
Custom Duty 10% on non-localized part (30% for current players) 25% on localized parts (45% for current players)
10% on non localized parts (30% for current players) 25% on localized parts (45% for current players)
Incentive Applicability 5 years for Cars & LCVs 3 years for Cars & LCVs
Truck, Buses & Prime Mover
Import of all parts at prevailing custom duty applicable to non-localized parts for manufacturing of trucks, buses and prime movers for a period of three
years
-
Motorcycles Existing policy for motorcycles as approved by Govt. -

17
Financial Profile (Key Figures & Ratios)
(Rs. in millions) Pak Suzuki Honda Atlas Cars Indus Motors
Dec-17 Dec-18 Dec-19 Mar-20* Mar’17 Mar-18 Mar-19 Mar-20 June-17 June-18 June-19 Mar-20*
Net Sales 101,812 119,854 116,548 17,741 62,803 91,523 95,128 55,046 112,272 139,715 157,996 75,830
Gross Profit Margin (%) 9.5% 5.9% 1.7% 3.2% 14.5% 11.4% 7.7% 7.4% 17.7% 17.1% 12.1% 10.3%
Net Profit Margin (%) 3.8% 1.1% -2.5% -5.3% 9.8% 7.1% 4.0% 1.2% 11.6% 11.3% 8.7% 6.6%
FFO 1,566 868 (2,119) 911 6,944 5,953 3,997 2,575 11,994 15,719 10,156 5,165
Total Debt - 11,310 32,527 31,336 - - - 2,332 - - 81 228
FFO/ Total Debt (%) - 8% -7% 12% - - - 110.4% - - 12609% 3014%
Leverage (x) 0.72 1.10 1.99 2.05 2.94 2.44 0.79 0.92 1.05 1.23 0.62 0.65
Gearing (x) - 0.39 1.25 1.25 - - - 0.14 - - 0.0 0.01
Total Liabilities 21,361 32,277 51,709 51,146 38,432 41,735 14,010 15,285 32,683 45,181 24,738 27,350
Total Equity 29,550 29,233 25,951 25,002 13,065 17,073 17,627 16,557 31,197 36,744 40,045 41,846
Current Ratio (x) 1.9 1.4 1.1 1.1 1.2 1.3 1.9 1.8 1.8 1.7 2.1 1.9
(Stock in Trade + Trade Debt)/ Borrowings (x) - 2.6 1.2 1.3 - - - 5.2 - - - -
*Ratio Annualized
VIS Credit Rating Company Limited

18
Sources
• Pakistan Economic Survey 2018-2019 • Index Mundi • Global Automobile Industry Data – Statista/Focus2move • PAMA production & sales data • PSX Notices • EPA Sindh report • World Bank data • IMC Annual Reports Analysts’ Contacts
Talha Iqbal Choangalia Senior Manager [email protected] Muhammad Tabish Assistant Manager [email protected]
VIS Credit Rating Company Limited