automotive aftermarket outlook and reflections …
TRANSCRIPT
November 21, 2018
- Please Refer To Important Disclosures On The Last Page -
PRESENTING COMPANIES
10/31/2018 10/31/2017 11/1/2016Company Exchange Ticker Price (a) Price (a) Price (a)AutoZone, Inc NYSE AZO 733.47$ 589.50$ 734.45$ Boyd Group Income Fund (b) TSX BYD.UN 120.31 96.10 81.17 BYD Company Ltd (c) SHE 002594 46.79 62.79 55.57 Cooper Tire & Rubber Co. NYSE CTB 30.89 32.80 35.10 Dana, Inc. " DAN 15.47 30.49 15.00 Donaldson Company, Inc " DCI 51.28 47.21 35.46 Gentex Corporation NASDAQ GNTX 21.05 19.04 15.96 Genuine Parts Co. NYSE GPC 97.92 88.23 86.43 Lear Corporation " LEA 132.90 175.59 121.30 Monro, Inc. NASDAQ MNRO 74.40 49.35 53.32 Motorcar Parts of America, Inc " MPAA 21.18 28.91 26.19 Navistar International Corp NYSE NAV 33.49 42.31 23.01 O'Reilly Automotive, Inc NASDAQ ORLY 320.75 210.95 264.24 Penske Automotive Group NYSE PAG 44.02 46.62 42.83 Rush Enterprises, Inc. NASDAQ RUSHB 35.95 47.59 24.77 Standard Motor Products, Inc NYSE SMP 53.90 43.67 46.88 Superior Industries International, Inc. " SUP 9.83 15.55 22.95 Tenneco, Inc. " TEN 34.43 58.11 56.06 US Auto Parts Network, Inc. NASDAQ PRTS 1.19 2.56 2.27 Veoneer, Inc. NYSE VNE 33.58 N/A N/A
(a) Adjusted for splits and dividends(b) Prices in Canadian Dollars(c) Prices in Chinese RMB
AUTOMOTIVE AFTERMARKET OUTLOOK AND REFLECTIONS FROM OUR
42nd ANNUAL SYMPOSIUM October 29 – October 30, 2018
GAMCO Investors, Inc. One Corporate Center Rye, NY 10580-1435 Tel (914) 921-5150 www.gabelli.com
Brian C. Sponheimer Auto & Cap. Equip. Research (914) 921-8336
A. Carolina Jolly, CFA Research Analyst (914) 921-7762
Shawn Kim Research Analyst (914) 921-8364

2
3
TABLE OF CONTENTS
PAGE SYMPOSIUM REFLECTIONS 2 THE AUTOMOTIVE AFTERMARKET 6 AUTO DEALERS 19 AUTO SUPPLIERS 19 COMMERCIAL TRUCKING 23 COMPANIES AUTOZONE, INC. 24 BOYD GROUP INCOME FUND 26 COOPER TIRE & RUBBER 28 DANA, INC. 30 DONALDSON COMPANY INC. 32 GENTEX 34 GENUINE PARTS CO. 36 LEAR CORP. 38 MONRO MUFFLER BRAKE, INC. 40 MOTORCAR PARTS OF AMERICA 42 NAVISTAR INTERNATIONAL, INC. 44 O’REILLY AUTOMOTIVE, INC. 46 PENSKE AUTOMOTIVE GROUP, INC. 48 RUSH ENTERPRISES, INC. 50 STANDARD MOTOR PRODUCTS, INC. 52 SUPERIOR INDUSTRIES 54 TENNECO, INC. 56 US AUTO PARTS NETWORK, INC. 58 VEONEER 60 SAVE THE DATE! 62
1
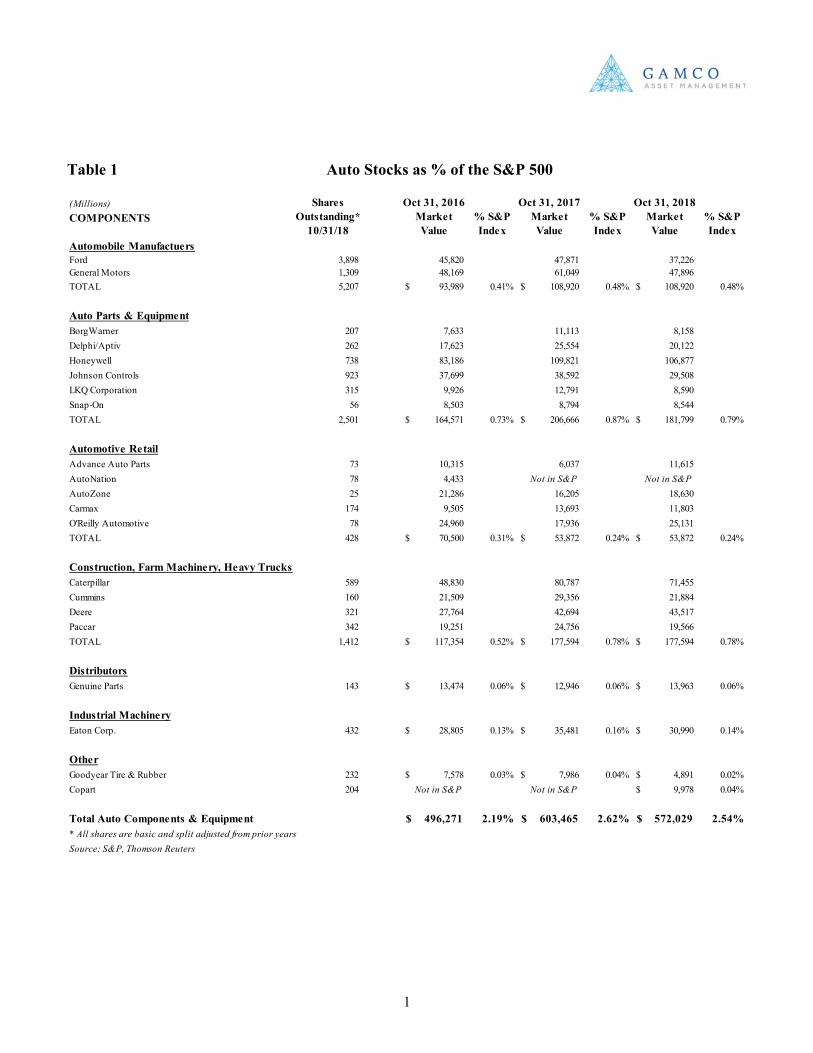
Table 1 Auto Stocks as % of the S&P 500
(Millions) COMPONENTS
Shares Outstanding*
10/31/18
Oct 31, 2016 Market Value
% S&P Index
Oct 31, 2017 Market Value
% S&P Index
Oct 31, 2018 Market Value
% S&P Index
Automobile ManufactuersFord 3,898 45,820 47,871 37,226 General Motors 1,309 48,169 61,049 47,896 TOTAL 5,207 93,989$ 0.41% 108,920$ 0.48% 108,920$ 0.48%
Auto Parts & EquipmentBorgWarner 207 7,633 11,113 8,158 Delphi/Aptiv 262 17,623 25,554 20,122 Honeywell 738 83,186 109,821 106,877 Johnson Controls 923 37,699 38,592 29,508 LKQ Corporation 315 9,926 12,791 8,590 Snap-On 56 8,503 8,794 8,544 TOTAL 2,501 164,571$ 0.73% 206,666$ 0.87% 181,799$ 0.79%
Automotive RetailAdvance Auto Parts 73 10,315 6,037 11,615 AutoNation 78 4,433 Not in S&P Not in S&PAutoZone 25 21,286 16,205 18,630 Carmax 174 9,505 13,693 11,803 O'Reilly Automotive 78 24,960 17,936 25,131 TOTAL 428 70,500$ 0.31% 53,872$ 0.24% 53,872$ 0.24%
Construction, Farm Machinery, Heavy TrucksCaterpillar 589 48,830 80,787 71,455 Cummins 160 21,509 29,356 21,884 Deere 321 27,764 42,694 43,517 Paccar 342 19,251 24,756 19,566 TOTAL 1,412 117,354$ 0.52% 177,594$ 0.78% 177,594$ 0.78%
DistributorsGenuine Parts 143 13,474$ 0.06% 12,946$ 0.06% 13,963$ 0.06%
Industrial MachineryEaton Corp. 432 28,805$ 0.13% 35,481$ 0.16% 30,990$ 0.14%
OtherGoodyear Tire & Rubber 232 7,578$ 0.03% 7,986$ 0.04% 4,891$ 0.02%Copart 204 Not in S&P Not in S&P 9,978$ 0.04%
Total Auto Components & Equipment 496,271$ 2.19% 603,465$ 2.62% 572,029$ 2.54%* All shares are basic and split adjusted from prior yearsSource: S&P, Thomson Reuters
2
SYMPOSIUM REFLECTIONS Aftermarket: Technology dominates industry conversation, demographic tailwinds prevail • Key demographic drivers continue to act as tailwinds for the automotive aftermarket: unemployment remains
low, wages are up, at $2.69 gas prices remain below peak 2014 levels of ~$3.70, the average age of the vehicle continued to climb to 11.7 years, and annual miles driven increased 0.4% to 3.2 trillion. Further, the aftermarket sweet spot population (those vehicles aged 6-11 years) will begin to increase after several years of headwinds from low new car sales during 2008-2011. Slight deceleration in miles driven could be in response to higher gas prices ($2.86 around the time of our conference) though we note recent declines in fuel prices.
• At 47% of the US store base, the “Big 4” (ORLY, AZO, GPC, AAP) continue to project opportunities to
expand their respective store bases amidst a static auto parts store population. Further, in addition to GPC acquiring European distribution AAG, there was more talk of potential acquisitions into international geographies. This continued consolidation has further driven volume discounts and payables in the face of increasing interest rates.
• New distribution channels are a hot topic of conversation in the aftermarket; however, understanding the customer is key. Required delivery speeds across hundreds of thousands of SKUs, along with in-person professional service, create barriers to entry as some DIFM distributors can deliver to underlying repair shops within 30-45 minutes and provide repair assistance at the actual store. Given that these investments are required to compete, the US market is most likely watching the success of Alibaba’s integration of CarZone, an automotive parts distributor, and QCCR, a repair chain operator.
• According to the AASA, aftermarket e-Tailing is expected to grow to $14.4 billion in 2021. However, the
majority of the parts sold online are discretionary parts that have transitioned over the last 5-10 years. Some estimate that only ~$1 billion of AMZN aftermarket sales correlate with categories sold by the “Big 4.”
• E-commerce could potentially increase price transparency which may pressure gross margins. Many suppliers are reviewing MRP (minimum resale price) pricing to maintain the value of certain parts.
• While the aftermarket has faced deflation over the last several years, increasing freight/labor costs, rising
interest rates, and tariffs will most likely drive inflation over the next year. Historically, the aftermarket distributors have been able to push price through while holding gross profit margin constant, driving profit and earnings. To date, price increases offset the September Chinese tariffs, and many expect to push through looming 25% January tariffs, noting that the impact is mainly on part components and not total sale price. • •
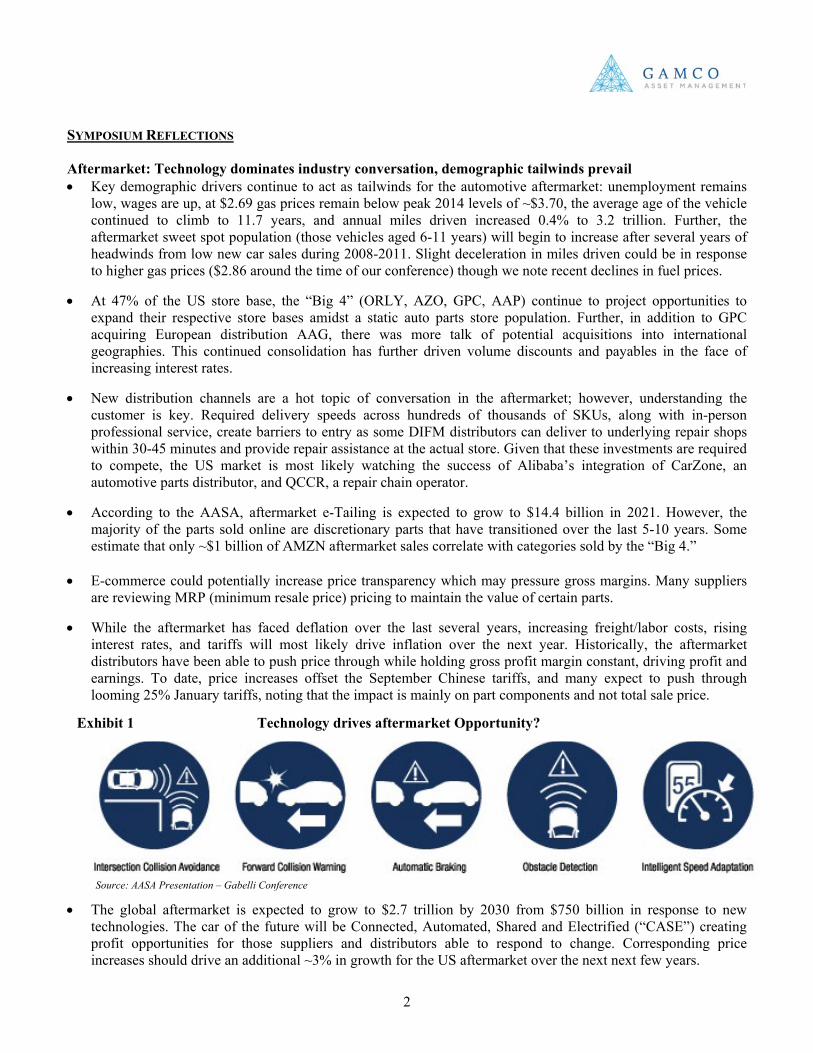
• The global aftermarket is expected to grow to $2.7 trillion by 2030 from $750 billion in response to new technologies. The car of the future will be Connected, Automated, Shared and Electrified (“CASE”) creating profit opportunities for those suppliers and distributors able to respond to change. Corresponding price increases should drive an additional ~3% in growth for the US aftermarket over the next next few years.
Exhibit 1 Technology drives aftermarket Opportunity?
Source: AASA Presentation – Gabelli Conference
3
• The AASA estimates that mobility and automated mega-trends could lead to an additional 2 trillion global miles driven (from ~6 trillion) by 2040. The subsequent wear-and-tear on vehicles in operation is a positive.
• The transition to more autonomous and electric vehicle provides value opportunities for the US aftermarket. Fully electric vehicles are expected to comprise less than 5% of the nearly 290 million vehicle population by 2030; however, these more complex parts are expected to grow +35% relative to the low single digit growth of current categories.
• Increased technology is expected to drive DIFM share by 3-4% by 2025. Currently, the aftermarket is fighting
to ensure that parts suppliers are able to gain telematics data in the future to better compete against OEMs as vehicles age past warranty. Further, increasing complexity in parts requires higher repair shop investment, often including technician training, which should benefit both larger independent chains and the dealers.
Dealers: Preparing for the Short Term and the Long • Current SAAR environment expected to remain healthy. Penske comments essentially echoed those of its
peers (AN, LAD, etc.) on their respective 3rd quarter calls regarding expectations for a steady to slightly lower SAAR environment into 2019. While several multiyear tailwinds, most notably an increasing vehicle age and interest rate declines, had flattened in the first sense and become a headwind in the latter, other major drivers (employment, GDP growth, used vehicle prices, OEM profitability) remain at sufficiently healthy levels to project US Sales in the 16.5+ million unit range next year.
• Storm clouds ahead? Interest rates appear to be the most notable headwind as the calendar turns. Current rates
(~5% for a 60-month new vehicle loan) are still historically low, with every 25bps an approximate $7-8/month headwind for consumers. Thus far, rate increases have hardly dented new vehicle sales, which are likely to end 2018 at roughly 17.1 million. However, average monthly payments continue to be buoyed by higher used vehicle prices, which are helping trade-in values and keeping monthly payment increases at a relatively benign level. Should employment gains wane and used prices decline, the interest rate effect on new units could become more noticeable.
• Resilience in a downturn. PAG was quick to point out the many profit centers available to new vehicle dealers that offer resilience in a declining SAAR environment. First and foremost, a dealer’s Parts & Service business provides a recurring revenue base at high margins that allow dealers to better predict baseline profitability. Additionally, dealers are increasingly focused on growing used vehicle sales, both at franchised locations and at used-only superstores (PAG, AN, SAH to name a few). Further, dealers have looked to augment their businesses via Used Car Superstores and collision centers to further diversify profit lines away from more cyclical new vehicle sales.
• Disruption Opportunities and Challenges. Dealers are often maligned by investors for having no obvious place should autonomous fleets become an eventuality for personal mobility. The hypothesis terribly understates the tremendous value dealers provide customers regarding service, particularly for autonomous vehicles which are expected to have considerably higher utilization. Penske in particularly stands to benefit given its extensive experience in logistics and fleet management at Penske Truck Leasing (of which it owns 28.9%).
4
Suppliers: Focus on company specifics
• Strong year for earnings lost to coming concerns. Nearly every publicly traded automotive OE supplier saw its shares fall during 2018 as a wall of worry crept into investors’ minds regarding potential production declines into 2019. Suppliers at our conference implored investors to focus less on the macro and more on company-specifics, be they business diversification (DAN) and regulatory-driven growth, coupled with financial engineering (TEN).
• Mix & Geography Matters. Heading into 2019, it is important to remember that not all suppliers are created equal. For example, those with diversified end markets are still likely to see increased demand in Commercial Truck & Off Highway markets. Similarly, suppliers with relatively greater US exposure (and in particular component suppliers for North American Crossover, SUV, and Light Truck platforms) are likely to continue to enjoy steady volumes at very high levels of production. Those suppliers most exposed to Europe, where Worldwide Light vehicle Testing Procedures (WLTP) have caused severe operational bottlenecks, will likely continue to see production disruption through the first quarters as automakers adjust to newer, stricter regulations in Europe.
• Asian demand concerns. Suppliers to OEMs with considerable exposure to Chinese markets are facing
visibility issues as demand has softened following the implementation of tariffs on imported vehicles. As prices have risen for all Chinese vehicles, consumers have taken a “pause,” with many OEMs seeing 20% and 30% declines in September and October retail sales in the region. Talks of sales tax cuts to boost demand have helped stocks for now, but the potential for downward revisions to production schedules has increased as a result of escalating trade tensions.
• Looming ICE and Diesel pain. Governments across the globe but most notably in Europe as well as China appear to be accelerating plans to “electrify” light vehicle powertrains at the expense of Internal Combustion Engines (ICE). While noting the term “electrify” includes hybrids- which are likely to be the largest subset of light vehicles with some degree of electric propulsion, an acceleration away from diesel and towards Gas Direct Injection vehicles is becoming more clear. This is likely to be a long term mix headwind for traditional powertrain suppliers, as content per vehicle for gas engines is usually 70 cents on the dollar to diesel-propelled vehicles.
• M&A: Technology & Diversification. OE supplier balance sheets and cash flow have arguably never been
stronger; high profitability levels in strong production years and benefits from fixed cost restructuring have driven free cash flow and helped reduce leverage. The largest deal of the past year was Tenneco’s $5.4 billion purchase of Federal-Mogul (completed in October). The deal provides the opportunity for two significant OE and aftermarket suppliers to merge and then separate into two companies that will benefit not only from scale but also strategic specificity. Elsewhere, suppliers have been increasingly active in expanding technological capabilities. For example, LEA and DAN have sought to expand their presence in the areas of both connectivity and electrification to ensure an important place as automotive technology advances.
5
Commercial Truck: Cautiously Optimistic
• Record Class 8. Strong economic conditions have supported a healthy freight environment that continues to show resiliency heading into 2019. North American Class 8 production is expected to surpass 315,000 units in 2018, up 23% from 2017 (256,000 units). End market strength has been broad-based, with notable demand from energy, construction, and refuse customers. Presenting companies showed tempered optimism for a 2019 market that should be at or slightly above 2018’s record levels.
• Supply chain constraints extend the cycle. The unprecedented order environment has caused numerous friction points across the supply chain, causing production disruptions for OEMs throughout the year. Average lead times for new trucks now extend beyond six months as OEMs are already starting to fill build slots for the second half of 2019. Despite the supply chain issues, cancellation rates have not shown a material increase, suggesting much of the current demand is genuine.
• Stable used truck market. Extended lead times for new trucks have driven incremental used truck demand as time sensitive buyers have had no choice but to buy used trucks as opposed to waiting six months for a new truck. Given the elevated freight environment, shortage of drivers, and aforementioned supply chain constraints, fleets are also holding on to trucks longer to increase and maintain capacity. Presenting companies did not expect near term used truck pricing pressures assuming the broader freight environment remains positive.
• Electric applications. Companies across the commercial vehicle sector are dedicating meaningful
electrification efforts with most agreeing that specific applications such as medium duty, final mile, and urban class 8 make the most sense in the near term due to the “stop and go” and “return to base” nature of such trucks. Presenting companies, including EV truck company, Thor Trucks, expressed skepticism that electric long haul class 8 trucks would be economically viable in the near term given current battery cost and charging infrastructure requirements.
6
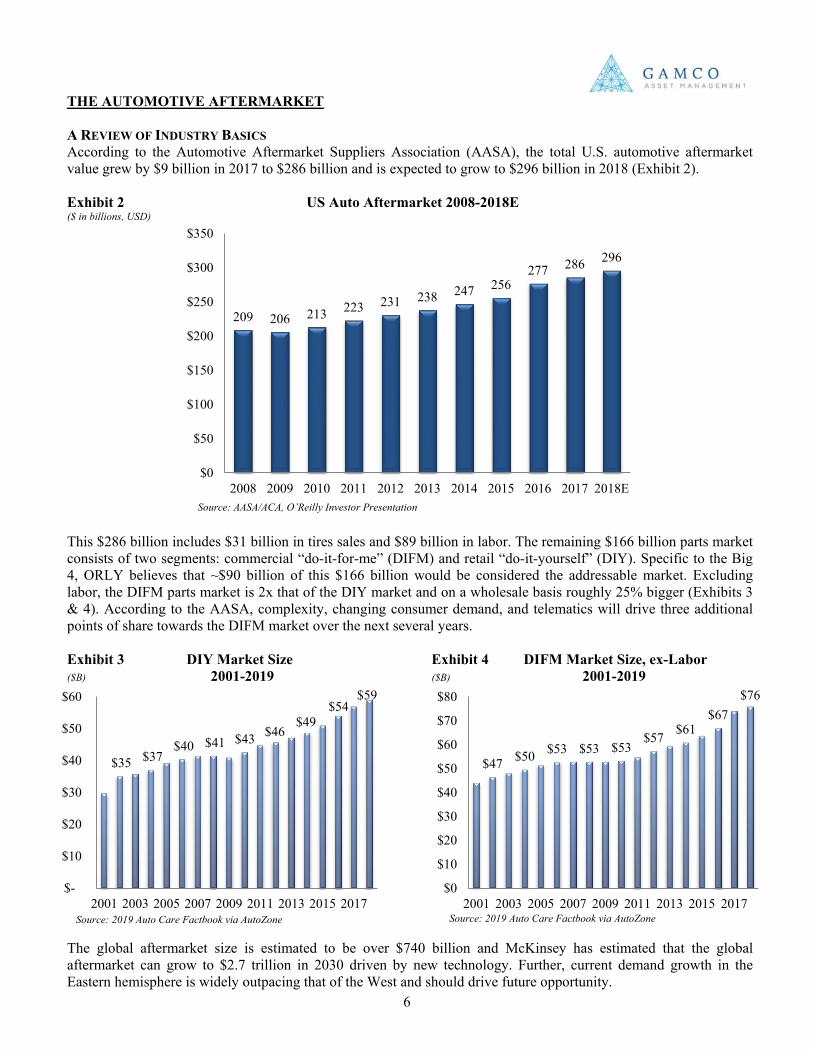
THE AUTOMOTIVE AFTERMARKET A REVIEW OF INDUSTRY BASICS According to the Automotive Aftermarket Suppliers Association (AASA), the total U.S. automotive aftermarket value grew by $9 billion in 2017 to $286 billion and is expected to grow to $296 billion in 2018 (Exhibit 2). Exhibit 2 US Auto Aftermarket 2008-2018E ($ in billions, USD)
This $286 billion includes $31 billion in tires sales and $89 billion in labor. The remaining $166 billion parts market consists of two segments: commercial “do-it-for-me” (DIFM) and retail “do-it-yourself” (DIY). Specific to the Big 4, ORLY believes that ~$90 billion of this $166 billion would be considered the addressable market. Excluding labor, the DIFM parts market is 2x that of the DIY market and on a wholesale basis roughly 25% bigger (Exhibits 3 & 4). According to the AASA, complexity, changing consumer demand, and telematics will drive three additional points of share towards the DIFM market over the next several years. Exhibit 3 DIY Market Size Exhibit 4 DIFM Market Size, ex-Labor ($B) 2001-2019 ($B) 2001-2019
The global aftermarket size is estimated to be over $740 billion and McKinsey has estimated that the global aftermarket can grow to $2.7 trillion in 2030 driven by new technology. Further, current demand growth in the Eastern hemisphere is widely outpacing that of the West and should drive future opportunity.
209 206 213 223 231 238 247 256 277 286 296
$0
$50
$100
$150
$200
$250
$300
$350
2008 2009 2010 2011 2012 2013 2014 2015 2016 2017 2018E
Source: AASA/ACA, O’Reilly Investor Presentation
Source: 2019 Auto Care Factbook via AutoZone
$35 $37 $40 $41 $43 $46
$49 $54
$59
$-
$10
$20
$30
$40
$50
$60
2001 2003 2005 2007 2009 2011 2013 2015 2017
$47 $50 $53 $53 $53 $57 $61
$67 $76
$0
$10
$20
$30
$40
$50
$60
$70
$80
2001 2003 2005 2007 2009 2011 2013 2015 2017Source: 2019 Auto Care Factbook via AutoZone
7
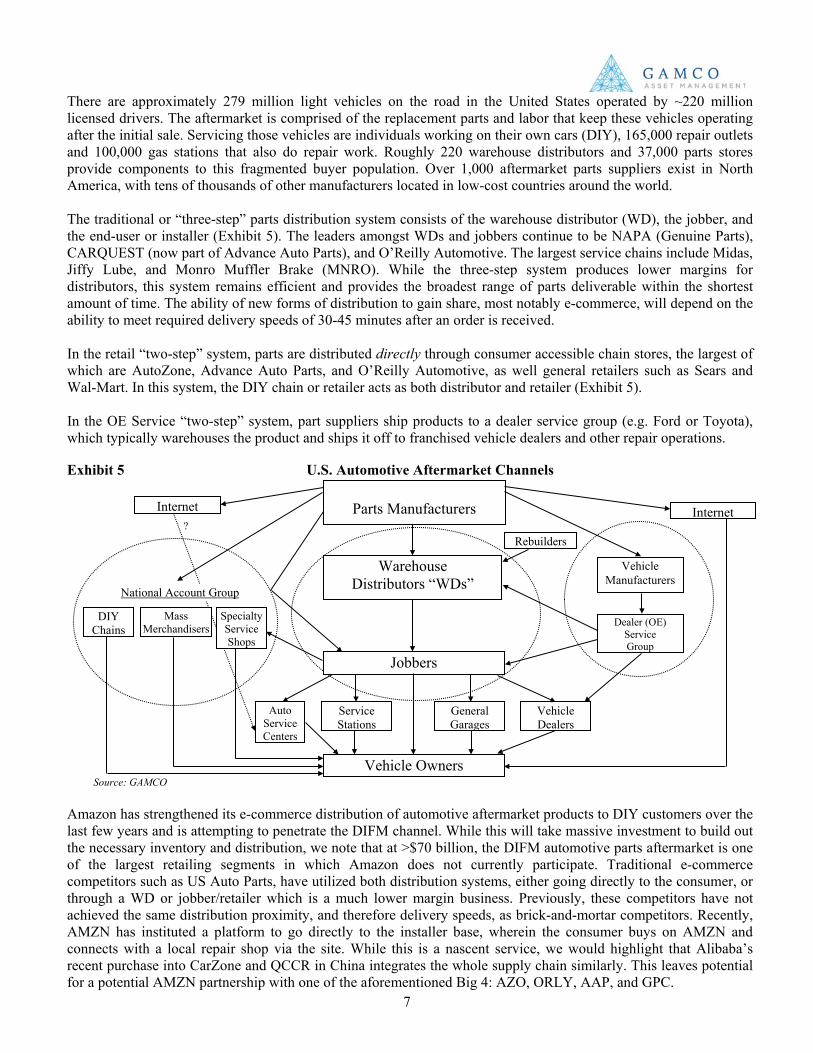
There are approximately 279 million light vehicles on the road in the United States operated by ~220 million licensed drivers. The aftermarket is comprised of the replacement parts and labor that keep these vehicles operating after the initial sale. Servicing those vehicles are individuals working on their own cars (DIY), 165,000 repair outlets and 100,000 gas stations that also do repair work. Roughly 220 warehouse distributors and 37,000 parts stores provide components to this fragmented buyer population. Over 1,000 aftermarket parts suppliers exist in North America, with tens of thousands of other manufacturers located in low-cost countries around the world. The traditional or “three-step” parts distribution system consists of the warehouse distributor (WD), the jobber, and the end-user or installer (Exhibit 5). The leaders amongst WDs and jobbers continue to be NAPA (Genuine Parts), CARQUEST (now part of Advance Auto Parts), and O’Reilly Automotive. The largest service chains include Midas, Jiffy Lube, and Monro Muffler Brake (MNRO). While the three-step system produces lower margins for distributors, this system remains efficient and provides the broadest range of parts deliverable within the shortest amount of time. The ability of new forms of distribution to gain share, most notably e-commerce, will depend on the ability to meet required delivery speeds of 30-45 minutes after an order is received. In the retail “two-step” system, parts are distributed directly through consumer accessible chain stores, the largest of which are AutoZone, Advance Auto Parts, and O’Reilly Automotive, as well general retailers such as Sears and Wal-Mart. In this system, the DIY chain or retailer acts as both distributor and retailer (Exhibit 5). In the OE Service “two-step” system, part suppliers ship products to a dealer service group (e.g. Ford or Toyota), which typically warehouses the product and ships it off to franchised vehicle dealers and other repair operations. Exhibit 5 U.S. Automotive Aftermarket Channels
Amazon has strengthened its e-commerce distribution of automotive aftermarket products to DIY customers over the last few years and is attempting to penetrate the DIFM channel. While this will take massive investment to build out the necessary inventory and distribution, we note that at >$70 billion, the DIFM automotive parts aftermarket is one of the largest retailing segments in which Amazon does not currently participate. Traditional e-commerce competitors such as US Auto Parts, have utilized both distribution systems, either going directly to the consumer, or through a WD or jobber/retailer which is a much lower margin business. Previously, these competitors have not achieved the same distribution proximity, and therefore delivery speeds, as brick-and-mortar competitors. Recently, AMZN has instituted a platform to go directly to the installer base, wherein the consumer buys on AMZN and connects with a local repair shop via the site. While this is a nascent service, we would highlight that Alibaba’s recent purchase into CarZone and QCCR in China integrates the whole supply chain similarly. This leaves potential for a potential AMZN partnership with one of the aforementioned Big 4: AZO, ORLY, AAP, and GPC.
Parts Manufacturers
Warehouse Distributors “WDs”
Jobbers
Auto Service Centers
Service Stations
General Garages
Vehicle Dealers
Vehicle Manufacturers
Dealer (OE) Service Group
Rebuilders
Vehicle Owners
DIY Chains
Mass Merchandisers
Specialty Service Shops
National Account Group
Internet
Source: GAMCO
Internet
?
8
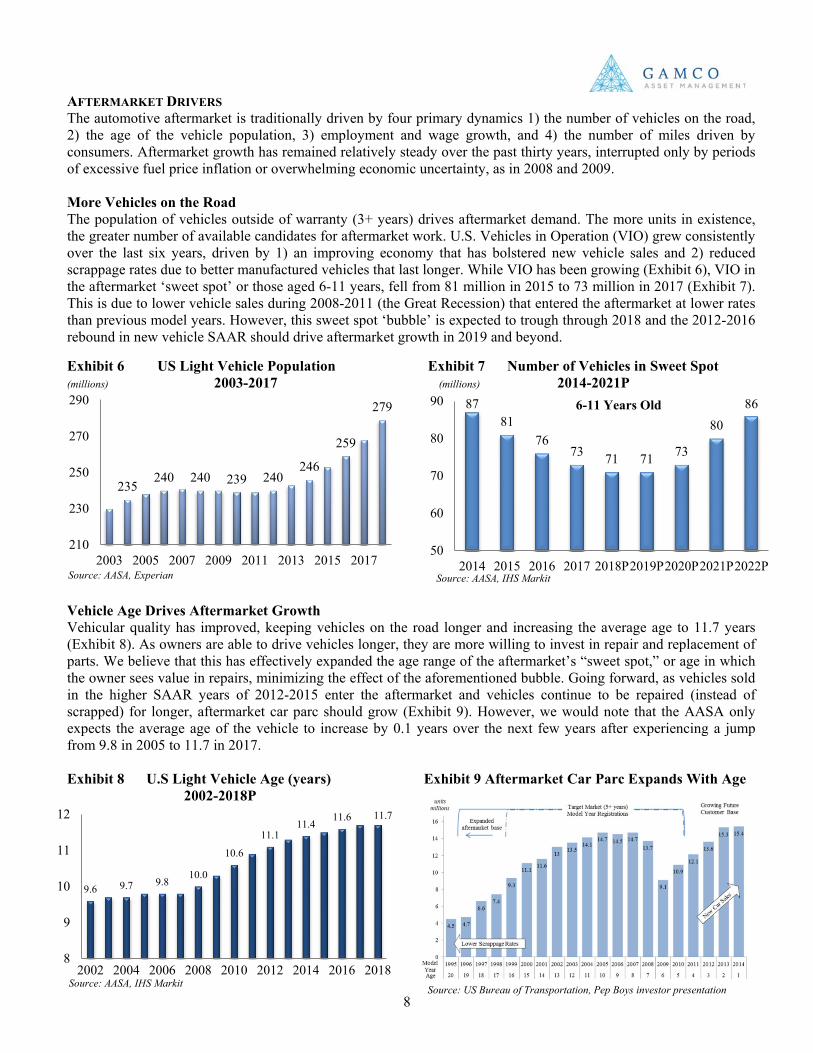
AFTERMARKET DRIVERS The automotive aftermarket is traditionally driven by four primary dynamics 1) the number of vehicles on the road, 2) the age of the vehicle population, 3) employment and wage growth, and 4) the number of miles driven by consumers. Aftermarket growth has remained relatively steady over the past thirty years, interrupted only by periods of excessive fuel price inflation or overwhelming economic uncertainty, as in 2008 and 2009. More Vehicles on the Road The population of vehicles outside of warranty (3+ years) drives aftermarket demand. The more units in existence, the greater number of available candidates for aftermarket work. U.S. Vehicles in Operation (VIO) grew consistently over the last six years, driven by 1) an improving economy that has bolstered new vehicle sales and 2) reduced scrappage rates due to better manufactured vehicles that last longer. While VIO has been growing (Exhibit 6), VIO in the aftermarket ‘sweet spot’ or those aged 6-11 years, fell from 81 million in 2015 to 73 million in 2017 (Exhibit 7). This is due to lower vehicle sales during 2008-2011 (the Great Recession) that entered the aftermarket at lower rates than previous model years. However, this sweet spot ‘bubble’ is expected to trough through 2018 and the 2012-2016 rebound in new vehicle SAAR should drive aftermarket growth in 2019 and beyond. Exhibit 6 US Light Vehicle Population Exhibit 7 Number of Vehicles in Sweet Spot (millions) 2003-2017 (millions) 2014-2021P
Vehicle Age Drives Aftermarket Growth Vehicular quality has improved, keeping vehicles on the road longer and increasing the average age to 11.7 years (Exhibit 8). As owners are able to drive vehicles longer, they are more willing to invest in repair and replacement of parts. We believe that this has effectively expanded the age range of the aftermarket’s “sweet spot,” or age in which the owner sees value in repairs, minimizing the effect of the aforementioned bubble. Going forward, as vehicles sold in the higher SAAR years of 2012-2015 enter the aftermarket and vehicles continue to be repaired (instead of scrapped) for longer, aftermarket car parc should grow (Exhibit 9). However, we would note that the AASA only expects the average age of the vehicle to increase by 0.1 years over the next few years after experiencing a jump from 9.8 in 2005 to 11.7 in 2017. Exhibit 8 U.S Light Vehicle Age (years) Exhibit 9 Aftermarket Car Parc Expands With Age 2002-2018P
235 240 240 239 240
246
259
279
210
230
250
270
290
2003 2005 2007 2009 2011 2013 2015 2017
87 81
76 73 71 71 73
80 86
50
60
70
80
90
2014 2015 2016 2017 2018P2019P2020P2021P2022P
6-11 Years Old
9.6 9.7 9.8 10.0
10.6
11.1 11.4
11.6 11.7
8
9
10
11
12
2002 2004 2006 2008 2010 2012 2014 2016 2018
Source: AASA, Experian
Source: US Bureau of Transportation, Pep Boys investor presentation
Source: AASA, IHS Markit
Source: AASA, IHS Markit
9
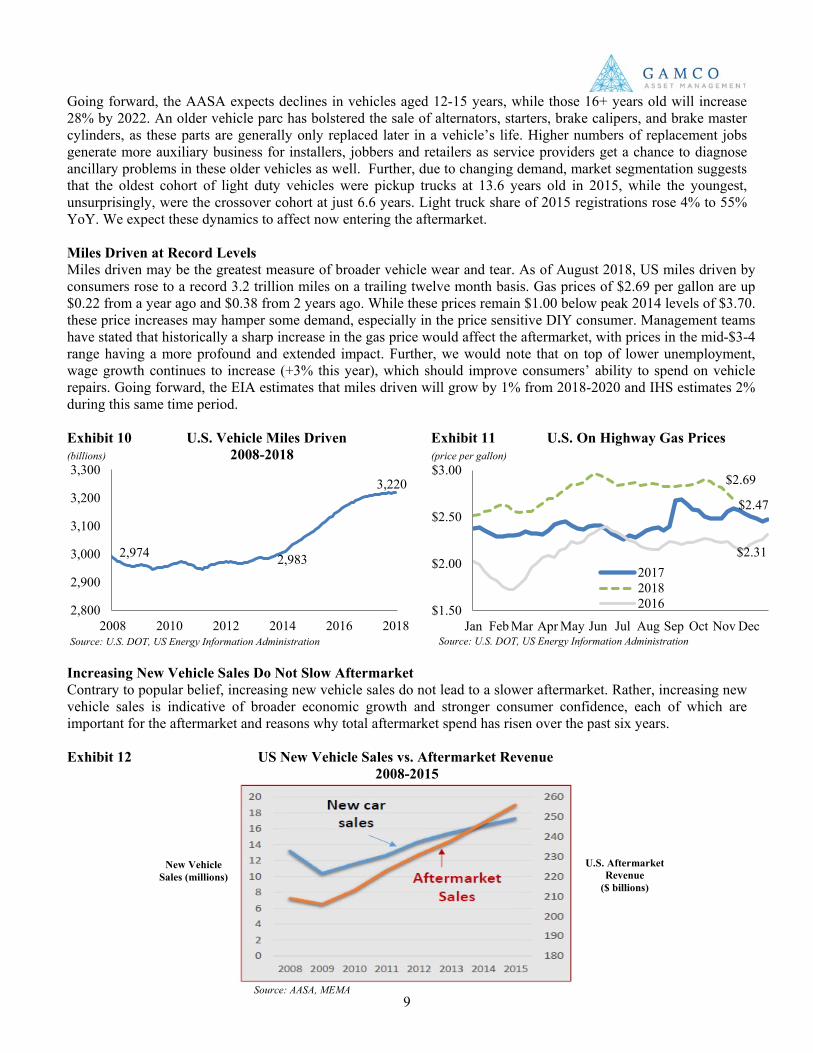
Going forward, the AASA expects declines in vehicles aged 12-15 years, while those 16+ years old will increase 28% by 2022. An older vehicle parc has bolstered the sale of alternators, starters, brake calipers, and brake master cylinders, as these parts are generally only replaced later in a vehicle’s life. Higher numbers of replacement jobs generate more auxiliary business for installers, jobbers and retailers as service providers get a chance to diagnose ancillary problems in these older vehicles as well. Further, due to changing demand, market segmentation suggests that the oldest cohort of light duty vehicles were pickup trucks at 13.6 years old in 2015, while the youngest, unsurprisingly, were the crossover cohort at just 6.6 years. Light truck share of 2015 registrations rose 4% to 55% YoY. We expect these dynamics to affect now entering the aftermarket. Miles Driven at Record Levels Miles driven may be the greatest measure of broader vehicle wear and tear. As of August 2018, US miles driven by consumers rose to a record 3.2 trillion miles on a trailing twelve month basis. Gas prices of $2.69 per gallon are up $0.22 from a year ago and $0.38 from 2 years ago. While these prices remain $1.00 below peak 2014 levels of $3.70. these price increases may hamper some demand, especially in the price sensitive DIY consumer. Management teams have stated that historically a sharp increase in the gas price would affect the aftermarket, with prices in the mid-$3-4 range having a more profound and extended impact. Further, we would note that on top of lower unemployment, wage growth continues to increase (+3% this year), which should improve consumers’ ability to spend on vehicle repairs. Going forward, the EIA estimates that miles driven will grow by 1% from 2018-2020 and IHS estimates 2% during this same time period. Exhibit 10 U.S. Vehicle Miles Driven Exhibit 11 U.S. On Highway Gas Prices (billions) 2008-2018 (price per gallon)
Increasing New Vehicle Sales Do Not Slow Aftermarket Contrary to popular belief, increasing new vehicle sales do not lead to a slower aftermarket. Rather, increasing new vehicle sales is indicative of broader economic growth and stronger consumer confidence, each of which are important for the aftermarket and reasons why total aftermarket spend has risen over the past six years. Exhibit 12 US New Vehicle Sales vs. Aftermarket Revenue
2008-2015
2,974 2,983
3,220
2,800
2,900
3,000
3,100
3,200
3,300
2008 2010 2012 2014 2016 2018
Source: AASA, MEMA
New Vehicle Sales (millions)
U.S. Aftermarket Revenue
($ billions)
Source: U.S. DOT, US Energy Information Administration
Source: U.S. DOT, US Energy Information Administration
$2.47
$2.69
$2.31
$1.50
$2.00
$2.50
$3.00
Jan Feb Mar Apr May Jun Jul Aug Sep Oct Nov Dec
201720182016
10
OTHER AFTERMARKET FACTORS
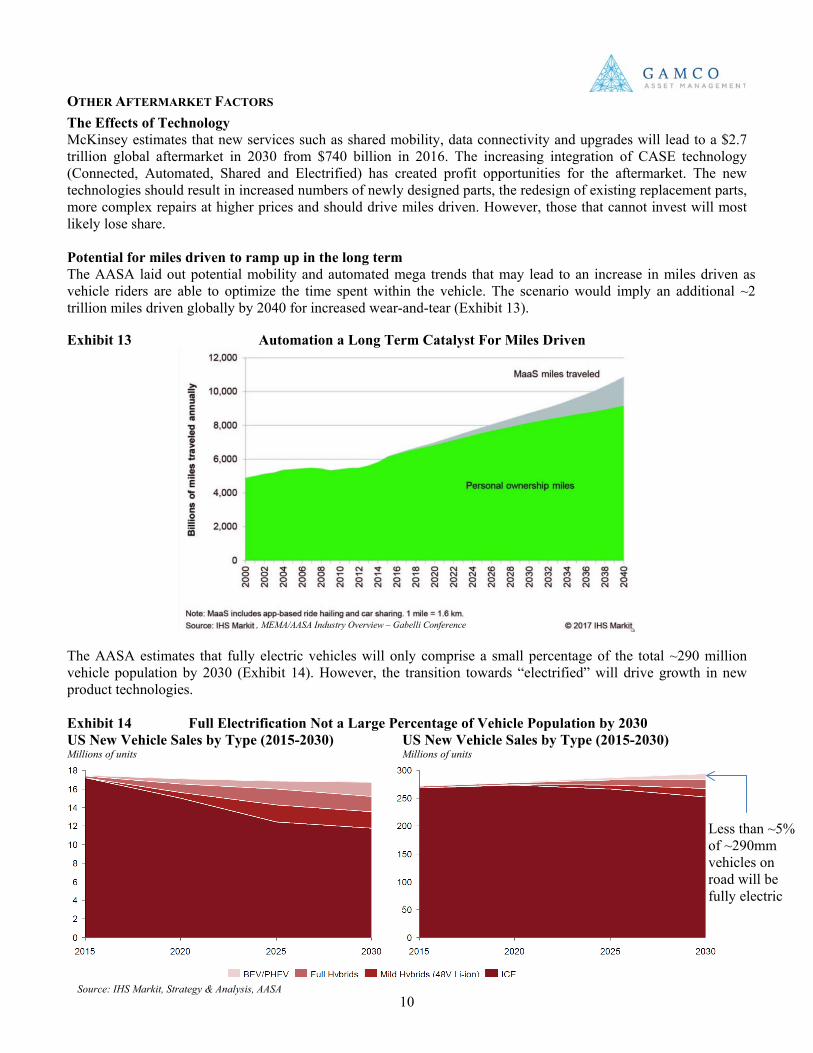
The Effects of Technology McKinsey estimates that new services such as shared mobility, data connectivity and upgrades will lead to a $2.7 trillion global aftermarket in 2030 from $740 billion in 2016. The increasing integration of CASE technology (Connected, Automated, Shared and Electrified) has created profit opportunities for the aftermarket. The new technologies should result in increased numbers of newly designed parts, the redesign of existing replacement parts, more complex repairs at higher prices and should drive miles driven. However, those that cannot invest will most likely lose share. Potential for miles driven to ramp up in the long term The AASA laid out potential mobility and automated mega trends that may lead to an increase in miles driven as vehicle riders are able to optimize the time spent within the vehicle. The scenario would imply an additional ~2 trillion miles driven globally by 2040 for increased wear-and-tear (Exhibit 13). Exhibit 13 Automation a Long Term Catalyst For Miles Driven
The AASA estimates that fully electric vehicles will only comprise a small percentage of the total ~290 million vehicle population by 2030 (Exhibit 14). However, the transition towards “electrified” will drive growth in new product technologies. Exhibit 14 Full Electrification Not a Large Percentage of Vehicle Population by 2030 US New Vehicle Sales by Type (2015-2030) US New Vehicle Sales by Type (2015-2030) Millions of units Millions of units
, MEMA/AASA Industry Overview – Gabelli Conference
Source: IHS Markit, Strategy & Analysis, AASA
Less than ~5% of ~290mm vehicles on road will be fully electric
11
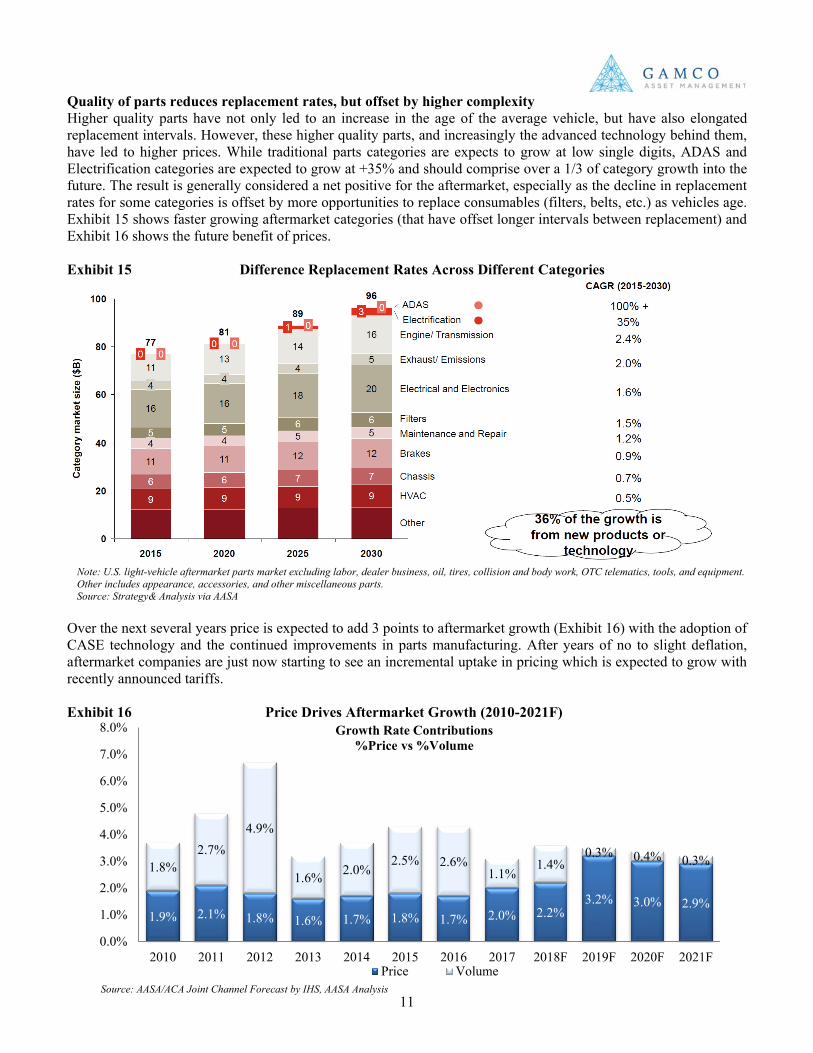
Quality of parts reduces replacement rates, but offset by higher complexity Higher quality parts have not only led to an increase in the age of the average vehicle, but have also elongated replacement intervals. However, these higher quality parts, and increasingly the advanced technology behind them, have led to higher prices. While traditional parts categories are expects to grow at low single digits, ADAS and Electrification categories are expected to grow at +35% and should comprise over a 1/3 of category growth into the future. The result is generally considered a net positive for the aftermarket, especially as the decline in replacement rates for some categories is offset by more opportunities to replace consumables (filters, belts, etc.) as vehicles age. Exhibit 15 shows faster growing aftermarket categories (that have offset longer intervals between replacement) and Exhibit 16 shows the future benefit of prices. Exhibit 15 Difference Replacement Rates Across Different Categories
Over the next several years price is expected to add 3 points to aftermarket growth (Exhibit 16) with the adoption of CASE technology and the continued improvements in parts manufacturing. After years of no to slight deflation, aftermarket companies are just now starting to see an incremental uptake in pricing which is expected to grow with recently announced tariffs. Exhibit 16 Price Drives Aftermarket Growth (2010-2021F)
1.9% 2.1% 1.8% 1.6% 1.7% 1.8% 1.7% 2.0% 2.2% 3.2% 3.0% 2.9%
1.8% 2.7%
4.9%
1.6% 2.0% 2.5% 2.6%
1.1% 1.4%
0.3% 0.4% 0.3%
0.0%
1.0%
2.0%
3.0%
4.0%
5.0%
6.0%
7.0%
8.0%
2010 2011 2012 2013 2014 2015 2016 2017 2018F 2019F 2020F 2021F
Growth Rate Contributions %Price vs %Volume
Price VolumeSource: AASA/ACA Joint Channel Forecast by IHS, AASA Analysis
Note: U.S. light-vehicle aftermarket parts market excluding labor, dealer business, oil, tires, collision and body work, OTC telematics, tools, and equipment. Other includes appearance, accessories, and other miscellaneous parts. Source: Strategy& Analysis via AASA
12
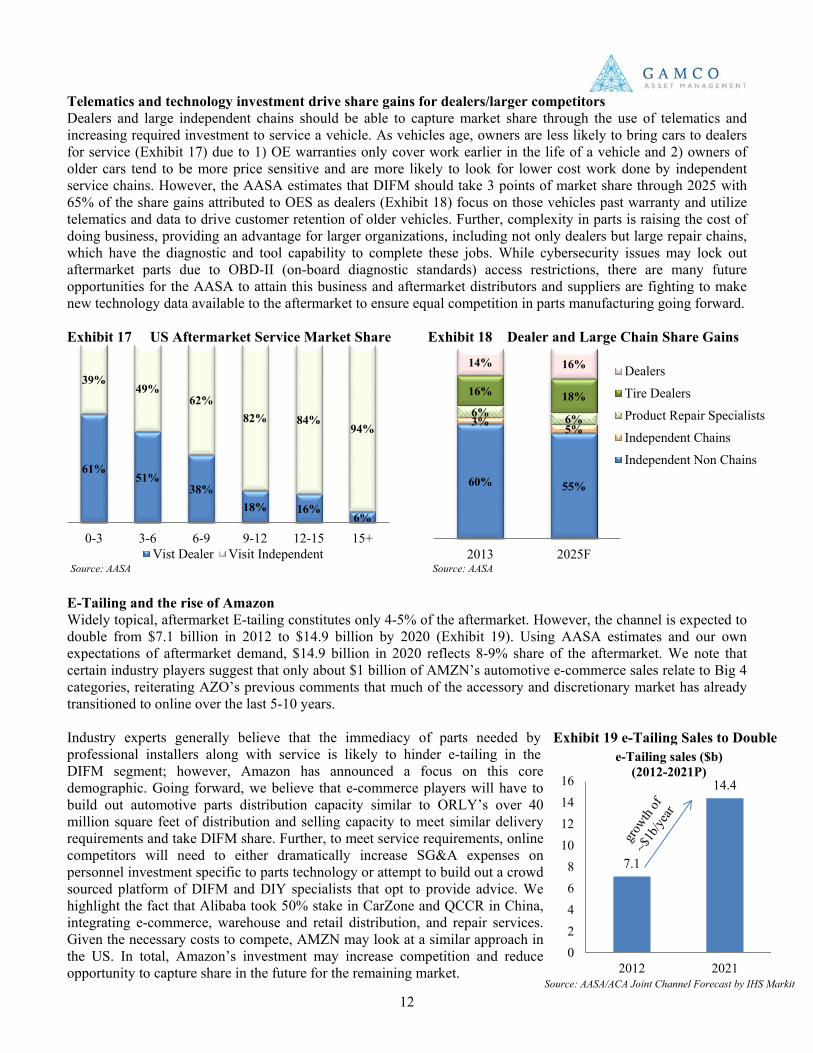
Telematics and technology investment drive share gains for dealers/larger competitors Dealers and large independent chains should be able to capture market share through the use of telematics and increasing required investment to service a vehicle. As vehicles age, owners are less likely to bring cars to dealers for service (Exhibit 17) due to 1) OE warranties only cover work earlier in the life of a vehicle and 2) owners of older cars tend to be more price sensitive and are more likely to look for lower cost work done by independent service chains. However, the AASA estimates that DIFM should take 3 points of market share through 2025 with 65% of the share gains attributed to OES as dealers (Exhibit 18) focus on those vehicles past warranty and utilize telematics and data to drive customer retention of older vehicles. Further, complexity in parts is raising the cost of doing business, providing an advantage for larger organizations, including not only dealers but large repair chains, which have the diagnostic and tool capability to complete these jobs. While cybersecurity issues may lock out aftermarket parts due to OBD-II (on-board diagnostic standards) access restrictions, there are many future opportunities for the AASA to attain this business and aftermarket distributors and suppliers are fighting to make new technology data available to the aftermarket to ensure equal competition in parts manufacturing going forward. Exhibit 17 US Aftermarket Service Market Share Exhibit 18 Dealer and Large Chain Share Gains
E-Tailing and the rise of Amazon Widely topical, aftermarket E-tailing constitutes only 4-5% of the aftermarket. However, the channel is expected to double from $7.1 billion in 2012 to $14.9 billion by 2020 (Exhibit 19). Using AASA estimates and our own expectations of aftermarket demand, $14.9 billion in 2020 reflects 8-9% share of the aftermarket. We note that certain industry players suggest that only about $1 billion of AMZN’s automotive e-commerce sales relate to Big 4 categories, reiterating AZO’s previous comments that much of the accessory and discretionary market has already transitioned to online over the last 5-10 years. Industry experts generally believe that the immediacy of parts needed by professional installers along with service is likely to hinder e-tailing in the DIFM segment; however, Amazon has announced a focus on this core demographic. Going forward, we believe that e-commerce players will have to build out automotive parts distribution capacity similar to ORLY’s over 40 million square feet of distribution and selling capacity to meet similar delivery requirements and take DIFM share. Further, to meet service requirements, online competitors will need to either dramatically increase SG&A expenses on personnel investment specific to parts technology or attempt to build out a crowd sourced platform of DIFM and DIY specialists that opt to provide advice. We highlight the fact that Alibaba took 50% stake in CarZone and QCCR in China, integrating e-commerce, warehouse and retail distribution, and repair services. Given the necessary costs to compete, AMZN may look at a similar approach in the US. In total, Amazon’s investment may increase competition and reduce opportunity to capture share in the future for the remaining market.
61% 51%
38% 18% 16%
6%
39% 49%
62% 82% 84%
94%
0-3 3-6 6-9 9-12 12-15 15+Vist Dealer Visit Independent
Source: AASA/ACA Joint Channel Forecast by IHS Markit
60% 55%
3% 5% 6% 6%
16% 18%
14% 16%
2013 2025F
Dealers
Tire Dealers
Product Repair Specialists
Independent Chains
Independent Non Chains
Source: AASA
Exhibit 19 e-Tailing Sales to Double
Source: AASA
7.1
14.4
02468
10121416
2012 2021
e-Tailing sales ($b) (2012-2021P)
13
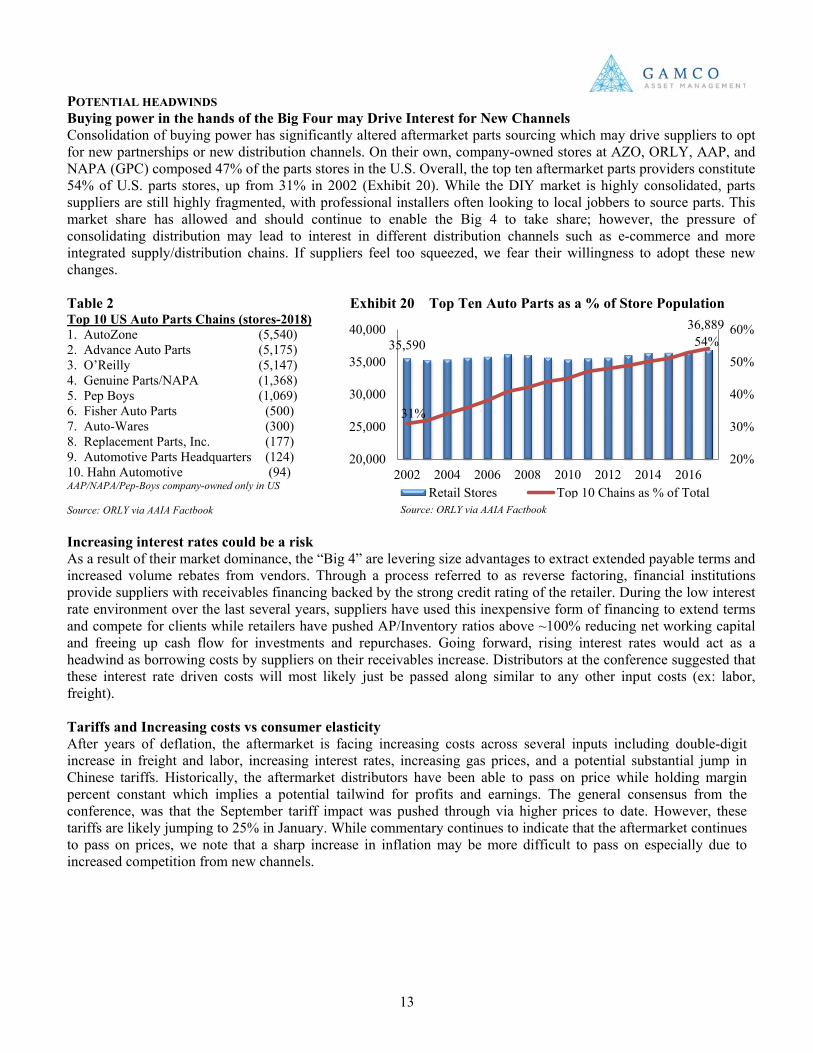
POTENTIAL HEADWINDS Buying power in the hands of the Big Four may Drive Interest for New Channels Consolidation of buying power has significantly altered aftermarket parts sourcing which may drive suppliers to opt for new partnerships or new distribution channels. On their own, company-owned stores at AZO, ORLY, AAP, and NAPA (GPC) composed 47% of the parts stores in the U.S. Overall, the top ten aftermarket parts providers constitute 54% of U.S. parts stores, up from 31% in 2002 (Exhibit 20). While the DIY market is highly consolidated, parts suppliers are still highly fragmented, with professional installers often looking to local jobbers to source parts. This market share has allowed and should continue to enable the Big 4 to take share; however, the pressure of consolidating distribution may lead to interest in different distribution channels such as e-commerce and more integrated supply/distribution chains. If suppliers feel too squeezed, we fear their willingness to adopt these new changes. Table 2 Exhibit 20 Top Ten Auto Parts as a % of Store Population Top 10 US Auto Parts Chains (stores-2018) 1. AutoZone (5,540) 2. Advance Auto Parts (5,175) 3. O’Reilly (5,147) 4. Genuine Parts/NAPA (1,368) 5. Pep Boys (1,069) 6. Fisher Auto Parts (500) 7. Auto-Wares (300) 8. Replacement Parts, Inc. (177) 9. Automotive Parts Headquarters (124) 10. Hahn Automotive (94) AAP/NAPA/Pep-Boys company-owned only in US Source: ORLY via AAIA Factbook Increasing interest rates could be a risk As a result of their market dominance, the “Big 4” are levering size advantages to extract extended payable terms and increased volume rebates from vendors. Through a process referred to as reverse factoring, financial institutions provide suppliers with receivables financing backed by the strong credit rating of the retailer. During the low interest rate environment over the last several years, suppliers have used this inexpensive form of financing to extend terms and compete for clients while retailers have pushed AP/Inventory ratios above ~100% reducing net working capital and freeing up cash flow for investments and repurchases. Going forward, rising interest rates would act as a headwind as borrowing costs by suppliers on their receivables increase. Distributors at the conference suggested that these interest rate driven costs will most likely just be passed along similar to any other input costs (ex: labor, freight). Tariffs and Increasing costs vs consumer elasticity After years of deflation, the aftermarket is facing increasing costs across several inputs including double-digit increase in freight and labor, increasing interest rates, increasing gas prices, and a potential substantial jump in Chinese tariffs. Historically, the aftermarket distributors have been able to pass on price while holding margin percent constant which implies a potential tailwind for profits and earnings. The general consensus from the conference, was that the September tariff impact was pushed through via higher prices to date. However, these tariffs are likely jumping to 25% in January. While commentary continues to indicate that the aftermarket continues to pass on prices, we note that a sharp increase in inflation may be more difficult to pass on especially due to increased competition from new channels.
35,590 36,889
31%
54%
20%
30%
40%
50%
60%
20,000
25,000
30,000
35,000
40,000
2002 2004 2006 2008 2010 2012 2014 2016Retail Stores Top 10 Chains as % of Total
Source: ORLY via AAIA Factbook
14
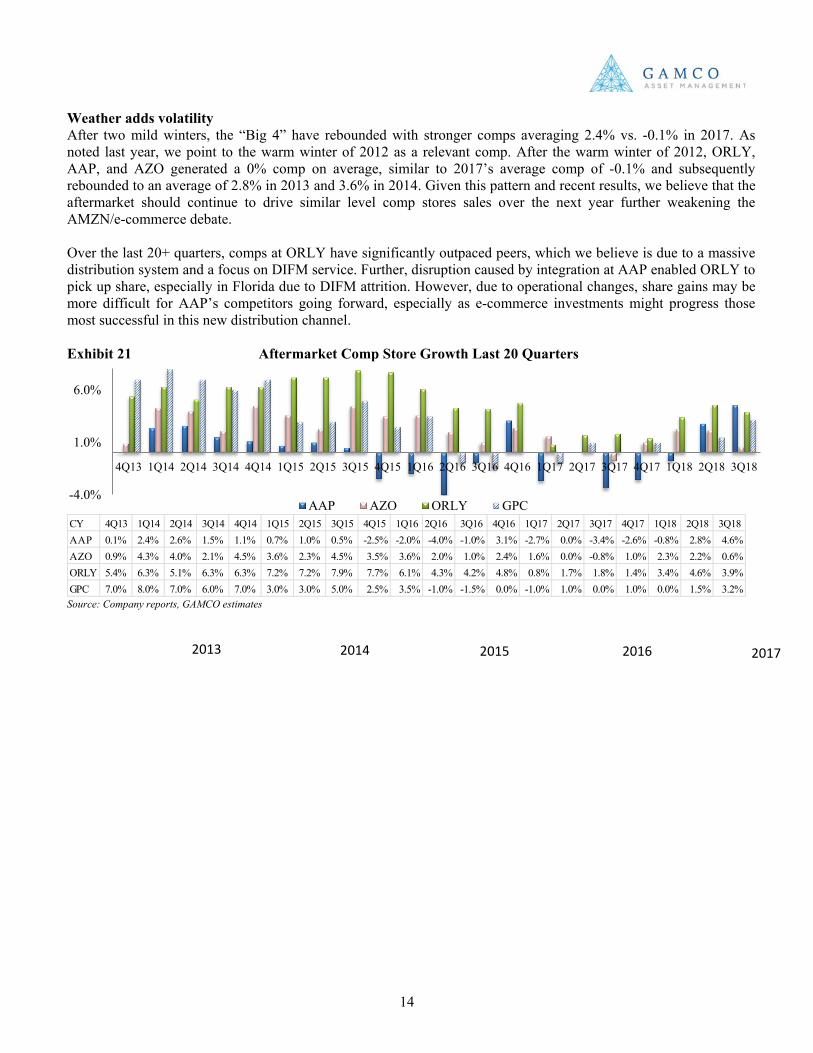
Weather adds volatility After two mild winters, the “Big 4” have rebounded with stronger comps averaging 2.4% vs. -0.1% in 2017. As noted last year, we point to the warm winter of 2012 as a relevant comp. After the warm winter of 2012, ORLY, AAP, and AZO generated a 0% comp on average, similar to 2017’s average comp of -0.1% and subsequently rebounded to an average of 2.8% in 2013 and 3.6% in 2014. Given this pattern and recent results, we believe that the aftermarket should continue to drive similar level comp stores sales over the next year further weakening the AMZN/e-commerce debate. Over the last 20+ quarters, comps at ORLY have significantly outpaced peers, which we believe is due to a massive distribution system and a focus on DIFM service. Further, disruption caused by integration at AAP enabled ORLY to pick up share, especially in Florida due to DIFM attrition. However, due to operational changes, share gains may be more difficult for AAP’s competitors going forward, especially as e-commerce investments might progress those most successful in this new distribution channel. Exhibit 21 Aftermarket Comp Store Growth Last 20 Quarters
Source: Company reports, GAMCO estimates
-4.0%
1.0%
6.0%
4Q13 1Q14 2Q14 3Q14 4Q14 1Q15 2Q15 3Q15 4Q15 1Q16 2Q16 3Q16 4Q16 1Q17 2Q17 3Q17 4Q17 1Q18 2Q18 3Q18
AAP AZO ORLY GPC
2013 2014 2015 2016 2017
CY 4Q13 1Q14 2Q14 3Q14 4Q14 1Q15 2Q15 3Q15 4Q15 1Q16 2Q16 3Q16 4Q16 1Q17 2Q17 3Q17 4Q17 1Q18 2Q18 3Q18AAP 0.1% 2.4% 2.6% 1.5% 1.1% 0.7% 1.0% 0.5% -2.5% -2.0% -4.0% -1.0% 3.1% -2.7% 0.0% -3.4% -2.6% -0.8% 2.8% 4.6%AZO 0.9% 4.3% 4.0% 2.1% 4.5% 3.6% 2.3% 4.5% 3.5% 3.6% 2.0% 1.0% 2.4% 1.6% 0.0% -0.8% 1.0% 2.3% 2.2% 0.6%ORLY 5.4% 6.3% 5.1% 6.3% 6.3% 7.2% 7.2% 7.9% 7.7% 6.1% 4.3% 4.2% 4.8% 0.8% 1.7% 1.8% 1.4% 3.4% 4.6% 3.9%GPC 7.0% 8.0% 7.0% 6.0% 7.0% 3.0% 3.0% 5.0% 2.5% 3.5% -1.0% -1.5% 0.0% -1.0% 1.0% 0.0% 1.0% 0.0% 1.5% 3.2%
15
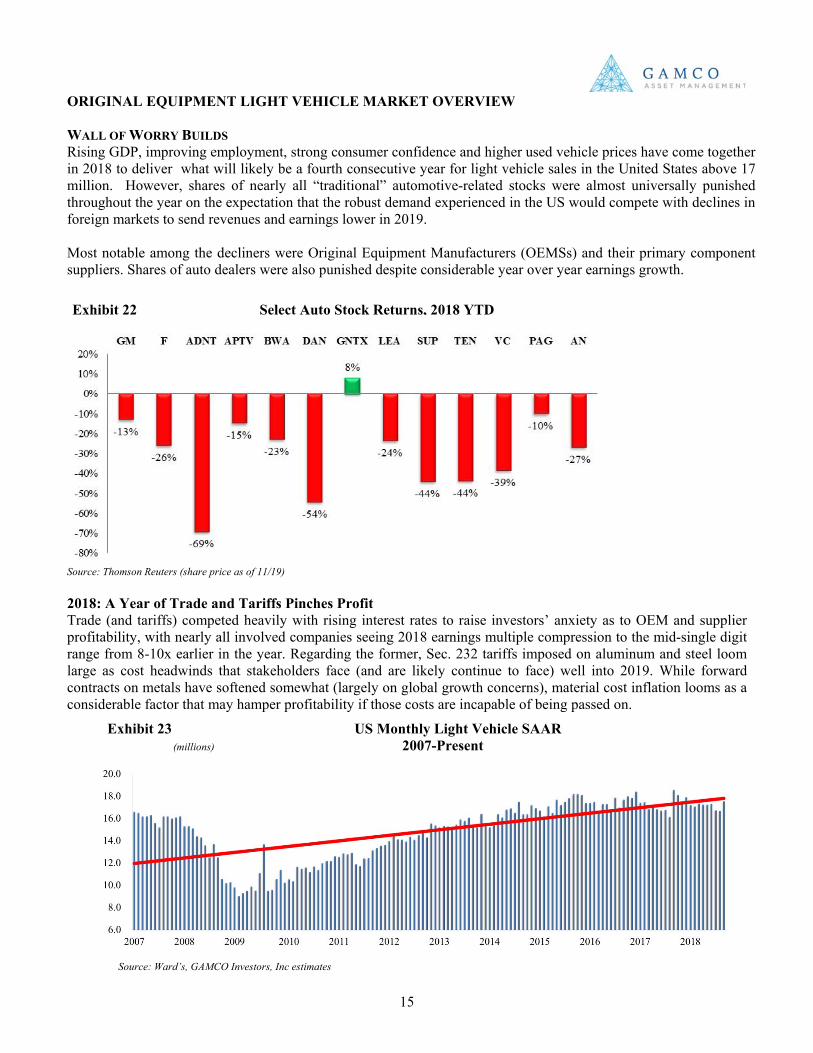
ORIGINAL EQUIPMENT LIGHT VEHICLE MARKET OVERVIEW WALL OF WORRY BUILDS Rising GDP, improving employment, strong consumer confidence and higher used vehicle prices have come together in 2018 to deliver what will likely be a fourth consecutive year for light vehicle sales in the United States above 17 million. However, shares of nearly all “traditional” automotive-related stocks were almost universally punished throughout the year on the expectation that the robust demand experienced in the US would compete with declines in foreign markets to send revenues and earnings lower in 2019. Most notable among the decliners were Original Equipment Manufacturers (OEMSs) and their primary component suppliers. Shares of auto dealers were also punished despite considerable year over year earnings growth.
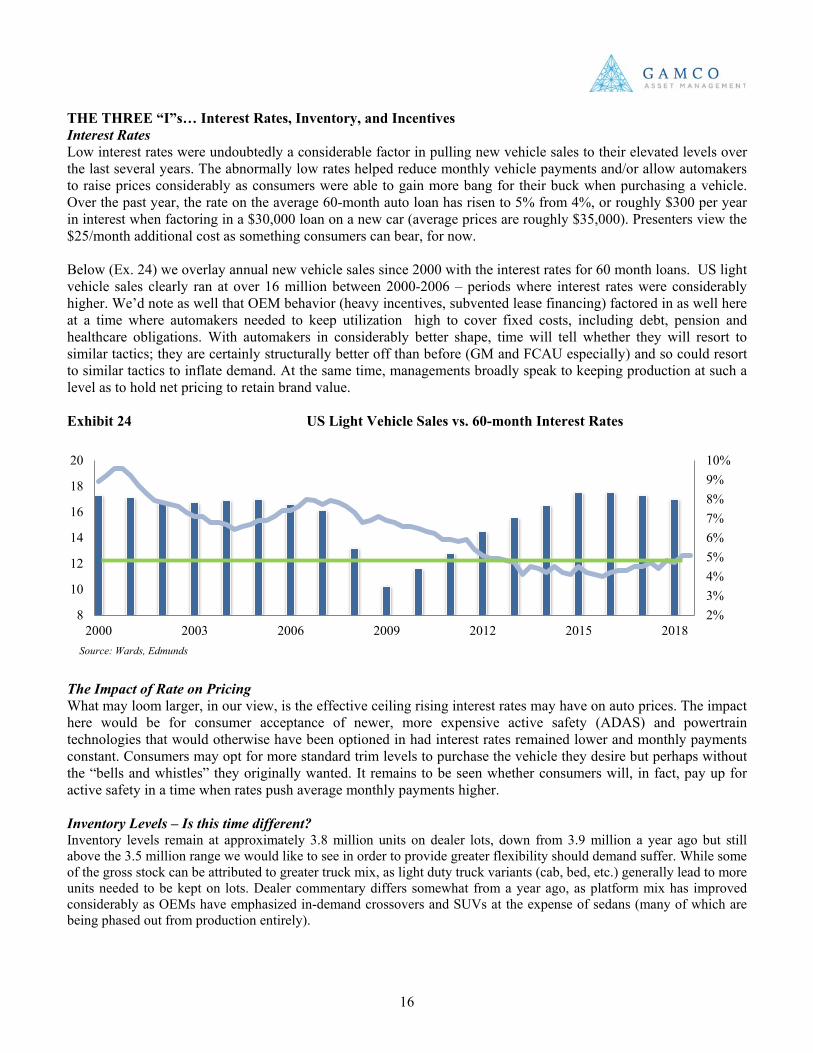
Source: Thomson Reuters (share price as of 11/19) 2018: A Year of Trade and Tariffs Pinches Profit Trade (and tariffs) competed heavily with rising interest rates to raise investors’ anxiety as to OEM and supplier profitability, with nearly all involved companies seeing 2018 earnings multiple compression to the mid-single digit range from 8-10x earlier in the year. Regarding the former, Sec. 232 tariffs imposed on aluminum and steel loom large as cost headwinds that stakeholders face (and are likely continue to face) well into 2019. While forward contracts on metals have softened somewhat (largely on global growth concerns), material cost inflation looms as a considerable factor that may hamper profitability if those costs are incapable of being passed on.
Exhibit 23 US Monthly Light Vehicle SAAR (millions) 2007-Present
Exhibit 22 Select Auto Stock Returns, 2018 YTD
Source: Ward’s, GAMCO Investors, Inc estimates
16
Source: Wards, Edmunds
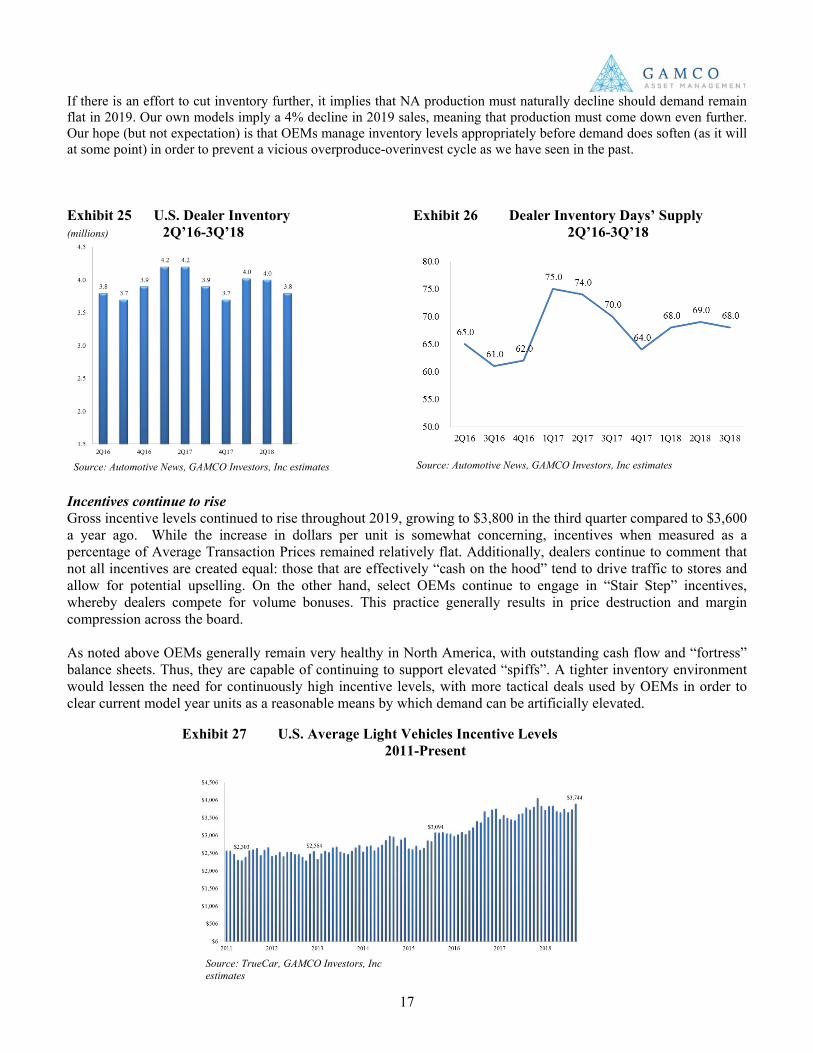
THE THREE “I”s… Interest Rates, Inventory, and Incentives Interest Rates Low interest rates were undoubtedly a considerable factor in pulling new vehicle sales to their elevated levels over the last several years. The abnormally low rates helped reduce monthly vehicle payments and/or allow automakers to raise prices considerably as consumers were able to gain more bang for their buck when purchasing a vehicle. Over the past year, the rate on the average 60-month auto loan has risen to 5% from 4%, or roughly $300 per year in interest when factoring in a $30,000 loan on a new car (average prices are roughly $35,000). Presenters view the $25/month additional cost as something consumers can bear, for now. Below (Ex. 24) we overlay annual new vehicle sales since 2000 with the interest rates for 60 month loans. US light vehicle sales clearly ran at over 16 million between 2000-2006 – periods where interest rates were considerably higher. We’d note as well that OEM behavior (heavy incentives, subvented lease financing) factored in as well here at a time where automakers needed to keep utilization high to cover fixed costs, including debt, pension and healthcare obligations. With automakers in considerably better shape, time will tell whether they will resort to similar tactics; they are certainly structurally better off than before (GM and FCAU especially) and so could resort to similar tactics to inflate demand. At the same time, managements broadly speak to keeping production at such a level as to hold net pricing to retain brand value. Exhibit 24 US Light Vehicle Sales vs. 60-month Interest Rates
The Impact of Rate on Pricing What may loom larger, in our view, is the effective ceiling rising interest rates may have on auto prices. The impact here would be for consumer acceptance of newer, more expensive active safety (ADAS) and powertrain technologies that would otherwise have been optioned in had interest rates remained lower and monthly payments constant. Consumers may opt for more standard trim levels to purchase the vehicle they desire but perhaps without the “bells and whistles” they originally wanted. It remains to be seen whether consumers will, in fact, pay up for active safety in a time when rates push average monthly payments higher. Inventory Levels – Is this time different? Inventory levels remain at approximately 3.8 million units on dealer lots, down from 3.9 million a year ago but still above the 3.5 million range we would like to see in order to provide greater flexibility should demand suffer. While some of the gross stock can be attributed to greater truck mix, as light duty truck variants (cab, bed, etc.) generally lead to more units needed to be kept on lots. Dealer commentary differs somewhat from a year ago, as platform mix has improved considerably as OEMs have emphasized in-demand crossovers and SUVs at the expense of sedans (many of which are being phased out from production entirely).
17
2%3%4%5%6%7%8%9%10%
8
10
12
14
16
18
20
2000 2003 2006 2009 2012 2015 2018
17
Source: Automotive News, GAMCO Investors, Inc estimates Source: Automotive News, GAMCO Investors, Inc estimates
Source: TrueCar, GAMCO Investors, Inc estimates
If there is an effort to cut inventory further, it implies that NA production must naturally decline should demand remain flat in 2019. Our own models imply a 4% decline in 2019 sales, meaning that production must come down even further. Our hope (but not expectation) is that OEMs manage inventory levels appropriately before demand does soften (as it will at some point) in order to prevent a vicious overproduce-overinvest cycle as we have seen in the past. Exhibit 25 U.S. Dealer Inventory Exhibit 26 Dealer Inventory Days’ Supply (millions) 2Q’16-3Q’18 2Q’16-3Q’18 Incentives continue to rise Gross incentive levels continued to rise throughout 2019, growing to $3,800 in the third quarter compared to $3,600 a year ago. While the increase in dollars per unit is somewhat concerning, incentives when measured as a percentage of Average Transaction Prices remained relatively flat. Additionally, dealers continue to comment that not all incentives are created equal: those that are effectively “cash on the hood” tend to drive traffic to stores and allow for potential upselling. On the other hand, select OEMs continue to engage in “Stair Step” incentives, whereby dealers compete for volume bonuses. This practice generally results in price destruction and margin compression across the board. As noted above OEMs generally remain very healthy in North America, with outstanding cash flow and “fortress” balance sheets. Thus, they are capable of continuing to support elevated “spiffs”. A tighter inventory environment would lessen the need for continuously high incentive levels, with more tactical deals used by OEMs in order to clear current model year units as a reasonable means by which demand can be artificially elevated.
Exhibit 27 U.S. Average Light Vehicles Incentive Levels 2011-Present
18
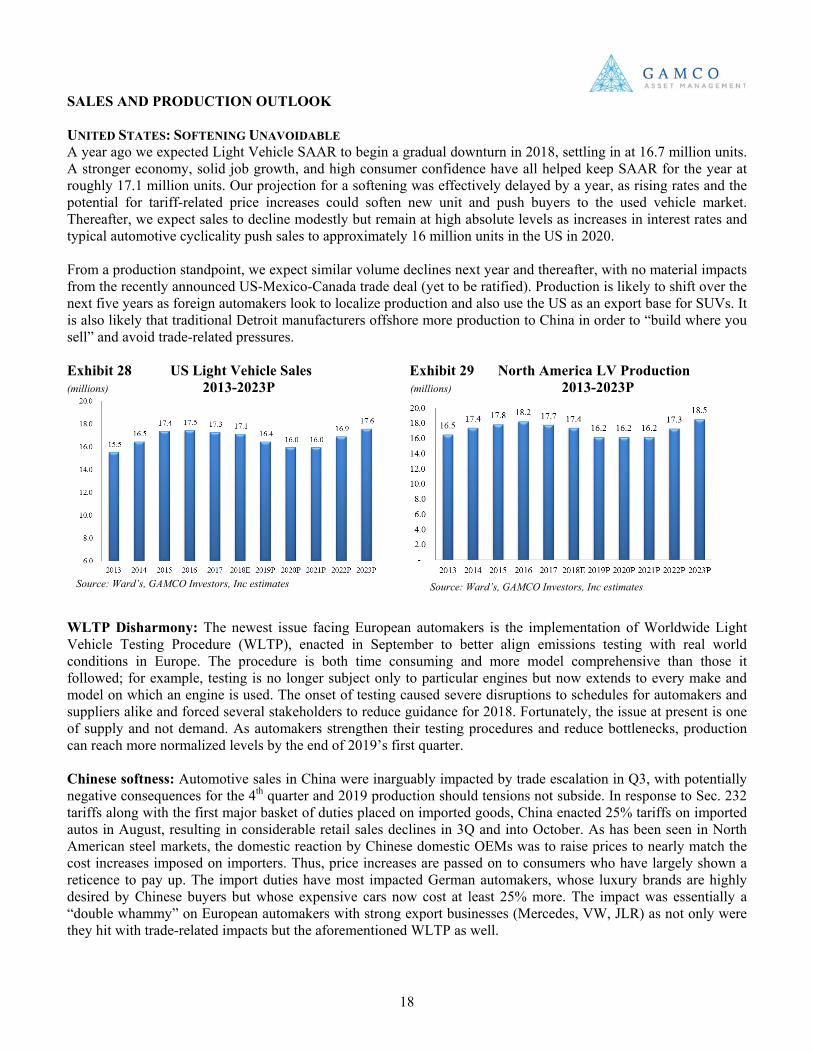
SALES AND PRODUCTION OUTLOOK UNITED STATES: SOFTENING UNAVOIDABLE A year ago we expected Light Vehicle SAAR to begin a gradual downturn in 2018, settling in at 16.7 million units. A stronger economy, solid job growth, and high consumer confidence have all helped keep SAAR for the year at roughly 17.1 million units. Our projection for a softening was effectively delayed by a year, as rising rates and the potential for tariff-related price increases could soften new unit and push buyers to the used vehicle market. Thereafter, we expect sales to decline modestly but remain at high absolute levels as increases in interest rates and typical automotive cyclicality push sales to approximately 16 million units in the US in 2020. From a production standpoint, we expect similar volume declines next year and thereafter, with no material impacts from the recently announced US-Mexico-Canada trade deal (yet to be ratified). Production is likely to shift over the next five years as foreign automakers look to localize production and also use the US as an export base for SUVs. It is also likely that traditional Detroit manufacturers offshore more production to China in order to “build where you sell” and avoid trade-related pressures. Exhibit 28 US Light Vehicle Sales Exhibit 29 North America LV Production (millions) 2013-2023P (millions) 2013-2023P
WLTP Disharmony: The newest issue facing European automakers is the implementation of Worldwide Light Vehicle Testing Procedure (WLTP), enacted in September to better align emissions testing with real world conditions in Europe. The procedure is both time consuming and more model comprehensive than those it followed; for example, testing is no longer subject only to particular engines but now extends to every make and model on which an engine is used. The onset of testing caused severe disruptions to schedules for automakers and suppliers alike and forced several stakeholders to reduce guidance for 2018. Fortunately, the issue at present is one of supply and not demand. As automakers strengthen their testing procedures and reduce bottlenecks, production can reach more normalized levels by the end of 2019’s first quarter. Chinese softness: Automotive sales in China were inarguably impacted by trade escalation in Q3, with potentially negative consequences for the 4th quarter and 2019 production should tensions not subside. In response to Sec. 232 tariffs along with the first major basket of duties placed on imported goods, China enacted 25% tariffs on imported autos in August, resulting in considerable retail sales declines in 3Q and into October. As has been seen in North American steel markets, the domestic reaction by Chinese domestic OEMs was to raise prices to nearly match the cost increases imposed on importers. Thus, price increases are passed on to consumers who have largely shown a reticence to pay up. The import duties have most impacted German automakers, whose luxury brands are highly desired by Chinese buyers but whose expensive cars now cost at least 25% more. The impact was essentially a “double whammy” on European automakers with strong export businesses (Mercedes, VW, JLR) as not only were they hit with trade-related impacts but the aforementioned WLTP as well.
Source: Ward’s, GAMCO Investors, Inc estimates Source: Ward’s, GAMCO Investors, Inc estimates
19
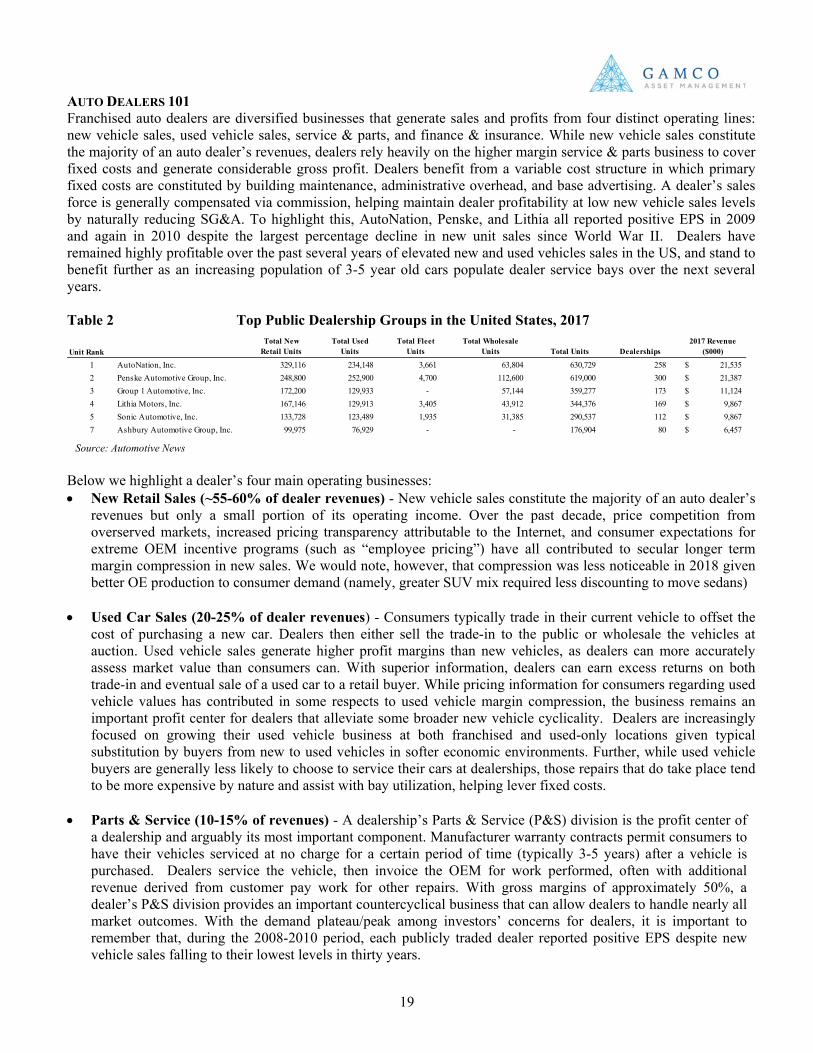
AUTO DEALERS 101 Franchised auto dealers are diversified businesses that generate sales and profits from four distinct operating lines: new vehicle sales, used vehicle sales, service & parts, and finance & insurance. While new vehicle sales constitute the majority of an auto dealer’s revenues, dealers rely heavily on the higher margin service & parts business to cover fixed costs and generate considerable gross profit. Dealers benefit from a variable cost structure in which primary fixed costs are constituted by building maintenance, administrative overhead, and base advertising. A dealer’s sales force is generally compensated via commission, helping maintain dealer profitability at low new vehicle sales levels by naturally reducing SG&A. To highlight this, AutoNation, Penske, and Lithia all reported positive EPS in 2009 and again in 2010 despite the largest percentage decline in new unit sales since World War II. Dealers have remained highly profitable over the past several years of elevated new and used vehicles sales in the US, and stand to benefit further as an increasing population of 3-5 year old cars populate dealer service bays over the next several years. Table 2 Top Public Dealership Groups in the United States, 2017
Below we highlight a dealer’s four main operating businesses: • New Retail Sales (~55-60% of dealer revenues) - New vehicle sales constitute the majority of an auto dealer’s
revenues but only a small portion of its operating income. Over the past decade, price competition from overserved markets, increased pricing transparency attributable to the Internet, and consumer expectations for extreme OEM incentive programs (such as “employee pricing”) have all contributed to secular longer term margin compression in new sales. We would note, however, that compression was less noticeable in 2018 given better OE production to consumer demand (namely, greater SUV mix required less discounting to move sedans)
• Used Car Sales (20-25% of dealer revenues) - Consumers typically trade in their current vehicle to offset the cost of purchasing a new car. Dealers then either sell the trade-in to the public or wholesale the vehicles at auction. Used vehicle sales generate higher profit margins than new vehicles, as dealers can more accurately assess market value than consumers can. With superior information, dealers can earn excess returns on both trade-in and eventual sale of a used car to a retail buyer. While pricing information for consumers regarding used vehicle values has contributed in some respects to used vehicle margin compression, the business remains an important profit center for dealers that alleviate some broader new vehicle cyclicality. Dealers are increasingly focused on growing their used vehicle business at both franchised and used-only locations given typical substitution by buyers from new to used vehicles in softer economic environments. Further, while used vehicle buyers are generally less likely to choose to service their cars at dealerships, those repairs that do take place tend to be more expensive by nature and assist with bay utilization, helping lever fixed costs.
• Parts & Service (10-15% of revenues) - A dealership’s Parts & Service (P&S) division is the profit center of
a dealership and arguably its most important component. Manufacturer warranty contracts permit consumers to have their vehicles serviced at no charge for a certain period of time (typically 3-5 years) after a vehicle is purchased. Dealers service the vehicle, then invoice the OEM for work performed, often with additional revenue derived from customer pay work for other repairs. With gross margins of approximately 50%, a dealer’s P&S division provides an important countercyclical business that can allow dealers to handle nearly all market outcomes. With the demand plateau/peak among investors’ concerns for dealers, it is important to remember that, during the 2008-2010 period, each publicly traded dealer reported positive EPS despite new vehicle sales falling to their lowest levels in thirty years.
Unit RankTotal New
Retail UnitsTotal Used
UnitsTotal Fleet
UnitsTotal Wholesale
Units Total Units Dealerships2017 Revenue
($000)
1 AutoNation, Inc. 329,116 234,148 3,661 63,804 630,729 258 21,535$ 2 Penske Automotive Group, Inc. 248,800 252,900 4,700 112,600 619,000 300 21,387$ 3 Group 1 Automotive, Inc. 172,200 129,933 - 57,144 359,277 173 11,124$ 4 Lithia Motors, Inc. 167,146 129,913 3,405 43,912 344,376 169 9,867$ 5 Sonic Automotive, Inc. 133,728 123,489 1,935 31,385 290,537 112 9,867$ 7 Ashbury Automotive Group, Inc. 99,975 76,929 - - 176,904 80 6,457$
Source: Automotive News
20
Similar to a year ago, dealers should continue to benefit tremendously from an increase in the population of 3-5 year old vehicles, as these cars repopulate dealership bays with cars requiring work falling under factory warranty. Further, increased OEM warranty length over the past decade has helped dealers increase P&S sales through regular maintenance service, such as oil changes and fluid work, thereby growing the segment’s contribution to sales. In addition to warranty work, dealers have increased non-warranty service share from independent service shops in recent years by continuing customer relationships through oil change and other maintenance service plans sold earlier in vehicles lives. As noted previously, newer model vehicles are increasingly more complex, including more electrical parts and highly engineered processes that require regular maintenance. Highly trained technicians and expensive equipment are often cost prohibitive for non-franchised local repair shops, redirecting consumers to dealers for repairs. Long term opportunities exist as we expect dealers to become important customers of ride sharing fleets. These fleets will rely on vehicles that drive considerably more miles per year than those driven by consumers. This increased wear-and-tear will likely require more OE and OES parts, which naturally helps shift some business away from the independent aftermarket and to dealers.
• Finance & Insurance (2-5% of dealer revenues) – Dealers earn referral fees from third-party lenders that
finance new or used vehicle purchases. The lender of choice is typically the captive finance subsidiary of the auto manufacturer whose vehicle is being sold, though banks and credit unions gained share in the 2008-2010 downturn as captives became more reticent to extend credit to near prime and subprime customers. Dealers are typically incentivized to push customers toward captive lenders, as they often receive volume bonuses for arranging financing. Predominately tied to new vehicle sales and pricing, F&I offers dealers a pure-profit sales add-on. Other F&I products, such as extended warranties and maintenance plans, are more often sold to customers of domestic or volume import brands. High lease penetration in premium vehicles, which typically carry more complete and longer, warranty coverage from OEMs, makes the products less attractive for luxury buyers.
USED VEHICLE FOCUS:
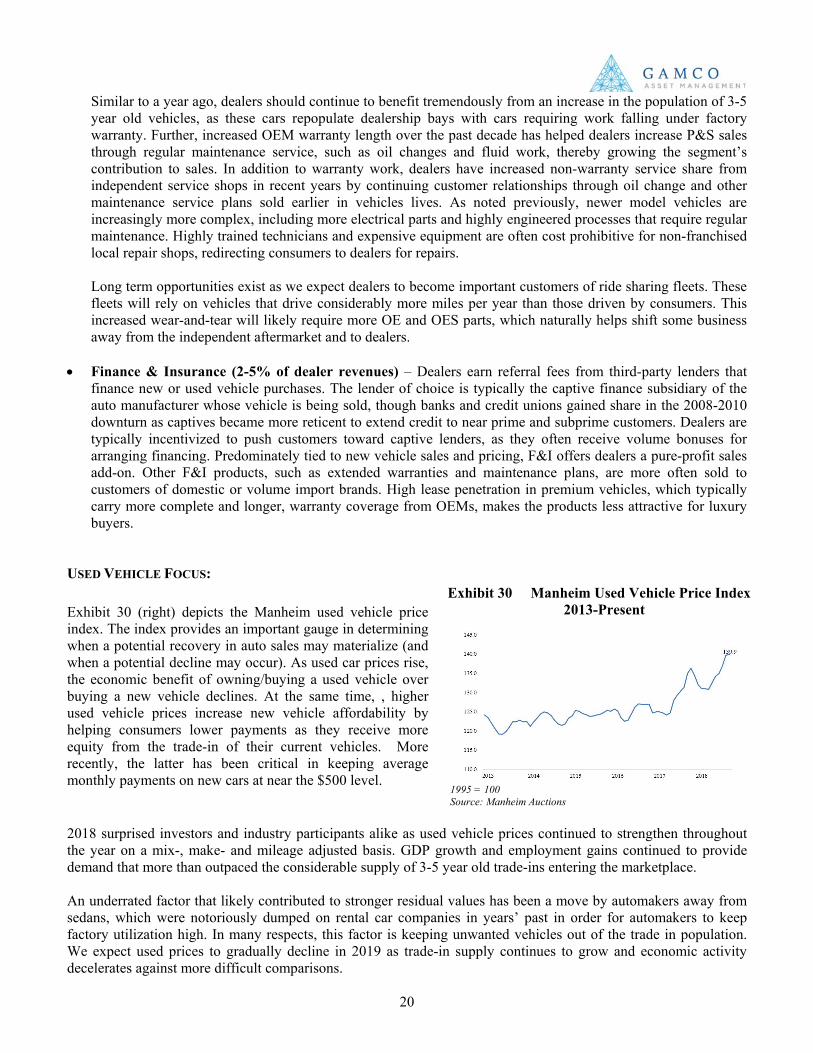
1995 = 100 Source: Manheim Auctions 2018 surprised investors and industry participants alike as used vehicle prices continued to strengthen throughout the year on a mix-, make- and mileage adjusted basis. GDP growth and employment gains continued to provide demand that more than outpaced the considerable supply of 3-5 year old trade-ins entering the marketplace. An underrated factor that likely contributed to stronger residual values has been a move by automakers away from sedans, which were notoriously dumped on rental car companies in years’ past in order for automakers to keep factory utilization high. In many respects, this factor is keeping unwanted vehicles out of the trade in population. We expect used prices to gradually decline in 2019 as trade-in supply continues to grow and economic activity decelerates against more difficult comparisons.
Exhibit 30 (right) depicts the Manheim used vehicle price index. The index provides an important gauge in determining when a potential recovery in auto sales may materialize (and when a potential decline may occur). As used car prices rise, the economic benefit of owning/buying a used vehicle over buying a new vehicle declines. At the same time, , higher used vehicle prices increase new vehicle affordability by helping consumers lower payments as they receive more equity from the trade-in of their current vehicles. More recently, the latter has been critical in keeping average monthly payments on new cars at near the $500 level.
Exhibit 30 Manheim Used Vehicle Price Index 2013-Present
21
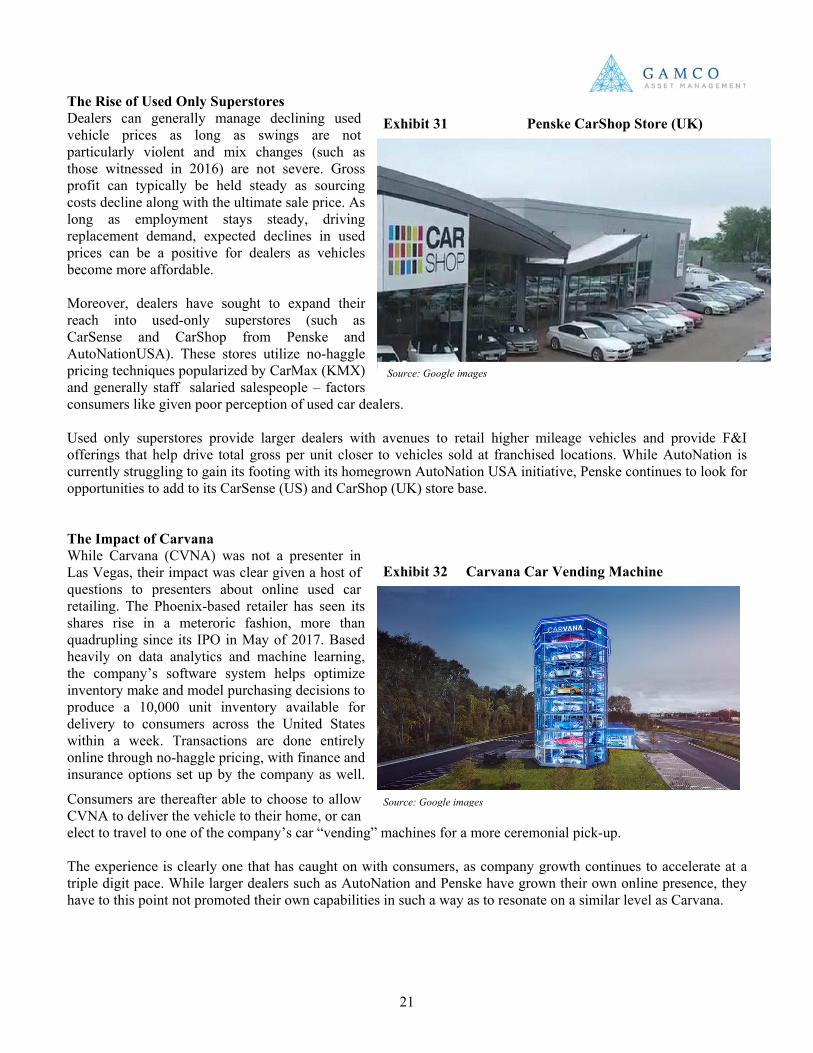
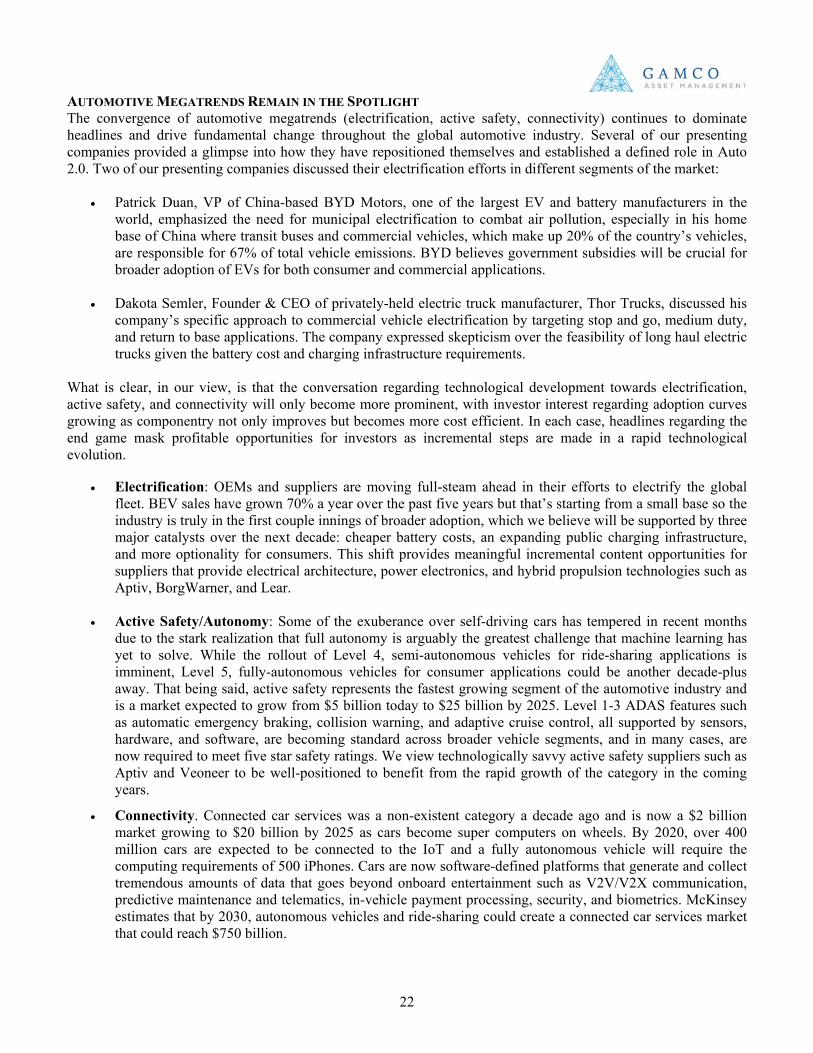
The Rise of Used Only Superstores Dealers can generally manage declining used vehicle prices as long as swings are not particularly violent and mix changes (such as those witnessed in 2016) are not severe. Gross profit can typically be held steady as sourcing costs decline along with the ultimate sale price. As long as employment stays steady, driving replacement demand, expected declines in used prices can be a positive for dealers as vehicles become more affordable. Moreover, dealers have sought to expand their reach into used-only superstores (such as CarSense and CarShop from Penske and AutoNationUSA). These stores utilize no-haggle pricing techniques popularized by CarMax (KMX) and generally staff salaried salespeople – factors consumers like given poor perception of used car dealers. Used only superstores provide larger dealers with avenues to retail higher mileage vehicles and provide F&I offerings that help drive total gross per unit closer to vehicles sold at franchised locations. While AutoNation is currently struggling to gain its footing with its homegrown AutoNation USA initiative, Penske continues to look for opportunities to add to its CarSense (US) and CarShop (UK) store base. The Impact of Carvana While Carvana (CVNA) was not a presenter in Las Vegas, their impact was clear given a host of questions to presenters about online used car retailing. The Phoenix-based retailer has seen its shares rise in a meteroric fashion, more than quadrupling since its IPO in May of 2017. Based heavily on data analytics and machine learning, the company’s software system helps optimize inventory make and model purchasing decisions to produce a 10,000 unit inventory available for delivery to consumers across the United States within a week. Transactions are done entirely online through no-haggle pricing, with finance and insurance options set up by the company as well.
Consumers are thereafter able to choose to allow CVNA to deliver the vehicle to their home, or can elect to travel to one of the company’s car “vending” machines for a more ceremonial pick-up. The experience is clearly one that has caught on with consumers, as company growth continues to accelerate at a triple digit pace. While larger dealers such as AutoNation and Penske have grown their own online presence, they have to this point not promoted their own capabilities in such a way as to resonate on a similar level as Carvana.
Exhibit 32 Carvana Car Vending Machine
Source: Google images
Source: Google images
Exhibit 31 Penske CarShop Store (UK)
22
AUTOMOTIVE MEGATRENDS REMAIN IN THE SPOTLIGHT The convergence of automotive megatrends (electrification, active safety, connectivity) continues to dominate headlines and drive fundamental change throughout the global automotive industry. Several of our presenting companies provided a glimpse into how they have repositioned themselves and established a defined role in Auto 2.0. Two of our presenting companies discussed their electrification efforts in different segments of the market:
• Patrick Duan, VP of China-based BYD Motors, one of the largest EV and battery manufacturers in the world, emphasized the need for municipal electrification to combat air pollution, especially in his home base of China where transit buses and commercial vehicles, which make up 20% of the country’s vehicles, are responsible for 67% of total vehicle emissions. BYD believes government subsidies will be crucial for broader adoption of EVs for both consumer and commercial applications.
• Dakota Semler, Founder & CEO of privately-held electric truck manufacturer, Thor Trucks, discussed his company’s specific approach to commercial vehicle electrification by targeting stop and go, medium duty, and return to base applications. The company expressed skepticism over the feasibility of long haul electric trucks given the battery cost and charging infrastructure requirements.
What is clear, in our view, is that the conversation regarding technological development towards electrification, active safety, and connectivity will only become more prominent, with investor interest regarding adoption curves growing as componentry not only improves but becomes more cost efficient. In each case, headlines regarding the end game mask profitable opportunities for investors as incremental steps are made in a rapid technological evolution.
• Electrification: OEMs and suppliers are moving full-steam ahead in their efforts to electrify the global fleet. BEV sales have grown 70% a year over the past five years but that’s starting from a small base so the industry is truly in the first couple innings of broader adoption, which we believe will be supported by three major catalysts over the next decade: cheaper battery costs, an expanding public charging infrastructure, and more optionality for consumers. This shift provides meaningful incremental content opportunities for suppliers that provide electrical architecture, power electronics, and hybrid propulsion technologies such as Aptiv, BorgWarner, and Lear.
• Active Safety/Autonomy: Some of the exuberance over self-driving cars has tempered in recent months due to the stark realization that full autonomy is arguably the greatest challenge that machine learning has yet to solve. While the rollout of Level 4, semi-autonomous vehicles for ride-sharing applications is imminent, Level 5, fully-autonomous vehicles for consumer applications could be another decade-plus away. That being said, active safety represents the fastest growing segment of the automotive industry and is a market expected to grow from $5 billion today to $25 billion by 2025. Level 1-3 ADAS features such as automatic emergency braking, collision warning, and adaptive cruise control, all supported by sensors, hardware, and software, are becoming standard across broader vehicle segments, and in many cases, are now required to meet five star safety ratings. We view technologically savvy active safety suppliers such as Aptiv and Veoneer to be well-positioned to benefit from the rapid growth of the category in the coming years.
• Connectivity. Connected car services was a non-existent category a decade ago and is now a $2 billion market growing to $20 billion by 2025 as cars become super computers on wheels. By 2020, over 400 million cars are expected to be connected to the IoT and a fully autonomous vehicle will require the computing requirements of 500 iPhones. Cars are now software-defined platforms that generate and collect tremendous amounts of data that goes beyond onboard entertainment such as V2V/V2X communication, predictive maintenance and telematics, in-vehicle payment processing, security, and biometrics. McKinsey estimates that by 2030, autonomous vehicles and ride-sharing could create a connected car services market that could reach $750 billion.
23
Source: Ward’s, ACT, GAMCO estimates Source: ACT, GAMCO estimates
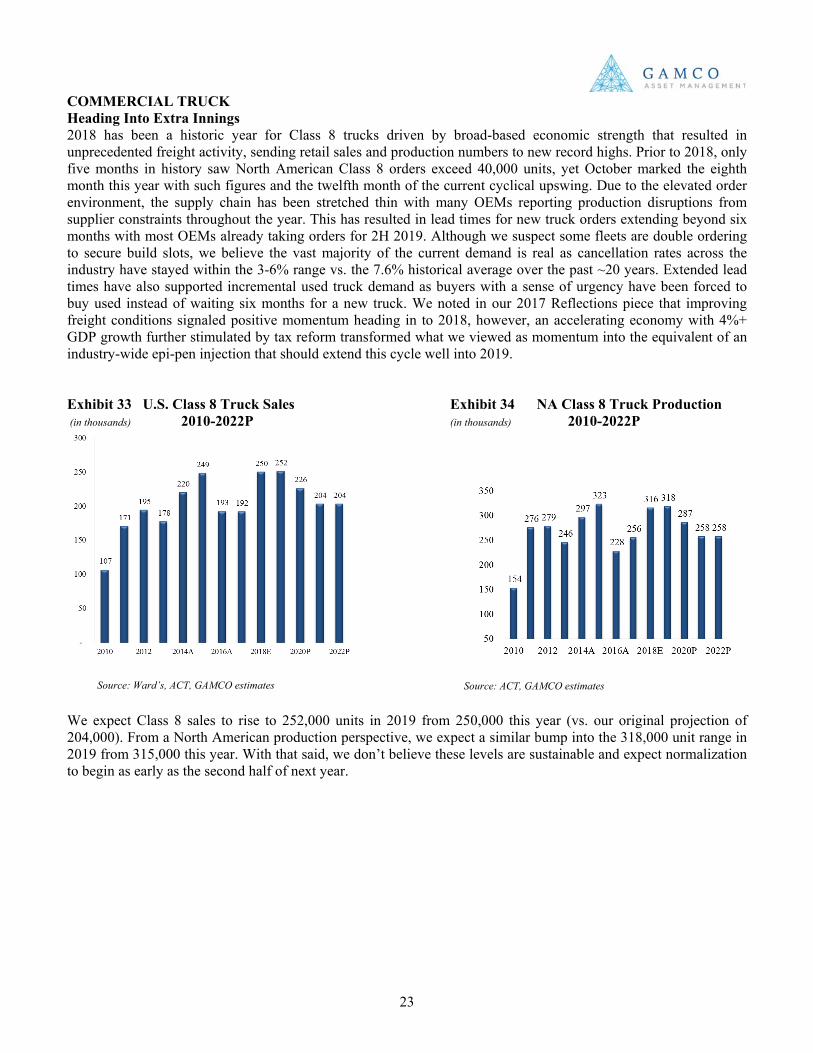
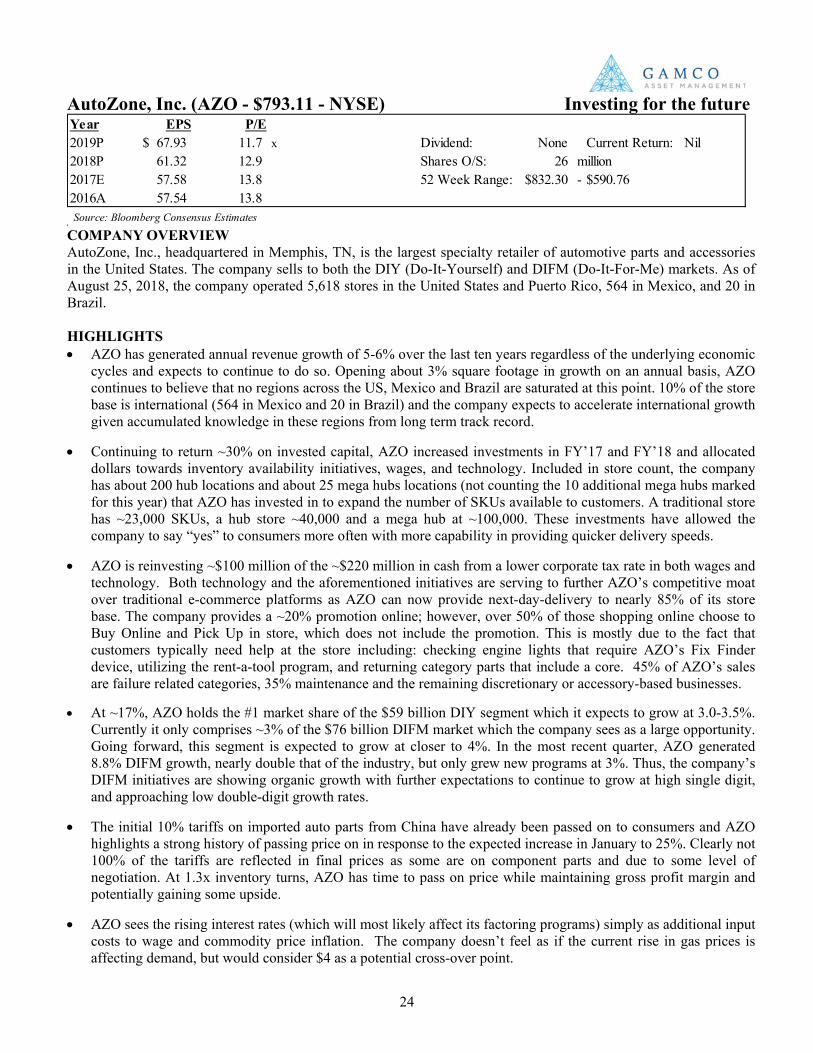
COMMERCIAL TRUCK Heading Into Extra Innings 2018 has been a historic year for Class 8 trucks driven by broad-based economic strength that resulted in unprecedented freight activity, sending retail sales and production numbers to new record highs. Prior to 2018, only five months in history saw North American Class 8 orders exceed 40,000 units, yet October marked the eighth month this year with such figures and the twelfth month of the current cyclical upswing. Due to the elevated order environment, the supply chain has been stretched thin with many OEMs reporting production disruptions from supplier constraints throughout the year. This has resulted in lead times for new truck orders extending beyond six months with most OEMs already taking orders for 2H 2019. Although we suspect some fleets are double ordering to secure build slots, we believe the vast majority of the current demand is real as cancellation rates across the industry have stayed within the 3-6% range vs. the 7.6% historical average over the past ~20 years. Extended lead times have also supported incremental used truck demand as buyers with a sense of urgency have been forced to buy used instead of waiting six months for a new truck. We noted in our 2017 Reflections piece that improving freight conditions signaled positive momentum heading in to 2018, however, an accelerating economy with 4%+ GDP growth further stimulated by tax reform transformed what we viewed as momentum into the equivalent of an industry-wide epi-pen injection that should extend this cycle well into 2019. Exhibit 33 U.S. Class 8 Truck Sales Exhibit 34 NA Class 8 Truck Production (in thousands) 2010-2022P (in thousands) 2010-2022P
We expect Class 8 sales to rise to 252,000 units in 2019 from 250,000 this year (vs. our original projection of 204,000). From a North American production perspective, we expect a similar bump into the 318,000 unit range in 2019 from 315,000 this year. With that said, we don’t believe these levels are sustainable and expect normalization to begin as early as the second half of next year.
24
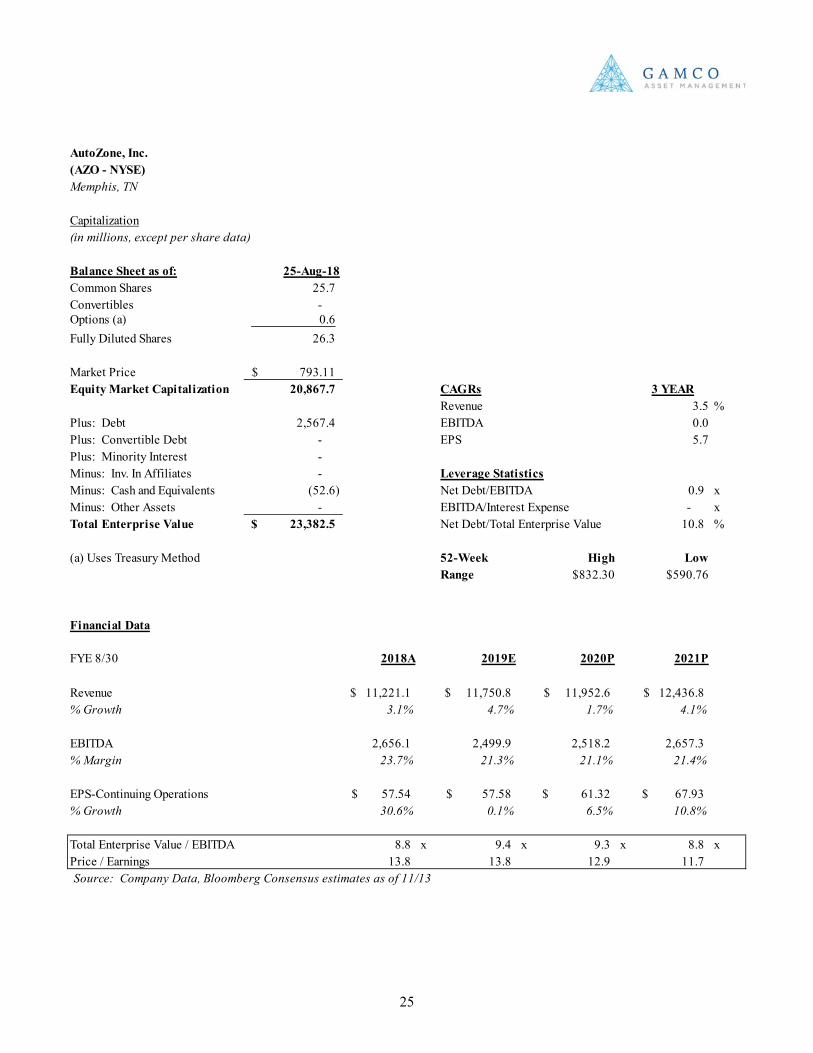
AutoZone, Inc. (AZO - $793.11 - NYSE) Investing for the future
COMPANY OVERVIEW AutoZone, Inc., headquartered in Memphis, TN, is the largest specialty retailer of automotive parts and accessories in the United States. The company sells to both the DIY (Do-It-Yourself) and DIFM (Do-It-For-Me) markets. As of August 25, 2018, the company operated 5,618 stores in the United States and Puerto Rico, 564 in Mexico, and 20 in Brazil. HIGHLIGHTS • AZO has generated annual revenue growth of 5-6% over the last ten years regardless of the underlying economic
cycles and expects to continue to do so. Opening about 3% square footage in growth on an annual basis, AZO continues to believe that no regions across the US, Mexico and Brazil are saturated at this point. 10% of the store base is international (564 in Mexico and 20 in Brazil) and the company expects to accelerate international growth given accumulated knowledge in these regions from long term track record.
• Continuing to return ~30% on invested capital, AZO increased investments in FY’17 and FY’18 and allocated
dollars towards inventory availability initiatives, wages, and technology. Included in store count, the company has about 200 hub locations and about 25 mega hubs locations (not counting the 10 additional mega hubs marked for this year) that AZO has invested in to expand the number of SKUs available to customers. A traditional store has ~23,000 SKUs, a hub store ~40,000 and a mega hub at ~100,000. These investments have allowed the company to say “yes” to consumers more often with more capability in providing quicker delivery speeds.
• AZO is reinvesting ~$100 million of the ~$220 million in cash from a lower corporate tax rate in both wages and
technology. Both technology and the aforementioned initiatives are serving to further AZO’s competitive moat over traditional e-commerce platforms as AZO can now provide next-day-delivery to nearly 85% of its store base. The company provides a ~20% promotion online; however, over 50% of those shopping online choose to Buy Online and Pick Up in store, which does not include the promotion. This is mostly due to the fact that customers typically need help at the store including: checking engine lights that require AZO’s Fix Finder device, utilizing the rent-a-tool program, and returning category parts that include a core. 45% of AZO’s sales are failure related categories, 35% maintenance and the remaining discretionary or accessory-based businesses.
• At ~17%, AZO holds the #1 market share of the $59 billion DIY segment which it expects to grow at 3.0-3.5%.
Currently it only comprises ~3% of the $76 billion DIFM market which the company sees as a large opportunity. Going forward, this segment is expected to grow at closer to 4%. In the most recent quarter, AZO generated 8.8% DIFM growth, nearly double that of the industry, but only grew new programs at 3%. Thus, the company’s DIFM initiatives are showing organic growth with further expectations to continue to grow at high single digit, and approaching low double-digit growth rates.
• The initial 10% tariffs on imported auto parts from China have already been passed on to consumers and AZO
highlights a strong history of passing price on in response to the expected increase in January to 25%. Clearly not 100% of the tariffs are reflected in final prices as some are on component parts and due to some level of negotiation. At 1.3x inventory turns, AZO has time to pass on price while maintaining gross profit margin and potentially gaining some upside.
• AZO sees the rising interest rates (which will most likely affect its factoring programs) simply as additional input
costs to wage and commodity price inflation. The company doesn’t feel as if the current rise in gas prices is affecting demand, but would consider $4 as a potential cross-over point.
Year EPS P/E2019P 67.93$ 11.7 x Dividend: None Current Return: Nil2018P 61.32 12.9 Shares O/S: 26 million2017E 57.58 13.8 52 Week Range: 832.30$ - $590.762016A 57.54 13.8 Source: Bloomberg Consensus Estimates
25
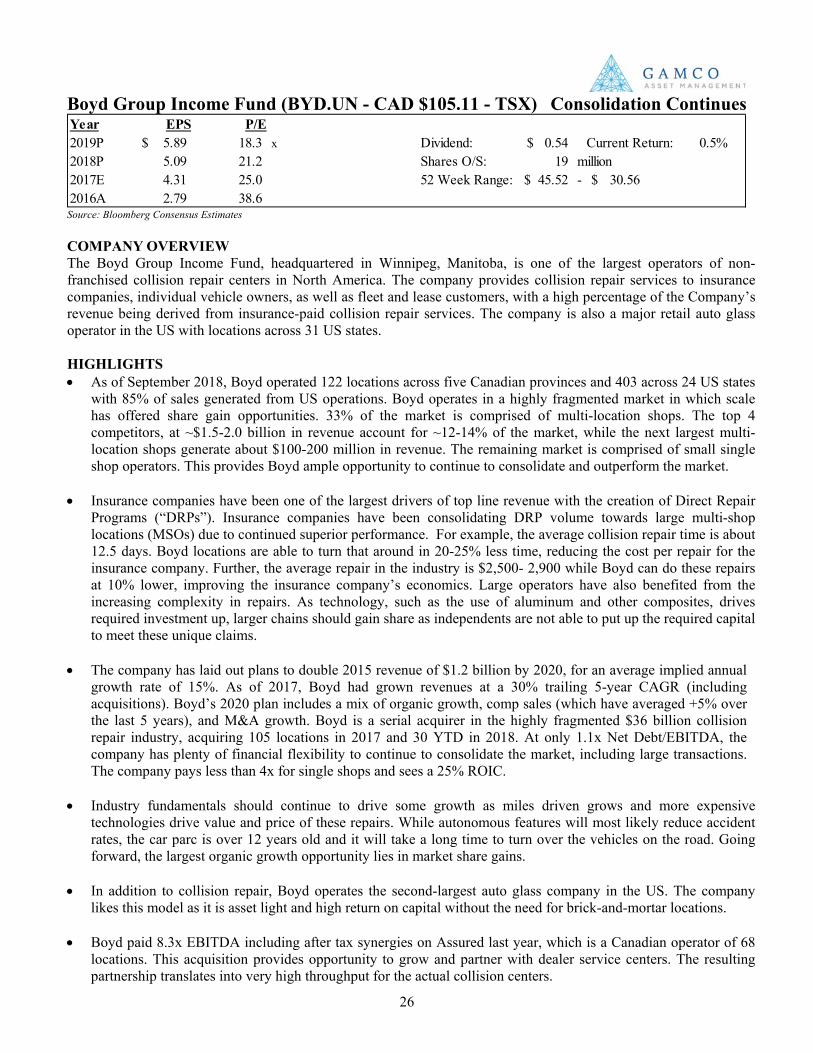
AutoZone, Inc.(AZO - NYSE)Memphis, TN
Capitalization(in millions, except per share data)
Balance Sheet as of: 25-Aug-18Common Shares 25.7 Convertibles - Options (a) 0.6 Fully Diluted Shares 26.3
Market Price 793.11$ Equity Market Capitalization 20,867.7 CAGRs 3 YEAR
Revenue 3.5 %Plus: Debt 2,567.4 EBITDA 0.0Plus: Convertible Debt - EPS 5.7Plus: Minority Interest - Minus: Inv. In Affiliates - Leverage StatisticsMinus: Cash and Equivalents (52.6) Net Debt/EBITDA 0.9 xMinus: Other Assets - EBITDA/Interest Expense - xTotal Enterprise Value 23,382.5$ Net Debt/Total Enterprise Value 10.8 %
(a) Uses Treasury Method 52-Week High LowRange $832.30 $590.76
Financial Data
FYE 8/30 2018A 2019E 2020P 2021P
Revenue 11,221.1$ 11,750.8$ 11,952.6$ 12,436.8$ % Growth 3.1% 4.7% 1.7% 4.1%
EBITDA 2,656.1 2,499.9 2,518.2 2,657.3% Margin 23.7% 21.3% 21.1% 21.4%
EPS-Continuing Operations 57.54$ 57.58$ 61.32$ 67.93$ % Growth 30.6% 0.1% 6.5% 10.8%
Total Enterprise Value / EBITDA 8.8 x 9.4 x 9.3 x 8.8 xPrice / Earnings 13.8 13.8 12.9 11.7Source: Company Data, Bloomberg Consensus estimates as of 11/13
26
Boyd Group Income Fund (BYD.UN - CAD $105.11 - TSX) Consolidation Continues
Source: Bloomberg Consensus Estimates COMPANY OVERVIEW The Boyd Group Income Fund, headquartered in Winnipeg, Manitoba, is one of the largest operators of non-franchised collision repair centers in North America. The company provides collision repair services to insurance companies, individual vehicle owners, as well as fleet and lease customers, with a high percentage of the Company’s revenue being derived from insurance-paid collision repair services. The company is also a major retail auto glass operator in the US with locations across 31 US states. HIGHLIGHTS • As of September 2018, Boyd operated 122 locations across five Canadian provinces and 403 across 24 US states
with 85% of sales generated from US operations. Boyd operates in a highly fragmented market in which scale has offered share gain opportunities. 33% of the market is comprised of multi-location shops. The top 4 competitors, at ~$1.5-2.0 billion in revenue account for ~12-14% of the market, while the next largest multi-location shops generate about $100-200 million in revenue. The remaining market is comprised of small single shop operators. This provides Boyd ample opportunity to continue to consolidate and outperform the market.
• Insurance companies have been one of the largest drivers of top line revenue with the creation of Direct Repair Programs (“DRPs”). Insurance companies have been consolidating DRP volume towards large multi-shop locations (MSOs) due to continued superior performance. For example, the average collision repair time is about 12.5 days. Boyd locations are able to turn that around in 20-25% less time, reducing the cost per repair for the insurance company. Further, the average repair in the industry is $2,500- 2,900 while Boyd can do these repairs at 10% lower, improving the insurance company’s economics. Large operators have also benefited from the increasing complexity in repairs. As technology, such as the use of aluminum and other composites, drives required investment up, larger chains should gain share as independents are not able to put up the required capital to meet these unique claims.
• The company has laid out plans to double 2015 revenue of $1.2 billion by 2020, for an average implied annual growth rate of 15%. As of 2017, Boyd had grown revenues at a 30% trailing 5-year CAGR (including acquisitions). Boyd’s 2020 plan includes a mix of organic growth, comp sales (which have averaged +5% over the last 5 years), and M&A growth. Boyd is a serial acquirer in the highly fragmented $36 billion collision repair industry, acquiring 105 locations in 2017 and 30 YTD in 2018. At only 1.1x Net Debt/EBITDA, the company has plenty of financial flexibility to continue to consolidate the market, including large transactions. The company pays less than 4x for single shops and sees a 25% ROIC.
• Industry fundamentals should continue to drive some growth as miles driven grows and more expensive
technologies drive value and price of these repairs. While autonomous features will most likely reduce accident rates, the car parc is over 12 years old and it will take a long time to turn over the vehicles on the road. Going forward, the largest organic growth opportunity lies in market share gains.
• In addition to collision repair, Boyd operates the second-largest auto glass company in the US. The company
likes this model as it is asset light and high return on capital without the need for brick-and-mortar locations. • Boyd paid 8.3x EBITDA including after tax synergies on Assured last year, which is a Canadian operator of 68
locations. This acquisition provides opportunity to grow and partner with dealer service centers. The resulting partnership translates into very high throughput for the actual collision centers.
Year EPS P/E2019P 5.89$ 18.3 x Dividend: 0.54$ Current Return: 0.5%2018P 5.09 21.2 Shares O/S: 19 million2017E 4.31 25.0 52 Week Range: 45.52$ - 30.56$ 2016A 2.79 38.6
27
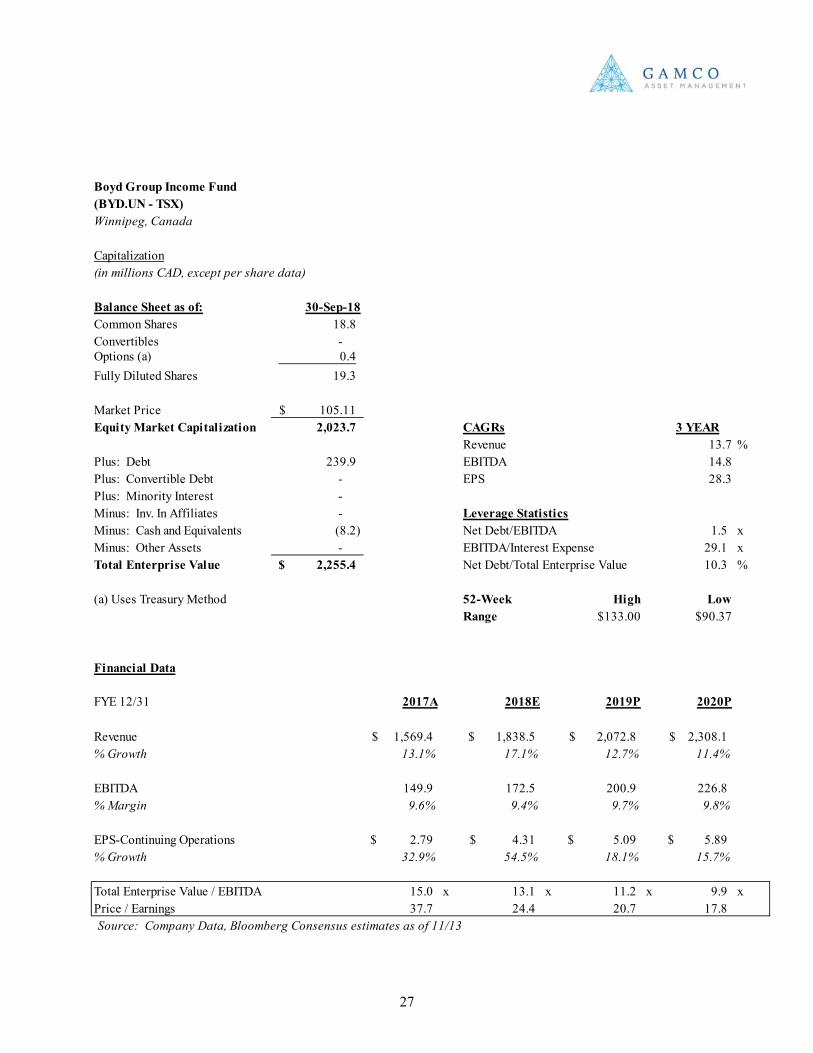
Boyd Group Income Fund(BYD.UN - TSX)Winnipeg, Canada
Capitalization(in millions CAD, except per share data)
Balance Sheet as of: 30-Sep-18Common Shares 18.8 Convertibles - Options (a) 0.4 Fully Diluted Shares 19.3
Market Price 105.11$ Equity Market Capitalization 2,023.7 CAGRs 3 YEAR
Revenue 13.7 %Plus: Debt 239.9 EBITDA 14.8Plus: Convertible Debt - EPS 28.3Plus: Minority Interest - Minus: Inv. In Affiliates - Leverage StatisticsMinus: Cash and Equivalents (8.2) Net Debt/EBITDA 1.5 xMinus: Other Assets - EBITDA/Interest Expense 29.1 xTotal Enterprise Value 2,255.4$ Net Debt/Total Enterprise Value 10.3 %
(a) Uses Treasury Method 52-Week High LowRange $133.00 $90.37
Financial Data
FYE 12/31 2017A 2018E 2019P 2020P
Revenue 1,569.4$ 1,838.5$ 2,072.8$ 2,308.1$ % Growth 13.1% 17.1% 12.7% 11.4%
EBITDA 149.9 172.5 200.9 226.8% Margin 9.6% 9.4% 9.7% 9.8%
EPS-Continuing Operations 2.79$ 4.31$ 5.09$ 5.89$ % Growth 32.9% 54.5% 18.1% 15.7%
Total Enterprise Value / EBITDA 15.0 x 13.1 x 11.2 x 9.9 xPrice / Earnings 37.7 24.4 20.7 17.8Source: Company Data, Bloomberg Consensus estimates as of 11/13
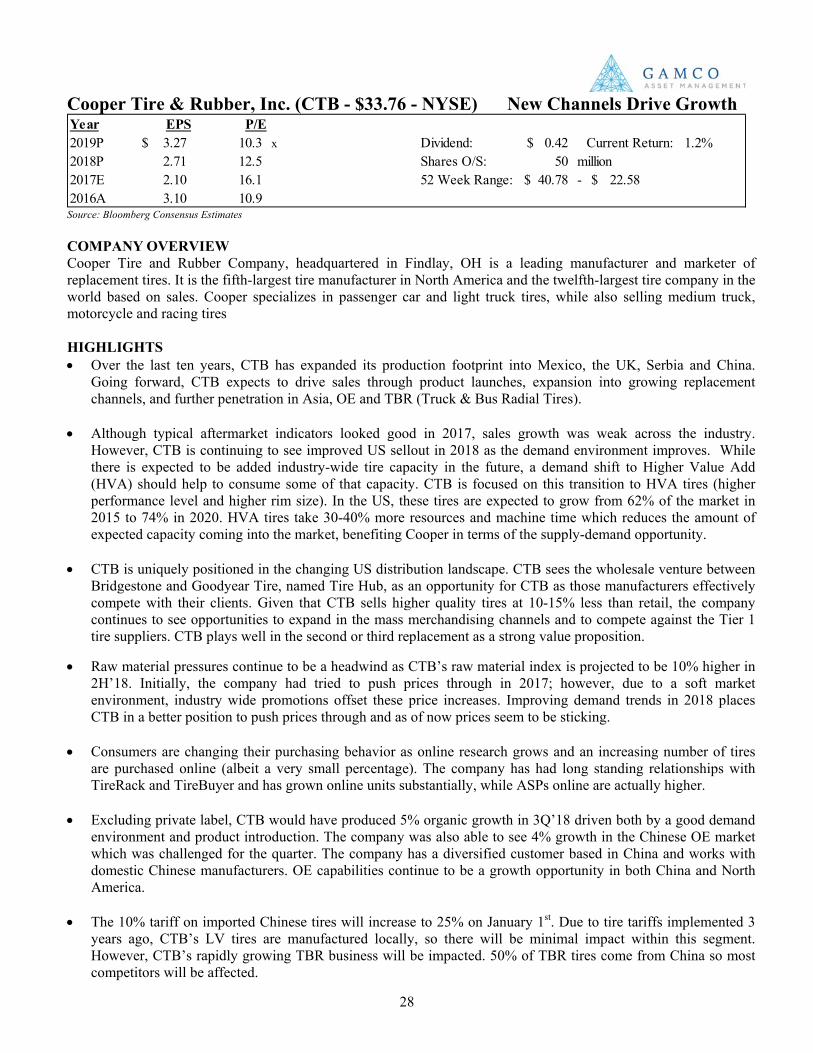
28
Cooper Tire & Rubber, Inc. (CTB - $33.76 - NYSE) New Channels Drive Growth
Source: Bloomberg Consensus Estimates COMPANY OVERVIEW Cooper Tire and Rubber Company, headquartered in Findlay, OH is a leading manufacturer and marketer of replacement tires. It is the fifth-largest tire manufacturer in North America and the twelfth-largest tire company in the world based on sales. Cooper specializes in passenger car and light truck tires, while also selling medium truck, motorcycle and racing tires HIGHLIGHTS • Over the last ten years, CTB has expanded its production footprint into Mexico, the UK, Serbia and China.
Going forward, CTB expects to drive sales through product launches, expansion into growing replacement channels, and further penetration in Asia, OE and TBR (Truck & Bus Radial Tires).
• Although typical aftermarket indicators looked good in 2017, sales growth was weak across the industry. However, CTB is continuing to see improved US sellout in 2018 as the demand environment improves. While there is expected to be added industry-wide tire capacity in the future, a demand shift to Higher Value Add (HVA) should help to consume some of that capacity. CTB is focused on this transition to HVA tires (higher performance level and higher rim size). In the US, these tires are expected to grow from 62% of the market in 2015 to 74% in 2020. HVA tires take 30-40% more resources and machine time which reduces the amount of expected capacity coming into the market, benefiting Cooper in terms of the supply-demand opportunity.
• CTB is uniquely positioned in the changing US distribution landscape. CTB sees the wholesale venture between
Bridgestone and Goodyear Tire, named Tire Hub, as an opportunity for CTB as those manufacturers effectively compete with their clients. Given that CTB sells higher quality tires at 10-15% less than retail, the company continues to see opportunities to expand in the mass merchandising channels and to compete against the Tier 1 tire suppliers. CTB plays well in the second or third replacement as a strong value proposition.
• Raw material pressures continue to be a headwind as CTB’s raw material index is projected to be 10% higher in 2H’18. Initially, the company had tried to push prices through in 2017; however, due to a soft market environment, industry wide promotions offset these price increases. Improving demand trends in 2018 places CTB in a better position to push prices through and as of now prices seem to be sticking.
• Consumers are changing their purchasing behavior as online research grows and an increasing number of tires
are purchased online (albeit a very small percentage). The company has had long standing relationships with TireRack and TireBuyer and has grown online units substantially, while ASPs online are actually higher.
• Excluding private label, CTB would have produced 5% organic growth in 3Q’18 driven both by a good demand
environment and product introduction. The company was also able to see 4% growth in the Chinese OE market which was challenged for the quarter. The company has a diversified customer based in China and works with domestic Chinese manufacturers. OE capabilities continue to be a growth opportunity in both China and North America.
• The 10% tariff on imported Chinese tires will increase to 25% on January 1st. Due to tire tariffs implemented 3
years ago, CTB’s LV tires are manufactured locally, so there will be minimal impact within this segment. However, CTB’s rapidly growing TBR business will be impacted. 50% of TBR tires come from China so most competitors will be affected.
Year EPS P/E2019P 3.27$ 10.3 x Dividend: 0.42$ Current Return: 1.2%2018P 2.71 12.5 Shares O/S: 50 million2017E 2.10 16.1 52 Week Range: 40.78$ - 22.58$ 2016A 3.10 10.9
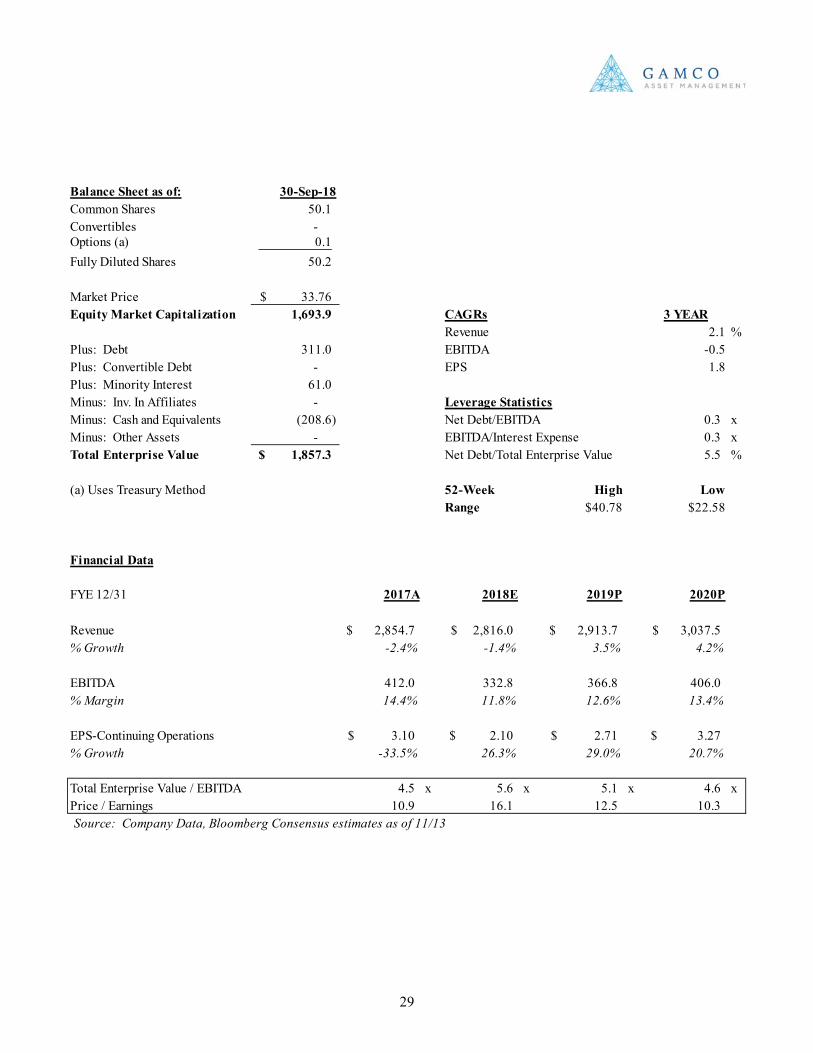
29
Balance Sheet as of: 30-Sep-18Common Shares 50.1 Convertibles - Options (a) 0.1 Fully Diluted Shares 50.2
Market Price 33.76$ Equity Market Capitalization 1,693.9 CAGRs 3 YEAR
Revenue 2.1 %Plus: Debt 311.0 EBITDA -0.5Plus: Convertible Debt - EPS 1.8Plus: Minority Interest 61.0 Minus: Inv. In Affiliates - Leverage StatisticsMinus: Cash and Equivalents (208.6) Net Debt/EBITDA 0.3 xMinus: Other Assets - EBITDA/Interest Expense 0.3 xTotal Enterprise Value 1,857.3$ Net Debt/Total Enterprise Value 5.5 %
(a) Uses Treasury Method 52-Week High LowRange $40.78 $22.58
Financial Data
FYE 12/31 2017A 2018E 2019P 2020P
Revenue 2,854.7$ 2,816.0$ 2,913.7$ 3,037.5$ % Growth -2.4% -1.4% 3.5% 4.2%
EBITDA 412.0 332.8 366.8 406.0% Margin 14.4% 11.8% 12.6% 13.4%
EPS-Continuing Operations 3.10$ 2.10$ 2.71$ 3.27$ % Growth -33.5% 26.3% 29.0% 20.7%
Total Enterprise Value / EBITDA 4.5 x 5.6 x 5.1 x 4.6 xPrice / Earnings 10.9 16.1 12.5 10.3Source: Company Data, Bloomberg Consensus estimates as of 11/13
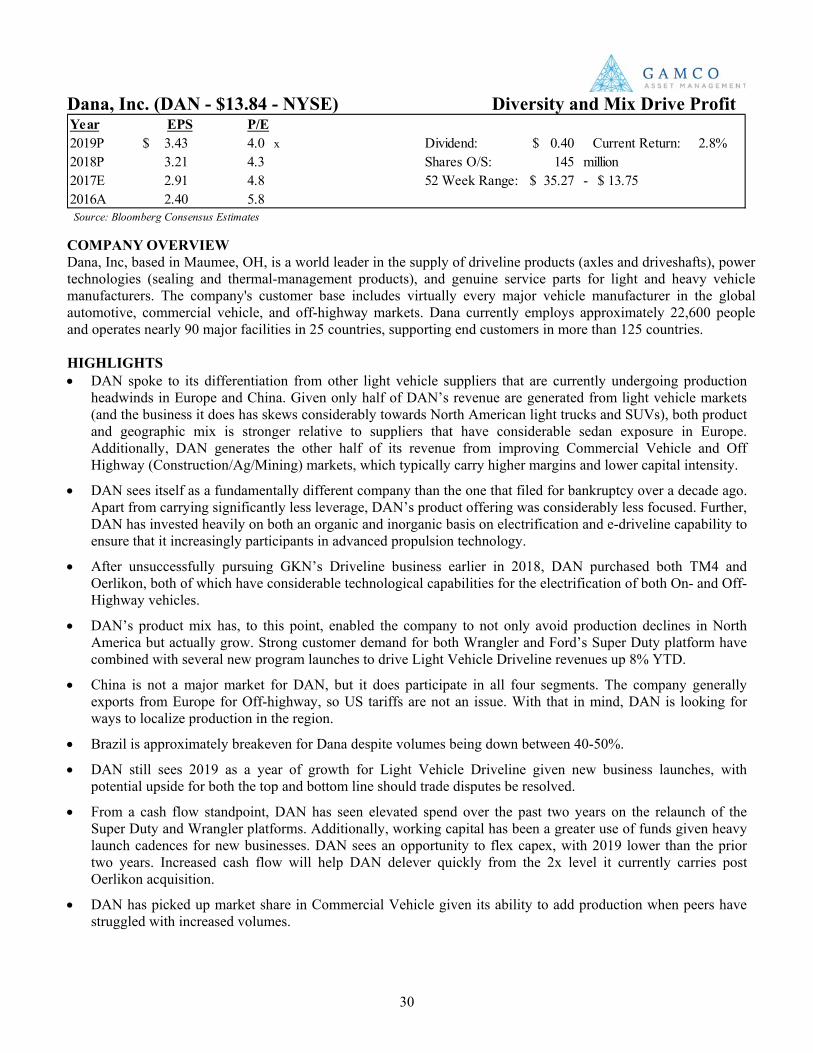
30
Dana, Inc. (DAN - $13.84 - NYSE) Diversity and Mix Drive Profit
COMPANY OVERVIEW Dana, Inc, based in Maumee, OH, is a world leader in the supply of driveline products (axles and driveshafts), power technologies (sealing and thermal-management products), and genuine service parts for light and heavy vehicle manufacturers. The company's customer base includes virtually every major vehicle manufacturer in the global automotive, commercial vehicle, and off-highway markets. Dana currently employs approximately 22,600 people and operates nearly 90 major facilities in 25 countries, supporting end customers in more than 125 countries.
HIGHLIGHTS • DAN spoke to its differentiation from other light vehicle suppliers that are currently undergoing production
headwinds in Europe and China. Given only half of DAN’s revenue are generated from light vehicle markets (and the business it does has skews considerably towards North American light trucks and SUVs), both product and geographic mix is stronger relative to suppliers that have considerable sedan exposure in Europe. Additionally, DAN generates the other half of its revenue from improving Commercial Vehicle and Off Highway (Construction/Ag/Mining) markets, which typically carry higher margins and lower capital intensity.
• DAN sees itself as a fundamentally different company than the one that filed for bankruptcy over a decade ago. Apart from carrying significantly less leverage, DAN’s product offering was considerably less focused. Further, DAN has invested heavily on both an organic and inorganic basis on electrification and e-driveline capability to ensure that it increasingly participants in advanced propulsion technology.
• After unsuccessfully pursuing GKN’s Driveline business earlier in 2018, DAN purchased both TM4 and Oerlikon, both of which have considerable technological capabilities for the electrification of both On- and Off-Highway vehicles.
• DAN’s product mix has, to this point, enabled the company to not only avoid production declines in North America but actually grow. Strong customer demand for both Wrangler and Ford’s Super Duty platform have combined with several new program launches to drive Light Vehicle Driveline revenues up 8% YTD.
• China is not a major market for DAN, but it does participate in all four segments. The company generally exports from Europe for Off-highway, so US tariffs are not an issue. With that in mind, DAN is looking for ways to localize production in the region.
• Brazil is approximately breakeven for Dana despite volumes being down between 40-50%.
• DAN still sees 2019 as a year of growth for Light Vehicle Driveline given new business launches, with potential upside for both the top and bottom line should trade disputes be resolved.
• From a cash flow standpoint, DAN has seen elevated spend over the past two years on the relaunch of the Super Duty and Wrangler platforms. Additionally, working capital has been a greater use of funds given heavy launch cadences for new businesses. DAN sees an opportunity to flex capex, with 2019 lower than the prior two years. Increased cash flow will help DAN delever quickly from the 2x level it currently carries post Oerlikon acquisition.
• DAN has picked up market share in Commercial Vehicle given its ability to add production when peers have struggled with increased volumes.
Year EPS P/E2019P 3.43$ 4.0 x Dividend: 0.40$ Current Return: 2.8%2018P 3.21 4.3 Shares O/S: 145 million2017E 2.91 4.8 52 Week Range: 35.27$ - 13.75$ 2016A 2.40 5.8 Source: Bloomberg Consensus Estimates
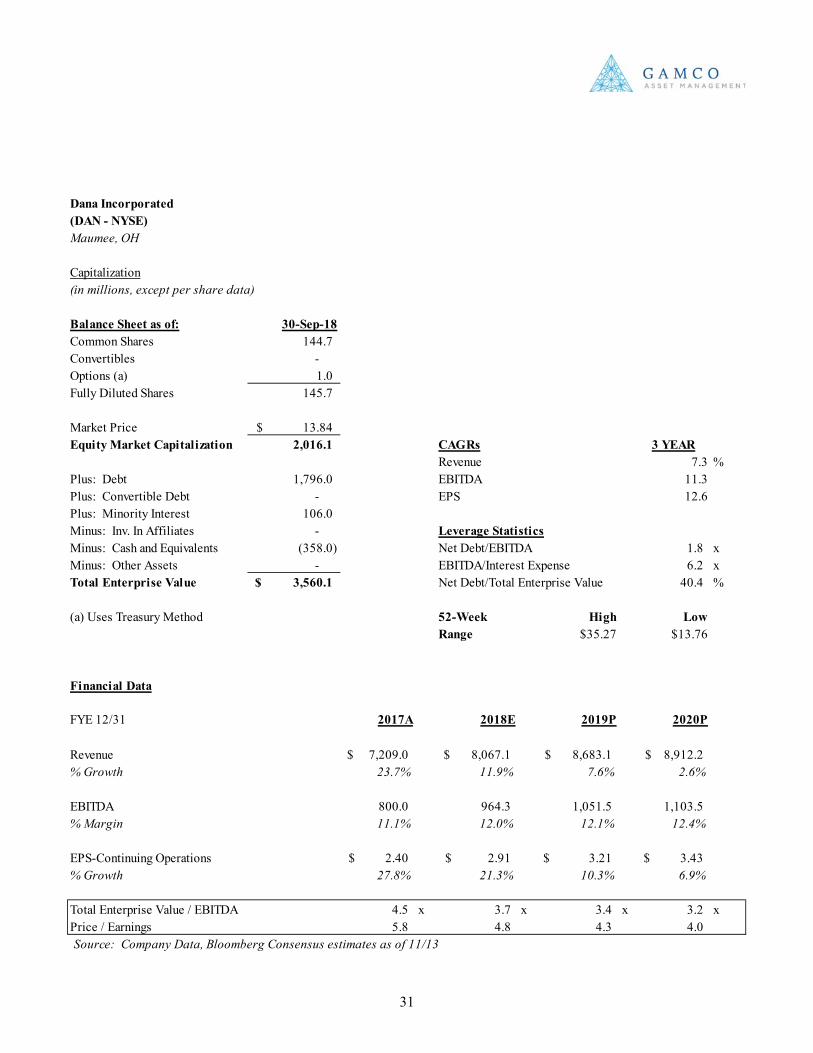
31
Dana Incorporated(DAN - NYSE)Maumee, OH
Capitalization(in millions, except per share data)
Balance Sheet as of: 30-Sep-18Common Shares 144.7 Convertibles - Options (a) 1.0 Fully Diluted Shares 145.7
Market Price 13.84$ Equity Market Capitalization 2,016.1 CAGRs 3 YEAR
Revenue 7.3 %Plus: Debt 1,796.0 EBITDA 11.3Plus: Convertible Debt - EPS 12.6Plus: Minority Interest 106.0 Minus: Inv. In Affiliates - Leverage StatisticsMinus: Cash and Equivalents (358.0) Net Debt/EBITDA 1.8 xMinus: Other Assets - EBITDA/Interest Expense 6.2 xTotal Enterprise Value 3,560.1$ Net Debt/Total Enterprise Value 40.4 %
(a) Uses Treasury Method 52-Week High LowRange $35.27 $13.76
Financial Data
FYE 12/31 2017A 2018E 2019P 2020P
Revenue 7,209.0$ 8,067.1$ 8,683.1$ 8,912.2$ % Growth 23.7% 11.9% 7.6% 2.6%
EBITDA 800.0 964.3 1,051.5 1,103.5% Margin 11.1% 12.0% 12.1% 12.4%
EPS-Continuing Operations 2.40$ 2.91$ 3.21$ 3.43$ % Growth 27.8% 21.3% 10.3% 6.9%
Total Enterprise Value / EBITDA 4.5 x 3.7 x 3.4 x 3.2 xPrice / Earnings 5.8 4.8 4.3 4.0Source: Company Data, Bloomberg Consensus estimates as of 11/13
32
Donaldson Company, Inc. (DCI - $53.49 - NYSE) Razor and Razor Blade
COMPANY OVERVIEW Donaldson Company, based in Minneapolis, MN, is a global manufacturer of worldwide filtration systems and replacement parts. The company’s products include air and liquid filtration systems and exhaust and emission control products. Donaldson has two reporting segments: Engine Products and Industrial Products.
HIGHLIGHTS • Technology provides the possibility for aftermarket capture. DCI continues to innovate within its OE business
(smaller, better performing filters) in order to generate significant recurring revenue opportunities in the years thereafter.
• Opportunities exist to expand geographically, particularly in China, where revenue stands in the low single digits but where market factors point to a considerable increase in future demand for filtration products.
• Donaldson believes it has mid-teens market share of the roughly $15 billion portion of the $65 billion global aftermarket.
• DCI to this point has not seen a decline in vehicle utilization that would signal a softening of demand not only for its own aftermarket products but also for original equipment machinery purchases. Growth has been considerable and order intake remains at very healthy levels.
• Possibilities for market expansion exist for low sulfur diesel and biodiesel markets, where regulations continue to push for cleaner fuels, requiring new filtration systems that DCI provides.
• Donaldson sees several paths for growth in China, including On Road trucking in the world’s largest truck market. It also views the opportunity as being a result of increasing not only its market presence but share in its current business.
• Energy exposure is primarily within the independent aftermarket for fracking activities along with the company’s Gas Turbine business. Regarding the latter, DCI chose to deemphasize its business as it had been primarily an assembler and not a technology provider. The result is a business that has a run rate of approximately $110 million per year, down from $170 million.
• DCI has seen no major competitive dynamics change since Parker Hannafin bought Clarcor.
• CEO Tod Carpenter is not concerned about truck and machinery electrification by the likes of Tesla and other developers given different math regarding work unit economics. Hybrids present a possibility by which content per unit declines but aftermarket revenues remain.
• The company may enjoy growth in excess of mining market volumes given the addition of various liquid filtration options since the last upcycle.
• DCI wisely made a $35 million voluntary contribution to its pension contribution this year in order to deduct at 35% instead of the new statutory tax rate of 21%.
Year EPS P/E2019P 2.99$ 17.9 x Dividend: 0.76$ Current Return: 1.4%2018P 2.60 20.5 Shares O/S: 128 million2017E 2.37 22.5 52 Week Range: 59.43$ - 43.35$ 2016A 2.00 26.7 Source: Bloomberg Consensus Estimates
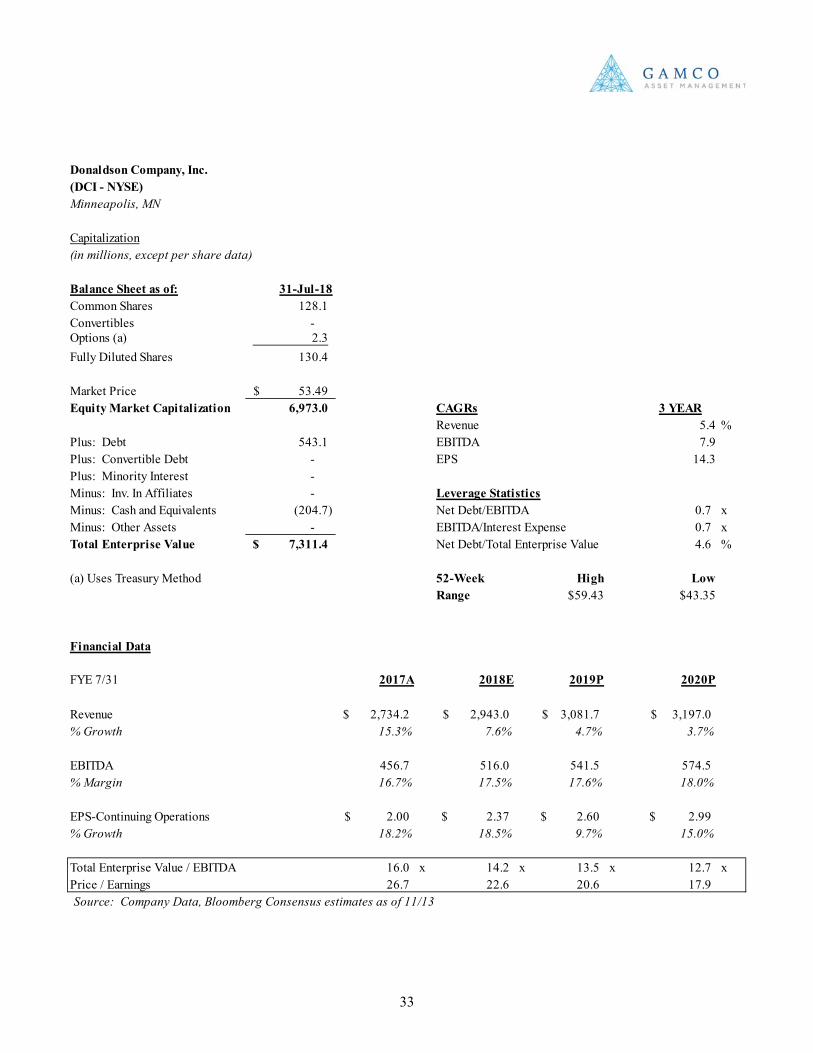
33
Donaldson Company, Inc.(DCI - NYSE)Minneapolis, MN
Capitalization(in millions, except per share data)
Balance Sheet as of: 31-Jul-18Common Shares 128.1 Convertibles - Options (a) 2.3 Fully Diluted Shares 130.4
Market Price 53.49$ Equity Market Capitalization 6,973.0 CAGRs 3 YEAR
Revenue 5.4 %Plus: Debt 543.1 EBITDA 7.9Plus: Convertible Debt - EPS 14.3Plus: Minority Interest - Minus: Inv. In Affiliates - Leverage StatisticsMinus: Cash and Equivalents (204.7) Net Debt/EBITDA 0.7 xMinus: Other Assets - EBITDA/Interest Expense 0.7 xTotal Enterprise Value 7,311.4$ Net Debt/Total Enterprise Value 4.6 %
(a) Uses Treasury Method 52-Week High LowRange $59.43 $43.35
Financial Data
FYE 7/31 2017A 2018E 2019P 2020P
Revenue 2,734.2$ 2,943.0$ 3,081.7$ 3,197.0$ % Growth 15.3% 7.6% 4.7% 3.7%
EBITDA 456.7 516.0 541.5 574.5% Margin 16.7% 17.5% 17.6% 18.0%
EPS-Continuing Operations 2.00$ 2.37$ 2.60$ 2.99$ % Growth 18.2% 18.5% 9.7% 15.0%
Total Enterprise Value / EBITDA 16.0 x 14.2 x 13.5 x 12.7 xPrice / Earnings 26.7 22.6 20.6 17.9Source: Company Data, Bloomberg Consensus estimates as of 11/13
34
Gentex Corporation (GNTX - $22.15 - NYSE) Mirrors and Margins
Source: Bloomberg COMPANY OVERVIEW Gentex Corporation, headquartered in Zeeland, MI, designs and manufactures automatic-dimming rearview and non-dimming mirrors and electronics for the automotive industry, dimmable aircraft windows for the aviation industry, and commercial smoke alarms and signaling devices for the fire protection industry. HIGHLIGHTS • CEO Steve Downing attributed Gentex’s leading market position in automotive mirrors to the company’s unique
technological strengths around electrochromic chemistry, glass processing, film coatings, and other related technologies (all protected by over 1,200 patents). Gentex’s market share of electrochromic/auto-dimmable mirrors has grown from 75% 16 years ago to 93% today.
• GNTX has made a notable expansion into other technologies and features that complement next-gen automotive connectivity including camera monitoring systems, HomeLink, biometrics, and in-vehicle payment systems. Management believes these technologies will complement and support autonomous vehicles and estimates a 3-5 year timeframe before these features are production ready. Management asserted GNTX is a leading technology company that meets automakers’ needs where they have no other solution.
• Management addressed the bear-case argument against GNTX – that autonomous vehicles will eliminate the need for mirrors. The company asserts it is not a foregone conclusion that the mirrors will be eliminated and pointed to its full-display mirror product which integrates a camera-based display within the mirror itself. Furthermore, broader adoption of fully-autonomous vehicles is likely further away than what some headlines suggest. Management also believes driver and passenger personalization through biometrics security/identification as well as in-vehicle connected car solutions for residential and retail applications will provide content opportunities in Auto 2.0.
• Management expects ongoing market outperformance to support its industry-leading margins. Mid to single-digit growth rates should provide margin stability with margin expansion expected at 7-10% growth. Management expects 3-7% growth in 4Q vs. a flat production environment.
• WLTP headwinds in Europe led to a 5% growth rate in 3Q vs. an expected high-single digit figure. Management commented that production disruptions were volatile with some OEMs changing volumes on a weekly basis. With most of the issues starting in the latter part of 3Q, the headwinds are expected to continue into 4Q and potentially into the early part of 2019.
• Although the business has historically carried a meaningful net cash position, management has become more
flexible with its capital structure. Management already took its cash level below its previously stated target of $525 million of net cash to opportunistically repurchase shares. Based on Gentex’s current EV/EBITDA multiple, management believes shares are undervalued and will use market pull backs to accelerate its share repurchase program.
Year EPS P/E2020P 2.03$ 10.9 x Dividend: 0.44$ Current Return: 2.0%2019P 1.80 12.3 Shares O/S: 262 million2018E 1.66 13.3 52 Week Range: 25.41$ - 17.80$ 2017A 1.29 17.2
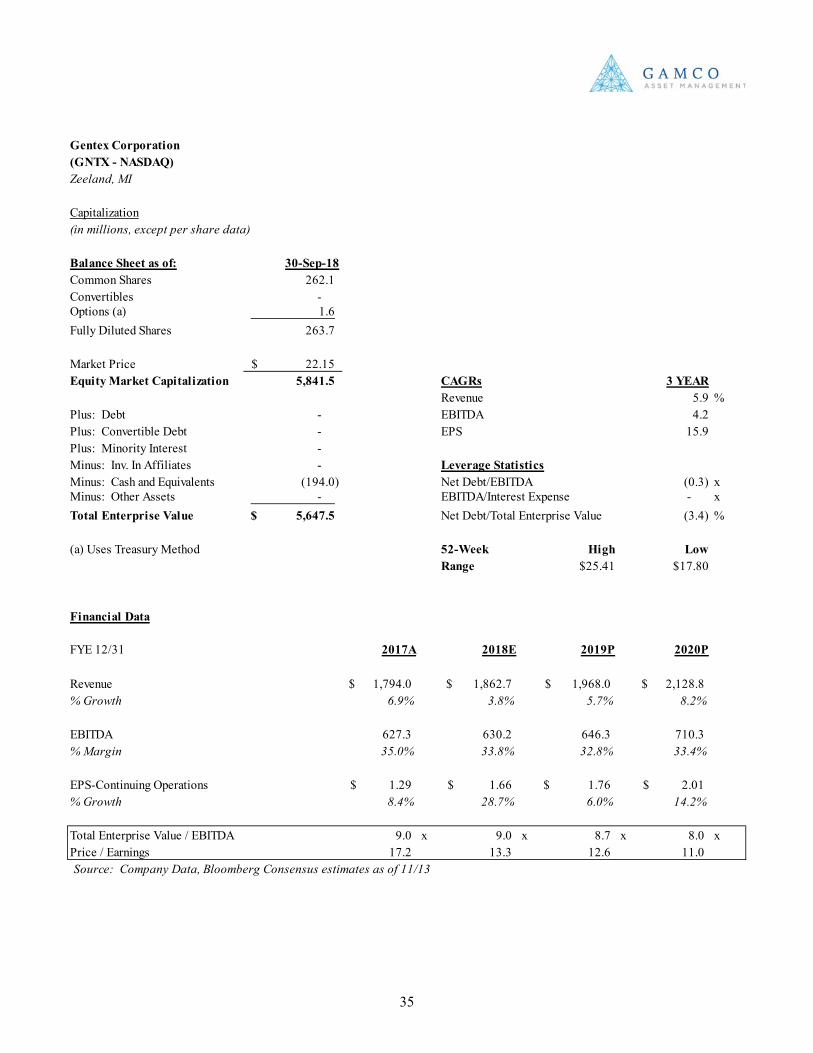
35
Gentex Corporation(GNTX - NASDAQ)Zeeland, MI
Capitalization(in millions, except per share data)
Balance Sheet as of: 30-Sep-18Common Shares 262.1 Convertibles - Options (a) 1.6 Fully Diluted Shares 263.7
Market Price 22.15$ Equity Market Capitalization 5,841.5 CAGRs 3 YEAR
Revenue 5.9 %Plus: Debt - EBITDA 4.2Plus: Convertible Debt - EPS 15.9Plus: Minority Interest - Minus: Inv. In Affiliates - Leverage StatisticsMinus: Cash and Equivalents (194.0) Net Debt/EBITDA (0.3) xMinus: Other Assets - EBITDA/Interest Expense - xTotal Enterprise Value 5,647.5$ Net Debt/Total Enterprise Value (3.4) %
(a) Uses Treasury Method 52-Week High LowRange $25.41 $17.80
Financial Data
FYE 12/31 2017A 2018E 2019P 2020P
Revenue 1,794.0$ 1,862.7$ 1,968.0$ 2,128.8$ % Growth 6.9% 3.8% 5.7% 8.2%
EBITDA 627.3 630.2 646.3 710.3% Margin 35.0% 33.8% 32.8% 33.4%
EPS-Continuing Operations 1.29$ 1.66$ 1.76$ 2.01$ % Growth 8.4% 28.7% 6.0% 14.2%
Total Enterprise Value / EBITDA 9.0 x 9.0 x 8.7 x 8.0 xPrice / Earnings 17.2 13.3 12.6 11.0Source: Company Data, Bloomberg Consensus estimates as of 11/13
36
Genuine Parts Company (GPC - $99.52 - NYSE) M&A and International Expansion
COMPANY OVERVIEW Genuine Parts Company, located in Atlanta, Georgia, is a premier North American distributor of “consumables” such as automobile replacement parts, industrial bearings, mechanical power components, and other supplies, office products, and electrical and electronic components and replacement parts. The auto parts business encompasses a network of warehouses and jobber stores under the NAPA brand and is the company’s largest and best-known operating segment.
HIGHLIGHTS • GPC has continued to extend its presence internationally through bolt-on and more transformation acquisitions in
Europe, AustralAsia and Canada across both its Industrial and Automotive markets. The acquisition of Alliance Automotive Group (AAG), which was completed a little over a year ago, generates ~$2 billion in revenue across France (#1 share), the UK (#2 share), Germany (#3 share) and Poland. This is the second time in five years that GPC went out of its core geographic presence to make a transformative acquisition. Similar to Exego, AAG had a preexisting relationship with GPC that helped facilitate the purchase. AAG shares a number of similarities with NAPA, including a three-step distribution system, similar brand names and a multi-decade track record of outstanding customer service. AAG has ~90% exposure to the fast growing DIFM customer base. With over 285 million vehicles, Europe is a larger market than US and creates plenty of opportunity for the NAPA segment as the company expects to continue to further expand in the consolidating region. AAG was considered even more attractive given that branded product constitutes a significant portion of its sales.
• While NAPA excels in the DIFM market with superior service, brand and over 17,000 NAPA auto centers, the DIY business is also 20-25% of the business. NAPA has grown DIY revenues at mid-to-high single digits over the last couple of years following an initiative to refresh stores with a newer, more customer friendly format that has helped drive more retail business. In response to this success, GPC is now rolling out this format to the independently owned stores. The company achieved a 3.2% comp in the last quarter noting a culmination of initiatives, fundamentals and of course, positive weather patterns.
• GPC is dealing with increasing costs up 6% YTD on a 5% sales increase, freight up 11% and the probable effects of tariffs and higher interest rates yet to come. While the first couple of rounds of tariffs had little effect, January’s increase will most likely begin to impact the company. GPC does have some direct purchases from Chinese factories and some domestic vendors to manufacture in China; however, most of the tariffs will only touch on a portion of the product being produced. Further, as interest rates go up, suppliers will have to pass on the additional costs from the price increases, which GPC sees as a similar cost to fuel increases. Historically, as GPC passes prices on it has seen little margin compression.
• With relation to e-commerce, GPC is a strong DIFM competitor and, in line with other comments from the presenters, does see strong growth in this segment with its service proposition as a distinct competitive advantage. While investors have worried over pricing discipline in response to e-commerce penetration, GPC was able to expand gross margin during the last quarter indicating minimal or no increase in pricing competition.
• Given that the potential merger of SP Richards with Essendant did not go through, GPC does see opportunity in the new environment as the last independent wholesaler.
• GPC does not see any slowdown in the industrial products distribution segment, Motion Industries, as the segment continues to drive high single digit comps. With inflation up +3%, Motion has been able to pass through prices and continues to be active in M&A. GPC is not uncomfortable with its current leverage and has room for additional acquisitions.
Year EPS P/E2019P 6.26$ 15.9 x Dividend: 2.88$ Current Return: 2.8%2018P 5.95 16.7 Shares O/S: 148 million2017E 5.65 17.6 52 Week Range: $107.75 - $84.712016A 4.63 21.5 Source: Bloomberg Consensus Estimates
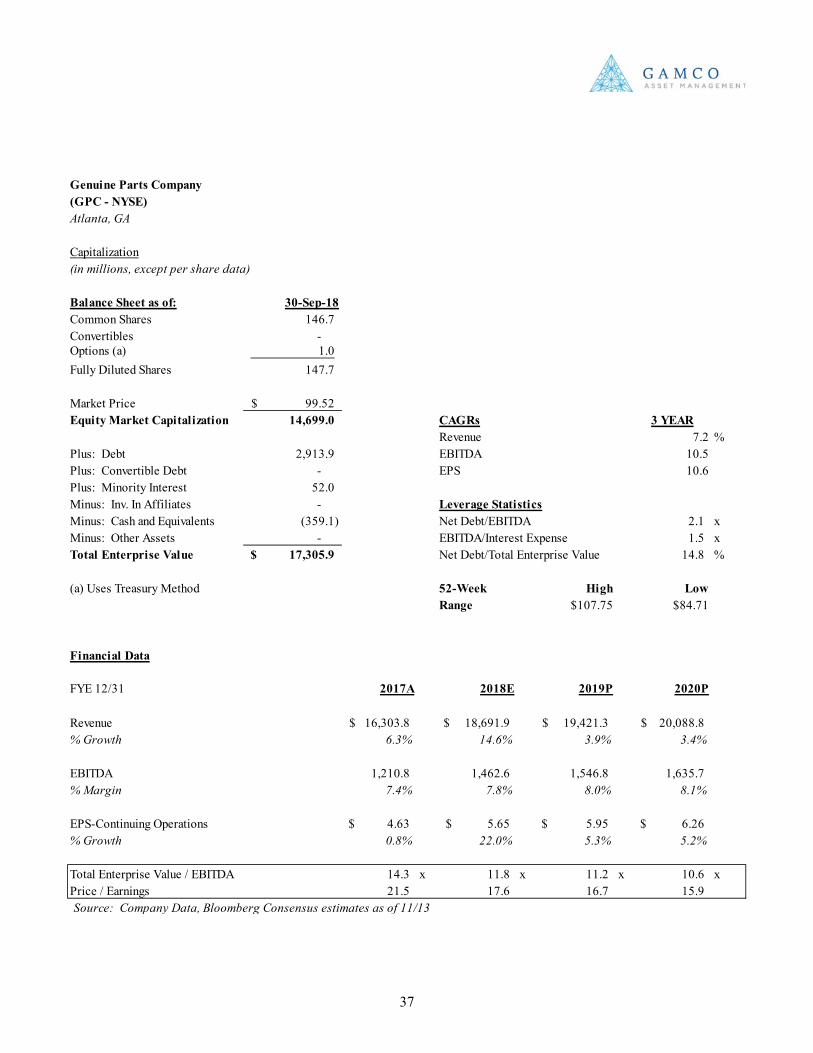
37
Genuine Parts Company(GPC - NYSE)Atlanta, GA
Capitalization(in millions, except per share data)
Balance Sheet as of: 30-Sep-18Common Shares 146.7 Convertibles - Options (a) 1.0 Fully Diluted Shares 147.7
Market Price 99.52$ Equity Market Capitalization 14,699.0 CAGRs 3 YEAR
Revenue 7.2 %Plus: Debt 2,913.9 EBITDA 10.5Plus: Convertible Debt - EPS 10.6Plus: Minority Interest 52.0 Minus: Inv. In Affiliates - Leverage StatisticsMinus: Cash and Equivalents (359.1) Net Debt/EBITDA 2.1 xMinus: Other Assets - EBITDA/Interest Expense 1.5 xTotal Enterprise Value 17,305.9$ Net Debt/Total Enterprise Value 14.8 %
(a) Uses Treasury Method 52-Week High LowRange $107.75 $84.71
Financial Data
FYE 12/31 2017A 2018E 2019P 2020P
Revenue 16,303.8$ 18,691.9$ 19,421.3$ 20,088.8$ % Growth 6.3% 14.6% 3.9% 3.4%
EBITDA 1,210.8 1,462.6 1,546.8 1,635.7% Margin 7.4% 7.8% 8.0% 8.1%
EPS-Continuing Operations 4.63$ 5.65$ 5.95$ 6.26$ % Growth 0.8% 22.0% 5.3% 5.2%
Total Enterprise Value / EBITDA 14.3 x 11.8 x 11.2 x 10.6 xPrice / Earnings 21.5 17.6 16.7 15.9Source: Company Data, Bloomberg Consensus estimates as of 11/13
38
Lear Corporation (LEA - $133.91 - NYSE) Disciplined Growth
Source: Bloomberg COMPANY OVERVIEW Lear Corporation, based in Southfield, MI, is a leading Tier 1 global supplier of seating assemblies and electrical distribution systems for the automotive industry. Lear provides content on approximately 300 vehicle nameplates worldwide, counting every major global auto OEM as a customer. HIGHLIGHTS • LEA views the shift to crossovers and SUVs as part of a long-term trend and expects the segment’s share of the
market to grow from 35% today to 40% by 2023. Management noted how it strategically aligned itself for this shift over the past several years by building 90% of its current backlog around crossover and SUV programs.
• Management discussed the evolution of the seat to a smart device with personalization features and how this
provides meaningful long-term content opportunities. LEA is already developing next-gen seating content including biometrics, active safety support, modular heating and cooling, personalized audio, and individualized comfort settings.
• The E-Systems business continues to become a larger part of the LEA narrative with electrification and connectivity providing compelling growth opportunities. Management noted LEA is now the only supplier with both electrical architecture and power electronics capabilities. Content per vehicle for E-Systems can range from an incremental $300 to $2,000.
• Management maintained its view that LEA is better positioned with Seating and E-Systems under one roof. Intelligent seating is being developed by E-Systems and the company already has in-house capabilities that other seat makers are trying to obtain. Given how well-situated the business is relative to the convergence of automotive megatrends, any disruptions associated with a separation of both businesses would likely result in customer losses. That being said, LEA will listen to any proposal but management believes a move to split the company would be a mistake given the strong quoting activity.
• Regarding capital allocation, reinvestment remains the top priority but LEA will remain opportunistic with
M&A, especially with acquisitions that help expand the company’s capabilities within electrification and connectivity, particularly in Asia. Share repurchases will also continue to be a major pillar of the capital allocation strategy.
• LEA is a completely different company today compared to what it was a decade ago. Besides having secular growth tailwinds in both businesses, management believes its financial discipline is what sets it apart from previous regimes. Management will only take on new business if it meets the requisite margin profile and is not pursuing growth for the sake of growth, which ultimately resulted in the company’s 2009 bankruptcy.
• Despite recent macro headwinds, China remains a key area of future growth as electrification and connectivity continues to gain momentum in the region. Seating has historically opened the door for E-Systems, however, the reverse is true in China. Vehicle connectivity is widely preferred by consumers and the shift to crossovers and SUVs is also a major trend in China.
Year EPS P/E2020P 22.25$ 6.0 x Dividend: 2.80$ Current Return: 2.1%2019P 20.41 6.6 Shares O/S: 64 million2018E 18.80 7.1 52 Week Range: 206.36$ - 128.05$ 2017A 16.63 8.1
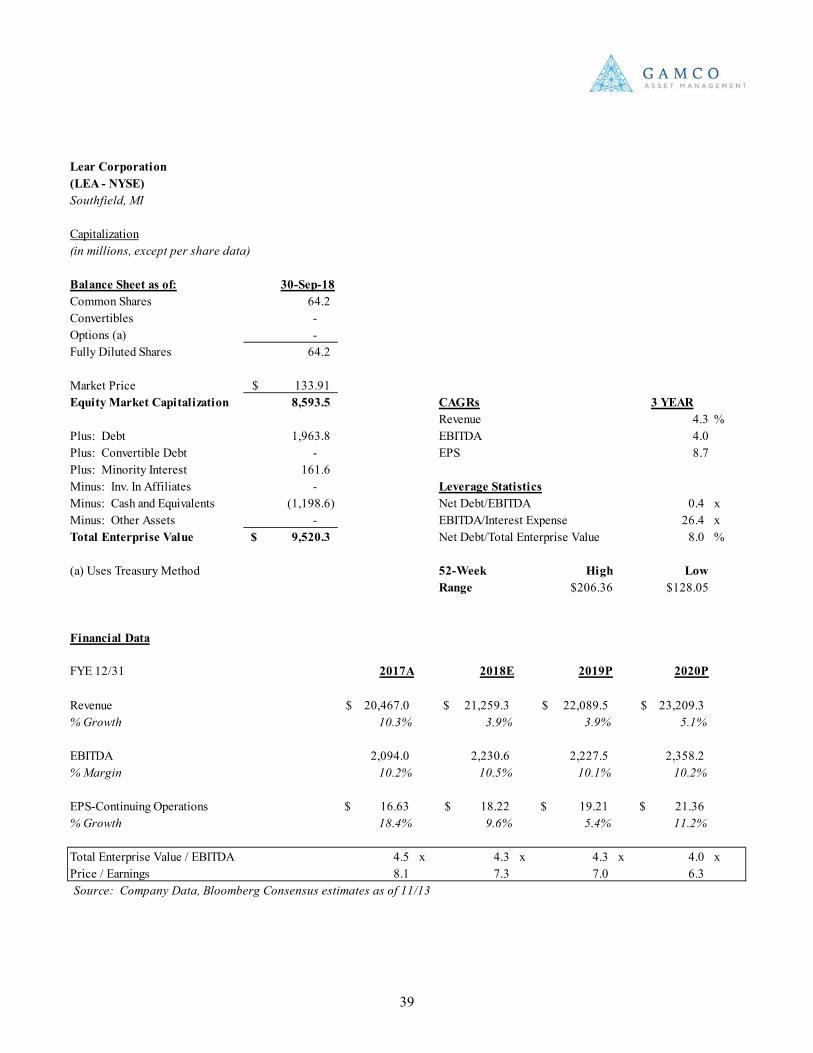
39
Lear Corporation(LEA - NYSE)Southfield, MI
Capitalization(in millions, except per share data)
Balance Sheet as of: 30-Sep-18Common Shares 64.2 Convertibles - Options (a) - Fully Diluted Shares 64.2
Market Price 133.91$ Equity Market Capitalization 8,593.5 CAGRs 3 YEAR
Revenue 4.3 %Plus: Debt 1,963.8 EBITDA 4.0Plus: Convertible Debt - EPS 8.7Plus: Minority Interest 161.6 Minus: Inv. In Affiliates - Leverage StatisticsMinus: Cash and Equivalents (1,198.6) Net Debt/EBITDA 0.4 xMinus: Other Assets - EBITDA/Interest Expense 26.4 xTotal Enterprise Value 9,520.3$ Net Debt/Total Enterprise Value 8.0 %
(a) Uses Treasury Method 52-Week High LowRange $206.36 $128.05
Financial Data
FYE 12/31 2017A 2018E 2019P 2020P
Revenue 20,467.0$ 21,259.3$ 22,089.5$ 23,209.3$ % Growth 10.3% 3.9% 3.9% 5.1%
EBITDA 2,094.0 2,230.6 2,227.5 2,358.2% Margin 10.2% 10.5% 10.1% 10.2%
EPS-Continuing Operations 16.63$ 18.22$ 19.21$ 21.36$ % Growth 18.4% 9.6% 5.4% 11.2%
Total Enterprise Value / EBITDA 4.5 x 4.3 x 4.3 x 4.0 xPrice / Earnings 8.1 7.3 7.0 6.3Source: Company Data, Bloomberg Consensus estimates as of 11/13
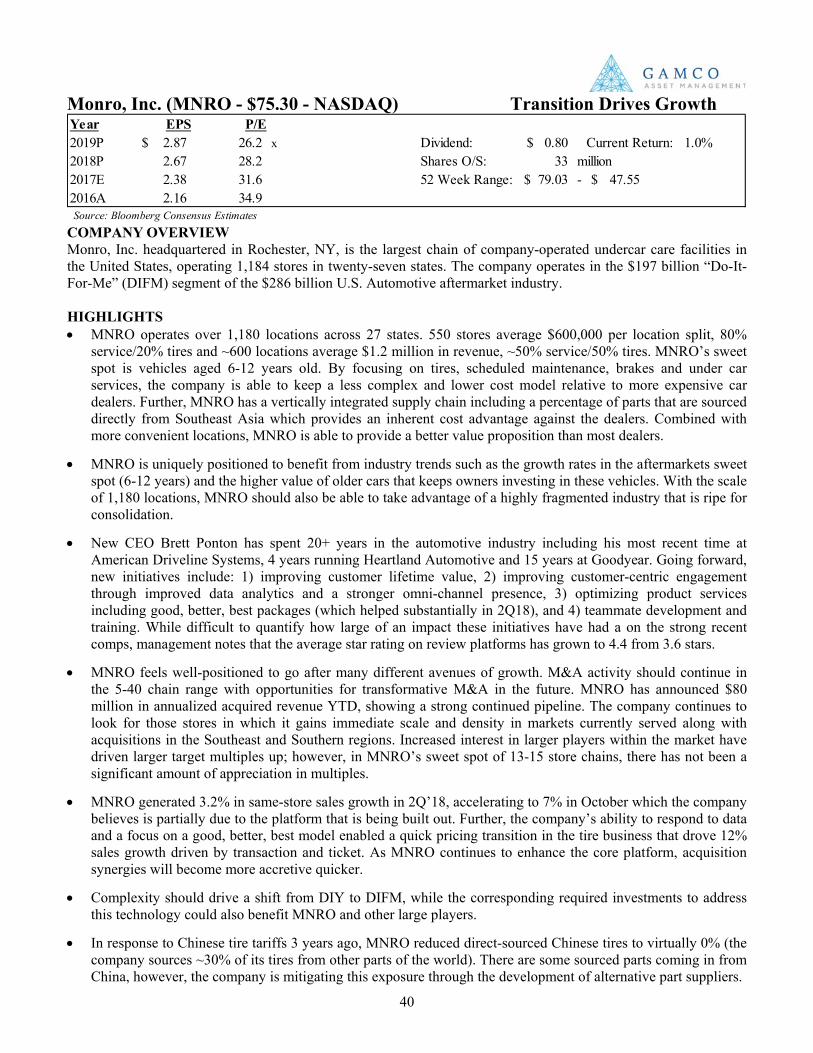
40
Monro, Inc. (MNRO - $75.30 - NASDAQ) Transition Drives Growth
COMPANY OVERVIEW Monro, Inc. headquartered in Rochester, NY, is the largest chain of company-operated undercar care facilities in the United States, operating 1,184 stores in twenty-seven states. The company operates in the $197 billion “Do-It-For-Me” (DIFM) segment of the $286 billion U.S. Automotive aftermarket industry. HIGHLIGHTS • MNRO operates over 1,180 locations across 27 states. 550 stores average $600,000 per location split, 80%
service/20% tires and ~600 locations average $1.2 million in revenue, ~50% service/50% tires. MNRO’s sweet spot is vehicles aged 6-12 years old. By focusing on tires, scheduled maintenance, brakes and under car services, the company is able to keep a less complex and lower cost model relative to more expensive car dealers. Further, MNRO has a vertically integrated supply chain including a percentage of parts that are sourced directly from Southeast Asia which provides an inherent cost advantage against the dealers. Combined with more convenient locations, MNRO is able to provide a better value proposition than most dealers.
• MNRO is uniquely positioned to benefit from industry trends such as the growth rates in the aftermarkets sweet spot (6-12 years) and the higher value of older cars that keeps owners investing in these vehicles. With the scale of 1,180 locations, MNRO should also be able to take advantage of a highly fragmented industry that is ripe for consolidation.
• New CEO Brett Ponton has spent 20+ years in the automotive industry including his most recent time at American Driveline Systems, 4 years running Heartland Automotive and 15 years at Goodyear. Going forward, new initiatives include: 1) improving customer lifetime value, 2) improving customer-centric engagement through improved data analytics and a stronger omni-channel presence, 3) optimizing product services including good, better, best packages (which helped substantially in 2Q18), and 4) teammate development and training. While difficult to quantify how large of an impact these initiatives have had a on the strong recent comps, management notes that the average star rating on review platforms has grown to 4.4 from 3.6 stars.
• MNRO feels well-positioned to go after many different avenues of growth. M&A activity should continue in the 5-40 chain range with opportunities for transformative M&A in the future. MNRO has announced $80 million in annualized acquired revenue YTD, showing a strong continued pipeline. The company continues to look for those stores in which it gains immediate scale and density in markets currently served along with acquisitions in the Southeast and Southern regions. Increased interest in larger players within the market have driven larger target multiples up; however, in MNRO’s sweet spot of 13-15 store chains, there has not been a significant amount of appreciation in multiples.
• MNRO generated 3.2% in same-store sales growth in 2Q’18, accelerating to 7% in October which the company believes is partially due to the platform that is being built out. Further, the company’s ability to respond to data and a focus on a good, better, best model enabled a quick pricing transition in the tire business that drove 12% sales growth driven by transaction and ticket. As MNRO continues to enhance the core platform, acquisition synergies will become more accretive quicker.
• Complexity should drive a shift from DIY to DIFM, while the corresponding required investments to address this technology could also benefit MNRO and other large players.
• In response to Chinese tire tariffs 3 years ago, MNRO reduced direct-sourced Chinese tires to virtually 0% (the company sources ~30% of its tires from other parts of the world). There are some sourced parts coming in from China, however, the company is mitigating this exposure through the development of alternative part suppliers.
Year EPS P/E2019P 2.87$ 26.2 x Dividend: 0.80$ Current Return: 1.0%2018P 2.67 28.2 Shares O/S: 33 million2017E 2.38 31.6 52 Week Range: 79.03$ - 47.55$ 2016A 2.16 34.9 Source: Bloomberg Consensus Estimates
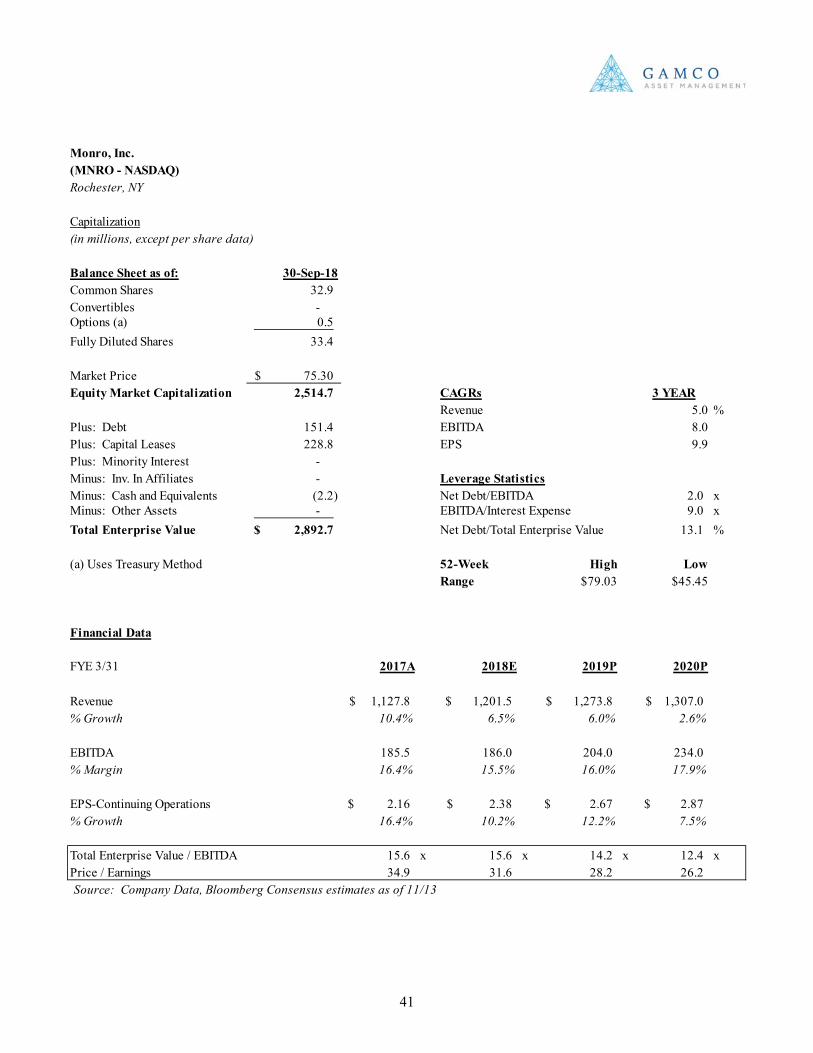
41
Monro, Inc.(MNRO - NASDAQ)Rochester, NY
Capitalization(in millions, except per share data)
Balance Sheet as of: 30-Sep-18Common Shares 32.9 Convertibles - Options (a) 0.5 Fully Diluted Shares 33.4
Market Price 75.30$ Equity Market Capitalization 2,514.7 CAGRs 3 YEAR
Revenue 5.0 %Plus: Debt 151.4 EBITDA 8.0Plus: Capital Leases 228.8 EPS 9.9Plus: Minority Interest - Minus: Inv. In Affiliates - Leverage StatisticsMinus: Cash and Equivalents (2.2) Net Debt/EBITDA 2.0 xMinus: Other Assets - EBITDA/Interest Expense 9.0 xTotal Enterprise Value 2,892.7$ Net Debt/Total Enterprise Value 13.1 %
(a) Uses Treasury Method 52-Week High LowRange $79.03 $45.45
Financial Data
FYE 3/31 2017A 2018E 2019P 2020P
Revenue 1,127.8$ 1,201.5$ 1,273.8$ 1,307.0$ % Growth 10.4% 6.5% 6.0% 2.6%
EBITDA 185.5 186.0 204.0 234.0% Margin 16.4% 15.5% 16.0% 17.9%
EPS-Continuing Operations 2.16$ 2.38$ 2.67$ 2.87$ % Growth 16.4% 10.2% 12.2% 7.5%
Total Enterprise Value / EBITDA 15.6 x 15.6 x 14.2 x 12.4 xPrice / Earnings 34.9 31.6 28.2 26.2Source: Company Data, Bloomberg Consensus estimates as of 11/13
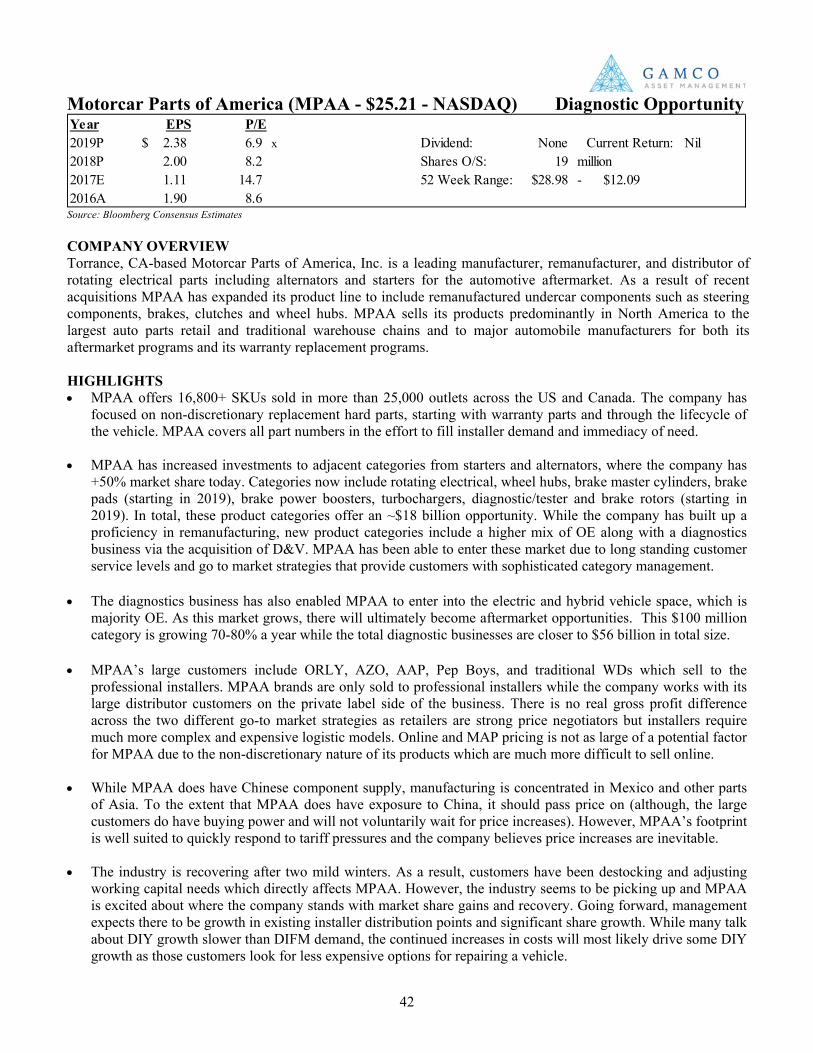
42
Motorcar Parts of America (MPAA - $25.21 - NASDAQ) Diagnostic Opportunity
Source: Bloomberg Consensus Estimates COMPANY OVERVIEW Torrance, CA-based Motorcar Parts of America, Inc. is a leading manufacturer, remanufacturer, and distributor of rotating electrical parts including alternators and starters for the automotive aftermarket. As a result of recent acquisitions MPAA has expanded its product line to include remanufactured undercar components such as steering components, brakes, clutches and wheel hubs. MPAA sells its products predominantly in North America to the largest auto parts retail and traditional warehouse chains and to major automobile manufacturers for both its aftermarket programs and its warranty replacement programs. HIGHLIGHTS • MPAA offers 16,800+ SKUs sold in more than 25,000 outlets across the US and Canada. The company has
focused on non-discretionary replacement hard parts, starting with warranty parts and through the lifecycle of the vehicle. MPAA covers all part numbers in the effort to fill installer demand and immediacy of need.
• MPAA has increased investments to adjacent categories from starters and alternators, where the company has +50% market share today. Categories now include rotating electrical, wheel hubs, brake master cylinders, brake pads (starting in 2019), brake power boosters, turbochargers, diagnostic/tester and brake rotors (starting in 2019). In total, these product categories offer an ~$18 billion opportunity. While the company has built up a proficiency in remanufacturing, new product categories include a higher mix of OE along with a diagnostics business via the acquisition of D&V. MPAA has been able to enter these market due to long standing customer service levels and go to market strategies that provide customers with sophisticated category management.
• The diagnostics business has also enabled MPAA to enter into the electric and hybrid vehicle space, which is
majority OE. As this market grows, there will ultimately become aftermarket opportunities. This $100 million category is growing 70-80% a year while the total diagnostic businesses are closer to $56 billion in total size.
• MPAA’s large customers include ORLY, AZO, AAP, Pep Boys, and traditional WDs which sell to the
professional installers. MPAA brands are only sold to professional installers while the company works with its large distributor customers on the private label side of the business. There is no real gross profit difference across the two different go-to market strategies as retailers are strong price negotiators but installers require much more complex and expensive logistic models. Online and MAP pricing is not as large of a potential factor for MPAA due to the non-discretionary nature of its products which are much more difficult to sell online.
• While MPAA does have Chinese component supply, manufacturing is concentrated in Mexico and other parts
of Asia. To the extent that MPAA does have exposure to China, it should pass price on (although, the large customers do have buying power and will not voluntarily wait for price increases). However, MPAA’s footprint is well suited to quickly respond to tariff pressures and the company believes price increases are inevitable.
• The industry is recovering after two mild winters. As a result, customers have been destocking and adjusting working capital needs which directly affects MPAA. However, the industry seems to be picking up and MPAA is excited about where the company stands with market share gains and recovery. Going forward, management expects there to be growth in existing installer distribution points and significant share growth. While many talk about DIY growth slower than DIFM demand, the continued increases in costs will most likely drive some DIY growth as those customers look for less expensive options for repairing a vehicle.
Year EPS P/E2019P 2.38$ 6.9 x Dividend: None Current Return: Nil2018P 2.00 8.2 Shares O/S: 19 million2017E 1.11 14.7 52 Week Range: $28.98 - $12.092016A 1.90 8.6
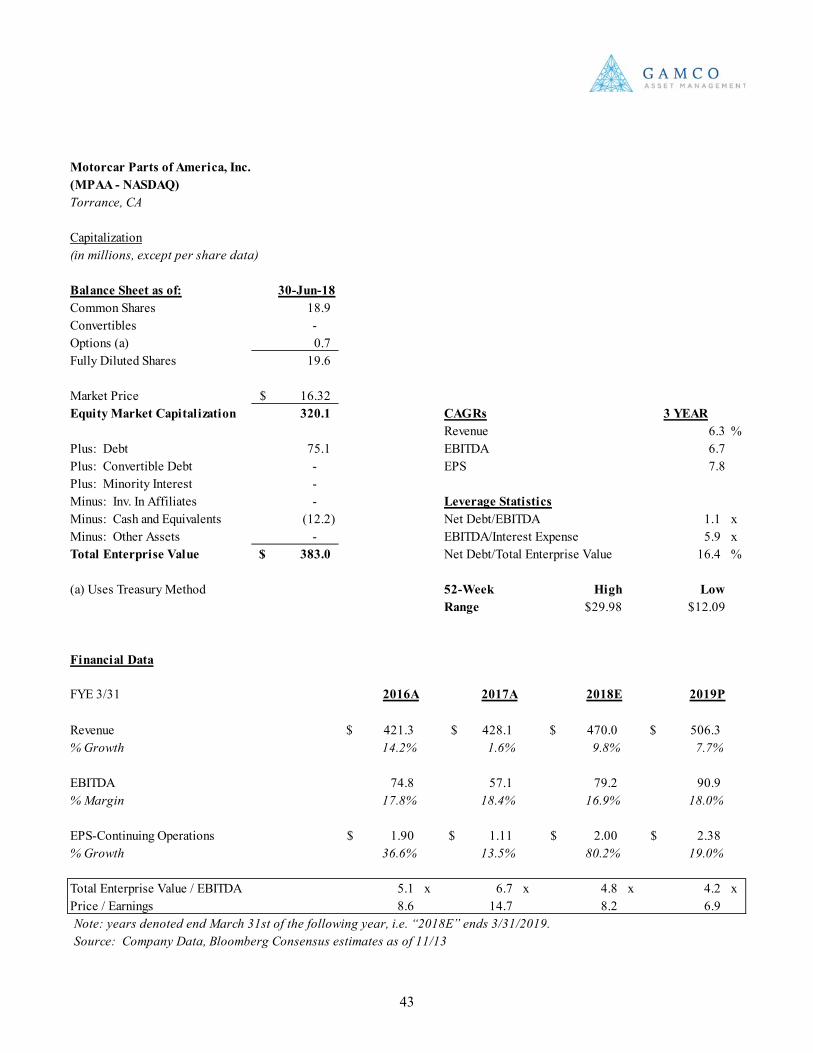
43
Motorcar Parts of America, Inc.(MPAA - NASDAQ)Torrance, CA
Capitalization(in millions, except per share data)
Balance Sheet as of: 30-Jun-18Common Shares 18.9 Convertibles - Options (a) 0.7 Fully Diluted Shares 19.6
Market Price 16.32$ Equity Market Capitalization 320.1 CAGRs 3 YEAR
Revenue 6.3 %Plus: Debt 75.1 EBITDA 6.7Plus: Convertible Debt - EPS 7.8Plus: Minority Interest - Minus: Inv. In Affiliates - Leverage StatisticsMinus: Cash and Equivalents (12.2) Net Debt/EBITDA 1.1 xMinus: Other Assets - EBITDA/Interest Expense 5.9 xTotal Enterprise Value 383.0$ Net Debt/Total Enterprise Value 16.4 %
(a) Uses Treasury Method 52-Week High LowRange $29.98 $12.09
Financial Data
FYE 3/31 2016A 2017A 2018E 2019P
Revenue 421.3$ 428.1$ 470.0$ 506.3$ % Growth 14.2% 1.6% 9.8% 7.7%
EBITDA 74.8 57.1 79.2 90.9% Margin 17.8% 18.4% 16.9% 18.0%
EPS-Continuing Operations 1.90$ 1.11$ 2.00$ 2.38$ % Growth 36.6% 13.5% 80.2% 19.0%
Total Enterprise Value / EBITDA 5.1 x 6.7 x 4.8 x 4.2 xPrice / Earnings 8.6 14.7 8.2 6.9Note: years denoted end March 31st of the following year, i.e. “2018E” ends 3/31/2019.Source: Company Data, Bloomberg Consensus estimates as of 11/13
44
Navistar International Inc. (NAV - $28.60 - NYSE) Share Coming Back
COMPANY OVERVIEW Navistar International Corp., based in Warrenville, IL, manufactures Class 4-8 trucks, buses, and defense vehicles, as well as mid-range diesel engines and parts for the trucking industry. A wholly-owned subsidiary, Navistar Financial Corporation, provides financing of products sold by the company’s truck segment. HIGHLIGHTS • Navistar not only reiterated expectations for its first year of free cash flow since its turnaround began but sees
sufficient evidence of a strong Q1 (January 2019) that it may allow the company to use cash on hand to retire its April converts.
• The company remains on track to hit its $500 million in cumulative VW cost saves within the first five years, with new products in development across the gamut of rapidly changing technology.
• The company’s VW alliance will allow for a reversal in parts revenue as it reintroduces integrated powertrain offerings. NAV lost considerable engine share after its EGR issues, ceding much of the long term parts tail to CMI given customer engine preference. Regaining engine share remains a lucrative long term opportunity for NAV (and VW as well).
• NAV views its 270bps of share recovery in Class 8 this year as indicative of coming convergence of its order share (high teens %) to its retail share (13%). As fleet orders are delivered ,NAV expects to see a continuation of retail share trends, not only for Class 8 but also for new medium duty offerings.
• Chairman & CEO Troy Clarke expressed optimism not only for a strong 2019 but some push of demand into 2020.
• Regarding cash flow, NAV believes it is positioning itself to eventually get to investment grade credit (not in the near future). Such improvement would enable the company to use a revolver for cash management and ultimately lower the amount of cash that it carries at any one point. In the near term, NAV will continue to emphasize reinvestment in the business along with in future technologies (Electrification, ADAS) to position the company well for the long term.
• NAV noted that there was nothing to add regarding its relationship with VW/Traton but reiterated why it owning NAV would be beneficial to the new truck company (which essentially mirrored its pitch to current and potential NAV shareholders).
• NAV’s Brazil operations are essentially slightly profitable in a market at the beginning of a recovery. While regional industry dynamics do not support monetization at present, the possibility exists at some point.
• Supply chain issues remained through the company’s third quarter, but it believes it will be able to catch up to production in 4Q as it believes its suppliers have sufficiently ramped their own manufacturing efforts to an appropriate speed.
• Regarding the length of cycle, NAV sees the possibility that 3% GDP brings capacity expansion for fleets (with 2% growth sufficient for replacement demand). Consumer demand for goods remains high and industrial production numbers (ISM specifically) remain firmly supportive of expansion.
• NAV sees its JV procurement alliance with VW as critical for stemming issues related to the potential impact of tariffs.
Year EPS P/E2019P 3.48$ 8.2 x Dividend: None Current Return: Nil2018P 3.81 7.5 Shares O/S: 99 million2017E 3.32 8.6 52 Week Range: 47.73$ - 28.25$ 2016A 0.70 40.9 Source: Bloomberg Consensus Estimates
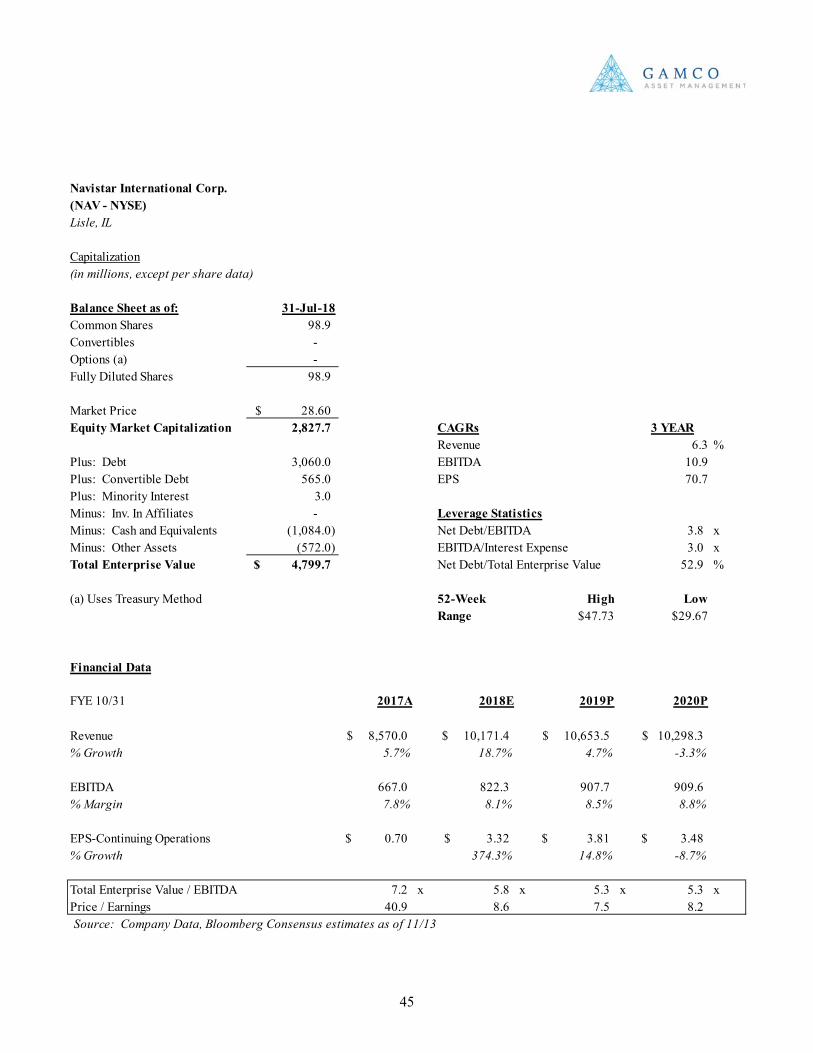
45
Navistar International Corp.(NAV - NYSE)Lisle, IL
Capitalization(in millions, except per share data)
Balance Sheet as of: 31-Jul-18Common Shares 98.9 Convertibles - Options (a) - Fully Diluted Shares 98.9
Market Price 28.60$ Equity Market Capitalization 2,827.7 CAGRs 3 YEAR
Revenue 6.3 %Plus: Debt 3,060.0 EBITDA 10.9Plus: Convertible Debt 565.0 EPS 70.7Plus: Minority Interest 3.0 Minus: Inv. In Affiliates - Leverage StatisticsMinus: Cash and Equivalents (1,084.0) Net Debt/EBITDA 3.8 xMinus: Other Assets (572.0) EBITDA/Interest Expense 3.0 xTotal Enterprise Value 4,799.7$ Net Debt/Total Enterprise Value 52.9 %
(a) Uses Treasury Method 52-Week High LowRange $47.73 $29.67
Financial Data
FYE 10/31 2017A 2018E 2019P 2020P
Revenue 8,570.0$ 10,171.4$ 10,653.5$ 10,298.3$ % Growth 5.7% 18.7% 4.7% -3.3%
EBITDA 667.0 822.3 907.7 909.6% Margin 7.8% 8.1% 8.5% 8.8%
EPS-Continuing Operations 0.70$ 3.32$ 3.81$ 3.48$ % Growth 374.3% 14.8% -8.7%
Total Enterprise Value / EBITDA 7.2 x 5.8 x 5.3 x 5.3 xPrice / Earnings 40.9 8.6 7.5 8.2Source: Company Data, Bloomberg Consensus estimates as of 11/13
46
O’Reilly Automotive, Inc. (ORLY - $336.07 - NASDAQ) Regional Expansion as an Opp
COMPANY OVERVIEW O’Reilly Automotive, Inc., headquartered in Springfield, MO, is one of the largest specialty retailers of automotive aftermarket parts, tools, supplies, equipment and accessories in the United States. The company sells to both the DIY (Do-It-Yourself) and DIFM (Do-It-For-Me) markets. As of September 30, 2018, O’Reilly operated 5,190 stores in 47 states. HIGHLIGHTS • ORLY’s tiered distribution network of 27 distribution centers, +300 hubs, and over 5,000 stores along with
superior service levels provides competitive advantages against both brick-and-mortar and e-commerce competition. The customer base is ~42% DIFM and ~58% DIY, both of which require immediacy of parts and high service levels. Due to +60 years of running this business model, ORLY is able to provide multiple trips per day and on the weekends to over 90% of its stores, meeting 30 minute delivery times. This is relative to some other competitors that have attempted this distribution frequency, but have not been able to execute profitably. Given that industry techs often get paid per job and repair chains fight for the best techs, this is a significant advantage. While the company does not break out failure, maintenance and other categories, ORLY says that over 75% of its parts have a specific vehicle part number versus more commoditized categories such as oil and chemicals. Performance products are now a small portion of sales.
• ORLY produced ~4% comps YTD vs 1.5% one year ago, outperforming peers. In addition to ORLY’s aforementioned competitive advantages, management attributes the comp performance to normalized weather patterns (after 2 years of mild weather), a stronger consumer less prone to deferring maintenance, and less impact from lower new car sales from the Great Recession (which are no longer just entering the 6-11 year sweet spot of the aftermarket). Improving consumer economics, a higher-value vehicle population that lasts longer, and continued miles driven should support long term industry growth. ORLY sees 1.5-3.0% DIY growth and 2.0-4.5% DIFM growth due to the technical nature of the new car parc. Management also noted that unpredicted spike hikes in fuel prices affect the price-sensitive DIY customer the most. Going forward, ORLY expects 2.5-3.0% industry growth plus additional share gains.
• ORLY is expecting to see more price increases in 4Q’18 than seen in the last 5 years, not only as the average ticket increases with advancement in vehicle technology, but in expectation of future commodity and tariff prices. Further, wages and freight will continue to increase as will interest rates on vendor terms. The company, and the industry, has been historically able to pass these prices on as consumers need to keep their vehicles running and ORLY is able to maintain its gross margin percentage even while running at 1.4x turns. To the extent that ORLY does sell some accessories and maintenance products, those are more likely to be deferred. Further, the tariffs will impact the entire industry and any parts sourced from China are parts that are sourced by the whole industry placing ORLY in a strong position across the entire playing field.
• ORLY was able to capture ~$220 million in cost savings from new tax cuts which partially went to wages and people, but also to ORLY’s initiatives on B2C e-commerce which is one of the company’s biggest priorities in 2018 and beyond. Management has spent considerable amount of time working on content and search to improve online performance.
• Organic growth has been a consistent driver of growth over time with the company expecting to open 200-210
new stores in 2019 with expansion opportunities in markets such as the Northeast and Florida. Further, given the company’s history of successfully integration acquisitions, ORLY is reviewing potential non-US acquisitions in Canada or Mexico, noting strong industries in these cross-border opportunities.
Year EPS P/E2019P 19.68$ 17.1 x Dividend: None Current Return: Nil2018P 17.80 18.9 Shares O/S: 80 million2017E 16.11 20.9 52 Week Range: 363.20$ - 213.72$ 2016A 12.08 27.8 Source: Bloomberg Consensus Estimates
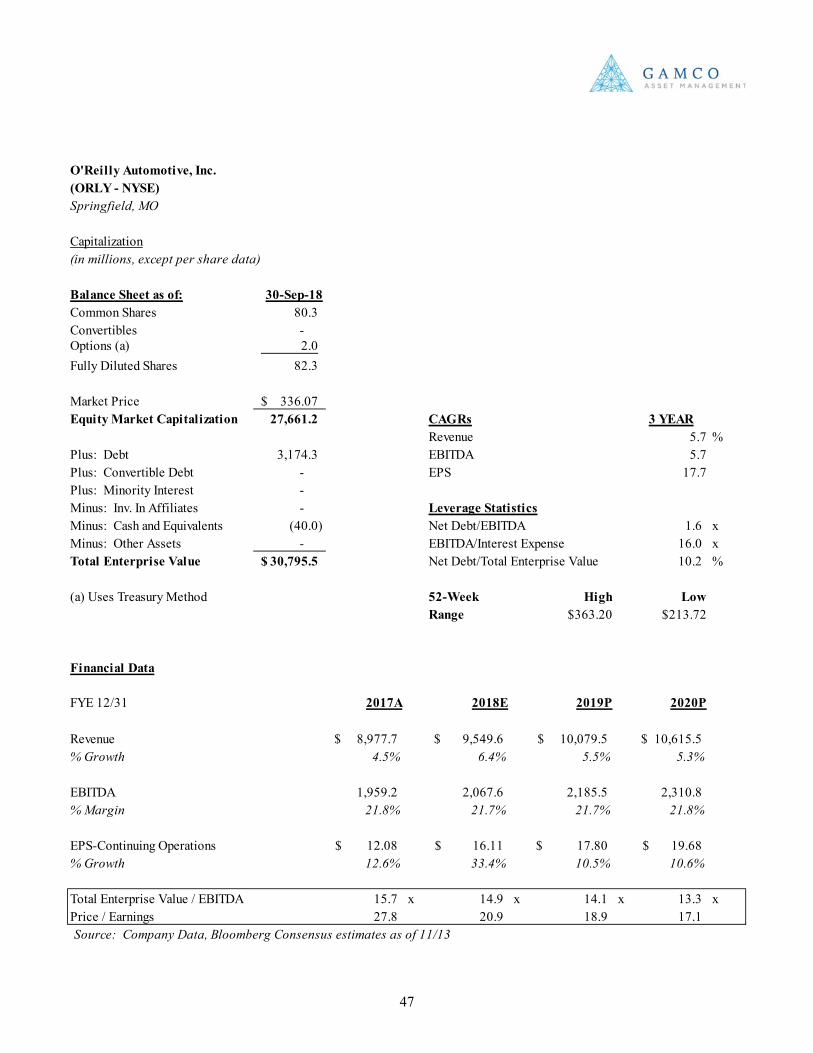
47
O'Reilly Automotive, Inc.(ORLY - NYSE)Springfield, MO
Capitalization(in millions, except per share data)
Balance Sheet as of: 30-Sep-18Common Shares 80.3 Convertibles - Options (a) 2.0 Fully Diluted Shares 82.3
Market Price 336.07$ Equity Market Capitalization 27,661.2 CAGRs 3 YEAR
Revenue 5.7 %Plus: Debt 3,174.3 EBITDA 5.7Plus: Convertible Debt - EPS 17.7Plus: Minority Interest - Minus: Inv. In Affiliates - Leverage StatisticsMinus: Cash and Equivalents (40.0) Net Debt/EBITDA 1.6 xMinus: Other Assets - EBITDA/Interest Expense 16.0 xTotal Enterprise Value 30,795.5$ Net Debt/Total Enterprise Value 10.2 %
(a) Uses Treasury Method 52-Week High LowRange $363.20 $213.72
Financial Data
FYE 12/31 2017A 2018E 2019P 2020P
Revenue 8,977.7$ 9,549.6$ 10,079.5$ 10,615.5$ % Growth 4.5% 6.4% 5.5% 5.3%
EBITDA 1,959.2 2,067.6 2,185.5 2,310.8% Margin 21.8% 21.7% 21.7% 21.8%
EPS-Continuing Operations 12.08$ 16.11$ 17.80$ 19.68$ % Growth 12.6% 33.4% 10.5% 10.6%
Total Enterprise Value / EBITDA 15.7 x 14.9 x 14.1 x 13.3 xPrice / Earnings 27.8 20.9 18.9 17.1Source: Company Data, Bloomberg Consensus estimates as of 11/13
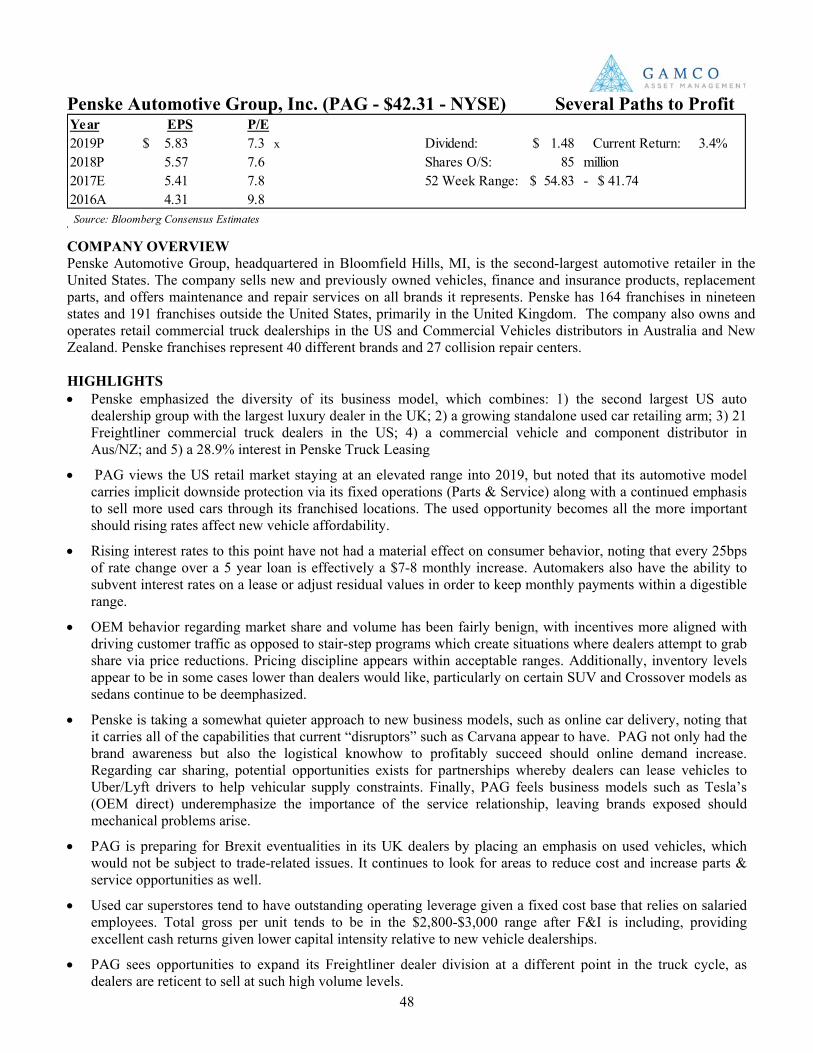
48
Penske Automotive Group, Inc. (PAG - $42.31 - NYSE) Several Paths to Profit
COMPANY OVERVIEW Penske Automotive Group, headquartered in Bloomfield Hills, MI, is the second-largest automotive retailer in the United States. The company sells new and previously owned vehicles, finance and insurance products, replacement parts, and offers maintenance and repair services on all brands it represents. Penske has 164 franchises in nineteen states and 191 franchises outside the United States, primarily in the United Kingdom. The company also owns and operates retail commercial truck dealerships in the US and Commercial Vehicles distributors in Australia and New Zealand. Penske franchises represent 40 different brands and 27 collision repair centers. HIGHLIGHTS • Penske emphasized the diversity of its business model, which combines: 1) the second largest US auto
dealership group with the largest luxury dealer in the UK; 2) a growing standalone used car retailing arm; 3) 21 Freightliner commercial truck dealers in the US; 4) a commercial vehicle and component distributor in Aus/NZ; and 5) a 28.9% interest in Penske Truck Leasing
• PAG views the US retail market staying at an elevated range into 2019, but noted that its automotive model carries implicit downside protection via its fixed operations (Parts & Service) along with a continued emphasis to sell more used cars through its franchised locations. The used opportunity becomes all the more important should rising rates affect new vehicle affordability.
• Rising interest rates to this point have not had a material effect on consumer behavior, noting that every 25bps of rate change over a 5 year loan is effectively a $7-8 monthly increase. Automakers also have the ability to subvent interest rates on a lease or adjust residual values in order to keep monthly payments within a digestible range.
• OEM behavior regarding market share and volume has been fairly benign, with incentives more aligned with driving customer traffic as opposed to stair-step programs which create situations where dealers attempt to grab share via price reductions. Pricing discipline appears within acceptable ranges. Additionally, inventory levels appear to be in some cases lower than dealers would like, particularly on certain SUV and Crossover models as sedans continue to be deemphasized.
• Penske is taking a somewhat quieter approach to new business models, such as online car delivery, noting that it carries all of the capabilities that current “disruptors” such as Carvana appear to have. PAG not only had the brand awareness but also the logistical knowhow to profitably succeed should online demand increase. Regarding car sharing, potential opportunities exists for partnerships whereby dealers can lease vehicles to Uber/Lyft drivers to help vehicular supply constraints. Finally, PAG feels business models such as Tesla’s (OEM direct) underemphasize the importance of the service relationship, leaving brands exposed should mechanical problems arise.
• PAG is preparing for Brexit eventualities in its UK dealers by placing an emphasis on used vehicles, which would not be subject to trade-related issues. It continues to look for areas to reduce cost and increase parts & service opportunities as well.
• Used car superstores tend to have outstanding operating leverage given a fixed cost base that relies on salaried employees. Total gross per unit tends to be in the $2,800-$3,000 range after F&I is including, providing excellent cash returns given lower capital intensity relative to new vehicle dealerships.
• PAG sees opportunities to expand its Freightliner dealer division at a different point in the truck cycle, as dealers are reticent to sell at such high volume levels.
Year EPS P/E2019P 5.83$ 7.3 x Dividend: 1.48$ Current Return: 3.4%2018P 5.57 7.6 Shares O/S: 85 million2017E 5.41 7.8 52 Week Range: 54.83$ - 41.74$ 2016A 4.31 9.8 Source: Bloomberg Consensus Estimates
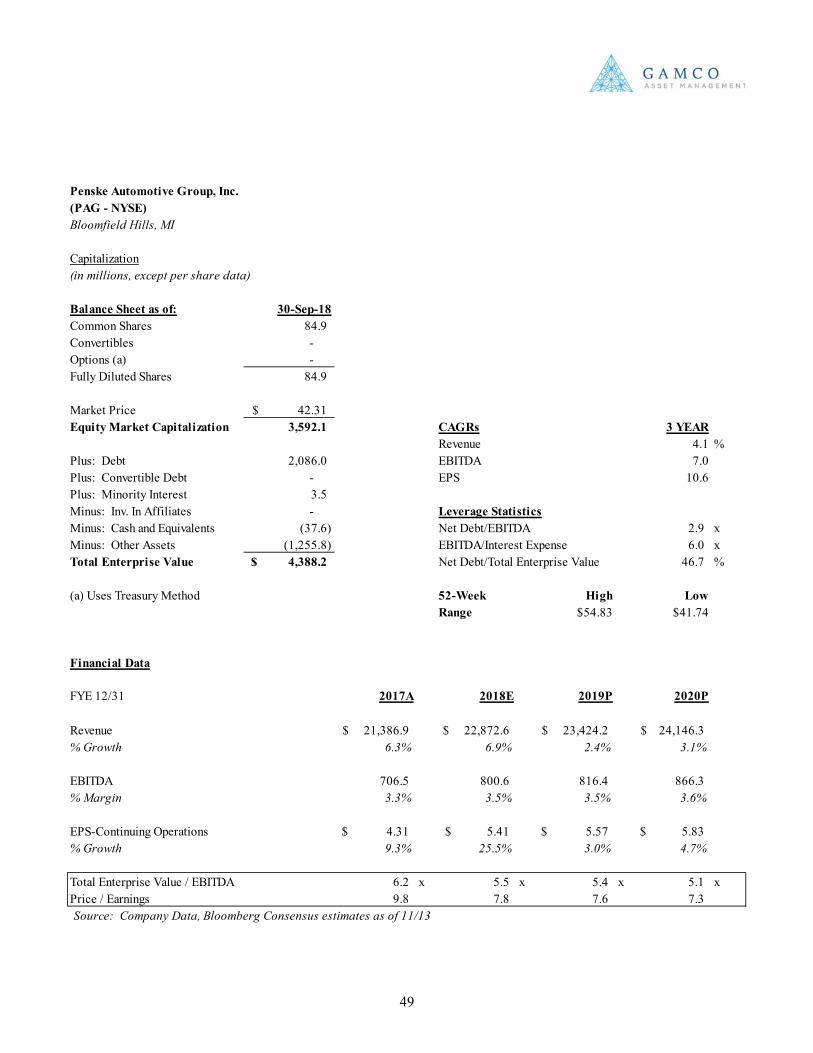
49
Penske Automotive Group, Inc.(PAG - NYSE)Bloomfield Hills, MI
Capitalization(in millions, except per share data)
Balance Sheet as of: 30-Sep-18Common Shares 84.9 Convertibles - Options (a) - Fully Diluted Shares 84.9
Market Price 42.31$ Equity Market Capitalization 3,592.1 CAGRs 3 YEAR
Revenue 4.1 %Plus: Debt 2,086.0 EBITDA 7.0Plus: Convertible Debt - EPS 10.6Plus: Minority Interest 3.5 Minus: Inv. In Affiliates - Leverage StatisticsMinus: Cash and Equivalents (37.6) Net Debt/EBITDA 2.9 xMinus: Other Assets (1,255.8) EBITDA/Interest Expense 6.0 xTotal Enterprise Value 4,388.2$ Net Debt/Total Enterprise Value 46.7 %
(a) Uses Treasury Method 52-Week High LowRange $54.83 $41.74
Financial Data
FYE 12/31 2017A 2018E 2019P 2020P
Revenue 21,386.9$ 22,872.6$ 23,424.2$ 24,146.3$ % Growth 6.3% 6.9% 2.4% 3.1%
EBITDA 706.5 800.6 816.4 866.3% Margin 3.3% 3.5% 3.5% 3.6%
EPS-Continuing Operations 4.31$ 5.41$ 5.57$ 5.83$ % Growth 9.3% 25.5% 3.0% 4.7%
Total Enterprise Value / EBITDA 6.2 x 5.5 x 5.4 x 5.1 xPrice / Earnings 9.8 7.8 7.6 7.3Source: Company Data, Bloomberg Consensus estimates as of 11/13
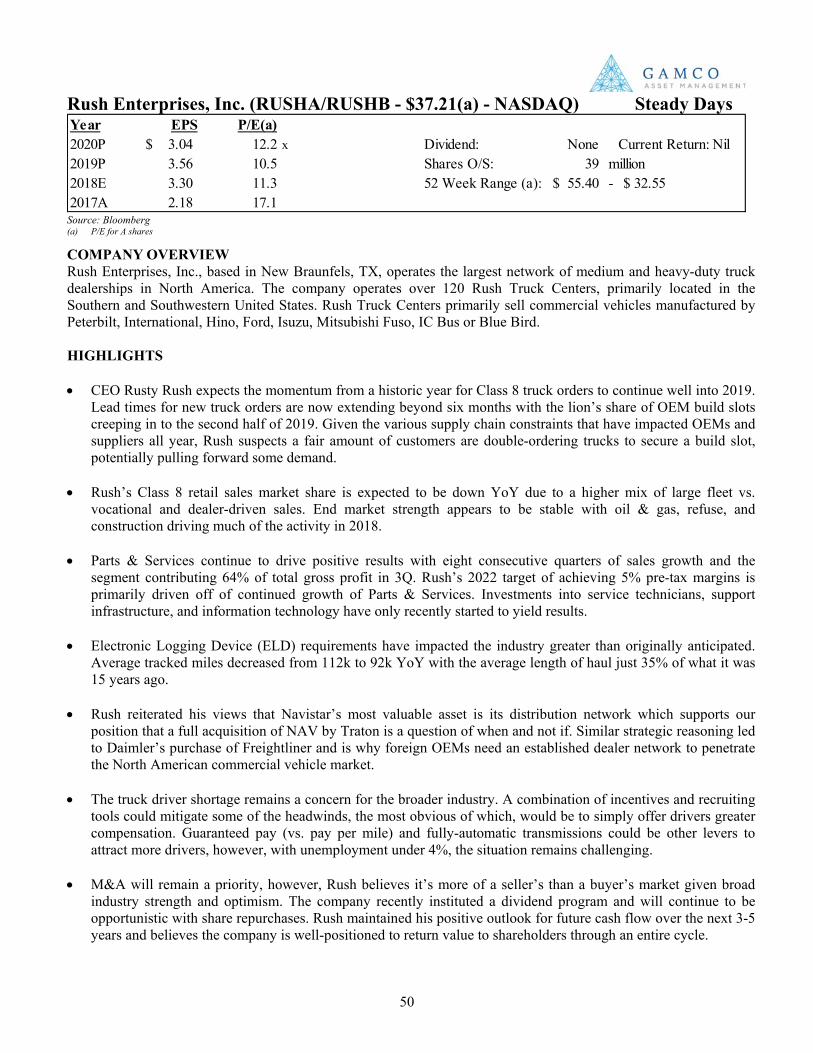
50
Rush Enterprises, Inc. (RUSHA/RUSHB - $37.21(a) - NASDAQ) Steady Days
Source: Bloomberg (a) P/E for A shares
COMPANY OVERVIEW Rush Enterprises, Inc., based in New Braunfels, TX, operates the largest network of medium and heavy-duty truck dealerships in North America. The company operates over 120 Rush Truck Centers, primarily located in the Southern and Southwestern United States. Rush Truck Centers primarily sell commercial vehicles manufactured by Peterbilt, International, Hino, Ford, Isuzu, Mitsubishi Fuso, IC Bus or Blue Bird. HIGHLIGHTS • CEO Rusty Rush expects the momentum from a historic year for Class 8 truck orders to continue well into 2019.
Lead times for new truck orders are now extending beyond six months with the lion’s share of OEM build slots creeping in to the second half of 2019. Given the various supply chain constraints that have impacted OEMs and suppliers all year, Rush suspects a fair amount of customers are double-ordering trucks to secure a build slot, potentially pulling forward some demand.
• Rush’s Class 8 retail sales market share is expected to be down YoY due to a higher mix of large fleet vs. vocational and dealer-driven sales. End market strength appears to be stable with oil & gas, refuse, and construction driving much of the activity in 2018.
• Parts & Services continue to drive positive results with eight consecutive quarters of sales growth and the segment contributing 64% of total gross profit in 3Q. Rush’s 2022 target of achieving 5% pre-tax margins is primarily driven off of continued growth of Parts & Services. Investments into service technicians, support infrastructure, and information technology have only recently started to yield results.
• Electronic Logging Device (ELD) requirements have impacted the industry greater than originally anticipated. Average tracked miles decreased from 112k to 92k YoY with the average length of haul just 35% of what it was 15 years ago.
• Rush reiterated his views that Navistar’s most valuable asset is its distribution network which supports our position that a full acquisition of NAV by Traton is a question of when and not if. Similar strategic reasoning led to Daimler’s purchase of Freightliner and is why foreign OEMs need an established dealer network to penetrate the North American commercial vehicle market.
• The truck driver shortage remains a concern for the broader industry. A combination of incentives and recruiting
tools could mitigate some of the headwinds, the most obvious of which, would be to simply offer drivers greater compensation. Guaranteed pay (vs. pay per mile) and fully-automatic transmissions could be other levers to attract more drivers, however, with unemployment under 4%, the situation remains challenging.
• M&A will remain a priority, however, Rush believes it’s more of a seller’s than a buyer’s market given broad
industry strength and optimism. The company recently instituted a dividend program and will continue to be opportunistic with share repurchases. Rush maintained his positive outlook for future cash flow over the next 3-5 years and believes the company is well-positioned to return value to shareholders through an entire cycle.
Year EPS P/E(a)2020P 3.04$ 12.2 x Dividend: None Current Return: Nil2019P 3.56 10.5 Shares O/S: 39 million2018E 3.30 11.3 52 Week Range (a): 55.40$ - 32.55$ 2017A 2.18 17.1
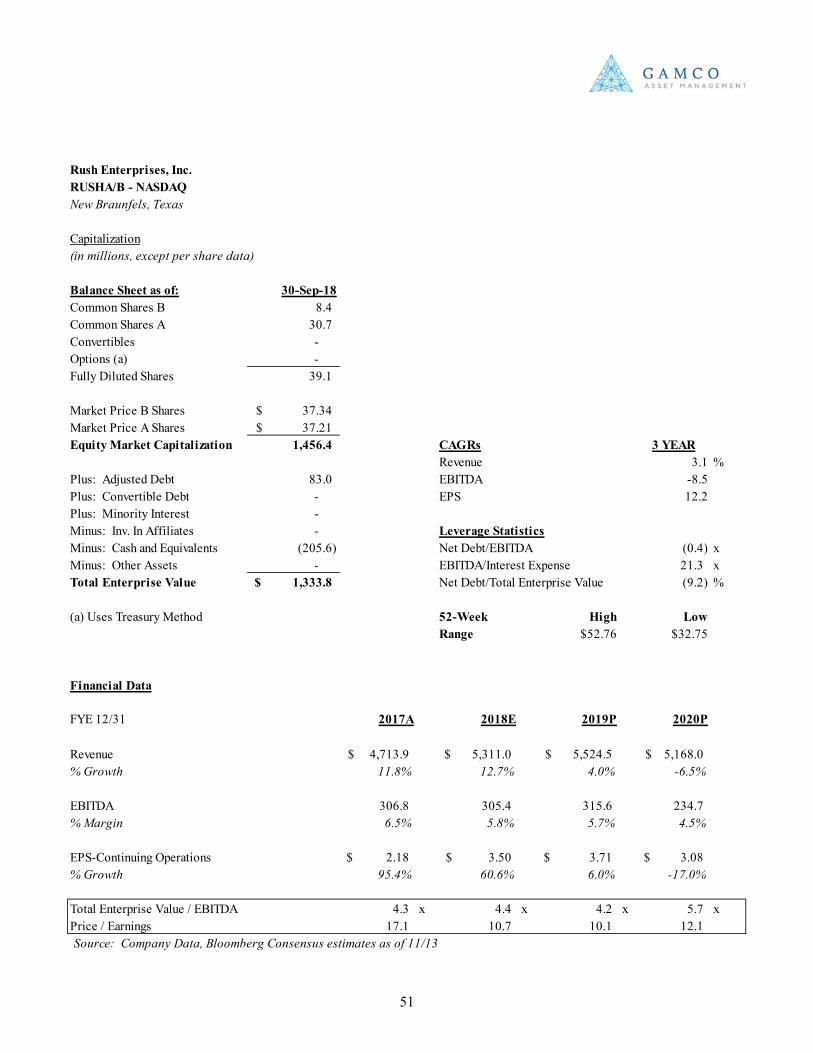
51
Rush Enterprises, Inc.RUSHA/B - NASDAQNew Braunfels, Texas
Capitalization(in millions, except per share data)
Balance Sheet as of: 30-Sep-18Common Shares B 8.4 Common Shares A 30.7 Convertibles - Options (a) - Fully Diluted Shares 39.1
Market Price B Shares 37.34$ Market Price A Shares 37.21$ Equity Market Capitalization 1,456.4 CAGRs 3 YEAR
Revenue 3.1 %Plus: Adjusted Debt 83.0 EBITDA -8.5Plus: Convertible Debt - EPS 12.2Plus: Minority Interest - Minus: Inv. In Affiliates - Leverage StatisticsMinus: Cash and Equivalents (205.6) Net Debt/EBITDA (0.4) xMinus: Other Assets - EBITDA/Interest Expense 21.3 xTotal Enterprise Value 1,333.8$ Net Debt/Total Enterprise Value (9.2) %
(a) Uses Treasury Method 52-Week High LowRange $52.76 $32.75
Financial Data
FYE 12/31 2017A 2018E 2019P 2020P
Revenue 4,713.9$ 5,311.0$ 5,524.5$ 5,168.0$ % Growth 11.8% 12.7% 4.0% -6.5%
EBITDA 306.8 305.4 315.6 234.7% Margin 6.5% 5.8% 5.7% 4.5%
EPS-Continuing Operations 2.18$ 3.50$ 3.71$ 3.08$ % Growth 95.4% 60.6% 6.0% -17.0%
Total Enterprise Value / EBITDA 4.3 x 4.4 x 4.2 x 5.7 xPrice / Earnings 17.1 10.7 10.1 12.1Source: Company Data, Bloomberg Consensus estimates as of 11/13
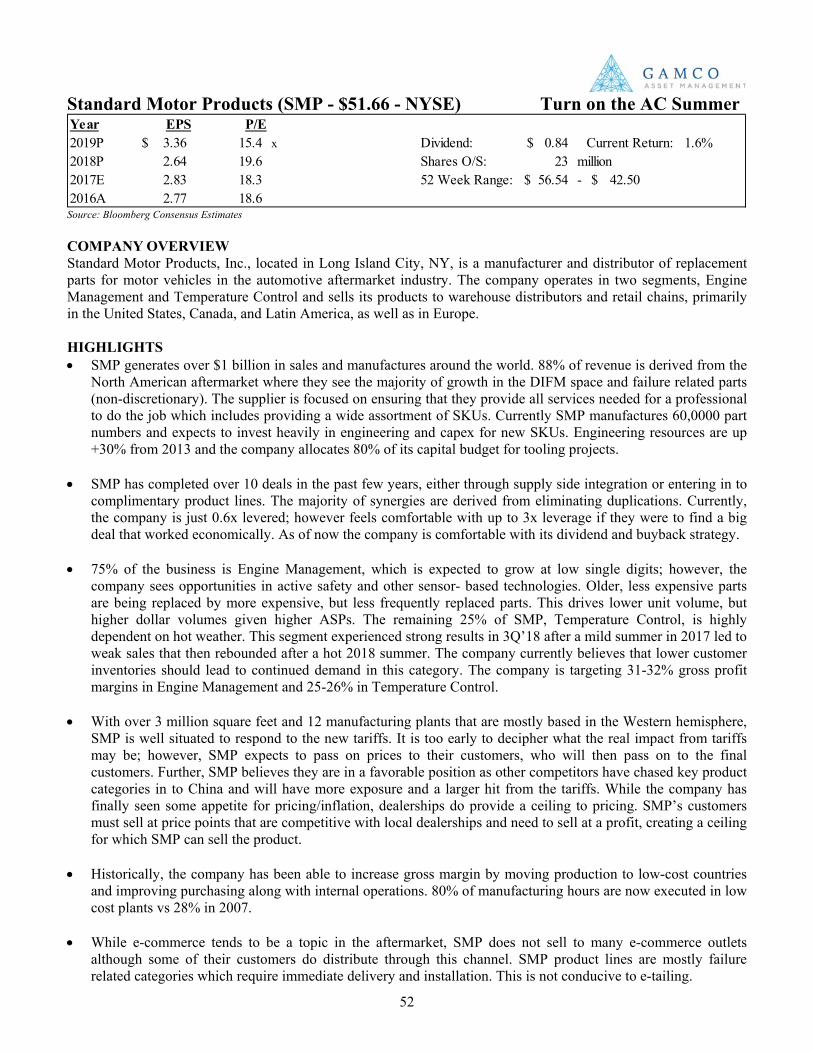
52
Standard Motor Products (SMP - $51.66 - NYSE) Turn on the AC Summer
Source: Bloomberg Consensus Estimates COMPANY OVERVIEW Standard Motor Products, Inc., located in Long Island City, NY, is a manufacturer and distributor of replacement parts for motor vehicles in the automotive aftermarket industry. The company operates in two segments, Engine Management and Temperature Control and sells its products to warehouse distributors and retail chains, primarily in the United States, Canada, and Latin America, as well as in Europe. HIGHLIGHTS • SMP generates over $1 billion in sales and manufactures around the world. 88% of revenue is derived from the
North American aftermarket where they see the majority of growth in the DIFM space and failure related parts (non-discretionary). The supplier is focused on ensuring that they provide all services needed for a professional to do the job which includes providing a wide assortment of SKUs. Currently SMP manufactures 60,0000 part numbers and expects to invest heavily in engineering and capex for new SKUs. Engineering resources are up +30% from 2013 and the company allocates 80% of its capital budget for tooling projects.
• SMP has completed over 10 deals in the past few years, either through supply side integration or entering in to complimentary product lines. The majority of synergies are derived from eliminating duplications. Currently, the company is just 0.6x levered; however feels comfortable with up to 3x leverage if they were to find a big deal that worked economically. As of now the company is comfortable with its dividend and buyback strategy.
• 75% of the business is Engine Management, which is expected to grow at low single digits; however, the
company sees opportunities in active safety and other sensor- based technologies. Older, less expensive parts are being replaced by more expensive, but less frequently replaced parts. This drives lower unit volume, but higher dollar volumes given higher ASPs. The remaining 25% of SMP, Temperature Control, is highly dependent on hot weather. This segment experienced strong results in 3Q’18 after a mild summer in 2017 led to weak sales that then rebounded after a hot 2018 summer. The company currently believes that lower customer inventories should lead to continued demand in this category. The company is targeting 31-32% gross profit margins in Engine Management and 25-26% in Temperature Control.
• With over 3 million square feet and 12 manufacturing plants that are mostly based in the Western hemisphere, SMP is well situated to respond to the new tariffs. It is too early to decipher what the real impact from tariffs may be; however, SMP expects to pass on prices to their customers, who will then pass on to the final customers. Further, SMP believes they are in a favorable position as other competitors have chased key product categories in to China and will have more exposure and a larger hit from the tariffs. While the company has finally seen some appetite for pricing/inflation, dealerships do provide a ceiling to pricing. SMP’s customers must sell at price points that are competitive with local dealerships and need to sell at a profit, creating a ceiling for which SMP can sell the product.
• Historically, the company has been able to increase gross margin by moving production to low-cost countries
and improving purchasing along with internal operations. 80% of manufacturing hours are now executed in low cost plants vs 28% in 2007.
• While e-commerce tends to be a topic in the aftermarket, SMP does not sell to many e-commerce outlets
although some of their customers do distribute through this channel. SMP product lines are mostly failure related categories which require immediate delivery and installation. This is not conducive to e-tailing.
Year EPS P/E2019P 3.36$ 15.4 x Dividend: 0.84$ Current Return: 1.6%2018P 2.64 19.6 Shares O/S: 23 million2017E 2.83 18.3 52 Week Range: 56.54$ - 42.50$ 2016A 2.77 18.6
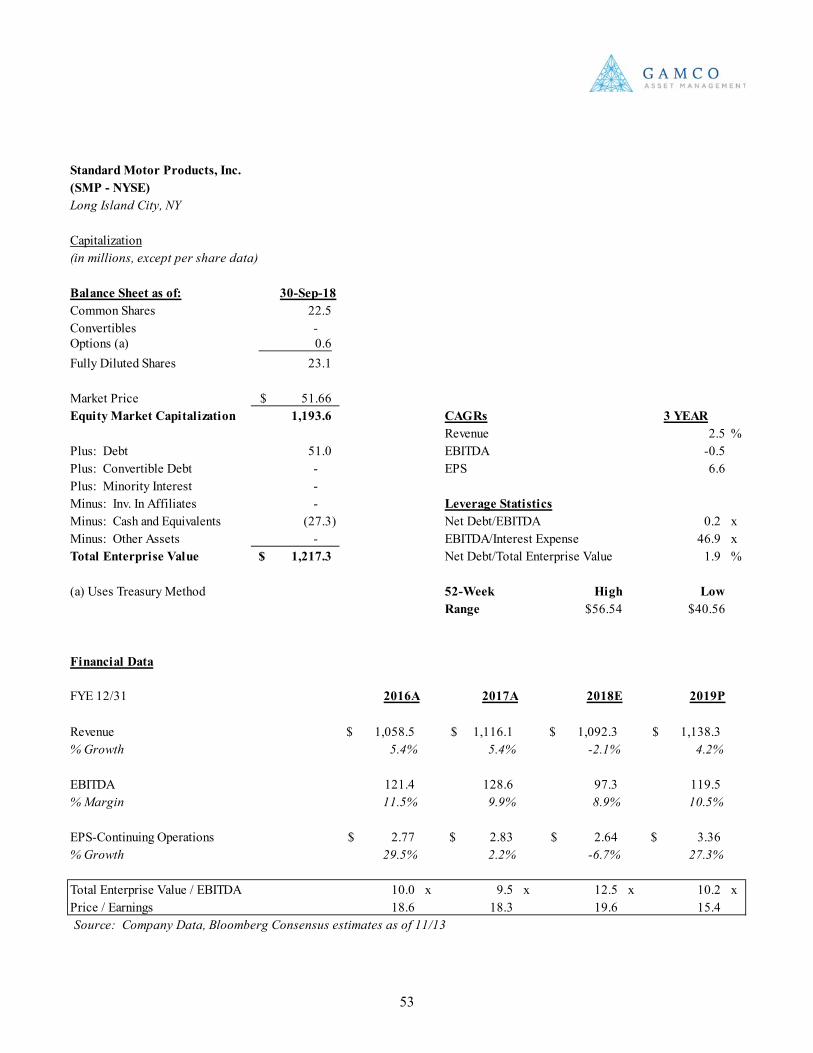
53
Standard Motor Products, Inc.(SMP - NYSE)Long Island City, NY
Capitalization(in millions, except per share data)
Balance Sheet as of: 30-Sep-18Common Shares 22.5 Convertibles - Options (a) 0.6 Fully Diluted Shares 23.1
Market Price 51.66$ Equity Market Capitalization 1,193.6 CAGRs 3 YEAR
Revenue 2.5 %Plus: Debt 51.0 EBITDA -0.5Plus: Convertible Debt - EPS 6.6Plus: Minority Interest - Minus: Inv. In Affiliates - Leverage StatisticsMinus: Cash and Equivalents (27.3) Net Debt/EBITDA 0.2 xMinus: Other Assets - EBITDA/Interest Expense 46.9 xTotal Enterprise Value 1,217.3$ Net Debt/Total Enterprise Value 1.9 %
(a) Uses Treasury Method 52-Week High LowRange $56.54 $40.56
Financial Data
FYE 12/31 2016A 2017A 2018E 2019P
Revenue 1,058.5$ 1,116.1$ 1,092.3$ 1,138.3$ % Growth 5.4% 5.4% -2.1% 4.2%
EBITDA 121.4 128.6 97.3 119.5% Margin 11.5% 9.9% 8.9% 10.5%
EPS-Continuing Operations 2.77$ 2.83$ 2.64$ 3.36$ % Growth 29.5% 2.2% -6.7% 27.3%
Total Enterprise Value / EBITDA 10.0 x 9.5 x 12.5 x 10.2 xPrice / Earnings 18.6 18.3 19.6 15.4Source: Company Data, Bloomberg Consensus estimates as of 11/13
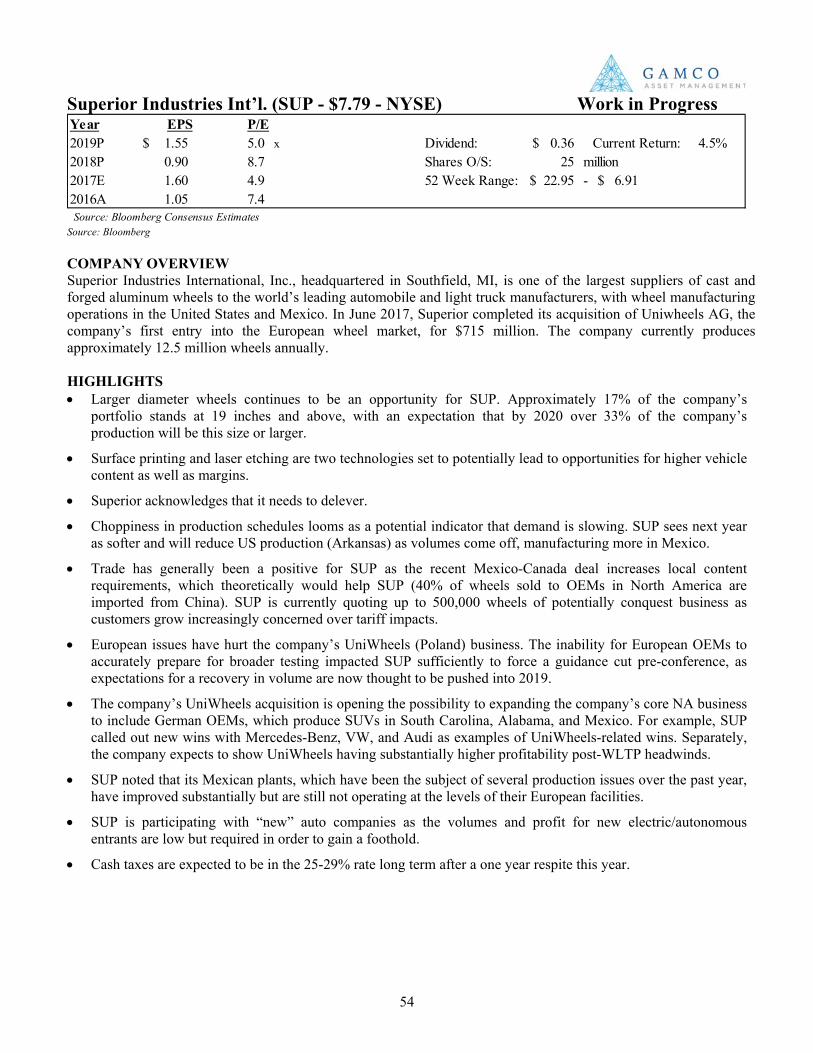
54
Superior Industries Int’l. (SUP - $7.79 - NYSE) Work in Progress
Source: Bloomberg COMPANY OVERVIEW Superior Industries International, Inc., headquartered in Southfield, MI, is one of the largest suppliers of cast and forged aluminum wheels to the world’s leading automobile and light truck manufacturers, with wheel manufacturing operations in the United States and Mexico. In June 2017, Superior completed its acquisition of Uniwheels AG, the company’s first entry into the European wheel market, for $715 million. The company currently produces approximately 12.5 million wheels annually. HIGHLIGHTS • Larger diameter wheels continues to be an opportunity for SUP. Approximately 17% of the company’s
portfolio stands at 19 inches and above, with an expectation that by 2020 over 33% of the company’s production will be this size or larger.
• Surface printing and laser etching are two technologies set to potentially lead to opportunities for higher vehicle content as well as margins.
• Superior acknowledges that it needs to delever.
• Choppiness in production schedules looms as a potential indicator that demand is slowing. SUP sees next year as softer and will reduce US production (Arkansas) as volumes come off, manufacturing more in Mexico.
• Trade has generally been a positive for SUP as the recent Mexico-Canada deal increases local content requirements, which theoretically would help SUP (40% of wheels sold to OEMs in North America are imported from China). SUP is currently quoting up to 500,000 wheels of potentially conquest business as customers grow increasingly concerned over tariff impacts.
• European issues have hurt the company’s UniWheels (Poland) business. The inability for European OEMs to accurately prepare for broader testing impacted SUP sufficiently to force a guidance cut pre-conference, as expectations for a recovery in volume are now thought to be pushed into 2019.
• The company’s UniWheels acquisition is opening the possibility to expanding the company’s core NA business to include German OEMs, which produce SUVs in South Carolina, Alabama, and Mexico. For example, SUP called out new wins with Mercedes-Benz, VW, and Audi as examples of UniWheels-related wins. Separately, the company expects to show UniWheels having substantially higher profitability post-WLTP headwinds.
• SUP noted that its Mexican plants, which have been the subject of several production issues over the past year, have improved substantially but are still not operating at the levels of their European facilities.
• SUP is participating with “new” auto companies as the volumes and profit for new electric/autonomous entrants are low but required in order to gain a foothold.
• Cash taxes are expected to be in the 25-29% rate long term after a one year respite this year.
Year EPS P/E2019P 1.55$ 5.0 x Dividend: 0.36$ Current Return: 4.5%2018P 0.90 8.7 Shares O/S: 25 million2017E 1.60 4.9 52 Week Range: 22.95$ - 6.91$ 2016A 1.05 7.4 Source: Bloomberg Consensus Estimates
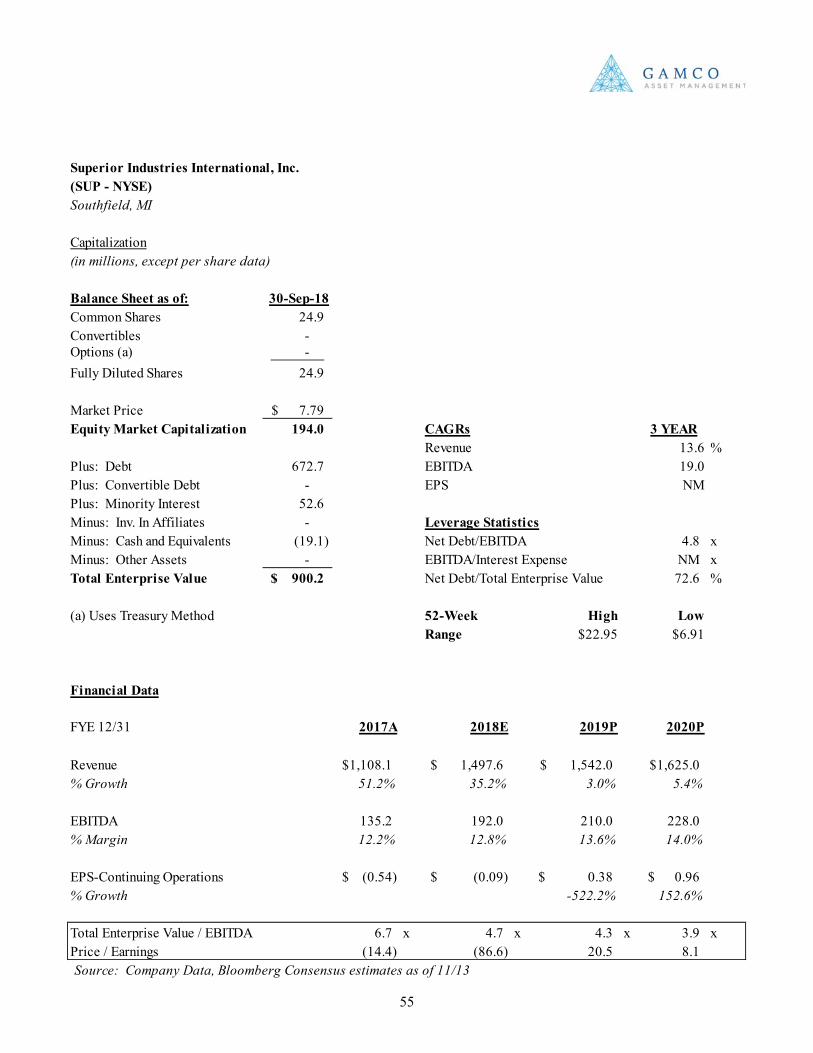
55
Superior Industries International, Inc.(SUP - NYSE)Southfield, MI
Capitalization(in millions, except per share data)
Balance Sheet as of: 30-Sep-18Common Shares 24.9 Convertibles - Options (a) - Fully Diluted Shares 24.9
Market Price 7.79$ Equity Market Capitalization 194.0 CAGRs 3 YEAR
Revenue 13.6 %Plus: Debt 672.7 EBITDA 19.0Plus: Convertible Debt - EPS NMPlus: Minority Interest 52.6 Minus: Inv. In Affiliates - Leverage StatisticsMinus: Cash and Equivalents (19.1) Net Debt/EBITDA 4.8 xMinus: Other Assets - EBITDA/Interest Expense NM xTotal Enterprise Value 900.2$ Net Debt/Total Enterprise Value 72.6 %
(a) Uses Treasury Method 52-Week High LowRange $22.95 $6.91
Financial Data
FYE 12/31 2017A 2018E 2019P 2020P
Revenue 1,108.1$ 1,497.6$ 1,542.0$ 1,625.0$ % Growth 51.2% 35.2% 3.0% 5.4%
EBITDA 135.2 192.0 210.0 228.0% Margin 12.2% 12.8% 13.6% 14.0%
EPS-Continuing Operations (0.54)$ (0.09)$ 0.38$ 0.96$ % Growth -522.2% 152.6%
Total Enterprise Value / EBITDA 6.7 x 4.7 x 4.3 x 3.9 xPrice / Earnings (14.4) (86.6) 20.5 8.1Source: Company Data, Bloomberg Consensus estimates as of 11/13
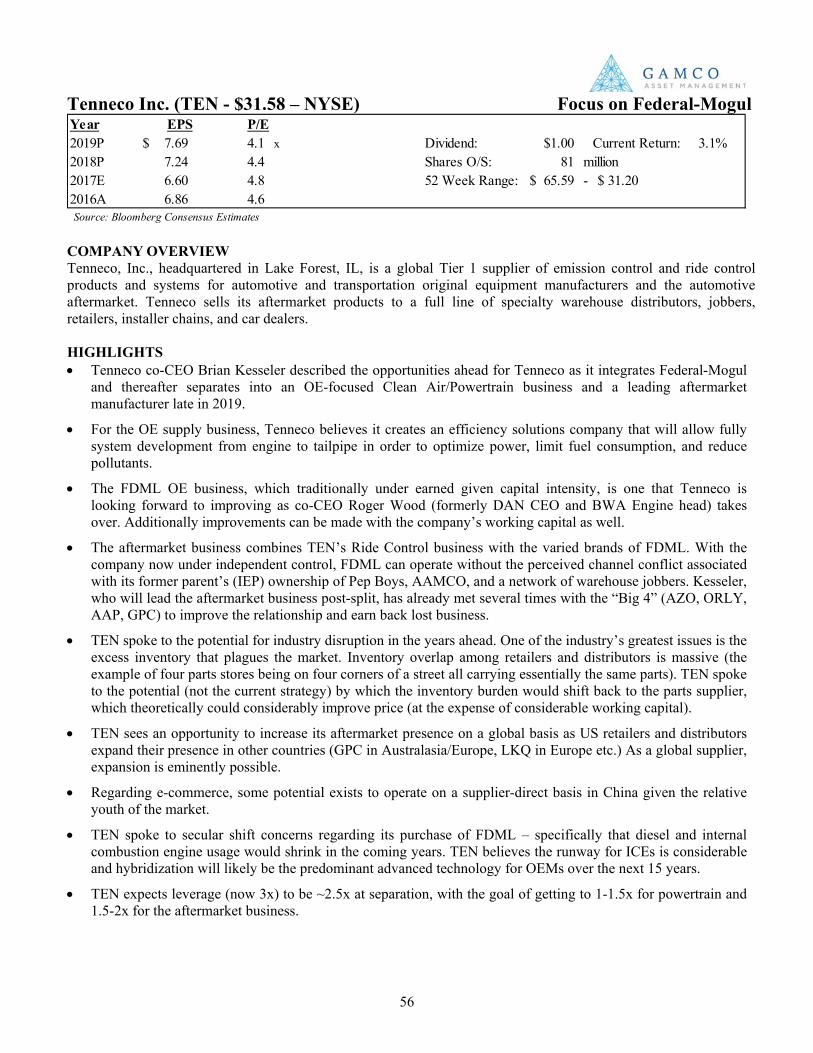
56
Tenneco Inc. (TEN - $31.58 – NYSE) Focus on Federal-Mogul
COMPANY OVERVIEW Tenneco, Inc., headquartered in Lake Forest, IL, is a global Tier 1 supplier of emission control and ride control products and systems for automotive and transportation original equipment manufacturers and the automotive aftermarket. Tenneco sells its aftermarket products to a full line of specialty warehouse distributors, jobbers, retailers, installer chains, and car dealers. HIGHLIGHTS • Tenneco co-CEO Brian Kesseler described the opportunities ahead for Tenneco as it integrates Federal-Mogul
and thereafter separates into an OE-focused Clean Air/Powertrain business and a leading aftermarket manufacturer late in 2019.
• For the OE supply business, Tenneco believes it creates an efficiency solutions company that will allow fully system development from engine to tailpipe in order to optimize power, limit fuel consumption, and reduce pollutants.
• The FDML OE business, which traditionally under earned given capital intensity, is one that Tenneco is looking forward to improving as co-CEO Roger Wood (formerly DAN CEO and BWA Engine head) takes over. Additionally improvements can be made with the company’s working capital as well.
• The aftermarket business combines TEN’s Ride Control business with the varied brands of FDML. With the company now under independent control, FDML can operate without the perceived channel conflict associated with its former parent’s (IEP) ownership of Pep Boys, AAMCO, and a network of warehouse jobbers. Kesseler, who will lead the aftermarket business post-split, has already met several times with the “Big 4” (AZO, ORLY, AAP, GPC) to improve the relationship and earn back lost business.
• TEN spoke to the potential for industry disruption in the years ahead. One of the industry’s greatest issues is the excess inventory that plagues the market. Inventory overlap among retailers and distributors is massive (the example of four parts stores being on four corners of a street all carrying essentially the same parts). TEN spoke to the potential (not the current strategy) by which the inventory burden would shift back to the parts supplier, which theoretically could considerably improve price (at the expense of considerable working capital).
• TEN sees an opportunity to increase its aftermarket presence on a global basis as US retailers and distributors expand their presence in other countries (GPC in Australasia/Europe, LKQ in Europe etc.) As a global supplier, expansion is eminently possible.
• Regarding e-commerce, some potential exists to operate on a supplier-direct basis in China given the relative youth of the market.
• TEN spoke to secular shift concerns regarding its purchase of FDML – specifically that diesel and internal combustion engine usage would shrink in the coming years. TEN believes the runway for ICEs is considerable and hybridization will likely be the predominant advanced technology for OEMs over the next 15 years.
• TEN expects leverage (now 3x) to be ~2.5x at separation, with the goal of getting to 1-1.5x for powertrain and 1.5-2x for the aftermarket business.
Year EPS P/E2019P 7.69$ 4.1 x Dividend: $1.00 Current Return: 3.1%2018P 7.24 4.4 Shares O/S: 81 million2017E 6.60 4.8 52 Week Range: 65.59$ - 31.20$ 2016A 6.86 4.6 Source: Bloomberg Consensus Estimates
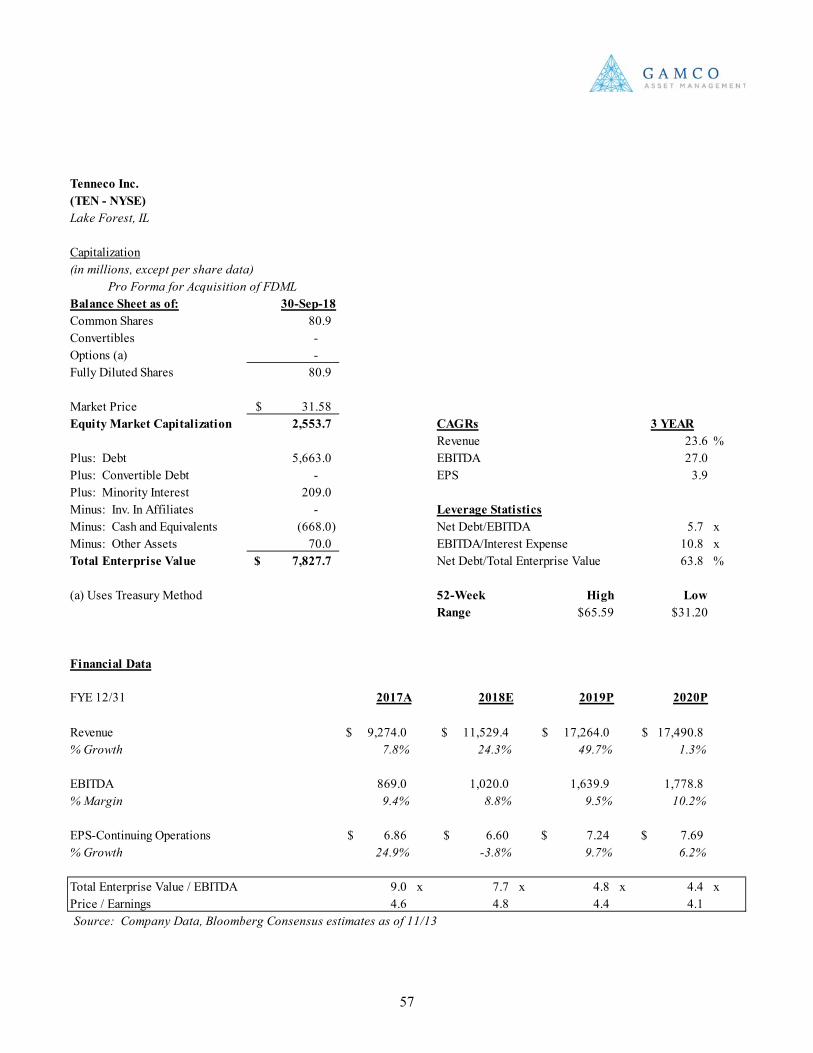
57
Tenneco Inc.(TEN - NYSE)Lake Forest, IL
Capitalization(in millions, except per share data)
Balance Sheet as of: 30-Sep-18Common Shares 80.9 Convertibles - Options (a) - Fully Diluted Shares 80.9
Market Price 31.58$ Equity Market Capitalization 2,553.7 CAGRs 3 YEAR
Revenue 23.6 %Plus: Debt 5,663.0 EBITDA 27.0Plus: Convertible Debt - EPS 3.9Plus: Minority Interest 209.0 Minus: Inv. In Affiliates - Leverage StatisticsMinus: Cash and Equivalents (668.0) Net Debt/EBITDA 5.7 xMinus: Other Assets 70.0 EBITDA/Interest Expense 10.8 xTotal Enterprise Value 7,827.7$ Net Debt/Total Enterprise Value 63.8 %
(a) Uses Treasury Method 52-Week High LowRange $65.59 $31.20
Financial Data
FYE 12/31 2017A 2018E 2019P 2020P
Revenue 9,274.0$ 11,529.4$ 17,264.0$ 17,490.8$ % Growth 7.8% 24.3% 49.7% 1.3%
EBITDA 869.0 1,020.0 1,639.9 1,778.8% Margin 9.4% 8.8% 9.5% 10.2%
EPS-Continuing Operations 6.86$ 6.60$ 7.24$ 7.69$ % Growth 24.9% -3.8% 9.7% 6.2%
Total Enterprise Value / EBITDA 9.0 x 7.7 x 4.8 x 4.4 xPrice / Earnings 4.6 4.8 4.4 4.1Source: Company Data, Bloomberg Consensus estimates as of 11/13
Pro Forma for Acquisition of FDML
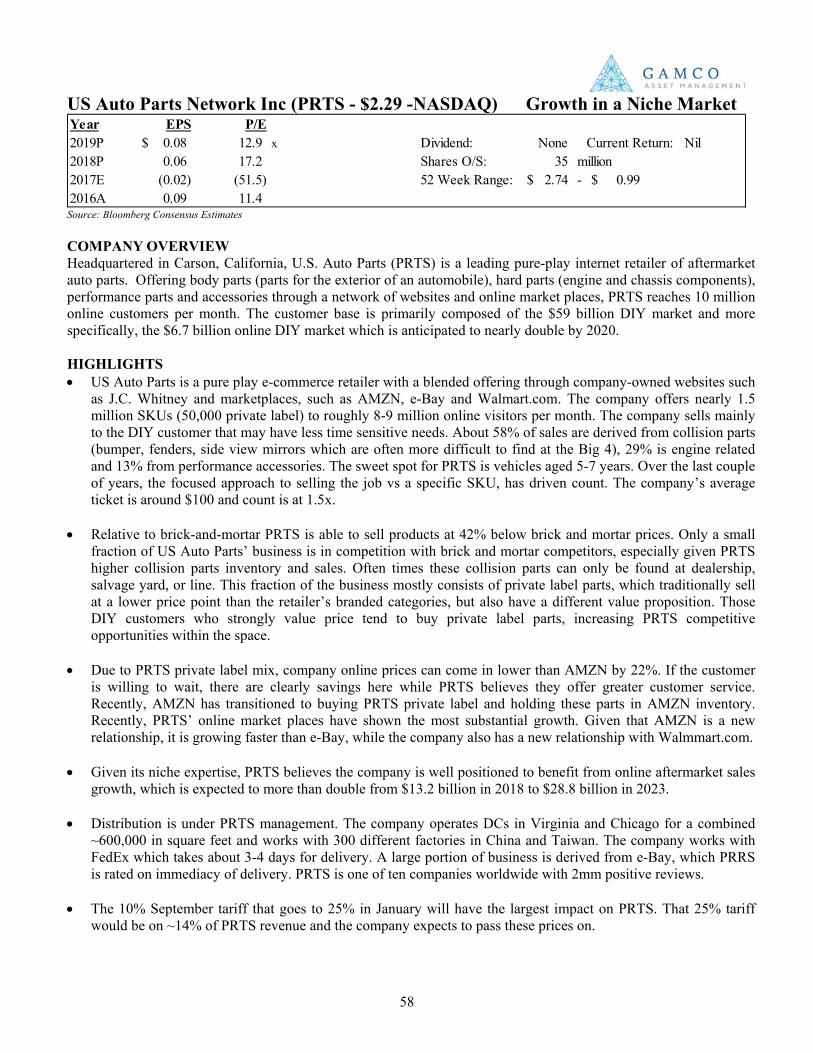
58
US Auto Parts Network Inc (PRTS - $2.29 -NASDAQ) Growth in a Niche Market
Source: Bloomberg Consensus Estimates COMPANY OVERVIEW Headquartered in Carson, California, U.S. Auto Parts (PRTS) is a leading pure-play internet retailer of aftermarket auto parts. Offering body parts (parts for the exterior of an automobile), hard parts (engine and chassis components), performance parts and accessories through a network of websites and online market places, PRTS reaches 10 million online customers per month. The customer base is primarily composed of the $59 billion DIY market and more specifically, the $6.7 billion online DIY market which is anticipated to nearly double by 2020. HIGHLIGHTS • US Auto Parts is a pure play e-commerce retailer with a blended offering through company-owned websites such
as J.C. Whitney and marketplaces, such as AMZN, e-Bay and Walmart.com. The company offers nearly 1.5 million SKUs (50,000 private label) to roughly 8-9 million online visitors per month. The company sells mainly to the DIY customer that may have less time sensitive needs. About 58% of sales are derived from collision parts (bumper, fenders, side view mirrors which are often more difficult to find at the Big 4), 29% is engine related and 13% from performance accessories. The sweet spot for PRTS is vehicles aged 5-7 years. Over the last couple of years, the focused approach to selling the job vs a specific SKU, has driven count. The company’s average ticket is around $100 and count is at 1.5x.
• Relative to brick-and-mortar PRTS is able to sell products at 42% below brick and mortar prices. Only a small
fraction of US Auto Parts’ business is in competition with brick and mortar competitors, especially given PRTS higher collision parts inventory and sales. Often times these collision parts can only be found at dealership, salvage yard, or line. This fraction of the business mostly consists of private label parts, which traditionally sell at a lower price point than the retailer’s branded categories, but also have a different value proposition. Those DIY customers who strongly value price tend to buy private label parts, increasing PRTS competitive opportunities within the space.
• Due to PRTS private label mix, company online prices can come in lower than AMZN by 22%. If the customer
is willing to wait, there are clearly savings here while PRTS believes they offer greater customer service. Recently, AMZN has transitioned to buying PRTS private label and holding these parts in AMZN inventory. Recently, PRTS’ online market places have shown the most substantial growth. Given that AMZN is a new relationship, it is growing faster than e-Bay, while the company also has a new relationship with Walmmart.com.
• Given its niche expertise, PRTS believes the company is well positioned to benefit from online aftermarket sales growth, which is expected to more than double from $13.2 billion in 2018 to $28.8 billion in 2023.
• Distribution is under PRTS management. The company operates DCs in Virginia and Chicago for a combined
~600,000 in square feet and works with 300 different factories in China and Taiwan. The company works with FedEx which takes about 3-4 days for delivery. A large portion of business is derived from e-Bay, which PRRS is rated on immediacy of delivery. PRTS is one of ten companies worldwide with 2mm positive reviews.
• The 10% September tariff that goes to 25% in January will have the largest impact on PRTS. That 25% tariff would be on ~14% of PRTS revenue and the company expects to pass these prices on.
Year EPS P/E2019P 0.08$ 12.9 x Dividend: None Current Return: Nil2018P 0.06 17.2 Shares O/S: 35 million2017E (0.02) (51.5) 52 Week Range: 2.74$ - 0.99$ 2016A 0.09 11.4

59
U.S. Auto Parts, Inc(PRTS- NASDAQ)Carson, CA
Capitalization(in millions, except per share data)
Balance Sheet as of: 30-Sep-18Common Shares 35.0 Convertibles - Options (a) 0.1 Fully Diluted Shares 35.0
Market Price 1.03$ Equity Market Capitalization 36.1 CAGRs 3 YEAR
Revenue 0.4 %Plus: Debt - EBITDA 10.9Plus: Convertible Debt - EPS -3.9Plus: Minority Interest - Minus: Inv. In Affiliates - Leverage StatisticsMinus: Cash and Equivalents (9.3) Net Debt/EBITDA (0.8) xMinus: Other Assets - EBITDA/Interest Expense 1.1 xTotal Enterprise Value 26.8$ Net Debt/Total Enterprise Value (34.7) %
(a) Uses Treasury Method 52-Week High LowRange $2.74 $0.99
Financial Data
FYE 12/31 2017A 2018E 2019P 2020P
Revenue 303.4$ 286.0$ 296.0$ 307.0$ % Growth 0.0% -5.7% 3.5% 3.7%
EBITDA 11.3 11.7 13.6 15.4% Margin 3.7% 2.9% 4.6% 5.0%
EPS-Continuing Operations 0.09$ (0.02)$ 0.06$ 0.08$ % Growth 7.1% 33.3%
Total Enterprise Value / EBITDA 2.4 x 2.3 x 2.0 x 1.7 xPrice / Earnings 11.4 NM 17.2 12.9Source: Company Data, Bloomberg Consensus estimates as of 11/13
60
Veoneer, Inc. (VNE – $32.22 – NYSE) Focused on 2020 Vision
Source: Bloomberg COMPANY OVERVIEW Veoneer, Inc. (VNE), based in Stockholm, Sweden, is a global Tier 1 automotive supplier that specializes in the design, development, manufacturing, and sale of automotive safety electronics focused on Advanced Driver Assistance Systems (ADAS) and autonomous driving technologies. VNE formerly operated as the Electronics segment within Autoliv (ALV) and was spun-out from the parent in July 2018. HIGHLIGHTS • Following a successful separation from ALV this summer, VNE has faced a challenging macro environment
from light vehicle production disruptions primarily in Europe (WLTP) and China (deceleration of growth). VNE has seen customer platform delays ranging from 6 months to 2 years.
• VNE acknowledged some downside risk to its 2020 targets of $3 billion in sales and 0-5% EBIT margins. Increased costs to support its growing $1.1 billion backlog are expected to pressure margins in the near to medium term. Near-term gross margin is expected to be in the 20% range with a long-term target of mid-20% not expected to occur until post-2020. R&D and capex are also expected to be at elevated levels in the near-term.
• VNE remains one of the few pure plays in active safety/autonomous driving with a leading portfolio of vision and radar systems. On the vision side, VNE competes directly with Intel/Mobileye, Bosch, and Continental, with all four companies taking up the lion’s share of the market. On the radar side, VNE is the market leader and competes with Aptiv, Bosch, and Continental, with all four companies representing 80% of the market. ADAS controllers represent another important piece of the company’s active safety portfolio.
• Most companies pursuing autonomous driving are focused on one of two tracks – ride-sharing/commercial applications or consumer applications. VNE reiterated its primary focus is on the consumer market and views ride-sharing companies like Uber and Lyft as potential customers.
• Regulations and consumer preferences are expected to drive broader adoption of Level 1-2 ADAS features, despite the added costs. Regulators in major markets require certain ADAS features such as automatic emergency braking, adaptive cruise control, and collision-warning systems to meet five-star safety ratings. OEMs have already voluntarily committed to these technologies for models set to be produced over the next 5-6 years. Veoneer’s active safety content per vehicle is expected to grow from $50 today to $250-300 by 2025.
• VNE believes its initial $1 billion cash capitalization from ALV should be sufficient to fund the business through
the cycle and pursue the right type of M&A opportunities. Similar to ALV, VNE expects to manage a conservative balance sheet and does not plan on raising any additional capital.
Year EPS P/E2020P (1.75)$ NM Dividend: None Current Return: Nil2019P (1.75) NM Shares O/S: 87 million2018E (2.25) NM 52 Week Range: None - None2017A (2.50) NM(a) Adjusted EPS excludes certain amortization, restructuring, and other non-cash or one-time expenses
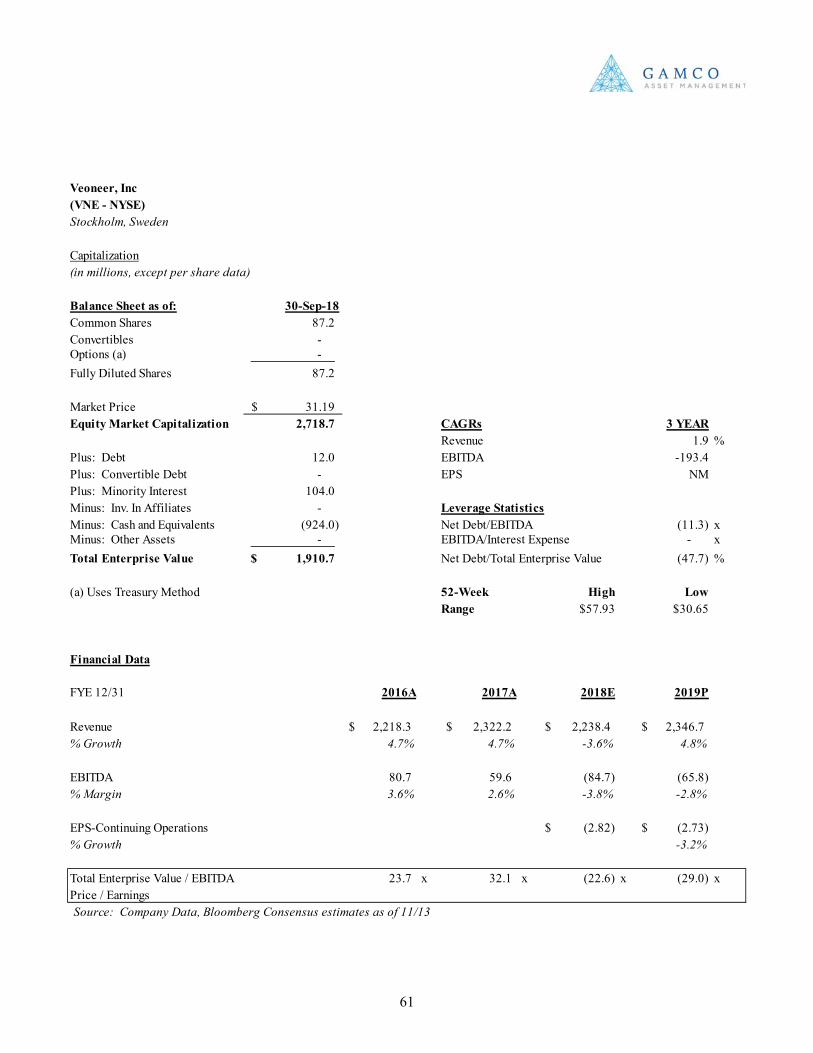
61
Veoneer, Inc(VNE - NYSE)Stockholm, Sweden
Capitalization(in millions, except per share data)
Balance Sheet as of: 30-Sep-18Common Shares 87.2 Convertibles - Options (a) - Fully Diluted Shares 87.2
Market Price 31.19$ Equity Market Capitalization 2,718.7 CAGRs 3 YEAR
Revenue 1.9 %Plus: Debt 12.0 EBITDA -193.4Plus: Convertible Debt - EPS NMPlus: Minority Interest 104.0 Minus: Inv. In Affiliates - Leverage StatisticsMinus: Cash and Equivalents (924.0) Net Debt/EBITDA (11.3) xMinus: Other Assets - EBITDA/Interest Expense - xTotal Enterprise Value 1,910.7$ Net Debt/Total Enterprise Value (47.7) %
(a) Uses Treasury Method 52-Week High LowRange $57.93 $30.65
Financial Data
FYE 12/31 2016A 2017A 2018E 2019P
Revenue 2,218.3$ 2,322.2$ 2,238.4$ 2,346.7$ % Growth 4.7% 4.7% -3.6% 4.8%
EBITDA 80.7 59.6 (84.7) (65.8)% Margin 3.6% 2.6% -3.8% -2.8%
EPS-Continuing Operations (2.82)$ (2.73)$ % Growth -3.2%
Total Enterprise Value / EBITDA 23.7 x 32.1 x (22.6) x (29.0) xPrice / EarningsSource: Company Data, Bloomberg Consensus estimates as of 11/13
62
Save the Date!
43rd Annual
Automotive Aftermarket Symposium
Las Vegas
Attention:
Portfolio Managers/Analysts
Symposium: Automotive Aftermarket
Place: TBD
Dates: November 4th – November 5th, 2019
Contact: C.V. McGinity [email protected] (914) 921-7732
63
Brian Sponheimer (914) 921-8336 A. Carolina Jolly, CFA (914) 921-7762 Shawn Kim (914) 921-8364 Brian Sponheimer , A. Carolina Jolly, CFA and Shawn Kim are analysts for GAMCO Investors Inc.
GAMCO is providing this white paper as a matter of general information. We do not intend for this paper to be a complete description of any security or company, nor is it a research report with respect to any of the companies mentioned herein.
As of October 31, 2018, affiliates of GAMCO Investors, Inc. beneficially 12.54% of Rush Enterprises Class B and less than 1% of Class A, 8.05% of Navistar, 7.13% of Superior Industries, 4.33% of Dana Inc., 2.57% of Standard Motors, 2.37% of Tenneco, 1.97% of Genuine Parts, 1.70% of AutoNation, 1.51% of Donaldson, 1.12% of Cooper Tire and Rubber and less than 1% of all other companies mentioned in this report. One of our affiliates serves as an investment advisor to Dana Holding, Genuine Parts, Honeywell and Navistar, or affiliated entities and has received compensation within the past twelve months for these non-investment banking securities-related services.
The analysts’ views are subject to change at any time based on market and other conditions. The information in this posting represents the opinions of the analysts and is not intended to be a forecast of future events, a guarantee of future results, or investment advice. Views expressed are those of the analysts and may differ from those of other GAMCO officers, analysts, other employees, or of the Firm as a whole. Because the investment personnel at GAMCO and our affiliates make individual investment decisions with respect to the client accounts that they manage, these accounts may have transactions inconsistent with the information contained in this posting.
This paper is not an offer to sell any security nor is it a solicitation of an offer to buy any security.
Stocks are subject to market, economic risks that causes their prices to fluctuate. When you sell shares, they may be worth less than what you paid for them.
Companies Mentioned:Advance Auto Parts AAP - NYSE Honeywell International HON - NYSEAptiv APTV - NYSE Johnson Controls JCI - NYSEAsbury Automotive ABG - NYSE Lear Corporation LEA - NYSEAutoNation AN - NYSE Lithia Motors LAD - NYSEAutoZone, Inc AZO - NYSE LKQ Corporation LKQ - NASDAQBorgWarner BWA - NYSE Monro, Inc. MNRO - NASDAQBoyd Group Income Fund (b) BYD.UN - TSX Motorcar Parts of America, Inc MPAA - NASDAQBYD Company Ltd (c) 002594 - SHE Navistar International Corp NAV - NYSECaterpillar CAT - NYSE O'Reilly Automotive, Inc ORLY - NASDAQCarmax KMX - NYSE Paccar PCAR - NASDAQCooper Tire & Rubber Co. CTB - NYSE Monro, Inc. MNRO - NASDAQCopart CPRT - NASDAQ Motorcar Parts of America, Inc MPAA - NASDAQCummins CMI - NYSE Navistar International Corp NAV - NYSEDana, Inc. DAN - NYSE O'Reilly Automotive, Inc ORLY - NASDAQDeere & Company DE - NYSE Paccar PCAR - NASDAQDelphi Automotive DLPH - NYSE Penske Automotive Group PAG - NYSEDonaldson Company, Inc DCI - NYSE Rush Enterprises, Inc. RUSHB - NASDAQEaton Corp. ETN - NYSE Snap-On SNA - NYSEFord F - NYSE Sonic Automotive SAH - NYSEGeneral Motors GM - NYSE Standard Motor Products, Inc SMP - NYSEGentex Corporation GNTX - NASDAQ Superior Industries International, IncSUP - NYSEGenuine Parts Co. GPC - NYSE Tenneco, Inc. TEN - NYSEGoodyear Tire & Rubber GT - NASDAQ US Auto Parts Network, Inc. PRTS - NASDAQGroup 1 Automotive GPI - NYSE Veoneer, Inc. VNE - NYSE