automotive exhaust gas conversion : reaction kinetics ... · automotive exhaust gas conversion ......
TRANSCRIPT

Automotive exhaust gas conversion : reaction kinetics,reactor modelling and controlNievergeld, A.J.L.
DOI:10.6100/IR506187
Published: 01/01/1998
Document VersionPublisher’s PDF, also known as Version of Record (includes final page, issue and volume numbers)
Please check the document version of this publication:
• A submitted manuscript is the author's version of the article upon submission and before peer-review. There can be important differencesbetween the submitted version and the official published version of record. People interested in the research are advised to contact theauthor for the final version of the publication, or visit the DOI to the publisher's website.• The final author version and the galley proof are versions of the publication after peer review.• The final published version features the final layout of the paper including the volume, issue and page numbers.
Link to publication
General rightsCopyright and moral rights for the publications made accessible in the public portal are retained by the authors and/or other copyright ownersand it is a condition of accessing publications that users recognise and abide by the legal requirements associated with these rights.
• Users may download and print one copy of any publication from the public portal for the purpose of private study or research. • You may not further distribute the material or use it for any profit-making activity or commercial gain • You may freely distribute the URL identifying the publication in the public portal ?
Take down policyIf you believe that this document breaches copyright please contact us providing details, and we will remove access to the work immediatelyand investigate your claim.
Download date: 27. Jul. 2018

Automotive Exhaust Gas Conversion:
Reaction Kinetics, Reactor Modelling and Control
Arthor Nievergeld

Automotive Exhaust Gas Conversion: Resetion Kinetics, Reactor Modelling and Control
PROEFSCHRIFT
ter verkrijging van de graad van doctor aan de Technische Universiteit Eindhoven, op gezag van de Rector Magnificus, prot.dr. M. Rem, voor een commissie aangewezen door het College voor Promoties in het openbaar te verdedigen op
vrijdag 13 februari 1998 om 16.00 uur
door
Arthur Josephus Laurentlus Nievergeld
geboren te Ketpen

Dit proefschrift is goedgekeurd door de promotoren:
prof.dr.ir. G.B. Marin en prof.dr.ir. A.C.P.M. Backx
Copromotor:
dr.ir. J.H.B.J. Hoebink
CIP-DATA LIBRARY TECHNISCHE UNIVERSITEIT EINDHOVEN
Nievergeld, Arthur J.L.
Automotive exhaust gas converslon: Reactlon klnetics, reactor moc:telling and control I by Arthur J.L. Nievergeld. -Eindhoven: Technische Universiteit Eindhoven, 1998. Proefschrift. -ISBN 90-386-o728-8 NUGI813 Trefw.: uitlaatgassen; reductie I chemische reactoren I procesregeling Subject headings: three-way catalysts I reaction kinatics I process control
Druk: Universiteitsdrukkerlj Technische Universiteit Eindhoven

SUMMARY
To reduce the emissions of automotive engines, usually aso-called monolith converter, i.e. a caramie block with saveral thousands of parallel channels, is mounted in the exhaust pipa of a car. The walls of the channels are coated with the washcoat: a thin layer of alumina which serves as support for the noble rnatal particles, e.g. platinum and rhodium, being the activa catalyst phase. To allow high conversionsof all harmful components simultaneously, the exhaust gas composition is kapt close to the stoichiometrie point by a feedback control system. The delay time in the feedback loop of the controller results in an asciilating feed composition. The effects of these oscillations on the time-average conversionscan be either positive, neutral or negative.
The application of a so-called frequency response analysis aimed at the determination of .kinetic parameters in continuous flow reactors has been investigated. A frequency response analysis determines the dynamic behaviour of the reactor as a tunetion of the asciilating frequency and extracts information trom the responses about the kinatic parameters to be estimated. From the analysis it is clear that dynamic oparation raveals more information about the reaction mechanism and the kinatic parameters than steady state operation. Applying the frequency response analysis to areaction described by a three-step mechanism consisting of adsorption/desorption and surface reaction in a plug flow reactor results in kinatic information about all kinatic parameters, whereas the responses of a CSTR contain information about the rata determining step and the sorption equilibrium coefficient only. Compared with the plug flow reactor, the dynamic behaviour of the CSTR is a rasuit of both mixing in the fluid phase and the kinetics. When mixing has an important contribution to the dynamic behaviour of the CSTR the responses will contain less kinatic information than the responses of the plug flow reactor.
The CO oxidation by oxygen over both ·a Ptly-AI20 3 and a commercial Pt/Rh/Ce0Jy-AI20 3 catalyst was studied in a Iabaratory fixad-bed reactor with cycling of the feedunder typical exhaust gas conditions below the light-off temperature. An elementary step reaction mechanism tor the CO oxidation over Pt/y-AI20 3 was developed to describe the responses resulted from switching between a CO containing

4 SUMMARY
and an oxygen containing feed stream. The kinatic parameters of the mechanism were estimated by means of nonllnear regression. Experlments over Pt/Rh/Ce0:1v·AI20 3
were performed to clarify the role of ceria during cyclic feeding of CO and 0 2• The effects of steam and C02 on the CO oxidation in the presence of ceria have also been addressed.
The cyclic feeding experiments over the PVy-AI20 3 catalyst showed a strong tempersture dependenee of the oxygen adsorption and that adsorption is inhibited by adsorbed CO. In contrast, CO adsorption is independent of the tempersture and takes place on a catalytic surface completely covered with oxygen adatoms. Furthermore, C02 adsorbs significantly on the v·AI20 3 support. The experimental responses can be adequately described by an elementary step reaction mechanism consisting of adsorption and desorption of CO, and molecular oxygen adsorption foliowed by instantaneous dissociation and subsequent reaction with CO. To account for CO adsorption on an oxygen covered surface it is assumed that CO and oxygen can share the same catalytic site, whereas the reaction between CO and oxygen adatoms sharing the same site leads to a second route for C02 formation. Interaction of gas phase C02
and the support is assumed to proceed via reversible adsorption of C02•
Cyclic feeding experiments over a PVRh/Ce0Jy-AI20 3 catalyst showed the existence of a reaction path leading to C02 apart from the monofunctional paths over PVy-AI20 3• This so-called bifunctional path describes the reactlon of CO adsorbed on the noble metal with oxygen on the ceria surface. From the experiment~ it Is clear that oxygen from the gas phase adsorbs on ceria and diffuses to the noble rnatal interface where reaction with adsorbed CO takes place. The relativa importsnee of each reaction path to the total C02 production depends on the temperature. At elevated temperatures (T >453 K) oxygen in the bulk of ceria participates in the reaction with adsorbed CO. Ouring the CO containing feed stream oxygen in the bulk of ceria diffuses to the ceria surface where it reacts with CO at the metal-ceria interface, whereas the reduced bulk is oxidized when the feed stream contains 0 2 only. Ceria acts then as a storage component that releases oxygen under net reducing conditions and is tilled up with oxygen under net oxidizing conditions. Steam was found to enhance the C02 formation rate, while the presence of C02 in the feed stream leads to lower reaction rates by blocking adsorption sites for oxygen on ceria. The latter leads to a less pronounced effect of ceria on the C02 production rate. The contribution of the bifunctional path to the C02 formation results in higher time average converslons during cyclic feeding of COand02•
An adiabatic, one-dimensional model of a catalytic converter. of automotive exhaust gas based on first principles was developed in order to simulate the behaviour of monolithic converters under cycling and start-up conditions. Accumulation of mass in the bulk gas phase, the gas phase in the pores of the washcoat and on the catalyst surface, as well as accumulation of energy in both the gas phase and the solid phase are taken into account. Both the oxidation of CO, of ethene and ethyne and the

SUMMARY 5
reduction of NO have been considered in the modelling. Steady state simulations showed that the pollutants in exhaust gas are converted in the reactor in a fixed sequence and that the light-off temperature of individual pollutants is rather irrelevant for the behaviour of real exhaust gas because of mutual interact i ons in a mixture. First ethyne is converted, then carbon monoxide, and finally nitrogen oxide and ethene simultaneously. Forced concentratien cycling can either imprave or deteriorate the performance of the converter when compared to steady state operation, and the effects are strongly influenced by the conditions. Below the light-off temperature the conversion impravement of CO, C2H4 and C2H:z increases with increasing temperature. Above the light-off temperature time-average conversions are lower than steady state ones. Steady state reactor eperation at the stoichiometrie point leads then to the highest performance. Light-off calculations with a time independent feed composition showed that it takes more than 100 seconds to warm-up the reactor completely, but after 50 seconds conversion of all components is already completed. The warming-up period of the reactor is mainly determined by convective heat transfer.
A cambustion engine model, based on literature data, and the model of the converter were used in designing a so-called model predictive control strategy tor exhaust gas converter. Therefore, a black box model of the converter in combination with the engine was developed using identification techniques. The controller uses the black box model to predict the emissions over a given time horizon which allows a very tight control of the air-to-fuel ratio fed to the engine. This in contrast to the currently applied controller which causes the air-to-fuel ratio to asciilate around the stoichiometrie point. The black-box model was also used to calculate the optima! setpoints of the controller during a cold-start. Switching the air-to-fuel ratio to lean tor a short period of time leads to a reduction of the emissions of the pollutants due to a simultaneous ignition of the oxidation reactions.

6 SUMMARY

SAMENVATTING
De uitstoot van schadelijke stoffen in het uitlaatgas van Otto motoren wordt tegenwoordig beperkt door de toepassing van een driewegkatalysator. Een driewegkatalysator is gemonteerd in de uitlaatpijp van de auto en bestaat uit keramisch materiaal met verschillende duizenden parallelle kanalen, de zogenaamde monoliet. De wanden van deze kanalen zijn bedekt met een zogenaamde 'washcoat', een dun laagje aluminadat dient als drager voor het edelmetaal, zoals platina en rhodium. Een hoge conversie van alle schadelijke componenten wordt bereikt wanneer de uitlaatgassamenstelling stoechiometrisch is. Daartoe is de motor uitgerust met een regelsysteem dat de samenstelling dicht bij de optimale waarde probeert te houden. Echter, een dode tijd in de terugkoppellus van de regelaar zorgt voor oscillaties in de uitlaatgassamenstelling. Het is alom bekend dat deze oscillaties de prestatie van de reactor kunnen beïnvloeden.
Het bewust opwekken van een oscillerende gassamenstelling kan ook voordelig zijn bij het schatten van kinetische parameters. In dit kader is de toepasbaarheid van een zogenaamde frequentie responsie analyse bij het schatten van kinetische parameters in continue doorstroomde reactors onderzocht. Tijdens zo'n analyse worden de amplitude en fase van de concentraties stroomafwaarts van de reactor gemeten als functie van de frequentie terwijl de voedingsconcentraties harmonisch oscilleren. Het frequentiegedrag van de amplitude en fase hangt af van de procescondities, en van de kinetische parameters en het reactiemechanisme. Om de voordelen van dynamisch bedrijven van reactoren vergeleken met stationair bedrijf tijdens kinetisch onderzoek duidelijk te maken is het dynamisch gedrag van een propstroomreactor en een continue doorstroomde reactor (CSTR) bepaald voor een reactie die kan worden beschreven door een driestappenmechanisme. In de CSTR kan alleen de evenwichtscanstante en de snelheidscoêfficiënt van de snelheidsbepalende stap worden geschat, terwijl in de propstroomreactor alle coëfficiënten kunnen worden bepaald. De kinetische informatie die beschikbaar is aan de uitlaat van de CSTR wordt gemaskeerd door menging in de gasfase. Wanneer de tijdconstante van menging veel groter is dan de karakteristieke tijdschaal van de elementaire stappen dan bevatten de responsies weinig kinetische

8 SAMENVATTING
infonnatie. De reactie tussen CO en zuurstof over een Ptly-AI20 3 en een commercieel
verkrijgbare Pt/Rh/Ce0Jy-AI20 3 katalysator is bestudeerd in een laboratorium vastbedreactror door gebruik te maken van een oscillerende voedingssamenstelling. De condities waren zodanig gekozen dat het reactorbedrijf vergelijkbaar was met uitlaatgascondities gedurende een koude start. Aan de hand van de responsies als gevolg van het schakelen tussen een voedingsstroom die alleen CO in helium bevat en een die 0 2 in helium bevat is een reactiemechanisme voor de CO oxidatie over de PtlyAI203 katalysator opgesteld. De snelheidscoëfficiënten in het mechanisme zijn geschat met behulp van niet-lineaire regressietechnieken. Belangrijkste doel van de experimenten met de commerciële Pt/Rh/Ce0Jy-AI20 3 katalysator was het onderzoeken van de rol van ceria tijdens oscillerende condities en de invloed van stoom en C02 in de voeding op de CO oxidatie.
Experimenten met de Pt/y-AIP3 katalysator tonen dat zuurstofadsorptie sterk afhankelijk is van de temperatuur en wordt geïnhibeerd door geadsorbeerd CO, terwijl CO adsorbeert op een met zuurstof bedekt katalysatoroppervlak en temperatuur onafhankelijk is. Uit de C02 responsie kan worden afgeleid dat er significante C02
adsorptie op de alumina drager plaatsvindt. De responsies kunnen worden beschreven door een elementair stappenmodel bestaande uit adsorptie en desorptie van CO, moleculaire zuurstofadsorptie die wordt gevolgd door instantané dissociatie en oppervlakreactie die leidt tot C02 vorming. De adsorptie van CO op een door zuurstof bedekt katalysatoroppervlak kan worden beschreven door aan te nemen dat zuurstof en CO hetzelfde actieve centrum kunnen bezetten. De reactie tussen deze twee species vonnt een tweede reactiepad voor de C02 vonning. De interactie tussen C02
en de alumina drager is gemodelleerd door reversibele adsorptie. De experimenten met de commercieel verkrijgbare Pt!Rh/Ce0Jy-AI20:~
katalysator maken duidelijk dat naast de twee reactiepaden over het edelmetaal, de zogenaamde monofunctionele paden, ook nog een zogenaamd bifunctioneel· pad bestaat voor de C02 productie. Dit laatste pad wordt gevonnd door de reactie tussen op het edelmetaal geadsorbeerd CO en zuurstofspecies op het ceriaoppervlak. Zuurstof uit de gasfase adsorbeert op het ceriaoppervlak en diffundeert naar het edelmetaalceria grensvlak waar reactie met CO species plaatsvindt. Bij een lage temperatuur vindt de aanvoer van zuurstof voomamalijk plaats via oppervlakdiffusie, terwijl bij hogere temperaturen diffusie vanuit de bulk van het ceria een steeds belangrijkere rol gaat spelen. Het ceriaoppervlak en de ceriabulk gedragen zich als zuurstofèapaciteiten die kunnen worden aangesproken tijdens reducerende omstandigheden terwijl zij gedurende oxiderende procescondities worden gevuld. Dit resulteert in een C02
productie tijdens het gedeelte van de periode dat er alleen CO wordt gevoed. Stoom in de voeding bleek de productiesnelheid van C02 te verhogen, terwijl een voeding met 10 vol% C02 leidt tot een verlaging van de productiesnelheid. DoordatC02 op het ceria adsorbeert wordt de bijdrage van het bifunctionele pad in de co2 productie kleiner en

SAMENVATTING 9
het gedrag van de PVy-AI:P3 katalysator benaderd. De aanwezigheid van het
bifunctionele pad leidt tot een hogere tijdsgemiddelde prestatie van de commerciële katalysator vergeleken met de PVy-AI20 3 katalysator.
Om de effecten van een oscillerende voedingssamenstelling op de prestatie van een industriële uitlaatgaskatalysator te bestuderen is een dynamisch model van de katalysator opgesteld. Dit model bestond uit continuïteitsvergelijkingen voor de componenten in de bulkgasfase, de poriën van de 'washcoat' en species op het edelmetaaloppervlak. Verder bestond het model ook nog uit energievergelijkingen voor de gasfase en voor de vaste fase. De oxidatie van de CO, etheen en ethyn en de reductie van NO werden in de modellering in beschouwing genomen. Simulaties toonden dat tijdens stationair bedrijf de schadelijke componenten in een vaste volgorde als functie van de reactorcoördinaat worden omgezet: eerst reageert ethyn, dan CO en daarna NO en etheen tegelijk. Het is duidelijk dat door de wederzijdse beïnvloeding van de componenten het gedrag van een monolietreactor onder echte condities alleen kan worden benaderd indien tijdens de simulaties het uitlaatgas een realistische samenstelling heeft. De effecten van een oscillerende voedingssamenstelling op de prestatie van de reactor zijn afhankelijk van de temperatuur. Beneden de zogenaamde 'light-off' temperatuur leidt oscillerend voeden tot een verhoging van de conversies van CO, etheen en ethyn vergeleken met stationair bedrijf. Boven de 'light-off' temperatuur leidt een constante stoechiometrische voedingssamenstelling tot de hoogste prestatie. Simulatie van een koude start maakte duidelijk dat het ongeveer 100 seconden duurt voordat de reactor helemaal is opgewarmd, maar na 50 seconden is de omzetting van alle componenten volledig. Uit de berekeningen bleek ook dat de opwarming van de monolietreactor voornamelijk plaatsvindt door convectie.
Het model van de monolietreactor is samen met een model voor de motor uit de literatuur gebruikt om een zogenaamde modelgebaseerde regelaar te ontwikkelen. Het interne model van de regelaar is bepaald met behulp van identificatietechnieken. Door gebruik te maken van transformaties kan ondanks het niet-lineair~ procesgedrag toch een lineaire regelaar worden gebruikt. Met behulp van het interne model kan de regelaar het gedrag van de motor en reactor voorspellen en de optimale voedingssamenstelling van de motor berekenen zodat de concentraties stroomafwaarts van de reactor de gewenste waarden aannemen. Dit in tegenstelling tot de huidige toegepaste regelaar die oscillaties in de uitlaatgassamenstelling rond de gewenste waarde veroorzaakt. Het model van de regelaar is ook gebruikt om de optimale stationaire waarde van de lucht-brandstofverhouding te berekenen gedurende een koude start. Uit de berekende lucht-brandstofverhouding volgde dat een oxiderende voedingssamenstelling van de reactor op het juiste moment en gedurende korte tijd leidt tot een verlaging van de uitstoot van schadelijke stoffen.

10 SAMENVATTING

CONTENTS
SUMMARVISAMENVATTING
NOTATION
11NTRODUCTION
2 EXPERIMENTALSET-UP AND PROCEDURES
2.1 Introduetion 2.2 Experimental set-up
2.2.1 Feed section 2.2.2 Reactor section 2.2.3 Analysis section
2.3 Catalyst preparation and characterization 2.4 Experimental procedures
2.4.1 Catalyst pretraatment and stabilization 2.4.2 Calibration of the mass spectrometer 2.4.3 Cycling of argon concentrations 2.4.4 lnlet concentrations 2.4.5 Smoothing of the experimental data
3
15
19
25 26 26 27 28 29 30 30 32
33 34 34
3 FREQUENCY RESPONSE ANALYSIS AIMED AT DETERMINATION OF KINETIC PARAMETERS
3.1 Introduetion 3.2 Definitions 3.3 Adsorption and desorption in continuous flow reactors
3.3.1 Introduetion 3.3.2 Adsorption-desorption in a CSTR
37 39 41 41 42

12 CONTENTS
3.3.3 Adsorption-desorption in a plug flow reactor 3.3.4 Dynamics of a CSTR versus a plug flow reactor 3.3.5 Parameter sensitivity analysis
3.4 Three-step mechanism in continuous flow reactors 3.4.1 Kinetic model 3.4.2 Three-step mechanism in a CSTR 3.4.3 Three-step mechanism in a plug flow reactor 3.4.4 Parameter sensitivity analysis
3.5 Conclusions
44 45 47 48 48 50 53 56 59
Appendix 3A
Appendix38
Derivation of the frequency response equations tor adsorption and desorption in continuous flow reactors 62 Derivation of the frequency response equations for the three step mechanism in continuous flow reactors 66
4 TRANSIENT KINETICS OF THE CO OXIDATION OVER Pt/y-AI20 3
4.1 Introduetion 69 4.2 Model equations and data analysis 71
4.2.1 Reactor modelling 71 4.2.2 Estimation of kinetic parameters 73
4.3 Experimental results 75 4.3.1 Experimental conditions 75 4.3.2 Cyclic feeding 76 4.3.3 Effect of frequency and temperature on the time-average conversion 79
4.4 Kinatic model 81 4.4.1 Reaction mechanism 4.4.2 Rate expressions
4.5 Regression results 4.5.1 Parameter estimates 4.5.2 Simuiatiens
4.6 Steady state simulations 4. 7 Conclusions
5 TRANSIENT KINETICS OF THE CO OXIDATION OVER Pt/Rh/Ce0/y-Aip3
5.1 Introduetion 5.2 Experimental results and discussion
5.2. 1 Experimental conditions 5.2.2 Cyclic feeding experiments with CO and 0 2
81 86 87 87 88 90 91
95 96 96 97

CONTENTS
5.2.3 Effect of C02 and H20 5.2.4 Effects of cerium oxide on the time-average conversion
5.3 Reaction mechanism 5.4 Conclusions
6 SIMULATION OF AN AUTOMOTIVE EXHAUST GAS CONVERTER
13
104 106 109 110
6.1 Introduetion 113 6.2 Kinetic model 114
6.2.1 Reaction mechanism 114 6.2.2 Rate equations 116
6.3 Reactor model 118 6.3.1 Assumptions 118 6.3.2 Continuity equations 120
6.4 Results and discussion 123 6.4.1 Steady state 123 6.4.2 Light-off behaviour 125 6.4.3 Cyclic feeding 126 6.4.4 Effects of cyclic feeding on the time-average converslons 128
6.5 Conclusions 131
Appendix6A Calculation of physical coefficients 135
7 MODEL PREDICTIVE CONTROL OF THE AUTOMOTIVE EXHAUST GAS CONVERTER
7.1 Introduetion 7.2 Model predictive control 7.31dentification procedure 7.4 Description of the process 7.5 ldentification results
7.5.1 Preliminary analysis 7 .5.2 Nontinaar transformatlans 7.5.3 Model estimation and validation
7.6 Controller design and performance 7.6.1 PI controller 7.6.2 Model predictive controller 7.6.3 Comparison between the PI controller and the MPC 7.6.4 Effects of model error on the performance of the MPC
7.7 Steady state optimizer
137 138 142 143 145 145 149 154 154 155 156 157 158 159

14
7.8 Conclusions
8 GENERAL CONCLUSIONS
CONTENTS
160
163

NOTATION
acar specific catalytic surface m2NM m·3R
Ss specific surface area m2c kg"\ a., specific surface area per volume m2; m·3R A pre--exponential factor s·1
As cross sectional surface area m2 R b catalyst dilution dagree ffi
3inert m -3 Inert+ c
b vector of parameter estimates B fráctional amplitude
CP specific heat J kg1 K"1
c con centration mol m·3
d diameter m
~ diameter monolith channel mR dw washcoat thickness mR D ditfusion coefficient ms m·1 s·1
g g
e error situation dependent E activation energy kJ mol·1
f frequency Hz f vector with model equations F molar flow rata mol s·1
FE fraction of exposed rnatal atoms mol8 mol·1
G massflow kg s·1
Afl reaction enthalpy J mol·1
k rata coefficient situation dependent
k, mass transfer coefficient ms, m;·2 s·1
KP proportional gain situation dependent
LR reactor length mR L, total concentration of surface sites mol mNu-2
m number of parameters m number or control moves

16 NOTAT/ON
M molarmass n number of observations N turnover frequency Nu Nusselt number p pressure p preelietion horizon q number of observed responses r reaction rate R gas constant R production rate s objective tunetion Sh Sherwood number SJ sticking probability on clean surface t time T tempersture T. sampling period u manipulated variabie w catalyst metalloadlng w weights w catalyst mass )( axial reactor coordinate x vector of independent variables y vector with observations y output * vacant noble rnatal surface site
* vacant site on support 0 vacant site on ceria
Greek symbola
heat transfer coefficient coeffiCient of surface dependency vector of parameters monolith converter void fraction catalyst bed void fraction washcoat porosity fractional surface coverage thermal conductivity equivalence ratio (AJF)/(AIF)81fJldl
kg mol-1
s·1
Pa
mol m·2NM s·1
J mol·1 K·1
mol m·2 NM s·1
s K s situation dependent kg"_. kg·1
0
ktJo mn
situation dependent
mst m-sn mst m-sn m3f m-3w

V
ç p 0
T
7j
f/J
tll"'m (l)
Subscripts
a b c d diss f i LH m NM R s stoich tot w
NOTAT/ON
stoichiometrie coefficient fractional surface coverage density stoichiometrie coefficient characteristic time inlegration time phase superficial mass flow angular frequency
adsorption bulk; catalyst bed catalyst, characteristic desorption dissociation bulk gas phase; feed with respect to component i; inner Langmuir-Hinshelwood modulation; model noble metal reactor surface; solid; superficial; setpoint stoichiometrie total specific; reactor wall
Superscripts
0 statie; standard; under raferenee conditions in inlet; input out output; oulet ss steady-state
17
kgm·3
s s rad kg m·2R s·,
rad s·1

18 NOTAT/ON

1 INTRODUCTION
The catalytic treatment of automotive exhaust gas was introduced in the saventies in the USA and has become an important industrial process today. During the last two decades the more stringent emission standards resulted in a 90% reduction of the emissions of hydrocarbons, CO and NOx by passenger cars. However, the latest Clean Air Act provisions, leading via the Transitional Low Emission Vehicles (TLEV) to Ultra Low Emissions Vehicles (ULEV), force car and catalyst manufactures towards new technologies (Bali and Jacque, 1994). Much effort has bee~ put in the search for alternative fuels such as methanol and propane, and the development of new engine technologies. Hybrid drive systems, i.e. a combination of a cambustion engine and an electric machine, are becoming an important field of attention in the challenge to approach Zero Emission Vehicles (ZEV) (Tagliaferri et al., 1994).
Until1975, the emissions of CO and hydrocarbons were reduced by slightly lean oparation of the engine. To meet the emission standards of NOx the cambustion temperature was reduced by exhaust gas recirculation (EGR) but this maasure lead to higher fuel consumption and was abandoned after the oil crisis. The more stringent standards for CO and hydrocarbons introduced in 1975, see Figure 1.1 , lead to the application of the oxidation catalyst. In 1979, Volvo was the first to introduce cars with a fuel control system in combination with a three-way catalyst, and this is nowadays the only system to be applied for automotive exhaust gas treatment.
To meet the future stricter vehicle emission regulations, see Figure 1.1, car manufacturers evaluate various strategies to significantly reduce the emissions, especially those of hydracarbon and NOx. One of the main goals of these new technologies is to reduce the time to reach the so-called light-off temperature, which is the temperature required for 50% conversion of the pollutants, as most of the emissions

20 CHAPTER 1
occur before the catalyst has reached the light·off temperature (Rijkeboer, 1991 ). lt takes about one minute after a cold start of the engine to reaches this temperature (Kirchner and Eigenberg, 1996). A strategy to reduce the light·off period is fitting cars with electrically heated preconverters (Oh et al., 1993; Kirchner and Eigenberg, 1996; Kirchner et al., 1997). The drawbacks of this system are the high costs and the high weight, as the battery to store the energy required for heating the preconverter is very large. A second option is the instanation of a small properly designed pre-converter located upstream of the three-way catalyst typically 0.6 m trom the
-HC -co -No;
~~----------------------~7
30
70 73 75 78 80 81
year
Rgure 1.1 Federal emlsslon stsndards tor passenger cars In the US (adspted trom Andersson, 1995).
exhaust manifold (Gulati et al., 1994). Major drawback of this system is the long-term thermal degradation of the pre-converter due to the high exhaust gas temperature close to the engine.
Lean bum engine operations i.e. engine operations with excess oxygen, see Figure 1.2, may lead to promislng opportunities in meeting the future NOx standards. The Jean air-fuel mixture fed to the engine reduces the cambustion temperature resuHing in lower NOx emissions. Furthermore, Jean bum enginas have a higher efficiency and hence a lower fuel consumption. Drawbacks are the reduced engine performance and the need for new catalysts which aHow NOx reduction under net oxidizing conditions. The use of copper exchanged zeolite catalyst is investigated thoroughly in this respect (Ciambelli, et al., 1994; Florera et al., 1994).
12
rich
Rgure 1.2
leanl)um :
18
laan alr-fual ratio[·]
Effect of alr-fuel ratio on the emlsslons of CO, NO" and hydrocarbotls, and the englne power (not to scsle) {Tamaru and Mllls, 1994).
An important driving force to evaluate the use of other metals than usually

INTRODUCTION 21
applied platinum and rhodium is both technologically and economically. As new catalyst developments require improved thermal stability of both noble rnatal and support the use of palladium in three-way catalysts has been considered again. Using palladium insteadof rhodium leadstobetter light-off performance (Beek and Sommers, 1994) and better thermal stability, but only in combination with tight air-to-fuel ratio control (Taylor, 1994). At present, rhodium is necessary tor NO, reduction rasuiting in catalyst dependenee on the rhodium market In 1994, 91% of the world rhodium demand was spant tor three-way catalysts, while 35% of the platinum was used in automotive catalysts (Cowley, 1994). As the rhodium to platinum ratio in automotive catalysts exceeds by far the mining ratio (1/5 and 1/17, respectively) the rhodium may beshort in supply regardless of the known reserves.
Scope of this thesis
In order to meet the future emission standards it is necessary to optimize the applied catalytic converter tor a braad range of process conditions. A thorough understanding of the underlying reaction kinatics is needed in that respect and, therefore, reliable kinatic models have to be acquired to account for the composition and temperature dependenee of the reaction rates. As the converter is operated with an asciilating feed composition (Taylor and Sinkevitch, 1983) transient kinatic models based on elementary steps have to be developed whereas accumulation effects in the gas phase and on the catalytic surface have to be taken into account to describe the behaviour under realistic conditions. However, in the literature hardly any transient kinatic model has been published. Since the CO oxidation by oxygen is one of the most important reactions occurring in three-way catalysis, the kinatics of this reaction was studied under cyclic feeding conditions. The experiments using a Pt/y-AI20 3 catalyst were carried out below the light-off temperature as emissions after a cold engine start are a major problem. An elementary step kinatic model was developed which describes the experimental responses.
The role of ceria in commercial three-way catalyst is still not clarified. Therefore, the reaction between CO and 0 2 over a Degussa Pt/Rh/Ce0/v·AIP3 catalyst during toreed concentratien cycling was studied. The effects of ceria on the time-average conversion ware also addressed. Moreover, as real exhaust gas contains steam and C02 the influence of these components on the reaction rate was also investigated.
A transient model of an industrial monolith converter was developed to simulate the behaviour under dynamic conditions. Forced concentratien cycling may lead to higher time-average reactor performance depending on the oparating conditions (Lie et al., 1993; Nievergeld, 1994; Nievergeld, et al., 1994). The effects on the timeaverage converslons of CO, NO and hydrocarbons as a tunetion of the feed

22 CHAPTER 1
temperature, the feed composition and the cycling frequency were calculated. New catalyst technologies demand tight control of the air-to-fuel ratio and hence
more sophisticated control schames have to be developed. Controllers based on modelsof both the engine and the converter can be used to meet this requirement. To demonstrata the benefits of such a controller compared to a conventional controller the converter model was used in the design of a model based controller.
Re terences
- Andersson L., Mathematica! modelling in catalytic automotive polfution control, Ph.D. Thesis, Chalmers Univarsity of Technology, Göteborg, 1995.
-Bali D.J., Jacque E., A palladium front brick study, Preprints ofthe Third International Congress on Catalysis and Autornotive Pol/ution Control (CaPoC3), 137-146, 1994.
-Beek D.D., Sommars J.W., Impact of sulfur on three-way catalysts: comparison of commercially produced Pd and Pt-Rh monoliths, Preprints of the Third International Congress on Catalysis and Autornotive Pol/ution Control (CaPoC3), 147-159, 1994.
- Ciambelli P., Corbo P., Gambino M., lndovina V., Moretti G., Campa M.C., Lean NOx reduction on Cu-Na Y and Cu-HZSM-5 zeolites at the spark ignition engine exhaust, Preprints of the Third International Congress on Catalysis and Autornotive Pol/ution Control (CaPoC3), 377-386
- Cowley, A., Platinum 19941nterim Review, Johnson-Matthey PLC.J 1994 - .Fiorea D., Georgescu L., Constantinescu F., Mänoiu 0., Gaber D., Comänescu M.,
Zeolite catalysts tor the purification of automotive exhaust gases, Preprints of the Third International Congress on Catalysis and Autornotive Pollution Control (CaPoC3), 441-450
- Gulati S.T., Socha L.S., Then P.M., Design and performance of a caramie preconverter system, Preprints of the Third International Congress on Catalysis and Autornotive Pol/ution Control (CaPoC3), 93-109, 1994.
- Kirchner T., Eigenberger G., Optimization of the cold-start behaviour of automotive catalysts using an electrically heated pre-catalyst, Chern. Eng. Sci., 10, 2409-
2418, 1996 - Kirchner, T., Donnarstag A., König A., Eigenberger G., lnfluence of catalyst
deactivation on the automotive emissions using different cold-start concepts, Preprints of the Fourth International Congress on Catalysis and Autornotive Pol/ution Control (CaPoC4), 39-48, 1997
- Lie A.B.K., Hoebink J.H.B.J., Marin G.B., The effects of oscillatory feeding of CO and 0 2 on the performance of a monolithic catalytic converter of automobile exhaust

INTRODUCTION 23
gas: a rnadelling study, Chem. Eng. J., 53,47-54, 1993. - Nievergeld A.J.L, Simulation and design of a catalytic monolith reactor for automobile
exhaust gas conversion, lnstitute for Continuing Education, Eindhoven Univarsity of Technology, ISBN 90-5282-340-5, 1994.
- Nievergeld A.J.L, Hoebink J.H.B.J., Marin G.B., The performance of a monolithic catalytic converter of automotive exhaust gas with oscillatory feeding of CO, NO and 0 2: a rnadelling study, Preprints of the Foutth International Congress on Catalysis and Automotlve Pol/ution Control (CaPoC4), 189-198, 1994
-Oh S.H., Bissett E.J., Battison P.A., Mathematica! rnadeling of electrically heated monolith converters: Model formulation, numerical methods, and experimental verification, lnd. Eng. Chem. Res., 32, 1560-1567, 1993
- Rijkeboer A.C., Catalysts on cars- practical experience, Catal. Today11(1), 141-150, 1991.
- Tagliaferri S, Padeste L, Baiker A., Behaviour of three-way catalysts in hybrid drive systems. Dynamic measurements and kinetic modelling, Preprints of the Third International Congress on Catalysis and Automotive Pol/ution Control (CaPoC3), 81-92, 1994.
- Tamaru K., Mills G.A., Catalysts forcontrol of exhaust emissions, Cat. Today, 22, 349-360, 1994
- Taylor, K.C., Sinkevitch, A.M., Behaviour of automotive exhaust catalyst with cyclic feed streams, lnd. Eng. Chem. Prod. Res. Dev., 22,45-51, 1983.
- Taylor K.C., Nitric oxide catalysis in automotive exhaust systems, Catal. Rev.-Sci. Eng. 35(4), 457-481, 1994.

24 CHAPTER 1

2 EXPERIMENT AL SET-UP AND PROCEDURES
2.1 Introduetion
The experimental set-up to carry out kinatic experiments conceming automotive exhaust gas catalysis has been designed by Campman (1996). The equipment allows to perform experiments under both steady-state and cycling conditions. Cyclic feeding experiments can be carried out to study the effects of the oscillations on the timeaverage conversions (Matros, 1989). Furthermore, using data of dynamic experiments in kinatic studies is beneficia! as they provide much more information about the reaction mechanism and the parameters than steady state experiments (Bailey, 1977). In designing the set-up special attention has been given to impose a well defined concentration square wave form on the catalyst bed. A special valve arrangement upstream of the packed bed reactor minimises the influences of back-mixing of reactants and products on the concentration cycles and, hence, allows experiments to be carried out at a relatively high frequency. The gas analysis has been designed to allow monitoring of concentrations at high sample frequencies. Furthermore, the set-up has been designed to perform experiments under oparating conditions typical for automotive exhaust gas conversion.
In section 2.2 the experimental equipment is discussed in more detail. Some properties of the catalysts used during the transient experiments are presented in section 2.3. Section 2.4 deals with the pretraatment and stabilisation procedure before carrying out experiments and shows the results of some experiments with an oscillating feed between two Ar in He gas mixtures. These are carried out to get an indication of the upper limit of the oscillation frequency that can be obtained with the current set-up.

26 CHAPTER2
2.2 Experlmental set-up
The experimental set-up used for the CO oxidation by oxygen with cycling of the feed composition is described in detail by Campman (1996). Some aspectsof the equipment wilt be discussed in this section which are relevant for the work presented in this thesis. The complete set-up is schematically shown in Figure 2.1 and consists of a feed section A, a reactor section B and an analysis section C. The different sections will now be discussed.
Flgure2.1 Schematic presentst/on. of the experlmenta/ set-up.
2.2.1 Feed sectlon
The feed section contains two duplicate gas blending systems to allow the generation of two different feed streams necessary for cyclic oparation of the reactor. In steady state experiments only one gas blended system is used. Whereas the total

EXPERIMENT AL SET-UP AND PROCEDURES 27
molar flow rates of both feed streams will be kept equal during toreed concentration cycling experiments, the compositions of the two feed streams will be different. A series of thermal gas mass flow controllers and a HPLC pump determine the composition of the feed stream. The pump is used tofeed water to an evaparator located downstraam of the mass flow controllers when experiments with a feed containing steam are carried out. In the simulation of real exhaust gas compositions this is an important requirement. The water evaparators are designed tofeed a constant and reproducible steam flow.
Four magnetic valves (time to open or close: 3-5 ms) see Figure 2.1, are used to generate square wave concentration cycles. By opening the valves two by two one feed stream is passed to the reactor while the other is directed immediately towards the ventilation. The switching of the valves is synchronised by two timers using 1 ms increments which permits either symmetrical or asymmetrical concentration cycling with frequencies between 0.05 and 20 Hz. Pressure changes in the reactor due to switching the valves are minimised by carefully adjusting the pressure controllers downstraam of the reactor and in the bypass line.
Downstraam of the magnetic valves two separated feed lines, one for each feed stream, lead to the reactor. Before entering the catalyst bed the feed streams are
preheated by a tubular preheater. The temperature of the preheater is measured with a thermocouple and controlled by a PlO-controller. A programmabie logic controller (PLC) actuates the electromagnetic valves which secure the gas supply lines and controts the high speed electromagnetic valves. The PLC also watches the reactor temperature: if the reactor temperature is higher than 700 K all electromagnetic valves of the gas feed lines except the one for the balance gas He are closed.
The gases He, CO, 0 2, C02 and CH4 (intemal standard of the gas chromatograph) used in the experiments have purities of respectively 99.995 vol%, 99.997 vol%, 99.995 vol%, 99.995 vol% and 99.995 vol% and were supplied by Hoekloos.
2.2.2 Reactor sectlon
The reactor section consists of a stainless steel reactor which is contained in a cylindrical oven. A cross-section of the reactor is depicted in Figure 2.2. The two feed lines end in precision-machined chambers in the top of the reactor. Sapphire beads, one for each chamber, located downstraam of the reactor inlet act as one-way valves. Although Figure 2.2 shows only two beads and chambers for simplicity, six of them were present actually, distributing each feed over three parallel channels equally divided over the cross-section of the reactor. lf not pressurized, each sapphire bead is lifted by a flexible metal spring thus closing the corresponding feed line. The metal spring has
been constructed of Duratherm, a Ti and Al containing Co/NVCr alloy which ratains its

28 CHAPTER2
elasticity up to 1000 K. The strength of the metal spring is adjusted in such a way that the feed line which bacomes pressurized is open, while the other feed line remains closed. The valve spring is retained by a sintered quartz plate which also serves to enhance the radial distribution of the in let feed stream. By this reactor design square wave concentration cycles can be generated with a minimal extent of mixing between the two feed streams. A thermocouple in the thermocouple tube is used to measure the axial temperature profile in the catalyst bed. The reactor pressure is controlled by a spring loaded back pressure controller and measured using a pressure transducer in combination with a digital indicating device. The catalyst bed itself is 1 0 mm high with a diameter of 13 mm. lmmediately upstream and downstraam of the catalyst bed mass spectrometer capillaries are inserted into the sample chambers to allow the real time analysis of the feed stream entering the bed and the composition effluent respectively. The residence time in the sample chambers is very smalt
-OI( ,..
10mm
Flgure2.2 Detalled view of the fixed bed reactor used In the cycllc feeding experiments.
compared with the period of the asciilation under the experimental conditions applied meaning that the chambers do not affect the shape of the inlet and outlet concentration wave form.
2.2.3 Analysis Beetion
The analysis section contains a gas chromatograph (Carlo Erba lrstruments GC 8340) and a quadrupale mass spectrometer (VG Sensor lab 2000). The gas chromatograph is used in catalyst line-out experiments as the catalyst activity changes on a time scale of hours. lt has been designed to enable online quantitative analysis of H2, N2, CO, NO, 0 2, C02 and ~0. Methane serves as intemal standard component and is added to the reactor effluent directly downstreem of the reactor; 99.999% pure helium is used as carrier gas. Remote control of the gas chromatographic analysis as welt as

EXPERIMENT AL SET-UP AND PROCEDURES 29
data acquisition and data analysis are performed using HP Chemstation software (Hewlett Packard) installed on a personaf computer.
The online analysis of the composition at the reactor in let and the outlet during experiments with a cycling of the feed is performed using the mass spectrometer. Two stainless steel capillary (l = 1.8 m, d; = 0.3 mm) are connected to the sample chambers located directly upstream and downstraam of the catalyst bed, see Figure 2.2, and to a zero volume three-way valve which leads to the mass spectrometer inlet. By switching
the three-way valve, either the reactor feed or the reactor effluent can be sampled. The time resolution of the mass spectrometer was enhanced by application of software and hardware originating from mass spectrometer systems used in breath analysis in a medical environment. Mass spectrometer control and data acquisition are performed by VG Medical software running on a dedicated personaf computer. Th is arrangement allows gas composition analysis at a sample frequency of typically 120/n Hz, where n denotes the number of atomie mass units to be measured, meaning that a mixture containing He, CO, 0 2 and C02 can be analysed thirty times per second.
To obtain quantitative measurements the mass spectrometer is calibrated daily, before startlog the cyclic feeding experiments by passing known gas mixtures through the reactor. The calibration procedure is discussed insection 2.4.2.
2.3 Catalyst preparatlon and characterisatlon
The catalysts were supplied as a powder by Degussa A.G. with a mean partiele diameter of 12 ~m which is too small for the experiments in the micro-fixed bed reactor as using this powder would result in a significant pressure drop over the catalyst bed. Therefore, the powder was pressed into small pellets at a pressure of GPa for 1 minute. The pellets were crushed and sieved afterwards and the desired fraction was collected. Some properties of the Ptly-AI20 3 and the Pt/Rh/Ce0Jy-AIP3 catalyst after pressing, crushing and sieving are presented in Table 2.1.
The catalyst texture properties shown in Table 2.1 have been derived trom static CO and 0 2 chemisorption measurements and from literature (Campman ,1996). Both the CO and the 0 2 chemisorption procedure were the same as Campman (1996) used for CO chemisorption measurements. The catalyst pretraatment during the chemisorption procedure was similar to pretraatment of the samples used for the cyclic feeding experiments. From the CO chemisorption capacities of the catafyst the fractions exposed noble metal were calculated using 1 CO per Pt atom and 2 CO atoms per Rh atom. The 0 2 chemisorption measurements with the Pt1y-A~03 catalyst were performed todetermine the oxygen adsorption capacity using one oxygen adatom per Pt atom.

30 CHAPTER2
Tsble2.1 Physico-chemlcsl cstslyst propertles.
Catalyst Pt/y-AI20 3 Pt/Rh/Ce0/y-AI20 3
Texture properties
r /nm 5 10
as /m2 kg·1 225 1oa 125 103
Vpore (BET) /m3 kg·1 0.54 10"3 0.35 10"3
dp /m o.25-o.3o 1 o-3 o.15-o.2o 1 o·3
p /kg m.a 1230 2280
eP /m3 m·3 g p 0.67 0.67
CO Chemisorptlon cspscltles
nchem /mol kgc·1 1 10"2 (5 10-a OJ 1.6 10"2
FE /mol8 mol"1 0.49 0.45
~M /mol k9c·1 1 10"2 1.3 10·2
Welght tract/on
WPt /kg kgc·1 3.98 10"3 3.98 10"3
WAn /kg kgc·1 0.79 10-3
WCe02 /kg k9c·1 0.3
2.4 Experimental procedures
2.4.1 Catalyst pretrestment and stabllisation
In order to enable reproducible kinetic experiments an appropriate catalyst pretraatment procedure is important. The pretraatment procedure carried out prior to the experiments described in this thesis is the same procedure as was used by Campman (1996}. At first the catalyst is heated to 773 Kin a flow of He. Then the

EXPERtMENTAL SET-UP AND PROCEDURES 31
Table2.2 Experimental condltions during catalyst pretrestment (p = 110 kPa).
pretraatamant inlet flow rata /mol s·1 T/K t/min phase He 02 H2
heating 1.7 10"3 0 0 293~ 773 30
oxidation 5.6 10"4 1.4 1 o-4 0 773 60
purge 1.7 10"3 0 0 773 30
reduction 8.4 104 0 4.4 10-5 773 120
cooling 1.7 10"3 0 0 773~ T reaction 60
catalyst is kapt under a pure He flow at 773 K for 30 minutes in order to purge reversibly adsorbed oxygen, foliowed by reduction in a He flow containing 5 vol% H2 at 773 K for 120 minutes. Finally the catalyst is caoled down under a He stream to the reaction temperature. The catalyst pretraatment procedure is summarised in Tabla 2.2.
Table2.3 Experimental condit/ons during the I/ne-out procedure.
Pco /kPa 2.2
Po2 lkPa 2.2
PH20 /kPa 0
PC02 /kPa 0
T /K 423
Ftot /mol s·1 6.4 10"4
'l Experiments with C02 and H20
0.55
0.55
0/11'1
0/11')
393
5.6 10"3
From introductory experiments it was found that both the Pt/y-AI20 3 and the Pt/Rh/Ce0Jy-AI20 3 catalyst exhibited a higher initia! activity aftar daily start-up as compared to the activity the day before. In order to minimise the influence of these reversibis start-up effects on experimental results, a line-out procedure had to be carried out. Aftar the catalyst pretraatment and befare the experiments with cycling of the feed the catalyst activity was foliowed in time. The activity of the catalyst was
assumed to be stabie as the decay was less than 1% per hour. By camparing the

32 CHAPTER2
activity to the activity measured aftar the previous line-out the reproducibility of the experiments was ensured. lnltially a He flow, containing also steam and C02 when applicable, was directed over the catalyst bed. Then CO was added to the flow foliowed by 0 2 aftar one minute. The reason for this sequence is that when oxygen was fed prior to CO the catalyst bed sustained a transient tempersture rise aftar adding CO, which caused a considerable delay in establishing a steady state. In Table 2.3 the experimental conditlans during the line-out procedure are listed.
2.4.2 eaUbration of the mass spectrometer
For a quantitative analysis of the reactor effluent the mass spectrometer was calibrated daily before the cyclic feeding experiments were started using four known gas mixtures containing He, CO, 0 2 and C02, see Tabla 2.4. The total flow and the total pressure were selected to be the same as during the cyclic feeding experiments since it tumed out that they influence the measured intensities. Aftar a stabilization period of 5 minutes the composition of the reactor feed was determined for each mixture by the mass spectrometer. The signals were used to deduct the calibration curves for each
Table2.4 Cal/bration mixtures 1· 4 (Ftot-= 5.61q3 mol s'1}
component 1 2 3 4
He /vol% 100 (80) 99.4 (79) 98.8 (78) 97.6 (76)
co /vol% 0 0.2 0.5 1
02 /vol% 0 0.3 0.5
C02 /vol% 0 (10) 0.1 (10.5) 0.2 (11) 0.4 (12)
H20 /vol% 0 (10) 0 (10) 0 (10) 0 (10)
Values between brackets are used durlng the cyclic feeding experiments with a feed also containing C02 and H20.
component. For He a linear eaUbration curve was used as the mass spectrometer signa I is proportional to high concentrations. For the other components second order polynomials were used as eaUbration curves. The coefficients of the curves ware obtained by regression of the measured mass spectrometer intensities with the calibration curves.

EXPERIMENT AL SET-UP AND PROCEDURES 33
2.4.3 Cycling of argon concentrations
To detennine whether the effects of back mixing of reactants and productscan be neglected in this study, cyclic feeding experiments with a feed containing argon have been carried out.
0.80
::t?. ~ 0.60 >
....... I* All* 1 r: t•lllfbaeuu c: 0 5 t : + i 0.40 $ 4> ... ë B ~ i ' 8 0.20 '
~
<i. I
0 "' "s
0.000 2 3 4 5
time/s
Flgure2.3 Ar In/et and outlet concentrat/ons versus time durlng forced cycling. <> = In/et; + = out/et. f = 0.5 Hz.
In Figure 2.3 the outlet and the inlet concentrations of the reactor are given at an asciilation frequency of 0.5 Hz. As can be seen from this figure, the inlet signa! is not distorted by the flow through the reactor and clearly the effects of back mixing can be neglected. Hence, the reactor can be regarded as an ideal plug flow reactor. The sample frequency of the mass spectrometer is a lso high enough as saveral samples are taken at the steep ascents and descents of the curves. Both the rise time and fall time amount to about 0.06 s whlch means that the highest frequency which can be applied without distartion of the amplitude is about 8 Hz. At higher frequencies the shape of inlet concentration tends to approach a hannonic function, but as long as both the reactor inlet and outlet compositions can be analysed with suftleient high time resolution the deviation from a square wave is rather irrelevant in kinatic studies.

34 CHAPTER2
2.4.4 lnlet concentrations
In Figure 2.4 the inlet concentrations during the cyclic feeding experiments are shown. Both the experiments with the Ptly-AI20 3 and the Pt!Rh/Ce0Jy-AI20 3 catalyst discussed in this thesis were carried out with feed concentrations as depicted in this figure. The feed stream was switched from 0.5 vol% CO to 0.5 vol% 0 2 and vice versa. As the concentrations vary between zero and 0.5 vol% the surface coverages will also change over a very broad range and therefore much kinetic information will be available at the outlet of the reactor. Although the inlet concentration wave was the same tor all experiments, both the reactor in let and outlet compositions were measured during the cyclic feeding experiments. The measured inlet and outlet concentrations were used in the modelling.
0.80,----------------------,
i :-:... 0·00o~--"'!------~~---8----1 ... 0 ......
Flgure2.4 CO snd 0 2 In/et concentrat/ons versus time dur/ng toreed concentrat/on cycl/ng. + = CO; .& :::: 0 2; f = o. 1 Hz.
2.4.5 Smoothing of the expertmental data
When carrying out preliminary experiments with a feed containing 1 0 vol% C02
and 1 0 vol% H20 it appeared that the signal-to-noise ratio of the C02 mass
spectrometer maasurement was rather low. A typical example of such an experiment is shown in Figure 2.5. Extracting kinatic information from the noisy C02 signa! is difficult

EXPERIMENT AL SET-UP AND PROCEDURES 35
and therefore a smoothing technique was applied to the original mass spectrometer data. The smoothed response is also shown in Figure 2.5 and the result is quite satisfactory. The smoothed and the original response were always compared to make sure no valuable information was lost by the applied smoothing method.
0.80.-----------------,
'#. ~ --". 0.60 0
g c: 0.40
~ l!!
1020
10.60 '#. ~ ......
co "' .•.••.... ·. 10.40 0
(.) c:
. 10.20 ~
I 10.00
0.00 ow' ---i~=.J:2'"'-L..:..JL..:.J~4....,__,...:.J.o---'-oi6"'"--'--'""-'--'--"'8"'"'-'-""--'-"'-1"'-0 =-..J....J
time/s
Flgure2.5 Orlglnal (thin llne) and smoothed (thick line) C02 outlet concentration versus time durlng cyclic feeding of CO and 02" I niet concentrations see Figure 2.4. Feed stream also contains 10 vol% H20 and 10 vol% C02; f = 0.1 Hz.
The signal-to-noise ratio was increased by smoothing the data with cubic splines (NAG, 1995). The spline coefficients ai are estimated by nonlinear regression of the original data with the object tunetion given by:
n
S(a) = m~ntr wly1 - f(a,x1))2
+ p [{t"(a,x1)fdx (2.1)
where W; is the (optional) weight for the ith observation and p the smoothing parameter.
This object tunetion consists of two parts: the first part measures the fit of the curve and the second part measures the smoothness of the curve. The value of the smoothing parameter, p, weights these two aspeets: largervalues of p give a smoother fitted curve (because the second order derivative of f(x) is then toreed to be smaller), but in general a poorer fit. Smallervalues of p give a less smoother curve but in general a better fit

36 CHAPTER2
and representation of the characteristics of the original observations. The unweighted smoothing presented in Figure 2.5 was performed with p amounting to 100.
References
- Bailey, J.E., Periodic phenomena, in: Chemica! reactor theory: A review, Lapidus L., and Amundson N.R., Eds., 758-813, Pretence-Hall, Englewood, NJ, 19n
- Campman, M.A.J., Kinatics of carbon monoxide oxidation over supported platinum catalysts, The role of steam in the presence of ceria, Ph.D. Thesis, Eindhoven Univarsity of Technology, 1996
- Matros, Y.S., Catalytic processas under unsteady-state conditions, Studies in surface
science and catalysis, 43, Elsevier, Amsterdam, 1989 - NAG Fortran Library Manual, mark 16, volume 1, 1995

3 FREQUENCV RESPONSE ANAL VSIS AIMED AT DETERMINATION OF KINETIC PARAMETERS
3.1 Introduetion
Chemica! reactors are usually operated in steady state, but periodic oparation may be beneficia! insome cases. From a practical point of view, dynamic reactor oparation can result in a higher time-average performance (Bailey, 1977; Ranken, 1984). When a reactor is operated dynamically, the instantaneous rates will usually be different from those obtainable at steady state rasuiting in a time-average performance of the reactor, which can change significantly as a tunetion of the frequency of the applied oscillation. Usually, this phenomenon results from the nonlinear behaviour of the kinatics (Matros, 1989). From a more fundamental point of view, periodic reactor oparation can be used to study the processas occurring in a reactor, such as transport phenomena and the reaction mechanism, and to estimate the corresponding rate coefficients. Compared to steady state operation, dynamic oparation gives much more insight into the processas taking place.
A drawback of conducting transient experiments is the experimentally more complex equipment needed to generata the time-dependent input signals and to maasure the rasuiting responses. Three types of input forcing functions are commonly applied to obtain more insight in the processas to be studied. Step changes and pulses are often used since they are easy to realize experimentally. The shape of the responses caused by the dynamic behaviour of the reactor system contains information about the rates of the individual steps of the occurring global processes. A drawback of step and pulse experiments is the difficulty to extract information about all individual
38 CHAPTER3
steps trom the measured response. The shape of the observed response is mainly determined by the rate determining step, and therefore it is hard to obtain information about the other steps. Harmonie perturbations are the third type of forcing function. The information about the dynamics of the individual steps of the global processes is available in the amplitude of the output oscillation and the phase shift of the output with respect to the input. The frequency is adapted to highlight the dynamics of a particular step of the processes and therefore to obtain information about this step only. By applying a range of frequencies the rates and the corresponding coefficients of all steps can be determined. This in contrast to both step and pulse experiments, where the observed response contains information about all processes simultaneously.
The frequency response method uses harmonie functions as input wave form. Since this analysis is only applicable to linear systems straightforwardly, small amplitudes have to be applied when dealing with nonlinear systems. When estimating parameters of the steps by means of regression of the experimental data, the goveming nonlinear model equations have to be linearized around the steady state to be able to derive the frequency response equations. Lynch and Walters (1990) showed that due to this linearization no valuable information about the dynamics of the processes is lost and linearization is, therefore, often allowed. One of the most promising features of the technique is its ability to discriminate between rivalling models due to the high sensitivity of the frequency response to the nature of the goveming equations, as shown by several studies (Naphtali and Polinski, 1969; Marcelin et al., 1986; Schrieffer and Sinfelt, 1990; Yasuda et al., 1991).
One first application of the frequency response analysis was th~ determination of the distribution of residence times in a continuous flow system (Kramers and Alberda, 1953). Lynch and Walters (1990) used the frequency response analysisto characterize an external recycle reactor. However, the most important usage of this technique reported in literature is the studying of the adsorption of gases in bidisperse sorbents (Jordi and Do, 1993, 1994; Sun and Bourdin, 1993; Sun et al., 1994; Yasuda, 1994). Applications of the frequency response techniques in kinetic studies are in the minority. Naphtali and Polinski (1969) were the first to apply this technique in determining the adsorption rates on heterogeneaus surfaces in a batch reactor. Several investigators showed that the technique is very suitable for the identification of different adsorption sites and determination of the corresponding rate constants in a batch reactor (Marcelin et al., 1986; Yasuda, 1978, 1982, 1984, 1985, 1991 ). Li et al. (1989) and Lynch and Walters (1990) used the frequency response method to study the adsorption-desorption kinatics in continuous flow reactors. Madix and Schwarz (1971a), Madix et al. (1971b)
and Schwarz and Madix (1974) applied the frequency response analysis to data obtained from a Modulated Beam Relaxation Speetrometry experiment. Schwartz et al. (1986) adapted the classica! frequency response analysis to make its application possible to nonlinear systems without linearization of the equations and used it to study

FREQUENCY RESPONSE ANAL YSIS AIMED AT DETERMINA TION OF KINEriC PARAMETERS 39
adsorption and desorption in combination with surface diffusion. Using nonlinear model equations in the regression of the experimental data may lead to kinetic parameters which are valid over a wider range of conditions.
The purpose of this chapter is to study the frequency response method aimed at the determination of kinetic parameters in both a continuous stirred tank reactor and a plug flow reactor. Not only adsorption and desorption but also surface reaction will be considered in this study. The derived frequency response equations will be used to examine the dynamic behaviour of both reactors and the results of a parameter sensitivity analysis will show which reactor type is most suitable tor in this respect.
3.2 Deflnltions
Before discussing the application of a frequency response analysis in kinetic studies, some definitions will be given. Usually, this analysis is applied to linear systems only. When dealing with nonlinear systems, I.e. systems characterized by a Jacobian which depends on the dependent variables, the experimentally applied perturbations should be smal! to allow the assumption of linearity. The latter means that the superposition principle holds and Laplace transfarms are applicable in the analysis leading to easier-to-perform mathematics.
The dynamic behaviour of a linear system is described by the gain and the phase shift of the output with respect to the input. For input x(t} described by:
x(t} = A1nsin(wt) (3.1}
the output of the system is given by:
y(t) = A0ut(oo}sin(wt +cp(w)) (3.2)
The gain of this system is defined by the ratio of the output amplitude and the input amplitude, Aout(w)/A;n, while the phase shift is given by cp(oo). Both the gain and phase shift are functions of the frequency w and of the parameters one wants to estimate. When applying a frequency response analysis, the gain and the pháse shift are the quantities to be measured and they are used in the regression process that delermines the values of the kinetic parameters.
A system with more than one input and more than one output is called a MIMO· system (Multiple~lnput, Multiple-Output). The dynamic behaviour of such a system is described by a number of gains and of phase shifts (number of input x number of outputs}, each withits own frequency dependency.
The characteristic response time Tc is defined by the time scale of the observed

40 CHAPTER3
output assuming a first order system, i.e. a system described by one first order
differential equation and, therefore, having only one time constant. When dealing with a higher order system, the characteristic response time approximates the largast time scale involved. Based on the period Tm of the toreed asciilation and the characteristic response time of the system, three different regimes of periadie operation can be distinguished (Bailey, 1977; Matras, 1989). In the classification of the regimes it is assumed that the system acts mainly as a first order system.
The first regime is the quasi-steady state regime (Tm "Tc). In this case, the input varies rather slowly compared with the dynamics of the system and the system can be considered as always in a steady state.
When the period of the asciilation is of the same order as thé characteristic
response time (Tm "' T,;), the reactor is in the intermediale or dynamic regime. The transient behaviour has to be determined to predict the effects of the periadie operation. The frequency range corresponding to the quasi-steady state regime plus the dynamic regime is also called the bandwidth of the system.
The third one is the sliding regime, also called relaxed steady state regime. When the input variabie varies rapidly relative to the characteristic response time (Tm "Tc), the outlet asciilation will show a very small amplitude. The quasi-steady state approximation can be applied to determine the behaviour using the time-average value of the input variable.
lt is also possible to study the dynamic behaviour of a system in the Laplace or in the frequency domain. Analyses in the Laptace domain are beneficia! icompared with studies in the time domain, since the time derivatives are transformed into corresponding polynomials in the Laptace variabie and therefore the rnathematics is easier. The output-input behaviour of a system in the Laptace domain is characterized by its transfer function. The output of the system is then given by:
Y(s) H(s) X(s) (3.3)
where H(s) is the transfer tunetion which can belang to the complex domain. Y(s) and X(s) are Laplace transfarms of the outlet and inlet signal, respectively. The gain is given by the absolute value of H(s), while the phase shift is defined by its argument. Transformation from the Laptace domain to the frequency domain is done by the substitution of s=iw, where i=v'(-1).
The kinetic parameter estimates are obtained by regression of the experimentally gathered amplitudes and/or phase shifts and the equations for the gain and phase shift in the frequency domain.

FREQUENCY RESPONSE ANAL YS/S AIMED AT DETERMINATION OF KINETIC PARAMETERS 41
3.3 Adsorption and desorptlon In continuous flow reactors
3.3.1 Introduetion
To show the benefits of a frequency response analysis in the assessment of kinetic parameters, the simple example of adsorption and desorption on a catalyst surface is considered. The expressions of the gain and the phase shift ware derived analytically and used to show the effects of parameter changes on the dynamic behaviour of the reactor. The parameter dependenee of the calculated gain and phase shift is very important during the estimation process since it eventually determines the statistica! significanee of the parameter estimates.
The following example is considered:
A being the species to be adsorbed trom the gas phase, * a vacant site and A* the adsorbed species. This process is studied in two reactor types: a continuous stirred tank reactor (CSTR) and a plug flow reactor (PFR). The inlet concentration is considered as input variable, while the outlet concentration serves as output. Although the frequency response analysis is often used to study adsorption-desorption in combination with transport phenomena, intrinsic kinetics are considered only in this example, as the purpose of this section is to show the application of this technique in the determination of kinatic parameters. During a frequency response analysis the gain and phase shift of the outlet concernration are measured as a tunetion of the frequency when the in let concentration oscillates harmonically around the steady state value with a fixed amplitude. The kinatic parameters can be obtained by regression of the measured data with the expressions tor the gain and the phase shift derived trom solving the continuity equations.
The continuity equation for adsorbed species A for both the CSTR and the PFR is given by:
dO A dt = k1CA9• - k_19A
and the balance of the active sites is given by:
a. + oA = 1
(3.4)
(3.5)
where OA and a. are the fractional surface coverage of A and the fraction of vacant sites,

42 CHAPTER3
respectively. In the next two sections the expressions for the gain and the phase shift will be derived for both the CSTR and the plug flow reactor.
3.3.2 Adsorption-desorption in a CSTR
The continuity equation for A in the gas phase of the CSTR is given by:
where the residence time T R is defined by
VA TA = -
Fv
(3.6)
(3.7)
and assumed to be constant. CNM denotes the ratio of the capacity of the catalyst surface and the capacity of the gas phase in moiNJmt
When applying the frequency response method, the nonlin1ear differential equations 3.4 and 3.6 are linearized around the steady state. Therefon~, the system is assumed to be at steady state before the oscillation is started. The initiál conditions for the gas phase concentration and the surface coverage are then given by the timeaverage inlet concentration and the steady state surface coverage:
(3.8)
As no reaction takes place the outlet concentration equals the inlet concentration in steady state and the surface coverage is determined by the inlet concentration only.
Both the inlet and outlet concentrations and the surface coverage oscillate harmonically around the steady state, which can be expressed as:
c~n(t) = cAss + ac~n(t), CA(t) = c:s + aCA(t), 9A(t) = e:,s + aaA(t) (3.9)
After substitution of the expressions given in Equation 3.9 into Equations 3.4 to 3.6 and neglecting second order terms of a, a set of linear differential equations in a is obtained, which is transformed to the frequency domain. The expression forthe gain is given by:

FREQUENCY RESPONSE ANAL YS/S AIMED AT DETERMINA TION OF KINETIC PARAMETERS 43
IH(w)l
and for the phase shift:
4> = - arctan -""'-'---...;..;;.:.;_;___;_..:...__~_ [
wTJ1 + CNMk1 k_1~ + w~)l 1 + CNMk1k_1T1T2 + w~
(3.11)
where T1 and T2 are given by:
(3.12)
The complete denvation of Equations 3.1 0 and 3.11 is given in appendix 3A. Both T1 and T2 can be considered as time scales assuming the surface and the gas phase are decoupled, i.e. ll.CA is an independent input variabie in the equation corresponding to the balance for the surface species A. Th is is the case when the gas
phase capacity is much larger than the capacity of the surface, i.e. CNM is small. T1
expressas then the time scale of relaxation to the steady state of adsorbed A as a resûlt of a changes of ll.CA or ll.CA1
". When CNM is rather large, the expressionsof the timescales have to be derived from Equation 3.10 resulting in rather complex equations without giving more insight into the dynamic behaviour of the reactor. Hence, they are not shown in this section.
Due to the complexity of Equations 3.10 and 3.11, the dynamic behaviour is not immediately clear. However, limiting values forthe gain and the phase shift in the sliding regime are 0 and - n/2 respectively, and therefore no kinetic inforrnation is available at the outlet of the reactor for high frequencies. More properties related to Equations 3.1 0 and 3.11 will be shown in section 3.3.4, where the dynamic behaviour of CSTR and plug flow reactor are compared. From Equations 3.1 0 and 3.11 it is clear that the dynamic behaviour of the CSTR not only depends on the kinatic parameters but also on the ratio
of the gas phase capacity and the surface capacity CNM• and on the residence time T R·
Hence, by carefully selecting the appropriate experimental conditions as much as possible inforrnation about the kinetic parameters can be extracted from the outlet

44 CHAPTER3
concentratien within the range of allowed oparating conditions.
3.3.3 Adsorption-desorptlon in a plug flow reactor
The example given in section 3.3.1 is now considered in a plug flow reactor. The continuity equation tor A in the gas phase is expressed as:
acA acA ' -at = -vax - cNM\k1CAe. - k_1SA) (3.13}
The continuity equations tor the surface species, Equations 3.4 and 3.5, hold also tor the plug flow reactor. lnitial conditions are given by the steady state concentratien and surface coverage profiles:
(3.14)
and the boundary condition by the time-dependent inlet concentration:
CA(O,t) = c~n(t) (3.15)
The expresslons are linearized around the steady state using:
CA(x,t) CASS + liCA(x,t), SA(x,t) = e~s + li8A(x,t) (3.16)
Equation 3.16 is substituted into Equations 3.4, 3.5 and 3.13 and second order terms in ti are neglected. Application of the Laplace operator in time to • the linearized equations results in an ordinary differentlal equation for the continuity equation of A in the gas phase and in an algebraic equation for the species on the catalyst surface. The Laptace transformed surface coverage is eliminaled trom the continuity equation tor A in the gas phase and the goveming differentlal equation is integrated in the x-direction. After transformation to the frequency domain equations for the gain and the phase shift are obtained. In appendix 3A the complete denvation is shown.
The gain is expressed by
IH(w)l ej. TRT~CNMk-1k1oo2] ""'l 1 + w2~
(3.17)
and the phase shift by:

FREQUENCY RESPONSE ANAL YSIS AIMED AT DETERMINATION OF KINETIC PARAMETERS 45
TRoo(1 + CNMk_ 1 k1~ + oo~) 1 + 4>~
where T1 is given by Equation 3.12.
(3.18)
Equations 3.17 and 3.18 show that both the gain and the phase shift are not only dependent on the kinetic parameters to be estimated but also on the reactor parameters TR and CNM. Highervalues of TR and CNM leadtoa taster decreasing gain as a tunetion of the frequency and consequently a smaller bandwidth. Hence, their values can be selecting according to the limitations of the experimental setup. From Equation 3.18 it is clear that CNM should be large enough in order to estimate kinetic parameters since the phase shift is a tunetion of the residence time only for small values of CNM and no kinetic information can be extracted from the outlet concentration. In contrast to the CSTR, the gain is still a tunetion of the kinetic parameters in the sliding regime whereas the phase shift becomes proportionaf to the trequency for very high frequencies and, hence, contains no kinetic information.
3.3.4 Dynamics of a CSTR versus a plug flow reactor
To demonstrata which reactor type is preferably used for the identification of kinetic parameters, the gain and the phase shift are calculated using the parameters shown in Table 3.1. The parameters are chosen to simulate the behaviour of potentially fast adsorbing species on a catalyst surface such as sorption of CO on platinum. lt is assumed that the dynamic regime is entered when the deviation from the gain at very low trequencies amounts to 10%, whereas the sliding regime starts at a 90%
reduction of the ga in. As shown in Figure 3.1, the dynamic
regime of the CSTR is entered at a trequency of 0.25 Hz and ends at 5 Hz. The gain of the CSTR decreasas initially taster than the gain of the plug flow reactor with increasing frequency, but remains almost constant in the sliding regime (f > 5 Hz). In this regime the gain is strongly dependent on the frequency.
Table 3.1 Parameters ussc:l to calculate the gain and the phase shift of the CSTR, using Equations 3.10 and 3.11, and the plug flow reactor, Equatlons 3.17 and3.18.
k, /mol'1 m 3s'1 g 1000
k_, Is_, 10
TR Is 0.1
CA" /mol m9-a 0.2
CNM /mol9
m9•3 10
T1 Is 4.8·10'3
T2 Is 2.1·10'3

46 CHAPTER3
The dynamic regime of the PFR starts at about 2 Hz and ends at 8 Hz; the sliding regime is not entered. Apparently, the braader bandwidth of the plug flow reactor compared to the bandwidth of the CSTR can be explained by the absence of mixing in the gas phase. This also means that mixing plays an important role in the dynamic behaviour of the CSTR and probably less detailed kinatic information will be available at the outlet of the reactor. r1 and r2 cannot be considered as time-scales as they suggest a bandwidth of one order of magnitude larger than the one shown in Figure 3.1.
1.20,-------------,
2
Figure3.1
4
frequency !Hz
8
The galn of the CSTR and the plug flow reactor versus the frequency calculated uslng Equatlons 3.10 and 3.15. Parameters: Table 3. 1, (···) =plug flow reactor;(-)= CSTR.
frequency !Hz
Figure3.2 The phase shift of the 'CSTR and the plug flow reactor versus the frequency calculated uslng Equatlons 3.11 and 3.16. Parameters: Table 3.1, (···)=plug flow reactor;(-) =CSTR.
Figure 3.2 shows that the frequency dependenee of the phase shift of the CSTR is less pronounced than the frequency dependenee of the gain. However, it is not clear whether the gain or the phase shift should be used in the determination of kinatic parameters. The phase shift of the plug flow reactor decreasas linearly as a tunetion of the frequency. lt should however be noted that the phase shift is not on I~ caused by the residence time but also by the interaction with the catalyst surface since the phase shift due to the gas flow through the reactor only amounts to -2ntr A which is not in fine with Figure 3.2.
As mixing in the gas phase also determines the dynamic behaviour of the CSTR, the observability of the parameters wilt probably be better in the plug flow reactor than in the CSTR. In the next section a parameter sensitivity analysis wiJl show if this is the case.

FREEQUEENCY RESPONSE ANAL YSIS AlMEED AT DETEERMINA TION OF KINEETIC PARAMETERS 47
3.3.5 Parameter sensitivity analysis
When applying the frequency response method, the kinatic parameters are adapted in such a way that the measured gain and phase shift as a tunetion of the frequency can be described by the model. Usually the kinatic parameters are estimated by means of nonlinear regression and the sensitivity of the calculated gain and the phase shift to parameter variations is very important in obtaining statistically significant parameter estimates. To investigate this parameter sensitivity in a CSTR and a plug flow reactor both parameters k, and k., were changed simultaneously with + and - 1 0% of the values given in Tabla 3.1. The equilibrium coefficient k,lk., remains constant in this Way. When camparing the effects of the parameter variations on the gain and the phase shift of the CSTR and the plug flow reactor it will become clear which reactor type is preferably used in the determination of kinatic parameters. The deviations of the gain and phase shift depicted in Figures 3.1 and 3.2, are given in Figures 3.3 and 3.4.
..:..
0.10r-------;======;i
1
- k, =1100, k,, =11111
- - k, =900, k,, =9 0.07
0.03 PFR
·i -o.oo:---~::---".---------1 .8' --y___ --
.0.03 ~ CS"......_ ----P-FR-
.O.o7 ~
-o.1oo:-~--:2-~--'-4-~-6:-~--:6
lrequency /Hz
Figure3.3 Deviation of the galn of both the CSTR and the plug flow reactor versus the frequency due to a 10% change of parameters given In Table 3.1. (···) = -10%; (-) = +10%.
- k, =1100, k,, =11
- - k, =900, k_, =9
PFR · ..
2
Flgure3.4
4
frequency /Hz
6 B
Devlation of the phase shift of both the CSTR and the plug flow reactor versus the frequency due to a 10% change of parameters given In Table 3.1. ("') = -10%; (-) = +10%.
As shown in Figure 3.3, changing the values of both parameters simultaneously does not affect the gain of the CSTR which means that adsorption and desorption are in equilibrium with the gas phase and no information about the individual parameters is obtainable from the output. However, the gainis affected when one parameter only is changed, but the effects of the individual parameter variations cancel out when both parameters are changed simultaneously. As shown in the same figure, the gain of the PFR depends on the values of the individual parameters. Both parameters can be estimated and the optimal frequency range is between 2 and 8 Hz. For frequencies

48 CHAPTER3
higher than the ones shown in Figure 3.3, the deviation of the gain goes to zero. lt is therefore not beneficia! in this case to apply higher frequencies when estimating the kinatic parameters by means of the frequency response method.
As shown in Figure 3.4, the behavîour of the phase shift is similar to that of the gain. The deviation of the phase shift of the CSTR changes only slightly as a function of the parameters. At frequencies above 4 Hz the phase shift of the PFR is strongly affected by the parameters variations. Clearly when using the phase shift of the PFR in the regression process the frequency should be relatively high.
Summarizing, the plug flow reactor is more suitable for the determination of kinatic parameters using the frequency response method than the CSTR. 8oth the measured gain and the measured phase shift can be used in the regression, and it is not necessary to apply very high frequencies for all practical purposes. When the frequency response method is applied to reactions with different behaviour, the frequency dependenee of the gain and the phase shift wUI differ from those shown in Figures 3.1 and 3.2. Hence, a parameter sensitivity analysis has to be carried out for all individual cases. However, quasi-steady state oparation will always reveal similar kinatic information as steady state operation. The dynamic behaviour of the CSTR will always be determined by both the reaction kinatics and mixing in the gas phase and, hence, experiments with a plug flow reactor will result in more detailed kinatic models of the occurring reactions.
3.4 Three-step mechanlsm in continuous flow reactors
3.4.1 Kinetic model
The examples discussed in section 3.3 are extended to a thre~-step reaction mechanism. Not only adsorption and desorption of A is considered but the dissociative adsorption of another component 82 foliowed by surface reaction between the adsorbed species is also taken into account. The reaction mechanism used in the examples of the CSTR and the plug flow reactor is given by:
k,
A + * .. A* k_,
~
82 + 2 * - 28*
2A + 82 - 2C

FREQUENCY RESPONSE ANAL YSIS AIMED AT DETERMINA Tl ON OF KINETIC PARAMETERS 49
The surface coverages are calculated by solving the continuity equations tor the species on the catalyst surface which are given by:
aeA at = k1CA8• - k_18A - i<a8A8B
and the balance of the active sites by:
a. + eA + 88 = 1
In Table 3.2 the kinatic parameter values are given. The values are chosen to approximate the behaviour of the CO oxidation by 0 2 over a supported platinum catalyst. This means that at the conditions shown in Table 3.2 adsorption of 8 2 is inhibited by adsorbed A. By setting the accumulation terms of Equations 3.19 and 3.20 to zero and solving the rasuiting set of nonlinear equations, an expression tor the steady state reaction rate is obtained. Since multiple complex solutions arise trom the nonlinear equations, the expression of the reaction rate is not just one simple expression. But, under the given conditions it is reasonable to assume CO adsorption equilibrium. With the adsorption of 82 being the rate determining step, implying 88
« a. « SA, the steady state reaction rate is given by:
R = 2~ Ce2 K2 c2
1 A
(3.19)
(3.20)
(3.21)
Table3.2 Parameters used to calculate the gain and phase shift of the outlet concentrations of both the CSTR and the plug flow reactor.
/mol-1 m 3s·1 g
ts·1
/mol-1 m 3s·1 g
ts·1
Is
/mol m9
•3
/molm -3 g
/mol ma-3
1000
10
100
10
0.1
0.2
0.1
10
(3.22)
From Equation 3.22 it is clearthat conducting steady state experiments at the conditions

50 CHAPTER3
given in Table 3.2, the values of the individual parameters cannot be estimated. lnformation about a lumped parameter, consisting of the ratio of the adsorption coefficient of B2 and the equilibrium constant K1 of A, can be extracted only from the measured data.
In the next two sections the gain and the phase shift for bath the CSTR and the plug flow reactor are calculated numerically, since analytica! solutions cannot be obtained. In section 3.4.4 a parameter sensitivity analysis is conducted to show which reactor is most suited for the determination of kierminstion of kinatic parameters when applying a frequency response analysis.
3.4.2 Three-step mechanism in a CSTR
The model of the CSTR consistor the components in the gas phase and the species on the catalyst surface. The continuity equations for the species on the catalyst surface are given in section 3.4.1, while for components A, 82 and C in the gas phase they are given by:
dCc
dt
The initia! conditions are given by the steady state solution:
Ci(O) = Ct11
, i "' A, B2, C
9i(O) = 9~, j A, B, C
(3.23)
(3.24)
(3.25)
(3.26)
Equations'3.19 to 3.21 and 3.23 to 3.25 have to be linearized around the steady state in order to allow the application of the frequency response method. The steady state is calculated by setting the accumulations terms to zero and solving the set of

FREQUENCY RESPONSE ANAL YSIS AIMED AT DETERMINA TION OF KINETIC PARAMETERS 51
algebraic equations numerically using a modified Newton-Raphson algorithm, implemented in NAG routine C05NBF (NAG, 1995). The expressionsof the linearized equations and the methods used to solve them are given in appendix 36. The results of the calculations using the parameters given in Table 3.2 when the concentratien of A at the in let is oscillating only will be discussed first. Next the gain and the phase shift wiJl be presented when B2 is oscillating only. Since the model is linearized, the superposition principle holds and the results may be added to describe the behaviour when the inlet concentrations of A and B2 are oscillating simultaneously.
Oscillating the inlet concentration of A only
In Figure 3.5 the gain of the gas phase concentrations is shown when CA is used as input. The oscillation of the gas phase concentrations of both 6 2 and C is a result of the oscillating surface reaction rate. The dynamic regime starts at 0.1 Hz and ends at 2 Hz meaning that for the determination of the parameters applying frequencies as high as 2 Hz is sufficient. Due to mixing in the gas phase only the sliding regime would start at 1 0 Hz since the residence time can then be considered as the characteristic response time of the reactor. Clearly the catalyst surface plays an important role in the dynamics of the reactor since the sliding regime is already entered at 2 Hz. lt should be noticed that the bandwidth not only depends on the kinetic parameters but also on T R and CNM· Hence, these parameters should be selected proparty in order to avoid mixing in the gas
2.50.--------------,
2.00
.J.. 1.50
.5 <G ' Cl 1.00 '
Figure3.5
4
frequency /Hz
6 a
The galn of the outlet concentrations of the CSTR versus the frequency. Parameters: Tab/e 3.2; input = A; output: (-) =A; (· .. ) = 82; (--) = C.
4.------------
~ 2 ·. c -.. iE 'i ol------'--:----------1
J Q. ·2
~OL-~~2-~~4-~~6-~~8
frequency /Hz
Flgure3.6 The phase shift of the outlet concentrat/ons of the CSTR versus the frequency. Parameters: Table 3.2; input= A; output: (-) =A; ( .. ) = 82; (--)
=C.

52 CHAPTER3
phase becoming the slowest mechanism and therefore the main detertnining factor for the dynamic behaviour. This means that TR should be small compared to the characteristic response time of the occurring reaction and CNM should be large compared to the time average outlet concentratien of A.
In the quasi·steady regime, the system can be considered as being in steady state and consequently the ratio of~ and K/ can be determined only (see Equation 3.22). In the sliding regime the small amplitude of A leads to almost time independent adsorbed species and consequently constant concentrations of C and B2• Although the kinatic parameters shown in Table 3.2 suggest a much higherfrequency~eeded toenter the sliding regime, such a high frequency is not necessary because of the properly selected values of T R and CNM·
As shown in Figure 3.6, B2 oscillates at low frequencies in phase with A whereas the phase shift of C starts at n. This is caused by the out·of·phase oscillation of the surface reaction due to negative order of the overall rate in the concentratien of A, see Equation 3.22. Higher concentrations of A lead to lower reaction rates and consequently higher concentrations of B2 and lower concentrations of C. In the dynamic regime, above 0.5 Hz, the phase shift of A bacomes independent of the frequency, whéreas the phase lead of C tums into a phase lag tor frequencies above 3 Hz. At even higher frequencies, transition from the dynamic to the sliding regime occurs and the phase shift of all concentrations bacomes negative with respect to the inlet concentration. The limit values of the phase shift amount to n tor both B2 and C, and to ·n/2 forA. The behaviour of the phase shift phase is not only determined by mixing in the gas phase but also by the reaction kinetics, as in case of mixing in the gas being the main dynamic process the dependency of the frequency would be similar tor all three components.
Oscillating the jnlet concentratien of B2on!y
The results when the inlet concentratien of B2 is oscillating only, are shown in Figures 3.7 and 3.8. Compared to the previously discussed situation, i.e. oscillating the input concentratien of A only, the frequency dependenee of the gain of B2, see Figure 3.7, differs from that of A, see Figure 3.5. The gain of B2 exhibits resonance at 0.5 Hz whereas the gain of A decreasas monotonously. Apparently the irreversible dissociative adsorption of B2 leads to this behaviour. The broader bandwidth of B2 can be explained assuming less interaction between the gas phase and the catalyst surface (see parameters in Table 3.2). For frequencies above 4 Hz, the amplitudes of both A and C approach zero meaning that the adsorbed species oscillate with a very small amplitude. As there is no time dependent interaction with the surface anymore mixing in the gas phase bacomes the most important dynamic mechanism and, hence, no kinatic information is available at the outlet.

FREQUENCY RESPONSE ANAL YSIS AIMED AT DETERMINATION OF KINET/C PARAMETERS 53
The oscillation of A is initially out-of-phase with respect to the in let, as shown in Figure 3.8, while the gas phase concentration of C is always behind in phase. In the quasi-steady state regime the in-phase oscillation of the reaction rata leads to an out-ofphase oscillation of A and an in·phase oscillation of C. The phase shift of 8 2 starts at zero and increases very rapidly as a tunetion of the frequency. Aftar passing the maximum, the effects of mixing in the gas on the dynamic behaviour bacomes more important and the phase lead tums into phase lag.
2.50,--------------,
2.00
..:... 1.50 c: .iii Cl 1.00
Flgure3.7
2 4
frequency /Hz
The gain of the outlet concentrat/ons of the CSTR versus the frequency. Parameters: Table 3.2; input = 82;
output: (-)=A; (···) = 82; (--) = C.
4,---------------------,
"0 2 ~
i oPk...-.::-'~---------.. j Q. ·2
4o·L-~~2-~~4-~~6~~~a
frequency /Hz
Flgure3.8 The phase shift of the outlet concentrations of the CSTR versus the frequency. Parameters: Table 3.2; input= 8~ output:(-)= A;(···)= 82;
(-·) = c
3.4.3 Three-step mechanism In a plug flow reactor
The model for the plug flow reactor consists of continuity equations for the species on the catalyst surface, which are the sameasin the example of the CSTR Equations 3.19 to 3.21, and continuity equations for the components in the gas phase given by:
acA acA 1 at = -v ax - cNM\k1CAe. k_18A) (3.27)
(3.28)

54 CHAPTER3
(3.29)
The initial conditions are now given by the steady state profiles:
C1(x,O) C155(x}, i A, 82, C
8i(x,O} = 8~(x), j = A, 8, C (3.30}
They are calculated setting the accumulation terms to zero and solving the coupled set of ordinary differential and algebraic equations numerically using NAG routine D02NHF (NAG, 1995). The boundary conditions are given by the inlet concentrations:
(3.31}
After linearization of the model equations they are transferred to the frequency domain. Due to the complexity of the equations, the gain and the phase shift are determined numerically. The linearization process itself and the numerical methods applied to calculate the gain and the phase shift are described in more detail in appendix 38.
Oscillating the inlet concentration of A only
In Figures 3.9 and 3.10, the gain and the phase shift are shown respectively, when the inlet concentration of A is asciilating only. The behaviour depicted in Figure 3.9 is in line with the results of the CSTR. The asciilation of both 82 and C is a result of theoscillating reaction rate due to the time dependent surface coverages. Compared to the CSTR, Figure 3.5, the bandwidth of the system is larger as the dynamic behaviour is determined by the kinetics only. Although there is no mixing in the gas phase, the amplitude of A becomes very small in the sliding regime.
Figure 3.10 shows that the phase shift of C initially amounts to TT,.but decreases rapidly as a tunetion of the frequency. This phase lead is caused by a global reaction rate being proportional to the reciprocal of the concernration of A, as already mentioned in section 3.4.2. The frequency dependenee of the phase shift of A is not only a result of the residence time but also of the interaction between the gas phase and the catalyst surface. The frequency dependenee of the phase shift of both 82 and C differs trom that of A and contains kinatic information since it is not proportional to the frequency.

FREQUENCY RESPONSE ANAL YSIS AIMED AT DETERMINATION OF KINETIC PARAMETERS 55
2.50;-------------,
2.00
6 8
frequency /Hz
Flgure 3.9 Gain of the outlet concentrat/ons of the plug flow reactor versus frequency. Parameters: Table 3.2; input: A; output:(-)= A;(· .. )= 82;
(--) = c.
Oscillating the jnlet concentration of ~
4r--------------~
frequency /Hz
Flgure3.10 Phase shtn of the outlet concentrations of the plug flow reactor versus frequency. Parameters: Table 3.2; input: A; output: (-)=A; (···) = 82; (--) = C.
As shown in Figure 3.11 , the amplitude of 82 increases during the transition trom
the quasi-steady regime to the dynamic regime and remains constant for frequencies above 4 Hz. lnitially the behaviour is similar to the behaviour of the CSTR, see Figure
3.7, but the amplitude does oot decrease tor higher frequencies due to the absence of
the mixing in the gas phase. The behaviour of the gain of both A and C as a tunetion of the frequency is more pronounced and contains more information about the reaction
mechanism than that of 8 2•
In Figure 3.12 the phase shift is depicted as a tunetion of the frequency. A
oscillates out-off-phase with respect to both 82 and C in the quasi-steady state regime. The frequency dependenee of the phase shift of 8 2 is almost completely determined by the residence time and contains hardly kinetic information. Above 6 Hz the phase shift
of all components is a result of the gas flow through the reactor only. The fast
decreasing phase shift of A before entering the sliding regime is mainly caused by the interaction between the gas phase and the catalyst surface.

56 CHAPTER3
2.50,------------,
2.00
~ 1.50 .5 111 Cl 1.00
- c 4 6 8
frequency /Hz
Flgure3.11 Galn of the outlet concentrat/ons of the plug flow reactor versus fréquency. Parameters: Table 3.2; input: B2; output:(-)= A;(···)= B2;
(--) = c
3.4.4 Parameter sensltlvlty analysls
4.-----------~
2 8
frequency !Hz
Flgure3.12 Phase shift of the outlet concentrat/ons of the plug flow reactor vs frequency. Parameters: Table 3.2; input: B2; output: (-) =A; (···) = B~ (-) = C
When applying a frequency response analysis, the kinetic parameters are estimated by regression of the measured gain and phase shift with the corresponding mathematica! expressions. Todetermine the accessibility of the parameters. the values of the kinatic parameter given in Table 3.2 are increased 1 0%. k1 and k.1 are changed simultaneously, hence keeping a constant sorption coefficient, whereas the other parameters are changed one at the time. The frequency response equations are solved using these new parameters and the deviation from the gain and the phase shift of bath the CSTR and the plug flow reactor are compared as a function of the frequency. The changes are defined by the difference of the gain and phase shift calculated with the parameters given in Table 3.2 and the gain and phase shift calculated with the adapted parameters.
The process considered in the examples is a MIMO system since there are two input variables and three output variables, and therefore the dynamic behaviour is described by six transfer functions. Th is implies that the parameters can be determined by regression of six measured gains and six measured phase shifts with the corresponding expressions. Hence, another purpose of the parameter sensitivity analysis is to show which of these expressions reveal most information about the parameters. The figures shown in this section depiet a selection of all possible gains and

FREQUENCY RESPONSE ANAL YSIS AIMED AT DETERMINATION OF KINET/C PARAMETERS 57
phase shifts. The selection criterion was that all parameters must be accessible, î.e. the
gain and the phase shift must be affected by the parameters significantly and the effects of the individual parameter changes must not cancel out when all parameters are varied simultaneously. For small adaptations of the kinatic parameters, the gain and phase are affected linearly and the superposition principle holds. Therefore, the effects as a rasuit of changing all parameters simultaneously are the summation off the effects when one parameter only is changed. The deviations of the gain and the phase shift are calculated tor increasing parameter values only, since decreasing the parameters leads to the
opposite effects.
1.10.-------------------
0.05
i 0.00 i'=._""'---,..----------=.·....:.·....:.·....:.·_::.-:_:·:_;_;;.._,
"" " <l
.0.05 - 1<,=1100, k.,=11 •
i - - ~=110 1 ---- 1<"=11
.0.10 l' ~--'-~____:::;:::=:::::::c:=::;:::::::J 0 2 4 6 8
frequency IHz
Flgure3.13 Devlatlon of the gain of the outlet concentrat/ons of the CSTR versus the frequency due toa 10% increase of the parameters glven In Table 3.2. Input ." A; output = A. Parameter variation: (-) = k 1, k.1; (···) = k2; (--) = ks-
0.10.--------------,
0.05
k,=1100, k_,=11
~=110
1<"=11 .0.10 ~t:._~--'--~-========:::'c
0 2 4 6 8
frequency IHz
Flgure3.14 Devlation of the galn of the outlet concentrat/ons of the plug flow reactor versus the frequency due to a 10% lncrease of the parameters given In Table 3.2. Input= A; output= A. Parameter variation: (-) = k1, k.1;
(···) = k2; (·-) = k3.
As shown in Figure 3.13, the gain of the CSTR is strongly dependent on the value of ~. However, the gain is rather independent of the value of the sorption equilibrium coefficient k/k1, meaning that adsorption of A is almost in equilibrium with the gas phase, and independent of the value of k3• This is confirmed by calculations performed with different values of k/k1 showing that the gain is affected by the individual parameter
variations. The other gains are all less affected by the parameter variations and therefore it is not necessary to include them in the regression. This is also an indication that the outlet variables are coupled meaning that the gains are dependent on each other.
The amplitude at the outlet of the plug flow reactor depends more strongly on the kinatic parameters, as depicted in Figure 3.14. The accessibility of the parameters in the

58 0HAPTER3
quasi-steady state regime Is camparabie wlth the CSTR, but during dynamlc oparation the benefits of the plug flow reactor become clear. In the quasi·steady state regime parameter k2 can be estlmated while at a frequency of 1 Hz much information about k3
is available at the outlet of the reactor. In contrast to the CSTR the value of k1 and k_1
can be estimated separately and almost the complete frequency range Is usabie. Figure 3.14 is a good example of the benefits of perfonnlng dynamlc experiments over a broad range of frequencies. As a function of the applied frequency, the contribution of one distinct parameter to the dynamic behaviour becomes more importanUhan that of the other parameters. Therefore the effects do notcancel out and all parameterscan be estimated.
o.sor---~---r======ïl - k,=1100, k.,=11 - . ~=110
0.40
1 - 0.30 ---- ~=11
~ 91 0.20 • .. [· 'á 0.10! . <I c •
.o.oo r-:-r··-... : .. ~_'-'_·--=--:.,~---_-_ -. -_ -_ -_ -_ ----___ -' __ ,_,
.().!Oo 2 4 6
frequency /Hz
Figure3.15 Devlatlon of ths phase shift of ths outlet concentratlons of the CSTR versus ths frequency due to a 10% lncrease of the parameters glven In Table 3.2. Input = 82; output = A. Parameter variation: (-) = k,, k.,; (···) = k2; (--) = k3.
frequenoy /Hz
Flgure3.16 Devlatlon of the phase shift of the outlet concentrat/ons of the plug flow reactor versus the frequency due to a 10% lncrease of the paremeters glven In Tsble 3.2. Input= B~ output= A. Parameter variat/on: (-) = k,, k_,; ("') = k2; (-·) :,k3.
The davlation of the phase shift between B2 and A due to the varlation of the parameters is shown in Figure 3.15. Notlee that the input and output are different from those in Figures 3.13 and 3.14. In the quasi-steady state regime the dependency of k2
on the phase shift Is very distinct. The oontribution of k3 to the phase 'shift bacomes significant at a frequency of about 2 Hz. By modifying the values of both k1 and k.1
simultaneously the phase shift is not changed. The trends depicted In thls tigure are in line with the ones shown in Figure 3.13.
Compared to the results of the CSTR, the phase shift of the plug flow reactor raveals much more kinatic information, as shown In Figure 3.16. The effects of the indMdual parameter variations do not cancel out and the values of all parameters can

FREQUENCY RESPONSE ANAL YSIS AIMED AT DETERMINATION OF KINETIC PARAMETERS 59
be estimated.
3.5 Conclusions
In this chapter the application of the frequency response analysis for the determination of kinetic parameters has been studied. Two examples in bath a CSTR and a plug flow reactor have been used to demonstrata the benefits of dynamic reactor oparation compared to steady state oparation when estimating kinetic parameters. The results of the two reactor types are compared to each other using a parameter sensitivity analysis. The examples showed that a frequency response analysis is applicable in the determination of kinetic parameters in continuous flow reactors. The analysis also showed that a plug flow reactor is more suitable for the estimation of the parameters due to the absence of mixing in the gas phase.
The examples, taking into account adsorption and desorption only, show that in the CSTR the sorption equilibrium coefficient can be estimated only, while in the plug flow reactor the parameter values of adsorption and desorption rate are accessible.
Application of the frequency response analysis to a reaction mechanism taking into account adsorption, desorption and surface shows that the same kinetic information is available at the outlet of the CSTA as during steady state reactor operation. The parameter of the rate determining step and the equilibrium constant can be estimated only. When the reaction is studied in a plug flow reactor, all parameters can be estimated. Bath the gain and the phase shift contain detailed information about the kinetic parameters.
lt is also beneficia! to apply the frequency response methad in case of reactions with a different behaviour. In order to determine the optima! experimental conditions a parameter sensitivity analysis has to be performed for all separate cases. However, the dynamics of the CSTR will always be determined by bath mixing in the gas phase and the kinatics of the reaction to be studied and, hence, a plug flow reactor is preferably used in estimating kinatic parameters.
Reierences
- Bailey, J.E., Periadie phenomena, in: Chemica! reactor theory: a review, by Lapidus, Land Amundson, N.A., Prentice-Hall, Englewood Cliffs, New York, 758-813,
1971 - Jordi, A.G., Do, O.G., Analysis of the frequency response methad for sorption kinatics
in bidispersed structured sorbents, Chem.Eng.Sci., 48, 1103-1130, 1993 - Jordi, A.G., Do, O.G., Analysis of the frequency response methad applied to non-

60 CHAPTE.R3
isothermal sorption studies, Chem.Eng.Sci., 49, 957-979, 1994
-Kramers, H., Alberda, G., Frequency response analysis of continuous flow systems, Chem.Eng.Sci., 2173-181, 1953
- Li, Y-E, Willcox, 0., Gonzalez, R.D., Determination of rate constants by the frequency response method: CO on Pt/Si02, A/ChE, 35, 423-428, 1989
-Lynch, D.T., Walters, N.P., frequency response characterization of re'action systems: extemal recycle reactor with a solid adsorbent, Chem.Eng.Sci., 45, 1089-1096, 1990
- Madix, R.J., Schwarz, J.A., Chemica! relaxation molecular beam stu.dies of reactive gas-solid scattering: I. reaction of silicon and germanium with mo'lecular chlorine, Surf.Sci., 24, 264-287, 1971a
- Madix, R.J., Parks, R., Susu, AA., Schwarz, J.A." Chemica! relaxation molecular beam studies of reactive gas-solid scattering: 11. reaction of ozone with heated
germanium surfaces, Surf.Sci., 24, 288-301, 1971 b - Marcelin, G., Lester, J.E., Mitchell, S.F., Frequency response study'of the effect of
alkali promotion on Rh/Ti02 catalysts: evidence for kinetically distinct H2-sorbing sites, J.Catal., 102, 240-248, 1986
- Matros, Y.S., Catalytic processas under unsteady-state conditions, Studies in surface science and catalysis, 43, Elsevier, Amsterdam, 1989
- NAG Fortran Library Manual, mark 16, volume 1 , 1995 - Naphtali, L., Polinski, L., Dynamic methods tor characterization of adsorption
properties of solid catalysts, Adv.Cata/., 19, 241-291, 1969 • Renken, A., Unsteady state operation of continuous reactors, lnt.Chem.Eng., 24, 202-
213, 1984 - Schrieffer, J.R., Sinfelt, J.H., Frequency response analysis of surface reactions in flow
systems, J.Phys.Chem., 94, 1047-1050, 1990 • Schwarz, J.A., Madix, review paper: Modulated beam relaxation spectrometry: its
application to the study of heterogeneaus kinetics, Surf.Sci., 46, 317-341, 1974 - Schwartz, J.P., Sawin, H.H., Hatton, A.T., Frequency response analy~is of
nonsuperimposable systems using a pseudo-transferfunction: application to systems with coverage-dependent adsorption, Chem.Eng.Sci., 41 ,495-51 0, 1986
- Sun, L.M., Bourdin, V., Maasurement of intracrystalline ditfusion by the frequency response method: analysis and interpretation of bimodal response curves,
Chem.Eng.Sci., 48, 3783-3793, 1993 - Sun, L.M., Meunier, F., Grenier, Ph., Ruthven, O.M., Frequency response for
nonisothermal adsorption in biporous pellets, Chem.Eng.Sci., 49, 373·381, 1994 - Yasuda, Y., Saeki, M., Kinetic details of a gas-surface system by the frequency
response method, J.Phys.Chem., 82,74-80, 1978 - Yasuda, Y., Determination of vapor ditfusion coefficients in zeolite bythe frequency
response method, J.Phys.Chem., 86, 1913-1917, 1982

FREQUENCY RESPONSE ANALYSIS AIMED AT DETERMINAT/ON OF KINETIC PARAMETERS 61
- Yasuda, Y., A frequency response technique to study zeolitic ditfusion of gases, J.Catal., 88, 530-534, 1984
- Yasuda, Y., Yamamoto, A., Zeolitic diffusivities of hydrocarbons by the frequency response method, J. Ca tal., 93, 176-1 81, 1985
- Yasuda, Y, Suzuki, Y., Fukada, H., Kinatic details of a gas/porous adsorbent system by the frequency response method, J.Phys.Chem., 95, 2486-2492, 1991
- Yasuda, Y., Frequency response method for investigation of gas/surface dynamic
phenomena, Heter.Chem.Rev., 1, 103-134, 1994

62 CHAPTER3
APPENDIX3A
Derivation of the frequency response equations for adsorption and desorption in continuous flow reactors
Freguency response eguations for the CSTR
The continuity equation for component A in the gas phase is given by:
(3A.1)
and the for species A" on the catalyst surface by:
(3A.2)
where the balance of the activa sites is given by:
1 aA + a. (3A.3)
The steady state surface coverage is calculated by setting the accumulation term of Equation 3A.2 to zero and eliminating a. using Equation 3A.3:
(3A.4)
The expresslons are linearized around the steady state using:
CA(t) = cAss + ACA(t), eA(t) = a~ + AaA(t) (3A.5)
Aftar substitution of the expresslons given in Equation 3A.5 into Equations 3A.1 to 3A.3 and using Equations 3A.4 to eliminate a"" the following differentlal equations are obtained:

FREQUENCY RESPONSE ANAL YSIS AIMED AT DETERMINA TION OF KINETIC PARAMETERS 63
..!.(c:s,in - CAss) CNJk1C:sa:s k_1e~) + TR
..!.(Ac~" - AcA) - cN~k1(AcAe:S - cAssAeA) k'_1AeA] + TR
(3A.6)
cNMk1ACAAeA
k 1~CAe:s - cAssAeA) k_1A9A -(3A.7)
k1ACAA9A
The first part of the right hand sites of Equations 3A.6 and 3A.7 is the steady state expression and equals zero. After some rearrangements the following set of linear differential equations is obtained:
1 c cNM e o 2 -A A + --A A + (A ) T2 T1
(3A.8)
(3A.9)
where T1 and T2 are given by:
1 (3A.10)
Application of the Laplace operator results in a set algebraic equations for both · the gas phase and the catalyst surface which are solved with respect to the Laplace transforrn of ACA and AeA. After transformation to the frequency domain using s =iw, where i= -1(-1), the following expressions forthe gain and the phase shift are obtained:

64
1 IH(w)l = -TR
CHAPTER3
Freguency response equations for the PFR
(3A.12)
The continuity equations for component A in the gas phase and species on the catalyst surface are given by:
acA acA 1 ) - = -v- - cNMI.k1CAe. - k_,eA at ax
where the expression for 9. is be obtained from Equation 3A.3. The expressions are linearized around the steady state using:
CA(x,t) = c:s + .àCA(x,t), 9A(x,t) e!s + .à9A(x,t)
(3A.13)
(3A.14)
(3A.15)
After substitution of the expressions given in Equation 3A.15 into the continuity equations and elimination of second terms in .à the frequency response equations are given by:
a.àCA =
at (3A.16)
(3A.17)

FREQUENCY RESPONSE ANAL YSIS AlMEED AT DETERMINATION OF KINETIC PARAMETERS 65
where T1 is given by Equation 3A.1 0. The differential Equations 3A.16 and 3A.17 are transformed to the Laplace
domain and e.ss and A8A are eliminated from Equations 3A.16. The resulting ordinary differential equation is solved and expressions for the gain and the phase shift are derived by the transformation to the frequency domain.

66 CHAPTER3
APPENDIX3B
Derivation of the frequency response equations for the three-step mechanism in continuous flow reactors
The model consists of balances for the components in the gas phase and the catalyst surface. The continuity equations of components A, 82 and C in the gas phase are:
dCA
dt
(38.1)
(38.2)
(38.3)
The surface coverages are calculated solving the balances of the species on the catalyst surface given by:
aeA - = k1CA9• k_19A - i<a9A9B at
(38.4)
(38.5)

FREOUENCY RESPONSE ANAL YSIS AIMED AT DETERMINATION OF KINETIC PARAMETERS 67
where e. is defined by:
e. = 1 - eA - e8 (38.6)
The equations are linearized around the steady state and transforrned to the Laptace domain and the resulting set of algebraic equations as a tunetion of the Laptace operator s are solved with respect to the depend variables using Maple V1
• The transformation to the frequency domain as well as the derivation of the expressions for the gain and the phase shift is also perforrned by Maple V. These expressions are not presented since they are too complicated without giving more insight in the dynamic behaviour of the reactor.
Plug flow reactor
The model consists of balances tor the catalyst surface, which are the same as in the example of the CSTR Equations 38.4 and 38.5 and continuity equations for the gas phase, given by:
acA acA 1 - = -v- - cNM\k1CAe. - k_19A) at ax (38.7)
(38.8)
(38.9)
The same approach as in the case of CSTR is used to solved the equations. After transformation to the frequency domain, the ordinary differential equations which describe the dynamic behaviour of the plug flow reactor are solved numerically. The differential equations are split into a real partand an imaginary part using Maple V. After that, the real and imaginary parts of the gas phase balances are solved simultaneousfy by the application of a variabie order, variabie step size backward differential formulae (BDF), implemented in NAG-routine D02E8F (NAG, 1995). After integration of the equations, the gain and the phase shift of the gas phase components are calculated.
1 Maple V is computer algebra software which derives analytica! solutions of mathematica! expressions.

68 CHAPTER3

4 TRANSIENT KINETICS OF THE CO OXIDATION
OVER Ptly-AI20 3
4.1 Introduetion
The oxidation of CO by oxygen over noble metal catalysts has been the subject of several surface science and kinetic studies during the last decades. lts importsnee in the automobile exhaust gas control and especially the time-average rate enhancements during periadie operatien resulted in publications of a more practical approach for this reaction (Silveston, 1995). Furthermore, the great variety in the observed phenomena èaused by the nonlinear behaviour, such as hysteresis associated with steady state multiplicity and autonorneus oscillations (Razon and Schmitz, 1986) has drawn the attention of many researchers from a more fundamental point of view.
Most of the steady state studies have been conducted at ultra-high vacuum conditions, but the CO oxidation by oxygen over supported catalysts at atmospheric pressure was found to praeeed essentially via the same elementary steps as over single crystals under low pressure (Engeland Ertl, 1979; Boudart and Rumpf 1987; Oh et al., 1986). Hence, kinetic parameters obtained from ultra-high vacuum studies may be used as initia! parameters estimates when rnadelling the experimental data at atmospheric pressure.
Above 100 K the CO chemisorption is assumed to praeeed molecularly via a precursor state (Compton, 1991). Oxygen adsorption was found to praeeed dissociatively at temperatures above 100 K (Engeland Ertl, 1979; Luntz et al., 1989). Taking into account molecular oxygen adsorption foliowed by an instantaneous

70 CHAPTER4
dissociation (Boudart and Djéga-Mariadassou, 1984) in an elementary step mechanism has proven to be useful in rnadelling the CO oxidation over platinum catalysts (Oh et a/., 1986; Campman, 1996). Significant desorption of oxygen has notbeen observed at temperatures below 700 K (Engeland Ertl, 1979; Luntz et al., 1989).
The C02 formation is assumed to praeeed either via a Langmuir-Hinshelwood mechanism or via an Eley-Rideal mechanism between oxygen adatoms and gas phase CO or gas phase oxygen and chemisorbed CO. Although most literature befare 1970 explained the observations by the Eley-Rideal mechanism, more recently the LangmuirHinshelwood mechanism is favoured. Several investigators used both reaction paths to C02 to explain the experimentally found behaviour. Above 450 K, it was found that the observed reaction rate decreasas much less with increasing teiTJperature than expected on basis of the Langmuir-Hinshelwood mechanism only (Engeland Ertl, 1979). The Eley-Rideal step is aften used to describethis behaviour. In explaining the results of transient experiments the Eley-Rideal step is introduced to describe the CO and C02 response after switching the feed from oxygen to CO (Harold and Garske, 1991a). Exposure of an oxygen covered surface to gaseaus CO causes a very fast formation of C02, whereas this is not the case if oxygen in the gas phase is exposed to chemisorbed CO. This phenomenon can be explained assuming the C02 formation proceeds via both the Langmuir-Hinshelwood and the Eley-Rideal mechanism.
One of the goals of the transient studies conducted is the investigation of the rate enhancement during dynamic oparation compared to steady state operation. Cutlip (1979) was among the first who showed that cyclic feeding of CO and oxygen increases the time-average performance of the reactor. Reaction rates up to 40 times higher than the maximum achievable steady state rates were measured by Zhou et al. (1984). The explanation of the observed phenomena varies from periodically oomparabie values of the surface coverages of CO and oxygen (Cutlip, 1979; Cho and West, 1986) to the formation of islands (Zhou et al., 1984; Barshad and Gulari, 1985a) an<;l the reduction of oxides (Zhou and Gulari, 1986). Barshad et al. (1985) assumed that the rate enhancement during cyclic feeding of CO is caused by surface species which are not present at steady state operation. A general conclusion of these studies 1is that the rate enhancement is strongly dependent on the conditlans such as temperature, frequency, duty fraction and the amplitude of the oscillation.
Transient studies in combination with Fourier-Transform Intrared Transmission Spectroscopy (Barshad et al., 1985; Barshad and Gulari, 1985b; Li et al., 1987; Prairie et al., 1988; Sant and Wolf, 1990) are aften used to clarify reaction mechanisms, since they provide much more information about the reaction mechanism than steady state experiments (Bailey, 19n; Matras, 1989).
Modelling studies of dynamic experiments are rather scarce. Cutlip et al. (1982) and Racine and Herz (1992) used the classica! three-step kinetic model based on steady state experiments to describe transient experiments. The reaction mechanism

TRANS/ENT KINE.TICS OF THE CO OXIDATION OVER Ptly·AI:Pa
of this classica! kinetic model is given by:
k,
CO + • .. CO>~< k_,
~ 02 + 2>~< ~ 20*
ka co* + o* ~ co2 + 2 *
71
One of their conclusions was that the three-step mechanism could not describe both
steady state and dynamic behaviour. To model the CO oxidation under dynamic
conditions, Racine and Herz (1992) introduced site heterogeneity, while Graham (1993)
and Sadhankar and Graham (1994) used a CO exclusion model, i.e. they assumed that
the maximum value of the CO surface coverage is less than unity, in combination with
surface reconstruction to describe the measured responses. Lynch and Graham (1990)
showed that C02 in the gas phase adsorbs significantly on the catalyst y-AI20 3 support. This interaction has to be accounted for in rnadelling dynamic experiments.
The purpose of this study is to model the CO oxidation with cycling of the feed.
The conditions are corresponding to exhaust gas conversion befare the light off, i.e. at
a relatively low temperature. The experimental data is used to develop a kinetic model
which can describe the measured responses and to estimate the kinetic parameters by means of nonlinear regression analysis (Froment and Hosten, 1981 ).
4.2 Model equations and data analysis
4.2.1 Reactor modelllng
The total molar flow rate can be assumed to be constant through the bed because of the high dilution of the flow with inert gas. Dynamic experiments conducted
with argon showed that the time-scale of mixing in the gas phase is much smaller than the period of the applied asciilation and can therefore be neglected. Furtherrnore the
experimental conditions were chosen to allow the maasurement of intrinsic kinatics and the reactor to be considered as isotherrnal. The fixed bed micro-reactor is, therefore,
modelled as an isotherrnal plug flow reactor. The model consists of continuity equations
forthe components CO, 0 2 and C02 in the gas phase, forthe species on the catalyst
surface and for C02 adsorbed on the support. For gas phase component i, the
continuity equation is expressed as:

72 CHAPTER4
(4.1)
where T is defined by F;Ar/F101• F101 is the total molar flow rate, en the bed porosity and
AR the cross sectionat surface area. Ck is the ratio of the surface capacity and the capacity of the gas phase in moVmg3
, given by:
Ck = Lkpc{1-sb) , k = NM or s sb + (1 -E:JsP
{4.2}
where the parameters are given in Tables 2.1 and 4.1. The continuity equations for both
the catalyst surface and the support consist of balances for surface species j and I respectively, and are expressed as:
aa~,t) = Rî{x,t) , Bl,.~,t) = R1{x,t) (4.3)
The balances for the active sites are given by:
1 = E ai<x.t>. 1 = E l..<x.t> (4.4) i I
The boundary condition of Equation 4.1 depends on time and is given by the inlet concent ration:
(4.5)
The measured inlet concentrations during the experiment are used as inlet
concentrations in the modelling. Using the measured inlet concentrations prevents the calculations trom being not comparable with the experimental responses due to the use
of different shape of the forcing functions in both the simulations and the experiments. The initial conditions of the differential equations are given by the steady state
solution. For the gas phase concentrations these are:
(4.6)
And tor the surface coverages:
(4.7)

TRANS/ENT KINET/CS OF THE CO OX/DATION OVER Pflv-A/20 3 73
The production rates R1,k, ~ and At are expressed as a linear combination of the rates of the individual steps of the reaction mechanism and depend on the kinetic parameters which have to be estimated. The reactor parameters are given in Table 4.1.
The model equations are solved Table 4•1 using a first order upwind scheme to Reactor parameters
~--~~--------------------~ discretize the spatlal derivatives, since there is conveetien only (Schiesser, 1993). Applying the upwind schema to the partial differentlal equations results in set of ordinary differentlal equations. This set of equations is integrated in time using a variabie orderand variabie step Backward Differentiation Formulae (BOF) method, implemented in NAG routine D02NCF (NAG, 1995). The initia! conditions given by Equations 4.6 and 4. 7 are determined by setting the accumulation terms of Equations 4.1 and 4.3 to zero and solving the coupled set of ordinary differentlal equations and algebraic equations by means of
~M1)
/m3 m-a g A
/mol kg-10
/mol kg·\
/mol m·3 g
Cs /mol m-39
1) LNM = FEw MNM
1.3 10-4
0.3
9.8 10'3
0.27
11.0
302
2) L. = La., L = 1.2 10-e mol m·2,
[Lynch and Graham, 1990].
NAG routine D02NHF (NAG, 1995). The model equations are solved on a Silicon Graphics Power Challenge. Typical CPU time to integrate over a period of 1 0 seconds is about 25 seconds.
4.2.2 Estlmatlon of kinetlc parameters
The method of least squares is used to estimate the parameters of the kinatic model. Since the model is nonlinear in its parameters p, the solution is found iteratively using a Marquardt-Levenberg method implemented in Odrpack (1992). The multiresponse explicit ordinary least square problem is defined by:
1, ... ,n (4.8)
where n is the number of observations per response, y1 a vector with the q observed responses which are modelled by f1• x1 is a vector with the m independent variables, e; the errors associated with y1 and b the approximated parameters p. The parameters are estimated trom the minimization of the multiresponse objective criterion:

74 CHAPTER4
0
S(P} = L (f1(x1; P> 1=1
(4.9)
Overall, the weights W~:~ are used to eliminate observations and to compensate for unequal variances or correlations in the variabie y1•
In the regression applied the observed responses are the outlet concentrations, while the independent variables are the inlet concentrations. For the weights the elements of the inverse error covariance matrix are taken. The elements of this matrix are calculated by the regression routine following a first regression with a unity error covariance matrix. To reduce the correlation between the activation energy and the preexponential factor reparametrisation of the Arrhenius equation is performed (Kitrell, 1970):
.§.(.!. __ 1 ) + PBcoJ R T Tavg AT
(4.10)
where:
A#= AexJ E ) ,..l RTavg (4.11)
and T avg the average tempersture amounting to 403 K. The surface coverage dependenee of the activation energy accounts for the interaction of adsorbed CO molecules and will be explained in more detail in sections 4.4.1 and 4.5. The varianee of the original parameters is determined according to:
exn( ~) var( A#) + · ( ~) \ar(E) ,..l AT avg RT avo
+ 2~exp( _E_) cov(A #,E) RTavg RTavg
var( A)
(4.12)
The parameter estimates were tested for significanee by means of their approximate individual t-values. These t-values are used to determine the 1-a contidance interval according to:
(4.13)
Using equation 4.12 and 4.13 the t-values and the 95% confidence intervals of the

TRANSJENT KINET/CS OF THE CO OXIDATION OVER Ptly-A/20 3 75
original parameters can be constructed. As mentioned before the outlet concentrations of CO, 0 2 and C02 are used as
responses in the regression analysis. The experiments performed at a frequency of 0.1 Hz are used in the regression only as higher frequencies eventually lead to axial temperature profiles in the reactor. Final estimates are obtained trom regression of data acquired at tour temperatures, see Table 4.2. The outlet concentrations at 400 points in time have been used in the regression. The initial values of the parameters are chosen within the range of realistic values summarized in Table 4.4. With good starting values it takesabout 14 iterations to reach the final estimates. During the regression of the data the model equations are integrated about 850 times over a period of 1 0 s which takes about six hours of CPU time on a Silicon Graphics Power Challenge.
4.3 Experimental results
4.3.1 Experlmental condltions
Before the experiments are carried out the catalyst is pre-treated as described in section 2.4.1. After keeping the catalyst under He ovemight, the initia! activity is higher. Therefore, before starting the cyclic feeding experiment, the steady state activity the catalyst was foliowed in time and compared with the activity of the day before. After three hours the decay of the production rate was less then 1% per hour and a steady state activity was assumed. lt tumed out that the catalyst maintained the same activity tor months. Hence, all experiments have been carried out with the same catalyst batch. The experimental conditions during the cyclic
Table4.2 Experimental condit/ons durlng the cycllc feeding experiments over Pt/y-A/20 3
p
Pco1>
P 1) 02
T
w f
F 2l lot
/kPa
/kPa
/kPa
IK
Ik ge
/Hz
/mol s·1
110
0.55
0.55
373-433
1.110"3
0.1-0.5
5.6 10"3
1> CO and 0 2 oscillate in counter phase; CO is fed one half of a period, 0 2 the other half 2> F1ot includes balance gas He
feeding experiments are summarized in Table 4.2, whereas the steady state conditions during the stabilisation period are given in section 2.4.1.

76 CHAPTER4
4.3.2 Cycllc feeding
In Figure 4.1 both the measured and the calculated responses are depicted at a temperature of 433 K. The calculated responses result trom the regression of the experimental data discussed in section 4.5. The feed stream is periodically switched trom 0.5 % CO to 0.5 % 0 2 in He with a period of 1 0 s, see also section 2.4.4. The shift in time between the inlet and the outlet responses due to the residence time amounts to about 100 ms and is not visible at the time resolution shown in Figure 4.1 . Although a stabie oscillation is reached within 1 0 seconds, the data recording; is started one minute after initiating the oscillation. As the responses are part of a stabie oscillation the oxygen and CO adsorption capacities can be calculated by integrating the C02
response in time. The amount of C02 produced during both the 0 2 and CO feeding part of the response amounts to 1 .1 1 o-2 moVkgc indicating equal CO and 0 2 adsorption capacities. As shown in Figure 4.1 , the time scales of the responses are of the same order as the period and the reactor is therefore operated in the so-called dynamic
0.80
0.60 t. c: 0 = ~ 0.40 G) (,) c 0 (,)
0.20
0.000
Flgure4.1
2 4 6
time/s
8 10
Messured snd calculsted CO, 0 2 snd C02 outlet concentrat/ons versus time durlng forced cycllng of the CO snd 0 2 concentrstlon. Lines: cslculsted uslng Equstlons 4.1 to 4.7 snd 4.17 to 4.20, parameters: Tsble 4.5. Symbols: messured responses: + = CO; .A = 0 2; = C02• Conditions: T = 433 K, f = 0.1 Hz and Table 4.2.
regime. This is the most interesting regime in the determination of kinetic parameters since the responses contain information about the reaction mechanism which is often

TRANStENT KINET/CS OF THE CO OXIDA TION OVER Pt/y-A/20 3 77
not accessible during steady state operation. In chapter 3 the benefits of dynamic reactor oparation compared to steady state oparation were discussed with respect to parameter estimation in more detail.
The observed phenomena can be explained as follows. At zero seconds, just before switching the feed stream trom CO to oxygen, a steady state is reached. lmmediately after switching, a tew sites only are available for the adsorption of oxygen and therefore the outlet 0 2 concentratien tends to follow the in let. After an induction time of about 0.2 s the surface reaction between adsorbed oxygen and adsorbed CO starts and C02 is detected at the outlet As a result of the surface reaction new vacant sites are created and more oxygen adsorbs on the catalyst surface. This autocatalytic effect leads to the rapid decrease of the 0 2 concentration, shown in Figure 4.1. When most of the adsorbed CO has reacted, the C02 production rate decreases. The oxygen concentratien starts then to increase and relaxes to the inlet concentration. When the 0 2 outlet concentratien equals the inlet concentratien the surface will be completely covered with oxygen adatoms and no C02 formation takes place any more. The transient part of the C02 response after the surface reaction has stopped can be explained by desorption from the support: apparently C02 in the gas phase shows some interaction with the v~AI20;~ support. From Figure 4.1 it is clear that the time-scale of the C02 desorption is large compared with the time-scale of the surface reaction.
After switching to the feed stream containing CO, the C02 formation starts immediately. Ou ring the first half a second no CO is detected at the outlet of the reactor. Although the surface is completely covered with oxygen, CO trom the gas phase adsorbs on the surface and reacts with adsorbed adatoms. When CO starts to break through the surface reaction rate and hence the C02 concentratien is decreasing. After about three seconds, the CO concentratien reaches the steady state while the C02
concentratien still decreases. The C02 formation stops when all adsorbed oxygen has reacted; CO adsorbed on the catalyst is then in equilibrium with the gas phase. From Figure 4.1 it can be concluded that CO adsorbs on a surface completely covered with adsorbed oxygen, while the 0 2 adsorption is inhibited by adsorbed CO.
Effect of temperature
At a temperature of 373 K, the 0 2 concentratien follows the inlet signal immediately after switching of the feed streams, as shown in Figure 4.2. Compared to Figure 4.1 the CO desorption rate has decreased due to the lower temperature. Hence, the steady state degree of CO coverage is higher at the end of the CO feeding part of the period. The 0 2 adsorption is even more inhibited by the adsorbed CO and therefore the outlet 0 2 concentratien equals the inlet concentratien tor about half a second. The initially very low surface reaction rate increases rapidly creating more vacant sites for

78 CHAPTER4
oxygen starts to adsorb on. When most of adsorbed CO has reacted, the 0 2
concentratien goes through the local minimum and relaxes to the final value without reaching the inlet concentration. Figure 4.2 shows that the 0 2 concentratien relaxes on the same time scala to the final value as the C02 concentratien meanlng that the time scala of the C02 desarptien trom support is no langer the slowest step.
When switching to a feed stream containing CO, the response is similar to that shown in Figure 4.1. The C02 production starts immediately because the CO adsorption is nat inhibited by the adsorbed oxygen. Apparently the reaction path leading to the formation of C02 aftar exposing the catalyst to CO is rather tempersture independent. The temperature dependency of the interaction of co2 with the support is also negligible under the experimental conditions as the relaxation behaviour in shown Figure 4.1 is similar to that shown in Figure 4.2. This is confirmed by experiments with a cyclic feed containing co2 only.
0.80.--------------------,
i: c: 0
0.60
~ -E oAo
i 0.20
co
0·00o~~==;2===4=-~s~::::~a•--111111o..U tirnets
Flgure4.2 Measured snd calculsted CO, 0 2 snd C02 outlet concentrat/ons versus time durlng toreed cyc/lng of the CO snd 0 2 concentratlon. Lines: calculated using Equations 4.1 to 4.7 snd 4.17 to 4.20, parameters: Tsb/e 4.4. Symbols: messured responses: + = CO; • = 0~ = co,. Conditions: T = 373 K, f = 0. 1 Hz and Table 4.2.
Effect of the frequency
At a forcing frequency of 0.5 Hz, a steady state is never reached and C02
formation always takes place, as depicted in Figure 4.3. The shape of the response

TRANS/ENT KINET/CS OF THE CO OXIDATION OVER Pt/y-A/20 3 79
immediately after switching the feed stream trom CO to oxygen is almost similar to the one shown in Figure 4.1. After switching the teed stream to 0 2 only a tew vacant adsorption sites are available and the outlet concentratien tollows the inlet. The local maximum in the oxygen response is lower compared to that in Figure 4.1 . As there is always both CO and oxygen present on the surface, the ongoing surface resetion creates extra vacant adsorption sites. Compared to Figure 4.1 , these sites are available immediately after switching the teed stream, while at a frequency of 0.1 Hz they are created after some oxygen has adsorbed on the catalyst surface. Since the CO adsorption is not inhibited by adsorbed oxygen, the CO response is similar to that at a frequency of 0.1 Hz, see Figure 4.1. There is still an induction time of the CO concentratien and the C02 starts to increase immediately atter switching the feed.
0.80
0.60 ~ c ~ 0
~ + C02 .;, 0.40 "' c 4 Q)
0
+ § 0.20
0.000
time/s
Flgure4.3 Measured CO, 0 2 and C02 outlet concentrat/ons versus time during toreed cycllng of the CO and 0 2 concentratlon. Conditions: T = 433 K, f = 0.5 Hz and Tabla 4.2.
4.3.3 Effect of frequency and tempersture on the time-average conversion
As often reported in literature dynamic reactor oparation can result in higher time-average conversions compared to steady state operation. The effects are strongly dependent of the conditions such as the frequency and the temperature. Usually the time-average conversions differ trom the steady state conversions due to the nonlinear behaviour of the reactions taking place in the reactor. In Figure 4.4 the time-average

80 CHAPTER4
conversions at four temperatures are depicted as a tunetion of the frequency. The behaviour at a tempersture of 373 K is first discussed. At low frequencies,
in the quasi-steady regime, the behaviour can be explained considering the amounts of C02 produced per second during feeding oxygen and CO. The total amount of C02
produced aftar switching the feed streams at low frequencies is determined by the capecity of the catalyst surface only and is independent of the frequency. Hence, the amount of C02 produced per second increases linearly as a tunetion of the frequency which explains the behaviour shown in Figure 4.4.
100r-------------------------------~
~ § ao ·~ c:: 60 8 &40 l! ! eb 20 E
:;::::
8.oo
Flgure4.4
~. ~. .. 4- -_-
433 K . ·.·o·. "-".. · .. ~ 413 K ..
·. ·. .6' . -/;. .
' .. fl' •... • ·.ts 393K
.f. -+-- -+. ~ + . " ~ '. 373K
0.25 0.50 0.75 1.00
frequency /Hz
Time-average conversion as a tunetion of the frequency at tour temperatures: + = 373 K; A = 393 K; = 413 K; .& = 433 K. Conditions Tsble 4.2.
At a higher frequency, the so-called dynamic regime of operation, the reaction takes place during a substantial part of the period and the responses become dependent of the frequency. In contrast to quasi-steady oparation the catalyst surface is not completely covered with either CO or oxygen adatoms just befare switching the feed streams. The amount of C02 produced during one complete perio~ now depends on the ratio of the time-scale of C02 formation to the period. As the CO adsorption is not inhibited by adsorbed oxygen and not all adsorbed CO reacts within the 0 2 feeding part of the period the surface becomes ever more CO covered with increasing frequency. The rasuiting lower dagree of oxygen coverage leads to a nonlinear increasing time-scale of the surface reaction with increasing frequency due to the nonlinear behaviour of the surface reaction. This means that the ratio time-scale of C02
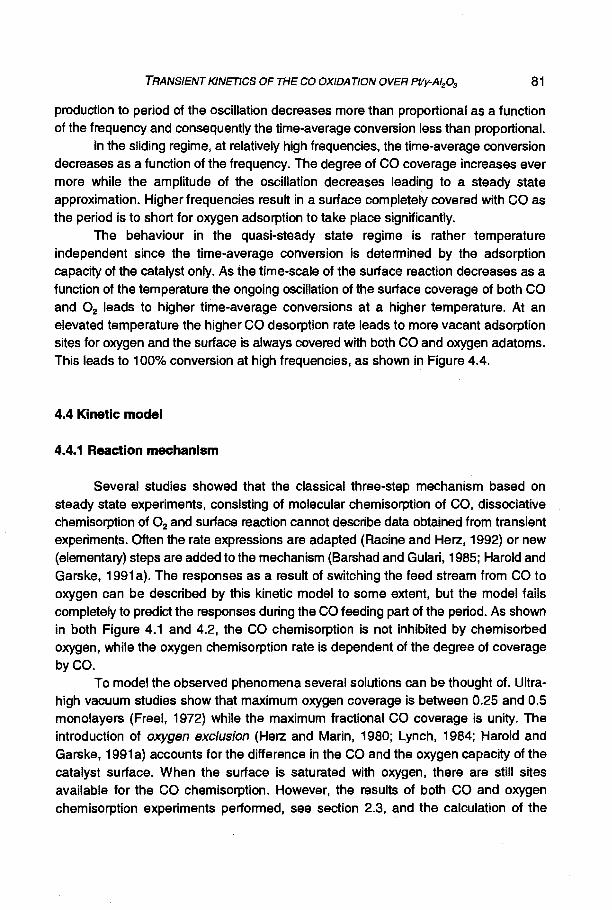
TRANS/ENT KINET/CS OF THE CO OXIDATION OVER Pf/y-A/20 3 81
production to period of the oscillation decreasas more than proportional as a tunetion of the frequency and consequently the time-average conversion less than proportional.
In the sliding regime, at relatively high trequencies, the time-average conversion decreasas as a tunetion of the frequency. The degree of CO coverage increases ever more while the amplitude of the oscillation decreasas leading to a steady state approximation. Higher frequencies rasuit in a surface completely covered with CO as the period is to short for oxygen adsorption to take place significantly.
The behaviour in the quasi-steady state regime is rather tempersture independent since the time-average conversion is determined by the adsorption capscity of the catalyst only. As the time-scale of the surface resetion decreasas as a tunetion of the tempersture the ongoing oscillation of the surface coverage of both CO and 0 2 leads to higher time-average conversions at a higher temperature. At an elevated tempersture the higher CO desorption rate leads to more vacant adsorption sites tor oxygen and the surface is always covered with both CO and oxygen adatoms. Th is leads to 100% conversion at high trequencies, as shown in Figure 4.4.
4.4 Kinetlc model
4.4.1 Resetion mechanism
Saveral studies showed that the classica! three-step mechanism based on steady state experiments, consisting of molecular chemisorption of CO, dissociative chemisorption of 0 2 and surface resetion cannot describe data obtained from transient experiments. Often the rate expressions are adapted (Racine and Herz, 1992) or new (elementary) steps are added to the mechanism (Barshad and Gulari, 1985; Harold and Garske, 1991 a). The responses as a result of switching the feed stream trom CO to oxygen can be described by this kinatic model to soma extent, but the model faits completely to predict the responses during the CO feeding part of the period. As shown in both Figure 4.1 and 4.2, the CO chemisorption is not inhibited by chemisorbed oxygen, while the oxygen chemisorption rate is dependent of the degree of coverage byCO.
To model the observed phenomena saveral solutions can be thought of. Ultrahigh vacuum studies show that maximum oxygen coverage is between 0.25 and 0.5 monolayers (Freel, 1972) while the maximum fractional CO coverage is unity. The introduetion of oxygen exclusion (Herz and Marin, 1980; Lynch, 1984; Harold and Garske, 1991 a) accounts for the ditterenee in the CO and the oxygen capscity of the catalyst surface. When the surface is saturated with oxygen, there are still sites available tor the CO chemisorption. However, the results of both CO and oxygen chemisorption experiments performed, see section 2.3, and the calculation of the

82 CHAPTER4
amount of chemisorbed CO and oxygen by integrating the measured C02 response
depicted in Figure 4.1 show that surface coverages of both CO and 0 2 can become unity.
Assuming the C02 formation not only proceeds via a Langmuir-Hinshelwood .
surface reaction but also via an Eley-Rideal resetion between dissociatively
chemisorbed oxygen and gas phase CO (Bonze! and Ku, 1973; Harold and Garske, 1991b) can be useful sometimes.ln steady state studies the Eley-Rideal step is used
to explain the dependency of the CO concentration on the reaction rate at elevated temperatures, while in transient studies it is used to account for the CO~ formation after
feeding CO to a surface saturated with oxygen. Since the surface is co~ptetely covered with oxygen and no other intermediale is involved in the Eley-Rideal reaction, there will
be no induction time in the co2 formation other than the residence time after switching the feed stream to CO. As shown in Figure 4.1 and 4.2 a small but significant induction
time is visible, so this step can be ruled out. Huinink (1995) used CO physisorption to model the CO oxidation by oxygen over
platinum at a pressure of 100 Pa. lt was assumed that physisorbed CO'is in equilibrium
with the gas phase and is foliowed by CO chemisorption on vacant sites. The C02
response predicted by this model will be the same as the one predicted by the basic Langmuir-Hinshelwood model. Since physisorption occurs on both chemisorbed CO and chemisorbed oxygen the physisorbed CO returns to the gas phase after switching
off the CO in the feed. Therefore, the introduetion of physisorbed CO results in an extra capacity on top of the chemisorbed species teading to a phase shift of the CO outlet
concentration. Hence, taking into account CO physisorption in the kinatic model results
not in a better description of the observed responses. Another alternative to describe the dynamic responses is the adsorption of CO
on platinum oxides (Barshad and Gulari, 1985; Herzand Shinouskis, 1984; Zhou et al., 1986). Platinum oxides are formed at a time-scale of minutes (Turner and Maple, 1984). The period of the toreed oscillation is about one second so the oxide formation is in the
sliding regime and consequently the amount of oxides remains almost constant in time. Since no adsorption of oxygen on oxides takes place and the reduction of the oxide also proceeds at a time-scale of minutes, the oxygen adsorption capacity wilt besmaller
than the CO adsorption capacity. As mentioned before, the amount of adsorbed CO equals the amount of adsorbed oxygen. Therefore it can be concluded that the contribution of the reduction of oxides to the C02 formation is negligible.
Saveral Fourier-Transform Intrared Transmission Spectroscopy (FTIR) studies show that during cyclic feeding the formation of new surface species plays an important role in the CO oxidation (Herz and Shinouskis, 1984; Barshad et al., 1985; Zhou and
Gulari, 1986). Barshad et al. (1985) suggest that CO can chemisorb on a catalytic site a/ready covered by chemisorbed oxygen. Outing periadie oparation new peaks became
visible in the time-average IR spectra compared to steady state operation. From these

TRANS/ENT KINET/CS OF THE CO OXIDATION OVER Ptly-A/20 3 83
IR spectra they concluded that CO adsorbs both on oxygen covered sites and platinum oxides. The amount of the latter remained constant at a switching period of about one minute, while the former oscillated with an amplitude of 30%. Barshad et al. (1985) also suggested that CO sharing a site with oxygen is a very reactive intermediale leading to the rate enhancements observed during periodic operation. Based on the above discussion it is assumed in the modelling that CO can
Table4.3 Elementary steps andreaction paths used to model the cycllc feeding experiment&
elementary reaction N1 N2 step number
.k1
co+ * .. co* 2 0 1 k_1
k.z 02 + *- 02* 1 1 2
k3
02* + *- 20* 1 1 3
k4
co* + o* - co2 + 2 * 2 0 4
~ co+ 0* .. oco* 0 2 5
·k-5
lee oco*- C02 + * 0 2 6
k, C02 +:j: .. co~ 0 0 7
k_7
2CO + 02 - 2C02
"site on Pt
chemisorb on a catalytic site already covered by chemisorbed oxygen, i.e. chemisorbed CO and oxygen adatoms can share the same catalytic site.
The elementary steps and the reaction paths considered in the modelling are

84 CHAPTER4
listed in Table 4.3. They consist of the basic Langmuir-Hinshelwood kinatic model with molecular oxygen adsorption foliowed by an instantaneous dissociation (Campman, 1996). These steps are often used to model the observed steady state behaviour. In step 5, the CO chemisorption on a site already covered by oxygen leading to the formation of species OCO* is taken into account. The CO adsorption rate of step 5 is assumed to be proportionaf to the oxygen surface coverage. OCO* can either desorb trom the catalyst surface rasuiting in chemisorbed oxygen and gaseaus CO, or react to co2, shown in step 6.
As discussed insection 4.3.2, C02 shows some interaction with the support. Therefore it is assumed that C02 adsorbs reversibly on the y-A120 3 support, step 7.
The expressionsof the rata coefficients of the elementary steps shown in Tabla 4.3 used in the regression analysis are given by:
Chemjsorption of CO and 02-
The rate coefficient tor the chemisorption of CO and 0 2 are obtained trom the collision theory and expressed as:
k. = ..:!_ ~ AT s.o I Lt 2nMi I
(4.14)
where ~ 0 rafers to the sticking probability on a clean surface. The chemisorption of CO and 0 2 have been reported to be non-activated processas (Engeland Ertl, 1978). lt is assumed that the chemisorption of 0 2 is foliowed by a instantaneous dissociation, and therefore ~is set to infinity. Th is leadstoa first order dependenee of the chemisorption rate on the fraction of vacant sites a. (Oh et al., 1986) and an overall steady state rate which is proportionaf to P0 /Pco (Campman, 1996).
Oesorotion of CO
The CO desorption coefficient is obtained trom:
( E
0 -p a l k = A exp _ d,co d,CO co
-1 d,CO AT (4.15)
The desorption of CO is assumed to follow the Elovich desorption kinatics (Boudart and Djéga-Mariadassou, 1984; Herz and Marin, 1980; Oh et al., 1986; Zhdanov and Kasemo, 1994). The surface non-uniformity or the interaction of the adsorbed CO molecules, is described by a linear relation between the activation energy and the CO

TRANS/ENT KINET/CS OF THE CO OXIDA TION OVER Pt/y-A/20 3 85
surface coverage.
Surface reaction
The coefficient of the surface reaction between CO* and 0* is described by:
k = A exp( - E~H -13LHeco) {4.16) 4 LH AT
The surface non-uniformity is again described by a tinaar surface coverage dependenee of the activation energy {Zhdanov and Kasemo, 1994).
As mentioned in section 4.3.2 the experîments showed that responses as a rasuit of switching the feed stream from oxygen to CO are independent of the temperature. Dynamic experiments performed with feed streams containing C02 only showed that the adsorption and desorption from the support are not significantly dependent of the temperature either. Therefore, the other rata coefficients are assumed to be parameters independent of the temperature.
Table4.4 Kinetlc parameters of the CO oxldatlon on Pt as reported in literature.
parameter value raferenee
Soco 1- 0.5 Herz and Marin, 1980
soo2 1- 0.014 Herz and Marin, 1980
~.co ts·1 1014, 1017, 1013 van Santen and Niemandsverdrîet, 1992; Zhdanov et al., 1988; Compton, 1991
Ed,CO /kJ mot·1 124, 130, 112 Herzand Marin, 1980; Compton, 1991, Campman, 1996
13d,CO /kJ mot·1 27.2, 16 Herzand Marin, 1980; Zhdanov and Kasemo, 1994
ALH ts·1 1013, 2 106 Herzand Marîn, 1980; Graham, 1993
ELH /kJ mot·1 56.5, 48.2 Herz and Marîn, 1980; Graham, 1993
ilLH /kJ mot·1 8.4 Zhdanov and Kasemo, 1994
ka.co2 /m 3 mot·1 s·1 g 5.5 Graham, 1993
~.C02 /s"1 27.7 Graham, 1993
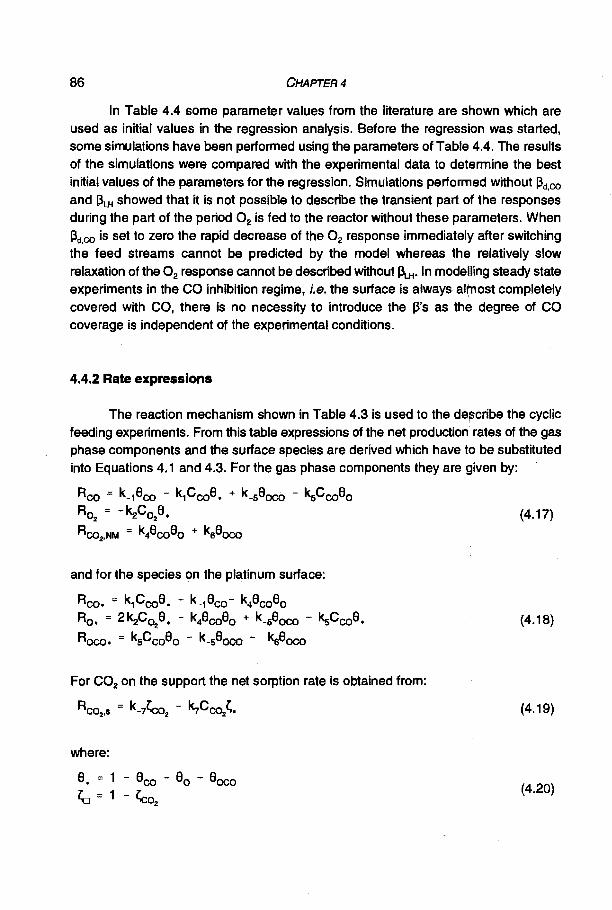
86 CHAPTER4
In Table 4.4 soma parameter values from the literature are shown which are used as initia! values in the regression analysis. Befare the regression was started, soma simulations have been performed using the parameters of Tabla 4.4. The results of the simulations ware compared with the experimental data to detennine the best initia! values of the parameters for the regression. Simulations perfonned without 13d,co and 13LH showed that it is not possible to describe the transient part of the responses during the part of the period 0 2 is fed to the reactor without these parameters. When 13d,co is set to zero the rapid decrease of the 0 2 response immediately aftar switching the feed streams cannot be predicted by the model whereas the relatively slow relaxation of the 0 2 response cannot bedescribed without ~· In rnadelling steady state experiments in the CO inhibition regime, i.e. the surface is always altnast completely covered with CO, there is no necessity to introduce the 13's as the dagree of CO coverage is independent of the experimental conditions.
4.4.2 Rate expresslons
The reaction mechanism shown in Table 4.3 is used to the describe the cyclic feeding experiments. From this table expressions of the net production rates of the gas phase components and the surface species are derived which have to be substituted into Equations 4.1 and 4.3. For the gas phase components they are given by:
Rco k_1800 k1C008. + k_58000 - k5C0080
Ro2 = -k:Po2e. (4.17) Rco2.NM = k48co8o + ksBoco
and for the species on the platinum surface:
R00• = k1C008. - k_18c0 - 1<:480080
R0 • = 2~CD:!e• - k480080 + k_58000 ksC008. (4.18)
Roco. = ksCcoBo - k_sBoco - ksBoco
For C02 on the support the net sorption rate is obtained from:
(4.19)
where:
(4.20)

TRANS/ENT KINET/CS OF THE CO OXIDA TION OVER Ptly·Aip3 87
The rate equations are a tunetion of the kinetic parameters to be estimated and are substituted into the continuity equations tor the components in the gas phase,
Equation 4.1, and the continuity equations tor the surface species Equation 4.3 (see sectien 4.2.1 ). The calculated responses are used in the regression of the experimental
data.
4.5 Regression results
4.5.1 Parameter estimates
The final kinetic parameter estimates with their 95% confidence intervals are
shown in Table 4.5. The corresponding t-values range between 5 and 2000 indicating that all parameters estimates are statistically significant. Equation 4.12 is used to
reconstruct the t-value eerrasponding to ~.co and ~· F-value after regression amounts to 1.3 103 while the highest absolute value of the binary correlation coefficient occurred
between s00 ° and ALH amounting to 0. 72. All parameters estimates are well in the range calculated trom the transition state
theory (Zhdanov et al., 1988) and close to values reported in the literature, see Table
4.4. The sticking probability of CO s00° on a clean surface is lower than the value reported by Herzand Marin (1980) but much higher than the value reported by Graham
(1993), while both the activatien energy and the pre-exponential factor of the CO desorption are welt in agreement with values found in the literature (Herz and Marin,
1980; Campman, 1996). Estimated value of J3d,co accounting tor the dependency of the activatien energy on the degree of coverage, is only half the value reported by Zhdanov
and Kasemo (1994) and Oh et al. (1986) tor the oxidation of CO over Rh/AI:P3• The
sticking probability of 0 2 on a clean surface is smaller than the value reported by Herz and Marin (1980). Howèver, Herzand Marin (1980) assumed a secend order oxygen
adsorption in their kinetic model and this leads to a higher value of s0 02• Compared to
the value of Herz and Marin (1980), the activatien energy of the surface reaction is rather low but close to the value reported by Graham (1993), whereas the value of the
pre-exponential factor of the surface resetion is in good agreement with the value of
Herzand Marin (1980) but smaller than the value as reported by Graham (1993). The
value of J3LH is in good agreement with the value of Zhdanov and Kasemo (1994). Graham (1993) reported much highervalues for the rate coefficients corresponding to
sorption of C02 on the support, k7 and k.7• Their values suggest that the C02 adsorption on the support and the desorption trom the support takes place on a time-scale of less
than 0.1 second. However, the values of the estimates shown in Table 4.5 are in
agreement with transient experiments conducted with a feed containing C02 only. These experiments showed that the time-scale of adsorption and desorption is

88 CHAPTER4
approximately 1 second. In the literature no values are reported of the parameters of step 5 and 6. However, the parameter estimates of ks. 1<.5 and ke· are in line with the observations of Barshad et al. (1985). They reported a rather low value of 9000 and a potentially fast reaction of OCO* to C02 , indicating a relatively lów value of the equilibrium constant and a high value of the rate coefficient for the desorption of OCO*,
~ce. Table4.5 Final kinetlc parameters estimates with correspondlng 95% confidence intervals obtalned trom regressJon of data acqulred trom the cycllc feeding experlments perlormed under condit/ons shown in Tt,~ble 4.2 wlth the model glven by Equatlons 4.1 to 4. 7 and 4.14 to 4.20.
parameter value
Soco 1- 2.37±0.03 10"1
Ad. CO /s-1 2.3±0.9 1015
Ed,CO /kJ mol-1 124±1
Pd. co /kJ mol·1 7.25±0.08
so02 1- 4.89±0.04 1 o-3
At_H ts·1 4.5±0.61011
ELH /kJ mol·1 53.8±0.4
~ /kJ mol'1 11.01±0.09
ks lm 3 mol-1 s·1 11 3. 76±0.03 1 02
k-5 ts·1 4.56±0.06 1 o·2
lee ts·1 1.86±0.02
k7 lm 3 mol-1 s·1 g 1.234±0.001
1<.7 ts·1 9.61±0.09 10'1
4.5.2 Simulations
In Figure 4.1 the measured and the calculated responses are shown at a temperature of 433 K and a forcing frequency of 0.1 Hz. The model describes all responses rather well. Both the local maximum and minimum of the o~gen signa! are

TRANS/ENT KINET/CS OF THE CO OXIDATION OVER Pt/y-AIP3 89
described adequately by the model. The calculated induction time of the C02 response after switching the feed stream to oxygen is smaller than that of the measured response, and the C02 concentration relaxes initially on a smaller time-scale to the final value, but the overall description is close to the measured data. The maximum of the calculated C02 response coincides with the minimum in the 0 2 concentration, while in the experimental curves the maximum in the C02 concentration occurs after the minimum of the 0 2 signal. Apparently the C02 formation proceeds via more reaction steps than given in Table 4.3. Bath the small induction time of the C02 concentration immediately after switching the feed stream from oxygen to CO and the experimentally observed relatively slow C02 relaxation rasuiting from desorption from the support are present in the calculated response.
From the transient behaviour of the surface coversges it bacomes clear that during the first half of the period the formation of co2 mainly proceeds via step 4 in Table 4.3, while after switching the feed stream to CO the production of C02 takes place via step 6. Simulations performed with step 4 leading to the formation of OCO* insteadof C02, i.e. considering only one reaction path in the C02 formation, showed a significantly worse description of the measured responses. Hence, in order to describe a complete period adequately the C02 production must praeeed via parallel reaction paths, as shown in Table 4.3. This is in line with the results of saveral experimental studies reported in the lilarature showing that the co2 formation over Pt proceeds via parallel paths at different time-scales (Herz and Shinouskis 1984; Barshad and Gulari, 1985; Zhou et al., 1980).
'#. ~ 8
Mo ()
i il 0.20 OI G)
E
0.20 0.40 0.60
caleulated C00 /vol%
Figure4.5 Measured CO outlet concentrat/ons versus concentrat/ons calculated wlth Equatlons 4.1 to 4. 7 and 4.17 to 4.20, parameters Table 4.5. Symbols: + = 373 K; ~;. :393 K; = 413 K; = 433 K. Conditions: Table 4.2.
0.20 0.40 0.60
caleulated CO. !vol%
Figure4.6 Measured 0 2 outlet concentrat/ons versus concentrat/ons calculated wlth Equatlons 4.1 to 4.7 and 4.17 to 4.20, parameters Table 4.5. Symbols: + = 373 K; ~;. =393 K; = 413 K; = 433 K. Conditions: Table 4.2.

90 CHAPTER4
Simulations perfonned at other experimental conditions showed that the model prediets the dynamic behaviour over a broad range of conditions rather well. An example is shown in Figure 4.2. At 373 K the quality of the model description is oomparabie with that at a temperafure of 433 K, depieted in Figure 4.1. The results at a higher frequency are not shown but are similar to the ones shown in Figure 4.1 and 4.2.
In Figures 4.5 to 4.7 the oorrasponding parity plots are shown. These figures show that the model describes the measured data rather well over a broad range of inlet concentrations and temperatures. The relatively large deviation from the straight line depicted in Figure 4.7 is mainly caused by the ditterenee between the calculated and the measured response immediately aftar switching the feed stream from CO to oxygen, see also Figure 4.1.
4.6 Steady state simulations
'C !! a: 0.10
:! E
Do 0 0
0.10 0.20 0.30
calculated C00, /vol%
Figure4.7 Measured C02 outlet concentrat/ons versus concentrat/ons calculated w/th Equatlons 4.1 to 4.7 and 4.17 to 4.20, parameters Table 4.5. Symbo/s: + = 373 K; t. =393 K; = 413 K; = 433 K. Conditions: Table 4.2.
As often reported in the literature, the classica! three·step kinatic model, see seetion 4.1 , obtained trom steady state experiments cannot describe the measured dynamic responses. However, the same holds for transient kinatic models as they do not prediet the observed steady state behaviour. The model of Cutlip (1983) prediets a surface predominantly covered by oxygen which is in contrast to the observations reported in the literature. Under steady state conditions, the model as proposed by Racine and Herz (1992) prediets CO inhibition at relatively low pressures.
To demonstrata the kinatic model obtained trom the regression•of the data trom cyclic feeding experiments can also prediet the steady state behaviour, the steady state C02 turnover frequencies as a tunetion of the concentrations are calculated. The accumulation tenns of the continuity equations for the species on the surface (Equation 4.3) are set to zero and thesetof algebraic equations is solved by means of NAG routine C05NBF (NAG, 1995) for a given gas phase composition. The turnover frequencies as a function of the CO concentration are shown in Figure 4.8 while the

TRANS/ENT KINET/CS OF THE CO OXIDATION OVER Pt/y-A/20 3 91
dependency on the oxygen concentration is shown in Figure 4.9. The partial order of the CO concentration at an elevated temperature decreasas from 1 to -1 as a tunetion ofthe CO concentration, as reported by Engeland Ertl (1979). The partial order in the CO inhibition regime of the CO concentration increases from -1 to 0 with decreasing temperature (Berlowitz et al., 1988). The reported dependencies of the partial reaction order in the CO concentration are predicted by the model, as shown in Figure 4.8.
o" Z
00.60 \
.\ 0.30 '\
0·0!l.ook' -~~:::-:::::~~~;-:::~-::::-;:::;---~~~:40~--:;:;;0~.6;;;;0 ;;;;:;::;:0:;.;;.60;;;::;:;d1.00
C00 /Vol%
Figure4.8 Steady state turnover frequency as a tunetion of the CO concentration calculated using Equation 4.3 at tour temperatures. Parameters: Table 4.5.
0.60 rr==::==:;--------:::::::::1 T~433K
•·•·• T~413K
----- T = 393 K 0.40 1e '----_J/
o• 0 z
Figure4.9
0.60 1.00
Steady state turnover frequency as a tunetion of the 0 2 concentration calcu/ated using Equation 4.3 at tour temperatures. Parameters: Table 4.5.
Most studies report a first order 0 2 dependency of the turnover frequency. The partial order of the oxygen concentration calculated with the model decreasas from 1 to 0.6 with increasing temperature. The predicted activation energy of the global reaction amounts to 90 kJ/mol. Th is is in good agreement with the value of 100 kJ/mol often reported in the literature.
4.7 Conclusions
In order to study the CO oxidation cyclic feeding experiments in a fixed bed reactor have been performed. A regression analysis showed that cyclic feeding experiments provide much information about the reaction mechanism and the kinatic parameters. The reaction mechanism based on steady state experiments cannot be used to describe the transient responses. In order to describe these responses, the steady state kinatic model has to be adapted. The cyclic feeding experiments showed that the CO adsorption is not inhibited by the adsorbed oxygen, while the adsorbed CO

92 CHAPTER4
is inhibitlng the 0 2 adsorption. To model the experimental responses it is assumed that CO can chemisorb on
a catalytlc site already covered with oxygen. To account tor the surface non-uniformity a linear dependency on the CO surface coverage of the activation energy of both the CO desorptlon and the surface reaction between adsorbed CO and oxygen adatoms has to be assumed. The C02 adsorption on and the desorption trom the support has also to be incorporated into the model.
The reaction mechanlsm based on the cyclic feeding experiments consists of adsorption, desorption and surface reaction steps. Nonlinear regr:ession analysis showed that all 13 kinetic parameters of the reaction mechanism were estimated significantly. All parameter estimates are well in agreement with the values reported in the literature. The kinetic model also describes the steady state behaviour reported in the literature.
Relerences
• Bailey, J.E., Periodic phenomena. In Chemica! reactor theory: A review (Edited by Lapidus, L. and Amundson N.R.) 758·813, Prentice-Hall, Englewood Cliffs, NJ, 19n
• Barshad, Y., Gulari, E., A dynamic study of CO oxidation on supported platinum, AIChE J. 31, 649-658, 1985a
• Barshad, V., Gulari, E., A novef catafytic reactor system tor transient response and its use in CO oxidation on Pd/AI20 3, J. Catal. 94, 1985b
- Barshad, Y., Zhou, X., Gulari, E., Carbon monoxide oxidation under transient conditiof1s: A Fourier-Transform intrared transmission spectroscopy study, J. Catal. 94, 128-141, 1985
- Berlowitz, P.J., Peden C.H.F., Goodman D.W., Kinetics of CO-oxidation on singlecrystal Pd. Pt and Ir, J. Chem. Phys. 92, 5213-5221, 1988
• Bonze!, H.P., Ku A., On the kinetics of oxygen adsorption on a Pt(111) surface, Surf. Sci. 40, 85·101, 1973
• Bouda.rt, M., Djéga-Mariadassou G., Kinetics of Heterogeneaus Catafytic Reactions, Prinoeton Univarsity Press, Prinoeton, N.J., 1984
• Boudart, M., Rumpt F., The catalytic oxidation of CO and structure insensitivity, Reset.
Kinet. Catal. Lett. 35, 95·105, 1987 - Campman, MAJ., Kinatics of carbon monoxide oxidation over supported platinum
catalysts, The role of steam in the presence of ceria, Ph.D. Thesis, Eindhoven Univarsity of Technology, 1996
- C.ho, B.K., West, L.A., Cyclic oparation of Pt/AI20s catalyst tor CO oxidation~ lnd. Eng. Chem. Fund. 25, 158-164, 1986

TRANSJENT KINET/CS OF THE CO OXIDATION OVER Pt/y-A/20 3 93
• Compton, R.G., (ed.) Studies of kinatic modeling tor oxidation reactions over metals
(exemplified by CO oxidation), Comprehensive chemical kinetics, vol. 32: Kinatic
modelsof kinatic reactions, Eisavier Science Publishing Company, lnc., New Vork, USA, 311-360, 1991
• Cutlip, M.B., Concentration forcing of catalytic surface rata processes, AIChE J. 25, 502-508, 1979
- Cultip, M.B, Hawkins, C.J., Mukesh, P., Morton, W., Kenney, C.N., Modelling of toreed periodic oscillations of carbon monoxide oxidation over platinum catalyst, Cham.
Eng. Comm. 32, 329-344, 1982
- Engel, T., Ertl G., Elementary steps in the catalytic oxidation of carbon monoxide on
platinum metals, Adv. Catal. 28, 1-78, 1979 • Fraai, J., Chemisorption on supported platinum 11, Stoichiometry tor hydrogen, oxygen
and carbon monoxide, J. Catal. 25, 149-160, 1972 - Froment, G.F., Hosten L.H., Catalytic kinetics: Modeling, Cat. Sc. Tech. Anderson
J.R., Boudart M., Springer Verlag, Berlin, 98-170, 1981 - Graham, W.R.C., Oxidation of carbon monoxide on platinum catalyst: kinatic model
discrimination using expertmentaf steady-state multiplicity and feed c.omposition cycfing, Ph.D. Thesis, Univarsity of Alberta, 1993
- Harold, M.P ., Garske, M.E., Kinatics and multiple rata statas of CO oxidation on Pt. I Model davslopment and multiplicity analysis, J. Catal. 127, 524-552, 1991a
- Harold, M.P., Garske, M.E., Kinatics and multiple rata statas of CO oxidation on Pt. 11 Linking UHV and atmospheric pressure kinatic behavior, J. Catal. 127, 553-
575, 1991b - Herz, R.K., Marin S.P., Surface chemistry modelsof carbon monoxide oxidation on
supported platinum catalysts, J. Catal. 65, 281·296, 1980 - Herz, R.K., Shinouskis, J., Transient oxidation and reduction of alumina supported
platinum, Appi.Surf.Sc/. 19, 373-397, 1984 • Huinink, J.P.H., A quantitaive analysis of transient kinatic experiments: the oxidation
of CO by OJNO on Pt, Ph.D. Thesis, Eindhoven Univarsity of Technology, 1995
- Kitrell, J.R., Mathematica! modelling of chemica! reactions, Adv. Chem. Eng. 8, 97,
1970 - Li, Y-E, Boecker, D., Gonzales, R.D., CO oxidation on Pt/Si02 and Pd/AI20 3 catalysts.
Rapid FTIR transient studies, J. Catal. 110, 319-329, 1988 - Luntz, A.C., Grimblot, J., Fowler, D.E., Sequentia! precursors in dissociative
chemisorption: 0 2 on Pt(111), Phys. Rev. 8. 39, 12903·12906, 1989
·Lynch, D.T., Use of elementary step mechanism to explain resonant behaviour tor CO
oxidation on platium, Can. J. Cham. Eng. Sci. 62, 691-698, 1984 • Matros, Y.S., Catalytic processas under unsteady-state conditions, Studies in surface
science and catalysis, 43, Elsevier, Amsterdam, 1989 - NAG Fortran Library Manual, mark 16, volume 1 , 1995

94 CHAPTER4
• Odrpack, User's raferenee guide for odrpack version 2.01, Software for weighted orthogonal distance regression, 1992
-Oh, S.H., Fisher, G.B., Carpenter J.E., Goodman, O.W., Comparative kinetic studies of C0-02 and CO-NO reactions over single crystal and supported rhodium catalysts, J. Catal. 100, 360-376, 1986
- Prairie, M.R., Cho, B.K., Oh, S.H., Shinouskis, E.J., Bailey, J.E., St~ady-state and transient studies of carbon monoxide oxidation on alumina-supported rhodium via transmission intrared spectroscopy, lnd.Eng. Chem. Res. 127, 1396-1407, 1988
• Racine, B.N., Herz, R.K., Modelling dynamic CO oxidation over Pt/AI20 3: Effects of intrapellet ditfusion and site heterogenity, J. Catal., 137, 158-178, 1992
- Razon, L.F., Schmitz R.A., lntrinsically unstable behaviour during the oxidation of carbon monoxide on platinum, Catal. Rev. Sci. Eng. 28, 89-164, 1986
- Sadhankar, R.R., Lynch, D.T., N20 reduction by CO over an alumina supported Ptcatalyst: toreed composition cycling, J . .Catal. 149, 278-291, 1994
- Sant, R., Wolf, E.E., Elementary step rnadeling and transient FTIR studies of CO oxidation on Rh/Si02, Chem. Eng. Sci. 45,3137-3147, 1990
-van Santen, R.A., Niemantsverdriet, J.W., Chemica! kinatics and Catalysis, Eindhoven Univarsity of T echnology, 1992
- Sohiesser, W.E., The numerical methods of lines, Academie Press, San Diego, 1993 - Silveston P., Hudgins, R.R., Renken, A., Periodio oparation of oatalytio reactors-
introduetion and overview, Catal. Today, 91-112, 1996 -Turner, J.E., Maple, M.B., Oxide formation and reduction over Pt, Pd, and Ir: A driving
meohanism for osoillations in the CO oxidation reaotion, Surf. Sci. 147, 1984 - Zhdanov, V.P., PavUèek, J., Knor, Z., Preexponential factors for elementary surface
processes, Gatal. Rev. Sci. Eng. 30, 501-517, 1988. - Zhdanov, V.P., Kasemo, B., Steady-state kinatics of CO oxidation on Pt: extrapolstion
trom 10'10 to 1 bar, Appl. Surf. Sci. 74, 147-164, 1994 - Zhou, X., Barshad, Y., Gulari, E., CO oxidation on Pd/AI20 3• Transient response and
rate enhanoement through toreed conoentration cyoling, Chem. Eng. Sci. 41, 1277-1284, 1984
- Zhou, X., Gulari, E., CO oxidation on Pt/AI20 3 and Pd/AIP3 transient response and oonoentration cycling studies, Chem. Eng. Sci. 41, 883-890, 1986

5 TRANSIENT KINETICS OF THE CO OXIDATION OVER
Pt/Rh/Ce0/v-AI20 3
5.1 Introduetion
Commercial automotive three-way exhaust catalysts commonly contain relatively large amounts of cerium oxide. Saveral effects have been ascribed to the cerium oxide addition. Ceria has been found to stabilize the noble metal dispersion at high temperatures (Summers and Ausen, 1979; Su et al. 1985) and to improve the thermal stability of the catalyst (Harrison et al., 1988). Furthermore it was found to promote the water-gas shift reaction at temperatures above the light-off (Kim, 1982; Herzand Sell, 1985; Harrison et al., 1988), hence improving the catalyst's CO conversion activity. However, the experimentally found higher activity of a ceria promoted catalyst cannot totally be explained by the water-gas shift reaction. Saveral studies show that ceria improves the CO oxidation activity even at relatively low temperatures (Serre et al., 1993b; Nunan et al., 1992; Campman, 1996), when there is no contribution of the water-gas shift reaction to the rate of CO oxidation.
The higher activity is often explained by assuming a second mechanism tor the CO oxidation with oxygen apart trom the Langmuir-Hinshelwood reaction: the reaction between CO adsorbed on the noble metal and oxygen trom ceria. Zatiris and Gorte (1993) assumed that oxygen adsorbs on ceria and reacts with CO on the noble metal after reverse spill-over of oxygen. However, most often the observed behaviour is explained by the reaction between oxygen adsorbed on ceria and CO on the noble metal (Jin et al., 1987; Oh and Eickel, 1988; Serre et al., 1993a; Campman, 1996).

96 CHAPTER5
Under transient conditions cerium oxide acts as an oxygen starage component (Kim, 1982; Herz, 1981; Herzet al., 1983; Yao and Y Yao, 1984; Su et al., 1985), which is a very important feature under conditions encountered in practical use. Because of the feed-back controller applied in cars to keep the air to fuel ratio near to its stoichiometrie point, the exhaust gas has a cyclic net oxidizing to net reducing composition oscillation. Cerium oxide can provide oxygen for the CO and hydracarbon oxidation during the net reducing excursions of the asciilation period, while oxygen is stared trom the gas phase at net oxidizing conditions. Hence, during dynamic oparation the time-average activity is improved by sustaining the appropriate oxygen stoichiometry (Herz et al., 1983; Yao and Y Yao, 1984). Su et al. (1985) and Yao and Y Yao (1984) showed that only a fraction of the total amount of oxygen in the bulk of ceria is available for resetion under transient conditions.
Since automotive exhaust gas contains about 10% steam its influence on the CO oxidation activity is an interesting issue. Although beneficia! effects are generally assigned to the water gas shift resetion even at low temperatures it was found that temperatures over 670 K were required for this resetion to occur at a substantial rate (Schlatter and Mitchell, 1980; Kim, 1982).
The purpose of the present chapter is to study the CO oxidation with oxygen over Pt/Rh/Ce0:/v-AI20 3 under typical exhaust gas conditions using cyclic feeding experiments. From these experiments especially the role of ceria will become clear. Experiments with a feed stream which also contains steam and C02 are performed to study the effects of these components on the CO oxidation under realistic exhaust gas conditions.
5.2 Experimental results and discuesion
5.2.1 Experimental conditions
Aftar the catalyst pretraatment as described in section 2.4.1 and prior to the experiments with cycling of the feed streams, steady state experiments were carried out to check the catalyst's activity. When the activity of the catalyst was stabie aftar approximately one hour it was compared with that of a fresh catalyst. The reactor was loaded with a new catalyst when the activity has decreased more than 10%.
In Tabla 5.1 the conditions during the transient experiments are shown. They are similar to the conditions during experiments with the Pt/y-AI20 3 catalyst, discussed in Chapter 4. Therefore, the results of experiments presented in this chapter can be compared with the results of the Ptly-AI20 3 catalyst discussed in Chapter 4, to clarify the role of ceria even more.

TRANS/ENT KINET/CS OF THE CO OXIDATION OVER Pt/Rh/CeOjy-A/20 3 97
Table5.1 Experimenta/ conditlans during thé cyclic feeding experlments over PVRh/Ce0/)1-A/20 8•
Ptot Ik Pa 110
Pco 1)2) Ik Pa 0.55
P02 1l2l lkPa 0.55
T IK 373-473
w Ik ge 1.01 10-3
f /Hz 0.1 -2
F,ot 3) /mol s·1 5.6 10"3
11 CO and 0 2 oscillate in counter phase; CO is fed one half of a period, 0 2 the other half. 2) during the experiments with co2 and steam the feed also contains 11 kPa C02
and 11 kPa H20 31 Ftot includes balance gas He
5.2.2 Cyclic feeding experiments with CO and 0 2
In Figure 5.1 the outlet concentrations · are shown when the inlet concentrations are cycled at a frequency of 0.1 Hz. One half of the period CO only is fed to the reactor, while the other half the feed contains oxygen. The responses are a part of a stabie oscillation which allows the calculation of the oxygen and CO adsorption capacities by integrating the C02 response in time. During the time oxygen only is fed to the reactor the amount of C02 produced is determined by the CO adsorption capacity and amounts to 1.7 1 o-2 moVkgc. Th is value is in good agreement with the noble metal capacity determined by statioriary CO chemisorption experiments, see Table 2.1 section 2.3. The amount of C02 produced during the CO containing feed stream is larger than the noble metal capacity and amounts to 2. 1 1 0"2 mollkgc.
After switching from the CO to the 0 2 containing feed stream, the oxygen concentration initially increases very tast. The outlet oxygen concentration follows

98 CHAPTER5
then the inlet concentration (not shown). Aftar 0.1 s the oxygen concentration passes the local maximum whereas the local minimum is reached after 0.2 s. The oxygen concentration relaxes to the steady state on a time~scale of about 1 s. As soon as the oxygen concentration passes the local maximum, the C02 outlet concentration starts to increase and it takes about 0.4 s to reach the local maximum. After that the concentration relaxes to the final value without reaching a steady state.
0.80..-------------------,
~ ë5 0.60 > -§ ~ 0.40
~ g 0 0.20 0
Figure5.1
t
2 4 6
time/s
co t \ \'1J\tA~
+
10
CO, 0 2 and C02 outlet concentrat/ons versus time durlng toreed cycllng of the CO and 0 2 concentratlon. + = CO; .À = 0~ <> = COr Condltlons: T = 393 K. f = 0. 1 Hz and Tabla 5. 1.
The observed behaviour can be explained as follows. At t = 0 the noble metal surface is in quasi~steady state with the gas phase and will be almost completely covered with CO. lmmediately after switching the feed streams, oxygen cannot adsorb on the noble metal surface due to the high dagree of CO coverage. Since ceria is reduced by the CO containing feed stream its surface possesses a relatively large amount of oxygen vacancies (Jin et al., 1987; Oh and Eickel, 1988; Serre et al., 1993a) and therefore oxygen in the gas phase initially adsorbs on ceria after switching the feed streams. As no oxygen is present at the noble metal, the increasing C02 concentration can only be explained by the existence of an another route tor the C02 formation apart from the Langmuir-Hinshelwood reaction. Most probably oxygen at the noble metal-ceria interface reacts with CO adsorbed on the noble rnatal via the so-called bifunctional reaction path. The reaction path is considered bifunctional because ceria provides oxygen adsorption sites, while CO

TRANS/ENT KINET/CS OF THE CO OXIDATION OVER Pt/Rh/CeO;/y-A/20 3 99
only adsorbs significantly on the noble metal surface. As a result of the C02
formation via the bifunctional reaction path the 0 2 outlet concentration starts to decrease and vacant sites are created at the noble metal surface. Oxygen from the gas phase now also adsorbs on the noble metal and the Langmuir-Hinshelwood reaction takes place. The C02 formation proceeds-then via two parallel pathways: the Langmuir Hinshelwood reaction and the reaction between oxygen on ceria and CO on the noble metal. This leads to a taster decreasing 0 2 gas phase concentration. When the rate of C02 production bacomes smaller due to depletion of CO adsorbed on the noble metal, the oxygen concentration starts to increase and the noble metal bacomes more covered with oxygen. When all adsorbed CO has reacted the noble metal surface will be totally covered with oxygen adatoms and the C02 production stops. The ceria surface and the bulk of ceria will become more oxidized by oxygen in the feed stream and the 0 2 concentration relaxes to the steady state value. The relatively large time-scale of the C02 relaxation aftar 0 2 has reached the steady state is caused by desorption from ceria (Li et al., 1989a), and trom v-AIP3 (Lynch and Graham, 1990).
When switching trom the teed stream containing 0 2 to the one containing CO it takes about 0.8 s before CO is detected at the outlet After an induction time of 0.4 s the C02 concentration starts to increase. The global maximum of the C02
response coincides with the breakthrough of the CO concentration. Both CO and C02 relax to their final values without reaching the steady state.
Just before switching the feed stream to CO, the noble metal surface is completely covered with oxygen. The number of vacant sites will be smaller compared the beginning of the period t = 0 s, since oxygen desorption is negligible under the experimental conditions (Engel and Ertl, 1979). However, as it follows from Figure 5.1 , all CO fed to the reactor adsorbs on the catalyst aftar switching the feed streams. Probably, soma CO will adsorb on the oxidized ceria surface thereby creating carbonate like species (Jin et al., 1987; Li et al., 1989a), but this cannot explain the large induction time of the CO concentration shown in Figure 5.1. As discussed in Chapter 4, CO adsorption on Pt/y-AI20 3 is not inhibited by oxygen adsorbed on the noble metal. There exist sufficient evidence that CO adsorption on ceria promoted catalysts is similar to unpromoted catalysts (Oh and Eickel, 1988; Zatiris and Gorte, 1993). Therefore, it is reasonable to assume that most of CO adsorbs on the noble metal surface covered with oxygen adatoms and reacts with both noble metal oxygen and oxygen trom ceria via the bifunctional path.
When most of noble metal oxygen has reacted the C02 formation rate decreasas and the surface bacomes covered with CO. The gas phase concentration starts to increase but does not reach the inlet concentration of 0.5 vol% because of the reaction between CO adsorbed on the noble metal and oxygen trom ceria. The latter eausas an ongoing C02 formation even when there is no oxygen left on the
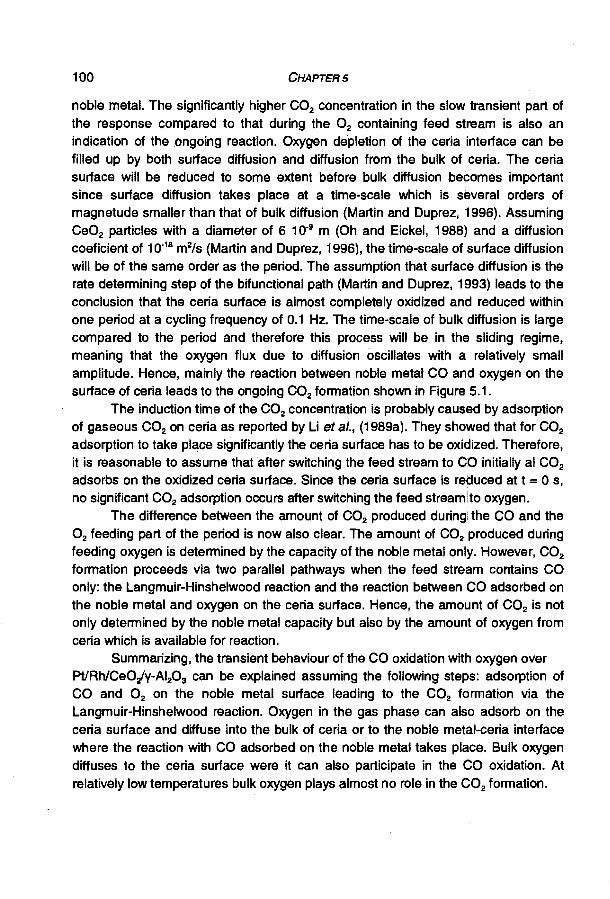
100 CHAPTERS
noble metal. The significantly higher C02 concentration in the slow transient part of the response compared to that during the 0 2 containing feed stream is also an indication of the ongoing reaction. Oxygen depletion of the ceria interface can be filled up by both surface ditfusion and ditfusion from the bulk of ceria. The ceria surface will be reduced to some extent before bulk ditfusion bacomes important since surface ditfusion takes place at a time-scale which is saveral orders of magnetude smaller than that of bulk ditfusion (Martin and Duprez, 1996). Assuming Ce02 particles with a diameter of 6 10·9 m (Oh and Eickel, 1988) and a ditfusion coeficient of 1 0'18 m2/s {Martin and Duprez, 1996), the time-scale of surface ditfusion will be of the same order as the period. The assumption that surface ditfusion is the rate determining step of the bifunctional path (Martin and Duprez, 1993) leads to the conclusion that the ceria surface is almost completely oxidized and reduced within one period at a cycling frequency of 0.1 Hz. The time-scale of bulk ditfusion is large compared to the period and therefore this process will be in the sliding regime, meaning that the oxygen flux due to ditfusion oscillates with a relatively small amplitude. Hence, mainly the reaction between noble metal CO and oxygen on the surface of ceria leads to the ongoing C02 formation shown in Figure 5.1.
The induction time of the C02 concent ration is probably caused by adsorption of gaseous C02 on ceria as reported by Liet al., (1989a). They showed that for C02
adsorption to take place significantly the ceria surface has to be oxidized. Therefore, it is reasonable to assume that after switching the feed stream to CO initially al C02
adsorbs on the oxidized ceria surface. Since the ceria surface is reduced at t = 0 s, no significant C02 adsorption occurs after switching the feed stream to oxygen.
The ditference between the amount of C02 produced during, the CO and the 0 2 feeding part of the period is now also clear. The amount of C02 produced during feeding oxygen is determined by the capacity of the noble metal only. However, C02
formation proceeds via two parallel pathways when the feed stream contains CO only: the Langmuir-Hinshelwood reaction and the reaction between CO adsorbed on the noble metal and oxygen on the ceria surface. Hence, the amount of C02 is not only determined by the noble metal capacity but also by the amount of oxygen from ceria which is available for reaction.
Summarizing, the transient behaviour of the CO oxidation with oxygen over Pt/Rh/Ce0Jy-AI20 3 can be explained assuming the following steps: adsorption of CO and 0 2 on the noble metal surface leading to the C02 formation via the Langmuir-Hinshelwood reaction. Oxygen in the gas phase can also adsorb on the ceria surface and diffuse into the bulk of ceria or to the noble metal-ceria interface where the reaction with CO adsorbed on the noble metal takes place. Bulk oxygen ditfuses to the ceria surface were it can also participate in the CO oxidation. At relatively low temperatures bulk oxygen plays almost no role in the C02 formation.

TRANS/ENT KINET/CS OF THE CO OXIDATION OVER Pt/Rh/CeO/v-A/20 3 101
Effect of temperature
In Figure 5.2 the responses of CO, 0 2 and C02 areshownat a temperature of 373 K. Compared to a temperature of 393 K, see Figure 5.1, the local maximum of the 0 2 concentration is higher aftar switching to the oxygen containing feed stream. This can be explained by assuming that a smaller amount of oxygen adsorbs on the ceria surface. The ceria surface will be less reduced at a lower temperature, as a result of the lower rate of C02 formation via the bifunctional path. Therefore, less vacant adsorption sites are available for oxygen to adsorb on.
0.80,-------------------,
~ 15 0.60 >
.......
5 ~.v ~ 0.40 '! ... ~ : 5 0.20 ! u
Flgure5.2
02 .. ,,",
4 6
time/s
co \ eJ;A t •
8
+
·~
10
CO, 0 2 and C02 outlet concentrations versus time durlng toreed cycllng of the co and 0 2 concentratlon. + = CO; A = 0 2; <> = co.- Conditfons: T = 373 K, f = 0.1 Hz and Table 5.1.
As a result of the lower rate of the reaction between adsorbed CO and oxygen at the ceria and of the Langmuir-Hinshelwood reaction C02 formation proceeds on a larger time-scala, as shown in Figure 5.2. The amount of C02
produced during feeding oxygen is smaller compared to Figure 5.1. This is an indication that not all adsorbed CO reacts. with oxygen within half a period and consequently less oxygen can adsorb on the noble rnatal surface. When comparing Figures 5.1 and 5.2 it is also clear that C02 desorption trom both ceria and y-AI20 3 is rather independent of the temperature.
The shape of the responses after switching the feed stream from 0 2 to CO is rather independent of the temperature. Compared to Figure 5.1 , the induction time of the CO response is smaller which can be explained by assuining that CO

102 CHAPTER5
adsorption is inhibited by CO already present on the noble metal surface as aresult of the relatively large time-scale of C02 formation. In contrast to Figure 5.1, the CO concentration in Figure 5.2 equals the inlet concentration at the end of the period. The ongoing reaction in the second half of the period at a temperature of 393 K was explained by oxygen supply mainly as a result of surface ditfusion. The time-scale of surface ditfusion will be comparable to the time-scale at a temperature of 393 K, as the temperature dependenee of surface ditfusion is rather small (Martin and Duprez, 1996). Clearly the reaction at the noble metal-ceria interface is the rate determining step of the bifunctional path at a temperature of 373 K, which is in: agreement with the behaviour after switching the feed stream trom CO to 0 2•
0.80.--------------------,
-;{< 15 0.60 > -§ ~ 0.40 .... ë B c: 8 0.20
Flgure5.3
~y-' 9 ' ? ·-.4'
' '. ' .....
2
02 .. f .. , ... """'"
4 6
time/s
8
i,, co A,..(
+
10
co, 0 2 and C02 outlet concentrat/ons versus time during toreed cycllng of the CO and 0 2 concentratlon. + = CO; .& = 0 2; <> = C02" Conditions: T = 453 K, f = 0. 1 Hz and Tabla 5.1.
Experiments conducted at a higher temperature show that oxygen ditfusion in the bulk of ceria is strongly dependent of the temperature. In Figure 5.3 the outlet concentrations at a temperature of 453 K are shown. Aftar switching trom CO to 0 2,
the 0 2 signal at the outlet initially remains zero. All oxygen adsorbs on the ceria surface and reacts with CO via the bifunctional path. The processas occur on a smaller time-scale at this temperature compared to a temperature óf 373 K as can be seen trom the steeper slope of the responses. As also shown in Figure 5.3, a significant extent of ditfusion of oxygen trom the bulk takes place at elevated temperatures since a large amount of co2 is produced when the feeds stream

TRANS/ENT KINET/CS OF THE CO OXIDATION OVER Pt!Rh/CeO/y-AI20 3 1 03
contains CO only.
Effect of freguency
As shown in Figure 5.4, the reactor is operated in the dynamic regime at a frequency of 0.5 Hz and a temperature of 453 K. The shape of the responses is similar to part of the responses immediately aftar switching the feed stream, shown in Figure 5.3. In contrast to a cycling frequency of 0.1 Hz, reaction always takes place at a frequency of 0.5 Hz. Clearly, there is always CO present at the noble metal surface which reacts with both oxygen on the noble metal surface via the
0.80,----------------------,
;!.. 0 0.60 > -5 1 o.40 .= ~ t:: f>. • (I) [ ó (.) ~"\ . 5 0.20 \i (.)
co
~ t.f A
~ !~~ r :~!' r~ .,. : ~·t 9 '& • i>+ .,
~ ., . f ' .. •. . t ·<? • : I' ó ·~ • : ~ 0 .'{ t'& , ., +o ' •~: • +'t • , '!, .1.'-.Wó .j.~' '. •\:' -~ ' ~ +· • 0 +' '"li
t'. ~ó +.;.' •• + •
_. ' + ' ;. ' + + ' • 1 ' . + ' .;. o.oooJ.oio-............. ..-.-...,;a.2 ___ ... 3~--•4...,....,.""""~s
time/s
Figure5.4 co, 0 2 and C02 outlet concentrat/ons versus time durlng toreed cycllng of the CO and 02 concentration. + = CO; .A = 0 2; <> = COr Conditions: T = 453 K, f = 0.5 Hz and Table 5. 1.
Langmuir-Hinshelwood reaction and with oxygen at the ceria surface via the bifunctional path. Probably the noble metal surface is also covered with soma oxygen because it is unlikely that. a large part of the surface remains unoccupied when the feed stream contains 0 2 only. The induction time of the CO concentratien is camparabie to the induction time in Figure 5.3, the induction time of the C02
concentratien is smaller. The latter is caused by the rather constant and relatively high degree of co2 coverage on the ceria which inhibits the adsorption of co2 trom the gas phase.

104 CHAPTERS
Comparison with the Pt/y-AI:J)3 catalvst
In Chapter 4 cyclic feeding experiments with a Pt/y-AI20 3 catalyst are discussed. The role of ceria becomes even more clear when camparing the dynamic behaviour of both catalysts. lt should however be noted that trom the CO chemisorption experiments, see section 2.3, it is clear that the specific noble metal adsorption capacity of the Pt/Rh/Ce0/'{·AI20 3 is larger than that of the Pt/y-AI20 3
catalyst. Therefore, the amount of C02 produced during feeding oxygen will not be the same tor both catalyst although the reactor contained approximately the same amount of catalysts. However, the role of ceria can be determined in a direct way by comparison of the results of the two catalyst since the shape of the individual responses contains most of the kinetic information. The amounts of C02 produced give information about the oxygen and CO adsorption capacity only.
As mentioned before, oxygen trom the gas phase not only adsorbs on the noble metal surface but also on the reduced ceria surface of the Pt/Rh/Ce0Jy-AI20 3
catalyst, and C02 formation proceeds via two pathways: CO adsorbed on the noble metal surface can react with noble metal oxygen and with oxygen trom ceria. In case of the Pt/y-AI20 3 catalyst oxygen adsorbs on the noble metal surfaGe only and C02
formation takes place via the Langmuir-Hinshelwood reaction. The local maximum of the 0 2 concentration immediately after switching the
feed stream trom CO to oxygen, see Figure 5.2, is lower compared to the Pt/y-AI20 3
catalyst, Figure 4.2, since oxygen adsorption on the ceria promoted catalyst proceeds on a smaller time-scale as a result of the vacant sites on ceria. In case of the Pt/y·AI20 3 catalyst, CO inhibition leads to a large time-scale of oxygen adsorption which explains also the induction time after switching the feed stream to 0 2• Furthermore, the parallel reaction pathways for the CO oxidation over the ceria containing catalyst lead to a relatively small time-scale of C02 formation after switching the feed streams. The oxygen concentration relaxes taster to the steady state value and the C02 concentrations increases taster.
The CO response as a result of switching the feed stream from oxygen to CO is similar tor both catalysts. As CO adsorption is not inhibited by oxygen initially all CO adsorbs on the noble metal surface. Both the taster C02 relaxation behaviour and the higher maximum in Figure 5.2 are a result of the two parallel reaction paths. The induction time of the C02 concentration in case of the Pt/Rh/Ce0/'{-AIP3
catalyst is caused by adsorption of C02 on the oxidized ceria surface.
5.2.3 Effect of C02 and H20
Automotive exhaust gas contains about 10% C02 and 10% steam. The

TRANSJENT KINET/CS OF THEE CO OXIDATION OVER Pf/Rh/CeO:fy-A/20 3 105
presence of co2 lowers the steady state co2 production rate whereas water is found to have a beneficia! effect on the CO oxidation activity (Campman, 1996). To study the influence of H20 and C02 on the CO oxidation under dynamic conditions toreed concentratien cycling experiments ware performed. The results of a typical experiment with both feed streams containing 10% C02 and H20, i.e. cyclic feeding of the CO and 0 2 concentratien only, is shown in Figure 5.5. lt should be noticed that the noise on the C02 signal is a result of the relatively small changes in the concentratien due to the cyclic feed compared to the feed concentration. Notice also that the right axis in Figure 5.5 begins at 9.9 vol%.
0.80..----------------,
2 4
Flgure5.5
6
tirnets
8 10
CO, 0 2 snd C02 outlet concentrat/ons versus time during foteed cycllng ofthe CO and 0 2 concentrat/on and 10% C02 and 10% H20 In the feed stream. Conditions: T = 393 K, f = 0. 1 Hz and Table 5.1.
Aftar switching from CO to 0 2, the 0 2 signal increases very fast and follows the inlet concentration. Compared to the results with a feed containing CO and 0 2
only, see Figure 5.1, the local maximum of the oxygen concentratien is much higher. The relaxation of the 0 2 and C02 the concentratien to the steady state proceeds on a smaller time-scale compared to the experiments without C02 and H20.
The observed behaviour can be explained as follows. Oxygen adsorption on ceria is initially blocked by the large amount of C02 present at the ceria surface (Herz 1981; Jin et al., 1987; Liet al., 1989a), due to the high C02 concentratien in feed. Probably the presence of hydoxyl groups on ceria as a rasuit of adsorption of water blocks also adsorption sites for oxygen (Sass et al., 1985; Padeste et al.,

106 CHAPTERS
1993). As a smaller amount of oxygen adsorbs on the ceria surface, the C02
formation via the bifunctional path bacomes less important and the CO oxidation activity decreases. The role of ceria becomes less pronounced and the behaviour of the Pt/y-AI20 3 catalyst is approximated. The small time-scale of the C02 relaxation is due to the absence of significant C02 adsorption as a result of inhibition by the large amount of C02 present on both ceria and the alumina support.
After switching from the 0 2 to the CO containing feed stream there is no induction time in co2 concentration. As mentioned before, co2 produced by reaction no longer adsorbs on ceria and is therefore immediately detected a' the outlet of the reactor.
Water is said to have a beneficia! effect on the CO oxidation activity (Campman, 1996). The relaxation of the CO concentration to the steady state proceeds on a smaller time-scale compared to the experiments without C02 and steam in the feed stream. Since C02 and water do not adsorb significantly on the noble metal surface (Engeland Ertl, 1979; Heras and Viscido, 1988, respectively), it is clear that the CO oxidation rate is higher when H20 is present in the feed stream. Campman (1996) assumed that the reaction between hydroxyl groups as aresult of H20 adsorption on ceria and molecular adsorbed oxygen on the ceria surface (Sass et al., 1986) leads to the formation atomie oxygen species. The latter are more reactive than molecularly adsorbed oxygen and react readily with CO on the noble metal which explains the rate enhancement by steam.
lt is not possible to calculate the amounts of C02 produced during the oxygen and CO part of the period due to the noisy signa! of C02, and therefore the oxygen and CO capacities cannot be determined. However, compared to the experiments without co2 and steam the co capacity has not changed since co2 and water do not adsorb on the noble metal (Engel and Ertl, 1979; Heras and Viscido, 1988, respectively). The oxygen capacity will besmaller as result of the adsorption of C02
and H20 on ceria.
5.2.4 Effects of cerium oxide on the time-average conversion
Under dynamic reactor oparation ceria is believed to increase the timeaverage conversions. During the net reducing cycle of the oscillation oxygen from bulk ceria participates in the reaction resulting in a higher· C02 production rate. During the net oxidizing part of the oscillation the bulk is replenishad with oxygen. Therefore, the oxygen capacity of ceria leads to a more appropriate oxygen stoichiometry during the oscillation rasuiting in a higher time-average conversion. In Figure 5.6 the time-average CO conversions at tour temperatures are shown as a tunetion of the frequency.

TRANSJENT KINET/CS OF THE CO OXIDATION OVER Pf/Rh/CeO:!y-AI,P3 107
The behaviour at a temperature of 373 K in the quasi-steady state regime, i.e. at sufficiently low frequencies, can be explained considering the amounts of C02
produced per second during the oxygen and during the CO feeding part of the period. Just before switching the feed stream to oxygen, the noble metal surface will be totally covered with CO. After switching over, the amount of C02 produced by the reaction between adsorbed CO and oxygen trom the feed is independent of the frequency and determined by the capacity of the noble metal only. Hence, the timeaverage co2 production during the oxygen feeding part of the period increases proportionally with the frequency. During the CO feeding half of the period the amount of C02 produced is not only determined by the noble metal capacity but also by the amount of oxygen adsorbed on the ceria surface. The C02 production per second is therefore higher and increases linearly as a tunetion of the frequency. Hence, in the quasi-steady regime at 373 K the time-average C02 production within one complete period increases linearly as a tunetion of the frequency.
433K: ,--~ ;
80 .. ~·.·."'. • • A "
473 K~ : .' 393 K 60 ' . '
Q ,..
: -/"
8.oo
Flgure5.6
+
0.50 1.00
frequency /Hz
373K
1.50 2.00
Time-average converslons as a tunetion of the frequency at tour temperatures: + = 373 K; tJ. = 393 K; .A. = 433 K; o = 473 K. Conditfons: Table 5.1.
When the reactor enters the dynamic regime the time-average conversion increases initially less than proportional as a tunetion of the frequency. In contrast to the quasi-steady state regime the noble metal surface is not completely covered with either CO or oxygen at the end of the relevant reactant feeding part of the period. The time-scales of the surface processas are of the sameorder as the period, and therefore the surface coverages do not reach the steady state within a half a period.

108 CHAPTER5
The amount of C02 produced during one complete period is now determined by ratio of the time-scale of C02 formation to the period. Since CO adsorption proceeds on a smaller time-scale than oxygen adsorption, the surface becomes more and more CO covered with increasing frequency. The resulting lower surface coverage of oxygen leads to a less than proportional increase of time-scale of co2 formation due to the non-linear behaviour of the reaction. Consequently, the time-average conversion increases also less than proportional as a tunetion of the frequency. Since the degree of the CO coverage increases as a tunetion of the frequency, oxygen adsorption is more inhibited and C02 formation via the bifunetional path becomes more important.
In the sliding regime, at relatively high frequencies, the time-average conversion decreasas with increasing frequency. The noble metal surface becomes even more covered with strongly adsorbed CO and the steady state surface coverage corresponding to the time-average feed composition ' is approached. During the whole oxygen feeding part period CO adsorbed on the noble metal inhibits the adsorption of oxygen and less C02 is produced by the Langmuir· Hinshelwood reaction. At a very high frequency, C02 formation proceeds via the bifunetional path only.
At a higher tempersture the time-average conversion increases taster but less than proportional as a tunetion of the frequency. In the quasi-steady state regime the amount of C02 produced during the half of the period the feed stream contains oxygen, is still determined by amount of adsorbed CO. The latter decreasas with increasing tempersture due to the lower steady state value of the surface coverage as a result of the activated CO desorption. However, significantly more C02 is produced during feeding CO as the amount of oxygen trom ceria which participates in the resetion increases. But, since the time-scale of bulk ditfusion is large compared to the period, the amount of C02 produced within half a period deeresse as a tunetion of the frequency. Therefore, the time-average conversion increases less than proportional to the frequency at a higher temperature.
In the sliding regime the time-average conversion becomes 1 00%. At an elevated tempersture the time-scale of the surface processas is much smaller than the period. The noble metal is always covered with bath CO and oxygen and C02
tormation always takes place leading to 100% conversion. Compared to the Pt/y-AI20 3 catalyst in case of the Pt/Rh/CeO:Iv·AI20 3
catalyst the time-average conversion increases taster as a funetion of the tempersture due to the extra oxygen capscity of the ceria addition. The ongoing resetion when the feed stream contains CO only results in a higher time-average conversion.

TRANStENT KINET/CS OF THE CO OXIDA TION OVER Pt/Rh/CeOjy-A/~3 1 09
5.3 Reaction mechanlsm
A reaction mechanism for the CO oxidation by oxygen over the Pt/Rh/Ce0jyAI203 catalyst based on the cyclic feeding experiments without C02 and steam is presented in Table 5.2. There exists sufficient evidence that the adsorption characteristics of CO and oxygen on alumina supported noble metal catalysts are not significantly modified by ceria (Oh and Eickel, 1988; Zatiris and Gorte, 1993). Therefore, it can be assumed that the monofunctional reaction path is similar to the
Tsble5.2 Resetion mechsnlsm for the CO oxldstlon wlth oxygen In the sbsenc:e of stesm on s Pt/Rh/CeO/v-AI.o, cstslyst •.
elementary reaction
1 co+ * ... co*
2 02 + * - 02*
3 02* + * - 20*
4 co* + o* - co2 + 2 *
5 co+ o* ... oco*
6 oco*- C02 + *
7 02 + D- 020
8 020 + D- 20o
9 co* + 02o - co2 + 0o + *
10 co* + 0o - co2 + o + *
11 C02 + 0o ... C03o
12 co2 +; .. co~
2CO + 02 - 2C02
*site on noble metal o site on ceria ; site on y-/Al20 3

110 CHAPTER5
mechanism over Ptly-AI20 3• Steps 1 to 6 reprasent the part of the reaction mechanism occurring on the noble metal surface as discussed in section 4.4.1.
Steps 7 to 1 0 reprasent the bifunctional reaction path due to the presence of ceria in the catalyst. At temperatures relevant for this study, oxygen adsorbs molecularly on ceria foliowed by dissociation (Sass et al., 1986; Li et al., 1989b). Sass et al., (1986) proposed that the reaction with CO proceeds via two parallel paths. CO adsorbed on the noble metal reacts with molecularly adsorbed oxygen, step 9 in Table 5.2, producing C02 and Oo, and with oxygen adatoms, step 10. The latter is potentially taster then the reaction between C02 and 0 2o. From the cyclic feeding experiments it is clear that C02 adsorbs significantly on an oxidized ceria surface, step 11 and on alumina, step 12.
At smalt P cofP 02 ratios, C02 formation via the Langmuir-Hinshelwood reaction wilt be the most important pathway, while at high PcofP02 ratios the route via the bifunctional path wilt become significant. The oxygen adsorption o~ the noble metal surface is then inhibited by the high dagree of CO coverage, teadingtoa relatively low Langmuir-Hinshelwood reaction rate.
The oxygen vacancies created at the ceria surface can either be tilled up by oxygen from the gas phase, step 7 or by ditfusion of oxygen trom the bulk of ceria.
5.4 Conclusions
Cyclic feeding experiments with CO and 0 2 showed that oxygen adsorbs on the ceria surface and reacts with CO adsorbed on the noble metal surface via a bifunctional path which occurs parallel to the reaction path for the CO oxidation on alumina supported catalysts.
At a low temperature the amount of oxygen on the ceria surface plays a role only, while at an elevated temperature oxygen ditfusion in the bulk ceria results in a significantly C02 formation when CO only is fed to the reactor. Ceria acts then as a starage component that releases oxygen under net reducing conditions and is tilled up with oxygen under net oxidizing conditions. The oxygen supplied by ceria leads to a higher time-average CO conversion.
Experiments with steam and C02 added to the CO and oxygen containing feed stream showed an enhancement of the CO oxidation rate. C02 in the feed stream adsorbs on the ceria surface and blocks adsorption sites for oxygen from the gas phase. The reaction via the bifunctional pathway bacomesthen less important rasuiting and therefore the role of ceria less pronounced.

TRANS/ENT KINET/CS OF THE CO OXIDATION OVER Pt/Rh/CeO;!v-A/20 3 111
Raferences
- Campman. M, Kinatics of carbon monoxide oxidation over supported platinum catalysts, The role of steam in the presence of ceria, Ph.D. Thesis, Eindhoven Univarsity of Technology, 1996
- Engel, T., Ertl, G., Elementary steps in the catalytic oxidation of CO on platinum metals, Adv. in Catalysis 28, 1-78, 1979
- Harrison, B., Diwell, A.F., Hallett, C., Promoting platinum metals by ceria, Platinum Metals Rev. 32(2), 73-83, 1988
- Heras, J.M., Viscido, L., The behaviour of water on metal surfaces, Catal. Rev.Sci. Eng., 30(2), 281-338, 1988
- Herz, R.K., Dynamic behavior of automotive catalysts. 1. Catalyst oxidation and reduction, lnd. Eng. Chem. Prod. Res. Dev. 20,451-457, 1981
- Herz, R.K., Kiela, J.B., Sell, J.A., Dynamic behavior of automotive catalysts 2. Carbon monoxide conversion under transient airlfuel conditions, lnd. Chem. Prod. Res. Dev. 22,387-396, 1983
- Herz, R.K., Sell, J.A., Dynamic behavior of automotive catalysts 3. Transient enhancement of water-gas shift over rhodium, J. Catal. 94, 166-174, 1985
-Jin, T., Okuhara, T., Mains, G.J., White, J.M., Temperature-programmed desorption of CO and C02 from Pt/Ce02• An important role tor lattice oxygen in CO oxidation, J.Phys.Chem. 91,3310-3315, 1987
- Kim, G., Ceria promoted three-way catalysts for auto exhaust emission control, lnd. Eng. Chem. Prod. Res. Dev. 21,267-274, 1982
- li, C., Sakata, V., Arai, T., Domen, K., Maruya, K., Onishi, T., Carbon monoxide and carbon dioxide adsorption on cerium oxide studied by Fourier-transform intrared spectroscopy, part 1.-Formation of carbonate species on dehydroxylated Ce02 at Room Temperature, J. Chem. Soc. Faraday Trans. 1
85(4), 929-943, 1989a - Li, C., Domen, K., Maruya, K., Onishi, T., Dioxygen adsorption on well-outgassed
and partially reduced cerium oxide studied by FT -IR, J. Am. Chem. Soc. 111, 7683-7687, 1989b
- Lynch, D.T., Graham, W.R.C., CO-oxydation on platinum: Variabie phasing of inputs during toreed composition cycling, AIChE J. 36, 1797-1806, 1990
- Martin, D., Duprez, D., Mobility of surface species on oxides. 1. lsotopic exchange of 180 2 with 160 of Si02, Al20 3, Zr02, MgO, Ce02, and Ce02-AIP3• Activatien by noble metals. Correlation with oxide basicity, J.Phys.Chem. 100, 9429-9438, 1996
- Nunan, J.G., Roberta, H.J., Cohn, M.J., Bradley, S.A., Physicochemical properties of Ce-containing three-way catalysts and the effect of Ce on catalysts activity, J. Catal. 133, 309-324, 1992a

112 CHAPTER5
-Oh, S.H.; Eickel, e.c., Effects of Cerium addition on CO oxidation kinatics over Alumina-supported Rhodium catalysts, J. Catal. 112, 1988,543-555
- Padeste, C., Cant, N.W., Trimm, D.L., The influence of water on the reduction and reoxidation of ceria, Catal. Lett. 18, 305-316, 1993
- Sass, A.S., Kuznetsov, A.V., Shvets, V.A., Savel'eva, G.A., Popova, N.M., Kazanskii, V.B., Luminescence and optical spectroscopie study of the interaction of palladium and cerium in catalysts, Kinet. Kata/. 26, 1411-1415, 1985
- Sass, A.S., Shvets, V.A., Savel'era, G.A., Povova, N.M., Kazanskii, V.B., Mechanism of the low-temperature oxidation of CO on applied mixed catalysts containing noble metals and cerium oxide, Kinet. Kata/. 27, 894-903, 1986
- Schlatter, J.C., Mitchell, P.J., Three-way catalyst response to transients, /nd. Eng.
Chem.Prod. Res. Dev.19, 288-293, 1980 - Serre, C., Garin, F., Belot, G., Maire, G., Reactivity of Pt/AI20 3 and Pt-Ce0/AI20 3
catalysts tor the oxidation of Carbon Monoxide by Oxygen I. Catalyst characterization by TPR using CO as reducing agent, J. Catal. 141, 1-8, 1993a
- Serre, C., Garin, F., Belot, G., Maire, G., Reactivity of Pt/AI20 3 and Pt/Ce0/AI20 3
catalysts tor the oxidation of carbon monoxide by oxygen 11. lnfluence of the pretraatment step on the oxidation mechanism, J. Catal. 141, 9-20, 1993b
- Summers, J.C., Ausen, S.A., Interaction of cerium oxide with noblel metals, J. Catal. 58, 131-143, 1979
- Su, E.C., Montreuil, C.N., Rothscild, W.G., Oxygen storage capscity of monolith three-way catalysts, Appl. Catal. 17, 75-86, 1985
- Yao, H.C., Vu Yao, Y.F., Ceria in automotive exhaust catalysts I. Oxygen storage, J. Catal. 86, 254-265, 1984
- Zatiris G.S., Gorte, R.J., Evidence fora second CO oxidation mechanism on Rh/ceria, J. Catal. 143, 86-91, 1993

6 SIMULATION OF AN AUTOMOTIVE EXHAUST
GAS CONVERTER
6.1 Introduetion
To prevent the emissions of harmful componentsin the exhaust of automotive engines, most cars are equipped with a catalytic converter, the so-called three-way catalyst, which is located in the exhaust pipa. The converter is usually a monolith, a blockof caramie material with saveral thousands of parallel channels. The channels are coated with an alumina washcoat which serves as support of the noble metals, usually platinum, rhodium and somatimes palladium, and considerable amounts of ceria as well as small amounts of additives.
Car and catalyst manufacturers put much effort in reducing theemission of pollutants to meet the ever more stringent standards. Both engine construction improvements and new catalyst developments are necessary to achieve ultra low emission vehicles. Optimisation of the existing catalysts is facilitated by knowledge of the underlying reaction kinetics, while insights obtained trom reactor modelling can be used to optimise the performance as a tunetion of the oparating conditions.
To allow simultaneously the oxidation of CO and hydrocarbons and the reduction of NO, a fuel control system is applied to keep the engine's exhaust gas composition close to the stoichiometrie value. The delay time in the feedback loop of the control system leads to an oscillating exhaust composition around the stoichiometrie point at a typical frequency of 1 Hz. Hence, in modelling the dynamic behaviour of the reactor under typical exhaust conditions, detailed kinatic models based on elementary steps have to be used, since the frequency of the oscillation is of the same order as the

114 CHAPTER6
turnover frequency of the occurring reactions and therefore no quasi~steady state approximation can be used.
In this chapter the catalytic converter is modelled under both steady state and dynamic conditions. The results of the simulations with a cyclic feéd will be used to calculate the effects of the oscillatlons on the time~average conversions.
6.2 Klnetlc model
6.2.1 Reactlon mechanism
In modelling the exhaust gas converter propane and propene are frequently used as model components tor hydrocarbons. However, they are not suited to simulate the behaviour under typical exhaust gas compositions as they do not affect the light-off tempersture of the CO Ol<idation and the NO reduction (Mabilon, et st., 1995). As reported in the literature, the presence of hydrocarbons in real exhaust gas retards the light-off of CO and NO (Mabilon et st., 1995}. In the modelling discussed in this chapter ethyne and ethene are used as model hydrocarbons. Ethyne is chosen since it is present in quantities (about 20 mol%, lmpels, 1987) that substantially retard the oxidation of CO and reduction of NO due to inhibltion (Mabilon et a/., 1995). Ethene is chosen as a representative tor all organic species except ethyne and methane because it is also present in relatively high quantities in exhaust gas (25 mol%, lmpels, 1987), and its ease of oxidation is similar to that of aromatics and oxygenated organic species. As methane is difficult to oxidise, it is often considered as inert with respect to exhaust gas treatment.
The kinatic model, see Tabla 6.1, for the reactions between C:O, 0~, NO, C2H4
and C2H2 was constructed trom literature data. Basically the steps invalving CO, NO and 0 2, denoted by pathways 01 to CJ:i, were taken from Oh et at. (1986). In pathway o1
the route tor the C02 formation via the CO oxidation with oxygen is given. Two different pathways lead to the N2 formation: the reaction of adsorbed nitrogen with adsorbed NO, a2, and the recombination of N adatoms, a3• Both ethene and ethyne oxidation ware basedon the workof Sant et at. (1989). They proposed two models tor the ethene oxidation: a model for low oxygen conditions which uses adsorbed CO as · an intermediate and a model for high oxygen concentrations which uses a direct pathway to the C02 formation. In the present kinatic model, ethene oxidation was based on the model for low oxygen concentrations, since ethene light~off typically occurs after ethyne and CO oxidation and therefore most of the oxygen has reacted. As data for ethyne oxidation were not available at all, the ethene oxidation model for high oxygen concentratien was applied for ethyne as it conversion is expected near the reactor entrance, before the conversion of the other components. The sticking probability of

SIMULATION OF AN AUTOMOTIVE EXHAUST GAS CONVERTER
Table6.1. 'Eiementary steps' and resetion pathways, indicated by the stoichiometrie numbers u. tor exhaust aas convers1on.
ka,~H4
C2H4 + 2 * ,. C2H4 ** ka,C:!H4
kN:!.I
NO* + N* - N2 + 0* + *
k/*.!0.1
C2H4 ** + 40* - 2CO* + 2H20 + 4*
k/*.!0.2
C2H2**** + 50* - 2C02 + H20 + 9*
1:o1: 2CO + 0 2 - 2C02
2:o2, o3: 2CO + 2NO- 2C02 + N,.
3:o4: C2H4 + 302 - 2C02 + 2H20
4:o5: 2C2H2 + 502 - 4C02 + 2H20
* stands tor catalyt1c s1te
01
2
1
0
0
0
0
2
0
0
0
0
2 2
0 0
2 2
0 0
0 0
1 2
2 2
1 0
0 1
0 0
0 0
115
0 0
3 5
0 0
1 0
0 2
0 0
2 0
0 0
0 0
1 0
0 2

116 CHAPTER6
ethene and the surface reaction rate constant kH20.2 of the model of Sant et al. (1989) for high oxygen concentrations were adapted, however, to describe the light-off data from Mabilon et al. (1995).
The global reactions shown in Tabla 6.1 correspond with the minimal number of reactions which has to betaken into account. From a mathematical point of view they can be regarded as a base tor the space including all possible reactions. The reaction between e.g. NO and C2H4 or C2H2 can also take place and is a linear combination of the global reactions given in Table 6.1, as wellas of the appropriate 'elementary steps'.
6.2.2 Rate equations
Adsorption of oxygen is assumed as irreversible and dissociative with a rata proportional to the fraction of vacant sites (Oh et al., 1986). In contrast to Sant et al. (1989) adsorption of both ethene and ethyne is also assumed to be first order in the vacant sites. The adsorption rate of component i (i= CO, 0 2, NO, C2~ or C21-\) is given by:
(6.1)
where the fraction of vacant catalytic sites is given by:
8, = 1 - 8co 80 - 8NO 8N - 8C2H4 8c2~ (6.2)
The fractional coverage e of the surface species is defined ~y the ratio of the sites occupied by a species to the total number of active sites. Hence, according to Tabla 6.1, for the adsorption of one molecule ethyne are tour vacant sites are needed, and tor one molecule ethene two vacant sites:
(6.3)
The adsorption rate coefficients are obtained trom the kinatic igas theory:
k . = _!_ ~ RT s.o a,, L 2nM 1
I I
(6.4)
where s1° is the sticking probability on a clean surface. The behaviour of the converter at low temperatures only is simulated (T <500 K),
i.e. just befare and after the light-off temperature of the components; hence the

SIMULA TION OF AN AUTOMOTIVE EXHAUST GAS CONVERTER 117
Table6.2 Klnetlc parameters and oorresponding reterences.
parameter value
Ä.J,co E 1)
d,CO
so 02
SNoo
Ad, NO
Ed,NO
so C2H4
Ad.<;H4
Ed.<;H4
so C2H2
Ad,C2H2
Ed.<;H2
~s Ediss
Aco 2
Eco2 A N2,1
E 2l N2,1
AN2,2
EN2,2
A~o.1 EH20.1
A s> H20,2
EH20,2
Js·,
/kJ mol·1
I-
I-Js·,
/kJ mot1
/-
Js•1
/kJ mol'1
/-
/s·1
/kJ mol'1
Js·1
/kJ mol·1
/s.,
/kJ mol'1
1.6·1014
112
0.01
0.5
5·1 013
108.7
0.35
1013
57.3
1
6.5·1013
115
3·1010
79.4
1012
60
2·109
87.8
120
62.7
1012
54.3
raferenee
Oh et al. (1986)
Oh et al. (1986)
Oh et al. (1986)
Oh et al. (1986)
Oh et al. ( 1986)
Oh et al. (1986)
Oh et al. (1986)
Sant et al. (1989)
Sant et al. (1989)
Sant et al. ( 1989)
Palmar (1977)
Sant et al. (1989)
Sant et al. ( 1989)
Oh et al. (1986)
Oh et al. ( 1986)
Oh et al. (1986)
Oh et al. (1986)
Oh et al. (1986)
Oh et al. (1986)
Oh et al. (1986)
Oh et al. (1986)
Sant et al. (1989)
Sant et al. (1989)
Oh et al. (1986)
Sant et al. (1989) 1> Oh et al., (1986) used for the CO desorption activation energy: 132 - 19 Beo - 42 eN
21 Oh et al., ( 1986) used for the recombination of N adatoms as activanon energy: 130-17 eN 3> The frequency factor for ethyne oxidation is increased trom 8·107 s·1 (Sant et al., 1989) to 1012 s·1 (Oh et al., 1986), reflecting the much higher oxidation rate of ethyne compared to ethene.

118 CHAPTER6
desorption rate of oxygen can be neglected (Engel and Ertl, 1979). The desorption rate of any other adsorbed species j 0 = CO*, NO*, C2H4 ** or C2~ ****) is proportional to the surface coverage and given by:
(6.5)
The rate of NO dissociation is expressed as:
r diss kdlssLt8No8. (6.6)
The rate of the surface reactions I (I = C02, N2, 1, N2,2 H20, 1 and H20,2, see Tabla 6.1) leading to the formation of C02, N2 and H20 respectively, is considered as proportional to the product of the involved surface coverages ex and Sy (x,y =CO*, 0*, NO*, N*, C2H/* orC2H2****}:
(6.7)
lt is clear from Equations 6.1, 6.3, 6.5 and 6. 7 that the corresponding 'elementary steps' in Tabla 6.1 are assumed to consist of a set of steps with a rata determining step invalving a single activa site.
Rate coefficients for desorption, dissociation and surface reactions are Arrhenius-type expressions. The kinatic parameter values and oorrasponding raferences as used in this study, are shown in Tabla 6.2.
As a kinatic model for both the CO oxidation and the NO reduction as well as the oxidation of hydrocarbons was not available, kinatic mode Is from the.literature for the reaction between CO, NO and 0 2 and for C2H2 and C2H4 oxidation have been used to model the exhaust gas converter. After adaptation of the sticking probability and the surface reaction constant of ethyne not only the experimental data van Mabilon et al., (1995) could be described but also the experimental data shown in Chapter 4. Therefore, instead of adapting the kinatic model presented in Chapter 4 to account for the oxidation of hydrocarbons and the NO reduction, a kinatic model based on literature data was used to model the converter.
6.3 Reactor model
6.3.1 Assumptions
The adiabatic model of the monolithic converter is based on the one-dimensional model reported by Lie (1992). For both the gas phase and the solid phase, only axial

StMULA TION OF AN AUTOMOTIVE EXHAUST GAS CONVERTER 119
concentratien and tempersture gradients are considered. Heat and mass transport
resistances are located at the interface between bulk gas phase and the washcoat, see also Figure 6.1. For the Sherwood and Nusselt numbers eerrasponding to these
processas the asymptotic values of 3.66 are taken. Denvation of mass and heat transfer coefficients trom these numbers is given in Appendix 6A. From comparisons
of this one-dimensional film model and the fundamental Graetz-Nusselt model, Leclerc
and Schweich (1993) concluded that the models are probably indistinguishable in
practica. More specifically, the model equations are based on the following assumptions:
- The radial velocity distribution is uniform. In practica the flow in the outer channels
might ba lower than in the inner channels due to a short divergent inlet of the monolith (Zygourakis, 1989; Eigenbergerand Nieken, 1991; Cybulski and Moulijn, 1994).
- The reactor operatas adiabatically, since the converter in the exhaust line is
thermally insulated.
- The walls of the channels are impenetrable to gas and all channels
have equal diameters. As a rasuit of these assumptions all channels are equal and ·model equations
tor one channel only have to be derived to
predict the behaviour of the monolith. Other assumptions are:
- Axial mass ditfusion and axial heat conduction in the gas phase is neglected,
since the Péclet number is larger than
50.
ceramic washcoat
Figure6.1 Actual profiles (dotted lines) as well as the assumed profiles (fulllines) in the chsnnels of the monolith.
- Axial mass ditfusion in the washcoat is neglected.
- The thermal conductivities of washcoat and caramie are equal. - The flow in the channels is laminar, since the Reynolds number is less than 300. Plug
flow behaviour is assumed nevertheless in view of the small channel diameter, since
radial profiles are flattened by molecular ditfusion (Taylor, 1953). - Entrance effects are neglected, as the hydrodynamic entrance length is only a
fraction of the totallength of the converter. - Pore ditfusion limitation is neglected (Hayes and Kolaczkowski, 1994).
- The gas is ideal with a constant average molecular mass, since the molar
concentrations of the reactive components are very low.
- Pressure drop is neglected, as it amounts toabout 1 kPa according to the Hagen
Poiseuille equation (Villermaux and Schweich, 1994).

120 CHAPTER6
Figure 6.1 shows the actual and the assumed profiles in the monolith channels.
6.3.2 Continulty equations
The model tor the converter consists of a set of continuity equations tor the reactants in the bulk gas phase and in the pores of the washcoat, as well energy equations for the bulk gas phase and the solid phase. Accumulation of mass on the catalytic surface is accounted for by continuity equations for the ads.orbed species. lt is not necessary to calculate the product concentrations since the continuity equations of the reactants are independent of them.
The continuity equation for reactant i (i =CO, 0 2, NO, C2H4, orC2H2) in the bulk gas phase is given by:
ep,.È..( c,,i) = _ <P:P .i.( c,,i) at p1 ax p1
where <Psup m =GlAs.
p~~" .a ( cf.i f"f,l V Pt
For reactant i in the pores of the washcoat it is given by:
4ed a ( c ·) ( C11 c ·) ewp!T at PS,I = Pt!<r.lav -p· - PS,I aca!Ri . b f f f
(6.8)
(6.9)
The. dependent variables. are expressed as C/p1 to correct for density changes as a tunetion of the axial coordinate due to non-uniform temperatures
The continuity equation for surface species j 0 =CO*, 0*, NO", N*, C2H/·*, or C2H2 ****) is given by:
a a. L-1 = R. 1 at 1 (6.10)
The enthalpy equations for the gas phase and tor the solid ph a se are given by:
ar, ep1c 1- =
P at (6.11)
(6.12)

SIMVLA TfON OF AN AUTOMOTIVE EXHAUST GAS CONVERTER 121
where rk gives the rates of the global reactions, see Table 6.1. The rate of the global
reaction between CO and oxygen r1 is calculated from the net CO disappearance rate due to sorption and the rate of the global reaction between NO and CO.
r1 = ra,co - rd,CO
r2 = ra,NO - rd,NO
r3 = ra.~H4 - rd.~H4 (6.13)
The heat production is calculated from the reaction enthalpies of the global reactions given in Table 6.1. This is allowed, since temperature oscillations due. to the
time dependent heat production as a result of the changing surface coverages are negligible (van Selow, 1996).
Boundary conditlans for the bulk gas concentrations are given by the inlet
concentrations:
Ct,1(0,t) = Ci~[1 + Bsin(2nft + $)] t ~ 0 (6.14)
where Q> = 0 tor CO, C2H2 and ~~. and Q> = n for ~ and NO, indicating that the former
and the latter oscillate in counter phase. For the gas phase temperature the boundary condition at the inlet is defined by:
(6.15)
while for the solid phase zero fluxes are assumed at the reactor in let and outlet
8T8(0,t) oT
8(l,t)
--- = 0, = 0 ax ax t ~o (6.16)
The initia! conditions are imposed by the assumption that the reactor operates in steady state before the feed asciilation starts. Hence, for the concentrations of
reactant i (i = CO, 0 2, NO, C2H4 , or C2~) in the bulk gas phase and in the solid phase
they are given by:
(6.17)
and for the surface coverage of species j ü =CO*, 0*, NO*, N*, C2H/*, or ~~ ****) by:
o~xs;L (6.18)

122 CHAPTER6
Initia! conditions for the bulk gas phase tempersture and the solid phase tempersture are:
(6.19)
The reactor parameters at a tempersture of 500 K are listed in Tabla 6.3.
Table6.3. Rell(;tor parameters at T = 500 K (Nieverge/d, 1994).
parameter value parameter value
e /m,3 mR-3 0.6 A. /mR2 6.0·10-3
<Pmsup /kg mR-2 s-1 5.83 Cpt /J kg-1 K-1 1.081·103
p, /kg mj3 0.68 Cps /J kg·1 K·1 1.015·103
Ps /kg m;3 2.5·103 Àt lW m·1 K'1 3.86·10"2
Sh,Nu 1- 3.66 Às lW m·1 K'1 1.675
kf.co• kf.o2 /m,·3 m;-2 s·1 0.18 a lW m;·2 K·1 141
kf.NO /m,-3 m;·2 s-1 0.21 ( -l\H)o, /J mol'1co 283·103
kr.c2H4 • kr,c2~ /m,-3 m;·2 s·1 0.14 ( -l\H)o2 /J moi·1No 373·103
Ew /m,3 mw-3 0.4 ( -àrH)a /Jmol-1 1322·103 3 C2H4
8v /m;2 mR-3 2.4·103 (-~H)a4 /Jmol-1 · CzHz 1254·103
db /mR 1.0·10"3 ~ /mol mNM ·2 2.7·10'5
dw /mR 2.5·10'5 acat /mNM2 mR·3 1.25·104
L /mR 0.15 B I· 0.15
Numerical methods
The model for the converter consists of a coupled set of partial and ordinary differential equations which is solved with the package POECOL (Madsen and Sincovec, 1979). The method implemented in this package is basedon the methods of lines and uses finite element orthogonal collocation tor discretization in the axial
direction. Piecewise polynomials (splines) are used as base functions. The intemal collocation points of the elements follow from the zeros of Legendra polynomials.
Application of the method of lines to the model equations transforms the partial

SIMULA TION OF AN AUTOMOTIVE EXHAUST GAS CONVERTER 123
differential equations to a (larger) set of initia! value ordinary differential equations. The latter is solved using the Backward Differentiation Formulae (BOF) with variabie order and variabie step size.
In solving the model equations the axial direction is divided into 40 elements and on each of these elements 4th order splines are used as base functions. Typical computation over a period of 10 seconds required 300 seconds of CPU time on a Silicon Graphics Power Challenge
6.4 Results and discussion
Both steady state and cyclic feeding simulations have been performed. The latter allow the calculation of the oscillatory effects on the time average performance. Timeaverage inlet conè'entrations and the corresponding equivalence ratio À, defined by the ratio (AlF) to (A/F)stoich• are given in Table 6.4. The inlet concentrations are derived trom the non-linear engine behaviour as a tunetion of the air/fuel ratio as reported by (Taylor and Sinkevitch, 1983). During all simulations the mass flow rate is kept at a typical
Table6.4 Equivalence ratio A and the cortesponding time-average inlet concentrat/ons
À co 02 NO C H "> x y À co 02 NO C H "> x y - vol% vol% ppm ppm - vol% vol% ppm ppm
0.94 1.41 0.32 637 615 1 0.5 0.48 1000 500
0.95 1.21 0.34 678 593 1.01 0.41 0.51 1088 485
0.96 1.03 0.36 727 572 1.02 0.33 0.54 1182 472
0.97 0.87 0.39 782 552 1.03 0.27 0.58 1280 461
0.98 0.73 0.42 846 534 1.04 0.22 0.62 1379 451
0.99 0.61 0.44 919 516 '} -CxHy - C2H2 or C2H4
value of 1 o-2 kg/s; the amplitude of all reactants is set at 15% of the time-average in let
concentratioris. The oxidizing reactants are oscillating out-of-phase with the reducing components, i.e. the phase shift betweenthem amounts ton.
6.4.1 Steady state
Figure 6.2 shows the light-off curves of all tour pollutants in the mixture. Ethyne
is oxidized first, foliowed by CO above 480 K: When most CO has reacted the

124 CHAPTER6
conversion of ethene and NO starts simultaneously. From this figure it is clear that the reactions take place in the sequence: C2H2 < CO< NO+C~4• Th is is also shown in Figure 6.3 in which the bulk gas concentrations and the concentrations in the pores of the washcoat as a tunetion of the axial coordinate at a feed temperature of 500 K are depicted. In the first part of the reactor ethyne is converted. When most ethyne has reacted, the CO oxidation starts foliowed by both the NO reduction and the C2H4
oxidation. As is clear from the oxygen profile, initially oxygen reacts with C2H2 and CO whereas the reaction with NO takes place after all C2H2 has reacted. Pattas et al. ( 1994) showed that 20% of the hydrocarbons
Flgure6.3 Concentrat/on versus axlal coordlnate at a feed tempersture of 500 K. Thln I/ne: bulk gas phase; thlck: I/ne pores of the washcoat. Conditions: A= 1, Tables 6.3 and 6.4.
.'i C,H, ' !
~--~480~--~4ro~~480~~~4oo~--~soo
leed temperature IK
F/gure6.2 Outlet concentrations versus feed temperature. Conditions: A= 1, Tables 6.3and6.4.
1.00 r--------------------------, .. ------
...:.. 0.80 ,' N 0
& lo.GO
I I
' ' ' 8
0.12
Flgure6.4
' ' ' 0.15
SUrfaJ:e coverage versus axlal coordlnate at a feed tempersture of 500 K. Conditions: A= 1, Tables 6.3 and 6.4.
are converted before the CO oxidation starts, which is in line with the alkyne oxidation as the alkyne content of exhaust gas is typical 20% of the total organics (lmpens, 1987). From Figure 6.3 it is also clear that significant mass transfer limitations are absent at this temperature, except for CO and 0 2 in the region of high conversion rates .. Furthermore it is also clear trom this tigure that the reaction between NO and C2H4
takes place significantly when most of CO, 0 2 and C2H2 is converted.

$/MULAT/ON OF AN AUTOMOTIVE EXHAUST GAS CONVERTER 125
The strict reaction sequence can be understood trom the corresponding axial surface coverage profiles shown in Figure 6.4. In the first part of the reactor mainly ethyne and CO compete tor the active sites and inhibit the adsorption of oxygen and ethene. There is also some NO adsorption and dissociation. After all C2H2 and CO has reacted, vacant sites become available tor the adsorption of C2H4 , and also more NO adsorption and dissociation can occur. The latter leads to a higher degree of nitrogen coverage only since the extra adsorbed oxygen due to NO dissociation reacts immediately with surface ethene. When almost all pollutants are converted, the surface becomes oxygen covered:
458.oo 0.03 0.15
axlal coordinate /m
Figure6.5 Tempersture of the gas and the solld phase versus axial coordlnate at tour feed temperatures. Dotted lines: gas phase; solid lines: solid phase. Conditions: A = 1, Tables 6.3 and 6.4.
In Figure 6.5 the axial temperature profiles of the gas and the solid phase are shown. The solid temperature is slightly, about 10K at most, higherthan the bulk gas temperature due to the heat of reaction. The maximum temperature rise across .the reactor equals the adiabatic temperature rise amounting to 94 K. At elevated feed temperatures the reactant conversions move more to the front part of the reactor and the temperature profiles become almost uniform over the entire lengthof the reactor.
6.4.2 Llght-off behavlour
A step increase in feed temperature trom 300 to 550 K causes reactor light-off. The evolution of the axial solid phase temperature profiles in the reactor are shown in Figure 6.6. lnitially the converter is heated by convective energy transfer only, so that the soliQ temperature is highest at the inlet. lt takes more than 120 seconds to approach the steady state temperature profiles shown in Figure 6.5 because of the large heat capacity of the solid phase.
Simulations performed without heat conductivity in the solid phase showed
Flgure6.6 Evolutlon of the axlal tempersture proflies of the solld phase alter a step lncrease of the feed tempersture trom 300 to 550 K. Conditions: A = 1 and Tables 6.3 and 6.4.

126 CHAPTERB
identical profiles to the ones in Figure 6.6. Leighton and Chang (1995) showed theoretically that the tempersture front during light-off is smoothed by an effective Taylor-Aris dispersion phenomenon. This apparent dispersion is significantly largerthan the solid thermal diffusivity of the ceramic converter and therefore heat conductivity of the solid phase plays no role during light-off.
Figure 6.7 shows the conversion of the pollutants as a tunetion of time as a result of a step increase of the feed tempersture from 300 K to 550 K. In this figure a similar i: conversion sequence of the pollutants is 1 60
visible as in Figure 6.2. When the ethyne ~ 40
conversion starting after about 10 s is considerable, the CO oxidation begins. After 50 s conversion of both NO and C2H4 is completed. At this point a steady state has not yet been reached since the tempersture
Figure 6.7
tirnets
in the second half of the reactor is still increasing, as shown in Figure 6.6. The first half of the reactor, however, has reached sufficiently high temperatures as to allow full
Converslons versus time aftera step lncrease of the feed tempersture trom 300 K to 550 K. Conditions: A = 1, Tables 6.3 and 6.4.
pollutant conversions, in line with the results in Figure 6.3. The shoulder in the NO conversion is caused by strongly increased NO adsorption when the CO oxidation is complete and more vacant sites becoming available.
6.4.3 Cycllc feeding
Figure 6.8 shows the gas phase outlet concentrations as a tunetion of time when the inlet concentrations are cycled at a typical frequency of 1 Hz. Since the oscillation is started trom the steady state, there is a transitiontoa stabie oscillation. The latter takes about 8 s and is not shown in Figure 6.8. The concentrations in the pores of the washcoat are not shown either but they asciilate in phase with the corresponding gas phase concentrations.
The amplitude of all concentrations except for 0 2 increases towards the outlet of the reactor. Hydrocarbons and CO concentrations remain in phase with the inlet, but the NO and oxygen outlet concentrations asciilate out of phase with respect to the in let concentrations. Ou ring the net reducing part of the period the minimum of the oxygen inlet concentration tums into a maximum as also reported by Lie et al. (1993) forthe CO oxidation with oxygen and by Nievergeld et al. (1995) for the reaction between CO, NO and oxygen. During the net oxidizing part the oxygen concentration shows a local

SIMULATION OF AN AUTOMOTIVE EXHAUST GAS CONVERTER 127
maximum. The minima of the outlet NO concentratien coincide with the global oxygen minima, but the NO maxima are shifted in time with respect to the oxygen maxima.
~ 0.30 <:
Figure6.8 Outlet concentrations versus time during 1 Hz cycling. Conditions: À = 1, 7i = 485 K, Tables 6.3 and 6.4.
1,QO,--------------,
';!; 0.75
~ !!! 8 0.50
~ i 0.25 ~
Figure6.9 Outlet surface coversges versus time during 1 Hz cycling. Conditions: À = 1, T, = 485 K, Tables 6.3 and 6.4.
The increase of the amplitudes can be understood from the outlet surface coverages shown in Figure 6.9. When the concentratien of the reducing components increases, mainly the higher degree of CO coverage leads to strenger inhibition of the other components. The resulting lower degree of coverages of NO, N and 0 causes lower reaction rates. In contrast, when the concentratien of the reducing components starts to decrease, the coverages of the strongly adsorbing components CO and C2H2
decrease also and more vacant sites become available. The resulting higher adsorption rates of NO, 0 2, and C2H4 lead to higher surface coverages of NO, C2H4 and N, the latter due to higher rate of NO dissociation, and corresponding higher surface reaction rates. The extra adsorbed oxygen reacts immediately with adsorbed CO and C2H4•
Hence, the out-of-phase asciilation of the reaction rates with respect to the CO, C2H4
and C2H2 gas phase concentrations leads to an increasing amplitude of the corresponding components as a tunetion of the reactor coordinate, while the in-phase asciilation with respect to oxygen leads to a smaller amplitude for 0 2. This effect is further enhanced by the counter phase asciilation of the oxygen/NO gas phase concentrations versus those of CO/hydrocarbons. When the surface coverage of the reducing components becomes very low the oxidation reactions stop and the degree of oxygen coverage increases. The surface becomes almost totally covered with nitrogen and oxygen adatoms and the 0 2 and NO gas phase concentrations start to increase.

128 CHAPTER6
6.4.4 Effects of cyclic feeding on the time-average conversions
Several experimental studies show that cyclic feeding leads to a higher time average performance (Schlatter et al., 1983; Taylor and Sinkevitch, 1983; Muraki et al., 1985). In general this is caused by the non-linear behaviour of the occurring reactions (Matros, 1989). To show the effects of the perturbations on the reactor performance, calculations with asciilating feeds have been performed for different temperatures, frequencies, and feed composition. The results are presented ·as a conversion impravement which can be either positive or negative and Is defined. by the difference of the time-average conversion during cyclic feeding and the steady state conversion.
Effects as a function of the tempersture and the freguency
In Figures 6.10 to 6.13 the conversion improvements are shown as a function of the tempersture at five frequencies. The conversion impravement 'for CO increases initially with increasing temperature. Above 480 K the impravement decreasas and bacomes negative, whereas at a tempersture of 490 K the time-average conversion equals the steady state value. Higher frequencies lead to lower time-average conversions for all temperatures.
Cycling of the inlet concentrations is not beneficia! for the NO conversion, as shown in Figure 6.11. Above 480 K the time-average conversions are lower than the steady state ones for all frequencies.
leed temperature IK
Figure 6.10 Time-average CO conversion Impravement due to cycl/ng of the In/et concentrat/ons versus feed temperature. Conditions A= 1, Tables 6.3and6.4.
i! 10
i e 0~----------~--------~ [ E ë ·10
i ~ ·20
-O.tHz ~ ~ • 1 Hz ...... 2 Hz
--- 4Hz -··-· 8Hz
~~~~~~~~7-~~~~~ 470 475 480 485 490
teed tempareture IK
Flgure6.11 Time-average NO conversion Impravement due to cycl/ng of the In/et concentrat/ons versus feed temperature. Conditions A= 1, Tables 6.3and6.4.

SIMULATION OF AN AUTOMOTIVE EXHAUST GAS CONVERTER 129
Figure 6.12 Time-average CJ-14 conversion Impravement due to cycling of the /niet concentrations versus leed temperature. Conditions A = 1, Tabfes 6.3and6.4.
-0.1Hz - • 1 Hz
2Hz --- 4Hz _ _, __ 8Hz
Flgure6.13 Time-average CJ-12 conversion Impravement due to cycling of the In/et concentrations versus feed temperature. Conditions A= 1, Tables 6.3and6.4.
The behaviour of the time-average C2H4 conversion as a function of the temperature, see Figure 6.12, is similar to that of CO, but shifted towards higher temperatures. The impravement initially increases but beoomes negative at an elevated temperature. The effects of the frequency are less pronounced than for CO, since higher frequencies lead to less impravement but also to less deterioration of the timeaverage conversion.
At low temperatures the time-average C2H2 conversion is slightly higher than the steady state conversion, Figure 6.13. Higher temperatures lead initially to lower conversions but at an elevated tempersture the steady state value is reached. Higher frequencies diminish the effects of the oscillations, leading to steady state conversions.
From Figures 6.10 to 6.13 it can be concluded that except tor NO, cyclic feeding is beneficia! at a tempersture below the lightoff of the individual components and that the cycling frequency should be relatively low. At low temperatures the strong inhibition of CO and C2H2 leads to small amplitudes of the surface coverage resulting in steady state conversions. At high temperatures cycling
~ 10
475 480 485 490
feed tamperature IK
Figure6.14 Time-average conversion lmprovements due to 1 Hz cycllng versus feed temperature. Conditions: A= 1, Tables 6.3 and 6.4.
effects become negative as a periodic shortage of either oxidants or reductants will

130 CHAPTER6
arise. At elevated temperatures the amplitudes of CO and C2H2 become zero, leading to complete conversions the whole period. As shown in Figure 6.4 the catalyst surface bacomes covered with oxygen when almost all pollutants are converted. At elevated temperatures high conversions take place in the most front part of the reactor and therefore the last part of the bacomes available for the starage of oxygen. During the net oxidizing part of the asciilation the excess of 0 2 and NO in the feed is stored on the catalytic surface. The oxygen adatoms as a result of adsorption and NO dissociation react with CO and hydrocarbons during the net reducing part of period.
The effects as a tunetion of the feed temperature are summárized for a typical frequency of 1 Hz in Figure 6.14. As mentioned before, cyclic feeding leads to higher time-average conversions compared to steady state oparation until the Ught-off temperature of the individual reactants is reached. Since the light-off 'temperatures are different for the individual reactants, the beneficia! effects do not coincide at any temperature, as depicted in Figure 6.14. The strict sequence in pollutant conversions, see Figure 6.2, causes improvements for components at a low conversion level and worse situations tor the others.
Effects as a tunetion of the feed composition
For a feed temperature of 500 K Figures 6.15 to 6.17 show the effect of the air/fuel ratio on the performance of the reactor during both steady state and cyclic feeding. The simulation results shown in these figures are in qualitative agreement with experimental results from the literature (Schlatter et al., 1983; Taylor and Sinkevitch, 1983; Muraki et al., 1985). As depicted in Figure 6.15, full conversion of all pollutants takes place at a stoichiometrie feed only - e. ·o- -
(equivalence ratio À = 1). At values of À -,$! o.ao o..: • ·c,H,
+'' .. above unity, i.e. net oxidizing conditions, 5 o.so
the NO conversion is reduced 1 ~0.40
tremendously. Ethene oxidation is also 8 .+:No
co.' . P · • , · C2H4
slightly reduced since ethene adsorption has to compete with oxygen for the vacant sites. Under net reducing conditions ethene is not converted since it is a much weaker competitor for oxidizing species than ethyne and CO. Under deeper net reducing conditions NO reduction is decreased since
its adsorption is inhibited by adsorbed CO and adsorbed nitrogen
0.20 ,.: .. 0.!18.94 ' 0.96 0.98 1'.00 1.02 1.04
equivalence ratiO /·
Figure6.15 Effects of air-to-fuel · ratio on the steady state average convers/ons. = C2H.,; + = CO; <> = C #I ;2 ö = NO. Conditions: T, = 500 K, Tables 6.3 and 6.4.

SIMULATION OF AN AUTOMOTIVE EXHAUST GAS CONVERTER 131
1.00 •Q. ~
0.80 co· ~ g 0.80
ï! 11> ~ 0.40 0 (J
1.04
Figure 6.16 Effects of air-to-fuel ratio on both the steady state and tllflll average conversions. Full llnes: cyclic feeding; dotted line: steady state. = C2H~ + = CO. Conditions: T1 = 500 K. f = 1 Hz, Tables 6.3 and 6.4.
1.00
0.80 . ·c2H2 A
~ g 0.80
1! 11> NO ~ 0.40 ...
020
o.oa.-94~--:"0.96,---~0...L.96,--~1-'-.oo~-1 .'-02~---'1 .04
equivalence ratio I·
Flgure 6.17 Effects of air-to-fuel ratio on both the steady state and tllflll average convers/ons. Fu/1 lines: cyclic feeding; dotteel llne: steady state. o = C2Hz: A = NO. Conditions: T, = 500 K. f = 1 Hz, Tables 6.3 and 6.4.
From Figures 6.16 and 6.17 it is clear that cyclic feeding is only beneticlal at nonstoichiometrie feeds where steady state converslons are far trom complete. For a net reducing feed, time-average ethene conversion is higher than the steady state conversion. Under deeper net reducing conditions cyclic feeding is beneficia! tor CO and ethyne. Under a net oxidizing feed composition time-average NO conversion is higher than the steady state one. Hence, at a feed tempersture of 500 K steady state oparation is preferabie and the so-called À-window should be as narrow as possible to obtain high converslons of all pollutants.
6.5 Conclusions
A dynamic model based on first principles is used to predict the behaviour of an exhaust gas converter as a tunetion of the process conditions. The simuiatien results are in qualitative agreement with the experimental results trom the literature and the experiments described in Chapter 4 of this thesis. The model of the converter can therefore be used in the optimisation of the reactor performance.
Steady state simulations show that first ethyne is converted, then carbon monoxide, and finally nitrogen oxides and ethene simultaneously. Cycling feeding can either improve or dateriorata the performance of the converter and the effects are strongly influenced by the process conditions, such as feed tempersture and composition, and the frequency. Below the light-off tempersture the conversion impravement of CO, C2H4 and ~~ increases with increasing temperature. Above the

132 CHAPTER6
light-off tempersture time-average conversions become lower than the steady state ones. Steady state reactor oparation at the stoichiometrie point leads then to the highest performance.
Light-off calculations show that it takes more than 1 00 seconds to warm-up the reactor completely, but after 50 seconds conversion of all components is completed. During the warming-up of the reactor axial heat conductivity of the solid plays no role.
Relerences
- Cybulski, A., and Moulijn, J.A., Monoliths in Heterogeneaus Catalysis. Cata/. Rev. -Sci. Eng., 36(2}, 179-270, 1994
- Eigenberger, G., und Nieken, U., Katalytische Abluftreinigung: Verfahrenstechnische Aufgaben und neue Lösungen. Chem.-lng.-Tech. 63(8}, 781-791, 1991
-Engel, T., Ertl G., Elementary steps in the catalytic oxidation of carbon monoxide on platinum metals, Adv. Catal. 28, 1-78, 1979
- Groppi, G., Belloli, A., Tronconi, E., Forzatti, P., A Comparison of Lumped and Distributed Modelsof Monolith Catalytic Combustors. Chem. Ehg. Sci. 17, 2705, 1995
- Hayes, R.E., and Kolaczkowski, S.T., Mass and Heat Transfer Effects in Catalytic
Monolith Reactors. Chem. Eng. Sci. 49, 3587-3599, 1994 -Heek, R.H., Wei, J. and Katzer, J.R., Mathematica! Modeling of Monolithic Catalysts.
AIChE J. 22(3), 477-484, 1976 - lmpens, R., Automotive Traffic: Risks for the Environment. In: Catalysis and
Automotive Pollution Control I, A. Frennet and J.-M. Bastin (Eds.). Eisavier Science Publishers B.V., Amsterdam, 11-30, 1987
- Leclerc, J.P., and Schweich, D., Modeling Catalytic Monoliths for Automobile Emission Controt Lasa, H.l. de, et al. (Eds.), Chemica/ Reactor for Environmentally Safe Reactors and Products, Kluwar Academie Publishers, 547-576, 1993
- Leighton, D.T., and Chang, H.C., A Theory for Fast-lgniting Catalytic Converters. AIChE J. 41(8), 1898-1914, 1995
- Lie, A.B.K.,Modellering van een monolietreactor toegepast als autouitlaatgaskatalysator. Graduation Report, lnstitute for Continuing Education, Eindhoven Univarsity of Technology, 1992
- Lie, A.B.K., Hoebink, ~I.H.B.J and Marin, G.B., The Effects of Oscillatory Feeding of CO and 0 2 on the Performance of a Monolithic Catalytic Converter of Automobile Exhaust Gas: A Modelling Study. Chem. Eng. J. 53, 47-54, 1993
- Mabilon, G., Durand, D. and Courty, Ph., lnhibition of Post-Cambustion Catalysts by Alkynes: A Clue for Understanding their Behaviour under Real Exhaust Conditions. In: Catalysis and Automotive Pol/ution Controllil 96 (Studies in

StMULA TfON OF AN AUTOMOTfVE EXHAUST GAS CONVERTER 133
Surface Science and Catalysis}, A. Frennet and J.-M. Bastin (Eds.). Elsevier Science Publishers B.V., Amsterdam, 775-788, 1995
- Matras, Y.S., Catalytic processas under unsteady-state conditions, Studies in surface science and catalysis, 43, Elsevier, Amsterdam, 1989
- Madsen, N.K., and Sincovec, R.F., PDECOL, General Collocation Software for Partial Differential Equations [03]. ACM Trans. Math. Softw. 5(3), 326-351, 1979
- Muraki, H.,Shinjoh, H., Sobukawa, H., Yokota, K. and Fujitani, Y.,Behavior of automotive noble metal catalysts in cycled feedstreams, lnd. Eng. Chem. Prod. Res. Dev. 24,43-49, 1985
- Nievergeld, A.J.L., Simuiatien and design of a catalytic monolith reactor for automobile exhaust gas conversion. Graduation Report, lnstitute for Continuing Education, Eindhoven Univarsity of Technology, 1994
- Nievergeld, A.J.L., Hoebink, J.H.B.J and Marin, G.B., The performance of a monolithic catalytic converter of automobile exhaust gas with oscillatory feeding of CO, NO and 0 2: a rnadelling study, Studies in Surface Scienèe and Catalysis 96, 909-918, 1995
- Oh, S.H., Fisher, G.B., Carpenter, J.E. and Goodman, O.W., Comparative Kinatic Studies of C0-02 and CO-NO Reactions over Single Crystal and Supported Rhodium Catalysts. J. Catal. 100, 360-376, 1986
- Palmer, R.L., Chemica! Reactions on Solid Surfaces Using Molecular Beam Techniques. US NTIS AD Report, A040579, 1977
- Pattas, K.N., Stamatelos, A.M., Pistikopoulos, P.K., Koltsakis, G.C., Konstandinidis, P.A., Volpi, E. and Leveroni, E., Transient Modeling of 3-Way Catalytic Converters. SAE Paper940934, 1994
- Reid, R.C., Polling, J.M. and Prausnitz, The Properties of Gases and Liquids. McGraw-Hi/1, New York, 587, 1987
- Sant, R., Kaul, D.J. and Wolf, E.E., Transient Studies and Kinatic Modeling of Ethylene Oxidation on Pt/Si02• A/ChE J. 35(2) 267-278, 1989
- Schlatter, J.C., Labaratory Reactor Systems for Three-Way Automotive Catalyst Evaluation. lnd. Eng. Chem. Prod. Dev. 22(1), 51-56, 1983
- v. Selow, E.R., Graduate Report, Design of a monolithic reactor for automobile exhaust gas conversion with improved light-off behaviour, lnstitute for Continuing Education, Eindhoven Univarsity of Technology, 63-65, 1996
- Siemund, S., Schweich, D., Leclerc, J.P. and Villermaux, J., Modelling Three-Way Monolithic Catalytic Converter: Camparisen between Simuiatien and Experimental Data. In: Cata/ysis and Automotive Pol/ution Controllil 96 (Studies in Surface Science and Cata/ysis), A. Frennet and J.-M. Bastin (Eds.). Elsevier Science Publishers B.V., Amsterdam, 887-896, 1995
- Taylor, G.l., Dispersion of soluble matter in solvent flowing through a tube, Proc. Roy. Soc.A219, 186,1953

134 CHAPTER6
• Taylor, K.C., and Sinkevitch, R.M., Behaviour of Automobile Exhaust Catalysts with Cycled Feedstreams. lnd. Eng. Chem. Prod. Res. Dev. 22, 45-51, 1983
• Villermaux, J., and Schweich, 0., Is the Catalytic Monolith Reactor Weil Suited to
Environmentally Benign Processing? lnd. Eng. Chem. Res. 33, 3025·3030, 1994 • Zygourakis, K. Transient Oparation of Monolith Catalytic Converters: A Two
Dimensional Reactor Model and the Effects of Radially Nonuniform Flow Oistributions. Chem. Eng. Sci. 44(9), 2075-2086, 1989

SIMULA TION OF AN AUTOMOTIVE EXHAUST GAS CONVERTER 135
APPENDIX SA
Calculation of Physical Coefficients
In rnadelling the converter, radial concentration, tempersture and velocity profiles
in the channels were approximated by the application of the asymptotic Sherwood and
Nusselt number. For fylly developed laminar flows in long cylindrical channels, two limit • cases tor the asymptotic Nusselt number Nuoo tor heat transfer are known: Nuw = 4.36 if the wall heat flux is constant, and NuT= 3.66 if the wall tempersture is constant. The
Nusselt number tor fully developed flow with constant wall tempersture is used in this
work; the asymptotic Sherwood number tor mass transfer follows trom the Reynolds analogy Sh = Nu. For significantly long monolith segments, working with asymptotic values tor Nusselt and Sherwood is adequate (Heek et al., 1976; Groppi et al., 1995; Siemund et al., 1995).
The binary ditfusion coetficient of component A in component B is calculated by
application of the method of Füller-Schettler-Giddings (Reid et al., 1987):
3.16·10-8T 1·75
( _1_ + _1_) 112
p,Jv ~13 + V~I3J MA Me (6A.1)
where vis the ditfusion volume in m3 mol·1, as given in Tabla 6A.1. The coetficients are
calculated tor ditfusion in nitrogen (component B in Equation 6A.1 ), i.e. there is no
correction made tor multi component ditfusion.
Table 6A.1. Ditfusion volumes in m3 mot' of some gases (Reld et al., 1987).
N2 18.5·10"6
co 18.0·10"6
02 16.3·10-6
NO 10.7·10-6
C2H4 41.0·10"6
C2H2 36.4·10-6
136 CHAPTER6
The mass transfer coefficient for reactant i (i = CO, 0 2, NO, C2H4, C2H2) is given by:
(6A.2)
Thermal conductivity of bulk gas phase is approximated by that of N2 and given by (lie, 1992):
A, =3.912·10-4 +9.798·1 o-5T8v9-5.06·1o-&-r!vg+ 1.501·10-11 T!,
9 [Wm -l K -1](6A.3)
As the Lewis number is close to 1 for all reactants, film thicknesses for heat and mass transfer are practically identical. The average tempersture in the film is defined by:
T = T, + Ts avg 2 (6A.4)
The heat transfer coefficient follows trom:
(6A.5)
where Nu~ = 3.66. The specific heat of the bulk gas phase is given by (Lie, 1992):
cpt = 1.055·103 + 0.197T1 + 4.94·10-4T12 1.88·10-7 T1
3 [Jkg-tK-1] (6A.6)
and of the solid phase (Oh and Cavendish, 1982):
cps = 1.071-103 + 0.156T8
- 3.435·107T5-2 [Jkg-1K-1] (6A.7)

7 MODEL PREDICTIVE CONTROL OF THE AUTOMOTIVE
EXHAUST GAS CONVERTER
7 .1. Introduetion
Nowadays, almost every new car sold in Europa is equipped with a catalytic converter in combination with a fuel control system to reduce the pollutants in the exhaust of gasoline engines. The applied converter enables the removal of CO, NO and hydrocarbons. To let these three reactions proceed simultaneously the exhaust gas composition is kept close to the stoichiometrie point by a fuel control system which controls the air·to·fuel ratio fed to the engine. As the delay time in the feedback loop of the system prevents the control algorithm of maintaining a stoichiometrie exhaust gas composition under all oparating conditions, the gas composition oscillates with a frequency typically between 0.5 and 10 Hz around the stoichiometrie composition. These oscillations may lead to higher time·average conversions as demonstraled in Chapter 6. However, to exploit the oscillatory effects on the performance of the converter fully, the frequency and the amplitude have to be settotheir corresponding optima! values. To maintain the optimum frequency and amplitude under all conditions a robust and stabie control system is required to control the air·to·fuel ratio. The currently applied control system cannot fulfill these demands as the oscillations are determined by the process conditions, e.g. the engine speed. Therefore, it may be beneficia! to replace the applied control system by a so·called Model Predictive Controller which can cope far better with delay times than a traditional feedback controller.
Furthermore, novel catalyst technologies require more sophisticated control

138 CHAPTER7
algorithms. Saveral studies were performed to explore the use of Pd as a possible reptacement for Rh. Palladium features both better light-off performance (Beek and Sommers, 1994) and better thermal stability as compared toPtand Rh, but only in combination with very tight air-to-fuel control (Taylor, 1994). As saveral other new developments focus on extemally heated converters (Oh et al., 1993) the temperature of the converters must be controlled carefully to ensure a long durability since overheating may lead to fast degeneration of the catalyst.
This chapter demonstratas the use of a Model Predictive Control schema in the strategy towards Ultra Low Emission Vehicles. The controller is based on the model of the catalytic converter, discussed in Chapter 6, and a simple model of the gasoline engine. Insection 7.2 some aspectsof model predictive control will be addressed first. The performance of the model predictive controller will be compared with the performance of a conventional controller.
7.2 Model predielive control
In this section some aspects of Model Predielive Control (MPC) will be discussed briefly. Fora more detailed description see Richalet et al. (1978), Garcia et al. (1989), Muske and Rawlings (1993) and Richalet (1993). To show the difference between a MPC and a conventional controller the latter will be discussed first. A basic representation of a conventional closed loop control system is given in Figure 7 .1. The controlled processcan be either a so-called SISO system, i.e. a system with only one input and one output or a MIMO system with multiple inputs and multiple outputs. Often notall inputs and outputs of a MIMO system are used in the controller. The controlled process outputs are called the controlled variables (CV's), while the inputs the controller adapts to keep the CV's at their setpoints are called the manipulated variables (MV's). The control objective is to keep the controlled variables at the setpoints in the presence of disturbances. To accomplish this, the controlled variables are subtracted from the corresponding setpoints and the errors are supplied to the controller which adapts the manipulated variables of the process in a way that reduces the deviation from the setpoints.
In Figure 7.2 the model predictive control diagram is shown. The so-called feed forward part of this controller consists of a model of the process which is used to predict the values of the controlled variables, while the feedback loop compensates for model errors and disturbances entering the process. The controlled variables are now compared with the model output and the error is fed to the controller. The controller uses the deviation between the model and the process in combination with the setpoints to calculate the new values of the manipulated variables. Tpis in contrast to a conventional controller which determines the values of the manipulated variables

MODEL PREDICTIVE CONTROL OF THE EXHAUST GAS CONVERTER 139
Figure 7.1
Dlaturbancea
Conilolied .. rlllblea f--,-----;~
Basic block diagram of a closet~ loop system.
using the deviation between the setpoints and the controlled variables. In steady state
the controlled variables have obtained the same values as the setpoints due to the
integrating behaviour of the MPC. This also means that the model outputs equal the
setpoints which is only the case if the controller behaviour equals the inverse steady
state model behaviour. The control algorithm calculates the moves llu of the manipulated variables
implemented to reach the setpoints by minimizing the objective function given by:
(7.1)
subject to the constraints on manipulated and the controlled variables:
Umln :> u(·) :> Umax• lllu(·)l :> ~ax• Ymln s y(·) :> Ymax (7.2)
Diaturbllncea
Controlled verleblea y
Setpoints y,:
Figure 7.2 Basic block diagram tor model predictive control.

140 CHAPTER7
where y is the process output, Ym the model output, b.u the so-called control moves, the changes of manipulated variables, p the prediction horizon, i.e. the number of samples the model outputs are calculated, and m the number of next control moves the controller calculates to drive the CV's to the setpoints. The first term of Equation 7.1 represents the error between the model outputs and the process outputs at the current time, where wy,l is the (time-dependent) weight penalizing the deviations trom the CV's. The second term of Equations 7.1 represents the so-called costs related to the moves of the manipulated variables. Large values of wu,1 lead to smaller values of b.u and hence to a less aggressive control action. So, the algorithm of the controller minimizes the error between the model output and the process output over a horizon of p sampling times by calculating m control moves of the manipulated variables. Although m moves are calculated, only the first one is implemented. At the next sampling interval, new values of the measured outputs are obtained, the control horizon is shifted forward by one step, and the same computations are repeated. This controllaw is referred to as moving horizon. The actions implemented in the feed forward control algorithm in case
of a SISO system are summarized in Figure 7.3. The controller tries to minimize the ditterenee between the model output and the process output, see Figure 7 .2, which is equivalent to minimizing the deviation from the setpoint.
paat future y,
-- ·-·-·-·-·-·-·-·-·-·-·-·::·:::·,::"'!#----"'-""-... ~---·-·-·-·-·-·-·......... -- ............. ~
-.- --
~~plingtlme
' ' ' '
11+111+2 k+ll
control horizon
predlction horizon
Flgure 1.3
y,.
k+m
Model based predlctlve controllaw.
k+p
time
Controller designs based on the MPC concept have found wide acceptsnee in industrial applications (Garcia et al., 1989). Model based controllers have the advantage over conventional types of feedback controllers to cope with delay times and with

MODEL PREDICTIVE CONTROL OF THE EXHAUST GAS CONVERTER 141
bounds on the manipulated variables reflecting real process constraints. A conventional controller will not detect a disturbance entering the process until after the delay time, and therefore the proper control action will betaken too late. For instance, in case of the exhaust gas converter the nowadays applied controller causes oscillatory behaviour as result of the relatively large delay time compared with the time scales of the process. Furthermore, the air-to-fuel ratio is constrained as the engine will not run properly when the deviation from the stoichiometrie value of 14.6 bacomes too large. As a classica! feedback controller, see Figure 7.1, reacts only after it has detected a deviation trom the setpoints, a model based control algorithm uses the information about the process dynamics to anticipate the effects of the disturbance on the output and to adjust the process inputs properly in order to keep the controlled variables at the setpoints.
Most often a model predictive controller uses a linear model to predict the values of controlled variables whereas the process itself may be nonlinear. Using a linear model to. predict the responses of a nonlinear process is allowed assuming a small region of oparating conditions around the steady state oparation of interest. MPC algorithms have been successfully used to control chemica! processes, which often exhibit both nonlinear steady state and dynamic behaviour (Richalet et al., 1978; Richalet, 1993). In case of highly nonlinear process behaviour in the surroundings of the working point the process is approximated by a linear system, whereas the nonlinear behaviour is handled with (statie) nonlinear transformations. When the assumption of linearity around the working point is allowed, the superposition principle can be applied. Hence, when the model describes the process response tor a given input signal it can be used to predict the responses to other input signals as well. However, nowadays much effort has been put in studying usability of nonlinear models in MPC controllers.
MPC algorithms often use a so-called black box model to predict the responses of the process over a given time horizon. This black box model describes the inputoutput behaviour in a pure mathematica! sense as the underlying equations are not based on physicallaws. An advantage of a black box model is the easy-to-solve model equations. This is very important when dealing with real time control as the goveming equations have to be solved within one fixed sample period. The black box model is obtained by an identification algorithm which adapts coefficients of the model in such a way to describe the process responses. The model identification is usually carried out perturbing the process. By monitoring the output responses after inducing changes to the inputs the relevant process dynamics, including the delay times when applicable, can be determined. As the control algorithm contains valuable information about the dynamics and the delay times of the process, a model based controller can raspond in a more dedicated way to disturbances and is therefore more robust than a conventional controller. For more information about the identification see Backx (1987) and Ljung (1987).

142 CHAPTER7
7.31dentification procedure
The process identification procedure used to develop the black box model of the model based controller can be divided into two parts, each with its own steps. Each step of the procedure is directed to obtain more detailed information about dynamic behaviour of the process in the surroundings of the working point of interest. The identification procedure consistsof a preliminary study, foliowed by.model estimation and validation (Backx, 1987; Backx and Damen, 1989). The subsequent steps will be discussed in more detail.
Preliminarv study
A first step in the preliminary study is the selection of the appropriate manipulated and controlled variables. The economics of the process, environmental legislation and critica! process oparation conditions determine the controlled variables. Manipulated variables are selected according to their different effects on the controlled variables. When manipulation of an input does not lead to measurable process responses then this input is not considered in the identification procedure. Inputs that cannot be manipulated but influence the controlled variables are called disturbance or feed forward signals. Disturbance signals which are measurable can be included in the identification and used for feed forward disturbance compensation; unmeasurable disturbance signals are compensated for by the feedback control.
Since the identification procedure is based on modelling the dynamic behaviour of the process with linear dynamic models, an important step of the preliminary study is the test if the amplitude ranges applied to the inputs are allowablé without violating the assumption of linearity around the operating conditions of interest. Totest the steady state linearity of the.process in the surroundings of the working point, astaircase signalis applied toeach input separately, see Figure 7.4. The time b!9tween the steps is chosen according to the charaderistic response time, which is related to the largast time constant of the process. For the analysis of the steady state linearity the process must reach a steady state for each step applied. As the separate steps have the same amplitude, the responses to the steps will have the same amplitude in case of a linear process. When the amplitudes of the responsestoeach step differ significantly, i.e. the process shows nonlinear steady state behaviour, a nonlinear transformation can be applied to the output of the linear model. The applied transformation approximates the steady state behaviour of the process, and the overall behaviour of the model will resembie the nonlinear process behaviour. More properties about the use of these transformations will be discussed insection 7.5.2. Furthermore, the responses of the process to the staircase signal enable an estimate of the charaderistic response time,

MODEL PREDICTIVE CONTROL OF THE EXHAUST GAS CONVERTER 143
which is required to define the duration of the input signals used in the next test step, and in the final estimation of the model parameters.
For the dateetion of dynamic nonlinearities and an impression of the bandwidth of the process, i.e. the :;
Q. smallest time constant of the process, .= a random input signal (noise) is often applied. In order to be able to determine the bandwidth of the process the input signal must cover a broad frequency spectrum, i.e. starting at the reelprocal of characteristic response time determined from the staircase experiments up to the reciprocal of the smallest time scale to be expected, to force the process to
Time
Flgure 7.4 Staircase input signa/ applied for steady state linearity analysis of a process.
enter the sliding regime. Significant changes in the cross-correlations functions of the input signal and the corresponding responses indicate dynamic nonlinearities.
Model estimation and validation
In the preliminary study the bandwidth and the region of linear process behaviour have been determined. Based on this information the input signals for the final parameter estimation can be constructed. The frequency range of the input signals must again cover the bandwidth of the process to obtain a model which describes the dynamic behaviour completely, whereas the amplitudes for each input must be in the estimated range of linearity, if necessary extended by the application of linearizing functions. The model parameters are estimated by means of nonlinear regression of the model equations with measured responses. For the validation of the model the responses to input signals not used in the regression are calculated and compared with the recorded real process responses.
7.4 Description of the process
The process to be controlled consistsof a gasoline engine in combination with the exhaust gas converter. The model of the converter, discussed in Chapter 6 is used to simulate the behaviour of a real converter, while the model of the engine is constructed from literature data (Taylor and Sinkevitch, 1983). The C2H4 and C2H2

144 CHAPTER7
concentrations of the model are calculated by dividing the reported total hydracarbon concentration by two. For sake ·of simplicity it is assumed that the exhaust
· gas composition changes instantaneously as a result of adaptations of the equivalence ratio À, meaning that a steady state model of the engine can be applied. The engine outlet concentrations as a
1.5o.-----------,o.2o
0.15
tunetion of À are depicted in Figure 7.5. ~
In Figure 7.6 the complete process ~
0.10 ~: (.)
is shown. The delay time .llt accounts tor c.l the residence time of the exhaust gas in
0g
the tailpipe between the exhaust manifold 0.50 and the converter and for the residence time of the air-fuel mixture in the inlet manifold of the engine. The exhaust gas mass flow rate and the converter feed tempersture are considered as feed forward signals, meaning that they have known values and inttuenee the outlet concentrations. The former is assumed to be constant meaning that the variations of the engine revolutions per second are
o.oa.~-5---'-~---'----'1.00'---"----'---'--.....J1.QR·00 equivalence ratio/-
Flgure 7.5 Englne outlet concentratlons versus equivalente ratio A.
very small compared with the mean engine speed; the latter will be included in the identification process so the effects of the feed tempersture on the outll:)t concentrations will be accounted for.
Before the identification is carried out the controlled variables, the feed forward variables and the manipulated variables have to be determined. As mentioned before T, will be regarded as a feed forward signa!. This means that there is only one degree of treedom left and hence only one outlet concentration can be controlled. The À-sensor of the currently applied control system in cars measures the oxygen concentration upstream of the converter and the signal of this sensor is used as a controlled variable; the composition of the air-fuel
Table 7.1 Process parameters and range of Input varlables.
G /kg s·, 0.01
.llt Is 0.1
À 1- 0.95 .. 1.05
T, /K 400 .. 510
mixture fed to the engine is the manipulated variable. In line with this system, the air-to-

MODEL PREDICTIVE CONTROL OF THE EXHAUST GAS CONVERTER 145
tuel ratio given by À is used as manipulated variabie in the MPC design. In contrast to the real system it is assumed that the oxygen concentration downstraam of the converter is measured and this value will be used as controlled variable. This enables the optimisation of the reactor performance as a tunetion of the air-to-tuel ratio. Hence, the control system adapts À so the oxygen outlet concentration is close to the desired value, the setpoint The parameters of the process and the range of the inputs are given in Table 7 .1. Both the mass flow G and the delay time ~t are set to values typical for normal engine operation. The teed temperature covers the temperature range from cold-start behaviour toa tully warmed-up converter, whereas À is in the range of allowed values tor proper oparation of the engine.
The models derived trom the identitication process will be used as the controlled process instead of the rigorous converter model discussed in Chapter 6 as the computational time decreasas substantially. This is allowed since the purpose of this chapter is to demonstrata the advantages of a model based controller compared with a conventional controller.
Process cout
H Englne ~ Converter ~§~ ................................................... ., ..................................... «•··· .............. .
Figure 7.6 Schematic drawlng of the process. 0"'1 = CO, 0 2, NO, C2H4 and C2H2.
7.51dentification results
7.5.1 Preliminary analysis
The outlet concentrations at three feed temperatures and the staircase input signal À are given in Figures 7.7 to 7.11. The duration of the steps is basedon the characteristic times of the outlet concentrations as a result of step changes of À. lt should be noticed that due to the engine characteristics, see Figure 7.5, the concentrations of the reducing components at the inlet of the converter decrease with increasing À, whereas the concentrations of oxidizing components increase with increasing À. From the figures it is clear that the process exhibits nonlinear behaviour

146 CHAPTER7
under some oparating conditions. At a feed tempersture of 470 K the steady state input-output behaviour of all components is rather linear. lt is reasanabie to assume that
tirnets
Flgure 7.7 A and CO outlet concentrat/on versus time at three leed temperatures. (-) = A; (--) = 470 K; (···) = 480 K; (-·-·) = 490 K.
5
Figure 7.9
10
tirnets
1.05
1,()3
A and NO outlet concentration versus time at three leed temperatures. (-) = A; (--) = 470 K; (···) = 480 K; (-·-·) = 490 K.
o.so.-------------, ~ 1.05
Figure 7.8 A and 0 2 outlet concentration versus time at three leed temperatures. (-) = A;(--)= 470 K; (· .. ) = 480 K; (····) = 490 K.
20
Rgure 7.10
...!..
~ 1.00 .c E !!!
A and C/14 outlet concentrat/on versus time at three leed temperatures. (-) = A; (--) = 470 K; (···) = 480 K; (-·--) = 490 K.
most of the nonlinear behaviour is caused by the kinatics of the oceurring reactions. The reaction rates are relativety low at a tempersture of 470 K and consequently there is little interaction between the gas phase and the catalyst surface. This means that the steady state input-output behaviour at low temperatures is mainly determined by the engine characteristics. At a higher tempersture the process cannot be considered as linear around the stoichiometrie value of À (À = 1) since the reactions praeeed at higher rates. The steady state behaviour is determined by the so-called gains only, see also

MODEL PREDICTIVE CONTROL OF THE EXHAUST GAS CONVERTER 147
(/. 0.040
~ :(
Ü
0
0.020- Lt., -, .
~·~-'
5
1.05
4i~op·-~-:-~·],., r-; · .. >- ~~:
1.03
10
tlme/s
Figure 7.11 A and C:!f2 outlet concentration versus time at three feed temperatures. (-) =A; (··) = 470 K; (-·) = 480 K; (···) = 490 K.
Chapter 3, which are given by the ratio of changes of an output to changes of an input in the surroundings of the working point. As the converter exhibits nonlinear behaviour the steady state gains are strongly dependent on the inputs as shown in the figures. For example, the steady state gains of CO and C2H2 are always negative, but the steady state gains of C2~ are negative for temperatures up to 480 K and become positive at a feed temperature of 490 K and À between 1.02 and 1.05. The NO outlet concentration at 490 K follows À for À > 1, but shows opposite behaviour for À < 1. The sign of the steady state gains of 0 2 changes saveral times as a tunetion of À for temperatures
1.50.------------..,
500
~ 1.00 ________ \ ~---------O:~!A7 ______________ : ~ u8
0.50 ... \_f : ~ . '•! 470 1-
'100 • .-- ""'~ 460 , IU>3 I
0.000 , , 2a'oo , ~~ I 6000
time /s
Rgure 7.12 Feed tempersture and CO outlet concentration versus time at three values of A. (-) = T,; (--) = 0.97; (··.J = 1.00; (---·) = 1.03.
0.60.-------------,
lime/s
Rgure 7.13 Feed tempersture and 0 2 outlet concentration versus time at three values of A. (-) = T,; (--) = 0.97; (- .. ) = 1.00; (---·) = 1.03.

148 CHAPTER7
above 470 K. This change of sign of the gains may lead to instabilities in combination with a feedback control system as the (stabilizing} negative feedback bacomes a positive feedback when the sign of the gain changes as tunetion of the oparating conditions. In the design of the control system special attention has to be paid to avoid changes of sign in the feedback loop.
0.25.------------,
0.20
0 i 0.15
!! 0.10 -:-------(.) ' ' ; ···: --- ----\ __r;,-;,--:- :··------.
0.05 ~ •1.00
500
0·00o'-' ~~-2-ooo._._...__~_4000.__...__~.....J6000
time/s
Figure 7.14 Feed tempersture and NO outlet concentrat/on versus time at three values of A. (-) = T,; (-) = 0.97; ( .. -) = 1.00; (-·-·) = 1.03.
o.oo.---~--------,
.... o"
(.) 0.02
0.97
'.t.OO
Figure 7.15
2000 4000
time/s
Feed tempersture and Czli4 outlet concentrat/on versus 1 time at three values of A. (-) = T,; (--) = 0.97; (· .. ) = 1.00; (-·--) = 1.03.
0.00.-------~----,
time/s
Figure 7.16 Feed tempersture and CzH2 outlet concentrat/on versus time at three values of A. (-) = T,; (--) = 0.97; (- .. ) = 1.00; (-·-·) = 1.03.
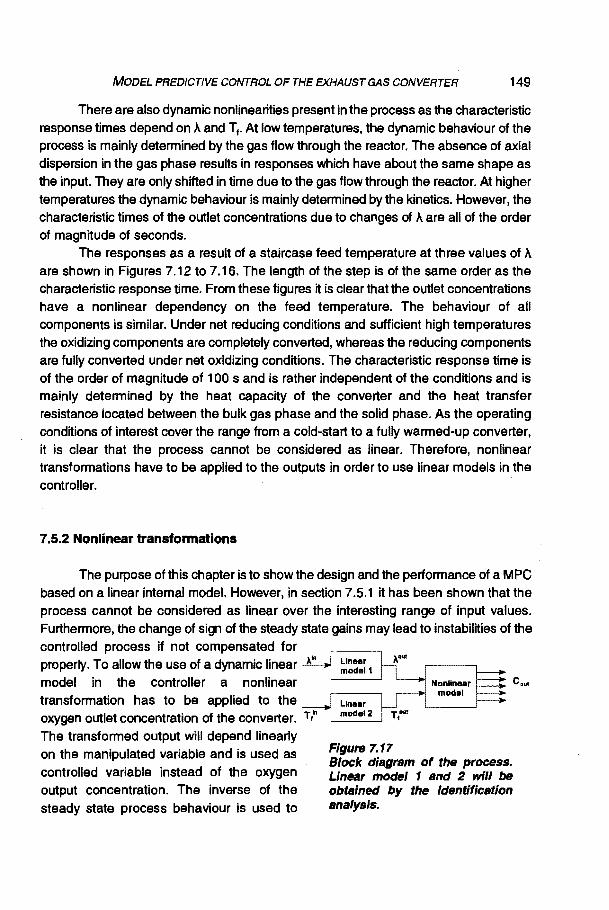
MODEL PREDICTIVE CONTROL OF THE EXHAUST GAS CONVERTER 149
There arealso dynamic nonlinearities present in the process as the characteristic response times depend on À and T,. At low temperatures, the dynamic behaviour of the process is mainly determined by the gas flow through the reactor. The absence of axial dispersion in the gas phase results in responses which have about the same shape as the input. They are only shifted in time due to the gas flow through the reactor. At higher temperatures the dynamic behaviour is mainly determined by the kinetics. However, the characteristic times of the outlet concentrations due to changes of À are all of the order of magnitude of seconds.
The responses as a result of a staircase feed tempersture at three values of À
are shown in Figures 7.12 to 7 .16. The length of the step is of the same order as the characteristic response time. From these figures it is clear that the outlet concentrations have a nonlinear dependency on the feed temperature. The behaviour of all components is similar. Under net reducing conditions and sufficient high temperatures the oxidizing components are completeiy converted, whereas the reducing components are fully converted under net oxidizing conditions. The characteristic response time is of the order of magnitude of 1 00 s and is rather independent of the conditions and is mainly determined by the heat capacity of the converter and the heat transfer resistance located between the bulk gas phase and the solid phase. As the oparating conditions of interest cover the range trom a cold-start to a fully warmed-up converter, it is clear that the process cannot be considered as linear. Therefore, nonlinear transformations have to be applied to the outputs in order to use linear models in the controller.
7 .5.2 Nonlinear transformatlons
The purpose of this chapter is to show the design and the performance of a MPC basedon a linear intemal model. However, insection 7.5.1 it has been shown that the process cannot be considered as linearover the interesting range of input values. Furthermore, the change of sign of the steady state gains may lead to instabilities of the controlled process if not compensated for properly. To allow the use of a dynamic linear model in the controller a nonlinear transformation has to be applied to the oxygen outlet concentratien of the converter. T,"'
The transformed output will depend linearly on the manipulated variabie and is used as controlled variabie instead of the oxygen output concentration. The inverse of the steady state process behaviour is used to
c ....
Flgure 7.17 Block diagram of the process. Unear model 1 snd 2 wil/ be obtslned by the ldentiflcstion anslys/s.

150 CHAPTER7
calculate the controlled variabie dependenee on the manipulated variabie À. The feed temperature dependency of the oxygen concentration is also linearized as T1 is used as feed forward in the controller and therefore this behaviour has to be accounted for. The input-output behaviour of the dynamic linear models in combination with the nonlinear transformation approximate then the nonlinear behaviour of the process, see Figure 7.17. First the steady state behaviour is determined by solving the equations of the converter in combination with the engine over the range of oparating conditions. This data will be used to derive a set of equations which describe the steady state behaviour of all outlet concentrations, since this model will be used to calculate the optima! values of À as a tunetion of the temperature, see section 7.7.
The steady state behaviour of the process is determined by calculating the outlet concentrations of the converter as a tunetion of the feed temperafure T1 and the equivalence ratio À. Equations 7.3 to 7.8 show the equations used to describe the steady state behaviour of the process. In Figures 7.18 to 7.22 the steady state outlet concentrations and outlet concentrations calculated using these equations as a tunetion of T1 and À are depicted. The first step in davaloping the transfonnations was the selection of the base function. Since the outlet concentrations are saturated for both low and high temperatures a tangent hyperbolic tunetion is most suited to describe the steady state outlet concentrations. This tunetion is shifted to positive values for the range of temperatures of interest by the introduetion of T 0, being a tunetion of both T1
and À, and of Ci and Ct, being the concentrations of component i at 400 and 510 K respectively. The À dependenee of both C1
1 and ct cannot be described by a simple tunetion and is accounted for by interpolation of the values of À given in Figures 7.18 to 7.22 using spiinas as base functions. The exponential tunetion in the argument of the tanh accounts for the asymmetrie steady behaviour of the outlet concentrations around T 0 , whereas parameter p determines whether the steepest descent is located at temperatures below T0 (p::-1) or above T0 (p=1). b1 and b2 are À dependent tuning parameters.
The outlet concentration i (i= CO, 0 2, and C2H2 (p=1 ), and NO and C2H4 (p=-1) is calculated using Equation 7.3, given by:
eh-cl Ci = Cil + I i (1+ptan~-b1(e-b2To_To)))
2 (7.3)
where C11 is the outlet concentration of component i at T1 = 400 K and C1
11 the outlet concentration at T1 = 510 K. As mentioned before, both C/ and c,n are a function of À.
Values of these parameters at intermediale values of À are determined by interpolation with spiinas as base functions. T 0 is given by:

MODEL PREDICTIVE CONTROL OF THE EXHAUST GAS CONVERTER 151
(7.4)
where T1 = 400 K. For i = CO, 0 2, C2H4 and C2H2 b1 and b2 are given by:
b, = 134 + 13sÀ (7.5)
(7.6)
The À dependenee of both b1 and b2 for i = NO cannot be described by a linear function, and is therefore given by:
(7.7)
(7.8)
The parameters ~. given in table 7 .2, are obtained by nonlinear regression of the steady state outlet concentrations of the process with Equations 7.3 to 7.8. In Figures 7.18 to 7.22 the outlet concentrations as a tunetion of the inputs À and T1 and the calculated concentrations using Equations 7.3 to 7.8 are shown and it can be concluded that the steady state process behaviour is described adequately by the model.
Table 7.2 Parameters of the nonlinear transformations obtained by regression of the outlet concentrations with Equations 7.3 to 7.8. Conditions see Table 7.1.
co 02 NO C2H4 C2H2
131 1- 5.5 103 3.1 103 -3.9103 3.5 103 2.7 103
132 1- -9.2 103 -4.8103 8.9 103 -5.6 103 -4.0 103
133 1- 4.2 103 2.1 10S -4.5 103 2.6 103 1.8 103
J34 1- -1.3 1Q2 -14.1 -1.3 103 42.2 6.2
J3s 1- 1.4102 18.6 2.7 103 -30 -3.3
13e 1- -58.1 -3.0 102 -1.4 103 -1.0 103 ·56.8
[3., 1- 65.6 3.2 1Q2 67.4 1.0 10S 72.1

152 CHAPTER7
1.50,.------------
1.20+--<---H-H+++H+++++++++++---....
~ 0.90,-""""' ............... """" ..... """"""""~
jo.so~~~ 0.30e o.o~oo~'---:42:;-;;o~-;440:;;---'---::460~~!Ji!!i~!Jiiiii"*
T,"'IK
Figure 7.18 Steady state CO outlet concentrat/ons of the process (tu/11/ne) and the model (symbols) versus feed temperature. Parameter A:+ :0.95; t:.: 0.96; o; 0.97,· •: 0.98; •: 0.99; v: 1; o: 1.01; 0: 1.02; •: 1.03; +: 1.05.
0.20,.----------------,
T1"'1K
Figure 7.20 Steady state NO outlet concentrations of the process (fu/1/lne) and the model (symbóls) versus feed temperature. Legend see Rgure 7.18.
T,"' /K
Figure 7.19 Steady state 0 2 outlet concentrat/ons of the process (fullllne) and the model (symbols) versus fHd temperature. Legend see Figure 7.18;
T,"'IK
Rgure 7.21 Steady state CJI4 outlet concentrations of the process (fullline) and the model (symbols) versus feed temperature. Legend see Rgure 7. 18.
The nonlinear behaviour of the oxygen outlet concentration as a tunetion of À and T1 is transforrned to two new variables À out and TfOOI (see Figure 7.17) using Equations
7.3 to 7.8. The linear models 1 and 2 will be obtained by the identification procedure
and they account tor the linearized dynamic behaviour of the 0 2 outlet concentration as

MODEL PREDICTIVE CONTROL OF THE EXHAUST GAS CONVERTER 153
T/''IK
Flgure 7.22 Steady state C,H2 outlet concentrat/ons of the process {fullline} and the model (symbols} versus feed temperature. Legend see Figure 7. 18.
a tunetion of either À in or Tt In the controller design À0111 will be the CV, whereas the corresponding outlet concentrations are calculated using Equations 7.3 to 7.8. lt is allowed to control À out insteadof the 0 2 outlet concentration as the concentration is a tunetion of À out, see also Figure 7.23. T1out is an intemal variabie of the model accounting tor the warming up dynamics of the reactor.
The influence of the feed tempersture
0.40.--------------, on the dynamic behaviour of Àout is not accounted tor in linear model 1 ; alllinearizing calculations are performed at a typical feed tempersture of 480 K. Since the oxygen ~
<!:0.20 outlet concentration as a tunetion of À is not 0 o
a monotonous function, see Figure 7.23, no inverse of this tunetion exists, and hence the calculation of À out trom the oxygen concentration is not straightforward. À0
ut is calculated by least square regression of the nonlinear process data with Equations 7.3 to 7.8. The corresponding values of Nn are used as initial values in the regression. T,out is calculated using the inverse tunetion of
0.10
0·0S.95':-:-~o:-:.9c:-7 ~-::o:-':.99:--'-----:-,_"'::-:o1~~,.03:::--'---:"".,_05
lambda/-
Flgure 7.23 0 2 outlet concentratlon versus A calculated uslng Eq. 7.3 to 7.8. T1= 480K.
Equations 7.3 to 7.8 where À equals one. Th is inverse tunetion is obtained by interpolstion of Àout at given 0 2 outlet concentrations by means of routine E01 BEF (NAG, 1995). The staircase oxygen concent ration depicted in Figures 7.8 and 7.13 is

154 CHAPTER7
used to calculate À001 and T1001 as a tunetion of time. This data is used in the
identification procedure.
7.5.3 Model estimation and validation
The purpose of the identification is to obtain dynamic models which describe both the manipulated and the feed forward variabie dependenee of the controlled ..:.. 1.01
variable. The calculated outputs using the -c
identification model, the inputs and the linearized outputs are depicted in Figures 7.24 and 7 .25. From Figure 7.24 it is clear that À001 still exhibits some nonlinear behaviour and this explains the discrepancy between the linear model and the process. The nonlinearity is probabty caused by nontinaar dynamic behaviour of the occurring
tlme/s
Figure 7.24 Am,~ (process and linear mode/1) versus time. T, = 480 K.
reactions. However, the delay time and the overall relaxation behaviour are described . adequately.
As shown in Figure 7.25,1inear model 2 describes the response of T,ou1 very well. The linear behaviour of T,ou1 can be explained assuming steady state surface species and hence steady state reaction rates. The dynamic behaviour of the outlet concentration is then almost completely determined by the heat capacity of the monolith and the rate of energy transfer from the gas phase to the solid phase. Since the inverse steady state behaviour is used to linearize the output the dynamic behaviour of T1°01 will be linearas well.
7.6 Controller design and performance
500
0 1000 5000 6000
tlme/s
Figure 7.25 T,m, T/"" (process and /inear mode/2) versus time. A = 1:
In this section a MPC controller for the exhaust gas converter is designed. To demonstrata the benefits of the MPC the performance wilt be compared with the

MODEL PREDICTIVE CONTROL OF THE EXHAUST GAS CONVERTER 155
performance of a proportional - integral (PI} controller. Most often a PI controller is applied to control the air-to-fuel ratio of the mixture fed to the gasoline engine of cars. As mentioned before, the models rasuiting trom the identification contain all relevant features of the real process such as the delay time and the same dynamic behaviour and therefore it is allowed to use them as the process to be controlled instead of the rigorous model. Once again it should be noted that there is only one MV, À1n, and one CV, À out, which is in line with real exhaust gas conversion. All calculations are performed in Matlab (Mathworks, 1992}, a software package especially developed tor control applications and signal analysis.
7 .6.1 PI controller
A discrete PI controller calculates the value u of the MV at time kTs (see also Figure 7.1} using:
(7.9)
where T s is the sampling period and eO} the deviation trom the setpoint at t = j seconds. The proportional gain K., and the inlegration time T1 are the tuning parameters of the controller. Most often such a controller is tuned by 'trial and error'; the test signal is usually a step change of the setpoint. The final closed loop response is a tradeoff between time to reach a new steady state and the overshoot. Large values of K., and/or small values of T1 lead to a more aggressive control action and more overshoot. When tuning the controller the integration time T1 is initially settoa very high value. By increasing
KP until the response to the step change of the setpoint does not show any overshoot the
1.02.---------------,
K•=0.034
value of the proportienat gain is determined. Next T1 is decreased until the step response t 1.0
1
exhibits an acceptable overshoot. As thè integral action of the controller eausas the manipulated variabie to change as long as an
- ' . /~... . ' / ','
->~' / K,. = 0.001
2
.. / .
error exists in the process output, such a controller can eliminate even small errors. However, in case of large delay times a
conventional (PI} controller will not act proparty to disturbances and setpoint
changes. For more details about applications
time/s
Flgure 7.26 Responses of the closed loop system wlth PI controller st three vslues of the proportlonsl gsin KP due to step chsnge of the setpoint. r, = 0. 7 s.

156 CHAPTER7
of PI controllers in combination with chemica! processas see Stephanopoulos (1984). In Figure 7.26 the closed loop step response tor three values of 1\, is shown. The
behaviour as a tunetion of r;·1 is similar. As can be seen trom this figure, a value of 0.034 leads to oscillatory behaviour of J..out, while a value of O.OQ1 results in slow relaxation behaviour. In the example discussed in this section 1\, is set to 0.017 and T1
to 0. 7 s. A large overshoof is accepted (see Figure 7.26) to ensure a relatively tast response of the closed loop system to setpoint changes and disturbances.
7 .6.2 Model predielive controller
The behaviour of the process with MPC is calculated using routine SCMPC trom the Matlab MPC tooibox (Morari and Ricker, 1994). Tuning parameters of the controller
1.02,.--------------,
w =1
11.01 -<
.!· . .,.-. .-=··----------,
: / w =10 '·"'- u
:j ".... w.=20
2 4 5
time/s
Flgure 7.27 Response of the closed loop system wlth MPC at three values of the welghts wu due to step change of the setpoint. Prediefion horizon: 0.5 s; control horizon: 0.25 s.
1.02,--------------,
Flgure 7.28 Manipuiated variabie i" of the closed loop system wlth MPC at three values ofthe weights wu due to step change of the setpoint. Prediction horizon: 0.5 s; control horizon: 0.25 s.
are the length of the prediefion horizon, the numbers of control moves within one control cycle (see Figure 7.3), and the weights of the control moves. The latter limit the absolute va lues of the changes of the MV, see also Equation 7 .1. Once again the response to a step change of the setpoint is used to determine the controller parameters by a 'trial and error' method. To allow the prediefion to reach the steady state the prediefion horizon should be longer than the largest time constant of the process (T = 0.4 s). When the prediefion horizon is too short the controller cannot correct for the last part of the response, which may lead to instabilities. Therefore, the
prediefion horizon is set to 0.5 s. The control horizon gives the number of moves the controller implements to reach the new setpoint, see also Figure 7.3, and is always

MODEL PREDICTIVE CONTROL OF THE EXHAUST GAS CONVERTER 157
shorter than the predietien horizon. Small ratios of control horizon to predietien horizon
result in a more aggressive control action, as the controller tries to move the CV to the setpoint within a shorter period of time. The control horizon is set to 0.25 s. In Figure 7.27 the step response at three values of the weight is depicted. A weight of 10 is chosen in the final tuning to obtain a campromise between a fast rasponding system and a not too aggressive control action, see Figure 7.28.
7.6.3 Comparison between the PI controller and the MPC
To demonstrata the advantages of a model predictive controller the response to a step setpoint change is compared with the response of the PI controller. In Figures 7.29 to 7.31 respectively the MV, CV and the 0 2 outlet concentration, are depicted for both the PI controller and MPC. As can beseen trom Figure 7.29, the MPC control action is more aggressive than the PI control action. The PI controller cannot be tuned more aggressively since the delay time of the process leads to oscillatory behaviour of the closed loop system tor large values of~ and/or small values of T1, see Figure 7.26. Since the MPC calculates the response to a setpoint change using its intemal model it does not have to wait until the CV changes as in case of the PI controller. The latter uses the error between the setpoint and the CV to deterrnine the moves of the MV, and hence can only raspond adequately after detecting the process response. Compared to the PI-controller the MPC based system reaches the setpoint within a much shorter period of time and without overshoot (Figure 7.30). Due to the delay time the control actionsof the PI controller leadtoa damped oscillatory response of the CV. This is line with the behaviour of a real exhaust control system as reported in the literature (Taylor
1.02r-----------------,
;: 1 /''{PI s· , I -< 'I
:/ PC
11)1.01,~··, ·-. ..--·
1.00:-~~---:-~~~~::--~-7--~-:. 0 2 3 4 5
tlmefs
Flgure 7.29 Manipulated variabie A'n tor the closed loop system wlth MPC and PI controller due to step change of the setpoint.
1.02r-----------------,
;: [.F_··/_,..,"P-1 "....--------1
I I
0 1 2 3 4
llme/s
Flgure 7.30 Responses of the closed loop system w/th MPC and PI controller due to step change of the setpoint.
5

158 CHAPTER7
and Sinkevitch, 1983). From these figures it is clear that the
MPC keeps the CV close to the setpoint. This means that oscillations can be induced with an optima! frequency to increase the performance of the reactor as described in Chapter 6 of this thesis. In Figure 7.31 the 0 2
outlet concentratien calculated using Equations 7.3 to 7.8 is shown aftera step change of the setpoint. The outlet concentrations of CO, NO C2H4 and C2H2
show similar behaviour.
time/s
Flgure 7.31 Responses of the 02 concentrat/on of the closed loop system wlth MPC snd PI controller due to step change of the setpoint.
7.6.4 Effects of model error on the performance ofthe MPC
In the MPC design discussed in sectien 7.6.2 the controlled process and the intemal model we re the same and hence there is no model error. T o show the effects of model errors on the performance of the MPC the steady state gain of the intemal
1.010
.:.. !: 1.005
! 1.000'
0~~~~-7~~--3~· ~~~--~
tlmets
Figure 7.32 Effects of model e«or on the step response of s closed loop system withsMPC.
. ,ss..., =0.8 1.010 ·"};.-. ( '\
.:.. ~ 1.005
\ss,...•1 ss...,= 1.2
1.000 0~~~~~2~--~3~--~~
tirnets
Figure 7.33 Effects of model e«or on the msnipulsted vsrlsble of s closed loop system wlth s MPC.
model of the controller is changed :1:20% and the response of the closed loop system is compared with the response without rnadelling error. As shown in Figure 7.32, the performance of the MPC decreasas by the introduetion of the model error. However,

MODEL PREDfCTIVE CONTROL OF THE EXHAUST GAS CONVERTER 159
the time to steady state is still much shorter than the response of the closed loop system with the PI controller, see Figure 7.30. When the steady state gain of the internat model is smaller than the gain of the process, the calculated value of "A;" to reach the setpoint using the intemal model is too large and consequently the value of controlled variabie "A out bacomes too high. The correction by the feedback loop takes place after detecting the increasing CV and this leads to a lower performance, see Figure 7 .33. When the gain of the model is larger than the process gain the calculated MV value is too small and the CV will not reach the setpoint. After the delay time the value of the MV is adapted and the output error bacomes zero.
7.7 Steady state optimizer
The nonlinear steady state model given by Equations 7.3 to 7.8 is used to calculate the optimal setpoints of NJUI. at a given temperature Ttut by weighted quadratic minimization of the outlet concentrations of the pollutants with respect to the parameter À0 ut. The weights W; for component i are chosen to obtain an equal contribution of all pollutants CO, NO and hydrocarbons in the objective function. Since the CO concentration in the feed of the converter is ...:.. 1,()2
1.04.-----------------,
1.03
a bout 10 times the concentration of NO and :s !. 1.01 hydrocarbons (C2H4 plus C2HJ see Figure 7.5, the weights are setto: w00 = 1, wNO = 10 and wHC = 10.
A cold start is simulated by inducing a step increase of Tt from 400 to 500 K. The optimal steady state setpoints of À001 are calculated every second and sent to the MPC. Figure 7.34 shows the optima! setpoints as a tunetion of time. The feed forward setpoints, based on the feed forward signals of the
1.00 . ' leed forward
• ~~0~~~~-~~~~~~~-~~100
time/s
Rgure 7.34 Optima/ setpoints and the feed forward setpoints of Aout versus timeaftera step change of T,"' trom 400to500K.
currently applied control system, are shown as well. These are constructed using the following assumption: When the engine's temperature is relatively low it is running on a rich mixture ("A < 1 ). At a higher temperature the air-to-tuel ratio is increased to obtain the stoichiometrie value at an elevated temperature. As shown in this tigure the optima! air-to-tuel ratio ted to the engine is switched trom rich to lean at t = 45 s. This causes the oxidation reactions to proceed at a higher reactîon rate leading to tast decreasing outlet concentrations of both CO and hydrocarbons, see also Figure 7.35. When camparing the outlet concentrations with feed forward and optimizer setpoints, Figures 7.35 and

160 CHAPTER7
7 .36, it is clear that switching the air-fuel mixture to lean tor a short period ignites all oxidation reactions simultaneously whereas in case of the feed forward signal the pollutants are converted in the same sequence as discussed in Chapter 6. The reduction of NO proceeds at a relatively low rata tor t > 45 s since the reducin~ components are almost completely converted.
The performance impravement due to the optimizer is calculated by integrating the outlet concentrations in time and camparing the cumulative .emissions of the pollutants in both cases. For CO and C2H4 the relativa impravement equals 15%, for C2H2 5% and for NO 1%.
0.60,-----------------,
co
i: 0.40
~
~ 0.20
75 100
Flgure 7.35 Outlet concentrat/ons versus time when applylng the optima/ setpoints atter a step change of T,'" trom 400 to 500K.
7.8 Concluslons
0.60,-----------------,
co
Flgure 7.36 Outlet concentrat/ons versus time when applylng th• feed forward setpoints after a step change of Tl" trom 400 to 500 K.
In davaloping a model based controller of the exhaust gas converter nonlinear transformations can be applied to account for the nonlinear behaviour of the process. A linear model can then be used to control the process over a broad range of oparating conditions in spite of the nonlinear behaviour.
The closed loop behaviour of the engine plus the exhaust gas converter in combination with a model based controller leads to a fast rasponding system to setpoint changes without causing any overshoot. A PI controller based system introduces oscillations as a result of the delay time present in the feedback loop. However, to obtain a fast rasponding closed loop behaviour to setpoint changes the intemal model of the controller must describe the process adequately. But, a model error of 20% stillleads to higher performance than a PI controller.

MODEL PRED/CTJVE CONTROL OF THE EXHAUST GAS CONVERTER 161
The steady state model of the converter can be used to calculate the optimal setpoints of the air-to-fuel ratio during a cold-start. By switching the feed mixture of the engine trom rich to Jean for a short period only, all oxidation reactions ignite simultaneously leading to lower emissions of the pollutants.
Reierences
- Backx, A.C.P.M., ldentification of an industrial process: A Markov parameter approach, Ph.D. Thesis, Eindhoven Univarsity of Technology, 1987
- Backx, A.C.P.M., Damen, A.A.H., ldentification of industrial MIMO processas tor fixed controllers, Part 1 General theory and practica, Joumal A 30, 3-12, 1989
-Beek, D.D., Sommers, J.W., Impact of sulfur on three-way catalysts: comparison of commercially produced Pd and Pt-Rh monoliths, Preprints of the Third /ntemational Congress on Cata/ysis and Automotive Polfution Control (CaPoC3), 147-159, 1994.
- Garcia, C.E., Prett, O.M., Morari, M., Model predictive control: Theory and practica -a survey, Automatics 25(3), 335-348, 1989
- Ljung, L., System identification: Theory for the user, Prentice-Halllnformation and system sciences series, 1987
- Matlab, High performance numeric computation and visualization software, Raferenee Guide, The Mathworks, 1992
- Morari, M., Ricker, N.L., Model predictive control toolbox, The Mathworks lnc., 1994 - Muske, K.R., Rawlings, J.B., Model predictive control with linear models, AIChE J.,
39(2), 262-287, 1993 - NAG Fortran Library Manual, mark 16, volume 1 , 1995 -Oh, S.H., Bissett, E.J., Battison, P.A., Mathematica! rnadeling of electrically heated
monolith converters: Model formulation, numerical methods, and experimental verification, lnd. Eng. Chem. Res. 32, 1560-1567, 1993
- Richalet, J., Rault, A., Testud, J.L., Papon, J., Model predictive heuristic control: Applications to industrial processes, Automatica 14, 413·428, 1978
- Richalet, J., lndustrial applications of model based predictive control, Automatics,
29(5), 1251-1274, 1993 - Stephanopoulos, G., Chemica! process control: An introduetion to theory and practica,
Prentice-Halllntemational Editions, 1984 - Taylor, K.C., Sinkevitch, A.M., Behaviour of automotive exhaust catalyst with cyclic
feed streams, lnd. Eng. Chem. Prod. Res. Dev. 22, 45·51 , 1983. - Taylor, K.C., Nitric oxide catalysis in automotive exhaust systems, Catal. Rev.-Sci. Eng.
35(4) 457-481' 1994

162 CHAPTER 7

8 GENERAL CONCLUSIONS
The work presenteel in this thesis focused on the transient kinetics of the catalytic oxidation of CO over supported platinum catalysts. Cyclic feeding experiments were carried out under conditions relevant tor exhaust gas treatment in practica. Furthermore, the effects of cyclic feeding on the performance of the converter used tor exhaust gas treatment were investigated and a model based controller of the converter was developed.
A frequency response analysis with respect to continuous flow reactors showed that cyclic reactor oparation reveals more kinetic information than steady state operation. Due to the absence of mixing in the fluid phase the outlet concentration of a plug flow reactor contains more kinetic information than that of a continuous stirred tank reactor.
From cyclic feeding experiments with a Pt/y-AI20 3 catalyst it was tound that 0 2
adsorption is strongly inhibited by adsorbed CO. An elementary step model based on the assumption that molecular adsorption of oxygen is foliowed by instantaneous dissociation describes adequately the responses as a result of admitting oxygen to a CO covered catalytic surface. In contrast, CO was tound to adsorb on a catalytic . surface completely covered with oxygen adatoms. In order to describe the experimental data after admission of CO to an oxygen covered surface, CO adsorption on a catalytic site al ready occupied by an oxygen adatom was assumed. The experimentally found interaction of C02 with the support was accounted tor by reversible adsorption. All kinatic parameters of the elementary step kinetic model we re determined by means of nonlinear regression.
Cyclic feeding experiments using a commercial Pt/Rh/CeO/v-AI20 3 catalyst suggest the existence of an another route converting CO into C02: the bifunctional path.
164 CHAPTER8
Here oxygen on the ceria surface reacts with CO adsorbed on the metal-ceria interface. From the experiments lt was also found that ceria acts as a starage component releasing oxygen under net reducing conditions and filling up with oxygen under net oxidizlng conditions. Oxygen trom the ceria bulk is involved in the reaction at higher temperatures only. The oxygen supplied by ceria leadstoa higher'time-average CO conversion compared to a Pt/y-Al20 3 catalyst. Steam was found to enhance the C02
production rate, whereas the presence of co2 in the feed stream leads to a less pronounced contribution of the bifunctional path to the co2 formation by blocking adsorption sites on the ceria surface. Based on the experimental results an elementary step reaction mechanism was introduced taking into account this bifunctional path.
In order to study the effects of cyclic feeding on the performance of a catalytic converter applied in exhaust gas treatment an adiabatic model considering the reduction of NO and the oxidation of CO, C2H4 and C2H2 by 0 2 was used. The simulations demonstrata that cyclic feeding leads to higher time~average converslons compared to the steady state conversions. However, the improved performance is a strong tunetion of the oparating conditions. Below the light-aft temperature cyclic feeding leads to higher time-average conversions, while above the llght·off temperafure steady state oparation leads to the highest reactor performance. Steady state simulatlons show that the pollutants are converted in the reactor in a fixed sequence: first ethyne, then carbon monoxide, and finally nitrogen oxide and ethene simultaneously.
A black·box model was developed for the combination of the engine and the converter. For the engine a model publishad in the literature was u&ed, while for the converter the model developed in this study was utilized. The black-box model was used in a model predictive controller schema. Since this controller is based on a .linear model the nonlinear process behaviour was linearized by means of nonlinear transformations. The performance of the model predictive controller was compared with the performance of the usually applied proportional • integral controller. The model predictive controller enables a tast reacting closed loop response to setpoint changes without causing any overshoot, whereas the proportional ~ integral controller leads to oscillatory behaviour of the closed loop system. A steady state optimizer was used to calculate the optima! air-t~fuel ratio of the mixture fed to the engine during a cold-start. At low converter temperatures a slightly rich feed of the engine leads to the lowest emissions. Switching the feed of the engine to laan for a short period of time only is suftielent to ignite the oxidation reaction simultaneously leading to a reductlon of the emissions of the pollutants.

DANKWOORD
In tegenstelling tot de omslag doet vennoeden, is dit proefschrift niet het werk van één persoon. Ik wil dan ook iedereen die aan de totstandkoming hielVan heeft meegewerkt hartelijk danken.

166

CURRICULUM VITAE
Arthur Nievergeld werd op 20 oktober 1964 geboren te Kelpen. In 1983 heeft hij het VWO diploma aan de Scholengemeenschap Sint Ursula te Hom gehaald. Hierna studeerde hij gedurende een jaar Werktuigbouwkunde aan de Technische Universiteit Eindhoven. In 1984 begon hij de studie Elektrotechniek aan dezelfde universiteit die in 1990 werd afgerond met een afstudeeronderwerp onder leiding van prof. ir. Kylstra. In 1992 begon hij met de Korte Onderzoeksopleiding Scheikundige Technologie van.het Instituut Vervolgopleidingen· TUE. Na afronding van deze opleiding in 1994 is hij met het promotieonderzoek begonnen in de groep van prof.dr.ir. G.B. Marin dat heeft geleid tot dit proefschrift. In januari 1997 is hij in dienst getreden van AspenTech Benelux b.v.

168

Stellingen
Behorende bij het proefschrift
Automotive Exhaust Gas Converslon: Reaction Kinetics, Reactor Modelling and Control
van Arthur Nisvergeld
1. Indien Lynch en Graham tijdens hun transiënt kinetisch onderzoek een propstroomreactor hadden gebruikt in plaats van een CSTR, dan had hun kinetisch model er anders uitgezien. Lynch D.T., Graham W.R.C., A/ChE36, 1797-1806, 1990;
Hoofdstuk 3 van dit proefschrift.
2. Aangezien Cutlib et al. voor de beschrijving van hun dynamische experimenten een kinetisch model gebruiken dat is gebaseerd op de beschrijving van de CO oxidatie in het CO inhibitiegebied, is het voorspelde stationaire gedrag niet in overeenstemming met eerder gedane observaties. Cutlib M.B., Hawkins C.J., Mukesh D., Morton W., Kenney C.N., Chem. Eng. Commun. 22, 329-344, 1983;
Hoofdstuk 4 van dit proefschrift.
3. Door de wederzijdse beïnvloeding van schadelijke componenten in het uitlaatgas van benzinemotoren is voor een realistische simulatie een vrijwel complete uitlaatgassamenstelling noodzakelijk. Hoofdstuk 6 van dit proefschrift.
4. De verklaring van Silveston dat de positieve effecten op de prestatie van een propstroomreactor met een oscillerende voedingssamenstelling afnemen met toenemende tijdgemiddelde CO conversie door een afname van de CO amplitude, is niet juist. Silveston P.L., Catal. Today25, 175-195, 1995;
Hoofdstuk 6 van dit proefschrift.
5. Onderzoekers die een stationair kinetisch model gebruiken voor de simulatie van een drie-wegkatalysator met een oscillerende voedingssamenstelling, moeten het woord 'transiënt' weglaten uit de titel van hun artikel.
6. De straffen die een schuldige krijgt opgelegd zijn doorgaans minder zwaar dan de straffen op overtreding van de wetten die hem/haar beschermen.

7. Tegenwoordig is in de file staan niet meer zo erg, want je weet vrijwel zeker dat de reizigers met het openbaar vervoer nog later thuis zijn.
8. Het juist gebruik van de grammaticacontrole van een tekstverwerker vereist een behoorlijke kennis van grammatica. Onze Taal, 11, 1997.
9. De rechtvaardiging naar de buitenwereld, dat de overname van een bedrijf noodzakelijk is om tot de top twee te horen is vaak een kwestib van het juist definiëren van de markt; de werkelijke reden wordt echter vaak gevormd door opportunistische directies.
10. Biologische oorlogvoering spitst zich tegenwoordig toe op computers. Het grootste probleem bij het afslaan van een cyber-aanval is het beantwoorden van de vraag: Is de aanval een daad van oorlog ?
11. Dit zou een zin uit het Groot Dictee der Nieuwe Nederlandse Taal kunnen zijn: De hippo's die na de elandtest bevend naar een pinkelpaal rennen om vervolgens spontaan te stoppen met montignaccen en daardoor gaan jojoën, kunnen het best naar een zotel gaan om met een portie mediwiet tot rust te komen. hippo's: high potentials; jojoën: extreme gewichtsschommelingen door schranspartij; zotel: hotel met low care medische voorzieningen: mediwiet: marihuana verstrekt op medische indicatie.