automotive - ascciascci.co.za/wp-content/uploads/2015/12/ascci quarterly newsletter... ·...
TRANSCRIPT
automotive"ISO/TS 16949: Where do we need to focus to improve performance"
Nov 2014 - Jan 2015
Featured:
Automotive SupplyChainCompetitiveness Initiative
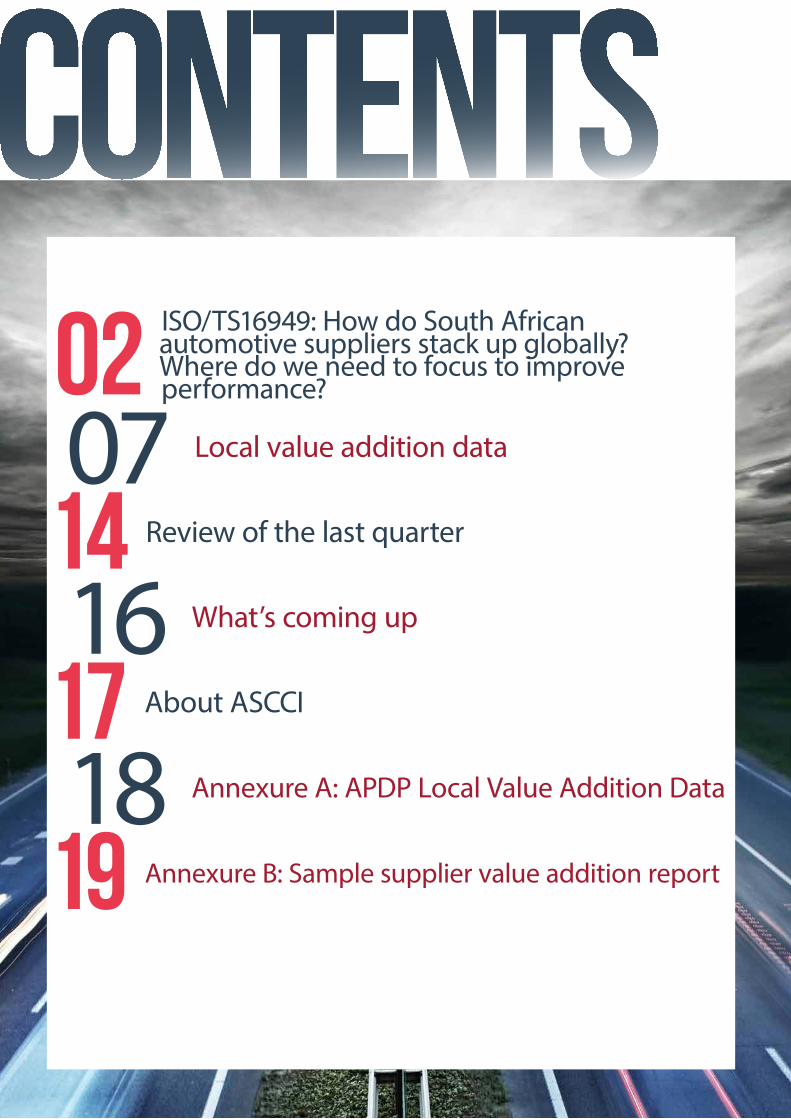
02 ISO/TS16949: How do South African automotive suppliers stack up globally? Where do we need to focus to improve performance?
07 Local value addition data
14 Review of the last quarter
16 What’s coming up
17 About ASCCI
18 Annexure A: APDP Local Value Addition Data
19 Annexure B: Sample supplier value addition report
ISO/TS16949: How do South African automotive suppliers stack up glob-ally? Where do we need to focus to improve per formance?
Research report summarised by Julia Wedgwood
Introduction
Automotive quality standards are notoriously stringent. Given the high cost of quality, customers want some level of assurance regarding the standard of supplier quality performance; while suppliers are interested in introduc-ing the culture and standards within their businesses that allow them to deliver high quality products cost effec-tively. The result has been the introduction of standards like TS 16949 which give confidence to both customer
and supplier that quality standards may be met and cost effectively. Despite the rigorous nature of ISO/TS 16949, the performance standards of ISO/TS 16949 certified firms are considered, by some camps, to vary – in some cases significantly. In the context of the South African automotive supply industry, ASCCI recently explored whether these perceptions are correct and, if so, how the shortfalls in the operating standards of some firms should be addressed. These are our findings.
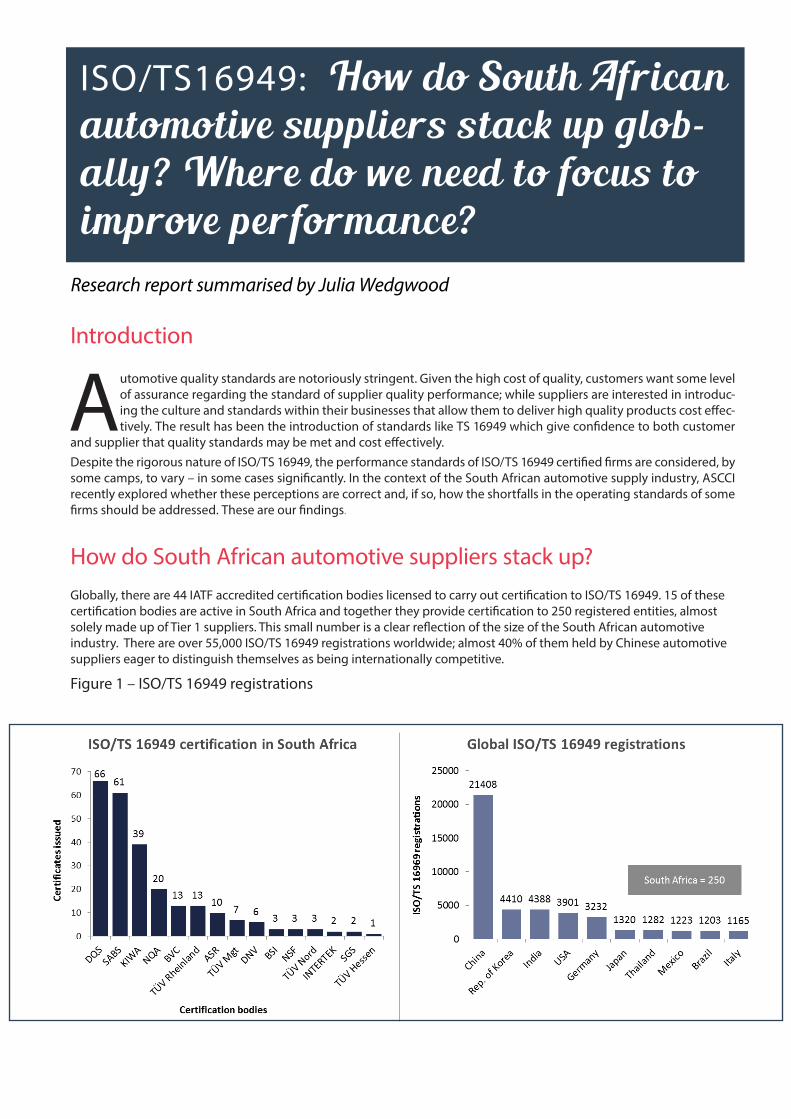
How do South African automotive suppliers stack up? Globally, there are 44 IATF accredited certification bodies licensed to carry out certification to ISO/TS 16949. 15 of these certification bodies are active in South Africa and together they provide certification to 250 registered entities, almost solely made up of Tier 1 suppliers. This small number is a clear reflection of the size of the South African automotive industry. There are over 55,000 ISO/TS 16949 registrations worldwide; almost 40% of them held by Chinese automotive suppliers eager to distinguish themselves as being internationally competitive.
Figure 1 – ISO/TS 16949 registrations
ASCCI Newsletter Nov 2014 - Jan 2015
4
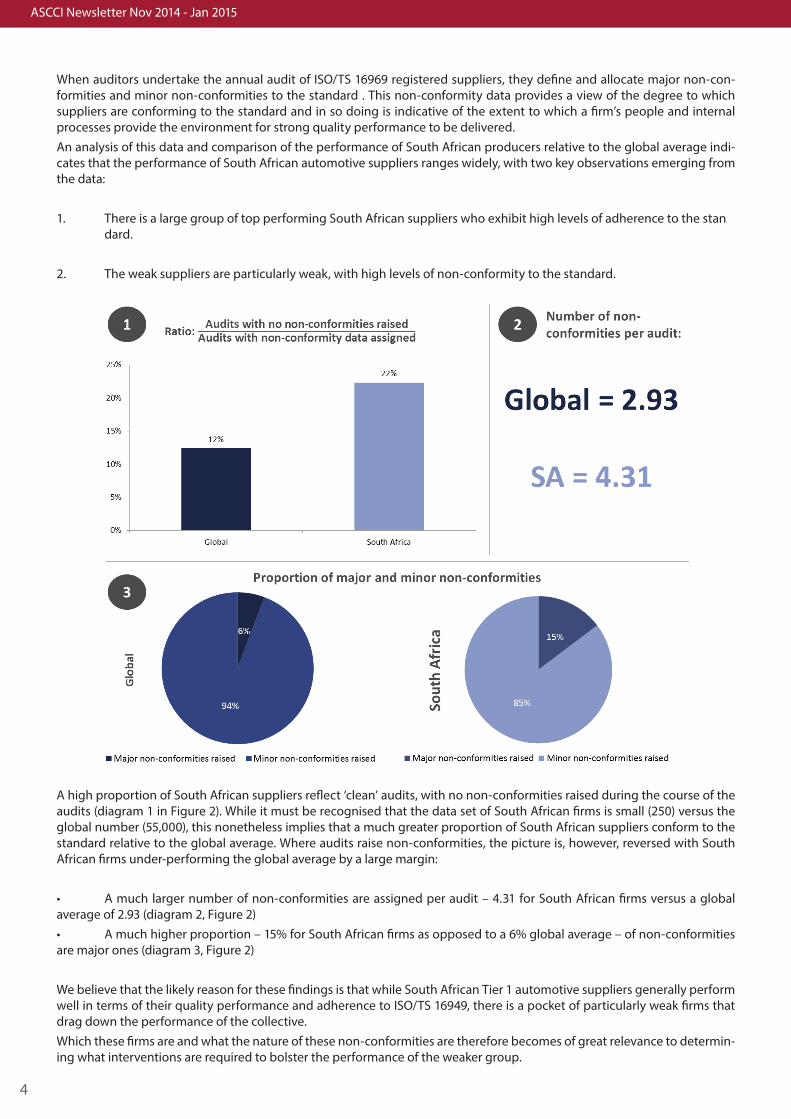
When auditors undertake the annual audit of ISO/TS 16969 registered suppliers, they define and allocate major non-con-formities and minor non-conformities to the standard . This non-conformity data provides a view of the degree to which suppliers are conforming to the standard and in so doing is indicative of the extent to which a firm’s people and internal processes provide the environment for strong quality performance to be delivered. An analysis of this data and comparison of the performance of South African producers relative to the global average indi-cates that the performance of South African automotive suppliers ranges widely, with two key observations emerging from the data:
1. There is a large group of top performing South African suppliers who exhibit high levels of adherence to the stan dard.
2. The weak suppliers are particularly weak, with high levels of non-conformity to the standard.
A high proportion of South African suppliers reflect ‘clean’ audits, with no non-conformities raised during the course of the audits (diagram 1 in Figure 2). While it must be recognised that the data set of South African firms is small (250) versus the global number (55,000), this nonetheless implies that a much greater proportion of South African suppliers conform to the standard relative to the global average. Where audits raise non-conformities, the picture is, however, reversed with South African firms under-performing the global average by a large margin:
• A much larger number of non-conformities are assigned per audit – 4.31 for South African firms versus a global average of 2.93 (diagram 2, Figure 2)• A much higher proportion – 15% for South African firms as opposed to a 6% global average – of non-conformities are major ones (diagram 3, Figure 2)
We believe that the likely reason for these findings is that while South African Tier 1 automotive suppliers generally perform well in terms of their quality performance and adherence to ISO/TS 16949, there is a pocket of particularly weak firms that drag down the performance of the collective. Which these firms are and what the nature of these non-conformities are therefore becomes of great relevance to determin-ing what interventions are required to bolster the performance of the weaker group.
ASCCI Newsletter Nov 2014 -Jan 2015
5
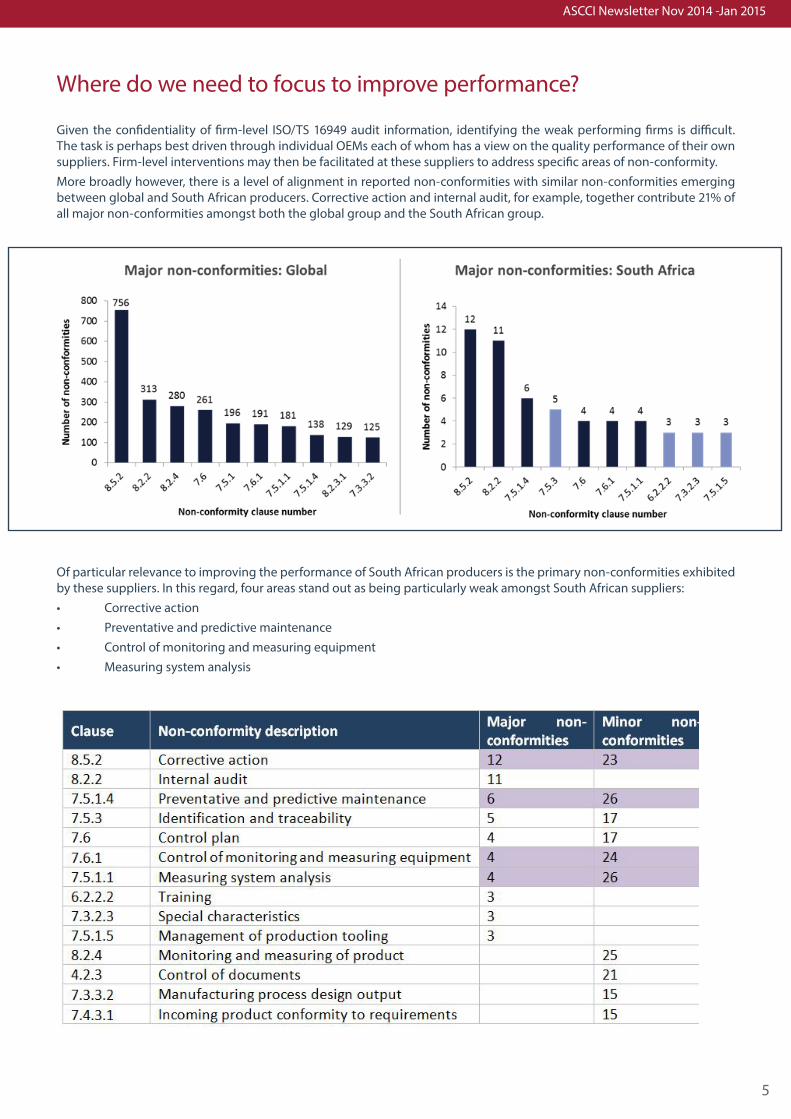
Where do we need to focus to improve performance?
Given the confidentiality of firm-level ISO/TS 16949 audit information, identifying the weak performing firms is difficult. The task is perhaps best driven through individual OEMs each of whom has a view on the quality performance of their own suppliers. Firm-level interventions may then be facilitated at these suppliers to address specific areas of non-conformity.More broadly however, there is a level of alignment in reported non-conformities with similar non-conformities emerging between global and South African producers. Corrective action and internal audit, for example, together contribute 21% of all major non-conformities amongst both the global group and the South African group.
Of particular relevance to improving the performance of South African producers is the primary non-conformities exhibited by these suppliers. In this regard, four areas stand out as being particularly weak amongst South African suppliers:• Corrective action• Preventative and predictive maintenance• Control of monitoring and measuring equipment• Measuring system analysis
ASCCI Newsletter Nov 2014 - Jan 2015
6
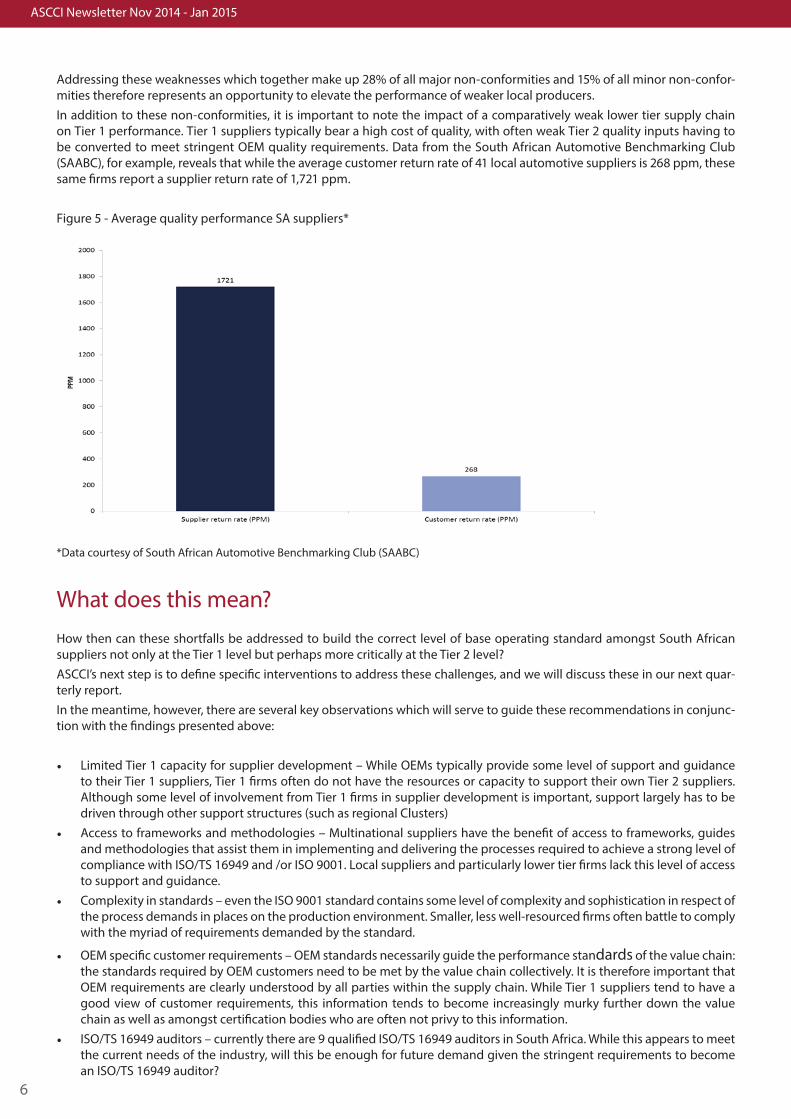
Addressing these weaknesses which together make up 28% of all major non-conformities and 15% of all minor non-confor-mities therefore represents an opportunity to elevate the performance of weaker local producers.In addition to these non-conformities, it is important to note the impact of a comparatively weak lower tier supply chain on Tier 1 performance. Tier 1 suppliers typically bear a high cost of quality, with often weak Tier 2 quality inputs having to be converted to meet stringent OEM quality requirements. Data from the South African Automotive Benchmarking Club (SAABC), for example, reveals that while the average customer return rate of 41 local automotive suppliers is 268 ppm, these same firms report a supplier return rate of 1,721 ppm.
Figure 5 - Average quality performance SA suppliers*
*Data courtesy of South African Automotive Benchmarking Club (SAABC)
What does this mean?How then can these shortfalls be addressed to build the correct level of base operating standard amongst South African suppliers not only at the Tier 1 level but perhaps more critically at the Tier 2 level?ASCCI’s next step is to define specific interventions to address these challenges, and we will discuss these in our next quar-terly report. In the meantime, however, there are several key observations which will serve to guide these recommendations in conjunc-tion with the findings presented above:
• Limited Tier 1 capacity for supplier development – While OEMs typically provide some level of support and guidance to their Tier 1 suppliers, Tier 1 firms often do not have the resources or capacity to support their own Tier 2 suppliers. Although some level of involvement from Tier 1 firms in supplier development is important, support largely has to be driven through other support structures (such as regional Clusters)
• Access to frameworks and methodologies – Multinational suppliers have the benefit of access to frameworks, guides and methodologies that assist them in implementing and delivering the processes required to achieve a strong level of compliance with ISO/TS 16949 and /or ISO 9001. Local suppliers and particularly lower tier firms lack this level of access to support and guidance.
• Complexity in standards – even the ISO 9001 standard contains some level of complexity and sophistication in respect of the process demands in places on the production environment. Smaller, less well-resourced firms often battle to comply with the myriad of requirements demanded by the standard.
• OEM specific customer requirements – OEM standards necessarily guide the performance standards of the value chain: the standards required by OEM customers need to be met by the value chain collectively. It is therefore important that OEM requirements are clearly understood by all parties within the supply chain. While Tier 1 suppliers tend to have a good view of customer requirements, this information tends to become increasingly murky further down the value chain as well as amongst certification bodies who are often not privy to this information.
• ISO/TS 16949 auditors – currently there are 9 qualified ISO/TS 16949 auditors in South Africa. While this appears to meet the current needs of the industry, will this be enough for future demand given the stringent requirements to become an ISO/TS 16949 auditor?
ASCCI Newsletter Nov 2014 -Jan 2015
7
Vehicle Production Information
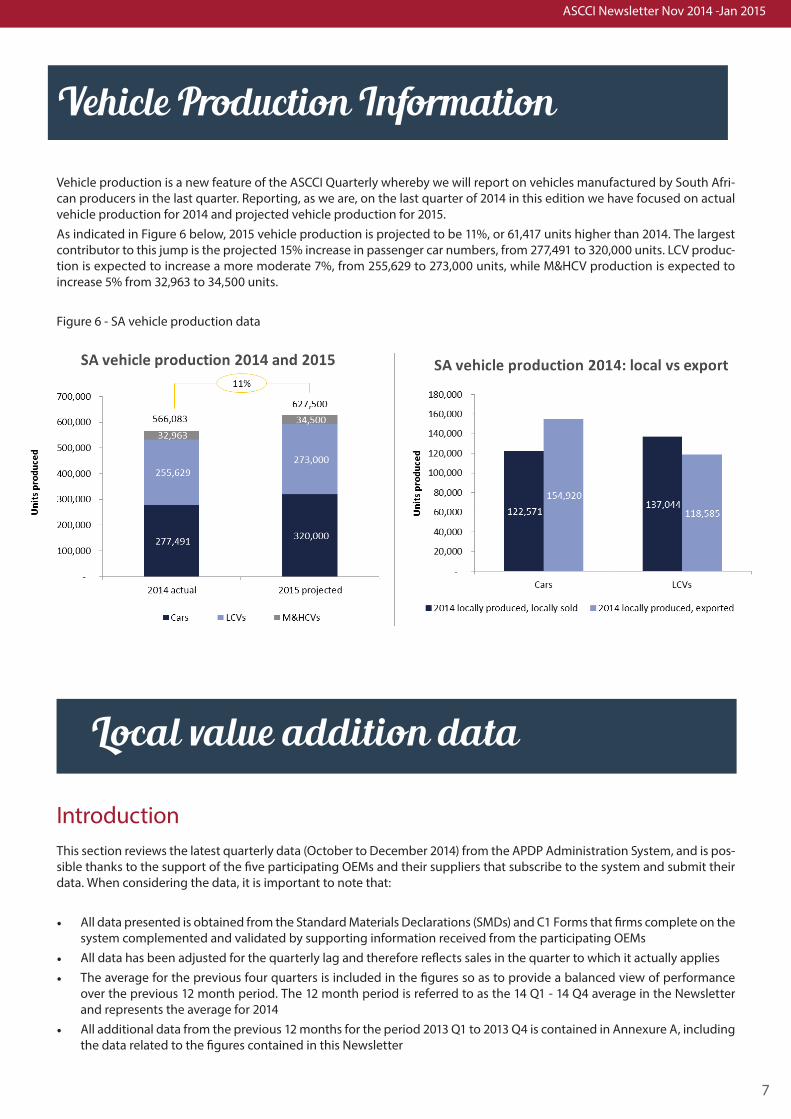
Vehicle production is a new feature of the ASCCI Quarterly whereby we will report on vehicles manufactured by South Afri-can producers in the last quarter. Reporting, as we are, on the last quarter of 2014 in this edition we have focused on actual vehicle production for 2014 and projected vehicle production for 2015. As indicated in Figure 6 below, 2015 vehicle production is projected to be 11%, or 61,417 units higher than 2014. The largest contributor to this jump is the projected 15% increase in passenger car numbers, from 277,491 to 320,000 units. LCV produc-tion is expected to increase a more moderate 7%, from 255,629 to 273,000 units, while M&HCV production is expected to increase 5% from 32,963 to 34,500 units.
Figure 6 - SA vehicle production data
Local value addition data
IntroductionThis section reviews the latest quarterly data (October to December 2014) from the APDP Administration System, and is pos-sible thanks to the support of the five participating OEMs and their suppliers that subscribe to the system and submit their data. When considering the data, it is important to note that:
• All data presented is obtained from the Standard Materials Declarations (SMDs) and C1 Forms that firms complete on the system complemented and validated by supporting information received from the participating OEMs
• All data has been adjusted for the quarterly lag and therefore reflects sales in the quarter to which it actually applies• The average for the previous four quarters is included in the figures so as to provide a balanced view of performance
over the previous 12 month period. The 12 month period is referred to as the 14 Q1 - 14 Q4 average in the Newsletter and represents the average for 2014
• All additional data from the previous 12 months for the period 2013 Q1 to 2013 Q4 is contained in Annexure A, including the data related to the figures contained in this Newsletter
ASCCI Newsletter Nov 2014 - Jan 2015
8
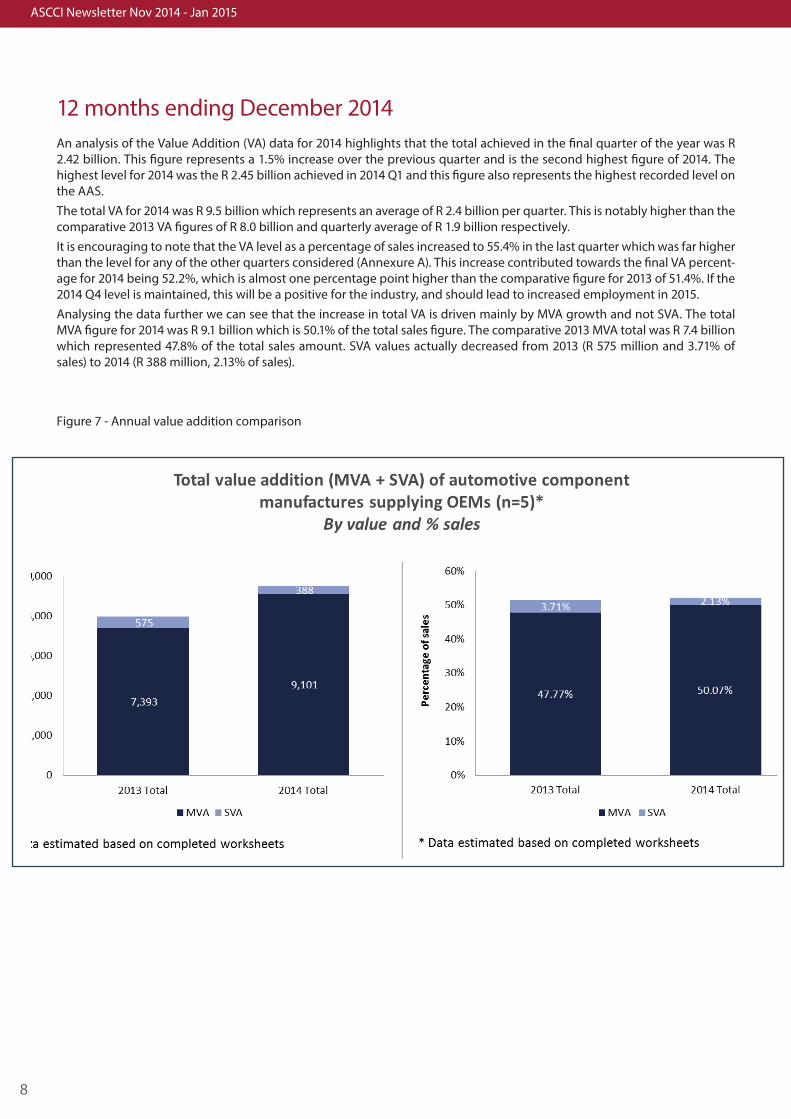
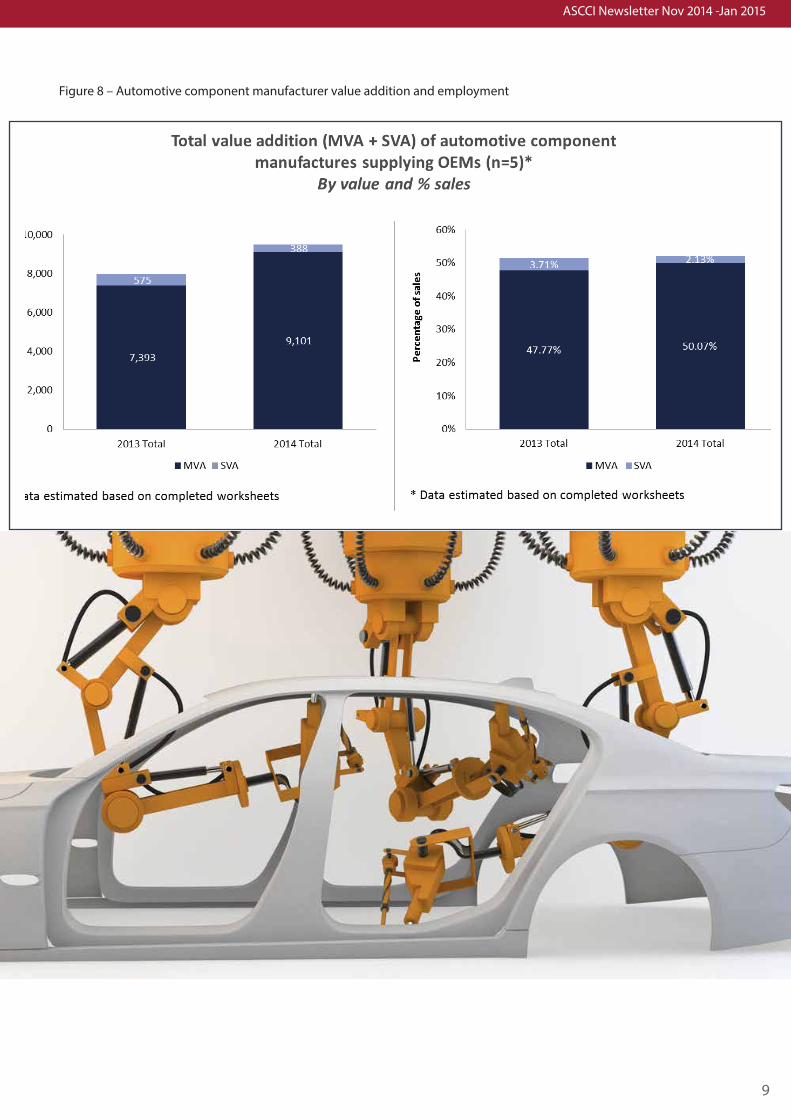
12 months ending December 2014An analysis of the Value Addition (VA) data for 2014 highlights that the total achieved in the final quarter of the year was R 2.42 billion. This figure represents a 1.5% increase over the previous quarter and is the second highest figure of 2014. The highest level for 2014 was the R 2.45 billion achieved in 2014 Q1 and this figure also represents the highest recorded level on the AAS. The total VA for 2014 was R 9.5 billion which represents an average of R 2.4 billion per quarter. This is notably higher than the comparative 2013 VA figures of R 8.0 billion and quarterly average of R 1.9 billion respectively.It is encouraging to note that the VA level as a percentage of sales increased to 55.4% in the last quarter which was far higher than the level for any of the other quarters considered (Annexure A). This increase contributed towards the final VA percent-age for 2014 being 52.2%, which is almost one percentage point higher than the comparative figure for 2013 of 51.4%. If the 2014 Q4 level is maintained, this will be a positive for the industry, and should lead to increased employment in 2015.Analysing the data further we can see that the increase in total VA is driven mainly by MVA growth and not SVA. The total MVA figure for 2014 was R 9.1 billion which is 50.1% of the total sales figure. The comparative 2013 MVA total was R 7.4 billion which represented 47.8% of the total sales amount. SVA values actually decreased from 2013 (R 575 million and 3.71% of sales) to 2014 (R 388 million, 2.13% of sales).
Figure 7 - Annual value addition comparison
ASCCI Newsletter Nov 2014 -Jan 2015
9
Figure 8 – Automotive component manufacturer value addition and employment
ASCCI Newsletter Nov 2014 - Jan 2015
10
2014 Q4 Supply Chain VA Statistics
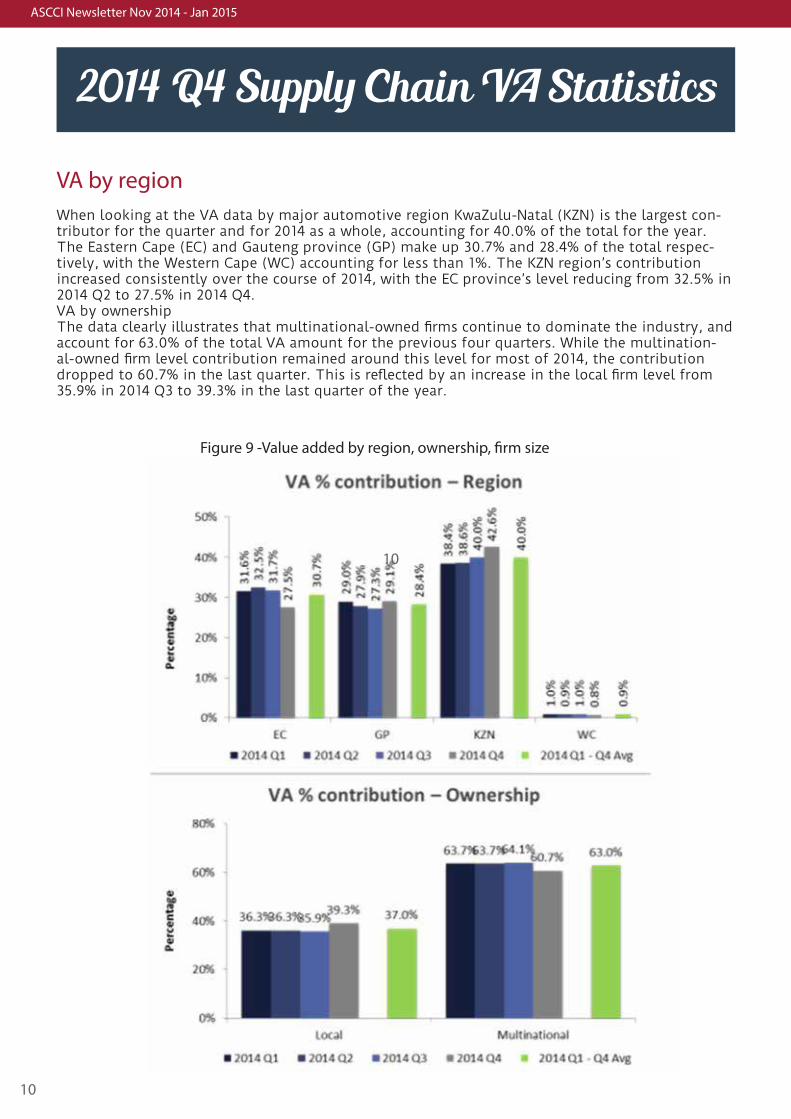
VA by regionWhen looking at the VA data by major automotive region KwaZulu-Natal (KZN) is the largest con-tributor for the quarter and for 2014 as a whole, accounting for 40.0% of the total for the year. The Eastern Cape (EC) and Gauteng province (GP) make up 30.7% and 28.4% of the total respec-tively, with the Western Cape (WC) accounting for less than 1%. The KZN region’s contribution increased consistently over the course of 2014, with the EC province’s level reducing from 32.5% in 2014 Q2 to 27.5% in 2014 Q4. VA by ownershipThe data clearly illustrates that multinational-owned firms continue to dominate the industry, and account for 63.0% of the total VA amount for the previous four quarters. While the multination-al-owned firm level contribution remained around this level for most of 2014, the contribution dropped to 60.7% in the last quarter. This is reflected by an increase in the local firm level from 35.9% in 2014 Q3 to 39.3% in the last quarter of the year.
Figure 9 -Value added by region, ownership, firm size
10
ASCCI Newsletter Nov 2014 -Jan 2015
11
VA by ownershipThe data clearly illustrates that multinational-owned firms continue to dominate the industry, and account for 63.0% of the total VA amount for the previous four quarters. While the multination-al-owned firm level contribution remained around this level for most of 2014, the contribution dropped to 60.7% in the last quarter. This is reflected by an increase in the local firm level from 35.9% in 2014 Q3 to 39.3% in the last quarter of the year.
VA by firm-size
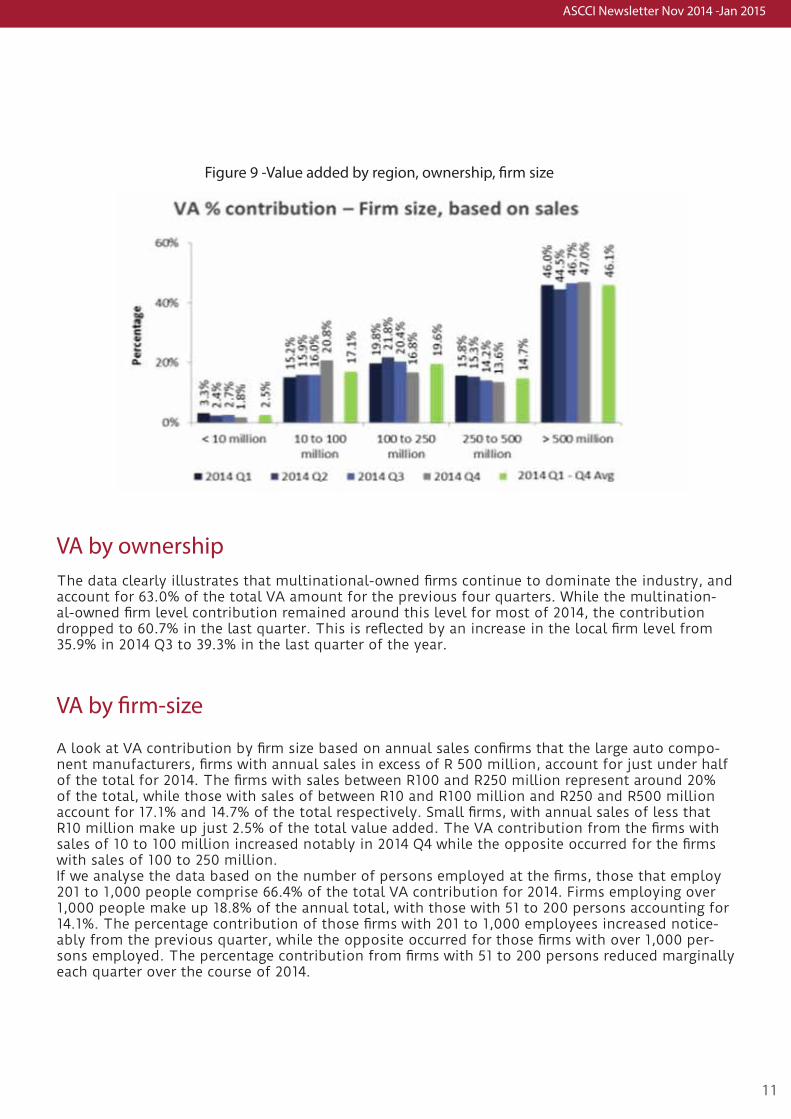
A look at VA contribution by firm size based on annual sales confirms that the large auto compo-nent manufacturers, firms with annual sales in excess of R 500 million, account for just under half of the total for 2014. The firms with sales between R100 and R250 million represent around 20% of the total, while those with sales of between R10 and R100 million and R250 and R500 million account for 17.1% and 14.7% of the total respectively. Small firms, with annual sales of less that R10 million make up just 2.5% of the total value added. The VA contribution from the firms with sales of 10 to 100 million increased notably in 2014 Q4 while the opposite occurred for the firms with sales of 100 to 250 million. If we analyse the data based on the number of persons employed at the firms, those that employ 201 to 1,000 people comprise 66.4% of the total VA contribution for 2014. Firms employing over 1,000 people make up 18.8% of the annual total, with those with 51 to 200 persons accounting for 14.1%. The percentage contribution of those firms with 201 to 1,000 employees increased notice-ably from the previous quarter, while the opposite occurred for those firms with over 1,000 per-sons employed. The percentage contribution from firms with 51 to 200 persons reduced marginally each quarter over the course of 2014.
Figure 9 -Value added by region, ownership, firm size
ASCCI Newsletter Nov 2014 - Jan 2015
12
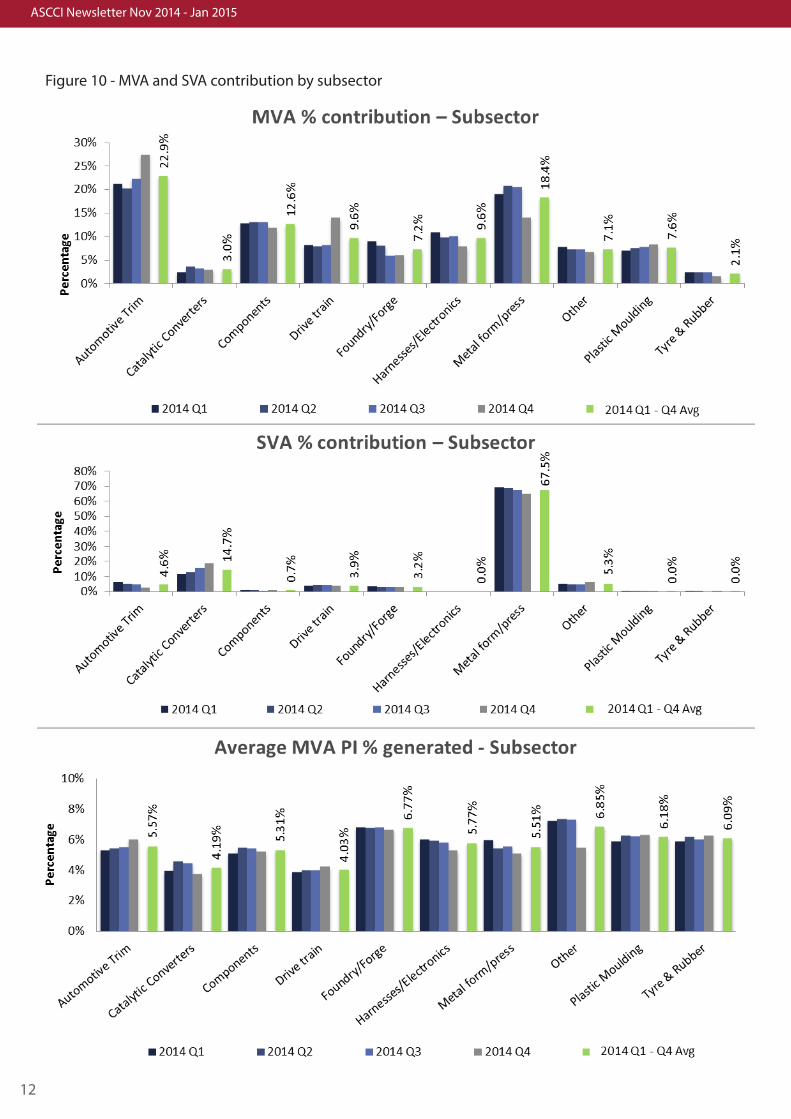
Figure 10 - MVA and SVA contribution by subsector
ASCCI Newsletter Nov 2014 -Jan 2015
13
MVA and SVA % contribution by sub-sector
The automotive trim firms are still the most important sub-sector in terms of MVA contribution. They account for 22.9% of the 2014 total. This is significantly higher than the second and third biggest contributors, namely the metal forming/pressing and components sub-sectors at 18.4% and 12.6% respectively. Several of the remaining sub-sectors each contribute between 7% and 10% of the 2014 total, with the catalytic converters and tyre & rubber firms accounting for 3.0% and 2.1% respectively. The automotive trim firms appear to be further strengthening their position and their quarterly figures having increased fairly substantially over the course of 2014. Looking at the total SVA figures for firms supplying the five participating OEMs, the metal forming/pressing firms remain the major contributor, accounting for around two-thirds of the total. While the catalytic converters sub-sector’s contribution has increased from 11.5% in 2014 Q1 to 18.6% in 2014 Q4, the average for these firms in 2014 is only 14.7%. This is well below the comparative met-al forming/pressing firm level. None of the other sub-sectors account for more than 5.5% of the total, with four of the sub-sectors contributing less than 1% of the total.
PI % contribution by sub-sector
An analysis of the MVA PI level for the various sub-sectors, reveals that the firms classified as part of the ‘other’ sub-sector recorded the highest percentage for 2014 (6.85%), although their level did drop quite significantly in the last quarter of 2014. The foundry/forge firms recorded the second best average for 2014, achieving a PI of 6.77% for 2014, with their level for each quarter remaining fairly consistent. The majority of the remaining sub-sectors have PI percentages between 5.3% and 6.2%, with the catalytic converters and drive train firms having the lowest PI figures of 4.2% and 4.0% respectively for 2014.
In terms of Standard Value Addition (SVA), the catalytic converters sub-sector firms contribute the highest PI benefit. They achieved an SVA benefit of 0.9% for 2014, followed by the metal forming/pressing (0.7%) and the foundry/forge (0.4%) firms. With the exception of the ‘other’ classified firms (0.2%), no other sub-sector contributes any real benefit as a result of standard materials.
ASCCI Newsletter Nov 2014 - Jan 2015
14
Feedback on activities from the quarter ending January 2015
Base Operating Standards StudyASCCI leveraged funding from the United Nations Industrial Development Organisation (UNIDO) to review the application of ISO/TS 16949 amongst South Africa automotive suppliers, and make rec-ommendations regarding how the standard could be better employed to facilitate the adoption of sound base operating standards. This research is summarised in the feature article of this report. Recommendations will be implemented in the next quarter.
World Class Manufacturing implementationASCCI has undertaken to implement WCM interventions at 120 suppliers over a 3 year period. The first group of 20 suppliers has been selected and recruited onto the programme. Each supplier will first be assessed before a suitable project is identified. Assessments have been completed at 11 of the 20 suppliers and projects are scheduled to launch in March.
Raw materials beneficiationIn respect of raw materials beneficiation, ASCCI has initially prioritised polymers as the immediate focus area. In this regard, a steering committee comprising industry, government, and labour will be established with the objective of developing alignment and collaboration between key stake-holders with regards to policy and other issues relating to polymer beneficiation, with the view to building the availability and competitiveness of polymer inputs.
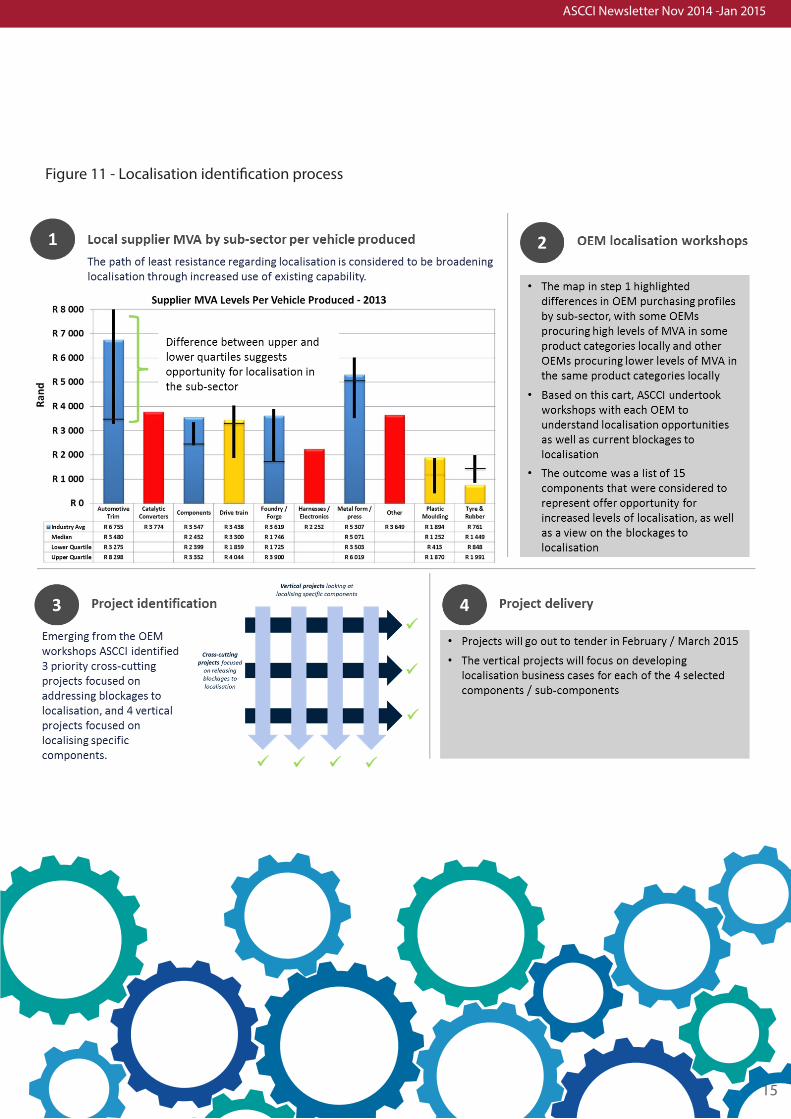
Tier 1 and tier 2 localisationASCCI undertook an exercise to identify possible localisation opportunities. Per the process artic-ulated in Figure 8, the outcome of the process was the identification of 3 cross cutting projects, which will focus on addressing the blockages to localisation, and 4 vertical projects which will develop business cases for the localisation of specific components.
Review of last quarter
ASCCI Newsletter Nov 2014 -Jan 2015
15
Figure 11 - Localisation identification process
ASCCI Newsletter Nov 2014 - Jan 2015
16
What’s Coming UpKey activities planned for the quarter ending 30 April
2015 Base Operating Standards implementationThe findings and recommendations of the Base Operating Standards study will be translated into actionable deliverables, whereby ASCCI will begin implementing approved recommendations focused on lifting the base operating standards of automotive suppliers, and particularly those at the Tier 2 level. The specific nature of these interventions will be covered in the next quarterly report.
World Class Manufacturing implementationThe remaining 9 supplier assessments will be concluded through the month of March, and more importantly projects will be launched at suppliers through March and April. Projects will focus on assisting suppliers in bolstering their productivity by increasing value add per Rand of employee cost.
Shop floor and scarce skills study
ASCCI has commissioned a study with the support of the dti to determine what the current industry skills development needs are in terms of both shop floor and scarce skills, and what the blockages and enablers are for adequately skilled and increasingly productive shop floor employees. The study will also consider what industry support is required to ensure that merSETA skills development activities and the linkages between academia and business are such that they deliver on the industry’s skills development needs.
Raw materials beneficiation steering committee
In respect of raw materials beneficiation, ASCCI has initially prioritised polymers as the immediate focus area. In this regard, a steering committee comprising industry, government, and labour will be established with the objective of developing alignment and collaboration between key stakeholders with regards to policy and other issues relating to polymer benefi-ciation, with the view to building the availability and price competitiveness of polymer inputs.
Tier 1 and tier 2 localisation projects
ASCCI will go out to tender on the cross cutting and vertical localisation projects in February / March 2015, with the view to launching projects in March 2015.
The 3 cross cutting projects will focus on determining available support to reduce the localisation costs associated with:
• Tooling and investment • Technology • Testing facilities
The 4 vertical projects will work with one or more OEMs and one or more suppliers to develop a business case and associat-ed plan to localise the whole or elements of the following components:
• Seat frames• Drive shafts• Prop shafts and side shafts• Heat exchange units
If you have missed something important, or would like additional information on any of the latest activities, contact ASCCI (www.ascci.co.za).
ASCCI Newsletter Nov 2014 -Jan 2015
17
About Us
The Automotive Supply Chain Competitiveness Initia-tive (ASCCI) was established in December 2013 to co-ordinate supply chain developments in the South Af-rican automotive industry. The creation of ASCCI was initiated jointly by the Department of Trade and In-dustry (dti), OEMs (represented by NAAMSA), suppliers (represented by NAACAM), and labour (represented by NUMSA) in the industry. ASCCI is thus a first in respect of facilitating such breadth and depth of collaboration to develop a successful and sustainable local automo-tive industry. For more information about ASCCI please visit www.ascci.co.za.
The National Association of Automobile Manufacturers (NAAMSA) of South Africa is the official body repre-senting new vehicle manufacturers. The organisation is responsible for compiling new vehicle production and sales statistics, and has specialists committees focused on addressing each of the major issues facing the in-dustry, from local content to vehicle crime and safety and legislation.For more information about NAAMSA please visit www.naamsa.co.za.
The National Association of Automotive Component and Allied Manufacturers (NAACAM) was established 34 years ago to represent the interests of South Afri-can automotive component manufacturers. NAACAM provides companies with a forum to formulate policies and take actions that benefit the industry as a whole. For more information about NAACAM please visit www.naacam.co.za.
Facilitation services are provided by Benchmarking & Manufacturing Analysts SA (Pty) Ltd (B&M Analysts), an organisation that provides specialised services to en-hance sustainable industry development.For more information about B&M Analysts please visit www.bmanalysts.com.
The National Union of Metalworkers South Africa (NUMSA) is an employee union offering its members collective bargaining with employers. Additional work-place activities include technical training and adult ba-sic education; and health, safety and environment, and HIV/Aids. For more information about NUMSA please visit www.numsa.org.za.
The Department of Trade and Industry (dti) is focused on creating a dynamic industrial and globally competi-tive South African economy, characterised by inclusive growth and development, and decent employment and equity. In this regard, its mission is four-fold:• Promote structural transformation towards a
dynamic industrial and globally competitive econ-omy;
• Provide a predictable, competitive, equitable and socially responsible environment, conducive to in-vestment, trade and enterprise development;
• Broaden participation in the economy to strength-en economic development; and
• Continually improve the skills and capabilities of the dti to effectively deliver on its mandate and re-spond to the needs of South Africa’s citizens.
For more information about the dti please visit www.thedti.gov.za.
ASCCI Newsletter Oct - Dec 2014
18
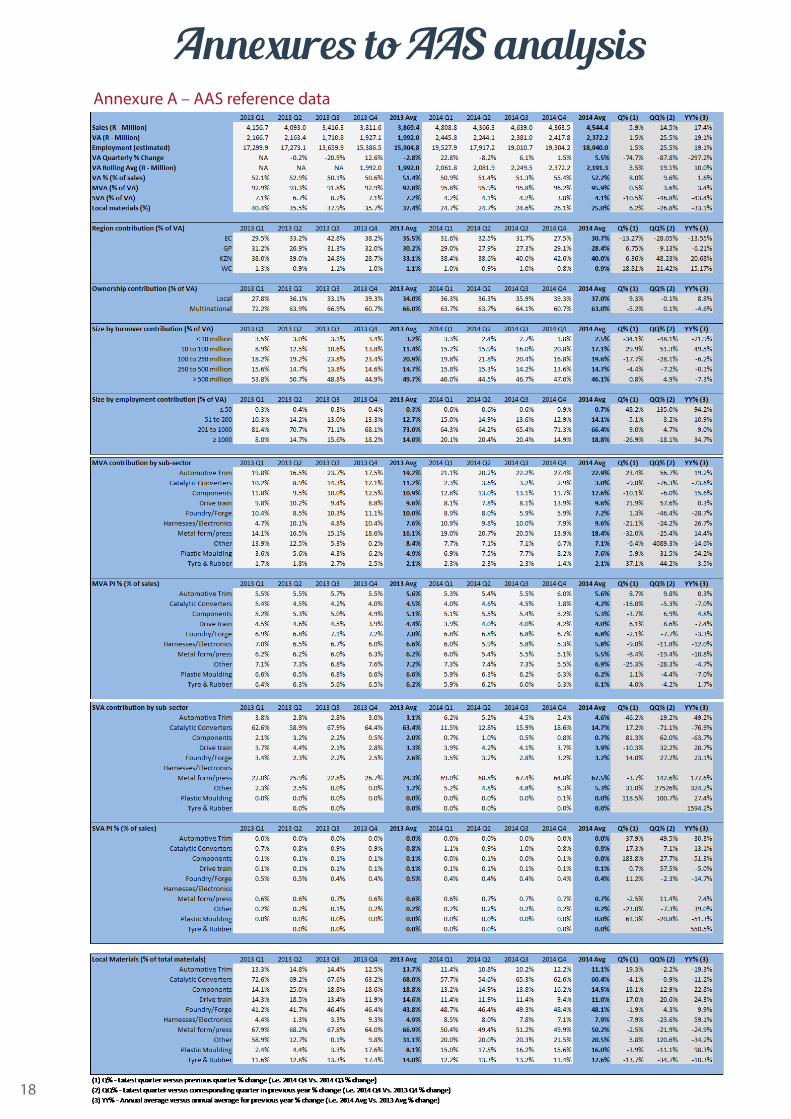
Annexure A – AAS reference data
Annexures to AAS analysis
19
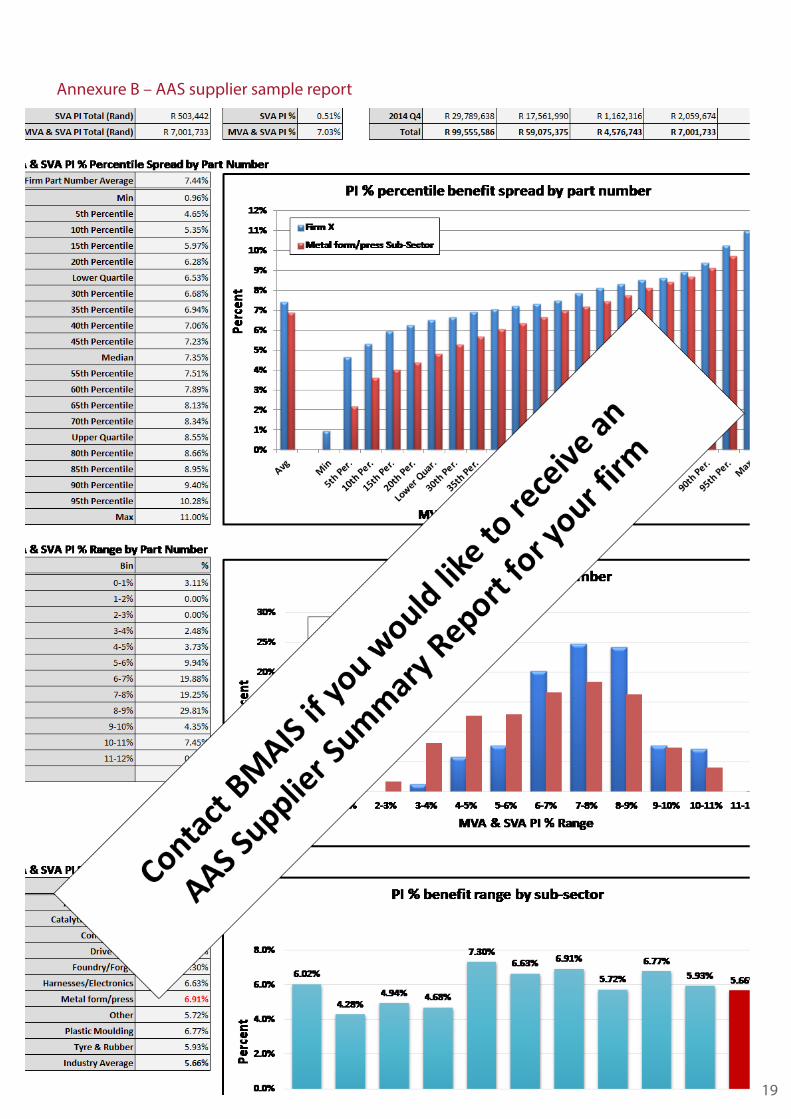
Annexure B – AAS supplier sample report
www.ascci.co.za