automotive regulation and electrification in...
TRANSCRIPT

© 2017 IHS Markit© 2017 IHS Markit. All Rights Reserved.
Regulation and Electrificationin Vehicle Sales Forecast ScenariosHow will forecasts reflect disruptive trends?
AUTOMOTIVE
Reinhard Schorsch, Director Advisory Services EMEA & APAC, [email protected]
28 February 2017 | Tokyo, Japan

© 2017 IHS Markit
2017 Spring Automotive Conference | 28 February 2017
2
• Preliminary questions
• Scenario concept
• Scenario examples
‒ Market regulations
‒ OEM strategies
‒ Electrification trends
• Summary
Contents

© 2017 IHS Markit 3
How are disruptive trends impacting your planning processes?
Which transparency and understanding of forecast/planning backgrounds do you require?
Do forecast backgrounds and scenarios give answers to these questions?
Which ‘what if’ questions do you need to answer?
What are your current and future expectations regarding automotive information, forecasts, or supporting services?
Preliminary questions
2017 Spring Automotive Conference | 28 February 2017

© 2017 IHS Markit
2017 Spring Automotive Conference | 28 February 2017
4
• Preliminary questions
• Scenario concept
• Scenario examples
‒ Market regulations
‒ OEM strategies
‒ Electrification trends
• Summary
Contents
© 2017 IHS Markit
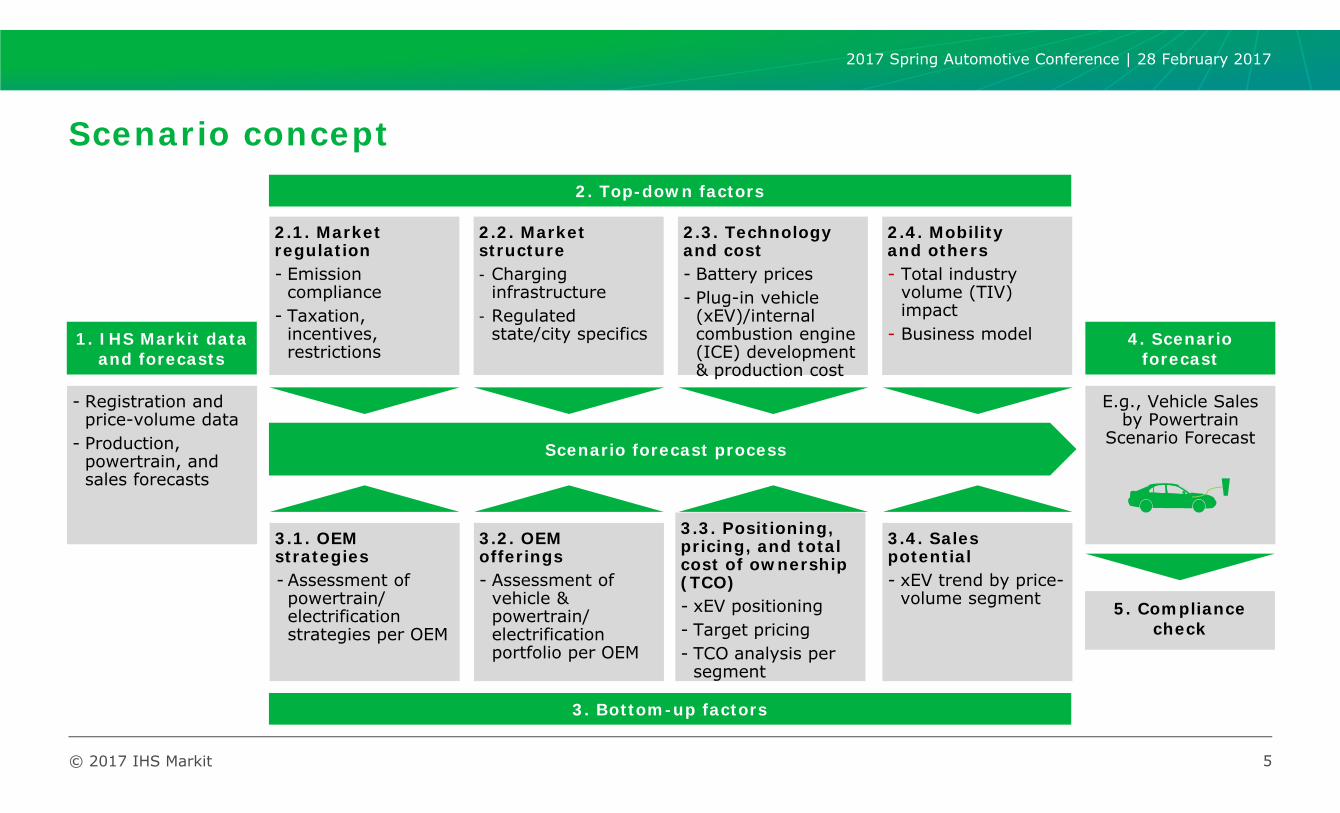
Scenario concept
5
2. Top-down factors
2.1. Market regulation- Emission
compliance- Taxation,
incentives, restrictions
2.2. Marketstructure- Charging
infrastructure- Regulated
state/city specifics
2.3. Technology and cost- Battery prices- Plug-in vehicle
(xEV)/internal combustion engine (ICE) development & production cost
2.4. Mobilityand others- Total industry
volume (TIV) impact
- Business model
- Registration and price-volume data
- Production, powertrain, and sales forecasts
3. Bottom-up factors
1. IHS Markit data and forecasts
Scenario forecast process
3.1. OEM strategies- Assessment of powertrain/ electrification strategies per OEM
3.2. OEM offerings- Assessment of
vehicle & powertrain/ electrification portfolio per OEM
3.3. Positioning,pricing, and total cost of ownership (TCO)- xEV positioning- Target pricing- TCO analysis per
segment
3.4. Sales potential- xEV trend by price-
volume segment
E.g., Vehicle Sales by Powertrain
Scenario Forecast
4. Scenario forecast
5. Compliance check
2017 Spring Automotive Conference | 28 February 2017

© 2017 IHS Markit
2017 Spring Automotive Conference | 28 February 2017
6
• Preliminary questions
• Scenario concept
• Scenario examples
‒ Market regulations
‒ OEM strategies
‒ Electrification trends
• Summary
Contents

© 2017 IHS Markit
Top-30 potentially restricted cities
Restrictedcities
Beijing Shanghai
Guangzhou Shenzhen
Hangzhou Tianjin
Signs of city
restrictions
Changsha Shenyang
Chongqing Suzhou
Nanjing Taiyuan
Ningbo Zhengzhou
Potentialrestrictions
Chengdu Ürümqi
Donguan Wenzhou
Foshan Wuhan
Jiaxing Wuxi
Jinan Xi’an
Kunming Xiamen
Qingdao Zhongshan
Shijiazhuang Zhuhai
China—city restrictions are major forecast drivers
7
Two major types of city restrictions
• First introduced in Shanghai in 1986 to reduce carbon dioxide (CO2) emissions and traffic in the city center
• Vehicles cannot enter the city center every day and are banned for one day of each week, depending on the number on their license plates
• Exception for neighborhood electric vehicles (NEVs) with special green license plates
License plate ban
• First introduced in Beijing in 2008 to reduce private vehicle volume and create safer, more livable cities with lower registration rates
• Works like a lottery and includes better chances for NEVs to get a license plate (e.g., gasoline license plate in Shanghai costs CNY90,000)
• Beijing already set a cap to have not more than6 million registered vehicles in 2017 and 100,000 vehicles a year from 2018–20
Car quota system
2017 Spring Automotive Conference | 28 February 2017

© 2017 IHS Markit
-
100
200
300
400
500
600
Thou
sand
s
City restriction Replacement Replacement by NEV Yellow car rep NEVs
• Beijing introduced its license plate restriction scheme in 2011. The lottery-based system allowed 240,000 new plates to be issued each year. This limit was reduced to just 150,000 units in the beginning of 2014. IHS Markit assumes that this level will be maintained until the end of 2017 as the regulations have already been put in place.
• The main goal of the controls was to limit road congestion while expanding the Beijing metro system in parallel, increasing its size and coverage by a factor of three or four by 2020.
• In line with new national government guidance (September 2015), NEVs are no longer to be subject to licence plate or circulation restrictions.
• After 2020, NEVs will become common, so that they are assumed to be included in a separate cap (in line with assumptions on other restricted cities at that time).
Beijing vehicle registrations by registration type, 2011–28
2017 Spring Automotive Conference | 28 February 2017
China—NEV quotas will affect sales significantly
8

© 2017 IHS Markit
Charging infrastructure development in China
China—infrastructure will support NEV convenience
9
Regional focus
• Main focus on East, North, and South China, including megacities Beijing, Shanghai, Guangzhou, and Qingdao
Charging standard
• New Chinese charging standard from early 2016 supports both DC fast charging and level 2 charging
Infrastructure development
• About 81,000 public charging stations and more than 50,000 private charging stations
• USD600 million investment in 2016
Ambitious target
• Government aims to build 12,000 charging stations, 4.8 million charging points by 2020
• Investment of up to USD19 billion
2017 Spring Automotive Conference | 28 February 2017

© 2017 IHS Markit
United States—a market differentiated by two regulations
10
Section 177 of Clean Air Act allows states to choose from:
• The US Environmental Protection Agency (EPA) has established national greenhouse gas emission standards.
• National Highway Traffic Safety Administration (NHTSA) has established Corporate Average Fuel Economy standards.
• Parallel standards are combined in nationwide standards until 2025, mandatory for all states not using section 177.
• California is allowed to set own (stricter) emission standards owing to special provisions in the Clean Air Act.
• ZEV mandate forces OEMs to sell increasing percentages of transitional ZEVs, i.e., battery electric vehicles (BEVs), fuel-cell electric vehicles (FCEVs), and plug-in hybrid electric vehicles (PHEVs) until 2025.
• As other states are not allowed to set own regulations, nine so-called Section 177 states have chosen to follow the ZEV mandate instead of national regulations.
National regulations California zero-emissions vehicle (ZEV) mandateor
2017 Spring Automotive Conference | 28 February 2017

© 2017 IHS Markit
0% 20% 40% 60% 80% 100%
General Motors
FCA
Ford
Hyundai
Renault-Nissan
Mazda
Toyota
Volkswagen Group
Honda
Daimler
BMW
Tesla Motors
ZEV states
United States—domestic OEMs are less dependent on ZEV states than European or Asian competitors
11
Passenger vehicle sales share by OEM and regulation region, 2015
Domestic players are
less dependent on ZEV states
Sources: US registration data by state Note: incl. passenger vehicles, excl. pickups, trucks, utility cars, vans
2017 Spring Automotive Conference | 28 February 2017

© 2017 IHS Markit
United States—ZEV states drive the powertrain electrification
12
2017 Spring Automotive Conference | 28 February 2017
ZEV mandate vehicle classifications and credits
3.0% 3.0% 3.0% 2.0% 4.0% 6.0% 8.0% 10.0%12.0%14.0%16.0%
3.0% 3.0% 3.0%2.5%
3.0%3.5%
4.0%4.5%
5.0%5.5%
6.0%
0%
5%
10%
15%
20%
25%
2012 2013 2014 2015 2016 2017 2018 2019 2020 2021 2022 2023 2024 2025
ZEV
TZEVs, Type 0ZEVs, NEVs
AT PZEVs
PZEVs
Example: Mercedes-Benz 2018 2019 2020 2021 2022 2023 2024 2025
Credits needed for 100,000 sales 4,500 7,000 9,500 12,000 14,500 17,000 19,500 22,000
Max. units:3,570 4,290 5,000 5,710 6,430 7,140 7,860 8,570
Min. units: 560 1,110 1,670 2,220 2,780 3,330 3,890 4,440
Mercedes-Benz GLC PHEV: 0.7 credits
(20 miles range assumed)
Mercedes-Benz EQBEV: 3.6 credits
(310 miles range assumed)
Mercedes-Benz example below: 13% actual ZEV, TZEV share enough to
reach 22% target in 2025
-13%
ZEV: Zero emission vehicleTZEV: Transitional zero emission vehicleNEV: Neighborhood electric vehicle
AT PZEV: Advanced technology partial zero emission vehiclePZEV: Partial zero emission vehicle

© 2017 IHS Markit
Europe—a common emission regulation, but differentmarket frameworks
13
Forecast drivers France United Kingdom Spain Italy Germany
Market frameworks
Incentives
Taxation
City restrictions
Infrastructure
TCOSmall segments
Larger segments
OEM offerings Industry wide
Left: until 2021 Right: 2021–26
2017 Spring Automotive Conference | 28 February 2017

14© 2017 IHS Markit
France—BEVs target limited market volumes owing to high price positioning
0%
10%
20%
30%
40%
50%
60%
70%
80%
90%
100%
0
500
1000
1500
2000
2500
300011
0€+
107
€10
5 €
102
€10
0 €
98 €
96 €
94 €
92 €
90 €
88 €
86 €
84 €
82 €
80 €
78 €
76 €
74 €
72 €
70 €
68 €
66 €
64 €
62 €
60 €
58 €
56 €
54 €
52 €
50 €
48 €
46 €
44 €
42 €
40 €
38 €
36 €
34 €
32 €
abs. %
Sal
es u
nits
List price in thousands
Cum
mulated sales
60% of the market priced below assumed minimum
I-Pace entry price
Source: Registration data of France premium, medium, and large SUVs
France premium, medium, and large SUV sales by price cluster
Increased malus pushes net prices of ICE vehicles, while decreasing
battery costs enables lower BEV
positioning
Future
2017 Spring Automotive Conference | 28 February 2017
15© 2017 IHS Markit
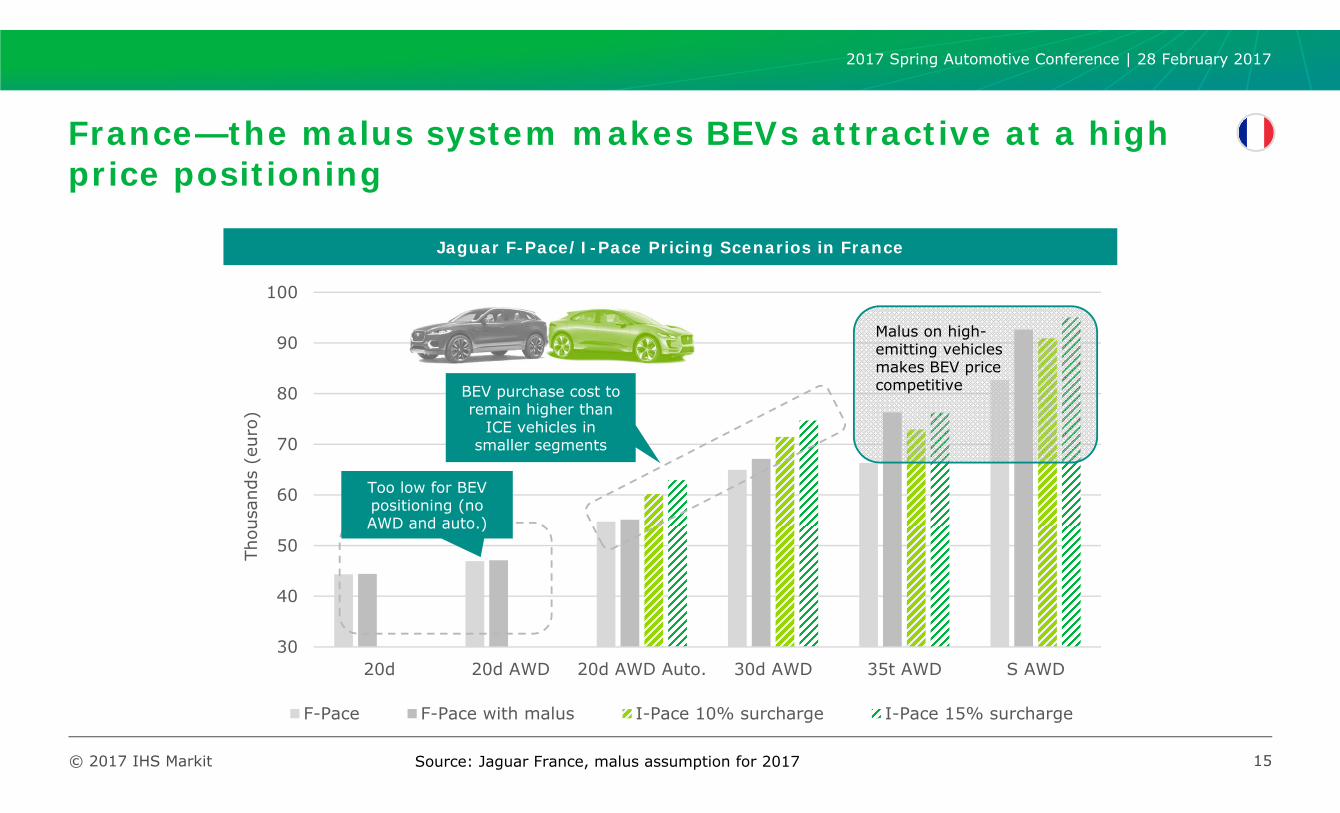
30
40
50
60
70
80
90
100
20d 20d AWD 20d AWD Auto. 30d AWD 35t AWD S AWD
Thou
sand
s (e
uro)
F-Pace F-Pace with malus I-Pace 10% surcharge I-Pace 15% surcharge
Jaguar F-Pace/I-Pace Pricing Scenarios in France
Malus on high-emitting vehicles makes BEV price competitiveBEV purchase cost to
remain higher than ICE vehicles in
smaller segments
Too low for BEV positioning (no AWD and auto.)
Source: Jaguar France, malus assumption for 2017
2017 Spring Automotive Conference | 28 February 2017
France—the malus system makes BEVs attractive at a high price positioning

© 2017 IHS Markit
2017 Spring Automotive Conference | 28 February 2017
16
• Preliminary questions
• Scenario concept
• Scenario examples
‒ Market regulations
‒ OEM strategies
‒ Electrification trends
• Summary
Contents

17© 2017 IHS Markit
CO
2re
du
ctio
n–
focu
sed
Opportunity cost–driven
Low opportunity costs High opportunity costs
Plays in segments with high CO2 level/impact
Plays in segments with low CO2 level/impact
2017 Spring Automotive Conference | 28 February 2017
OEM strategies—OEMs react differently to the challenges of regulation and electrification
–––

18© 2017 IHS Markit
0123456
Mild-hybrid gas
Mild-hybriddiesel
Full-hybrid gas
Full-hybrid diesel
PHEV gas
PHEV diesel
BEV
FCEV
Jaguar Land Rover
Category 1 2 3 4 5 6
% of total sales
0% 0–<1%
1–<5%
5–<10%
10–<20%
>20%
PHEV• PHEVs mostly use diesel engine.
Land Rover, especially, will not use gasoline engine for its PHEVs.
BEV
• Jaguar I-Pace is the first BEV in 2017. Luxury EV (I-Type) – Formula E engagement is to promote BEV.
• JLR rumored to open battery plantin cooperation with BMW and Ford
Ian Callum(Head of Design, Jaguar)
• In 2026, MHEVs will dominate the market of JLR vehicles and will help the OEM to reach future compliance targets.
“I’m clear in my mind that an electric Jaguar would be suitable for the brand. You have to move with the times.”
Mild hybrid electric vehicle (MHEV)
Alternative powertrain strategic relevance, 2026*Current strategic steps
Source: IHS Sales by Powertrain Scenario ForecastNote: *Sales shares across EU28, China, and United States
OEM strategies—Jaguar Land Rover (JLR) starts a BEV offensive
2017 Spring Automotive Conference | 28 February 2017
19© 2017 IHS Markit
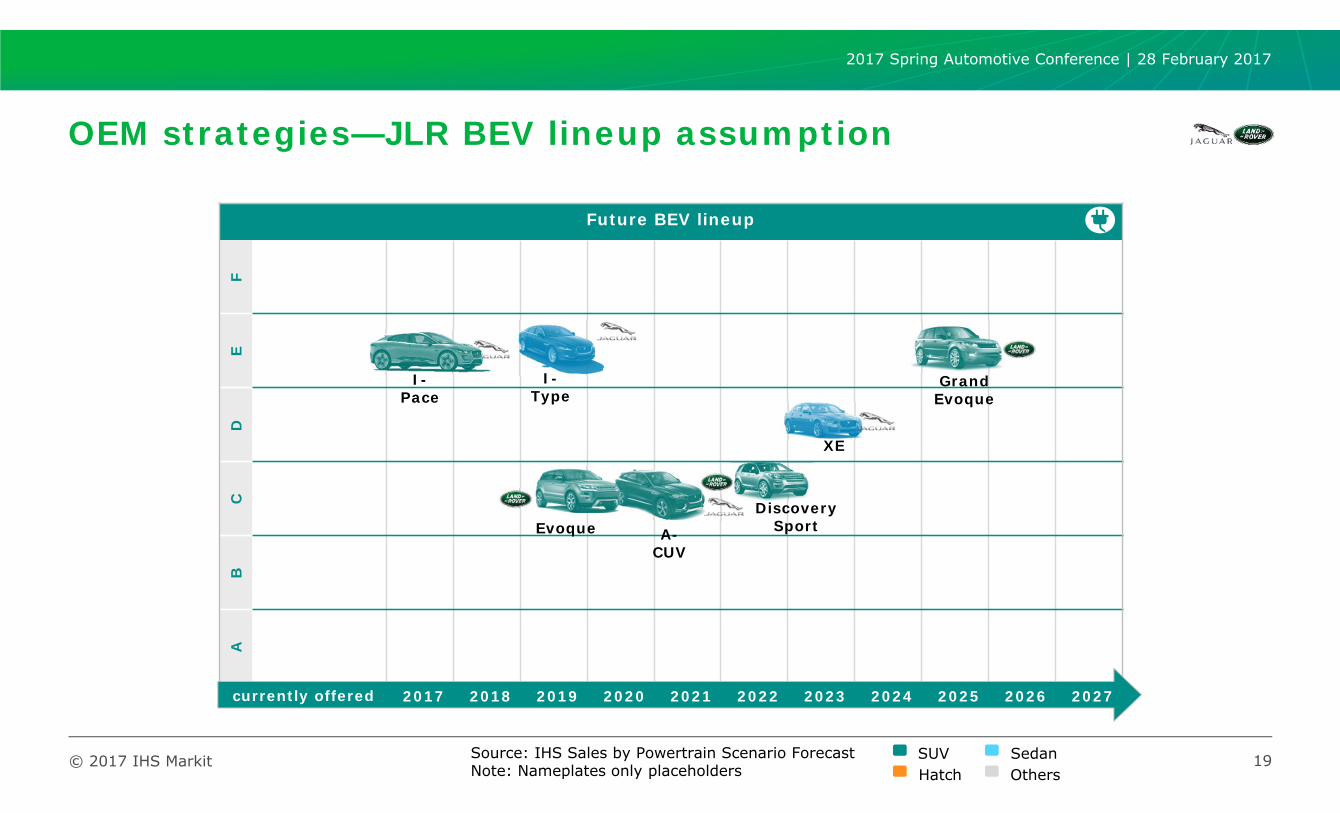
Future BEV lineupF
ED
CB
A
SUVHatch
SedanOthers
2017 2019 2021 2023 2025 20262018 2020 2022 2024 2027currently offered
I-Type
Grand Evoque
A-CUV
XE
Evoque
Source: IHS Sales by Powertrain Scenario ForecastNote: Nameplates only placeholders
Discovery Sport
I-Pace
OEM strategies—JLR BEV lineup assumption
2017 Spring Automotive Conference | 28 February 2017

20© 2017 IHS Markit
0123456
Mild-hybrid gas
Mild-hybriddiesel
Full-hybrid gas
Full-hybrid diesel
PHEV gas
PHEV diesel
BEV
FCEV
Alternative powertrain strategic relevance, 2026*
Category 1 2 3 4 5 6
% of total sales
0% 0–<1%
1–<5%
5–<10%
10–<20%
>20%
BMW i
• Portfolio expansion of the i brand focuses on technologies, rather than on BEVs.
• iNEXT is focusing on autonomous driving and connectivity.
Performance
• PHEV rollout across most model ranges, starting from 2 Series to 7Series, branded as iPerformance.
• BMW vehicles to be launched with BEV powertain (MINI, X3, 3 Series).
MHEV
• Fuel cell research in cooperation with Toyota
• Limited production volumes only due to costs and infrastructure hurdles
Fuel cellresearch
Current strategic steps
• In 2026, MHEV will dominate the offerings of BMW vehicle.
Source: IHS Sales by Powertrain Scenario ForecastNote: *Sales shares across EU28, China, and United States
OEM strategies—BMW rolls out PHEVs, followed by BEVs, while mild-hybridization almost becomes a standard
2017 Spring Automotive Conference | 28 February 2017

21© 2017 IHS Markit
Future BEV lineupF
ED
CB
A
5 Series i X5 i
3 Series iX3 i
X2 i
i5
i3
MINI E
SUVHatch
SedanOthers
Source: IHS Sales by Powertrain Scenario ForecastNote: Nameplates only placeholders
OEM strategies—BMW BEV lineup assumption
2017 2019 2021 2023 2025 20262018 2020 2022 2024 2027currently offered
2017 Spring Automotive Conference | 28 February 2017

© 2017 IHS Markit
2017 Spring Automotive Conference | 28 February 2017
22
• Preliminary questions
• Scenario concept
• Scenario examples
‒ Market regulations
‒ OEM strategies
‒ Electrification trends
• Summary
Contents
© 2017 IHS Markit
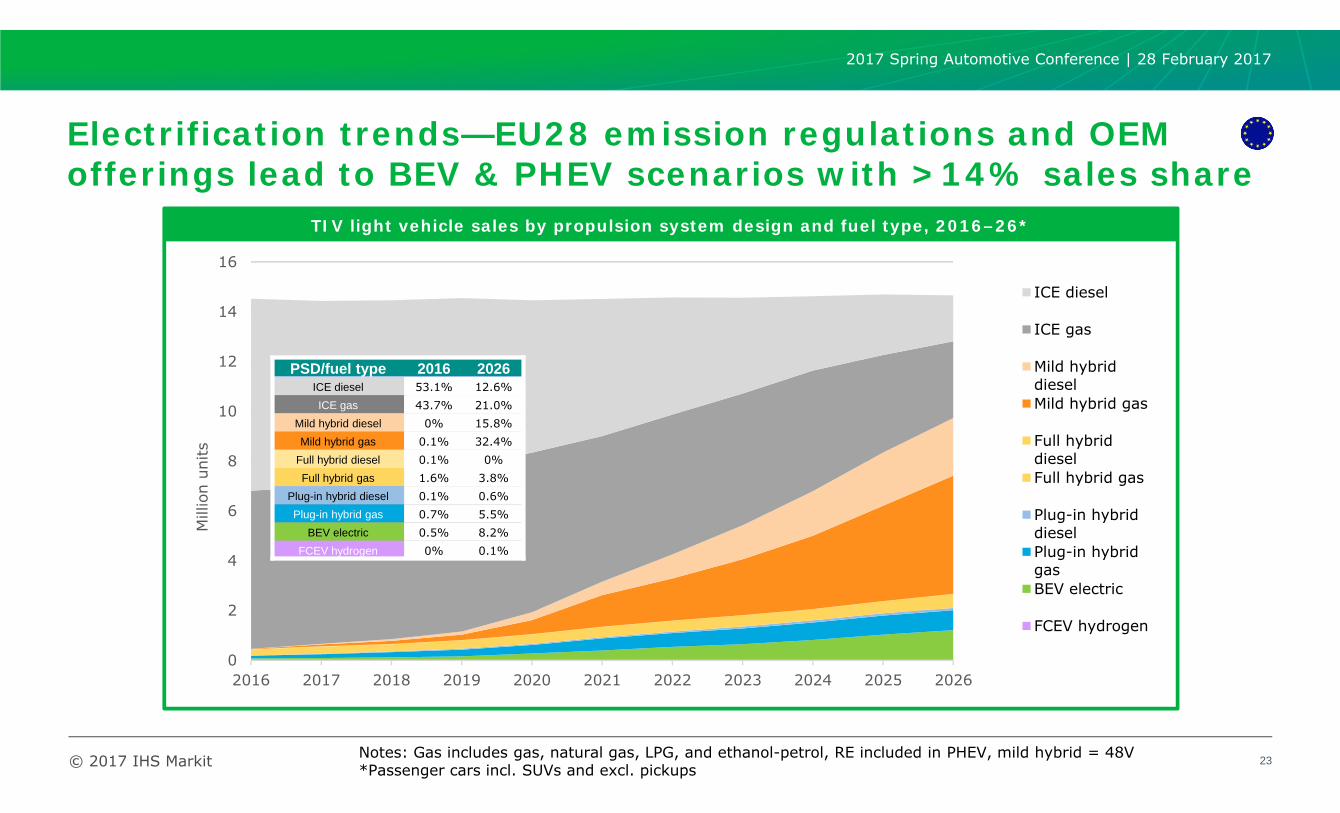
Electrification trends—EU28 emission regulations and OEM offerings lead to BEV & PHEV scenarios with >14% sales share
23
0
2
4
6
8
10
12
14
16
2016 2017 2018 2019 2020 2021 2022 2023 2024 2025 2026
Mill
ion
units
ICE diesel
ICE gas
Mild hybriddieselMild hybrid gas
Full hybriddieselFull hybrid gas
Plug-in hybriddieselPlug-in hybridgasBEV electric
FCEV hydrogen
TIV light vehicle sales by propulsion system design and fuel type, 2016–26*
Notes: Gas includes gas, natural gas, LPG, and ethanol-petrol, RE included in PHEV, mild hybrid = 48V *Passenger cars incl. SUVs and excl. pickups
PSD/fuel type 2016 2026ICE diesel 53.1% 12.6%ICE gas 43.7% 21.0%
Mild hybrid diesel 0% 15.8%Mild hybrid gas 0.1% 32.4%
Full hybrid diesel 0.1% 0%Full hybrid gas 1.6% 3.8%
Plug-in hybrid diesel 0.1% 0.6%Plug-in hybrid gas 0.7% 5.5%
BEV electric 0.5% 8.2%FCEV hydrogen 0% 0.1%
2017 Spring Automotive Conference | 28 February 2017

© 2017 IHS Markit 24
0
0.5
1
1.5
2
2.5
3
3.5
2016 2017 2018 2019 2020 2021 2022 2023 2024 2025 2026
Mill
ion
units
ICE diesel
ICE gas
Mild hybriddieselMild hybrid gas
Full hybriddieselFull hybrid gas
Plug-in hybriddieselPlug-in hybridgasBEV electric
FCEV hydrogen
Premium light vehicle sales by propulsion system design and fuel type, 2016–26*
PSD/fuel type 2016 2026ICE diesel 68.8% 7.3%ICE gas 27.3% 7.1%
Mild hybrid diesel 0% 23.5%Mild hybrid gas 0% 39.5%
Full hybrid diesel 0.2% 0.2%Full hybrid gas 1.4% 1.3%
Plug-in hybrid diesel 0.1% 2.1%Plug-in hybrid gas 1.7% 6.8%
BEV electric 0.5% 12.2%FCEV hydrogen 0% 0.1%
Note: Gas includes gas, natural gas, LPG, and ethanol-petrol, RE included in PHEV, mild hybrid = 48V *Passenger cars incl. SUVs and excl. pickups
Electrification trends—BEV & PHEV scenarios reach >20%sales share in the European premium vehicle market
2017 Spring Automotive Conference | 28 February 2017
25© 2017 IHS Markit
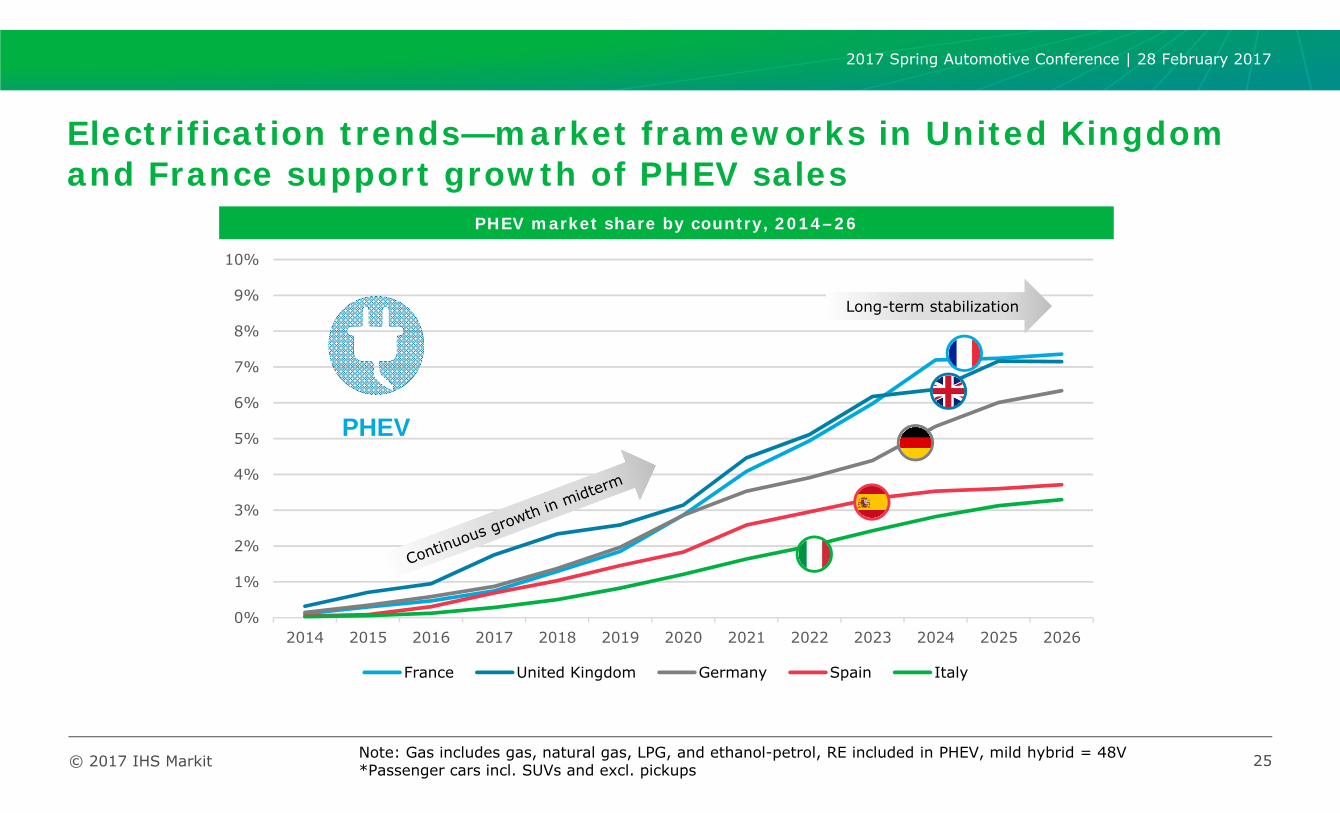
0%
1%
2%
3%
4%
5%
6%
7%
8%
9%
10%
2014 2015 2016 2017 2018 2019 2020 2021 2022 2023 2024 2025 2026
France United Kingdom Germany Spain Italy
PHEV market share by country, 2014–26
PHEV
Long-term stabilization
Note: Gas includes gas, natural gas, LPG, and ethanol-petrol, RE included in PHEV, mild hybrid = 48V *Passenger cars incl. SUVs and excl. pickups
Electrification trends—market frameworks in United Kingdom and France support growth of PHEV sales
2017 Spring Automotive Conference | 28 February 2017

26© 2017 IHS Markit
BEV
0%
2%
4%
6%
8%
10%
12%
14%
2014 2015 2016 2017 2018 2019 2020 2021 2022 2023 2024 2025 2026
France United Kingdom Germany Spain Italy
BEV market share by country, 2014–26
Slow growth in midterm
Note: Gas includes gas, natural gas, LPG, and ethanol-petrol, RE included in PHEV, mild hybrid = 48V *Passenger cars incl. SUVs and excl. pickups
Electrification trends—significant growth of BEV sales is expected after 2019
2017 Spring Automotive Conference | 28 February 2017

© 2017 IHS Markit 27
• Preliminary questions
• Scenario concept
• Scenario examples
‒ Market regulations
‒ OEM strategies
‒ Electrification trends
• Summary
Contents
2017 Spring Automotive Conference | 28 February 2017
© 2017 IHS Markit
Summary
• Markets require individual forecast approachesincluding anticipations of future regulations.
• OEM strategies and vehicle portfolios require individual assessmentsincluding anticipations of future emission compliance.
• Powertrain electrification is in progress. Customer acceptance and speed of xEV penetration trend depend on the closure of price and convenience gaps.
• Overall, the complexity of the forecast process increases significantly,along with your questions regarding the assumptions and their sensitivity regarding scenarios. We look forward to discuss them with you.
28
2017 Spring Automotive Conference | 28 February 2017

IHS MarkitTM COPYRIGHT NOTICE AND DISCLAIMER © 2017 IHS Markit.
No portion of this presentation may be reproduced, reused, or otherwise distributed in any form without prior written consent of IHS Markit. Content reproduced or redistributed with IHS Markit permission must display IHS Markit legal notices and attributions of authorship. The information contained herein is from sources considered reliable, but its accuracy and completeness are not warranted, nor are the opinions and analyses that are based upon it, and to the extent permitted by law, IHS Markit shall not be liable for any errors or omissions or any loss, damage, or expense incurred by reliance on information or any statement contained herein. In particular, please note that no representation or warranty is given as to the achievement or reasonableness of, and no reliance should be placed on, any projections, forecasts, estimates, or assumptions, and, due to various risks and uncertainties, actual events and results may differ materially from forecasts and statements of belief noted herein. This presentation is not to be construed as legal or financial advice, and use of or reliance on any information in this publication is entirely at your own risk. IHS Markit and the IHS Markit logo are trademarks of IHS Markit.
IHS Markit Customer Care:[email protected]: +1 800 IHS CARE (+1 800 447 2273)Europe, Middle East, and Africa: +44 (0) 1344 328 300Asia and the Pacific Rim: +604 291 3600