autonoma - david birge, kairav shroff, daniel fink - potential for collective ownership of american...
TRANSCRIPT

David BirgeMassachusetts Institute of Technology
Daniel FinkMassachusetts Institute of Technology
Kairav ShroffMassachusetts Institute of Technology
Potential for Collective Ownership of American Industrial LandA Necessary but Not Sufficient Condition for Autonomous Society
PART 1: Problem Set-Up
& Main ResearchQuestion
PART 2: Spatial-Financial Model
& Baseline Scenario
PART 3: 2 Test Scenarios
PART 4:Conclusions &
Next Steps

Pier Aureli describes Carl Schmitt’s conception of the nomos as:
“The relationship between the concreteness of the ‘ground’ and the construction of a political order....[which] is made manifest in the primary event of land appropriation, an action that precedes the formation of any geo-political institution such as the community, the city or the state. The nomos is therefore the basis for all the catego-ries that define the life of a community such as sovereignty, justice and distribution of resources.”
-- Pier Aureli (Studio Brief, Diploma 14, 2015 - 2016)
3Potential for Collective Ownership of American Industrial Land: Birge, Fink, Shroff

Appropriating and controlling land allows an autonomous groups to do the following:
I. Establish, physically locate, and design the built-form for new institutions it deems necessary to successfully pursue it’s autonomy.
II. Control over the physical design of housing and landscape, allowing the group to balance costs with amenities in order to ensure economic and social resilience.
III. Collocation of housing and those institutions which provide collective-scale economic or metabolic benefits, such as bulk-purchasing, shared services, etc.
IV. Establishment of a “home -base” for the community which simultaneously allows flexibility of work within the wage-labor system, while recognizing the home and local neighborhood as the sites of simple day-to-day physical and social reproduction, and thus as the primary sites, and principal activities, where members can establish a shared life-world
4Potential for Collective Ownership of American Industrial Land: Birge, Fink, Shroff

a
b
d
T
T
Union Square
Plot41 Inner Belt Rd
295ft x 235ft = ~70,000 SF
Value: $3,500,000
Inner-Belt
Inman Square
North-EndBoston
5Potential for Collective Ownership of American Industrial Land: Birge, Fink, Shroff

I. Cheapest land available in most cities. ($76.53 vs. $191.36 in 2009)
II. Large plot sizes which doesn’t limit size of collective. (23,496 ft2)
III. Good distribution in both inner and outer suburban areas.
WHY INDUSTRIAL LAND?6Potential for Collective Ownership of American Industrial Land: Birge, Fink, Shroff

I. Good data on housing rents, utilities, land uses, and land prices.
II. Relatively young, well-educated population, likely to be interested in shared living.
III. Inner-Belt District
a. Large, continous warehousing and industrial district with roughly 10 million square feet.
b. Centrally located with good access to transit and town centers.
c. Land is under pressure to be redeveloped, a new vision could force a reassessment.
IV. A good generalizable case-study. If it works here, it will probably work in many other areas.
WHY SOMERVILLE?7Potential for Collective Ownership of American Industrial Land: Birge, Fink, Shroff

PART 2: Spatial-Financial Model
& Baseline Scenario
8Potential for Collective Ownership of American Industrial Land: Birge, Fink, Shroff
9Potential for Collective Ownership of American Industrial Land: Birge, Fink, Shroff

INCOME + TAXES
CONSUMPTION + TRANSPORT
RENTAL INCOME
LAND & DEMO
BUILDING SPACE
UTILITIES, REPAIR, INSUR.
MORTGAGE & TAXES
SITE WORK
SOFT COSTS
MONTHLY CASH-FLOW, MINUS HOUSING + CHILDCARE + COLLECTIVE FEES
MONTHLY COST OF HOUSING (ALL FACTORS)
INFLATION
UNEMPLOYMENT
NUMBER OF MEMBERS
LOCATION MULTIPLIER
INVESTMENT RETURNS
YEARS TO RUN MODEL
RHINO GEOMETRY
TRANSPORT & CONSUMPTION COEFF.
AVERAGE INCOMEAVERAGE GROWTH
RENT INCREASE
PLOT COSTS
FLOORSSHARED SPACERENTAL SPACE
RENTAL RATES
LOAN TERMSDEFEREMENT
+-
thread 1
global parameters
thread 2
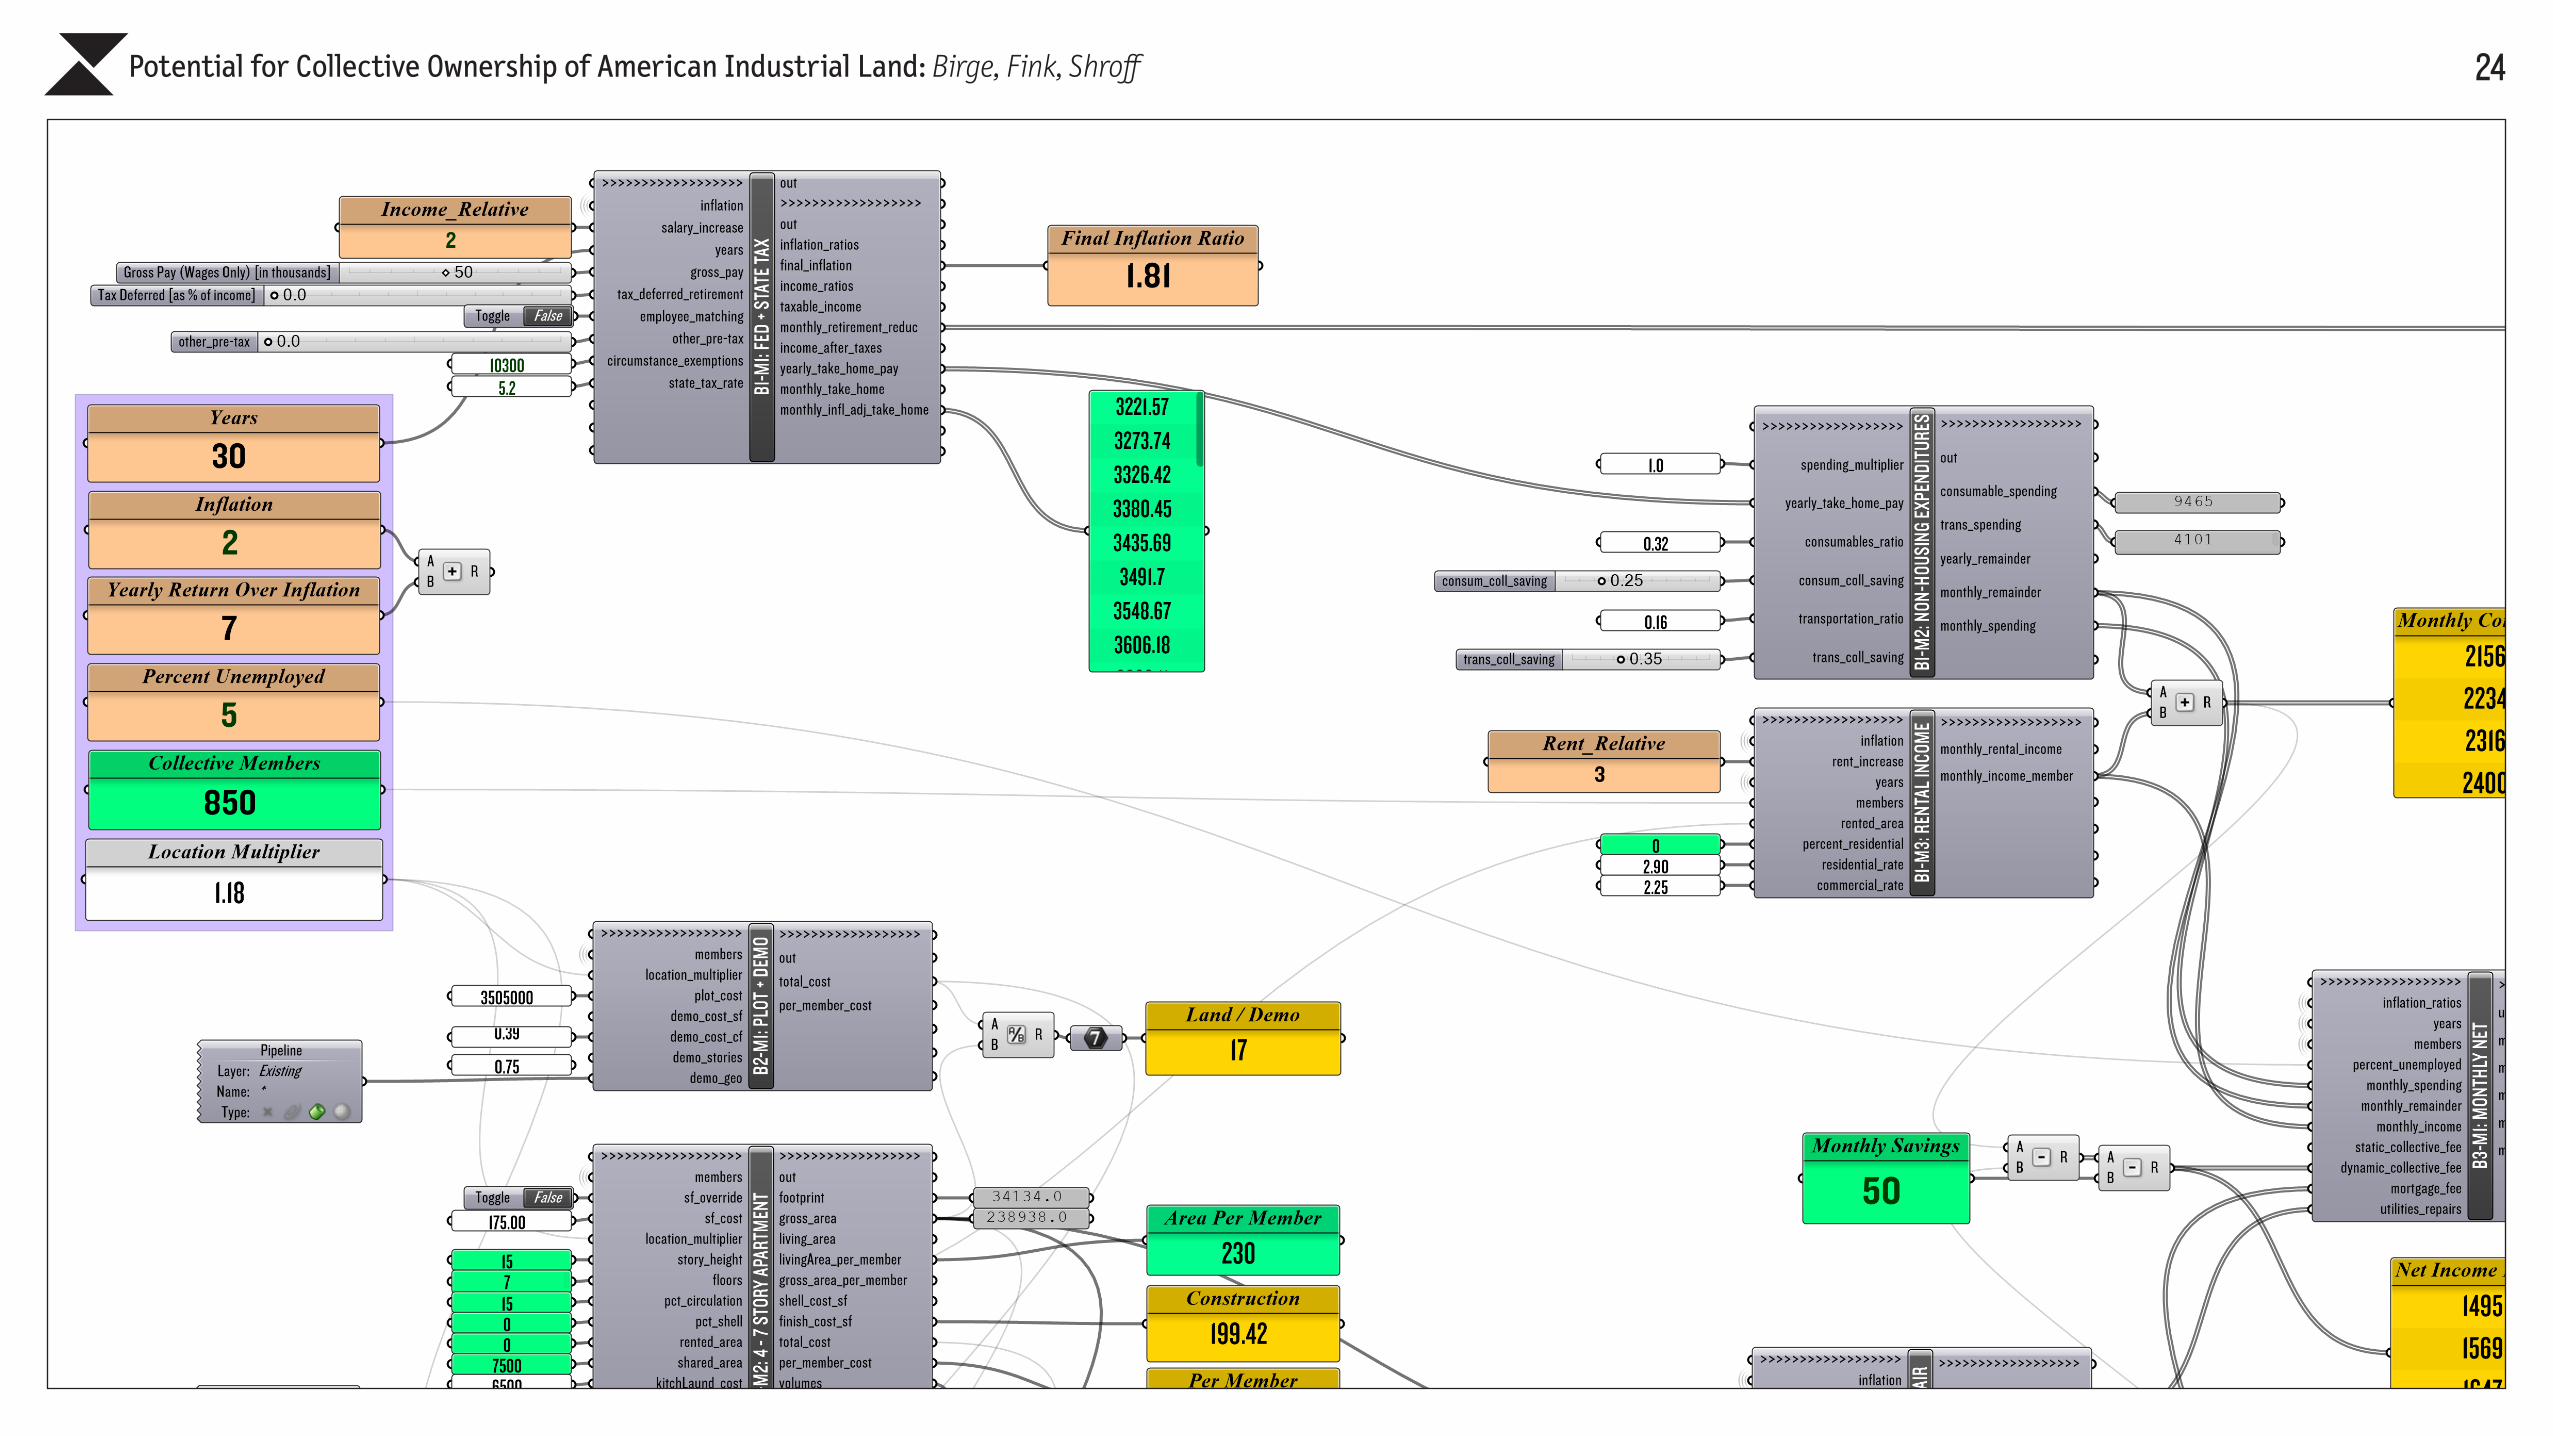
10Potential for Collective Ownership of American Industrial Land: Birge, Fink, Shroff
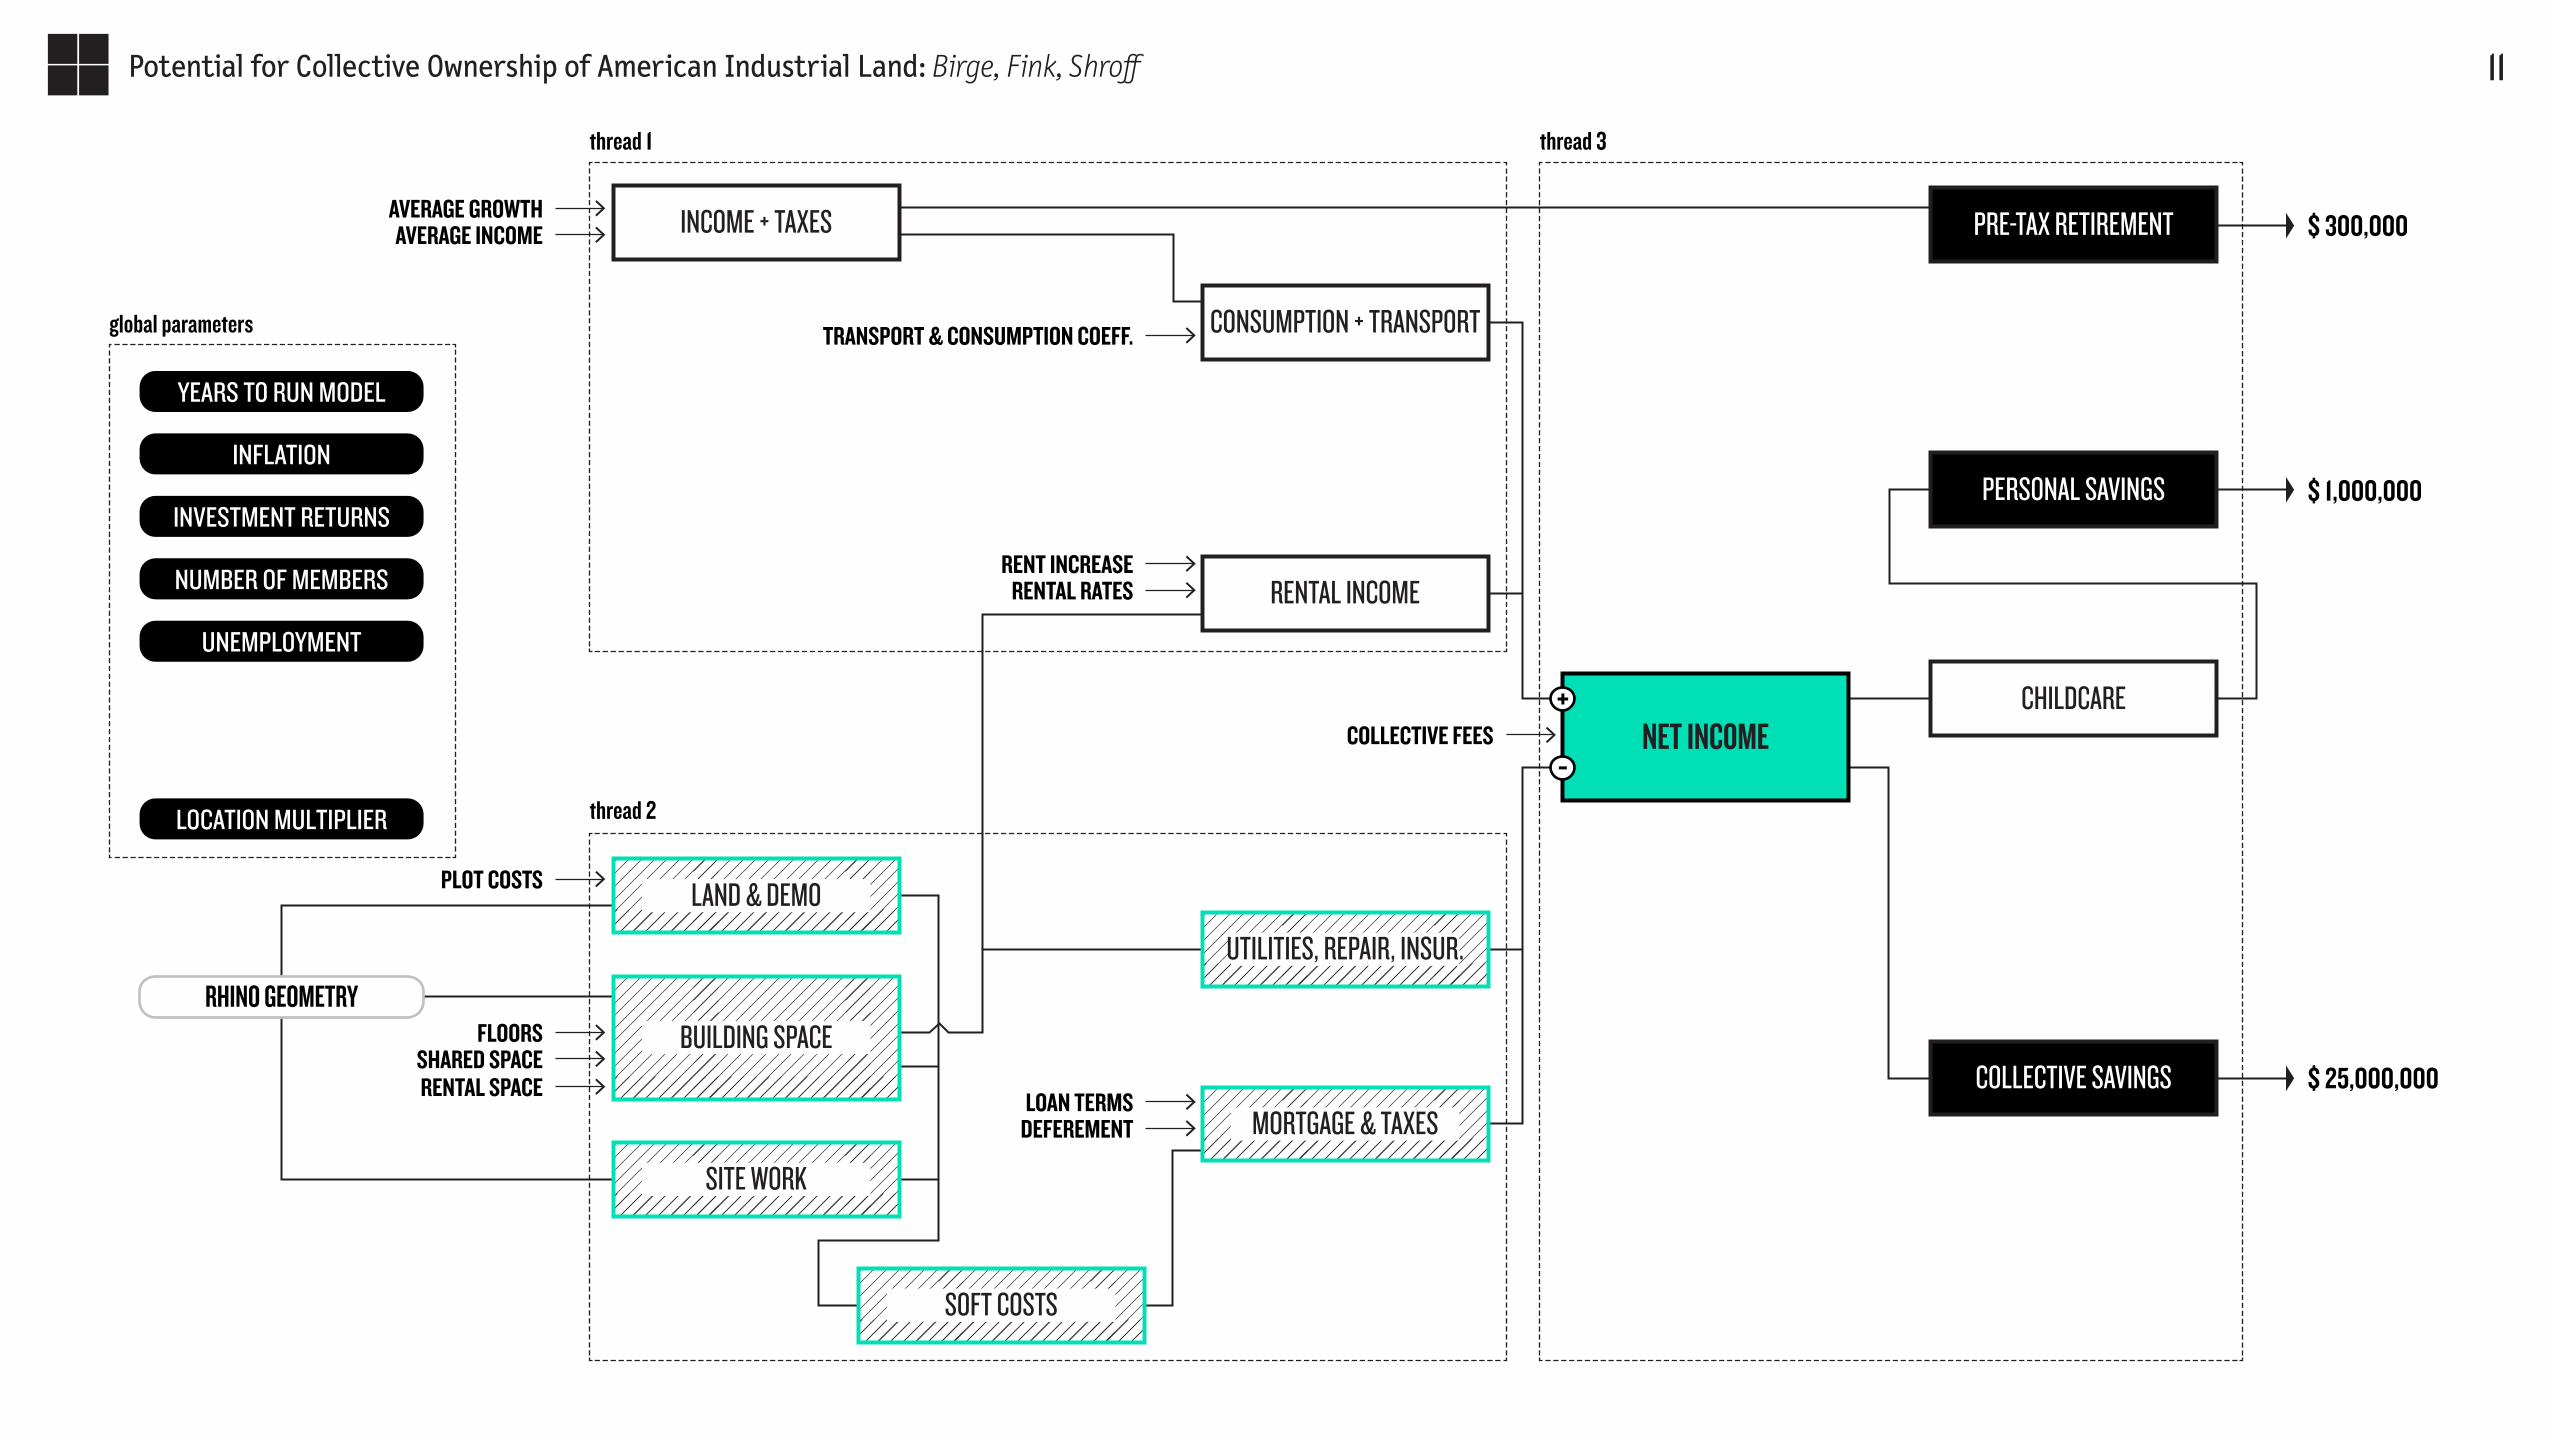
INCOME + TAXES
CONSUMPTION + TRANSPORT
RENTAL INCOME
CHILDCARE
PRE-TAX RETIREMENT
PERSONAL SAVINGS
COLLECTIVE SAVINGS
NET INCOME
LAND & DEMO
BUILDING SPACE
UTILITIES, REPAIR, INSUR.
MORTGAGE & TAXES
SITE WORK
SOFT COSTS
INFLATION
UNEMPLOYMENT
NUMBER OF MEMBERS
LOCATION MULTIPLIER
INVESTMENT RETURNS
YEARS TO RUN MODEL
RHINO GEOMETRY
TRANSPORT & CONSUMPTION COEFF.
AVERAGE INCOMEAVERAGE GROWTH
RENT INCREASE
PLOT COSTS
FLOORSSHARED SPACERENTAL SPACE
RENTAL RATES
LOAN TERMSDEFEREMENT
COLLECTIVE FEES
$ 1,000,000
$ 25,000,000
$ 300,000
+
-
thread 1
global parameters
thread 2
thread 3
11Potential for Collective Ownership of American Industrial Land: Birge, Fink, Shroff

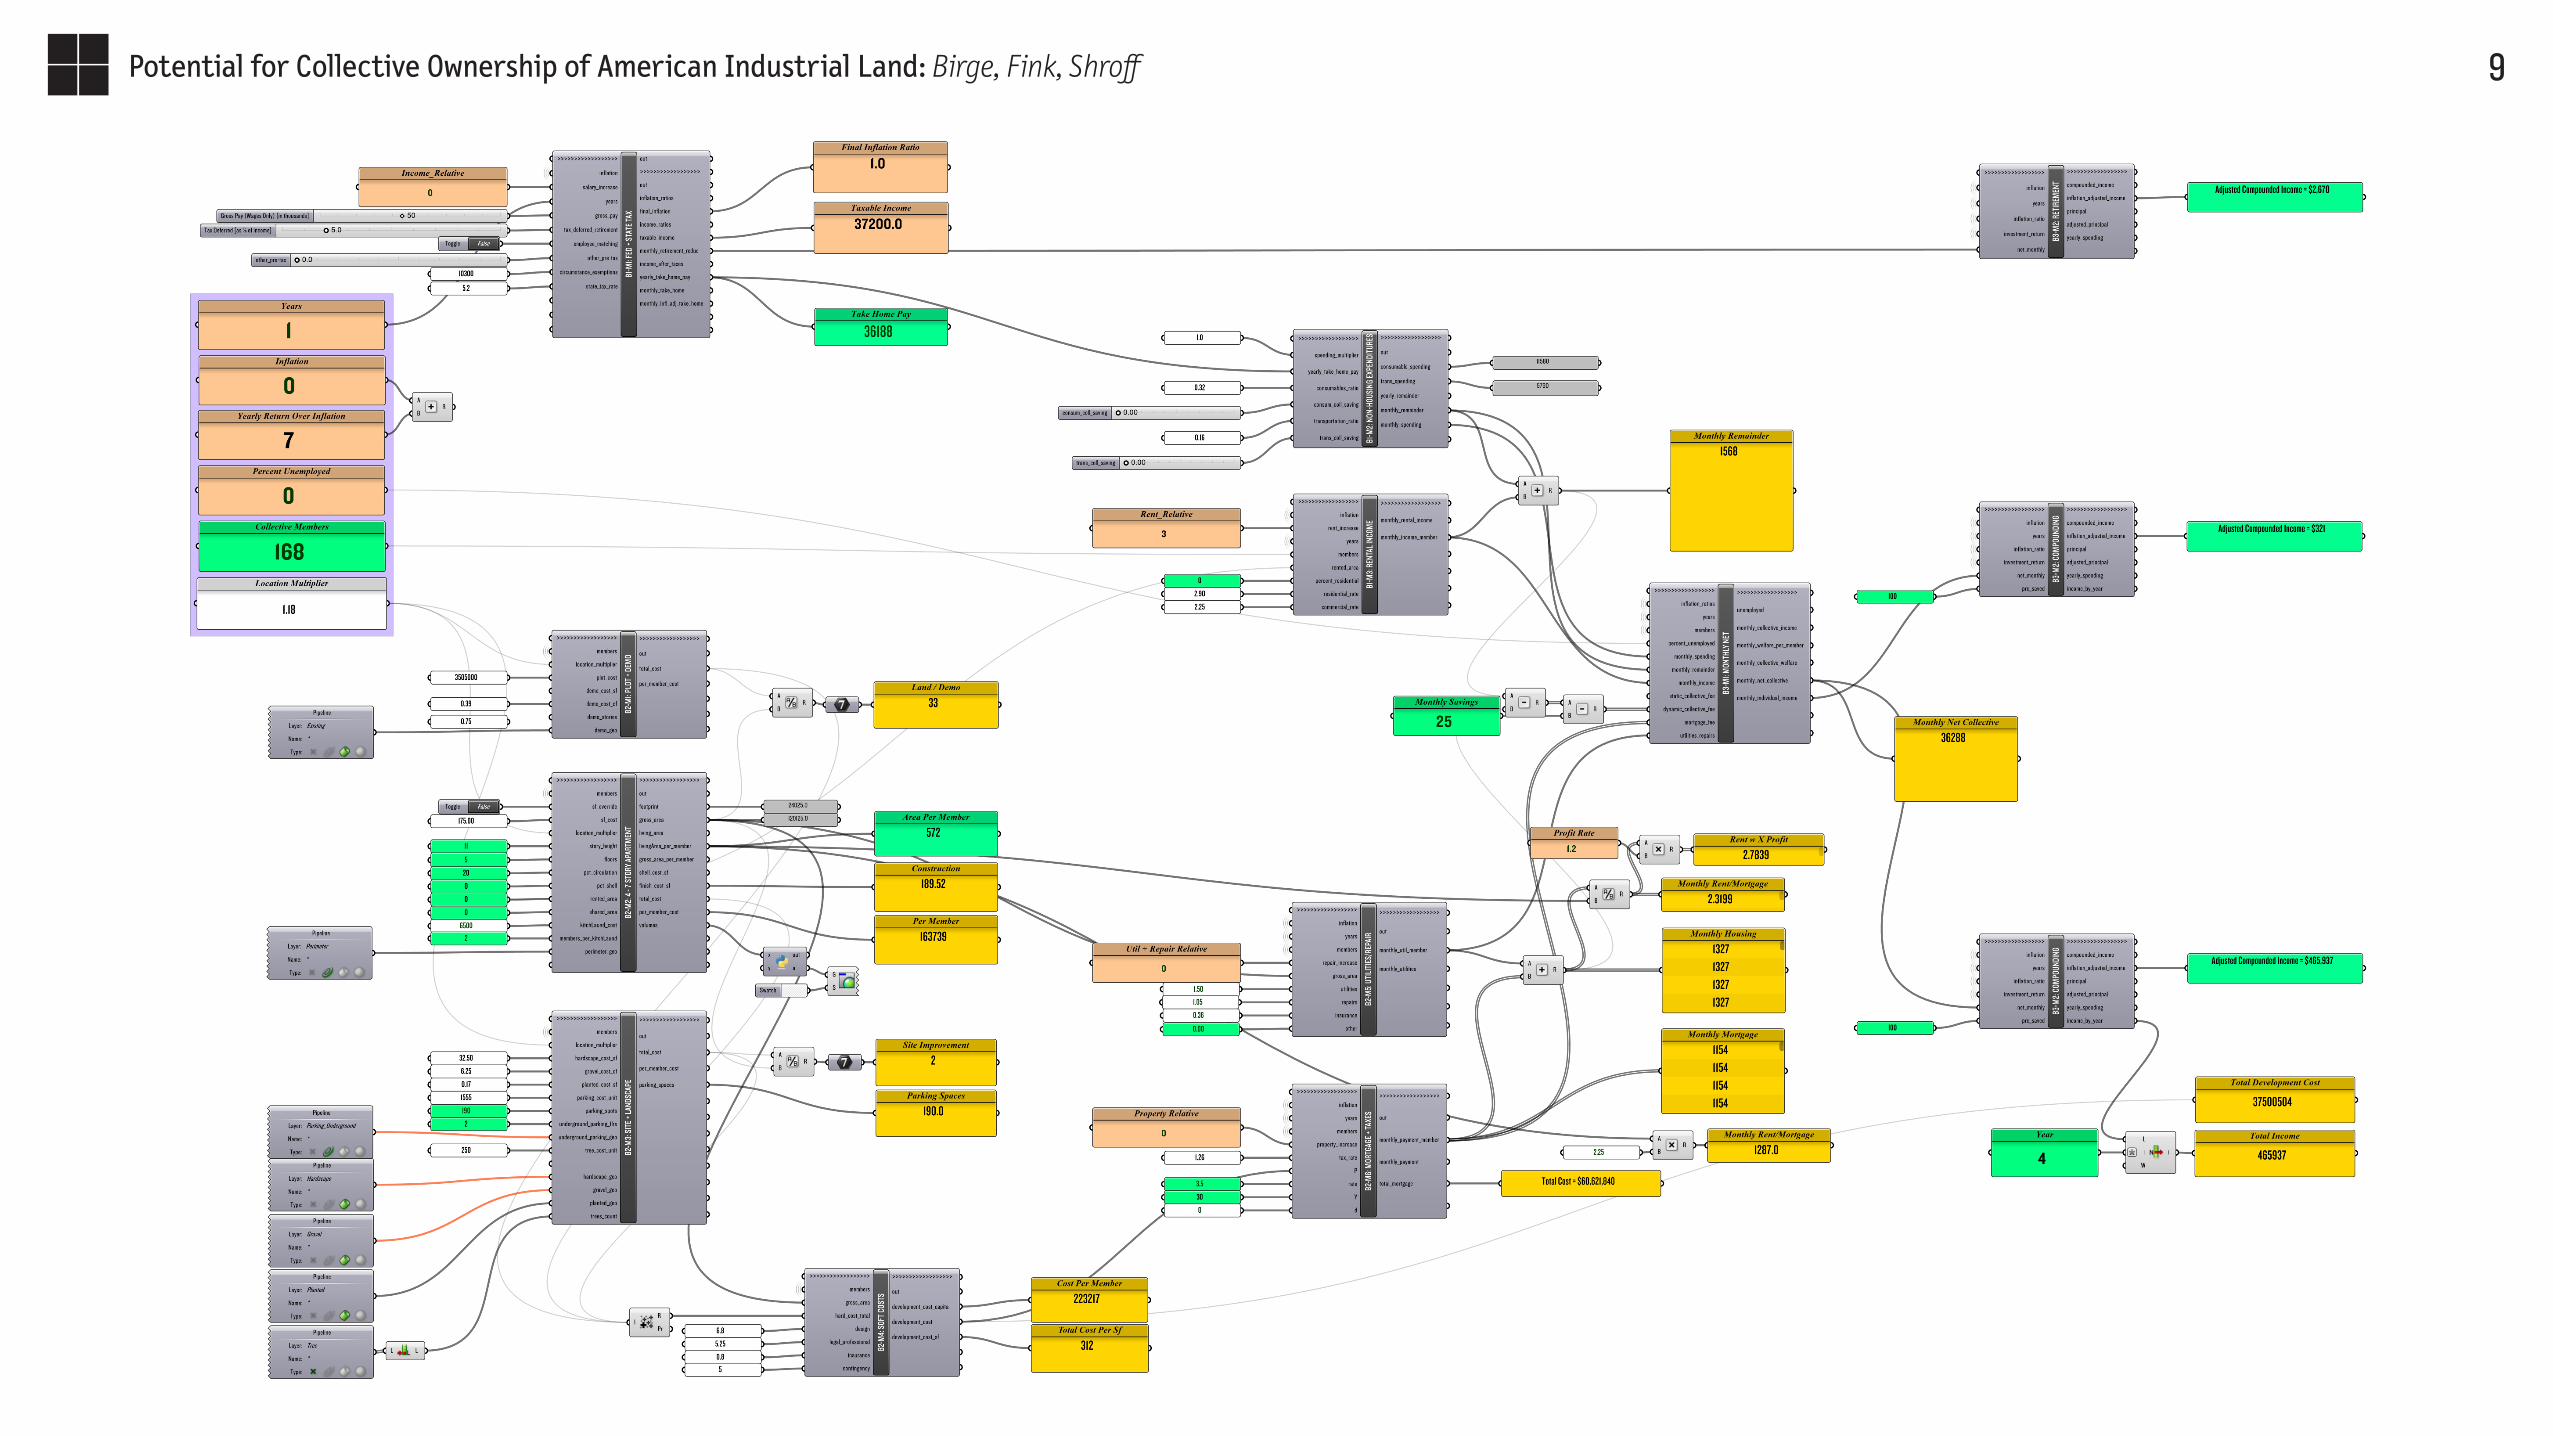
Most modules use readily available formulas: for mortgages, compounding interest, and tax
calculations for example. These require relatively simple math, and have been tested against
individual online calculators to verify accuracy. To verify housing costs, we run a simple baseline,
using 2015 data from Somerville.
MODEL VERIFICATION
For release: 10:00 a.m. (EDT), Thursday, September 3, 2015 USDL-15-1696
Technical Information: (202) 691-6900 • [email protected] • www.bls.gov/cex Media Contact (202) 691-5902 • [email protected]
CONSUMER EXPENDITURES – 2014Average expenditures per consumer unit in 2014 were $53,495, a 4.7-percent increase from 2013 levels, the U.S. Bureau of Labor Statistics reported today. During the same period, the Consumer Price Index (CPI-U) rose 1.6 percent1. In 2013, spending decreased 0.7 percent. Average pre-tax income per consumer unit increased at about the same pace as expenditures, up 4.8 percent from 2013.
Consumer units include families, single persons living alone or sharing a household with others but who are financially independent, or two or more persons living together who share expenses.
Most major components of household spending increased in 2014, as shown in table A. Many of the categories with large percentage increases in expenditures rebounded from declines in spending in 2013. The rise in healthcare expenditures was one of the largest increases among the major components. The subcomponent for health insurance expenditures increased primarily due to an improvement in the survey questionnaire. Because of the questionnaire change for health insurance, these estimates are not strictly comparable to prior years.
Note on health insurance
More consumer units reported expenditures for health insurance in 2014 than in 2013, and because of an improvement in interview collection methods, higher expenditures were reported. The percent of households reporting quarterly expenditures on health insurance increased from 65.5 percent in 2013 to 68.0 percent in 2014. The insurance questions were revised from 3-month recall questions to questions about the amount of the last payment and the payment period.
The new estimates are more accurate because the respondent does not have to calculate a quarterly estimate—instead the estimate is calculated by BLS, using the amount of the last payment which respondents are more likely to know. On the basis of cognitive testing, BLS concluded that these new questions produce better estimates. For those consumer units whose time in sample encompassed reporting health insurance expenditures using both the old questions and the new questions, the mean expenditure using the new questions increased by 26.2 percent compared to the old questions. In the 2014 tables, some of the over-the-year change in the healthcare expenditure data, especially in the health insurance subcomponent, is due to these improvements to the survey questionnaire.
The Greater Boston HousingReport Card 2015
The Housing Cost ConundrumBarry BluestoneJames HuessyEleanor White
Charles EisenbergTim Davis
with assistance fromWilliam Reyelt
Prepared by
The Kitty and Michael Dukakis Center for Urban and Regional Policy
Northeastern University
for
The Boston Foundation
Edited byRebecca KoepnickMary Jo MeisnerKathleen Clute
The Boston Foundation
U N D E R S T A N D I N G B O S T O N
November 2015
45T h e G r e a t e r B o s t o n H o u s i n g R e p o r t C a r d 2 0 1 5
soft costs, financial costs, and developer fees are each under $30 per square foot and together account for 24 percent of total development costs .
The costs of developing suburban projects in Massa-chusetts are shown in Figure 4.3 . Note that suburban land-acquisition costs are about 85 percent of the cost of land for urban projects, but site preparation costs are more than double . This is because the cost of develop-ing infrastructure, including water connections and sanitation, is higher in many suburbs . In urban areas, the infrastructure is already in place and publicly supplied . At $141/sq . ft ., construction costs in the suburbs are catching up with those in the cities . Soft costs, financial costs, and developer fees are on par as well . Overall, it costs a bit less to build in the suburbs, but only because the land is somewhat less expensive .
Changes over TimeThere is a general agreement that housing has become more expensive in the past decade and our data bear that out . From the period covering 2004–2008 to the period covering 2011–2015, Total Development Costs (TDC) for Massachusetts projects increased by $31 .82 per square foot (13 .2 percent) for urban projects and by $60 .80 per square foot (30 .2 percent) for suburban ones . This came at a time of modest overall inflation of 9 .5 percent as measured by the nation’s GDP deflator .
more like $3,215 in Boston — or 52 percent of the gross income of the median-income household .7
Large multi-family developments, as we will suggest later in this chapter, are somewhat less expensive to build on a square-foot basis as a result of economies of scale . The same is true of larger units with three or more bedrooms because the most expensive elements of a unit are the kitchen and bathroom . But even taking into account somewhat lower development costs per square foot, today’s cost of development renders home prices and rents for new housing well outside the feasible range for most working and middle-income households in Greater Boston .
The Cost Components of New Housing
The data we obtained for this analysis provides infor-mation on the average costs for each major compo-nent of housing development . For urban projects in Massachusetts, this information is found in Figure 4.2 . Of the total $273 .59 development cost per square foot, land acquisition runs about $41 per square foot, or about 15 percent of the total . Site preparation costs are another $8 .32 a square foot, or about 3 percent of the total . Construction costs, including labor and materials, account for just over half (58 percent) of total devel-opment costs — $159 per square foot . The remaining
$40.88
$8.32
$159.04
$29.20
$19.17
$16.97
Construction CostsSoft CostsFinancing CostsDeveloper FeeLand AcquisitionSite Costs
TotalDevelopment Cost
$273.59
FIGURE 4 .2
Total Housing Development Costs Per Square Foot by Cost Component,
Massachusetts Urban Projects, 2011–2015
Source: Dukakis Center Housing Cost Analysis
$34.17
$19.86
$140.60
$28.39
$21.27
$18.11
TotalDevelopment Cost
$262.39
Construction CostsSoft CostsFinancing CostsDeveloper FeeLand AcquisitionSite Costs
FIGURE 4 .3
Total Housing Development Costs Per Square Foot by Cost Component,
Massachusetts Suburban Projects, 2011–2015
Source: Dukakis Center Housing Cost Analysis
12Potential for Collective Ownership of American Industrial Land: Birge, Fink, Shroff

Assuming 1 person per bedroom:
Avgerage Space Per Person = 572.5Average Rent & Utilities = $1,283Average Rent & Utilities Per SF = $2.36
13Potential for Collective Ownership of American Industrial Land: Birge, Fink, Shroff
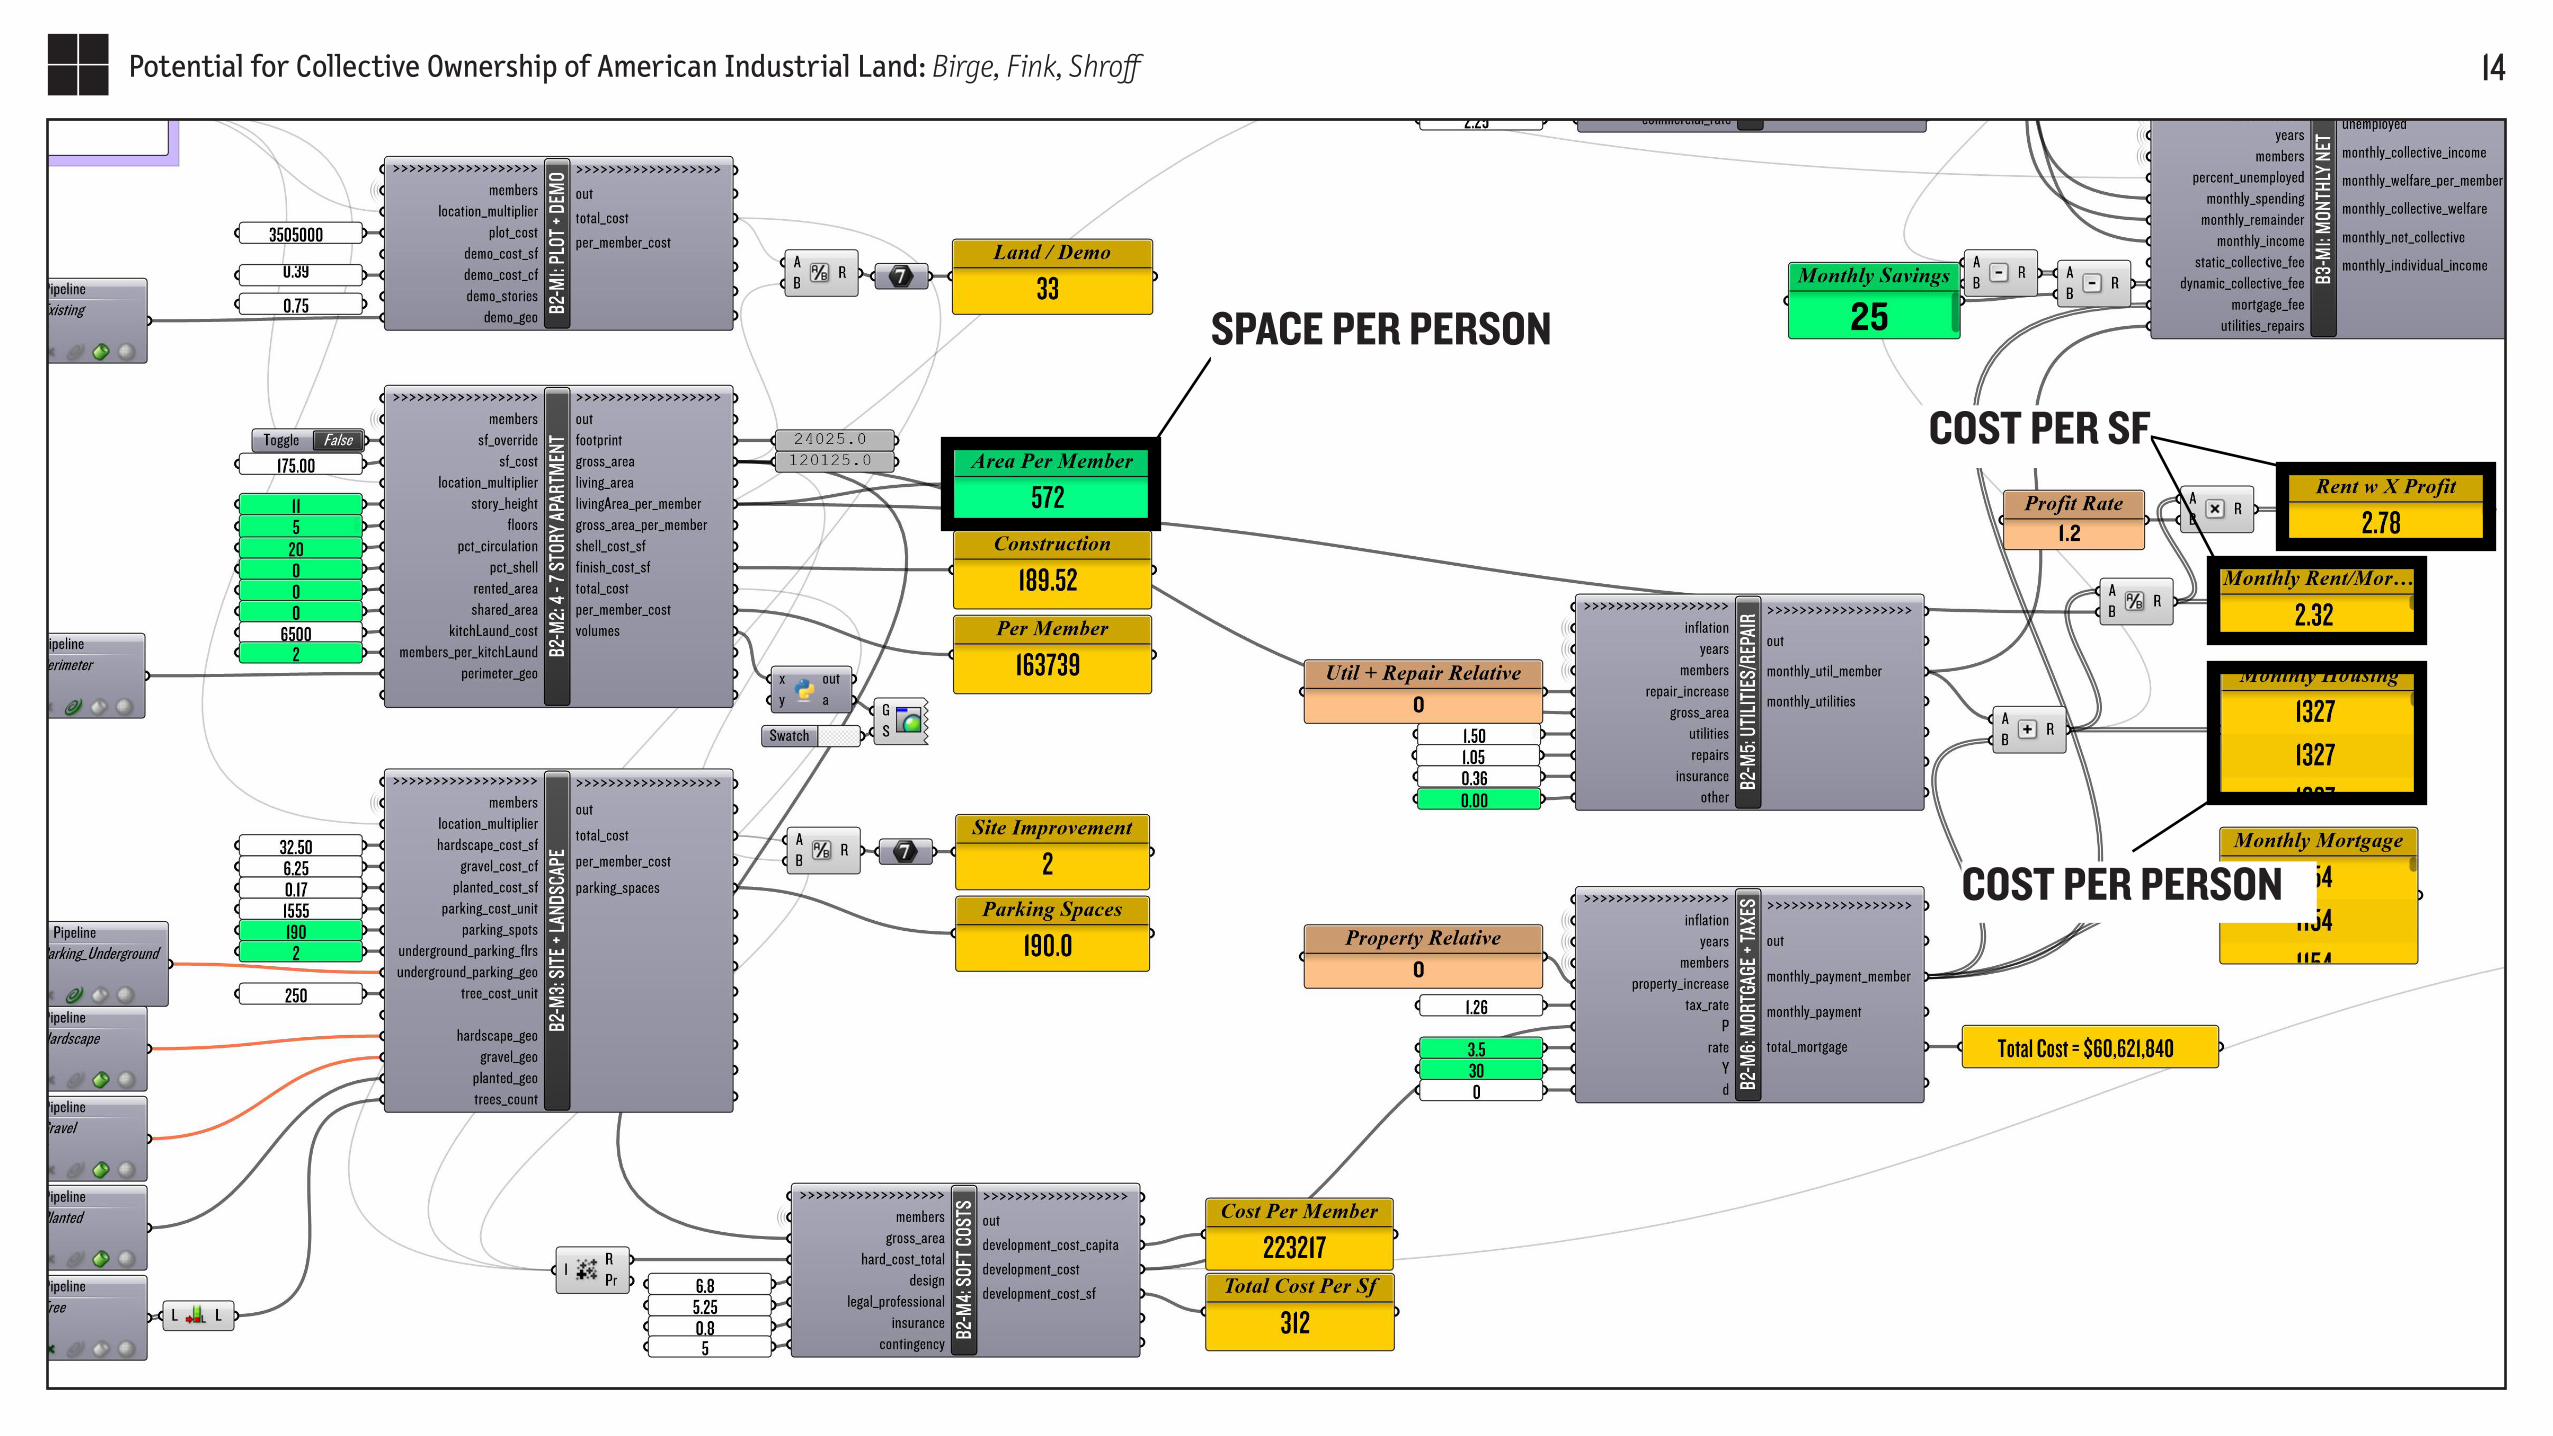
SPACE PER PERSON
COST PER SF
COST PER PERSON
14Potential for Collective Ownership of American Industrial Land: Birge, Fink, Shroff

15Potential for Collective Ownership of American Industrial Land: Birge, Fink, Shroff
PART 3: 2 Test Scenarios

16Potential for Collective Ownership of American Industrial Land: Birge, Fink, Shroff
235 feet
Floor height: 15’Floors: 7
T otal Area: 238,938 ft2
Members: 850
Scenario 2 - Maximum Expansion
295 feet
Floor height: 12’Floors: 7
T otal Area: 146,776 ft Members: 275
Scenario 1 - Minimum Income
2 Floor height: 12’Floors: 7
T otal Area: 262,381 ft 2
Members: 460
Scenario 3 - Economic Co-housing

17Potential for Collective Ownership of American Industrial Land: Birge, Fink, Shroff
SCENARIO 1: MINIMUM INCOME GROUP
INCOME
COLLECTIVE SAVINGS
MEMBERS
RENTAL SPACE
CONSTRUCTION COST PER SF
MORTGAGE TERMS
$25,000 [$20,800 is minimum wage]25% Consumable, 35% Transportation275 --> 400 SF per person12,000 SF$280 SF [Override based on historic data]60 years @ 2.75% [HUD, below market rate]

18Potential for Collective Ownership of American Industrial Land: Birge, Fink, Shroff

19Potential for Collective Ownership of American Industrial Land: Birge, Fink, Shroff

20Potential for Collective Ownership of American Industrial Land: Birge, Fink, Shroff

21Potential for Collective Ownership of American Industrial Land: Birge, Fink, Shroff
CHILDCARE
PRE-TAX RETIREMENT
PERSONAL SAVINGS
COLLECTIVE SAVINGS
NET INCOME / MONTH
MEMBER CASH-FLOW
RENTAL + REMAINING PAY
PRE-TAX RETIREMENT
TOTAL HOUSING COSTS
COLLECTIVE CASH-FLOW
$ 1,190,000
$ 273
$ 107
$ 1,043
$ 90
$ 680
$ 7,590
$ 19,000,000
$ 300,000
+
--COLLECTIVE FEES
40YRS
SCENARIO 1: OUTPUT PARAMETERS

22Potential for Collective Ownership of American Industrial Land: Birge, Fink, Shroff
SCENARIO 1.2: ADDING 1 CHILD / PER COUPLE
CHILDCARE
PRE-TAX RETIREMENT
PERSONAL SAVINGS
COLLECTIVE SAVINGS
NET INCOME / MONTH
MEMBER CASH-FLOW
RENTAL + REMAINING PAY
PRE-TAX RETIREMENT
TOTAL HOUSING COSTS
COLLECTIVE CASH-FLOW
$ 440,000
$ 273
- $173 $330
$ 107
$ 1,043
$ 90
$ 680
$ 7,590
$ 19,000,000
$ 300,000
+
--COLLECTIVE FEES
$570 - $650 / YR
40YRS

23Potential for Collective Ownership of American Industrial Land: Birge, Fink, Shroff
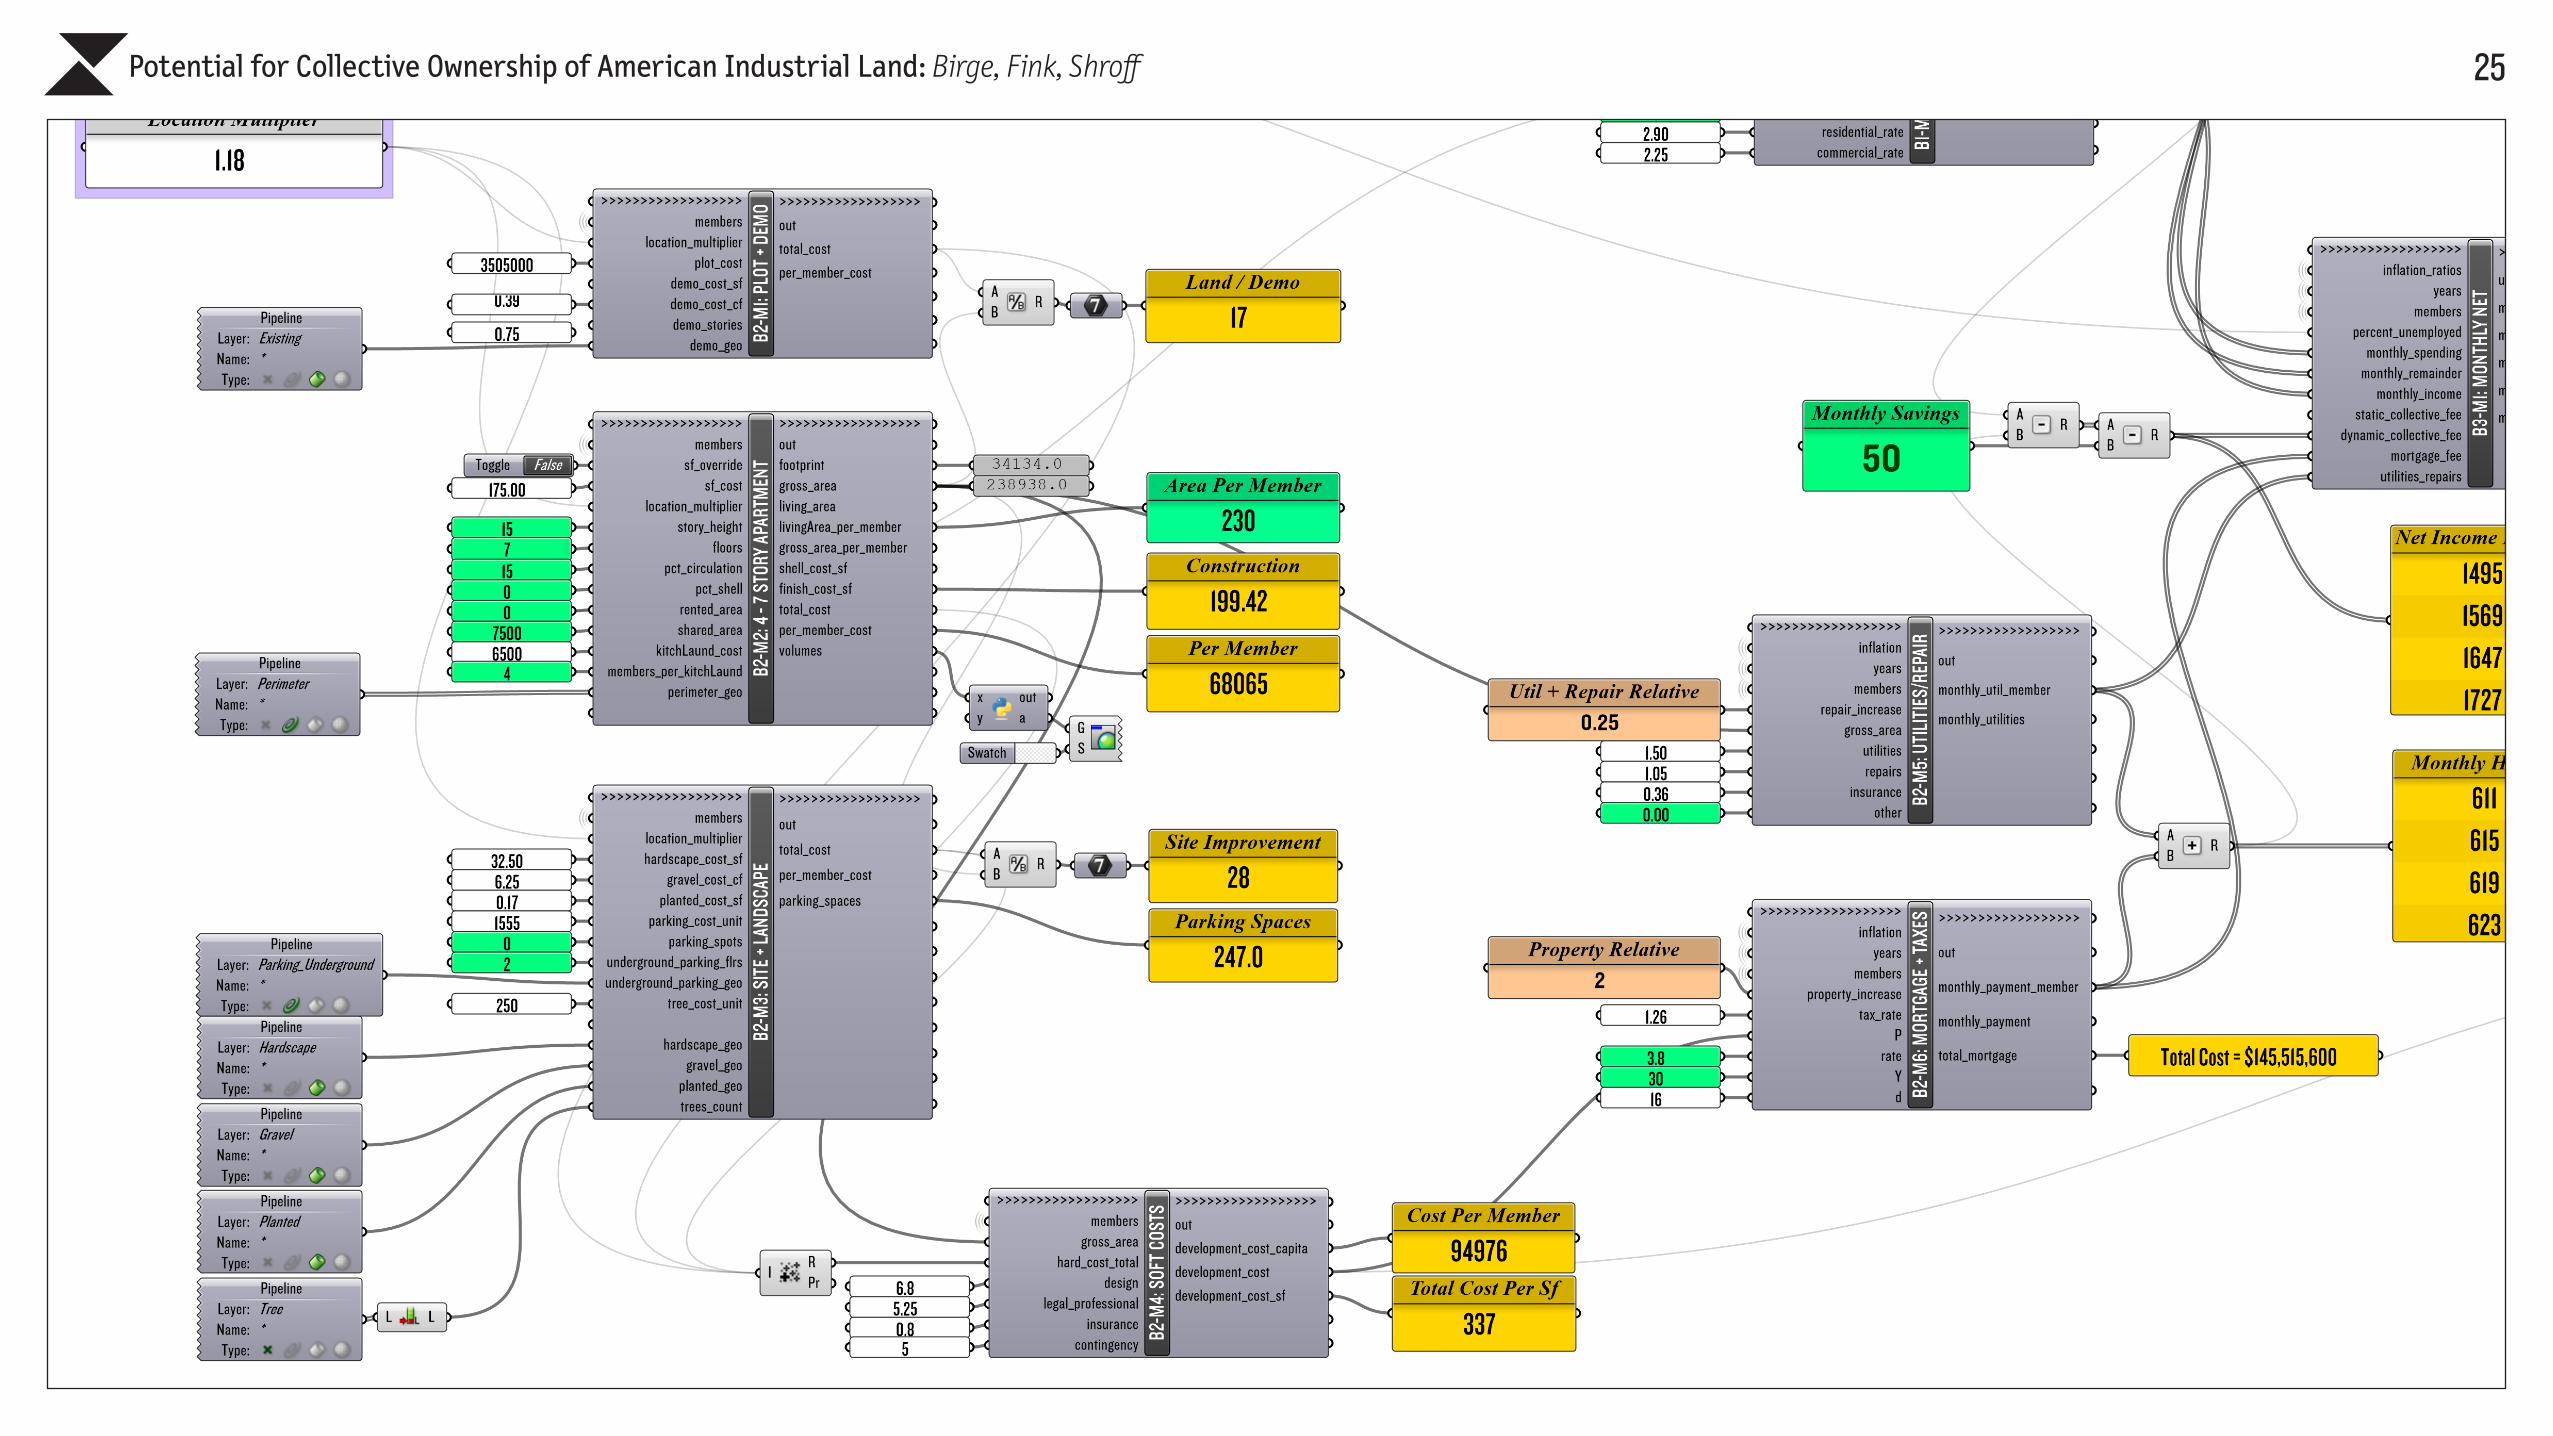
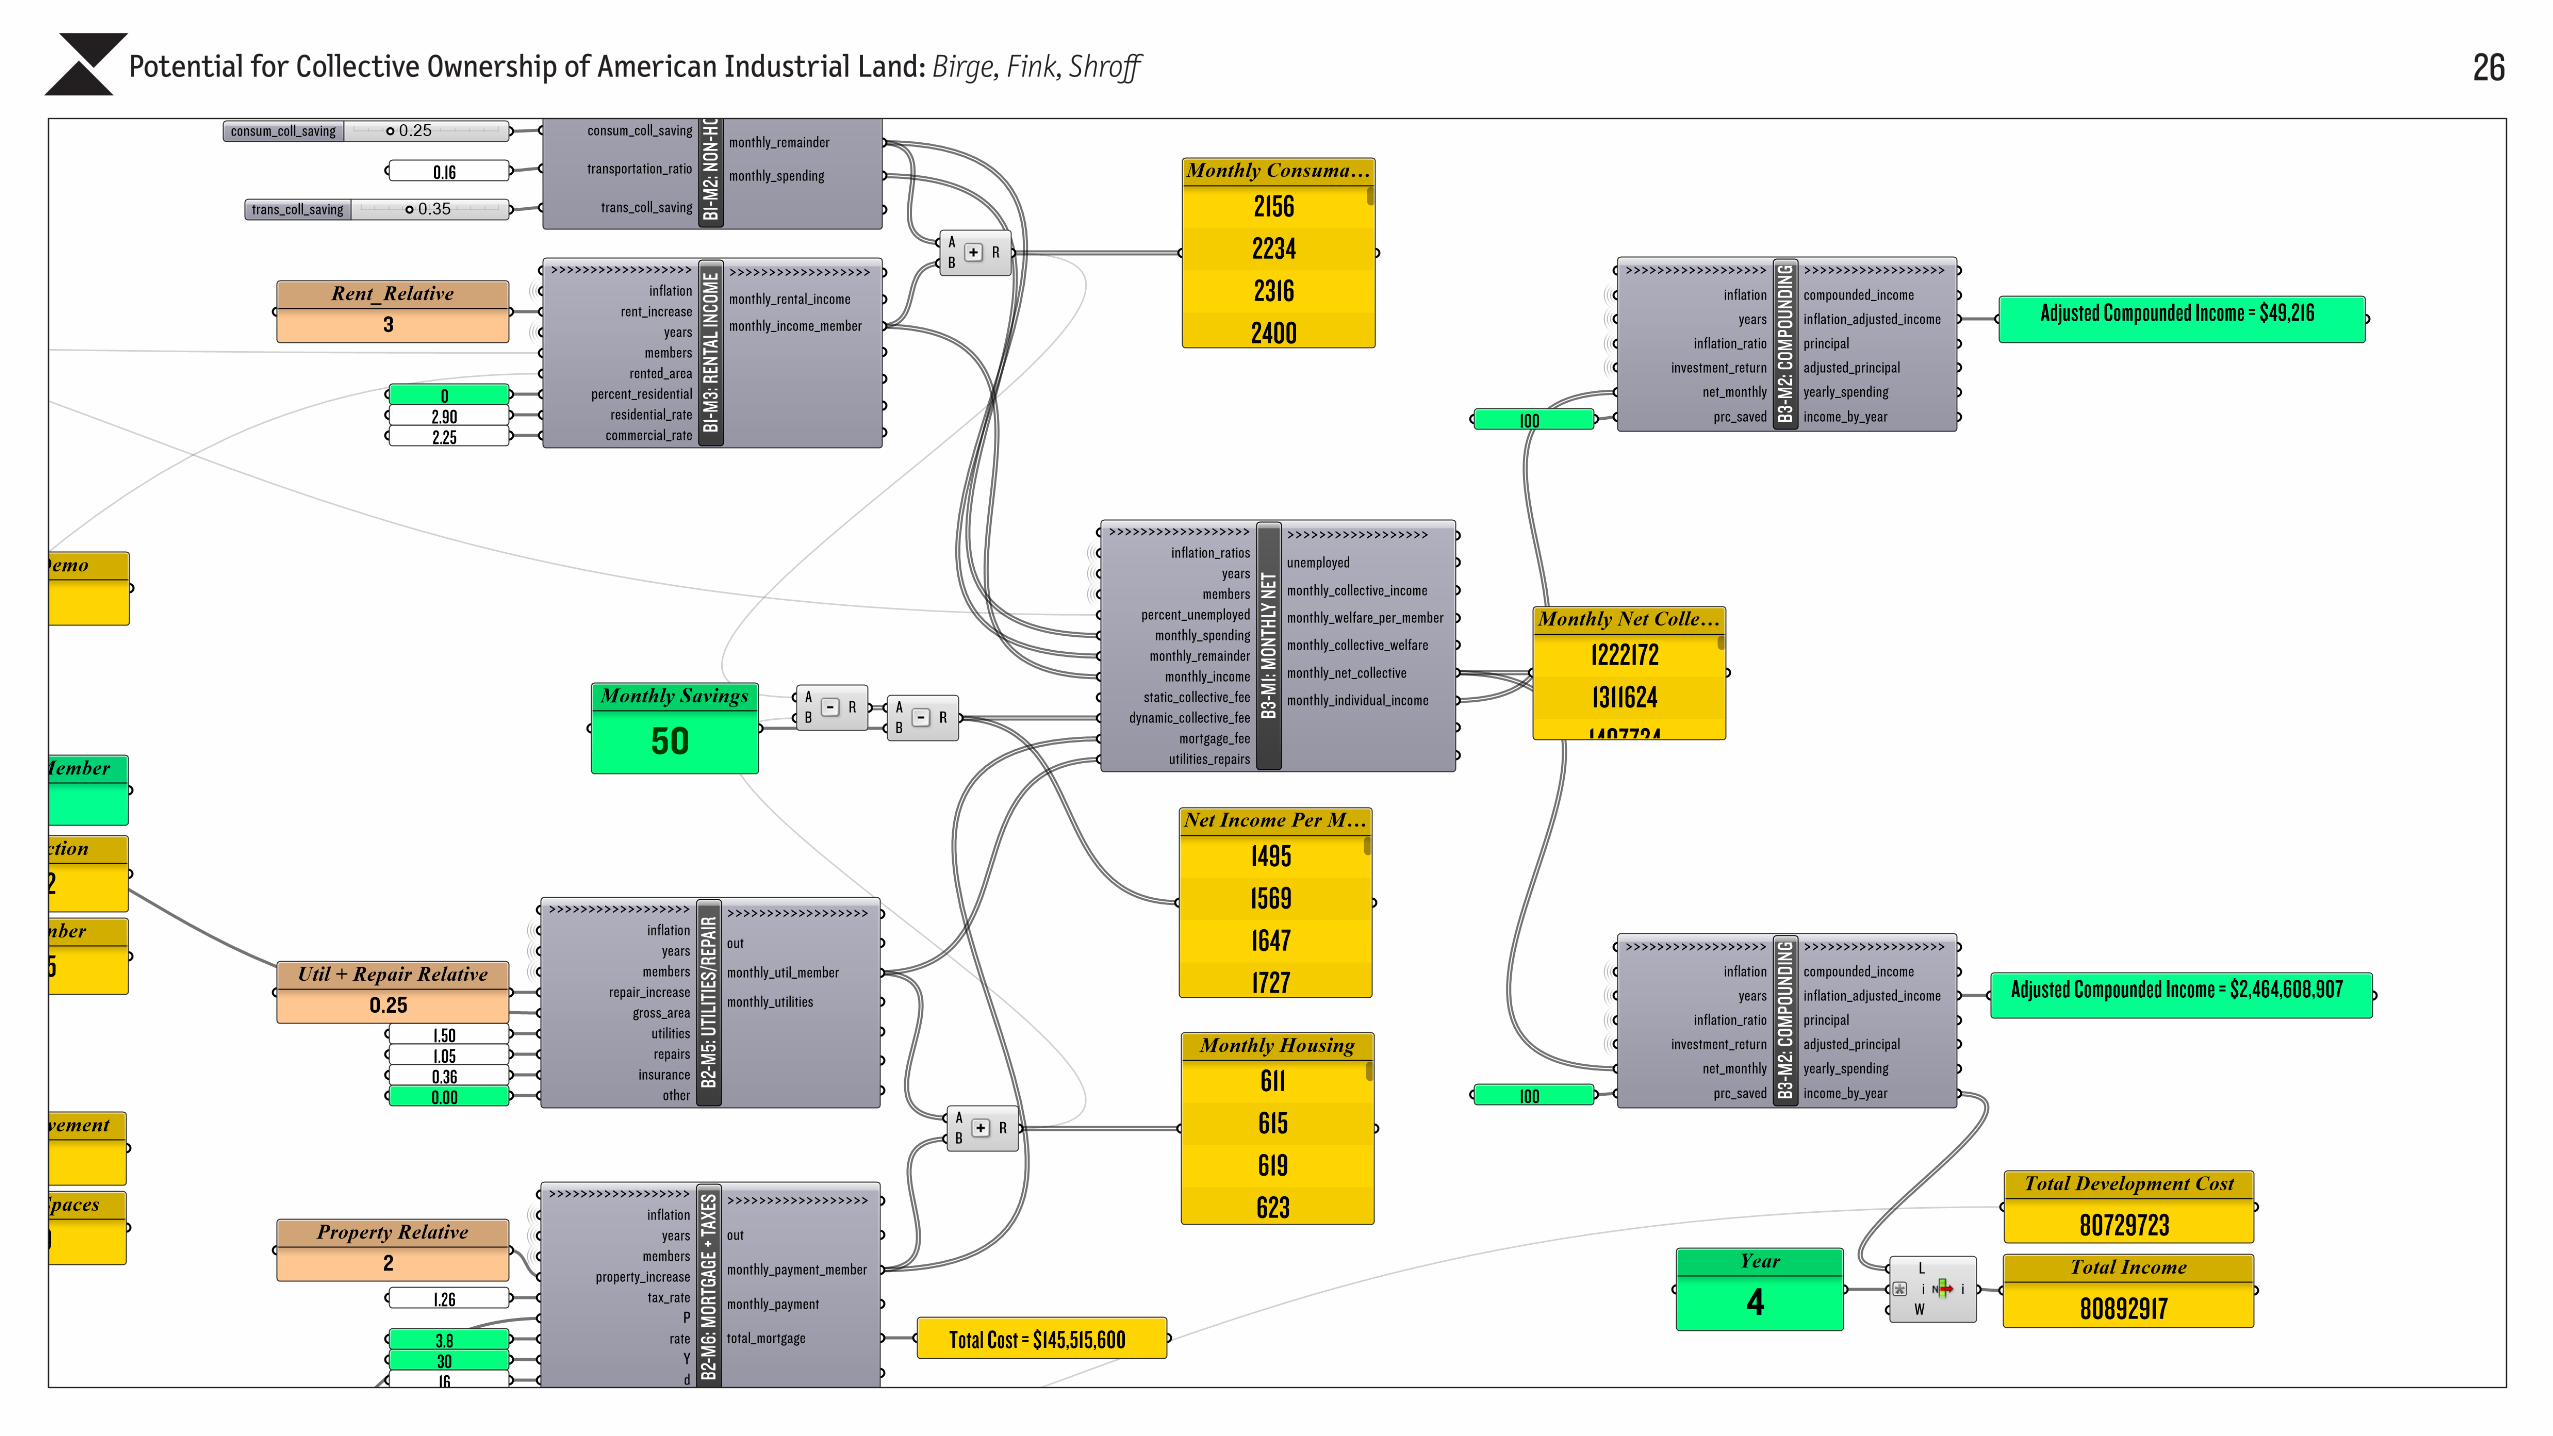
SCENARIO 2: MAXIMUM EXPANSION
INCOME
SHARED SPACE
MEMBERS
MORTGAGE TERMS
$50,0007,500 SF850 --> 230 SF per person30 years @ 8.6% (HUD, below market)
24Potential for Collective Ownership of American Industrial Land: Birge, Fink, Shroff
25Potential for Collective Ownership of American Industrial Land: Birge, Fink, Shroff
26Potential for Collective Ownership of American Industrial Land: Birge, Fink, Shroff

27Potential for Collective Ownership of American Industrial Land: Birge, Fink, Shroff
CHILDCARE
PRE-TAX RETIREMENT
PERSONAL SAVINGS
COLLECTIVE SAVINGS
COST OF DEVELOPMENT
NET INCOME / MONTH
YR1
YR2
YR3
YR4
MEMBER CASH-FLOW
RENTAL + REMAINING PAY
PRE-TAX RETIREMENT
HARD + SOFT COSTS
TOTAL HOUSING COSTS
COLLECTIVE CASH-FLOW
$ 50,000
$ 50
$ 0
$ 2,156
ALL BUT $ 50
$ 611
$ 1,222,000
$ 80,892,000$ 56,106,000$ 34,580,000$ 15,986,000
$ 80,729,000
$ 0
+
--COLLECTIVE FEES
30YRS
SCENARIO 2: OUTPUT PARAMETERS

28Potential for Collective Ownership of American Industrial Land: Birge, Fink, Shroff
POPULATION GROWTH
years
0
50,00025,000
100,000
150,000
200,000
popu
latio
n
16
81
27
129
83
4
243 collectives
20
6,561
32
5.5 million

29Potential for Collective Ownership of American Industrial Land: Birge, Fink, Shroff
SCENARIO 2.2: BALANCED SAVINGS
INCOME
PRE-TAX RETIREMENT
SHARED SPACE
MEMBERS
MORTGAGE TERMS
COLLECTIVE FEE
SAME5%SAMESAMESAMEAll but $50 >>> All but $700

30Potential for Collective Ownership of American Industrial Land: Birge, Fink, Shroff
CHILDCARE
PRE-TAX RETIREMENT
PERSONAL SAVINGS
COLLECTIVE SAVINGS
COST OF DEVELOPMENT
NET INCOME / MONTH
YR4
YR5
YR6
YR7
MEMBER CASH-FLOW
RENTAL + REMAINING PAY
PRE-TAX RETIREMENT
HARD + SOFT COSTS
TOTAL HOUSING COSTS
COLLECTIVE CASH-FLOW
$ 689,000
$ 700
$ 216
$ 2,156
ALL BUT $ 700
$ 611
$ 568,000
$ 94,400,000$ 73,562,000$ 55,647,000$ 40,349,000
$ 80,729,000
$ 313,812
+
--COLLECTIVE FEES
30YRS
SCENARIO 2.2: OUTPUT PARAMETERS

31Potential for Collective Ownership of American Industrial Land: Birge, Fink, Shroff
PART 4:Conclusions &
Next Steps

32Potential for Collective Ownership of American Industrial Land: Birge, Fink, Shroff
We have shown how our model can be used to simulate a wide range of scenarios, under differing economic conditions, and over long time-periods. Furthermore, assuming our model produces results within acceptable margins of error, these scenarios show that collective housing and purchasing can provide a robust economic model that autonomous societies can use to appropriate and occupy land. Because the potential financial gains for both individual members, and the collective institution as a whole, appears so great, it raises the question as to why more do not exist. The most logical reason for this is that multiple hurdles present themselves which prevent the initial founding of a collective. These include the effort required to organize and convince tens or even hundreds of individuals and households to agree to shared legal and financial terms, the potential need to lobby for rezoning of more affordable properties, and the more complex mortgage and loan conditions which may
CONCLUSION

33Potential for Collective Ownership of American Industrial Land: Birge, Fink, Shroff
prohibit banks from being willing to lend. Assuming these early hurdles of organization, zoning, and financing can be overcome, the answer to our primary research questions is that there is great structural and latent potential for a collective group of middle and lower-income groups to collectively purchase land and construct housing for themselves. Moreover, if land is available in appropriate areas at the necessary timing, we have also shown that a single collective could finance its own replication fast enough to match an exponentially growing demand. This is a critical point to make, as it implies the financing of a long genealogy of collectivized housing projects could theoretically be a singular event, a big-bang so to speak, which expands under its own initial inertia. This in turn suggests we should be thinking in terms of collective urbanization, and what that might look like, and not simply isolated, autonomous groups.

34Potential for Collective Ownership of American Industrial Land: Birge, Fink, Shroff
NEXT STEPSI. Investigate existing type and possibly invent new organizational models that do not
carry the equity burden nor its potential for profit seeking. A rental model may be more appropriate for large groups.
II. Consider new loan instruments which do not require equity, but rather use human-capital as the foundation for a new type of risk assessment. This could potentially be akin to an insurance model whereby with a large enough group, you can assess statistically meaningful results, even though you don’t know the individual who will be sick, or who will lose his or her job.
III. Develop arguments that would incentivize municipalities to allow rezoning. The addition of affordable housing without the city needing to do anything, is a strong case if enough local residents can join.