autonomous placement and migration of services in
TRANSCRIPT

Master of Science ThesisStockholm, Sweden 2012
TRITA-ICT-EX-2012:266
C U N E Y T C A L I S K A N
Autonomous Placement and Migrationof Services in Heterogeneous
Environments
K T H I n f o r m a t i o n a n d
C o m m u n i c a t i o n T e c h n o l o g y


Autonomous Placement and Migration of Servicesin
Heterogeneous Environments
CUNEYT CALISKAN
Master’s Thesis at Technische Universität MünchenSupervisor: Marc-Oliver PahlExaminer: Prof. Vlassov, V.
TRITA xxx yyyy-nn


AbstractIn this thesis, we present an autonomous placement protocol for servicesin smart spaces. Proposed design is a combination of computing Gridsand Intelligent Agent Systems which is able to adapt to environmen-tal changes. These changes are failing/joining/leaving nodes, changingnode usage, failing/joining/leaving services, and changing service de-mands. Smart spaces are heterogeneous in terms of available resourcesfor consumption and they are dynamic where available resources andservices change over time. The system adapts to environmental changesby live service migration and load balancing, and provides high avail-ability by maintaining backup replicas of services. Load in the system isbalanced among available resources by taking into account heterogene-ity of the environment. Complex nature of the problem space makesit difficult to manage the services and resources manually. Thus, allfunctionality provided by the system is fully autonomous. A novel ap-proach is presented for migration decisions based on utility functionsthat represent characteristics of nodes. Fitness of the designed protocolis tested with simulations under different circumstances. Obtained testresults show that it provides high degree of availability to services andadapts to environmental changes.
ReferatAutonoma placering och migration av tjänster i
heterogena miljöerI denna uppsats presenterar vi ett autonomt placeringsprotokoll för tjän-ster i smarta utrymmen. Den föreslagna utformningen är en kombina-tion av datornät och intelligenta agentsystem som kan anpassa sig tillförändringar i omgivningen. Dessa förändringar är felande/anslutandetill/lämnande av noder, förändrat nodanvändande, felande/anslutandetill/lämnande av tjänster och förändrat tjänsteanvändande. Smarta utrym-men är heterogena i termer av tillgängliga resurser för utnyttjande ochde är dynamiska där tillgängliga resurser och tjänster förändras övertid. Systemet anpassar sig till förändringar i omgivningen genom tjän-stemigration och belastningsbalansering, samt tillhandahåller hög till-gänglighet genom att bibehålla backup-kopior av tjänster. Belastningeni systemet balanseras mellan tillgängliga resurser genom att ta medomgivningens heterogenitet i beräkningen. Den komplexa naturen avproblemutrymmet gör det svårt att hantera tjänsterna och resursernamanuellt. Därför är all funktionalitet som tillhandahålls av systemetfullständigt autonom. En ny metod presenteras för migrationsbeslutbaserade på nyttofunktioner som representerar noders egenskaper. Detutformade protokollets lämplighet testas med simulationer under olikaomständigheter. Erhållna testresultat visar att det tillhandahåller enhög grad av tillgänglighet till tjänster och anpassar sig till förändringari omgivningen.

Contents
Contents
List of Figures
1 Introduction 1
2 Analysis 32.1 Existing Infrastructure . . . . . . . . . . . . . . . . . . . . . . . . . . 3
2.1.1 Smart Spaces and DS2OS . . . . . . . . . . . . . . . . . . . . 42.1.2 Managed Entities . . . . . . . . . . . . . . . . . . . . . . . . . 8
2.2 Desired Properties . . . . . . . . . . . . . . . . . . . . . . . . . . . . 82.2.1 Availability . . . . . . . . . . . . . . . . . . . . . . . . . . . . 92.2.2 Autonomy . . . . . . . . . . . . . . . . . . . . . . . . . . . . . 102.2.3 Load Balancing . . . . . . . . . . . . . . . . . . . . . . . . . . 112.2.4 Mobility . . . . . . . . . . . . . . . . . . . . . . . . . . . . . . 112.2.5 Migration . . . . . . . . . . . . . . . . . . . . . . . . . . . . . 132.2.6 Replication . . . . . . . . . . . . . . . . . . . . . . . . . . . . 132.2.7 Runtime Environment . . . . . . . . . . . . . . . . . . . . . . 14
2.3 Questions to be answered . . . . . . . . . . . . . . . . . . . . . . . . 14
3 Related Work 153.1 Grids and Agents . . . . . . . . . . . . . . . . . . . . . . . . . . . . . 153.2 Utility Function . . . . . . . . . . . . . . . . . . . . . . . . . . . . . . 163.3 Availability . . . . . . . . . . . . . . . . . . . . . . . . . . . . . . . . 173.4 Autonomy . . . . . . . . . . . . . . . . . . . . . . . . . . . . . . . . . 173.5 Load Balancing . . . . . . . . . . . . . . . . . . . . . . . . . . . . . . 193.6 Mobility . . . . . . . . . . . . . . . . . . . . . . . . . . . . . . . . . . 203.7 Migration . . . . . . . . . . . . . . . . . . . . . . . . . . . . . . . . . 213.8 Replication . . . . . . . . . . . . . . . . . . . . . . . . . . . . . . . . 213.9 Runtime Environment (RTE) . . . . . . . . . . . . . . . . . . . . . . 22
4 Design 254.1 Introduction . . . . . . . . . . . . . . . . . . . . . . . . . . . . . . . . 254.2 SMYRNA Utility Functions . . . . . . . . . . . . . . . . . . . . . . . 27

4.2.1 Utility of a Node . . . . . . . . . . . . . . . . . . . . . . . . . 274.2.2 Utility of a Service on a Node . . . . . . . . . . . . . . . . . . 29
4.3 Service Functionalities . . . . . . . . . . . . . . . . . . . . . . . . . . 304.4 Failure Detection . . . . . . . . . . . . . . . . . . . . . . . . . . . . . 31
4.4.1 Eventually Perfect Failure Detector . . . . . . . . . . . . . . . 324.4.2 Modified Eventually Perfect Failure Detector . . . . . . . . . 324.4.3 Worst Case Scenario . . . . . . . . . . . . . . . . . . . . . . . 34
4.5 SMYRNA . . . . . . . . . . . . . . . . . . . . . . . . . . . . . . . . . 344.5.1 Load Balancing . . . . . . . . . . . . . . . . . . . . . . . . . . 374.5.2 Placement Strategy . . . . . . . . . . . . . . . . . . . . . . . 384.5.3 Migration Strategy . . . . . . . . . . . . . . . . . . . . . . . . 404.5.4 Replication Strategy . . . . . . . . . . . . . . . . . . . . . . . 444.5.5 Failure of SMYRNA . . . . . . . . . . . . . . . . . . . . . . . 45
4.6 Runtime Environment (RTE) . . . . . . . . . . . . . . . . . . . . . . 46
5 Implementation 495.1 SMYRNA . . . . . . . . . . . . . . . . . . . . . . . . . . . . . . . . . 495.2 RTE . . . . . . . . . . . . . . . . . . . . . . . . . . . . . . . . . . . . 505.3 Adapting DS2OS to OSGi . . . . . . . . . . . . . . . . . . . . . . . . 515.4 Service Migration Strategy . . . . . . . . . . . . . . . . . . . . . . . 525.5 Prototype vs Simulation . . . . . . . . . . . . . . . . . . . . . . . . . 52
6 Evaluation 556.1 Experimental Setup . . . . . . . . . . . . . . . . . . . . . . . . . . . 55
6.1.1 Service Placement . . . . . . . . . . . . . . . . . . . . . . . . 586.1.2 Performance Metrics . . . . . . . . . . . . . . . . . . . . . . . 59
6.2 Nodes Fail . . . . . . . . . . . . . . . . . . . . . . . . . . . . . . . . . 606.3 Nodes Fail and Recover . . . . . . . . . . . . . . . . . . . . . . . . . 656.4 Decreasing Node Capacities . . . . . . . . . . . . . . . . . . . . . . . 68
7 Conclusions and Future Work 757.1 Conclusions . . . . . . . . . . . . . . . . . . . . . . . . . . . . . . . . 757.2 Future Work . . . . . . . . . . . . . . . . . . . . . . . . . . . . . . . 76
Bibliography 77
Appendices 81
A General Flow of Events 83
B List of Classes 85B.1 SMYRNA . . . . . . . . . . . . . . . . . . . . . . . . . . . . . . . . . 85B.2 RTE . . . . . . . . . . . . . . . . . . . . . . . . . . . . . . . . . . . . 86B.3 Simulation . . . . . . . . . . . . . . . . . . . . . . . . . . . . . . . . . 87

C Service API 89
D Sample Classes 99D.1 Sample Notification Callback . . . . . . . . . . . . . . . . . . . . . . 99D.2 Decision Function . . . . . . . . . . . . . . . . . . . . . . . . . . . . . 101
List of Figures
2.1 Layered system structure [PNS+09] . . . . . . . . . . . . . . . . . . . . . 52.2 Taxonomy of Mobility [BHR+02] . . . . . . . . . . . . . . . . . . . . . . 12
3.1 Monitor, Analyze, Plan, Execute [PNS+09] . . . . . . . . . . . . . . . . 18
4.1 Abstract View of the System . . . . . . . . . . . . . . . . . . . . . . . . 274.2 Detailed View of the System . . . . . . . . . . . . . . . . . . . . . . . . 284.3 Worst Case Scenario . . . . . . . . . . . . . . . . . . . . . . . . . . . . . 364.4 SMYRNA . . . . . . . . . . . . . . . . . . . . . . . . . . . . . . . . . . . 36
6.1 Node resource capacity distributions . . . . . . . . . . . . . . . . . . . . 576.2 Satisfied services in failing nodes scenario . . . . . . . . . . . . . . . . . 606.3 Satisfied services with different R values . . . . . . . . . . . . . . . . . . 616.4 Alive services with different R values . . . . . . . . . . . . . . . . . . . . 626.5 CoV of CPU . . . . . . . . . . . . . . . . . . . . . . . . . . . . . . . . . 626.6 CoV of bandwidth . . . . . . . . . . . . . . . . . . . . . . . . . . . . . . 636.7 CoV of memory . . . . . . . . . . . . . . . . . . . . . . . . . . . . . . . . 636.8 Satisfied services with different R values . . . . . . . . . . . . . . . . . . 646.9 Alive services with different R values . . . . . . . . . . . . . . . . . . . . 646.10 Failing and recovering nodes with different R, loads change . . . . . . . 656.11 Failing and recovering nodes with different R, loads constant . . . . . . 666.12 Average CPU load with different R, loads constant . . . . . . . . . . . . 666.13 Average CPU load with different R, loads change . . . . . . . . . . . . . 676.14 Satisfied services, different R, node recoveries and exponentially gener-
ated node resources . . . . . . . . . . . . . . . . . . . . . . . . . . . . . 686.15 Satisfied services where system capacity decreases . . . . . . . . . . . . 696.16 Satisfied services, overloaded nodes, decreasing node capacities, CPU . . 696.17 Satisfied services, overloaded nodes, decreasing capacities, CPU and
memory . . . . . . . . . . . . . . . . . . . . . . . . . . . . . . . . . . . . 70

6.18 Satisfied services, overloaded nodes, decreasing capacities, CPU, mem-ory, bandwidth . . . . . . . . . . . . . . . . . . . . . . . . . . . . . . . . 71
6.19 Satisfied services, overloaded nodes, decreasing capacities, exponential,CPU . . . . . . . . . . . . . . . . . . . . . . . . . . . . . . . . . . . . . . 72
6.20 Satisfied services, overloaded nodes, decreasing capacities, exponential,CPU and memory . . . . . . . . . . . . . . . . . . . . . . . . . . . . . . 72
6.21 Satisfied services, overloaded nodes, decreasing capacities, exponential,CPU, memory and bandwidth . . . . . . . . . . . . . . . . . . . . . . . . 73
List of Algorithms
1 Eventually Perfect Failure Detector [Gue06] . . . . . . . . . . . . . . 332 Modified Eventually Perfect Failure Detector . . . . . . . . . . . . . 353 Many-to-many . . . . . . . . . . . . . . . . . . . . . . . . . . . . . . 384 unload . . . . . . . . . . . . . . . . . . . . . . . . . . . . . . . . . . . 395 insert(pool) . . . . . . . . . . . . . . . . . . . . . . . . . . . . . . . . 396 getBestFittingNode(service, underloaded) . . . . . . . . . . . . . . . 407 dislodge(index) . . . . . . . . . . . . . . . . . . . . . . . . . . . . . . 418 redeployservices . . . . . . . . . . . . . . . . . . . . . . . . . . . . . . 429 Migration Decision . . . . . . . . . . . . . . . . . . . . . . . . . . . . 43


Chapter 1
Introduction
The interest on smart spaces is growing day by day because they bring ease to dailylives of human beings. As this interest grows, the expectations about the servicesprovided by smart environments grow, too. A large number of services are providedalready. Controlling the heating system, illumination, media devices, air condi-tioning, security, surveillance, kitchen appliances and many others are examples ofsuch services. A situation where users want to turn on the heating system in coldweather but the system is not responding is not desirable. Another similar situa-tion may occur when trying to turn on the security or surveillance system. Smartenvironments offer critical services to their users. Thus, unpleasant situations arenot welcome. Users of a software need it to be available whenever they want to useit no matter what happens to the computers/devices on the system site.
The goal of this thesis is to perform a research to provide a reliable infrastructurefor services designed for smart environments. The goal is aimed to be achieved byproviding an autonomous service placement protocol. The reason for the autonomyis that the environment is complex to be maintained manually. Complexity of thesystem raises from the large number of computational resources in the environment,different characteristics and dynamism of these resources.
This thesis aims at using all computational resources at smart environmentssuch as personal computers, notebooks, resources of smart devices such as refriger-ators, TVs and other devices. This variety of resources results in a heterogeneousenvironment in terms of available resources. The aim is to take into account thisheterogeneity while making decisions about service placement with balancing loadon the resources proportional to their capacities. The load on a resource is thefraction of resource demand to resource’s capacity. Resources are connected to eachother with network links where connectivity of each resource is different than theothers’. This connectivity leads to a distributed system where resources are locatedat different physical locations. For example, wind sensors can be installed outsideof building, on roof for instance, controlling unit of these sensors where data aresent can be placed in the basement of the building and current state about windspeed can be displayed on a personal computer. Depending on the wind speed,
1

CHAPTER 1. INTRODUCTION
shutters on windows can be controlled by the controlling unit where actuators ofthe shutters are placed outside the windows.
Services in smart spaces are dynamic where new services can be added or existingones can be removed. Some services can fail due to implementation or other unex-pected factors. The same dynamism applies also for the computational resources inthe environment. Some resources can be removed or new ones can be introducedby users. They can fail or lose connection with the network. Also the availableresources can change over time. These changes on resources and services constituteenvironmental changes where the goal is to adapt to these changes autonomously.
Smart spaces are heterogeneous, distributed and dynamic environments. Thegoal is to provide a reliable infrastructure for services in these environments andproviding an autonomous service placement protocol that will adapt to the dynamicnature of the problem.
ContributoinIn this thesis, a reliable infrastructure for services in smart environments is de-signed. Research is conducted in different domains for similar problems. To thebest of our knowledge, there is no research in this area which aims at exactly thesame goals that we do as the time of writing this document (28 September 2012).A prototype for the proposed design is implemented by adapting solutions from dif-ferent domains. However, due to missing functionalities of DS2OS, the design wastested with simulations because our solution depends on DS2OS which is explainedthroughout the document.
2

Chapter 2
Analysis
Smart spaces are heterogeneous, distributed and dynamic. Heterogeneity is in termsof available resources for consumption and connectivity. The system is distributedwith several nodes located in physically different locations. And the system is dy-namic where nodes and services can join and leave the system, connectivity andavailable resources can change. The dynamism of the system requires failure de-tection mechanisms for node and service failures. A self-organizing mechanism forproviding autonomy because of the complex nature of the system is required. Dy-namic nature of the problem requires dynamic load balancing solutions. Mobility inthe system is a requirement in terms of replication and migration as a result of thedesired properties such as availability and efficient resource consumption. The het-erogeneous and dynamic nature of the environment requires a runtime environmentto handle these difficulties.
This chapter starts with the introduction of the currently existing smart environ-ments in 2.1. Then, it continues with smart spaces and their characteristics in 2.1.1.After introducing smart spaces, managed entities in smart spaces are addressed in2.1.2. Afterwards, desired properties are introduced in 2.2 including availability,autonomy, load balancing, mobility together with migration and replication, and aruntime environment that can handle our requirements. Finally, this chapter con-cludes with the questions that are going to be answered throughout this thesis in2.3.
2.1 Existing Infrastructure
It is stated in Chapter 1 that all available resources in smart spaces are aimed tobe used. Smart spaces may include many nodes with different capabilities such asstorage, memory or processing power. The large number of nodes makes the envi-ronment heterogeneous in terms of available resources for consumption. All thesenodes may be located in physically different locations and be responsible for per-forming specific operations. Some of them can be used for storing data while someothers can be used for handling user requests. Although the nodes are responsible
3

CHAPTER 2. ANALYSIS
for specific operations, they all provide service to smart space users. Thus, forminga distributed system to serve for a common goal. Beside being heterogeneous anddistributed, the system is also dynamic in terms of node failures, connectivity speed,resources and deployed services. Heterogeneity, distribution and dynamism are themain challenges that we choose to address and overcome as they were the challengesfor other problems in different domains [RLS+03, AH04, KS97, NS05, WS01]. De-tails about these challenges are presented in the following subsection.
2.1.1 Smart Spaces and DS2OS
Smart spaces contain sensors and actuators. Sensors in smart spaces provide infor-mation about the real world. This information is processed by electronic controlelements and physical actions are reflected on real world via actuators. There isno common communication language for these sensors and actuators. Vendors havetheir own communication protocols specific for devices. These protocols are differenteven among different domains of a vendor. This causes a vast variety of communica-tion protocols. Devices are distributed in different physical locations. For example,the temperature sensors can be located in the living area within different rooms,the control unit can be in the cellar whereas the actuator for adjusting the tem-perature is located in the basement. Temperature regulation becomes a distributedtask. This requires a routing mechanism to address the devices and route infor-mation to actual receivers. Connectivity characteristics among these devices candiffer. Devices in smart spaces are added and removed continuously which resultsin a dynamic environment. A single program would be very complex to orchestratethe whole smart space. Thus, small services for specific purposes will be deployedin smart spaces. For example, there can be an alarm service that can trigger an-other service to play music in the morning and can turn on the lights when thealarm is activated. Then, coffee machine and floor heating in the bathroom can beactivated. A dynamic coupling of services is possible to create macros to perform acomplicated task like mentioned. Isolated systems, such as the illumination systemwithin a house, have dedicated communication channels between the control unitsto devices. In decentralized smart spaces, there are no such direct connections.This brings the problem of security and trust. Data may have been tampered andaltered in gateways or other places inside the system [PUC].
All of the challenges mentioned above are overcome by the distributed smartspace operating system, DS2OS, developed in Technical University of Munich [PUC].DS2OS abstracts the heterogeneity of devices by maintaining a virtual model of thereal world. The virtual model resides in the middleware and it is a tree structurethat holds the state information of entities and services which provides locationtransparency. The abstraction makes it possible for services to control the devicesin a vendor independent way. The virtual model is shared among all entities in thesystem and has access rules that can be set by the creator of the sub-tree. DS2OSoffers a limited set of interaction with the model which are basically getting andsetting the state of a device or service. DS2OS also provides a publish-subscribe
4

2.1. EXISTING INFRASTRUCTURE
User Interface
Users
Device Adapter
Protocol Bridge Device Adapter
Hardware
Services
Knowledge
Figure 2.1. Layered system structure [PNS+09]
mechanism. Services can subscribe to an address in the virtual model tree andwhenever a change occurs on the address, a notification is sent to the subscriber.This provides a dynamic coupling of services. For example, the scenario aboutthe alarm given above. The bathroom floor heating, music and coffee making ser-vices can subscribe to the state address of the alarm service. When the state ischanged, these services receive notification depicting the changed address. Then,these services can query the state and activate their own actions depending on thestate.
Figure 2.1 depicts the layered structure of DS2OS. As it is seen in the hard-ware layer of the figure, a wide variety of devices are monitored and controlled.The device adapter layer connects the devices to the knowledge layer. Highly ab-stracted knowledge layer contains digital representation of these devices in a realworld model. The service layer contains high level control services that run onnodes with sufficient resources. Finally, the user interface provides interaction be-tween users and the system. The knowledge layer provides location transparencyto services. All data required for the operation of a service are provided by theknowledge layer. Thus, a service can operate independent from its location andcan be migrated among different runtime environments with sufficient resources. Itis stated in Chapter 1 that the goal is to be achieved by providing a placementprotocol for services. The operational layer of the placement protocol is the servicelayer of DS2OS.
5

CHAPTER 2. ANALYSIS
Heterogeneous System
Smart spaces are equipped with various kinds of sensors and actuators. Examples ofthese sensors are: humidity, temperature, light, barometric pressure, GPS-receiverand accelerometer. Some examples of devices that can be orchestrated via actuatorsin smart spaces can be seen in the hardware layer of Figure 2.1. Also some examplesof devices that a user can use for interaction with the system is shown in theuser interface layer of the figure. As it is seen from the figure, users can interactthrough a notebook, personal computer, mobile phone, personal digital assistant(PDA), an embedded computer and many other devices. All these devices differin capabilities such as storage capacity, memory (RAM), processing power (CPU),network connectivity and operating power (limited battery life for mobile devices).Thus,the environment is a heterogeneous system. Two sample nodes running ina system can be thought as an embedded computer and a server. The embeddedcomputer with system parameters as 700 MHz of CPU, 256 MB of RAM and 1Mbps bandwidth. The server with system parameters as 8 cores and each 3200MHz of CPU, 32000 MB of RAM and 1 Gbps bandwidth.
It is not possible to treat all nodes equally in a heterogeneous environment. Ifwe take the above mentioned two sample computers and deploy same amount ofwork to both of them. It can be said that the embedded computer operates muchslower compared to the other one. This situation depends on the type of workdeployed because embedded computers are desinged to process specific tasks. It ispossible that the clients of the services deployed in the embedded computer are notsatisfied by this situation. The logical decision about deploying the jobs would beto treat the computers according to their capabilities. This can be thought as aload balancing mechanism which uses system resources in a fair way. As it is statedin Chapter 1, we aim at dealing with the challenge of heterogeneity to place serviceson nodes proportional to their capabilities. The operational area of this thesis is atthe service layer of DS2OS architecture where high level control services are located.
Distributed System
In the context of this thesis, a distributed system is a collection of software com-ponents operating over physically distributed and interconnected nodes. As it isstated in Chapter 1, smart spaces constitute distributed systems with several sen-sors, actuators and nodes placed on different locations and interconnected withcommunication links. Distributed systems are classified based on abstractions aboutprocesses/nodes and time [Gue06].
In the context of this thesis, a process p is said to be correct if it behaves asintended and sends messages according to specifications. An incorrect process isthe one that does not send any messages at all because it has crashed or sendsmessages but not compliant with specifications. The abstraction about processesis that the model is either crash-stop or crash-recovery. In a crash-stop model acrashed process never sends and receives messages again which means the process is
6

2.1. EXISTING INFRASTRUCTURE
not operating any more. In crash-recovery model, however, a process stops sendingmessages for a period of time due to its failure but it starts to send messages andoperate again after it recovers or restarts. Nodes in smart spaces are classified incrash-recovery model because they can fail and recover or restart.
The abstraction about time defines if a system is synchronous, asynchronousor partially synchronous. A synchronous system is the system where there is abounded time in which an operation is completed while there is no timing bound inan asynchronous system. However, there exists another kind of system which is inbetween, partially synchronous system. In partially synchronous systems there is atiming assumption but it is not fixed as in synchronous systems. Assume that thetime for an operation to complete is t. If the operation does not complete withinthis amount of time, the node is suspected or detected as incorrect. However, thismight not be the case. It is possible that the communication channel is slow andthe response is received later. In this case, the timeout value t is increased withan amount of ∆, t = t + ∆. The next time when an operation is performed, thetimeout value to wait for the response will be larger. After a while, t reaches a valuein which all the operations are completed and the system becomes synchronous. Inthis thesis, partially-synchronous system model is referred whenever time is referred.As it is said earlier, we have a distributed system where nodes can be located atdifferent physical locations. But they are interconnected in order to serve for acommon goal and these connections among nodes differ in terms of speed. Thus,there is no bounded time limit in which a message is delivered to its destination.It might take x milliseconds for a message to be delivered from node A to node Bwhile it might take y milliseconds to deliver the same message from node A to nodeC where x! = y. The same message on the same route can also take a differentamount of time when it is sent next time depending on the network traffic on theroute it travels. Taking all these conditions into consideration, smart spaces arepartially synchronous systems.
Dynamic System
It is already mentioned in the previous section about the dynamism of nodes thatthey can fail and recover. However, the dynamism of the system is not only be-cause of node failures but also because of the dynamism of connectivity, resourcesand services. The dynamism of nodes also includes actions taken for maintenancepurposes. For example, the system administrator may want to remove a node fromthe system manually and place a new one instead. When there are no longer avail-able resources for satisfying the users, a new node may be necessary to install to thesystem. As it is mentioned about the heterogeneity of the connections in Section2.1.1, the connectivity capabilities may also change over time. Because of the cur-rent Internet infrastructure, messages sent to the same destination can be routedon different routes depending on the traffic. This causes the messages sent to thesame destination to take different times to travel. The services deployed in a sys-tem are also dynamic. New services can be installed, existing ones can be updated
7
CHAPTER 2. ANALYSIS
with newer versions or uninstalled from the system. Services can also fail due tobuggy implementation. There might be also services that are run only once forsome special purpose such as installing a device driver. In this case, a service of thiskind will join the system and leave right after completion. The nodes in the systemdo not necessarily need to be dedicated computers for the operation of system. Apersonal computer or a notebook can also host some services and the resources onthese nodes can change whenever users start to use them for personal needs. Allin all, nodes and services can leave and join the system and the connectivity canchange over time just like the resources.
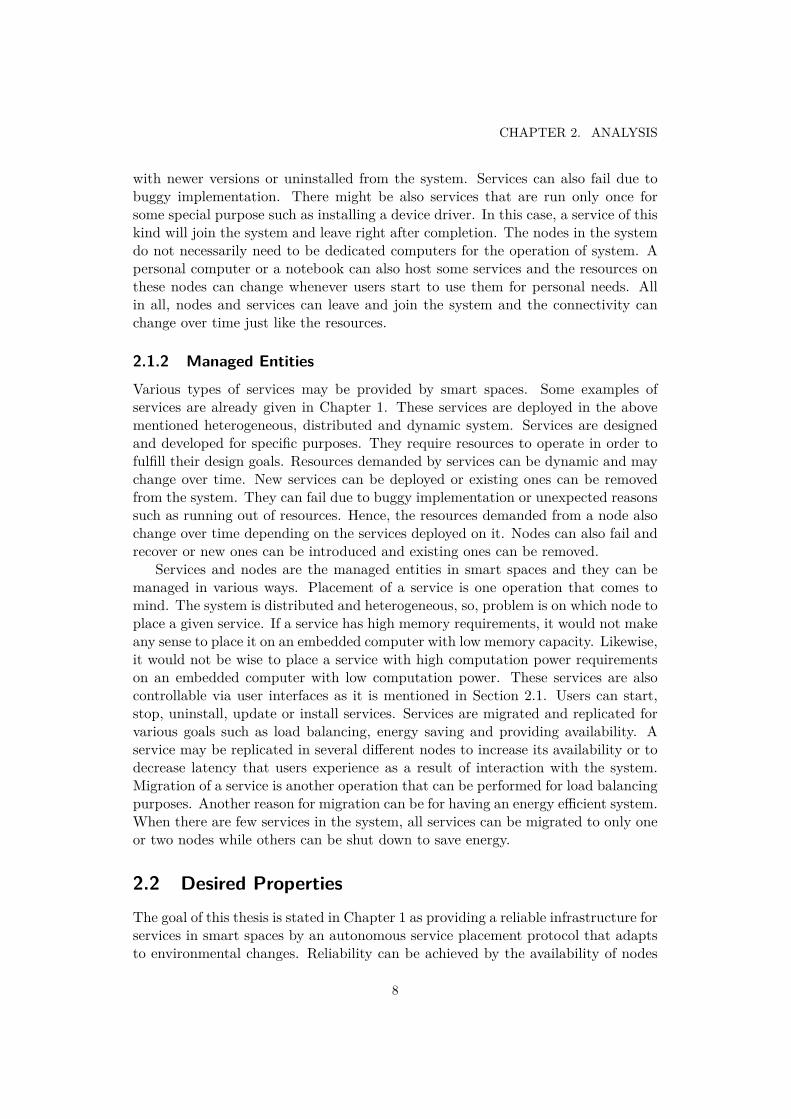
2.1.2 Managed EntitiesVarious types of services may be provided by smart spaces. Some examples ofservices are already given in Chapter 1. These services are deployed in the abovementioned heterogeneous, distributed and dynamic system. Services are designedand developed for specific purposes. They require resources to operate in order tofulfill their design goals. Resources demanded by services can be dynamic and maychange over time. New services can be deployed or existing ones can be removedfrom the system. They can fail due to buggy implementation or unexpected reasonssuch as running out of resources. Hence, the resources demanded from a node alsochange over time depending on the services deployed on it. Nodes can also fail andrecover or new ones can be introduced and existing ones can be removed.
Services and nodes are the managed entities in smart spaces and they can bemanaged in various ways. Placement of a service is one operation that comes tomind. The system is distributed and heterogeneous, so, problem is on which node toplace a given service. If a service has high memory requirements, it would not makeany sense to place it on an embedded computer with low memory capacity. Likewise,it would not be wise to place a service with high computation power requirementson an embedded computer with low computation power. These services are alsocontrollable via user interfaces as it is mentioned in Section 2.1. Users can start,stop, uninstall, update or install services. Services are migrated and replicated forvarious goals such as load balancing, energy saving and providing availability. Aservice may be replicated in several different nodes to increase its availability or todecrease latency that users experience as a result of interaction with the system.Migration of a service is another operation that can be performed for load balancingpurposes. Another reason for migration can be for having an energy efficient system.When there are few services in the system, all services can be migrated to only oneor two nodes while others can be shut down to save energy.
2.2 Desired PropertiesThe goal of this thesis is stated in Chapter 1 as providing a reliable infrastructure forservices in smart spaces by an autonomous service placement protocol that adaptsto environmental changes. Reliability can be achieved by the availability of nodes
8

2.2. DESIRED PROPERTIES
and services [AH04]. The complex nature of the problem space is difficult to manageentities manually but autonomic system behaviour can provide low complexity andeliminate manual (re)configuration [Her10]. Adaptation to environmental changesrequires dynamic load balancing on the nodes through mobility of services [RLS+03].Availability of services can be achieved with migration and replication of statefulservices [LAB+].
2.2.1 Availability
In the context of this thesis, availability means that the system is responding when-ever a user requests a service. It is almost inevitable that some nodes or serviceswill stop functioning. Some reasons of being unavailable are failure of nodes, sys-tem maintenance, network partitioning and buggy implementations. Whenever anode stops functioning due to any reason, the services running on that node are nolonger available to clients. Being aware of functioning defects requires a mechanismfor failure detection [Gue06]. As described in Section 2.1.1, the system is not syn-chronous. This makes failure detection more difficult compared to failure detectionin synchronous system which are introduced in Section 3.3. If time required tocomplete an operation such as delivering a message is known, then a node can besaid to be crashed when the message is not delivered within that time. However,there is no such time limit in which every operation is completed. Thus, decidingon the failure of a node is not straightforward. There might be some cases suchas some links between nodes are down or slow but the nodes are operating. Themessages may take different times to be delivered because of the network traffic orthe node capabilities. In such cases, making a decision about the failure of a nodemay be costly. False detection of nodes will put extra burden to the system becausethe services on the detected node are recovered on another node. Thus, there willbe a waste of resources whereas efficient resource consumption is among the goalsof this thesis.
Failure detectors have requirements regarding actually crashed nodes and actu-ally alive nodes in a system. The former requirements regarding actually crashednodes are called completeness requirements. The latter requirements are calledaccuracy requirements [Gue06].
Completeness has two different kinds and they are as follows:
• Strong completeness: every crashed node is eventually detected by allcorrect nodes. There exists a time after which all crashed nodes are detectedby all correct nodes.
• Weak completeness: every crashed node is eventually detected by somecorrect node. There exists a time after which all crashed nodes are detectedby some correct node, possibly by different correct nodes.
Accuracy has four different kinds and they are as follows:
9

CHAPTER 2. ANALYSIS
• Strong accuracy: no correct node is ever suspected. It means that for allpairs of nodes p and q, p does not suspect q unless q has crashed. This typeof accuracy requires synchrony.
• Weak accuracy: there exists a correct node which is never suspected by anynode. It means that a correct node p is always “well connected”.
• Eventual strong accuracy: after some finite time the failure detector pro-vides strong accuracy.
• Eventual weak accuracy: after some finite time the failure detector pro-vides weak accuracy.
Failure detectors are grouped according to their completeness and accuracy prop-erties as well as the timing assumption whether they are applicable in synchronousor asynchronous systems. Table 2.1 summarizes these different kinds of failure de-tectors.
Strong Completeness Weak Completeness
Synch. Perfect Detector (P ) Detector (Q) S. AccuracyStrong Detector (S) Weak Detector (W ) W. Accuracy
Asynch. Eventually Perfect Detector (♦P ) Eventually D. (♦Q) Eventually S. A.Eventually S. D. (♦S) Eventually W. D. (♦W ) Eventually W. A.
Table 2.1. Failure Detectors
Failure of nodes is one of the aspects in availability. Another aspect is thefailure of a single service. Services running in the system can also fail due to buggyimplementation or any other unexpected reason. Thus, a mechanism to monitorthe state of a service can also be useful if it is operating properly or not. When aservice failure is detected, a recovering protocol can be applied.
2.2.2 AutonomyIn the context of this thesis, “autonomy” means making decisions without any ex-ternal intervention. The environment is heterogeneous, distributed and dynamicwhich makes it complex for manual maintenance. Thus, a self-organizing systemwhich has no external intervention eliminates the complexity and manual interven-tion. The system needs to autonomously adapt itself to changes in the environmentin order to provide availability. Whenever a node becomes unavailable due to anyreason or runs out of available resource, the system needs to detect this and takeactions based on the decisions it makes [Her10].
Some challenges arise during providing autonomy. One of the problems is choos-ing parameters that constitute the base for decisions. Another one is how to decidewhen to take action and what action to take. The system can decide to perform anyoperation on a service as mentioned in Section 2.1.2. If the decision is to migrate
10

2.2. DESIRED PROPERTIES
a service, two new decision problems arise. First one is to decide which serviceto migrate. The second one is to decide where to migrate it. If the decision is toreplicate a service, new problems arise again. First decision to make is to determinehow many replicas are going to be maintained. Then, for each of these replicas,where to place it. The system itself needs to decide where to place a newly installedservice according to the current state of the resources. While making decisions tomanage services, some constraints need to be satisfied. For example, a service andits replica are never placed on the same node. Similarly, two replicas of a serviceare never placed on the same node. The capabilities of nodes should be taken intoconsideration while choosing the node to place a service or a replica.
2.2.3 Load Balancing
As it is explained in the existing infrastructure in Section 2.1, resources in smartspaces are heterogeneous and dynamic. Entities in smart spaces are services andnodes. A service requires certain amount of resources to fulfill its operations. Andthese resource demands may change over time. It is possible that a node hostingseveral services may run out of resources and become overloaded. An overloadednode means that the resource demands on the node are greater than its capacity.In case of existence of overloaded nodes, excess load can be shared with other nodesthat are not overloaded, a load balancing needs to be performed. In other words,utilization of all nodes equally. By utilization, we mean the resource consumptionof a node proportional to its capacity. For example, a node that can perform 100units of work per time is assigned 75 units of work. Utilization of this node is %75.The goal of load balancing is to utilize all nodes at the same level [RLS+03].
2.2.4 Mobility
The term mobility in this thesis means transferring a service or a service replicafrom its current runtime environment to another one. Adaptation to environmen-tal changes is possible through mobility of services among nodes with sufficientresources [RLS+03]. Availability of services or low service response time of sys-tems is possible via migration and replication of services [Her10]. However, livemigration of software requires capturing and re-establishing the state of a software[BHR+02, BLC02, Fün98]. Mobility has different forms depending on its degree asshown on Figure 2.2. When the program code together with its parameter set istransferred to a remote site and its execution is completed there, it is called remoteexecution. Upon completion, the computation results are returned back to its is-suer. The issuer of the execution selects the remote site in this form of mobility. Asimilar form of mobility where the program code is transferred before starting theexecution is called code on demand. The destination itself is the issuer of thismobility. These two forms are also said to provide only “code mobility” because thetransfer is performed before the execution starts. When both program code and itsdata state are transferred, it is called weak migration.
11

CHAPTER 2. ANALYSIS
Figure 2.2. Taxonomy of Mobility [BHR+02]
Data state. In object-oriented programming languages data are organized inclasses. A class is composed of data, stored in named fields and code structuredinto named methods. An instance of a class is called object. Objects encapsulate acollection of data, possibly references to other objects and a set of methods that canbe invoked to manipulate that data. These methods can also have local fields thatare valid only in the scope of methods. Thus, local variables are not considered inthe concept of data state. Data contained in the fields of an object constitute thedata state.
In weak migration, the migration takes place during execution. Thus, putting itin the category of “agent mobility”. In weak migration, the execution after transfercontinues from a predefined point such as a certain method to start. The last andstrongest form of mobility which is also in the category of agent mobility is strongmigration. In addition to weak migration, it also supports the transfer of theexecution state of the program[BHR+02]. The execution continues exactly fromthe point that it was suspended.
Execution state. Each thread of a running program has its own programcounter (PC). It is created when the thread is created and it contains the addressof the current instruction being executed by that thread. PC is one of the entitiesin execution state. The local variables of methods are also included in executionstate. Other additional information is also included depending on the runtimeenvironment. For example, Java Virtual Machine (JVM) includes the Java stackand the stack frame in execution state. Stack is a data structure that works inlast-in-first-out strategy. It has three operations: push, pop and top. Push storesan entry in the stack. Pop removes the entry on top of the stack. Top returns theentry on top of the stack. The Java stack stores frames per thread. When a methodis invoked by a thread, a new frame is pushed onto that thread’s Java stack. A stackframe includes local variables, operand stack and frame data. Local variables arestored on a zero-based array. The operand stack is used as a workspace. Values arepopped from the stack, operations are performed on them and the result is pushedback to the stack. Frame data includes information such as exception dispatching
12
2.2. DESIRED PROPERTIES
and method returns.Mobility includes migration and replication in the context of this thesis. Mi-
gration and replication brings an additional dynamism to the system. We have avery dynamic environment where services and their replicas can be migrated amongdifferent runtime environments.
2.2.5 Migration
Migration of services in the context of this thesis means preemptively suspendingthe operation of a service in its current runtime environment. Then, transferring itto another runtime environment in a different physical location. Finally, resumingthe operation of the service in its new location. The reasons for migration can beload balancing and energy saving as mentioned in Section 2.1.2. Migration needscapturing and reestablishing the state of a service. Detailed explanation aboutstates is given in Section 2.2.4. The destination and the service to be migratedneed to be selected by the system by considering the current state of the systemresources. Migration also has a constraint that needs to be considered while selectingthe destination. This constraint is that a service and its replica never exist in thesame location.
2.2.6 Replication
Replication of services in this thesis means keeping a number of exact consistentcopies of a service in different physical locations. Consistency means having thesame state on all of the instances of a service. Software replication is a cheapersolution for reliability compared to hardware replication because producing newcopies of a developed software is done at no cost. However, in hardware replication,multiple physical computers are deployed as backups to be activated in case offailure of the active machine. Replication has two different fundamental classes oftechniques, primary-backup replication and active replication. In primary-backupreplication strategy, one of the replicas, called primary, plays the role of a mediatorfor all the other replicas. All other replicas, called backups, just receive state updatemessages from the primary and do not interact with the issuer of requests. Uponreceiving a request from a client, the primary processes it, updates its state andgenerates a response. After generating the response, it sends messages to backupreplicas to update their states. Upon receiving acknowledgements from all of correctreplicas, the primary sends back the response to the client. In active replicationtechnique, there is no mediator and all of the replicas are playing active role inprocessing the requests. However, there is need for a front-end process to deliverrequests to all replicas. Every request is sent to all replicas by the front-end process.Each replica processes the request, updates its state and sends back the response.It is up to the front-end which response to send back to the client. Sending the firstresponse received is one of the options. Another option is to collect all responsesand decide on the one that is common to all or majority of replicas.
13
CHAPTER 2. ANALYSIS
2.2.7 Runtime EnvironmentThe heterogeneity and dynamism of the environment brings some constraints oncapabilities of runtime environments that can host services. We need a runtime en-vironment that has low resource requirements because smart spaces can have nodeswith low resources. It is also mentioned about the dynamism of the services thatthey can join and leave the system. Thus, smart spaces need a runtime environmentthat provides plug-and-play support and an update mechanism which is needed fordeploying newer versions of services.
Services in smart spaces can collaborate with each other to assist users. Forexample, a service that provides entertainment services like playing music can col-laborate with a location service that keeps track of current location of a user. Whena user changes its location from living room to kitchen, location service can informentertainment service about this change. When the entertainment service receivesthis information, it can simply deactivate speakers in living room and activate theones in kitchen. Thus, a runtime environment that provides mechanisms for servicediscovery and collaboration is required.
2.3 Questions to be answeredAfter introducing the problems with the existing infrastructure, managed entitiesand desired properties, details about the goal of this thesis are introduced. The goalof this thesis is to answer the following central question which is further decomposedinto more detailed sub-questions:
How to provide a reliable infrastructure for services within smartspaces?
The above central question can be split into more detailed and specific questionsthat will be answered throughout the thesis.
• How to deal with heterogeneity? A problem about this is to have a runtimeenvironment with low resource requirements. Another problem is how totreat all nodes in a fair way so that efficient resource consumption is possible.Making decisions about service management is another trouble. For example,selecting the node to place a service or selecting a service to migrate.
• How to deal with distribution? Decision making in a distributed system is adifficult process. A simple decision to make sure if a node is failed or notbecomes difficult. It is not straightforward to say that a node is failed if amessage is not received in t seconds. It can be received in the next t + 1,second.
• How to deal with dynamism? Adaptation to environmental changes is themain problem which includes many sub problems. Nodes and services joiningand leaving the system is another one of the sub problems. Another one isthe changing resource demands and changing node capacities.
14

Chapter 3
Related Work
A general view about why autonomous and distributed systems need each other isaddressed. After considering the current state of the art solutions in similar anddifferent domains, solutions about the problems and desired properties mentionedin Chapter 2 are addressed. As the environment is heterogeneous, the solutionabout representing this difference between nodes with utility functions is addressed.The two strongest failure detectors among the ones summarized in Table 2.1 areintroduced. Different solutions about decision making mechanisms are introduced.Load balancing mechanisms in structured P2P networks are addressed both forhomogeneous and heterogeneous systems. Mobility concepts and their realizationsare also addressed in different domains. Applications of migration and replicationfor availability and load balancing are addressed. OSGi framework is introduced asa runtime environment.
This chapter starts with the introduction of why Grids and agents need eachother in 3.1 and then continues with utility function in 3.2. Then, solutions on failuredetection are introduced in 3.3. And then, the current decision making solutionsfor autonomy are presented in 3.4. It continues with the concept of load balancingin 3.5. Afterwards, mobility concepts are addressed in 3.6. Next, realized migrationand replication techniques are addressed in 3.7 and 3.8 respectively. Finally, itconcludes with the runtime environment including the OSGi framework in 3.9.
3.1 Grids and Agents
A good example of distributed systems is Grids. Grids are collections of com-putational nodes that provide infrastructures for resource sharing for coordinatedproblem solving. The research on Grids have always been on the area of pro-viding interoperable infrastructure and tools for reliable resource sharing amonggeographically distributed communities. In other words, Grids define protocols andmiddleware for resource discovery and harnessing. Grids are scalable and robustbut they lack intelligence [FJK04].
According to the definition of Pattie Maes, Autonomous Agents are compu-
15

CHAPTER 3. RELATED WORK
tational systems that inhabit complex dynamic environments, sense and act au-tonomously in this environment, and by doing so realize a set of goals or tasks forwhich they are designed. Agents are problem solving entities with well-defined ob-jectives. They are situated in complex environments where they can sense and actwith their sensors and actuators. Agents are flexible and autonomous in terms ofmaking decisions to complete their objectives. They can cooperate or compete withother agents in the same environment or another environment. However, agents arenot designed to be scalable and robust [FJK04].
It is seen from their design perspectives that both agents and Grids have a com-mon thread. This thread is the creation of communities for achieving common goals.However, research on these areas has been focused on different aspects [FJK04].
We cannot adapt nor pure Grid solutions neither pure agent solutions becausewe need the features of both sides [Her10]. Design goals of this thesis includeautonomic system behaviour to reduce complexity which is the strongest part ofagent systems. Providing service availability and efficient resource consumption arealso among the goals and they require scalability and resource sharing which arethe strongest parts of Grids. Thus, a system which is a combination of Grids andagent systems is a relevant approach [FJK04].
3.2 Utility Function
Devices in heterogeneous environments differ in terms of available resources such asprocessing power, RAM, storage, network bandwidth, connectivity, limited batterylife and others. Representing this difference between devices is possible with aranking function or utility function [JB05]. In a peer-to-peer (P2P) system whereeach node has equal responsibilities, peers may exchange periodically their utilityvalues with their neighbours to form an overlay network. Overlay network is a logicaltopology where the nodes are connected with logical links rather than physical links.For example, a line overlay can be constructed by selecting two neighbours whereone of them has the closest utility value to its own but less and the other onewith the closest utility value to its own but larger. Selecting neighbours is donethrough a preference function which selects neighbours according to their utilityvalues. However, the parameters constituting the utility function differs accordingto the application domain. In a P2P video streaming system, the utility can bethought as the network bandwidth and available storage of a peer or the up-time ofa server where the goal is to discover the most stable peers [SDCM06, SD07].
The concept of a utility function can be adapted into the design of autonomousservice placement protocol. Utility function can be used to represent nodes’ availableresources over time.
16

3.3. AVAILABILITY
3.3 Availability
Availability is addressed among desired properties in Section 2.2.1 which requiresfailure detection mechanisms. Different kinds of failure detectors have been designedas summarized in Table 2.1. Two strongest failure detectors are explained briefly.
Perfect Failure Detector is based on the abstractions of synchronous time andcrash-stop processes. It requires strong completeness and strong accuracy. Specialmessages called heartbeat messages are periodically sent to inform other processesthat the sender is functioning properly. The crashes in this model are detected bysetting a timeout for the heartbeat messages. Upon timeout, a process pi detectsa process pj as crashed if there is no heartbeat message received from process pj .The process pj is removed from the known processes set because it crashed andpi will never receive messages from it again. Perfect failure detectors have strongassumptions and require synchrony. Thus, they are not deployed in distributedsystems where there is no synchrony.
On the other hand, Eventually Perfect/Imperfect Failure Detector is based onthe abstractions of asynchronous time and crash-recovery processes. It requiresstrong completeness and eventually strong accuracy. Timeouts for heartbeat mes-sages is used in this model, too. When the timeout occurs, a process pi suspectsprocess pj if there is no heartbeat message received from process pj . The processpj is marked as suspicious rather than being detected as crashed because it mightnot necessarily be dead. Upon receiving a message from process pj , the decisionabout it is revised and removed from the suspicious set and the timeout interval isincreased. The timeout delay used by a process pi to suspect pj will eventually belarge enough because pi keeps increasing it whenever it makes a false suspicion. Thisis because of the assumption that there is a time after which the system becomessynchronous, partially synchronous system [Gue06].
3.4 Autonomy
Autonomy is addressed among desired properties in Section 2.2.1 which requiresdecision making mechanisms. Human being always observes its environment, pro-cesses the information gathered, schedules an action and reflects this action to itsenvironment. For example, we observe the weather before going out. If the weatheris rainy, we plan to take an umbrella. If the weather is sunny and hot, we plan towear light clothes. Finally, we put our plans into action and take an umbrella orwear light clothes before going out. IBM proposed an autonomic manager modelthat has a monitor, analyze, plan and execute (MAPE) loop [KC03]. The proposedmodel has been adapted by [PNS+09] and the adapted model is depicted in Figure3.1. In the model, managed entity can be either a physical device or a softwaremodule that is orchestrated. Monitor module observes raw data from sensors ofthe managed entity and provides the data to analyze module. Analyze module per-forms the analysis of the raw data and provides it to the knowledge agent. The
17

CHAPTER 3. RELATED WORK
plan module receives the knowledge events from the knowledge agent and plans therequired actions based on the desired functionalities and provides the results to theexecute module. The execute module performs the planned actions on the managedentity via actuators.
The application of this simple yet effective model can be observed on all decisionmaking mechanisms.
Figure 3.1. Monitor, Analyze, Plan, Execute [PNS+09]
Making decisions requires a base for the decisions and this base can change de-pending on the application domain. In a grid environment -a collection of computersconnected to perform a common task- each node has to do some computations anddecide on which node to migrate jobs in order to balance the overall load in thesystem. For this purpose, locally connected nodes make estimations about the CPUloads, service rates and job arrival rates of their neighbours [SVM07]. Nodes alsotake into account the job migration cost, resource heterogeneity and network hetero-geneity while making decisions about migration. Based on the result of calculationsof these parameters, they make decisions on which jobs to migrate to which neigh-bours. However, the aim in this method is to provide load balancing, not providinghigh degree of availability.
Mobile agents are defined as active objects that have behaviour, state andlocation. They are called autonomous because once they are invoked they willautonomously decide which locations to visit and what instructions to perform[BHR+02]. Ambient Intelligence is an information technology concept by whichmobile users shall be seamlessly supported in their everyday activities. In such anenvironment, mobile agents can be deployed to assist users. When a user changeslocation in the environment, location agent can inform multimedia agent to activatemusic system in new location of the user. Another example application in such anenvironment is a search agent that can be used to search for a product in a shoppingmall. In the shopping mall scenario, an agent may make decisions about replication
18

3.5. LOAD BALANCING
and migration for decreasing the response latency. It can make decisions accordingto locally collected information over some time interval such as incoming requestsper second or number of hops -intermediary nodes/routers- a request has travelled[Her10]. If the number of requests it receives per time unit exceeds a threshold,it may decide to replicate itself in some other locations. If the number of hopsa request has travelled exceeds a threshold, it may decide to migrate towards thedirection it receives these requests. In this method, the aim is to increase quality ofservice by decreasing response time to user requests. It doesn’t aim fault tolerance.This mechanism also requires a request routing system that routes the requests bydetermining the shortest path.
A market-like structure where mobile agents earn energy for giving service tousers and expend energy for the resources they use is another example for decisionmaking. When an agent runs out of energy, it dies of starvation and in case ofabundance of energy, it reproduces or migrates to other runtime environments. Theagents also migrate to other runtime environments with lower costs in order to savesome energy [WS01, NS05]. This solution, too, doesn’t aim for fault tolerance.
Another example of decision making mechanism is based on time [LAB+]. Inthis approach, a set of replicas called configuration are maintained for a specifiedtime interval. Upon interval completion, the number of replicas may or may notchange but the set of nodes hosting these replicas is changed. This solution aimsfor fault tolerance and load balancing. However, the heterogeneity of nodes is nottaken into consideration.
3.5 Load Balancing
Load balancing is addressed among desired properties in Section 2.2.1. Many pro-posals have been made for load balancing in structured P2P systems and distributedsystems. However, not all of these proposals address the heterogeneity and dy-namism of systems. Chord [SMK+01] is a scalable P2P look-up service for Internetapplications. It is a distributed hash table (DHT) where nodes in this system forman overlay network of a circle. Each node is responsible to store a certain intervalof objects. Object to node assignments are done via a one way hash function ina static way. It is scalable in terms of joining and leaving nodes but it does notprovide any kind of load balancing for the number of objects a node is responsible.This becomes an issue when some objects are more popular than others. In thiscase, nodes responsible for storing these popular objects handle most of the look-ups while the rest handles only a few queries. However, Waon [TOT11] solves thisissue in structured P2P networks. Waon performs dynamic load balancing on thenumber of objects a node is responsible for. Unfortunately, it does not address theheterogeneity of nodes in a system.
In [RLS+03], three different methods for load balancing in structured P2Pnetworks are introduced. Namely, one-to-one, one-to-many and many-to-manyschemes. In one-to-one scheme, a lightly loaded node performs a DHT look-up
19

CHAPTER 3. RELATED WORK
for a random object ID and picks up the node responsible for that object. If thenode is overloaded, load transfer takes place.
In one-to-many scheme, excess loads of an overloaded node are transferred tomany lightly loaded nodes. This is performed by maintaining directories about loadinformation of light nodes in the system. These directories are stored in the systemas normal objects in the DHT and some nodes are responsible for the operations onthem. Lightly loaded nodes periodically advertise their loads and their capacities onthese directories. And overloaded nodes periodically sample these directories. Anoverloaded node picks randomly one of these directories and sends the informationabout its capacity and the loads of its objects. The receiving node that maintainsthe directory chooses the best object to transfer on a light node.
In many-to-many scheme, the same directories in the one-to-many scheme aremaintained with addition to advertising the heavy nodes also. These directories canbe thought as a global pool where all overloaded nodes put their excess loads. Thenodes responsible for maintaining these directories perform the matching of loadsto be transferred to light nodes. This scheme is explained in more details in Section4.5.1.
3.6 Mobility
Mobility is addressed among desired properties in Section 2.2.1 which includes cap-turing and re-establishing state of the software being mobilized. Weak migrationis the choice for most of the mobile agent platforms such as JADE [BCPR03],Agentscape [age], Mole [BHR+02] and Aglets [Agl09]. All these platforms are writ-ten in Java (Agentscape mostly in Java) and are mainly using the Java ObjectSerialization API [Sun01]. It provides a stable object serialization mechanism. Anobject is a programming-language level software entity that encapsulates a collec-tion of data, possibly references to other objects and a set of procedures that canbe invoked to manipulate that data [Huc]. Object serialization means flattening anobject in a way to be stored on permanent storage such as a file or transferred overnetwork in order to be reused later by reconstructing the object [Gre].
Capturing the execution state of Java programs is not allowed by the Java secu-rity policy [LYBB12]. Thus, several techniques have been developed to capture theinternal state of a Java application. These techniques can be categorized as JavaVirtual Machine (JVM) manipulation, byte-code instrumentation, source code in-strumentation and modification of the Java platform debugger architecture (JPDA).JVM manipulation means customizing the core JRE so that it provides the func-tionality of capturing the execution state. This method is efficient in terms of speedand overhead but it has the main drawback of not being portable which is the maingoal of the Java platform [BHD03]. Byte-code instrumentation means manipulat-ing the compiled source code by post-processing. A class file includes the byte-code instrumentations to be interpreted by the JVM [Dah99, Whi, BLC02, SSY00].This method has the drawback of time and space overhead. Source code instru-
20

3.7. MIGRATION
mentation means including special instructions in the source code to save snap-shots/checkpoints of the state be pre-processing the source code before compilation[Fün98]. This method also has the same drawbacks as the byte-code instrumen-tation and also the disadvantage that the source code is not always available incase of using libraries. Performing some modifications on JPDA allows capturingthe execution state as well. It is possible to access runtime information of an ap-plication in debug mode [AmSS+09]. Bytecode and source code instrumentationmethods have been applied to preserve the portability of the Java programs by dif-ferent techniques such as using the Java exception handling mechanism, debuggingtools and functionality blueprint transformation [BOvSW02]. Migrating operatingsystems instances, virtual machines, across physical hosts is another use of strongmigration. It provides a distinction between hardware and software, and facilitatesfault management, load balancing and low-level system maintenance [CFH+05].
3.7 MigrationMigration is addressed among desired properties in Section 2.2.1. It is one of thetechniques used for providing availability [Mar08]. However, it has its own challengessuch as saving the state of the entity to be migrated and reestablishing at thedestination. The reason for the decision to migrate an entity can be based ondifferent facts. If it is possible to know apriori that a node will be unavailable, theservices running on that node can be pre-emptively moved to other system nodesprior to node death. Apriori knowledge of failure can be battery exhaustion ofa mobile device or system maintenance by administrators. In such cases, entitiesrunning on that node can be forced to migrate to another one [Huc].
The nodes don’t necessarily have to die or crash to perform migration. Nodes inthe systems have limited resources and when a node starts to run out of availableresources, some of the services running on that node can be migrated to anotherone with more resources. This can serve for the purpose of load balancing amongnodes [SVM07]. A new approach to migration has been introduced by [LAB+].This approach enables migrations of services that replace non-failed nodes. It pro-vides both load balancing and autonomy but does not take into consideration theheterogeneity of nodes.
3.8 ReplicationReplication is addressed among desired properties in Section 2.2.1. It is anotherwidely deployed approach for providing availability. It requires extra communicationoverhead for state consistency among replicas. It has two different techniques asdescribed previously in Section 2.2.6. Active replication has been the choice forfault tolerance despite its high complexity for consistency [Mar08, FD02]. Whenactive replication method is used, there is need for a total order/atomic broadcastmechanism that the messages are delivered in the same order to all of the replicas.
21

CHAPTER 3. RELATED WORK
One way of achieving total order broadcast is by adapting a consensus mechanismwhich solves the problem of total order broadcast [Gue06]. Paxos, [Lam01], isthe most widely known consensus algorithm proposed by Leslie Lamport and it isapplied in [LAB+] for deciding on the execution order of the requests. In case offailure of primary replica in primary-backup replication, there is need for a primaryelection system [GS96]. Both techniques have their advantages and disadvantagesover each other. Failures in active replication are transparent to the user while usersmay have to reissue requests and can experience some delay in primary replication.Primary replication does not require a total order broadcast or consensus mechanismfor consistency. Finally, active replication uses more resources because all replicasare actively processing requests.
3.9 Runtime Environment (RTE)
Runtime environment is addressed among desired properties in Section 2.2.1. Assoon as a software program is executed, it is in a running state. Within this state,the program can send instructions to the computer’s processor, access the RAM,storage, network resources and other system resources [tec]. Runtime environmentsare components designed to support the execution of programs by providing themresources. The most commonly known runtime environment is the Java runtimeenvironment (JRE). JRE provides an abstraction layer over the operating systemthat allows a java application or applet to be executed on any other computer withJRE installed [LYBB12]. OSGi Alliance (former Open Services Gateway initiative)is a framework that runs on top of JRE [OSG11]. It provides a general-purpose,secure and managed Java framework that supports the deployment of extensibleand downloadable applications known as bundles. The main purpose of OSGi isto provide a modular approach to software development. Software is developed bycreating standalone operational pieces called modules. Each module has a specificoperational purpose and can be later used by other modules. In this approach,software development can be thought as putting together the pieces of a puzzle. Inthe context of OSGi, these modules are called bundles.
OSGi framework provides a very dynamic environment where bundles join andleave the system at runtime without restarting the framework. Bundles can be up-dated with newer versions or new versions can be installed while preserving the pre-vious versions of bundles. Bundles are called dependant when one bundle requiresanother one to run. It can be thought as a relation similar to producer-consumer.Producer is the one that provides the service and the consumer is the one thatdepends on the producer. Bundles include all the required resources for their oper-ation in a Java archive (JAR) file. All these requirements are defined in a file calledMANIFEST.MF file located in META-INF directory of each bundle. The manifestfile declares the other bundles together with their versions that the operation of thebundle depends. The framework ensures that all these dependencies are satisfiedbefore starting a bundle. Manifest file also includes the list of exported packages of
22

3.9. RUNTIME ENVIRONMENT (RTE)
a bundle that other bundles can consume.Some of the most widely used bundle manifest headers are as follows:
• Bundle-Activator: specifies the name of the class used to start and stop thebundle.
• Bundle-ClassPath: defines a comma-separated list of JAR file path names ordirectories containing classes and resources.
• Bundle-Name: defines a human-readable name for the bundle.
• Bundle-SymbolicName: specifies a non-localizable name for this bundle. Thebundle symbolic name together with a version identifies a unique bundle.
• Bundle-Version: specifies the version of this bundle.
• Export-Package: a comma-separated list of packages exported by this bundlefor use of other bundles.
• Import-Package: a comma-separated list of packages imported by this bundlethat are exported by other bundles.
• Require-Bundle: specifies that all exported packages from another bundlemust be imported, namely the public interface of another bundle.
A bundle may be in one of the following states:
• INSTALLED - The bundle has been successfully installed.
• RESOLVED - All Java classes that the bundle needs are available. The bundlein this state is either ready to start or has stopped.
• STARTING - The bundle is being started.
• ACTIVE - The bundle has been successfully activated and is running.
• STOPPING - The bundle is being stopped.
• UNINSTALLED - The bundle has been uninstalled from the framework andit cannot move into another state.
23


Chapter 4
Design
Putting the problem and the current state of the art solutions in similar and differentdomains together, a centralized system is introduced. It is centralized in the sensethat all information is gathered in a single service in the system. However, it doesnot exhibit the behaviour of a single point of failure because it is decentralizedin the sense that it manages itself by migration and replication and treats itselfas any ordinary service. The system is called SMYRNA and it manages all theservices running in the system. SMYRNA itself is a service that is deployed in theruntime environment which is the OSGi framework. OSGi is adapted as the runtimeenvironment because of its modular service oriented and dynamic nature and itslow resource requirements. The nature of OSGi provides great ease in replicationand migration because the framework enables deployment of services dynamically.The environment is distributed and asynchronous. Thus, eventually perfect failuredetector algorithm is adapted with a slight modification to detect node failures. Themodification is required because of the burden that will be caused to the system incase of false suspicion of a node failure. Finally, list of functionalities to be adaptedby services are listed in order to be manageable by SMYRNA. These functionalitiesinclude operations such as starting, stopping, resuming and suspending services.Also some operations for collecting statistical information are listed.
Designed solution for the problem is introduced in an abstract way in 4.1. Then,we continue with utility functions in 4.2. Afterwards, service functionalities thatare needed to manage services are introduced in 4.3. After that, failure detectionmechanism for total failures together with its adaptation and worst case complex-ity scenario are introduced in 4.4. Then, management mechanism, SMYRNA, isintroduced in details about decision making strategies in 4.5. Finally, this chapterconcludes by addressing the functionalities of runtime environment in 4.6.
4.1 Introduction
We want to achieve the goals and answer the questions listed previously in Chapter1 and Section 2.3. The path to conclusion goes through adapting the current state
25

CHAPTER 4. DESIGN
of the art solutions for similar problems in different domains as listed in RelatedWork 3. Taking into account the goals to be achieved, challenges and current stateof the art solutions, a system to meet the needs is designed.
In general, the system is responsible for placing and managing services in smartenvironments. The abstract view of the system is given in Figure 4.1. We havea virtual computing node which is composed of several physical computing nodesand we have services available for users. The idea is to give the view of a singlecomputing node while in fact there are several nodes constituting a distributed sys-tem. Users can interact through a user interface which can be a control panel inhome, an application store where users can buy new services, or any other interfacesuch as a web page. A user can install a new service, start or stop it, uninstallan already installed service, give feedback about services or can interact with anyservice. When a new service is installed, the system selects an appropriate com-puting node according to the desired functionality parameters to place this service.Creates replicas of this service depending on the provided parameters and placesthem in different computing nodes. It also manages these services at runtime by mi-grating them to different computing nodes with more available resources. It allowsthe system to adapt to environmental changes without any external intervention.Placement actions are denoted by arrows in the figure. Solid arrows represent theplacement of primary/active services while dotted arrows represent the placementof replicas. As it is seen from the figure, the number of service replicas may differ.This number depends on the parameters provided by the user.
Availability is one of the parameters and represents the desired level of avail-ability of a service (e.g. 0.99999). Latency is another one which denotes how fasta service communicates (e.g. MAX 100 milliseconds). Priority can be another pa-rameter indicating how critical a service is. Priority can be a numeric value on apredefined interval such as [1-10] where higher values represent higher priority as itis the situation with processes and threads in operating systems currently. This isan important parameter because critical services, such as building security, can bedeployed in smart spaces. Another factor can be that many other services dependon this service and it is desired to have a high priority.
More detailed view of the system is given in Figure 4.2. On the left side of thefigure there is a special case which is explained in details later in Section 4.5. Atthe bottom lays a physical computing node. A computing node is composed of anoperating system (OS), Java Virtual Machine (JVM) on top of OS and the OSGiframework on the top most. As it is explained earlier in Section 3.9, applicationsdeployed in OSGi are called bundles. On top of the computing node there is aspecial bundle called RTE. On the top most service bundles are located that can beused by users. The links represent the connectivity among entities.
Beside these entities, there is a special entity denoted with a pentagon namedK. This entity is called the knowledge store which is already provided by the au-tonomous control and management platform, DS2OS, developed in Technical Uni-versity of Munich. Knowledge store provides a high level abstraction of devicesin smart environments. It is responsible for storing the data of these devices and
26

4.2. SMYRNA UTILITY FUNCTIONS
Figure 4.1. Abstract View of the System
services.
4.2 SMYRNA Utility Functions
Taking into consideration the problem about heterogeneity mentioned in Section2.1.1 and the current state of the art solutions for dealing with this problem asintroduced in Section 3.2, specific utility functions for the purpose of this thesisare designed. As it was explained previously, utility functions are based on someparameters. We decided to select CPU, memory and network bandwidth values ofa node as the most important parameters to constitute our utility functions. Thereare 2 different utility functions, namely utility of a node and utility of a service ona node.
4.2.1 Utility of a Node
Smyrna has a novel migration strategy which is explained in details in Section 4.5.3.This strategy aims at migrating one service at a time from the worst RTE to the best
27

CHAPTER 4. DESIGN
Figure 4.2. Detailed View of the System
fitting RTE for the selected service. Utility of an RTE is calculated to determinethe worst RTE that a service is going to be migrated from. The strategy of selectingthe service to be migrated is given in Section 4.5.3. The utility function of a nodeis formulated as
UM =m+
n∑j=1
HM
n
2 (4.1)
where m is the slope of the fitted line of utility histories and HM = (U1, U2, ..., Uη)is the utility history of node M . Each utility of a node M is calculated as
Ui =
n∑k=1
Pk
n(4.2)
where P = (C,M,N) is the set of parameters that constitute our utility functions.C is free CPU, M is free memory and N is free network available. C is calculatedas
C = CPUidle ∗ CPUtotal (4.3)
28

4.2. SMYRNA UTILITY FUNCTIONS
where CPUidle is the CPU idle percentage and CPUtotal is the total CPU capacity.
M = Mfree (4.4)
where Mfree is the current free system memory. N is calculated as
N = Nfree ∗Nmax (4.5)
where Nfree is the currently free percentage of network and Nmax is the maximumamount of traffic that can be handled.
Designed utility function has a parameter, η, that denotes the history size. Inthis design, it is decided to keep the history of the last η = 10 utilities. Worstruntime environment is selected by investigating nodes’ utility histories. Whilecomparing runtime environments, an ultimate utility of each runtime environment iscalculated as given in 4.1. This value is calculated by fitting the utility history valuesin a line by the least squares fitting method. Then, the slope of the line is takeninto consideration to conclude if it shows increasing or decreasing characteristic.The slope of the fitted line constitutes half of the ultimate utility. Calculatingonly the slope of the fitted line is not enough to make a decision that the runtimeenvironment is a good one or not. There can be a case that a runtime environmenthas a utility history with alternating values that are all close to each other. In thiscase, the slope of the fitted line is close to 0 even though it has many free resources.Thus, average of the utility history is also taken into account while calculating theultimate utility. Average utility is normalized according to maximum average utility.The slope of the fitted line and the average utility values constitute the ultimateutility value.Utility of a node is used in order to determine the worst RTE in the system so thata service can be migrated from it to free some resources.
4.2.2 Utility of a Service on a Node
Smyrna’s novel migration strategy aims at relaxing worst RTEs by migrating ser-vices to other best fitting RTEs by migrating one service at a time. The worst RTEis selected by calculating the utility of a node as given in the previous subsection4.2.1. Best fitting RTE for a given service is determined by calculating the utilityof a service on each RTE. RTE which results in maximum utility is selected as thebest fitting one for the given service. The utility of a service s on a node M iscalculated as
US,M =n∑i=1
Wi,S ∗ Pi,M (4.6)
where W = (Wc,Wm,Wn) is the set of weights that service S provided about CPU,memory and network respectively. P = (C,M,N) is the set of free resources ofnode M as explained in subsection 4.2.1 and are calculated as in equations 4.3, 4.4and 4.5 respectively.
29

CHAPTER 4. DESIGN
Calculating utilities of a service on all nodes in the system, best fitting RTE canbe determined for a service to be placed. The weight vector provided by a serviceplays a major role in here. For example, a service providing the weight vector asW = (80, 10, 10) means that this service is putting a lot of importance on CPUwhile memory and network are not that important for it. In this case, best fittingRTE for this service will be the one with the most free CPU in the system.
Smyrna utility functions are metrics for measuring available resources for con-sumption and service fitting values on nodes. In Section 2.3, some questions to beanswered throughout this thesis are addressed. The utility functions are partialanswer for the first subquestion about dealing with heterogeneity. Smyrna utilityfunctions help to have a metric to treat all nodes in the system in a fair way.
4.3 Service FunctionalitiesWe want to manage the services in our smart space by placing, migrating andreplicating them. To achieve this, interaction with these services is required. Thisis possible via so called Application Programming Interface (API). Thus, certainoperations that can be invoked on these services are defined. The services are calledbundles. Bundles are applications that can be deployed in OSGi framework whichis the adapted runtime environment as explained in details later in Section 4.6.
• start: the initiating operation that does the necessary initializing operationssuch as registering a service as a remote service. This operation calls the runmethod of a service after finishing the initialization. The implementation ofthis operation is provided and is not left for service developer. All a servicedeveloper needs to do is to call this operation after initializing its service.
• stop: the terminating operation that stops the service. This operation givesthe possibility to finalize the service functionality and do the clean up such asclosing connections and freeing resources.
• suspend: active replicas need to be migrated or replicated when it is necessary.This operation is used to signal an active replica to suspend its operation andsave its state in the knowledge store. It can be called before migration orreplication to perform necessary state saving operations.
• resume: this operation is used to signal a replica that it will be the primaryreplica which is going to handle the requests from now on.
• run: this operation is the main method of a service. This method does theactual work that a service is supposed to do. Thus, the implementation of thealgorithm must be done within this method.
• getBundleName: we need to know the name of the bundle that each serviceis running. This operation will return the name of the bundle in the form
30

4.4. FAILURE DETECTION
of [BundleSymbolicName_Version] (e.g. de.edu.tum.rte_1.0.0). BundleSym-bolicName_Version constitutes a unique identifier in an OSGi framework.
• getLastModified: we need the information when a service was last modified.Last modified information denotes when a service was installed or updated.This information is necessary for making the decision about which service tomigrate.
• isActive: we have primary replicas that are actively handling user requestsand we also have their replicas. This state information states if this service isthe primary service or it is a replica.
• isAlive: as we explain in Section 4.6, runtime environments are responsible forcollecting information about services. This operation is invoked periodicallyby RTEs to monitor a service if it failed or not. If a service does not respond,a crash report is prepared for this service and a recovery protocol is applied.
• getStateAddress: we need to know about the address in the knowledge storeof a service state. This address is necessary for state serialization in case ofmigration or replication. The serialized state is deserialized at the destinationknowledge store. Thus, we transfer the data state of a service.
4.4 Failure DetectionBased on the analysis of the problem that a failure detection mechanism is requiredand the current state of the art solutions for this purpose, we decided to deployeventually perfect failure detection mechanism. The main reason of this choice isthat we have an asynchronous system. The system does not have a known timebound in which every operation is completed. It means that a message sent fromnode A to node B may take an arbitrary amount of time. It cannot be said thatnode A is crashed because node B didn’t receive a heartbeat message within tmilliseconds. There might be a congestion on the network route that the messagetravels which causes a delayed delivery.
The original algorithm for this type of failure detector is given in Algorithm 1.However, it cannot be adapt exactly the same mechanism and some modificationsare required. The reason why it cannot be adapted entirely is the possibility ofmaking false suspicion about a node’s failure. False suspicion brings burden to thesystem because of the replication strategy. We need to keep a number of replicas ofeach service depending on the parameters described previously in the introductionof this chapter. When a failure is detected, new replicas are created and placedappropriately in the system. If there is a false suspicion, additional replicas of theservices residing in the suspected node will be created. This causes more resourceconsumption, inconsistency and redundancy in the system.
A failure detector for another purpose is also required. Namely, to detect failureof the primary Smyrna instance. This failure detector is used by backup replicas of
31

CHAPTER 4. DESIGN
Smyrna. Primary Smyrna instance periodically sends ping messages to its replicas.Replicas receiving the pings update their information of the primary instance asalive. All replicas use a modified version of the eventually perfect failure detec-tor. The modification on the algorithm is at the same point as the one used bySmyrna where a node is suspected. The modified eventually perfect failure detectoralgorithm is given in Algorithm 2.
4.4.1 Eventually Perfect Failure Detector
It is based on maintaining a time delay and two sets of neighbours, namely alive andsuspected sets. Initially, alive set is assigned all the known neighbours (Π), suspectedset is empty (∅) and the period is set to TimeDelay value. Upon occurrence ofheartbeat deliver event, the sender of the message is added to the alive set. Upontimeout for heartbeat event, a heartbeat message is sent to each neighbour and theheartbeat timer is reset. Upon timeout for check event, the alive set and suspectedset are checked if they have a common entry. If so, it means that the algorithm hasmade a false suspicion and it increases the timer period by ∆. Then, each neighbourpi ⊂ Π is checked for two conditions. First, pi is checked if it does not belong toboth alive and suspected sets. If this condition is satisfied, pi is added to suspectedset and a suspect event is triggered. If not, the second condition is checked if pi is inboth sets. If it is, it means that the algorithm made a false suspicion and removespi from the suspected set and triggers a restore event. Finally, when all neighboursare checked, the alive set is set to be empty and the check timer is reset.
4.4.2 Modified Eventually Perfect Failure Detector
As it is described in the previous subsection, a modification the original algorithmis needed. The system is designed to operate on the overlay network provided byDS2OS. Thus, all communication is done using this overlay. New design of thefailure detector works as follows: instead of sending ping messages to all nodesin the system, all nodes send periodic ping messages to primary Smyrna instance.Smyrna receives all ping messages and performs the steps as defined in the originalalgorithm (Algorithm 1) except for the suspicion event. When a node is suspectedby Smyrna, it tries to establish a direct connection to this node using the overlaynetwork and checks if it is alive or dear. If it does not respond positively, then thisnode is detected as dead and recovery protocol for the services deployed on thatnode is started. If the node is alive, then Smyrna evaluates this as a false suspicionand increases the timer period by ∆.
The primary Smyrna failure detector used by backup replicas is given in Algo-rithm 2. It works as follows: replicas maintain two flags indicating if the primary isalive or suspected. Upon timeout of check timer, replicas check if the primary is setboth as alive and suspected. If this is the case, it means that they have made a falsesuspicion and they increase the check timer by ∆. Then they check if primary is notset nor as alive, neither as suspected. If it is the case, suspected flag is set to true
32

4.4. FAILURE DETECTION
loa 1. Eventually Perfect Failure Detector [Gue06]
1: upon event < Init > do2: alive ← Π3: suspected ← ∅4: period ← TimeDelay5: startT imer(TimeDelay,HEARTBEAT )6: startT imer(period, CHECK)
7: upon event < Timeout | HEARTBEAT > do8: for all pi ⊂ Π do9: trigger < send | pi, [HEARTBEAT ] >
10: end for11: startT imer(TimeDelay,HEARTBEAT )
12: upon event < Timeout | CHECK > do13: if (alive ∩ suspected) 6= ∅ then14: period← period+ ∆15: end if16: for all pi ⊂ Π do17: if not(pi ⊂ alive) ∧ not(pi ⊂ suspected) then18: suspected← suspected ∪ pi19: trigger < suspect | pi >20: else (pi ⊂ alive) ∧ (pi ⊂ suspected)21: suspected← suspected \ pi22: trigger < restore | pi >23: end if24: end for25: alive← ∅26: startT imer(period, CHECK)
27: upon event < Deliver | src, [HEARTBEAT ] > do28: alive← alive ∪ src
33

CHAPTER 4. DESIGN
and replicas try to establish a direct connection to the primary using the overlaynetwork and check if it is alive or not. If it is not alive, then they start an electionround among all replicas. The election process works as follows: each replica queriesall replicas using the overlay if it can be the primary by sending its ID. When thequery is received by any replica, the result is returned as a comparison of IDs. Ifthe received ID is less than its own ID, then the requester can be new primary. Thereplica who collects all votes which is also the one with the lowest ID, becomes thenew primary Smyrna instance.
Adapted failure detector helps to answer some of the subquestions listed in Sec-tion 2.3. This solution is a partial answer to the question of dealing with distributionand dynamism.
4.4.3 Worst Case ScenarioThe worst case scenario for detecting a failure is given in Figure 4.3. Only heartbeatmessages sent by Node 1 are shown to demonstrate clearly. Node 1 sends heartbeatmessages to all its neighbours at time t1 and crashes right after that. All other nodesreceive the heartbeat messages before their check periods at time t2 and they don’tsuspect Node 1. At time t3, when nodes check for received heartbeat messages,they realize that Node 1 is crashed. Then, they start a consensus among each otherand exchange messages which takes c seconds as shown in the figure. The numberof messages exchanged can be calculated in terms of nodes in a system. Let N bethe number of nodes in a system. When a node fails, N − 1 nodes start consensusand each of them sends N − 2 messages and N − 2 responses are generated to thesemessages. In total, N − 1 ∗ 2(N − 2) = 2N2 − 6N + 4 messages are exchanged in aconsensus round. This means that the worst case number of messages for consensuscan be presented as O(N2). If period for checking alive neighbours is t seconds anda consensus round takes c seconds, then the worst case for detecting a crash wouldbe 2t+ c seconds.
4.5 SMYRNAThe special case on the left side of Figure 4.2 is the existence of a very special andcritical bundle called SMYRNA. What makes this bundle so special is that it isthe decision making mechanism. Previously we mentioned about the MAPE loopin Section 3.4. RTE bundles have informational functionalities that are describedin Section 4.6. These functionalities form the monitoring phase of the MAPE loop.Collected information is stored in knowledge stores by RTEs. This informationis then retrieved and analyzed by SMYRNA. The analyzed information results inknowledge which is used in the planning phase. Based on the knowledge gainedfrom the analysis phase, SMYRNA can conclude into some decisions that involveservices and runtime environments, planning phase. Putting these decisions intoactions makes the execution phase. The logical view of the architecture is givenin Figure 4.4. The system can be thought as a ring structure where all entities
34

4.5. SMYRNA
loa 2. Modified Eventually Perfect Failure Detector
1: upon event < Init > do2: alive ← false3: suspected ← false4: period ← TimeDelay5: startT imer(period, CHECK)
6: upon event < Timeout | CHECK > do7: if (alive and suspected) then8: period← period+ ∆9: end if
10: if (!alive and !suspected) then11: suspected← true12: alive← primary.isAlive()13: if !alive then14: trigger < election >15: end if16: else if (alive and suspected) then17: suspected← false18: end if19: alive← false20: startT imer(period, CHECK)
21: upon event < deliver | [HEARTBEAT ] >22: alive← true
23: upon event < election >24: agreed← 025: for all ri ⊆ R do26: iAmPrimary ← ri.amIPrimary(myId)27: if iAmPrimary then28: agreed← agreed+ 129: end if30: end for31: if agreed = R.length then32: trigger < newLeader >33: end if
34: upon event < amIPrimary | ID >35: return myId > ID
35
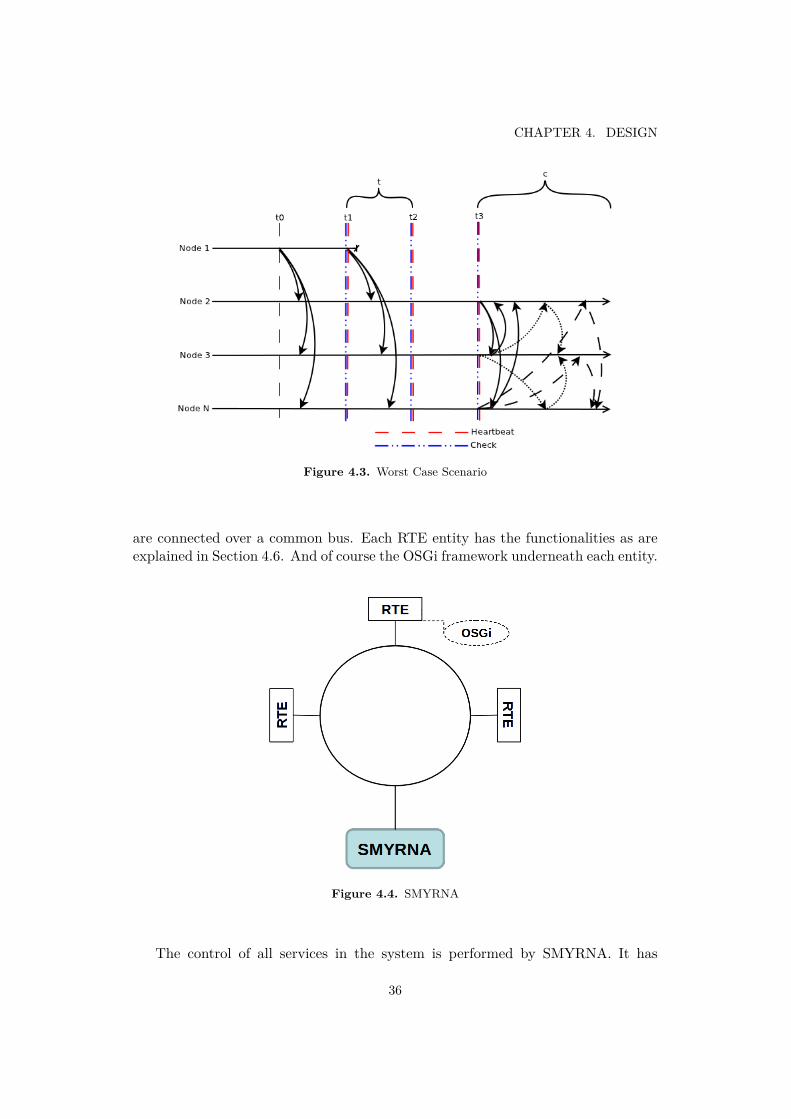
CHAPTER 4. DESIGN
Figure 4.3. Worst Case Scenario
are connected over a common bus. Each RTE entity has the functionalities as areexplained in Section 4.6. And of course the OSGi framework underneath each entity.
Figure 4.4. SMYRNA
The control of all services in the system is performed by SMYRNA. It has
36

4.5. SMYRNA
to decide where to place a service if a user wants to install a new service. Notonly where to place it but also it needs to decide how many replicas to maintaindepending on the parameters provided by users. After calculating required numberof replicas, then it has to decide where to place these replicas, too. Placing newservices and maintaining their replicas was the first problem. The second problemraises during the operation of these services. We have a dynamic environment andSMYRNA has to adapt to the environmental changes.
Failure of a computing node is one of the factors affecting decision makingmechanism. SMYRNA has to make sure that a node is for sure failed if it doesn’treceive a heartbeat message. As described in Section 2.2.1, it might be the situationthat connection between SMYRNA node and the other node is slow and heartbeatmessage is delayed. If it makes a false decision on the failure of a node, it hasto manage all services that were running on that node. This false decision bringsburden to the system by duplicating services on failed node and placing them onother nodes. Thus, detecting a failure is critical and it has to reach a consensuswith other nodes in the system that the suspected node is for sure dead.
Beside failure of a node, changes on available resources is another importantfactor that affects the decision making mechanism. A user may start using one ofthe nodes in the system for any purpose which causes resource consumption. In thiscase, SMYRNA has to adapt the system so that services run on nodes with sufficientresources. This adaptation provides optimization and load balancing in the system.The decision to make in this situation is first to determine which service to migrate.Second, where to migrate this service. While deciding on where to migrate, it musttake into account that service downtime must be minimum and also a service mustnever be in the same location with one of its replicas.
The proposed solutions about placement, migration and replication answer partsof all the questions listed in Section 2.3. Placement strategy answers the questionsabout where to place, migrate and replicate a service. Migration strategy answersthe questions about making decisions on when and which service to migrate listedrelated to the questions about dealing with heterogeneity. Replication strategyanswers the questions about dynamism in terms of recovery protocols to be appliedin case of node or service failures.
Detailed explanations about these decisions are given in the following subsec-tions.
4.5.1 Load Balancing
The environment is dynamic in terms of nodes, services and available resources forconsumption. The necessity of load balancing is addressed in Section 2.2.3 andcurrent state of the art solutions in similar domains in Section 3.5. Many-to-manyscheme developed by [RLS+03] is adapted. The algorithm is composed of unload,insert and dislodge phases.
In the unload phase, an overloaded node transfers its lightest services into theglobal pool until it becomes underloaded. At the end of this phase, all nodes are
37

CHAPTER 4. DESIGN
underloaded but the services in the pool are waiting to be assigned.Insert phase aims to transfer all services from the pool to underloaded nodes
without creating any new overloaded nodes. All services in the pool are tried to betransferred to an underloaded node starting from the heaviest service. A destinationnode d is selected from the underloaded nodes such that deploying service s willmaximize the utilization of d. This is repeated for all services until all services aretransferred in the pool or no more services can be transferred. If a service cannotbe assigned, algorithm continues with dislodge phase. If all services are transferred,the algorithm halts. Otherwise, remaining services in the pool are assigned back totheir original nodes.
Dislodge phase aims at swapping the heaviest service s from the pool with thelightest service s’ from an underloaded node l. If no such service can be identified,the algorithm halts. Otherwise, swap operation is performed and the algorithmcontinues from the insert phase.
Smyrna is the decision making unit in the system where all nodes periodicallyreport their capacities, current loads and services deployed to them. Thus, Smyrnais the directory where all information about overloaded and underloaded nodes ismaintained in the system. Many-to-many scheme is applied only in the presenceof both overloaded and underloaded nodes. It is not applied among nodes whichare all overloaded or underloaded. If there are no overloaded nodes, the migrationstrategy explained in Section 4.5.3 is applied. The algorithm of many-to-manyscheme is given in Algorithm 3.
loa 3. Many-to-many
1: N is set of all nodes2: underloaded← ∅3: pool← ∅4: unload() all nodes are underloaded after this phase5: insert(pool) all possible services are transferred to underloaded nodes6: redeployServices() remaining unassigned services are deployed back to their
nodes
4.5.2 Placement Strategy
This decision is the most crucial decision that SMYRNA makes. Three differentsituations result in this decision. First, if a new service is being installed to thesystem, the service must be placed in an appropriate node. Second, when a decisionabout migrating a service is done and the service must be migrated to a node withsufficient resources. Third and last situation is when a decision to replicate a serviceis done and the replica must be placed in an appropriate node. The destinationruntime environment is selected as the best node based on the utility histories ofnodes in the system. The constraints of not placing an active service and its replica
38

4.5. SMYRNA
loa 4. unload
1: underloaded← ∅2: pool← ∅3: for all ni ⊆ N do4: if ni is overloaded then5: while ni is overloaded do6: lightest← ni.removeLightest()7: pool← pool ∪ (ni, lightest)8: end while9: else
10: underloaded← underloaded ∪ ni11: end if12: end for
loa 5. insert(pool)
pool.sort() sort all services in ascending order according to their loadsfor i = pool.size()→ 0 doi← i− 1(ni, service)← pool(i)best = getBestF ittingNode(service, underloaded)if best 6= null thenbest.deploy(service)pool← pool r (ni, service)
elsedislodge(i)
end ifend for
and two replicas in the same node are also taken into consideration during thisdecision.
We have services with different resource demands and different weights providedfor these resources. Thus, we need to calculate utility of a service for each RTEin order to determine the best fitting RTE. The selection of target RTE to place aservice is done by choosing the best RTE with maximum utility value as calculatedby equation 4.6 for the service.
There is a parameter and constraint that must be satisfied while choosing thebest RTE in the system. This parameter is calledMinHistoryV alues which denotesthe number of utility values that must be available before making a decision. Thereis also another parameter which states the utility history length and is denoted asη. In our design, we decided to choose η = 10 and MinHistoryV alues = 2. So,to make a decision about the best RTE, we need to have at least 2 values of theutility history to be filled. The reason for choosing MinHistoryV alues = 2 is that
39

CHAPTER 4. DESIGN
loa 6. getBestFittingNode(service, underloaded)
1: min←MAX2: best = null3: for all ni ⊆ underloaded do4: if ni is not overloaded with service then5: remaining ← get free resources if service deployed on ni6: if remaining < min then7: min← remaining8: best← ni9: end if
10: end if11: end for12: return best
we need at least 2 values to fit a line in order to characterize the state of a node.MinHistoryV alues is required to make the first decision about RTEs’ states. Thisvalue can be set to a greater value, not greater than η, to make a more healthy firstdecision. η can also be set to a greater value in order to have more data about thepast of RTEs.
4.5.3 Migration Strategy
The algorithm for making decision about migration is given in Algorithm 9. Theidea is to migrate the oldest and most memory consuming service from the worstRTE to the best RTE by satisfying constraints about not placing replicas in samelocation. The algorithm works as follows: the worst RTE is selected according toutility histories. If no RTE satisfies the constraint ofMinHistoryV alues, algorithmhalts. Then, a service from the worst RTE is selected with a priority to be anactive service by excluding services in the candidate history. If no active serviceis selected, then a replica is selected. If no service is selected, algorithm halts andreturns NoOp which means to take no action. The selected service is added tothe candidate history. Afterwards, locations of this service are discovered. Thisis done by searching locations of this service’s active and replica locations. Thereason for discovering service locations is to satisfy the constraint about not placingreplicas in same location. Then, the best RTE is selected by providing the servicelocations to be excluded from the search. If no RTE is selected, algorithm returnsto the point on selecting a new service. Otherwise, selected RTE is checked if itbecomes overloaded if the candidate service is deployed on it. We do not want tocreate new overloaded RTEs because it increases the number of unsatisfied services.Afterwards a comparison is done with the worst RTE. If the best RTE satisfiesthe MigrationThreshold, then the selected service is migrated from the selectedworst RTE to the best one. MigrationThreshold = 0.90 is selected as a designparameter. This threshold means that it is necessary for a best RTE to be at least
40

4.5. SMYRNA
loa 7. dislodge(index)
1: modified← false2: heaviest← pool.get(index).service3: host← pool.get(index).node4: lightest← null5: node← null6: min← 999997: for all ni ⊆ underloaded do8: for all service ⊆ ni.services do9: if host.services.contains(service) then
10: continue11: end if12: if heaviest can be swapped with service without making ni overloaded
then13: load← service.getLoad()14: if load < min then15: min← load16: lightest← service17: node← ni18: modified← true19: end if20: end if21: end for22: end for23: if modified then24: node.swap(heaviest, lightest)25: pool.get(index).service← lightest26: end if27: return modified
10% better than the selected worst RTE. If the threshold is not satisfied, algorithmreturns to the point on selecting a new service. By keeping a candidate history,algorithm tries all services in the worst RTE to migrate. The algorithm eventuallyhalts when all services are tried and no action is taken.
When to migrate a service?
Adapting the system to environmental changes is one of the tasks that SMYRNAmust perform. Thus, deciding on when to migrate a service is a critical process. Thisdecision is done in the planning phase of the MAPE loop after analyzing the collectedinformation of the system. As it is described above in Section 4.5.3, there are someconstraints to be satisfied to migrate a service. First of all, the worst RTE must beselected. And then, an active service is tried to be selected. If there is no suitable
41

CHAPTER 4. DESIGN
loa 8. redeployservices
1: redeployServices()2: while pool 6= ∅ do3: ni, service ← pool.remove()4: ni.deploy(service)5: end while6: pool.clear()
active service, then a replica is tried to be selected. If there is no service satisfyingthese conditions, no action is taken. When a service is selected, then the best RTEis selected suitable for migrating the selected service by excluding service locations.If there is such an RTE, then it is checked if the MigrationThreshold is satisfied.The selected service is migrated only if this condition is satisfied. Otherwise, a newservice is selected as candidate and rest of the algorithm is repeated to select thebest RTE. This is done until a service is migrated or no services are left that meetthe conditions.
How Many Services to Migrate?
The number of services to be migrated at each round is a design parameter. Wedecided to migrate one service at a time. The main reason for this decision is to keepthe decision mechanism as simple as possible. One can monitor resource usage ofindividual services in more details and can make more precise decisions. Monitoredvalues can be considered while choosing services to migrate and how many servicesto migrate.
Currently, we can make a rough estimation about memory usage of a service.We do not have a mechanism to monitor resource usage of each service. Monitoringresources of individual services requires so much effort and resources. For example,if we want to monitor CPU usage of a service, we have to make analysis in threadlevel. Services can be multithreaded and we need a mechanism to track threads ofeach service which requires byte code instrumentation of services. This adds extraoverhead to services and to the system to monitor threads and their CPU times.We have nodes with very low resources and we want to use them efficiently. Thus,we do not deploy a resource monitoring mechanism.
Which Service to Migrate?
When a decision is made to migrate a service from a runtime environment, a servicemust be selected to migrate. This selection function is based on weighted sum oftwo parameters. The service with the maximum value is selected for migration.These parameters are:
• last modification date l: The service that has been operating in the runtimeenvironment for the longest time has more bias to be migrated. The main
42

4.5. SMYRNA
loa 9. Migration Decision
1: result← NoOp2: candidateHistory ← ∅3: done← false4: while !done do5: worst← getWorstRTE()6: if worst = null then7: return done← true8: end if9: service← getMigrationCandidate(worst, active, candidateHistory)
10: if service = null then11: service← getMigrationCandidate(worst, replica, candidateHistory)12: end if13: if service = null then14: return done← true15: end if16: candidateHistory ∪ service17: serviceLocations← getServiceLocations(service)18: best← getBestRTE(serviceLocations)19: if best 6= null then20: if !best.isOverloadedWith(candidate) then21: if worst.utility
best.utility ≤MigrationThreshold then22: result←MigrationOp(service, worst, best)23: done← true24: end if25: end if26: end if27: end while28: return result
reason for this decision is to prevent a service from oscillating among differentruntime environments. Another reason is the assumption that the longer aservice runs, the more likely it is to fail or the more resources it consumes.This can also be thought as leasing runtime environment resources in a fairmanner among services.
• memory usage m: The more memory a service requires, the more likely it isto be migrated in order to increase utility of its current RTE.
The selection function S for service i can then be formulated as
Si = li +mi
2 (4.7)
where l and m are normalized values. l is normalized based on the start time ofcalculation and subtracted from 1 to maximize the value of the oldest service. The
43

CHAPTER 4. DESIGN
equation is as follows:
li = 1− lastmDatecurrentDate
(4.8)
m is normalized based on the total memory usage of the JVM. The equation is asfollows:
mi = mSi
mJVM(4.9)
Having the set of selection functions S = (S1, S2, ...., Sn), the service to be migratedis then selected asMax(S). The goal of this selection function is to choose a servicethat has been operating for the longest time and consumes most memory.
4.5.4 Replication Strategy
Replication is one of the techniques for providing high software availability. How-ever, it has the challenge of keeping states up to date. As it is pointed out previously,state of services are stored in the knowledge store. Any structural changes on theknowledge store are synchronized by DS2OS. Whenever a change on the structure ofthe knowledge store occurs, 3 update messages are broadcasted to all other DS2OSinstances. If any other DS2OS instance does not receive these update messages,another strategy is followed. All DS2OS instances in the system broadcast periodicping messages. Hash of the knowledge store is sent with these ping messages. Uponreceiving ping messages, each instance compares its own hash and the received hashof the knowledge store. If they don’t match, then requests for pulling the structureupdates are sent. Nodes which do not receive the update messages update theirknowledge stores via this mechanism of comparing hashes. However, DS2OS syn-chronizes only the structure but not the knowledge itself. For this purpose, we havedesigned a state update mechanism that periodically sends the states of primaryservices to their backup replicas. The consistency of service states is achieved bythese updates.
How Many Replicas to Maintain?
The decision about how many replicas of a service to maintain is based on theparameters provided by users at service installation time. These parameters aredescribed in the introduction of this chapter. These parameters indicate how criticala service is. For example, if we have a service that is responsible for building securityand a service that is responsible for weather forecast, they will not have the samelevel of priority for replication. The number of replicas required to maintain isdecided based on this priority value. Assume that the number of replicas to bemaintained for a weather forecast service is τ = 1. When this service is installed forthe first time, immediately 1 replica is created and placed on an appropriate location.If the runtime environment that holds the replica of this service is detected ascrashed, the required number of replicas are not satisfied any more. A new replica iscreated and placed on an appropriate runtime environment with sufficient resources.
44

4.5. SMYRNA
Thus, the system ensures a constant τ number of replicas to be maintained for eachservice.
Which Service to Replicate?
Replication operation can take place only in two conditions. First one is whena service is installed for the first time to the system. The second one is when aruntime environment fails. In the first condition, required number of replicas ofnewly installed service are created and placed according to the placement strategydescribed above. In the second condition, all of active services and replicas operatingin the failing node have to be compensated. Replication upon node failure is requiredto meet the constraints described in the previous subsection. When a node fails,replication of services has an optimization issue that has to be satisfied. This issueis that, replicas of crashed primary services are activated and they are replicatedfirst. Then, the crashed replicas are replicated again either from other replicas orfrom the active one. Another optimization while replication is that, if a serviceto be replicated has a replica, this replica is replicated rather than the active one.Thus, the primary service is not interrupted. This optimization helps us to minimizeservice downtime.
Where to Place a Replica?
We have some constraints about how to decide where to place replicas of a service.First constraint is that no two replicas of a service are never placed in the samephysical location. Second constraint is that an active service and its replica arenever placed in the same physical location. A replica is placed as described insubsection 4.5.2 by taking into account these constraints.
4.5.5 Failure of SMYRNA
Smyrna is designed in the same way with all other services in the system. It alsomanages itself by migrating and creating backup replicas. A problem raises atthis point. What happens when Smyrna fails due to failure of the node that itis deployed? At this point, replicas of Smyrna take action. Smyrna sends pingmessages to its replicas as all RTEs send ping messages to Smyrna. When a replicadetects the failure of the primary instance, it tries to query primary instance directlyby using the overlay. It starts a new primary election among backup replicas if theprimary is detected as failed. Decision about the new primary is based on replicaIDs. Replica with the lowest ID becomes new primary instance and takes control.Failure detection is done with the modified eventually perfect failure detector.
45

CHAPTER 4. DESIGN
4.6 Runtime Environment (RTE)Taking into account the problems mentioned in Analysis chapter 2 and the currentstate of the art solutions, we decided to use the OSGi framework as the base of ourruntime environment. Due to its modular structure and small footprint in terms ofnecessary resources, OSGi meets our needs in terms of dynamism and heterogeneity.One could ask why we didn’t choose web services in an environment full of services.When we compare web services and OSGi framework, we can say that they bothprovide the same functionalities. Dynamic service discovery and event handlingmechanism (publish-subscribe) can be listed among these functionalities. The mainargument of choosing OSGi rather than web services is the small footprint require-ments of OSGi framework. We have a heterogeneous environment where embeddedcomputers with scarce resource can also operate. It would not be wise to run a webserver on an embedded computer or on a mobile device.
As it was mentioned in subsection 2.1.1, the workspace of this thesis is the ser-vices layer of the autonomous control and management platform for home automa-tion. OSGi allows mechanisms for providing, discovering and consuming services. Italso provides a publish-subscribe mechanism where a service subscribes for anotherservice and the framework notifies the subscribers of changes occurring on theirinterested services. When a service is registered to the framework, it notifies thesubscribers that a service of interest has been added to the system. It also notifieswhen a service is removed or a change occurs on the subscribed services.
Our services are deployed as bundles in the OSGi framework. A special bundlecalled RTE, is deployed in every physical computing node. RTE is responsible forperforming runtime environment specific functionalities. These functionalities canbe classified into two main groups, informational and operational.
• Informational functionalities are as follows:
– Utility function: as mentioned in Section 3.2, every runtime environ-ment is represented by a utility function. Utility function calculates autility value every ∆ time interval and keeps a history of size η. Thisutility history is used for decision making. The values of ∆ and η area trade-off between quick reaction to changes in the environment andefficient resource consumption.
– Service tracking: we need to know which services are running on whichphysical node. This functionality is a publish-subscribe service that no-tifies the subscribers of changes occurring on the services of interest.
– Service monitoring: we need to collect some statistical informationabout services. Total time of operation, crash reports and resource con-sumption can be examples for information collected.
• Operational functionalities are as follows:
– Service transfer: since we are talking about migration and replication,we need a mechanism to transfer services among different runtime en-
46

4.6. RUNTIME ENVIRONMENT (RTE)
vironments. Every runtime environment has mechanisms to send andreceive service. A service receiver service is waiting for incoming con-nections from other runtime environments. Service transfer is triggeredby a notification received by the knowledge store when a migration orreplication field is assigned a value by SMYRNA. When the notifica-tion is received, the runtime environment sets the required fields on theknowledge store of the destination RTE. These fields are the file nameand state address. The destination RTE receiving the notification that aservice is being transferred reads the file name and the state address ofthe service. Then, it requests the serialized state of the service from theknowledge store. When the file transfer is completed, the receiving RTEinstall this service and keeps the state in a buffer until this new servicestarts its operation and registers to the knowledge store. After installingthe new service, a notification for the completion of transfer is sent tothe sender. The sender uninstalls the service after receiving the transfercompletion notification. OSGi framework provides a publish-subscribemechanism which notifies when a service of interest is installed, updatedor removed in the system. Upon receiving the installation notificationfor the new service, it gets the state address of the service through theAPI explained earlier in Section 4.3. Then, it deserializes the state ofthis service in the buffer and stores it to its new address in the knowledgestore.
– State synchronization: different number of replicas are maintainedfor services. State consistency of replicas is provided by periodic stateupdate messages triggered by Smyrna. Smyrna notifies RTEs to send thestate of a service to other RTEs where replicas are located. Thus, RTEsare responsible for sending and receiving service state updates.
– Updating: users can update their current services with newer versions.Every runtime environment is responsible for the services deployed onits physical machine. Hence, updating services is in the responsibility ofruntime environments.
– Heartbeats: every runtime environment needs to send heartbeat mes-sages for failure detection. These messages are sent periodically every ∆time interval. The failure detection mechanism makes decisions based onthe received heartbeat messages.
OSGi, as our runtime environment, handles many challenges and answers par-tially many questions listed in Section 2.3. It does not have high resource require-ments which was a challenge caused by heterogeneity. It is service oriented and pro-vides a plug-and-play mechanism where services can be added and removed to/fromthe system dynamically. Thus, deals with the dynamism of the environment.
47

Chapter 5
Implementation
This chapter introduces details about the prototype implementation of SMYRNAand RTE in 5.1 and 5.2 respectively. Then, our design argumentation on two maindesign choices are addressed. The first argumentation is about the adaptation ofDS2OS to OSGi which is given in 5.3. The second argumentation is about themigration strategy on the decisions on the number of services to be migrated andthe strategy on the service selection to be migrated and is given in 5.4. Finally, thereason for using simulations in our experiments instead of using the prototype isgiven in 5.5.
5.1 SMYRNA
A prototype of the designed solution of SMYRNA is implemented in Java as anOSGi bundle. At the time of writing this document (28 September 2012), it includes3097 lines of code with some functionalities missing due to the reasons explained insection 5.5. List of classes of the prototype can be found in Appendix B.1.
SMYRNA treats itself also as any other service in the system which needs toimplement the service API given in Appendix C. As soon as it starts operating,it subscribes for some special addresses in knowledge store for receiving requestsfrom RTEs and its replicas. These addresses include notifications for RTE joinrequest, RTE ping messages, alive-check requests by its replicas and removed serviceaddresses. Then, it explores all RTEs in the system by querying DS2OS knowledgestore. For each explored RTE, it subscribes for some addresses to communicatewith the RTE. These addresses include list of services, generated crash reports andcalculated utility values. It also informs the RTE for the address where to sendping messages and information about removed services. Explored RTEs are addedto known nodes which are later monitored for failures.
When SMYRNA wants to manage a service, it simply sends a message to theRTE that hosts that service and responsible RTE performs desired operation onthat service. This is possible again with publish-subscribe mechanism of DS2OS.RTEs subscribe for certain addresses of services which are managed by SMYRNA.
49

CHAPTER 5. IMPLEMENTATION
For example, if a service s is desired to be migrated, SMYRNA sets destinationaddress to its corresponding address and responsible RTE is notified about this. Anexample address can be as
/knowledge/client_3/rte/services/de.edu.tum.service.impl_1.0.0/migrate. Valuethat is set by SMYRNA is a destination RTE which can be as /knowledge/client_7/rte.When the RTE with ID client_3 receives a notification about the change on theaddress, it gets the destination stored and performs necessary operations to migratedesired service to specified destination.
When the failure detector informs SMYRNA about a suspicion of possible failureof an RTE, it tries to directly query suspected RTE using the DS2OS overlay. Thisdirect query works as a tunnel established by DS2OS between requester and listenerends. Listeners subscribe to special addresses indicating it as a tunnel address.When a get request is made to that address, DS2OS redirects the request to thelistener and invokes the waiting method of which result is returned immediately tothe requester synchronously. If the result returned by suspected RTE is positiveindicating that it is alive, SMYRNA revises its decision and increments the intervalfor checking ping messages by ∆. If suspected RTE is dead, then a recovery protocolis started which first activates the backup replicas of active services deployed on thecrashed RTE and then creates backup replicas of all dead services to maintainrequired number of replicas for each service.
A general flow of events is given shown in Figure A in Appendix A.
5.2 RTE
As it is shown in Figure 4.4, we have another entity that is part of our design.RTEs are responsible for the functionalities listed in Section 4.6. Thus, a prototypeis implemented in Java as an OSGi bundle which performs desired functionalities.List of classes of the prototype can be found in Appendix B.2. RTE implementationcurrently includes 4380 lines of code.
As soon as RTE starts operating, it establishes connection to the DS2OS knowl-edge store and starts tracking for services in its local OSGi environment. Then itinitiates service failure detector which periodically checks service states if they arealive or not. If a service is not alive, it is tried to be restarted. For each service fail-ure, a crash report is generated. If a service keeps crashing, it is not restarted morethan 3 times and a detailed crash report is generated indicating that the service isnot operating any more. After starting service failure detector, RTE subscribes forsome special addresses to receive notifications whenever a change occurs on stateof these addresses. These addresses include where to send ping messages, where tosend removed service notifications and utility calculation address which triggers theevent of calculating a new utility. Values of these addresses are set by SMYRNA. Fi-nally, RTE tries to explore a primary SMYRNA instance in the system and informsabout joining the system if it finds any.
When a service registers itself to OSGi registry, RTE receives a notification about
50
5.3. ADAPTING DS2OS TO OSGI
this event via its service tracker and subscribes for special addresses for controllingthat service. These special addresses include fields such as migration, replication,suspending, resuming and stopping of a service. Values of these services are set bySMYRNA and necessary actions are taken when notifications are received for statechanges.
When a migration or replication notification is received for a service, RTE sus-pends desired service and retrieves its state from knowledge store. Then, state istransferred to destination RTE and service itself is transferred later. RTE that re-ceives state of a service, puts it into a temporary buffer where it keeps for a periodof time to be restored when the corresponding service is registered. If the serviceof which the state is stored registers to OSGi resgistry, its state is restored in theknowledge store. Thus, service can resume its operation from its previous state.
A general flow of events is given shown in Figure A in Appendix A.
5.3 Adapting DS2OS to OSGi
DS2OS project is originally implemented in pure Java and is deployed as a Javaapplication. It provides both synchronous and asynchronous communication withthe usage of TCP and UDP protocols respectively. It generally has two components,agent and client sides. The agent side is responsible for maintaining the middlewarewhile the client side provides the communication of services with the agent side. Wehad two options, to have a single client and share it among all services or to have aclient per service. If we use a single shared client, then the addressing mechanismwould be complicated. So, we decided to have a client per service. However, thiswould lead to having a number of TCP and UDP connections equal to the numberof services deployed on each node. Also the communication of services with thelocal agent would be performed over these protocols. This is costful in terms ofresources such as ports and time. Thus, we decided to adapt the current DS2OSas an OSGi bundle and implemented an OSGi protocol additional to datagram andstream protocols.
The adapted version of DS2OS is a bundle deployed in the OSGi frameworkand it is registered to the OSGi registry as an agent. All other services that wantto communicate with the agent, instantiate a client instance and register to theOSGi registry as clients. Thanks to the publish-subscribe mechanism provided byOSGi framework, the agent side tracks the clients registered to the framework.When a new client is registered, the agent side client tracker is notified aboutthis. Upon receiving the notification, the agent adds the client to its repositoryof the known clients. The identification of clients is done with the combination ofbundle name and bundle version which provides a unique naming mechanism inan OSGi framework. Instead of using ports for communication, the messages aresent and received via method calls. Thus, this mechanism eliminates the resourceconsumption of ports equal to the number of services and increases the speed ofcommunication with the local agent side. The communication with the other agents
51

CHAPTER 5. IMPLEMENTATION
is done through the local agent with a single TCP and UDP port.
5.4 Service Migration StrategyThe current migration strategy migrates one service at a time and the service tobe migrated is selected based on two parameters. The reason of this strategy isthat we are not able to determine actual resource consumptions per service basis.Currently, only a rough estimation about the memory allocated by a service is doneat service installation time. Monitoring the actual resource consumption requireseither source code or byte-code instrumentation or the modification of the JVM inJava based applications [HK03]. However, source code instrumentation requires thesource code to be available which is not the case all the time and service developersmay not be willing to expose their source code. Byte-code instrumentation on theother hand, is possible either at class loading time or after source code compilationbut this method introduces overhead to the applications which is not desired byour design because of the heterogeneity of node resources where nodes with lowresources may exist. Modifiying the JVM however, does not introduce any overheadbut it contradicts with the main purpose of the Java programming language whichis "write once, run anywhere". The portability of applications gets restricted onlyto the modified JVM. Thus, none of these methods has been adapted to our designto monitor actual resource consumptions.
We decided to migrate only a single service at a time because the affect ofthe migration operation cannot be predicted beforehand. Hence, our migrationoperation aims at relaxing nodes with low resources in long terms to prevent possibleoverloaded nodes.
The last modification date of a service is used to decide on the service to migrate.Last modification date is the time at which a service has been installed or updated onan RTE. The main reason for this parameter to be used is to prevent the possibilitythat a service is migrated all the time. This situation can occur when a serviceconsumes a lot of resources which causes the node that it is deployed to run out ofresources. In this case, that node will be selected as the worst RTE where a servicewill be migrated. If the decision to select the service to be migrated is based onlyon the resource consumption, then this service would be the one to be migratedagain. However, taking into account the last modification date prevents this fromhappening and lets this heavy service to operate on the node it is deployed for somemore time. Another for choosing the last modification time for migrating a serviceis to prevent possible memory leaks Java which are caused by developers [DS99].The longer a service runs, the more memory it may consume.
5.5 Prototype vs SimulationIt is mentioned earlier that SMYRNA depends on functionality of DS2OS. However,DS2OS has some functionalities missing at the time of writing this document (28
52

5.5. PROTOTYPE VS SIMULATION
September 2012) which are essential for the functionality of SMYRNA. Thus, ex-periments on testing SMYRNA were conducted by simulations instead of using theprototype. Currently, the prototype implementation does not have load balancingfully functional. List of classes of the simulation can be found in Appendix B.3.The simulation has in total 3406 lines of code.
53


Chapter 6
Evaluation
We present the results of simulations performed to test our design under differentcircumstances. The placement protocol succeeds on dealing with the heterogeneityof the nodes. Load balancing algorithm performs well in the presence of bothoverloaded and underloaded nodes. The system is able to adapt to the dynamicnature of the problem space by detecting failures of nodes and balancing loadsafter resource demands on nodes change. Autonomic behaviour of the system isable to deal with changes and adapt to the environment except some cases whereservices maintain no replicas or all replicas crash together with the primary service.Resource utilization of nodes is not satisfying where more than one constraint aretried to be satisfied which raises the necessity of an improvement of utility functions.
This chapter introduces the simulations performed to test our design and theresults obtained for different scenarios. Experimental setup is explained in 6.1including the service placement strategy and performance metrics in 6.1.1 and 6.1.2respectively. Then, it continues with the first scenario where node failures aresimulated in 6.2. After that, second simulation scenario and its results are presentedin 6.3 where nodes failures and recoveries are simulated. This chapter concludeswith the last scenario in 6.4 where nodes run out of resources over time.
6.1 Experimental Setup
We used PeerSim for simulation purposes of our design. It is a scalable and dynamicpeer-to-peer simulation framework [MJ09].
Our system makes a contract with the services deployed. This contract is ofa kind that promises certain amount of resources to the services so that they canoperate by a desired level of quality of service. Thus, our optimum case during anytime interval is the case where all services are satisfied with the resources allocatedto them. We have three different simulation scenarios to test our design to seehow it performs under different circumstances. The first scenario is where nodes inthe system keep failing with a certain probability. Second scenario is where nodesrecover after failures. The last scenario is where the nodes in the system start to
55

CHAPTER 6. EVALUATION
run out of resources over time.For all these scenarios, we have two different setups where node resources are
generated uniformly and exponentially on an interval. Resources of nodes are CPU,memory and bandwidth capacities that are stated earlier in our system design 4. Inthe first setup, resources are generated uniformly on the interval 1− 100. However,it does not mean that a node with high CPU resource also has high resources formemory and bandwidth. In the second setup, resources are generated exponentiallywith λ = 1. The reason for this setup is to simulate where we have most of thenodes with small capacities and very few of them with large capacities. Figure6.1(a) shows the histogram of uniformly generated resource capacity distributionof nodes. Figure 6.1(b) shows the histogram of exponentially generated resourcecapacity distribution of nodes.
In both cases, we have 100 nodes and 1000 primary services initially. Primaryservices have a number of replicas created. The maximum number of service replicas,R, is a parameter which is tested for different values. Replica services do not requireany resources when deployed on a node because we assume that they do not consumeany resources when suspended.
Service resource demands are generated uniformly on the interval 0−average node capacity.This way of generating service demands guarantees that there will be some serviceswith demands greater than node capacities. In such cases, service placement willcause troubles which we want to test.
An important thing about the experiments is that services that cannot be re-covered after a node fails are not considered in the rest of the simulation. Failednodes are recovered in some scenarios but the services are not recovered.
• Number of nodes: total number of nodes used in the system.
• CPU capacity interval: range of values that a node can have as CPU capacity.
• Memory capacity interval: range of values that a node can have as memorycapacity.
• Bandwidth capacity interval: range of values that a node can have as band-width capacity.
• CPU load factor : ratio of total CPU demand to total CPU capacity.
• Memory load factor : ratio of total memory demand to total memory capacity.
• Bandwidth load factor : ratio of total bandwidth demand to total bandwidthcapacity.
• Node failure probability: probability that a node can fail at each cycle.
• Number of primary services: total number of unique services in the system.
56

6.1. EXPERIMENTAL SETUP
0
5
10
15
20
[0-10) [10-20) [20-30) [30-40) [40-50) [50-60) [60-70) [70-80) [80-90) [90-100)
Num
ber
of N
odes
Intervals
Resource capacity distribution on nodes
CPUMemory
Bandwidth
(a) Uniformly distributed
0
5
10
15
20
25
30
35
40
45
50
[0-10) [10-20) [20-30) [30-40) [40-50) [50-60) [60-70) [70-80) [80-90) [90-100)
Num
ber
of N
odes
Intervals
Resource capacity distribution on nodes
CPUMemory
Bandwidth
(b) Exponentially distributed
Figure 6.1. Node resource capacity distributions. Figure 6.1(a) depicts the casewhere node capacities are generated uniformly. Figure 6.1(b) shows the case wherenode capacities are generated exponentially.
• Maximum number of replicas (R): maximum number of backup replicas thata primary service can have. I does not mean that every service this number ofbackup replicas. This is the maximum number of replicas a service can have.The number of replicas are generated uniformly on the interval [0−R].
57

CHAPTER 6. EVALUATION
Number of nodes 100CPU capacity interval 1− 100Memory capacity interval 1− 100Bandwidth capacity interval 1− 100CPU load factor CLF = %50Memory load factor MLF = %50Bandwidth load factor BLF = %50Node failure probability %pNumber of primary services 1000Maximum number of replicas R = 0, 1, 2, 3, 5, 10Migration threshold M = 0.9Node utility history length η = 10Minimum non-null values 2Number of migrations 1
Table 6.1. Experiment Parameters
• Migration threshold: ratio of the selected worst RTE’s utility to the selectedbest RTE’s utility. Used in case of migration when the system is totallyoverloaded or underloaded. For example, worst RTE’s utility is 75 and bestRTE’s utility is 100. 75
100 will lead to a value of 0.75 which is less than ourmigration threshold. Thus, it satisfies the constraint that the selected bestRTE is at least %10 better than the selected worst RTE. So, migration willtake place.
• Node utility history length: number of utility values to be stored.
• Minimum non-null values: minimum number of required utility values in ordermake calculate utility of a RTE’s.
• Number of migrations: number of services to be migrated in each cycle whenthe system is totally overloaded or underloaded.
6.1.1 Service Placement• Each service s ⊂ S demands CPU resource ωc(t), memory resource ωm(t) and
bandwidth resource ωb(t) to operate and these demands vary over time t.
• The placement of services is defined in terms of the placement on each noden ⊂ N , denoted as Sn(t). Sn(t) represents the set of services placed to runon node n at time t. For a placement to be valid, each service s ⊂ S must beplaced on exactly one node.
• CPU capacity of each node is divided among the services Sn(t) proportionallyto their demands. This means that allocated CPU capacity ψc(t) for a service
58

6.1. EXPERIMENTAL SETUP
s on node n at time t is ψc(t) = ωc(t)∑x⊂Sn
ωx(t)∗Ωc where Ωc is the CPU capacity
of node n.
• Memory capacity of each node is divided among the services Sn(t) propor-tionally to their demands. This means that allocated memory capacity ψm(t)for a service s on node n at time t is ψm(t) = ωm(t)∑
x⊂Sn
ωx(t)∗ Ωm where Ωm is
the memory capacity of node n.
• Bandwidth capacity of each node is divided among the services Sn(t) pro-portionally to their demands. This means that allocated bandwidth capacityψb(t) for a service s on node n at time t is ψb(t) = ωb(t)∑
x⊂Sn
ωx(t)∗ Ωb where Ωb
is the bandwidth capacity of node n.
6.1.2 Performance MetricsWe measure the satisfied services, alive services and coefficient of variation of CPU,memory and bandwidth loads. Coefficient of variation shows how good the loadsare balanced. The less value, the better balancing. Detailed explanation about themetrics is given as:
• Satisfied Demand: out of all primary services, the fraction of services withsatisfied demands. A service s is satisfied if and only if ψc ≥ ωc, ψm ≥ ωmand ψb ≥ ωb. This means that in order to satisfy a service s, all of its resourcedemands must be met. If one of these demands is not met, the service is saidto be unsatisfied.
• Alive Services: out of all primary services, the number of alive services, maynot be satisfied, which are operating in the system together with their requirednumber of replicas.
• Coefficient of variation of total resource loads: CPU, memory and bandwidth
loads for a node n are defined as τc,m,b =
∑s⊂S
ωc,m,b
Ωc,m,bwhich represents the frac-
tion of the total resource demand to its capacity. The coefficient of variationis then defined as the ratio of the standard deviation to the average of thetotal CPU, memory and bandwidth loads over all nodes. The coefficient ofvariation for a single variable aims at describing the dispersion of the vari-able in a way that is independent of the variable’s measurement unit. Thecoefficient of variation for a model aims at describing the model fit in termsof the relative sizes of the squared residuals and outcome values. The lowerthe coefficient of variation, the smaller the residuals relative to the predictedvalue. This is suggestive of a good model fit [cov].
59

CHAPTER 6. EVALUATION
6.2 Nodes Fail
In this scenario, we simulates the case where the nodes in the system keep failingwith a constant probability, namely %2. Failed nodes are not recovered in thisscenario. Resource demands of services are not changed. The main goal of thisscenario is to test the influence of maximum number of replicas maintained perservice in case of node failures where recoveries are not possible.
Figure 6.2 shows the fraction of satisfied service, overloaded and alive nodes inthe system. In this scenario, maximum number of replicas per service is R = 2 whichis also equal to logN . CPU, memory and bandwidth load factors are all set to %50of the total system capacities. Node capacities are uniformly distributed over allnodes. As it is seen from the figure, the number of overloaded nodes increases as thefraction of satisfied services decreases together with the number of alive nodes. Aftercycle 60 where %70 of nodes have failed, we see significant jumps on the fractionof the overloaded nodes. The reason for this is that the remaining nodes host allof the alive services together with their replicas. Thus, whenever a node fails, alarge number of active services also crash and their replicas are then activated onthe nodes that host the replicas of these services. And this introduces new resourcedemands on a large number of nodes. This is something expected as a result ofconstantly failing nodes that are not recovered.
0
10
20
30
40
50
60
70
80
90
100
0 10 20 30 40 50 60 70 80 90 100
0
10
20
30
40
50
60
70
80
90
100
Aliv
e N
ode
s,
Sa
tisfie
d S
erv
ice
s
Ove
rloa
ded
No
de
s
cycles
Satisfied Services, Resource Load Factor = %50, Fail Probability = %2, Recovery Probability = %0
Satisfied ServicesOverloaded Nodes
Alive Nodes
Figure 6.2. Satisfied services, overloaded and alive nodes where nodes fail with %2probability. CPU, memory and bandwidth load factors are %50. Maximum numberof replicas per service is R = 2.
Figure 6.3 shows the case of satisfied services for different maximum numberof replicas maintained per service. The figure shows that the number of replicasmaintained per service does not make any significant difference in terms of satis-fied services. However, if we have a look at Figure 6.4 where the number of alive
60

6.2. NODES FAIL
services is shown, we see that the number of replicas makes a significant difference.Maintaining even a single replica per service enhances the resulting number of aliveservices by a factor 4. When we have services with maximum R = 2 = logN repli-cas, we have 6 times more alive services compared to not maintaining any replicas.We see some spikes down towards the end of the simulation. This is the resultof large number of services deployed on a node when we are running out of alivenodes. When a node fails, the primary services deployed on it are all considered tobe dead until they are replaced by their replicas. Thus, there is a significant dropin the number of alive services at the end of the simulation but they are recoveredby activating their backup replicas.
0
10
20
30
40
50
60
70
80
90
100
0 10 20 30 40 50 60 70 80 90 100
0
10
20
30
40
50
60
70
80
90
100
Sa
tisfied
Se
rvic
es
cycles
Satisfied Services With Different Max Replica Numbers
R=0R=1R=2R=3R=5
R=10
Figure 6.3. Satisfied services with different number of maximum replicas wherenodes fail with %2 probability. CPU, memory and bandwidth load factors are %50.
Figure 6.5 shows that our load balancing algorithm works fine. Average CPUload increases because of the failing nodes and CoV of CPU load decreases inverselyproportional to the average CPU load. When there are overloaded nodes in thesystem together with underloaded ones, our load balancing algorithm takes actionand balances the load. The resource demands of services are changed every 10cycles while keeping the overall CPU load factor stable. Thus, we see spikes inthe CoV every 10 cycles where the demands are changed. However, these spikesare immediately healed by the load balancing algorithm. In cycle 45 where %65 ofnodes have failed and the whole system becomes overloaded, CoV reaches its bestpoint where it is almost 0. After that cycle, load balancing is not performed becausethere are no underloaded nodes in the system. Hence, CoV starts to increase again.Similarly, CoV for bandwidth and memory are given in Figure 6.6 and Figure 6.7respectively.
We mentioned earlier that we have 2 different experimental setups where thenode resources are generated uniformly and exponentially. Satisfied services with
61

CHAPTER 6. EVALUATION
0
100
200
300
400
500
600
700
800
900
1000
0 10 20 30 40 50 60 70 80 90 100
0
100
200
300
400
500
600
700
800
900
1000
Aliv
e S
erv
ice
s
cycles
Alive Services With Different Max Replica Numbers
R=0R=1R=2R=3R=5
R=10
Figure 6.4. Alive services with different number of maximum replicas where nodesfail with %2 probability. CPU, memory and bandwidth load factors are %50.
0
10
20
30
40
50
60
70
80
90
100
0 10 20 30 40 50 60 70 80 90 100
0
0.5
1
1.5
2
2.5
3
Avera
ge C
PU
Lo
ad
, A
live
Nod
es
Co
V o
f C
PU
Loa
d
cycles
Coefficient of Variation of CPU Load, CPU Load Factor = %50
CoV CPU LoadAverage CPU Load
Alive Nodes
Figure 6.5. Coefficient of variation of CPU load where CPU load factor is %50,nodes fail with %2 and service demands change every 10 cycles.
different maximum number of replicas where node resources are generated exponen-tially is shown in Figure 6.8. In this case, we have plenty of nodes with low resourcesand only a few with high resources as it is seen from the histogram in Figure 6.1(b).We try to achieve satisfying service demands for CPU, memory and bandwidth atthe same time in this scenario. The total demands on resources are %50 of totalsystem capacities and nodes fail with %2 probability. Even from the beginning of
62
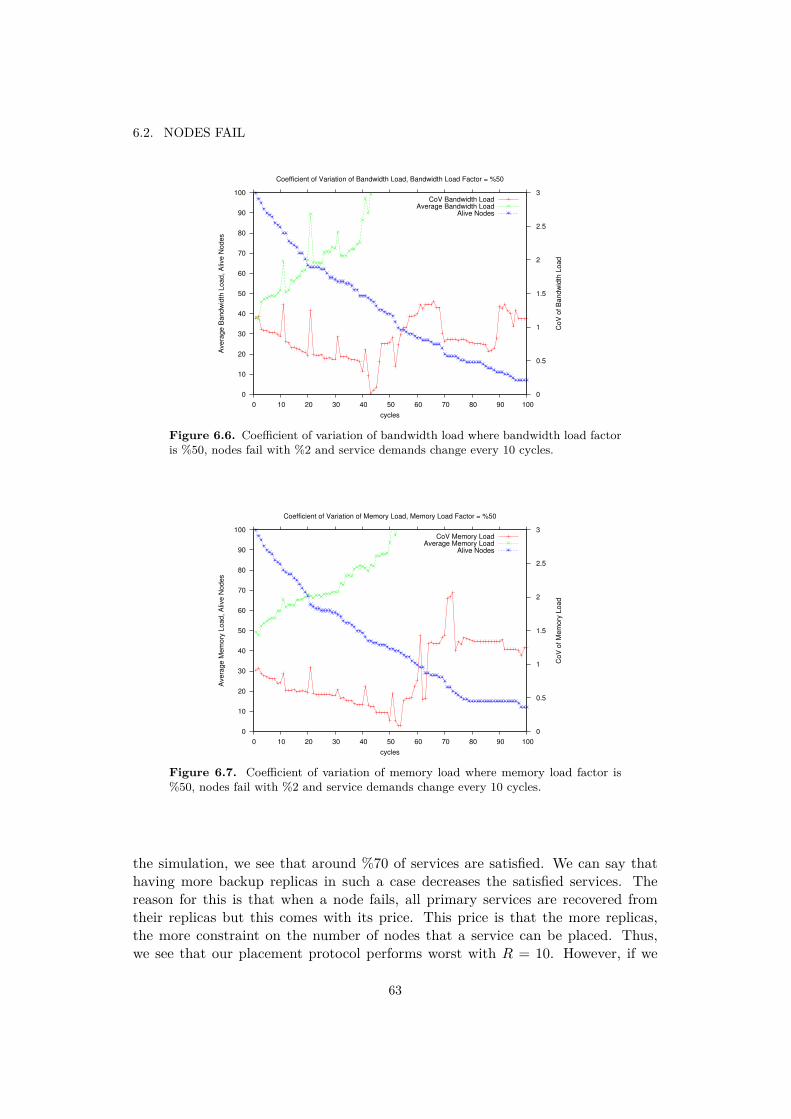
6.2. NODES FAIL
0
10
20
30
40
50
60
70
80
90
100
0 10 20 30 40 50 60 70 80 90 100
0
0.5
1
1.5
2
2.5
3
Ave
rag
e B
and
wid
th L
oa
d,
Aliv
e N
od
es
Co
V o
f B
an
dw
idth
Loa
d
cycles
Coefficient of Variation of Bandwidth Load, Bandwidth Load Factor = %50
CoV Bandwidth LoadAverage Bandwidth Load
Alive Nodes
Figure 6.6. Coefficient of variation of bandwidth load where bandwidth load factoris %50, nodes fail with %2 and service demands change every 10 cycles.
0
10
20
30
40
50
60
70
80
90
100
0 10 20 30 40 50 60 70 80 90 100
0
0.5
1
1.5
2
2.5
3
Ave
rag
e M
em
ory
Loa
d,
Aliv
e N
od
es
Co
V o
f M
em
ory
Lo
ad
cycles
Coefficient of Variation of Memory Load, Memory Load Factor = %50
CoV Memory LoadAverage Memory Load
Alive Nodes
Figure 6.7. Coefficient of variation of memory load where memory load factor is%50, nodes fail with %2 and service demands change every 10 cycles.
the simulation, we see that around %70 of services are satisfied. We can say thathaving more backup replicas in such a case decreases the satisfied services. Thereason for this is that when a node fails, all primary services are recovered fromtheir replicas but this comes with its price. This price is that the more replicas,the more constraint on the number of nodes that a service can be placed. Thus,we see that our placement protocol performs worst with R = 10. However, if we
63

CHAPTER 6. EVALUATION
have a look at Figure 6.9 where the number of alive services is depicted, we can saythat there is no significant difference compared to the case where node resourcesare generated uniformly in Figure 6.4.
0
10
20
30
40
50
60
70
80
90
100
0 10 20 30 40 50 60 70 80 90 100
0
10
20
30
40
50
60
70
80
90
100
Sa
tisfie
d S
erv
ice
s
cycles
Satisfied Services With Different Max Replica Numbers
R=0R=1R=2
R=10
Figure 6.8. Satisfied services with different number of maximum replicas wherenodes fail with %2 probability. CPU, memory and bandwidth load factors are %50.Node resources are generated exponentially.
0
100
200
300
400
500
600
700
800
900
1000
0 10 20 30 40 50 60 70 80 90 100
0
100
200
300
400
500
600
700
800
900
1000
Aliv
e S
erv
ice
s
cycles
Alive Services With Different Max Replica Numbers
R=0R=1R=2
R=10
Figure 6.9. Alive services with different number of maximum replicas where nodesfail with %2 probability. CPU, memory and bandwidth load factors are %50. Noderesources are generated exponentially.
64

6.3. NODES FAIL AND RECOVER
6.3 Nodes Fail and RecoverThe second scenario that we tested our design is the case where nodes fail andthen recover. However, services deployed on the failing nodes that do not have anyreplicas are not recovered. The main goal of this scenario is to test the influence ofmaximum number of replicas maintained per service in case of node failures wherefailed nodes recover.
Figure 6.10 shows the case where service resource demands change every 10cycles. This change is the reason for the spikes downwards on the fraction of satisfiedservices. However, our load balancing algorithm performs well and within 1 or 2cycles the load is balanced and services are satisfied again. The reason for this isthat we have fresh nodes with full capacities available for service deployment andalso the overall system load decreases because of the not recovered services thatdo not maintain any replicas. In Figure 6.11 where the service demands are keptconstant, we do not have any significant spikes downwards.
0
10
20
30
40
50
60
70
80
90
100
0 10 20 30 40 50 60 70 80 90 100
0
10
20
30
40
50
60
70
80
90
100
Satisfie
d S
erv
ice
s
cycles
Satisfied Services With Different Max Replica Numbers
R=0R=1R=2R=3R=5
R=10
Figure 6.10. Failing and recovering nodes with different R where service demandsare changed every 10 cycles.
Average CPU loads for both cases where service demands are kept constant andchanged are given in Figure 6.12 and Figure 6.13 respectively. In Figure 6.12 we seethe situation where the service demands are kept constant which results in a verystable load for the cases where services have backup replicas. This is not the casewhere no replicas are maintained because services are not recovered after a nodecrashed and the total resource demand keeps decreasing.
The results shown in Figure 6.13 however, are not that stable because the servicedemands change every 10 cycles. Thus, we have spikes upwards in the average CPUloads but our load balancing algorithm takes action in these cases and loads arestabilized as much as possible despite the constant node failures.
65

CHAPTER 6. EVALUATION
0
10
20
30
40
50
60
70
80
90
100
0 10 20 30 40 50 60 70 80 90 100
0
10
20
30
40
50
60
70
80
90
100
Sa
tisfie
d S
erv
ice
s
cycles
Satisfied Services With Different Max Replica Numbers
R=0R=1R=2R=3R=5
R=10
Figure 6.11. Failing and recovering nodes with different R where service demandsare kept constant.
0
10
20
30
40
50
60
70
80
90
100
0 10 20 30 40 50 60 70 80 90 100
0
10
20
30
40
50
60
70
80
90
100
Syste
m C
PU
Loa
d
cycles
System CPU Load With Different Max Replica Numbers
R=0R=1R=2R=3R=5
R=10
Figure 6.12. Average system CPU load for different R values where service demandsare kept constant.
For both of the cases, we can say that the amount of satisfied services stabilizesaround the end of the simulation for services which have backup replicas. We havearound %65 of services satisfied when we have R = 2 = logN and this numberbecomes %90 in the case of R = 10. This amount depends highly on the number ofbackup replicas. The more replicas, the more satisfied services.
For our second experimental setup where node resources are generated expo-
66
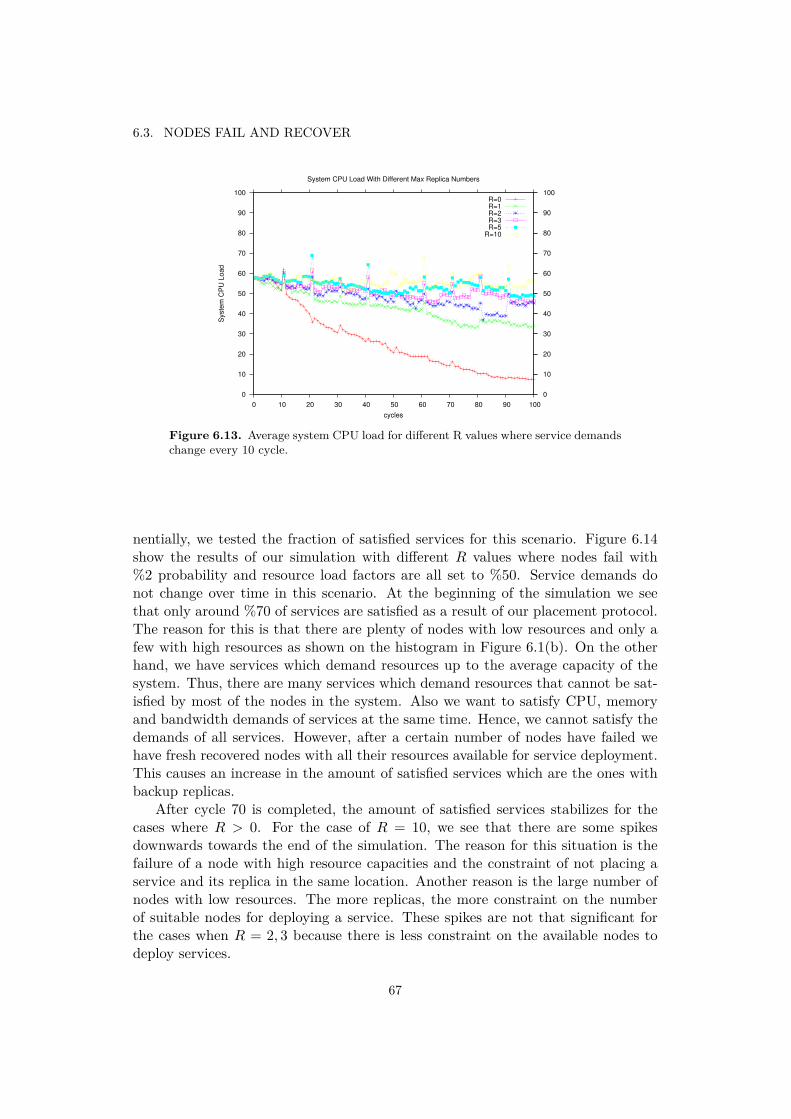
6.3. NODES FAIL AND RECOVER
0
10
20
30
40
50
60
70
80
90
100
0 10 20 30 40 50 60 70 80 90 100
0
10
20
30
40
50
60
70
80
90
100
Syste
m C
PU
Lo
ad
cycles
System CPU Load With Different Max Replica Numbers
R=0R=1R=2R=3R=5
R=10
Figure 6.13. Average system CPU load for different R values where service demandschange every 10 cycle.
nentially, we tested the fraction of satisfied services for this scenario. Figure 6.14show the results of our simulation with different R values where nodes fail with%2 probability and resource load factors are all set to %50. Service demands donot change over time in this scenario. At the beginning of the simulation we seethat only around %70 of services are satisfied as a result of our placement protocol.The reason for this is that there are plenty of nodes with low resources and only afew with high resources as shown on the histogram in Figure 6.1(b). On the otherhand, we have services which demand resources up to the average capacity of thesystem. Thus, there are many services which demand resources that cannot be sat-isfied by most of the nodes in the system. Also we want to satisfy CPU, memoryand bandwidth demands of services at the same time. Hence, we cannot satisfy thedemands of all services. However, after a certain number of nodes have failed wehave fresh recovered nodes with all their resources available for service deployment.This causes an increase in the amount of satisfied services which are the ones withbackup replicas.
After cycle 70 is completed, the amount of satisfied services stabilizes for thecases where R > 0. For the case of R = 10, we see that there are some spikesdownwards towards the end of the simulation. The reason for this situation is thefailure of a node with high resource capacities and the constraint of not placing aservice and its replica in the same location. Another reason is the large number ofnodes with low resources. The more replicas, the more constraint on the numberof suitable nodes for deploying a service. These spikes are not that significant forthe cases when R = 2, 3 because there is less constraint on the available nodes todeploy services.
67

CHAPTER 6. EVALUATION
0
10
20
30
40
50
60
70
80
90
100
0 10 20 30 40 50 60 70 80 90 100
0
10
20
30
40
50
60
70
80
90
100
Sa
tisfie
d S
erv
ice
s
cycles
Satisfied Services With Different Max Replica Numbers
R=0R=1R=2R=5
R=10
Figure 6.14. Satisfied services for different R values with exponentially generatednode resources.
6.4 Decreasing Node Capacities
Our third scenario is the case where nodes run out of resources over time. This canbe thought as clients of our smart environments start to use the available resourcesfor their personal purposes. We maintain a threshold value indicating what percent-age of a resource can be used by services on a node. The first scenario we tested isthe case where we decrease this threshold for all resources on all nodes by %2 every10 cycles. In this scenario, maximum number of replicas maintained is R = 2 andservice demands do not change over time. Node resources are generated uniformlyfor this case and we want to satisfy CPU, memory and bandwidth demands whereload factor for all of them is %50. Figure 6.15 depicts the results of this scenario.We see that decreasing the amount of available resources on the whole system evenwith %2 causes a large number of unsatisfied services and overloaded nodes. In thebeginning of the simulation, all services are satisfied by the placement. However,after a decrement on all the nodes in the system, around %75 of services are unsat-isfied but this is overcome by our load balancing algorithm within 2 to 3 cycles forthe first three cases. It gets more and more difficult to satisfy service demands afterthe fourth decrement and we observe a falling wave model. The reason for this isthe constraint of satisfying demands of CPU, memory and bandwidth at the sametime and we are running out of resources.
We have another scenario where we decrement the capacity thresholds by %2.5every 4 cycles. We test the cases where we want to satisfy only one of the resourcedemands -CPU-, two of the resources -CPU and memory- and all CPU, memory andbandwidth at the same time. In Figure 6.16, we try to satisfy only CPU demandsof services and our placement protocol seems to be quite successful on this. All
68

6.4. DECREASING NODE CAPACITIES
0
10
20
30
40
50
60
70
80
90
100
0 10 20 30 40 50 60 70 80 90 100
0
10
20
30
40
50
60
70
80
90
100S
atisfied
Se
rvic
es,
Ove
rlo
ad
ed N
ode
s
cycles
Satisfied Services, Resource Load Factor = %50, Threshold Decrement = %2
Satisfied ServicesOverloaded Nodes
Figure 6.15. Satisfied services and overloaded nodes where CPU, memory and band-width load factors are %50. Node capacities decrease by %2 every 10 cycles.Maximumnumber of replicas per service is R = 2.
services are satisfied after load balancing is applied upon threshold decrement untilcycle 84. At this cycle, the system capacity is decremented by %52.5 where we have%50 CPU demand. We can say that our placement protocol performs well in thiscase.
0
10
20
30
40
50
60
70
80
90
100
0 10 20 30 40 50 60 70 80 90 100
0
10
20
30
40
50
60
70
80
90
100
Satisfie
d S
erv
ice
s,
Ove
rlo
ad
ed N
ode
s
cycles
Satisfied Services, CPU Load Factor = %50, Thresholds Decrement = %2.5, Change Step = 4
Satisfied ServicesOverloaded Nodes
Figure 6.16. Satisfied services and overloaded nodes in case of decreasing nodecapacities. CPU load factor is %50. Capacities are decremented by %2.5 every 4cycles. Maximum number of replicas per service is R = 2. We want to meet CPUdemands of services.
69

CHAPTER 6. EVALUATION
In Figure 6.17, we have the results when we try to satisfy both CPU and memorydemands of services. In this case, our placement protocol is able to satisfy allservices after decreasing the overall capacity until %70. However, after subsequentdecrements we are not able to satisfy all services at the same time. At this pointwe have around %80 service satisfaction and this number drops dramatically inthe subsequent decrements. Even though the system has %70 of its capacity andthe overall demand is %50, our placement protocol cannot satisfy all services. Thereason for this is that we can have nodes with high CPU resources but with lowmemory resources or vice versa and it is not possible to satisfy both demands at thesame time. Additionally, services also may demand high CPU and low memory orvice versa which causes some resources to be wasted and nodes which are not fullyutilized.
0
10
20
30
40
50
60
70
80
90
100
0 10 20 30 40 50 60 70 80 90 100
0
10
20
30
40
50
60
70
80
90
100
Sa
tisfie
d S
erv
ices,
Ove
rloa
de
d N
od
es
cycles
Satisfied Services, CPU Memory Load Factor = %50, Thresholds Decrement = %2.5, Change Step = 4
Satisfied ServicesOverloaded Nodes
Figure 6.17. Satisfied services and overloaded nodes in case of decreasing nodecapacities. CPU and memory load factors are %50. Capacities are decremented by%2.5 every 4 cycles. Maximum number of replicas per service is R = 2. We want tomeet CPU and memory demands of services.
In Figure 6.18 we have our most extreme case where we want to satisfy all CPU,memory and bandwidth at the same time. In this scenario, after cycle 16 where theoverall system capacity is decremented to %90, we are not able to satisfy all services.We have %80 of services satisfied at this point and this value drops significantly inthe subsequent decrements. Now we have one more constraint to satisfy and thisresults in a dramatic performance drop. The reason is the same explained for theprevious scenario as we can not fully utilize all nodes because of the different nodecapacities and service demands.
We performed the above tests also for our second experimental setup where noderesources are generated exponentially. Now we have many of the nodes with lowresources and only a few nodes with high resources. Figure 6.19 depicts the case
70
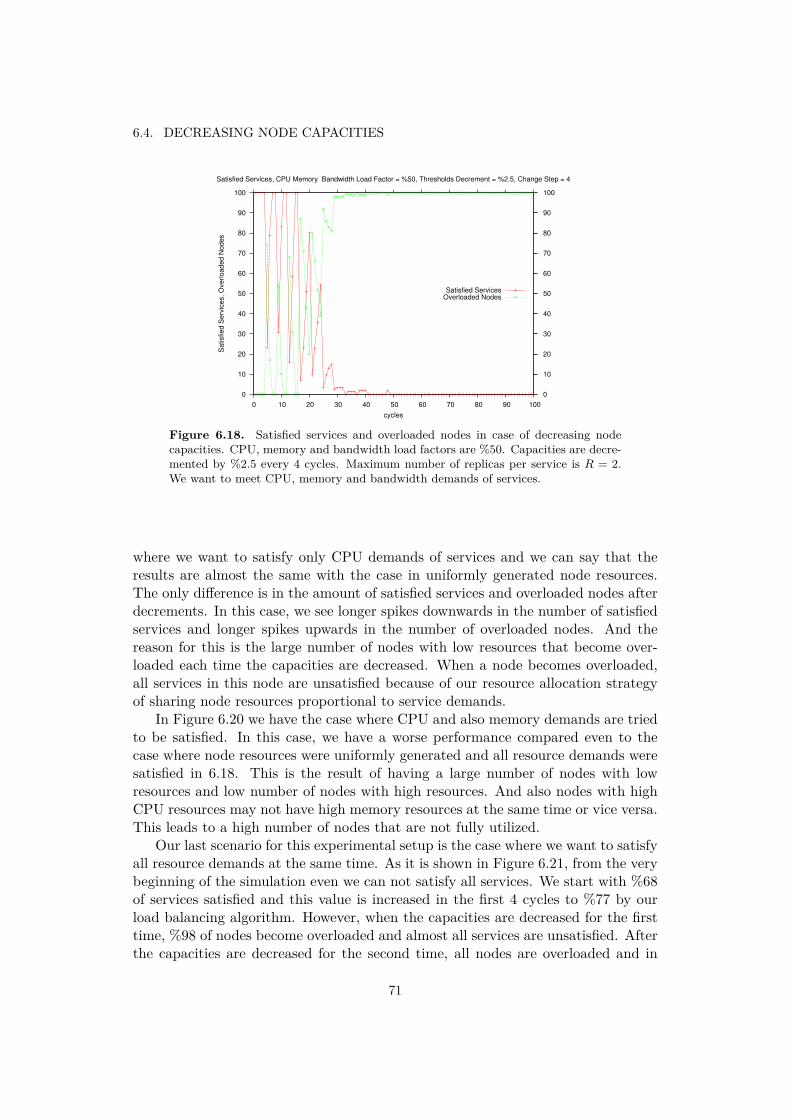
6.4. DECREASING NODE CAPACITIES
0
10
20
30
40
50
60
70
80
90
100
0 10 20 30 40 50 60 70 80 90 100
0
10
20
30
40
50
60
70
80
90
100
Sa
tisfied
Se
rvic
es,
Ove
rlo
ad
ed N
ode
s
cycles
Satisfied Services, CPU Memory Bandwidth Load Factor = %50, Thresholds Decrement = %2.5, Change Step = 4
Satisfied ServicesOverloaded Nodes
Figure 6.18. Satisfied services and overloaded nodes in case of decreasing nodecapacities. CPU, memory and bandwidth load factors are %50. Capacities are decre-mented by %2.5 every 4 cycles. Maximum number of replicas per service is R = 2.We want to meet CPU, memory and bandwidth demands of services.
where we want to satisfy only CPU demands of services and we can say that theresults are almost the same with the case in uniformly generated node resources.The only difference is in the amount of satisfied services and overloaded nodes afterdecrements. In this case, we see longer spikes downwards in the number of satisfiedservices and longer spikes upwards in the number of overloaded nodes. And thereason for this is the large number of nodes with low resources that become over-loaded each time the capacities are decreased. When a node becomes overloaded,all services in this node are unsatisfied because of our resource allocation strategyof sharing node resources proportional to service demands.
In Figure 6.20 we have the case where CPU and also memory demands are triedto be satisfied. In this case, we have a worse performance compared even to thecase where node resources were uniformly generated and all resource demands weresatisfied in 6.18. This is the result of having a large number of nodes with lowresources and low number of nodes with high resources. And also nodes with highCPU resources may not have high memory resources at the same time or vice versa.This leads to a high number of nodes that are not fully utilized.
Our last scenario for this experimental setup is the case where we want to satisfyall resource demands at the same time. As it is shown in Figure 6.21, from the verybeginning of the simulation even we can not satisfy all services. We start with %68of services satisfied and this value is increased in the first 4 cycles to %77 by ourload balancing algorithm. However, when the capacities are decreased for the firsttime, %98 of nodes become overloaded and almost all services are unsatisfied. Afterthe capacities are decreased for the second time, all nodes are overloaded and in
71
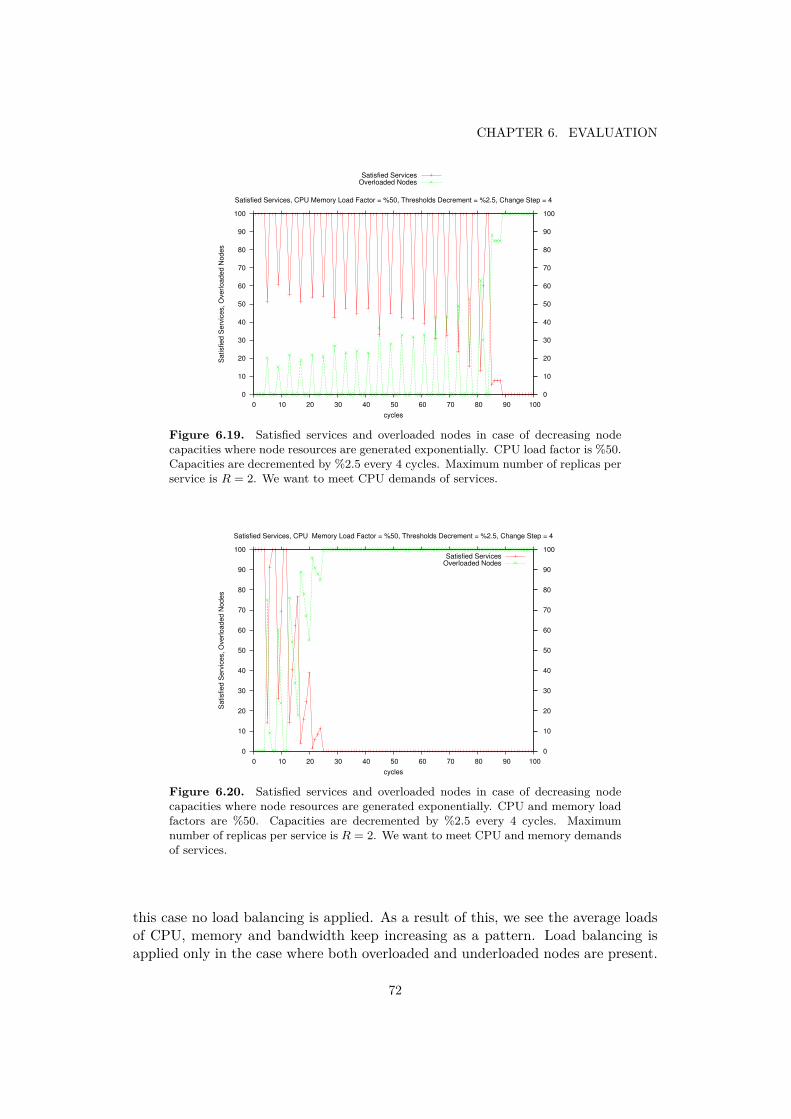
CHAPTER 6. EVALUATION
0
10
20
30
40
50
60
70
80
90
100
0 10 20 30 40 50 60 70 80 90 100
0
10
20
30
40
50
60
70
80
90
100S
atisfied
Se
rvic
es,
Ove
rlo
ad
ed N
ode
s
cycles
Satisfied Services, CPU Memory Load Factor = %50, Thresholds Decrement = %2.5, Change Step = 4
Satisfied ServicesOverloaded Nodes
Figure 6.19. Satisfied services and overloaded nodes in case of decreasing nodecapacities where node resources are generated exponentially. CPU load factor is %50.Capacities are decremented by %2.5 every 4 cycles. Maximum number of replicas perservice is R = 2. We want to meet CPU demands of services.
0
10
20
30
40
50
60
70
80
90
100
0 10 20 30 40 50 60 70 80 90 100
0
10
20
30
40
50
60
70
80
90
100
Sa
tisfie
d S
erv
ices,
Ove
rloa
de
d N
od
es
cycles
Satisfied Services, CPU Memory Load Factor = %50, Thresholds Decrement = %2.5, Change Step = 4
Satisfied ServicesOverloaded Nodes
Figure 6.20. Satisfied services and overloaded nodes in case of decreasing nodecapacities where node resources are generated exponentially. CPU and memory loadfactors are %50. Capacities are decremented by %2.5 every 4 cycles. Maximumnumber of replicas per service is R = 2. We want to meet CPU and memory demandsof services.
this case no load balancing is applied. As a result of this, we see the average loadsof CPU, memory and bandwidth keep increasing as a pattern. Load balancing isapplied only in the case where both overloaded and underloaded nodes are present.
72

6.4. DECREASING NODE CAPACITIES
Thus, we don’t see any improvements in the rest of the simulation.
0
10
20
30
40
50
60
70
80
90
100
0 10 20 30 40 50 60 70 80 90 100
0
10
20
30
40
50
60
70
80
90
100S
atisfie
d S
erv
ice
s,
Overlo
ad
ed
Nod
es
Ave
rag
e C
PU
, M
em
ory
an
d B
an
dw
idth
Lo
ad
s
cycles
Satisfied Services, CPU Bandwidth and Memory Load Factor = %50
Overloaded NodesAverage CPU Load
Average Memory LoadAverage Bandwidth Load
Satisfied Services
Figure 6.21. Satisfied services and overloaded nodes in case of decreasing nodecapacities where node resources are generated exponentially. CPU, memory andbandwidth load factors are %50. Capacities are decremented by %2.5 every 4 cycles.Maximum number of replicas per service is R = 2. We want to meet CPU, memoryand bandwidth demands of services. Also average CPU, memory and bandwidthloads are shown.
73


Chapter 7
Conclusions and Future Work
7.1 Conclusions
In this thesis, we presented a reliable infrastructure for services in smart environ-ments, SMYRNA. SMYRNA is an autonomous service placement protocol that isable to adapt to dynamic changes of heterogeneous environments. The presenteddesign was developed by adapting solutions from different domains with similarproblems. Research has been conducted on finding solutions in the domains ofGrid Computing, Peer-to-Peer networks, Intelligent Agents, Ambient IntelligenceSystems and Distributed Systems.
A prototype of the proposed system design was implemented and tested withdifferent simulation scenarios. The results showed that the placement protocolsucceeded on dealing with the heterogeneity of the nodes by using the introducedutility functions. However, utility functions need to be improved to perform betterwhen more than one constraint is desired to be satisfied. It has been shown thatthe system load was balanced successfully in the presence of both overloaded andunderloaded nodes. The loads were distributed proportional to node capacitieswhich was among our goals to deal with heterogeneity of resources and use all systemresources efficiently. However, node resource utilization was not satisfying whenmultiple resource demands were tried to be satisfied. Each additional constraintto be satisfied caused a significant drop on the overall system utilization. Whenthe system was fully overloaded or underloaded, our novel migration strategy tookaction and migrated one service at a time from the worst node to the best node inorder to prevent possible node overloading. It has been shown with extensive resultsthat the system was able to adapt to the environmental changes by detecting nodefailures and balancing the load when the load on a node changed over time. Thiswas also among our goals to deal with the dynamic nature of the environment.Our design has been tested that it was fully autonomous except some cases. Thesecases were the situations when a node failed and services on that node could notbe recovered because there were no backup replicas maintained for these services.Another case was when multiple nodes failed at the same time and both primary
75

CHAPTER 7. CONCLUSIONS AND FUTURE WORK
instances and replicas of services were deployed on these failing nodes. In this casealso there were no backup replicas left in the system of these services and they werenot recovered. Hence, we can say that external intervention is required to installthe services to the system again only at such cases.
An autonomous service placement protocol that adapts to environmental changesand a reliable infrastructure for services in heterogeneous smart environments havebeen proposed and tested to be performing well under different circumstances.
7.2 Future Work• State Synchronization: the consistency of replica states is currently per-
formed by sending periodic state updates to service replicas. This scheme cancreate an overhead in the network traffic and needs improvement. A way ofimprovement can be achieved by sending these updates in an accumulatedway where only the changed fields’ states are sent. This can be done by cal-culating a hash for the states and periodically checking for the changes as itis currently done by DS2OS.
• Load Balancing: the current load balancing scheme is applied only in thepresence of both overloaded and underloaded nodes. However, this can befurther improved to be applied also in the cases where all nodes are overloadedor underloaded.
• Service Resource Monitoring: the current design is not able to moni-tor the exact resource consumption of individual services. Currently, we canonly make a rough estimation about the memory used by a service when itis installed for the first time. However, we are not able to track its exactfootprint of used memory, CPU and bandwidth. An improvement in this fieldcan be applied by adding a mechanism for monitoring the exact resource con-sumption of a service. Based on these consumptions, more healthy decisionsabout migration of a service can be performed such as taking into accountthe bandwidth consumption while migration is possible on devices with lim-ited connectivity. Another criteria for resource consumption can be the powerconsumption of each service so that this criteria can be taken into accountwhile migration to devices with limited battery life.
• Resource Allocation: our current resource allocation mechanism allocatesresources to services proportional to their demands. Currently, all servicesare treated equally. However, this can be further improved by introducingpriorities to services and resource allocation can be performed by taking intoaccount these priorities.
76

Bibliography
[age] Agentscape documentation, accessed 15.09.2012.
[Agl09] Aglets Development Group. The Aglets 2.0.2 User’s Manual, March2009.
[AH04] G. Attiya and Y. Hamam. Reliability oriented task allocation in het-erogeneous distributed computing systems. In Proceedings. ISCC 2004.Ninth International Symposium on Computers and Communications,2004., volume 1, pages 68–73, June 2004.
[AmSS+09] K. Ahmed, M.A. m. Shohag, T. Shahriar, M.K. Hasan, and M.M.Rana. Strong thread migration in heterogeneous environment. InComputer Engineering and Technology, 2009. ICCET ’09. Interna-tional Conference on, volume 1, pages 205–209, jan. 2009.
[BCPR03] F. Bellifemine, G. Caire, A. Poggi, and G. Rimassa. Jade: A whitepaper. EXP in search of innovation, 3(3):6–19, 2003.
[BHD03] Sara Bouchenak, Daniel Hagimont, and Noël De Palma. Efficient javathread serialization. In Proceedings of the 2nd international conferenceon Principles and practice of programming in Java, PPPJ ’03, pages35–39, New York, NY, USA, 2003. Computer Science Press, Inc.
[BHR+02] J. Baumann, F. Hohl, K. Rothermel, M. Strasser, and W. Theilmann.Mole: A mobile agent system. Software: Practice and Experience,32(6):575–603, 2002.
[BLC02] Eric Bruneton, Romain Lenglet, and Thierry Coupaye. Asm: A codemanipulation tool to implement adaptable systems. In In Adaptableand extensible component systems, 2002.
[BOvSW02] F. M. T. Brazier, B. J. Overeinder, M. van Steen, and N. J. E. Wi-jngaards. Agent factory: generative migration of mobile agents inheterogeneous environments. In Proceedings of the 2002 ACM sympo-sium on Applied computing, SAC ’02, pages 101–106, New York, NY,USA, 2002. ACM.
77

BIBLIOGRAPHY
[CFH+05] Christopher Clark, Keir Fraser, Steven Hand, Jacob Gorm Hansen,Eric Jul, Christian Limpach, Ian Pratt, and Andrew Warfield. Livemigration of virtual machines. In Proceedings of the 2nd conferenceon Symposium on Networked Systems Design & Implementation - Vol-ume 2, NSDI’05, pages 273–286, Berkeley, CA, USA, 2005. USENIXAssociation.
[cov] Ucla academic technology services, accessed 15.09.2012.
[Dah99] Markus Dahm. Byte code engineering with the javaclass api, 1999.
[DS99] Wim De Pauw and Gary Sevitsky. Visualizing reference patterns forsolving memory leaks in java. In Rachid Guerraoui, editor, ECOOPâ99 â Object-Oriented Programming, volume 1628 of Lecture Notes inComputer Science, pages 668–668. Springer Berlin / Heidelberg, 1999.10.1007/3-540-48743-3_6.
[FD02] Alan Fedoruk and Ralph Deters. Improving fault-tolerance by repli-cating agents. In Proceedings of the first international joint conferenceon Autonomous agents and multiagent systems: part 2, AAMAS ’02,pages 737–744, New York, NY, USA, 2002. ACM.
[FJK04] Ian Foster, Nicholas R. Jennings, and Carl Kesselman. Brain meetsbrawn: Why grid and agents need each other. In Proceedings of theThird International Joint Conference on Autonomous Agents and Mul-tiagent Systems - Volume 1, AAMAS ’04, pages 8–15, Washington, DC,USA, 2004. IEEE Computer Society.
[Fün98] Stefan Fünfrocken. Transparent migration of java-based mobile agents:Capturing and re-establishing the state of java programs. PersonalTechnologies, 2:109–116, 1998. 10.1007/BF01324941.
[Gre] Todd Greanier. Discover the secrets of the java serialization api.
[GS96] R. Guerraoui and A. Schiper. Fault-tolerance by replication in dis-tributed systems. In Reliable Software Technologies - Ada-Europe’96,pages 38–57. Springer-Verlag, 1996.
[Gue06] Rachid Guerraoui. Introduction to reliable distributed programming.Springer, Berlin Heidelberg New York, 2006.
[Her10] Klaus Herrmann. Self-organized service placement in ambient intel-ligence environments. ACM Trans. Auton. Adapt. Syst., 5:6:1–6:39,May 2010.
[HK03] Jarle G. Hulaas and Dimitri Kalas. Monitoring of resource consump-tion in java-based application servers, 2003.
78

[Huc] Gregory Huczynski. Forced migration in a mobile object system: Re-ducing fault tolerance costs and improving reliability in distributedsystems.
[JB05] Márk Jelasity and Ozalp Babaoglu. T-Man: Gossip-based overlaytopology management. In 3rd Int. Workshop on Engineering Self-Organising Applications (ESOA’05), pages 1–15, 2005.
[KC03] Jeffrey O. Kephart and David M. Chess. The vision of autonomiccomputing. Computer, 36(1):41–50, January 2003.
[KS97] S. Kartik and C. Siva Ram Murthy. Task allocation algorithms formaximizing reliability of distributed computing systems. Computers,IEEE Transactions on, 46(6):719–724, June 1997.
[LAB+] Jacob R. Lorch, Atul Adya, William J. Bolosky, Ronnie Chaiken,John R. Douceur, and Jon Howell. The smart way to migrate replicatedstateful services. eurosys 2006.
[Lam01] Leslie Lamport. Paxos made simple. ACM SIGACT News, 32(4):18–25, December 2001.
[LYBB12] Tim Lindholm, Frank Yellin, Gilad Bracha, and Alex Buckley. Thejava virtual machine specification - java se 7 edition, June 2012.
[Mar08] Damianos Maragkos. Replication and migration of osgi bundles inthe virtual osgi framework. Master’s thesis, Swiss Federal Institute ofTechnology, 8092 Zurich, Switzerland, July 2008.
[MJ09] Alberto Montresor and Márk Jelasity. Peersim: A scalable p2p simu-lator. In Proc. of the 9th Int. Conference on Peer-to-Peer (P2P’09),pages 99–100, Seattle, WA, September 2009.
[NS05] T Nakano and T Suda. Self-organizing network services with evolution-ary adaptation. Neural Networks, IEEE Transactions on, 16(5):1269–1278, September 2005.
[OSG11] OSGi Alliance. OSGi Service Platform Core Specification, April 2011.
[PNS+09] Marc-Oliver Pahl, Christoph Niedermeier, Mario Schuster, AndreasMüller, and Georg Carle. Knowledge-based middleware for future homenetworks. In IEEE IFIP Wireless Days conference Paris, Paris, France,December 2009.
[PUC] Marc-Oliver Pahl, Deniz Ugurlu, and Georg Carle. Distributed smartspace operating system.
79

BIBLIOGRAPHY
[RLS+03] Ananth Rao, Karthik Lakshminarayanan, Sonesh Surana, RichardKarp, and Ion Stoica. Load balancing in structured p2p systems. InM. Kaashoek and Ion Stoica, editors, Peer-to-Peer Systems II, vol-ume 2735 of Lecture Notes in Computer Science, pages 68–79. SpringerBerlin / Heidelberg, 2003.
[SD07] Jan Sacha and Jim Dowling. A gradient topology for master-slave repli-cation in peer-to-peer environments. In Gianluca Moro, Sonia Berga-maschi, Sam Joseph, Jean-Henry Morin, and Aris Ouksel, editors,Databases, Information Systems, and Peer-to-Peer Computing, vol-ume 4125 of Lecture Notes in Computer Science, pages 86–97. SpringerBerlin / Heidelberg, 2007. 10.1007/978-3-540-71661-7_8.
[SDCM06] Jan Sacha, Jim Dowling, Raymond Cunningham, and René Meier. Dis-covery of stable peers in a self-organising peer-to-peer gradient topol-ogy. In Frank Eliassen and Alberto Montresor, editors, DistributedApplications and Interoperable Systems, volume 4025 of Lecture Notesin Computer Science, pages 70–83. Springer Berlin / Heidelberg, 2006.10.1007/11773887_6.
[SMK+01] Ion Stoica, Robert Morris, David Karger, M. Frans Kaashoek, andHari Balakrishnan. Chord: A scalable peer-to-peer lookup service forinternet applications. SIGCOMM Comput. Commun. Rev., 31(4):149–160, August 2001.
[SSY00] Takahiro Sakamoto, Tatsurou Sekiguchi, and Akinori Yonezawa. Byte-code transformation for portable thread migration in java. In DavidKotz and Friedemann Mattern, editors, Agent Systems, Mobile Agents,and Applications, volume 1882 of Lecture Notes in Computer Science,pages 443–481. Springer Berlin / Heidelberg, 2000. 10.1007/978-3-540-45347-5_3.
[Sun01] Sun Microsystems. Java Object Serialization Specification, August2001.
[SVM07] R. Shah, B. Veeravalli, and M. Misra. On the design of adaptiveand decentralized load balancing algorithms with load estimation forcomputational grid environments. Parallel and Distributed Systems,IEEE Transactions on, 18(12):1675–1686, dec. 2007.
[tec] Techterms, accessed 15.09.2012.
[TOT11] A. Takeda, T. Oide, and A. Takahashi. New structured p2p networkwith dynamic load balancing scheme. In IEEE Workshops of Interna-tional Conference on Advanced Information Networking and Applica-tions (WAINA), pages 108–113, March 2011.
80

[Whi] Abe White. Serp - http://serp.sourceforge.net, accessed 15.09.2012.
[WS01] M. Wang and T. Suda. The bio-networking architecture: a biologi-cally inspired approach to the design of scalable, adaptive, and surviv-able/available network applications. In Applications and the Internet,2001. Proceedings. 2001 Symposium on, 2001.
81


Appendix A
General Flow of Events
The general flow of events is shown in Figure A. DS2OS, Smyrna, runtime envi-ronment (RTE) and Eventually Perfect Failure Detector (EPFD) are entities shownon the figure. EPFD actually functions as a part of Smyrna but it is shown as aseparate entity for simplicity. Entities are separated by horizontal lanes where theycan interact with other entities. Details are not shown in the figure. Only mainfunctionalities are depicted.
83

APPENDIX A. GENERAL FLOW OF EVENTS
84

Appendix B
List of Classes
B.1 SMYRNA• de.edu.tum.smyrna.epfd.EPFD.java
• de.edu.tum.smyrna.epfd.EPFDSubscription.java
• de.edu.tum.smyrna.UtilityHistory.java
• de.edu.tum.smyrna.impl.ReplicaRecovery.java
• de.edu.tum.smyrna.impl.DecisionFunction.java
• de.edu.tum.smyrna.impl.Activator.java
• de.edu.tum.smyrna.impl.UtilityCalculationTask.java
• de.edu.tum.smyrna.impl.SmyrnaImpl.java
• de.edu.tum.smyrna.rep.PrimaryElection.java
• de.edu.tum.smyrna.rep.ReplicaPinger.java
• de.edu.tum.smyrna.rep.PrimaryEPFD.java
• de.edu.tum.smyrna.rep.PrimaryElectionVirtualNodeHandler.java
• de.edu.tum.smyrna.rep.ReplicaRepository.java
• de.edu.tum.smyrna.rep.AliveCheckVirtualNodeHandler.java
• de.edu.tum.smyrna.sub.ServiceRemovedCallback.java
• de.edu.tum.smyrna.sub.ServiceRegistrationCallback.java
• de.edu.tum.smyrna.sub.ServiceFailureCallback.java
• de.edu.tum.smyrna.sub.ReplicaPingCallback.java
85

APPENDIX B. LIST OF CLASSES
• de.edu.tum.smyrna.sub.RTEJoinCallback.java
• de.edu.tum.smyrna.sub.ReplicaListCallback.java
• de.edu.tum.smyrna.sub.UtilityCallback.java
• de.edu.tum.smyrna.RTEEntry.java
• de.edu.tum.smyrna.Operation.java
• de.edu.tum.smyrna.OpType.java
B.2 RTE• de.edu.tum.rte.Activator.java
• de.edu.tum.rte.ServiceEntry.java
• de.edu.tum.rte.Parameters.java
• de.edu.tum.rte.impl.RTE.java
• de.edu.tum.rte.impl.ServiceFailureDetector.java
• de.edu.tum.rte.impl.CircularBuffer.java
• de.edu.tum.rte.impl.ServiceManager.java
• de.edu.tum.rte.impl.SmyrnaUtility.java
• de.edu.tum.rte.sub.ResumeCallback.java
• de.edu.tum.rte.sub.SuspendCallback.java
• de.edu.tum.rte.sub.RemoveAddressCallback.java
• de.edu.tum.rte.sub.StopCallback.java
• de.edu.tum.rte.sub.TransferCompleteCallback.java
• de.edu.tum.rte.sub.MigrateCallback.java
• de.edu.tum.rte.sub.IsAlivePipe.java
• de.edu.tum.rte.sub.ReplicateCallback.java
• de.edu.tum.rte.sub.PingSubscription.java
• de.edu.tum.rte.sub.UtilityCallback.java
• de.edu.tum.rte.Utility.java
86
B.3. SIMULATION
• de.edu.tum.rte.util.RTECommandProvider.java
• de.edu.tum.rte.util.RTEIServiceTrackerCustomizer.java
• de.edu.tum.rte.util.ServiceTransport.java
• de.edu.tum.rte.util.ServiceReceivePipe.java
• de.edu.tum.rte.util.StateRestoreTimer.java
• de.edu.tum.rte.util.EPFDPing.java
• de.edu.tum.rte.IRTE.java
B.3 Simulation• de.edu.tum.smyrna.sim.main.Simulator.java
• de.edu.tum.smyrna.sim.DecisionFunction.java
• de.edu.tum.smyrna.sim.base.RTE.java
• de.edu.tum.smyrna.sim.base.ServiceMapping.java
• de.edu.tum.smyrna.sim.base.SortedList.java
• de.edu.tum.smyrna.sim.base.ServiceManager.java
• de.edu.tum.smyrna.sim.base.Service.java
• de.edu.tum.smyrna.sim.base.LCG.java
• de.edu.tum.smyrna.sim.base.RTEManager.java
• de.edu.tum.smyrna.sim.base.Operation.java
• de.edu.tum.smyrna.sim.base.OpType.java
• de.edu.tum.smyrna.sim.PerformanceObserver.java
• de.edu.tum.smyrna.sim.Smyrna.java
• de.edu.tum.smyrna.sim.controls.ServiceDemandGenerator.java
• de.edu.tum.smyrna.sim.controls.ServiceInitializer.java
• de.edu.tum.smyrna.sim.controls.SmyrnaPlacementInitializer.java
• de.edu.tum.smyrna.sim.controls.RTEInitializer.java
• de.edu.tum.smyrna.sim.controls.FailRecover.java
• de.edu.tum.smyrna.sim.controls.RTEThresholdGenerator.java
87


Appendix C
Service API
Service interface that defines the core functionalities required by Smyrna to manageservices.
/*** This interface defines core functionalities required for management of services.* @author Cuneyt Caliskan*/
public interface IService extends Runnable /*** Starts the actual functionality of this service.*/
void start();
/*** Resumes the functionality of the service which is waiting in* @link Status#READY state.*/
void resume();
/*** Stops the functionality of the service and exits the system. Does the cleanup* like closing files, sockets, etc.*/
void stop();
/*** Suspends the functionality of the service in case of preparation for migration* or replication. Also replicas of a service should be in suspended state.*/
void suspend();
89

APPENDIX C. SERVICE API
/*** Returns the bundle name of this service in the form of* [bundleSymbolicName_Version].* @return the bundle name and version in the form of [bundleSymbolicName_Version]*/
String getBundleName();
/*** Returns the last modified time of the bundle of this service in milliseconds.* @return last modified time in milliseconds*/
long getLastModified();
/*** Returns the value representing if this service is the primary one or a replica.* @return @code true if this is the active service,* @code false if this is a replica.*/
boolean isActive();
/*** Determines if this service is alive, for failure monitoring.* @return @code true if this method is accessible. Caller of this method will* determine that this service is dead if there is no response or cannot call* this method.*/
boolean isAlive();
/*** Determines the amount of memory consumed by this service bundle.* @return amount of memory allocated for this bundle in bytes.*/
long getMemoryUsage();
/*** Used to notify the failure of a runtime environment if this service is* subscribed for failures.* @param address address of the crashed RTE in KOR*/
void notifyRTEFailure(String address);
/*** Used to add memory usage for this service. It is used by the RTE when a bundle
90
* is installed and when a bundle is started.* @param amount memory in bytes*/
void addMemoryUsage(long amount);
/*** Used to get the address where the service saves its state on the KOR.* @return the address where the service state is stored.*/
String getStateAddress();
Abstract class which includes some of the functionalities implemented. Servicedevelopers need to extend this class.
/*** This is the abstract class that must be extended by any service implementation.* It includes the implementations of core functionalities required for controlling* services such as getters of some methods and service registration and unregistering.* @author Cuneyt Caliskan*/
public abstract class AService implements IService /*** Time in milliseconds to sleep when the replica is suspended.*/
protected static final long REPLICA_SLEEP_INTERVAL = 1000;/*** Used to keep the registration of this service in order to use later for* unregistering this service.*/
private ServiceRegistration<?> serviceRegistration;/*** Bundle context used for OSGi specific operations such as registering* and unregistering.*/
private BundleContext context;/*** State of this service. Can be one of @value Status#READY,* @value Status#RUNNING or @value Status#DEAD.*/
private volatile Status state;/*** Indicates if this service is the primary replica or a backup replica.* A value of <code>true</code> means it is the primary replica.
91

APPENDIX C. SERVICE API
*/private boolean active = false;/*** Holds the bundle name in the form of bundleSymbolicaName_bundleVersion* which is a unique identifier in an OSGi framework.*/
private String bundleName;/*** Allocated amount of memory in bytes.*/
private long memoryAllocated = 0;/*** Connector to the knowledge agent.*/
private Connector connector;/*** The address that the @link #connector is registered.*/
private String clientAddress;/*** User id of the @link #connector.*/
private String clientId;/*** Logger for this class instance.*/
private Logger logger;
/*** Constructs a new service by initiating the state to @link Status#READY* and connecting to the knowledge agent.* @param bundleContext bundle context*/
public AService(final BundleContext bundleContext) super();this.context = bundleContext;logger = Logger.getLogger(getClass());bundleName = bundleContext.getBundle().getSymbolicName() + "_"
+ bundleContext.getBundle().getVersion();state = Status.READY;active = false;initConnector();addPermissions();
92

/*** Tries to connect to the local agent instance by initiating the* @link #connector.*/
private void initConnector() try
connector = new Connector(context);clientId = connector.registerClient();if (clientId.isEmpty())
logger.error("Could not register the service with the local agent.");throw new RuntimeException("Could not register the service" +
"with the local agent.");clientAddress = connector.getKORSubtree();
catch (AgentCommunicationException e) throw new RuntimeException(
"Error while creating Connector, unable to register to " +"local agent:" + e.getMessage());
catch (AgentErrorException e) throw new RuntimeException(
"Error while creating Connector, unable to register to " +"local agent:" + e.getMessage());
private void addPermissions() try
connector.addReaderToSubTree(clientAddress, "*");connector.addWriterToSubTree(clientAddress, "*");
catch (AgentCommunicationException e) logger.error(e.getMessage());
catch (AgentErrorException e) logger.error(e.getMessage());
@Overridepublic abstract void run();
@Overridepublic final void start()
registerService();Thread t = new Thread(this);
93

APPENDIX C. SERVICE API
t.start();
@Overridepublic abstract void resume();
@Overridepublic abstract void stop();
@Overridepublic abstract void suspend();
@Overridepublic final String getBundleName()
return bundleName;
@Overridepublic final long getLastModified()
return context.getBundle().getLastModified();
@Overridepublic final boolean isActive()
return active;
@Overridepublic final boolean isAlive()
return !state.equals(Status.DEAD);
@Overridepublic final long getMemoryUsage()
return memoryAllocated;
@Overridepublic final void addMemoryUsage(final long amount)
memoryAllocated += amount;
/*** Registers this service as @link IService instance to the OSGi registry.
94

*/public final void registerService()
serviceRegistration = context.registerService(new String[] IService.class.getName()
, this, null);
/*** Unregisters the service if it has been successfully registered previously.* Also unregisters the @link #connector and closes the connection with the* local knowledge agent.*/
public final void unregisterService() try
if (serviceRegistration != null) serviceRegistration.unregister();serviceRegistration = null;
if (connector != null)
connector.removeKnowledge(clientAddress, clientId);connector.unregisterClient();connector.shutdown();
catch (AgentErrorException e)
logger.warn(e.getMessage()); catch (AgentCommunicationException e)
logger.warn(e.getMessage());
/*** Gets the sleep interval in case of suspended service.* @return the interval in milliseconds*/
public static long getReplicaSleepInterval() return REPLICA_SLEEP_INTERVAL;
/*** Gets the bundle context.* @return the bundle context*/
public final BundleContext getContext() return context;
95

APPENDIX C. SERVICE API
/*** Gets the state of this service.* @return the state as one of the possible entries in @link Status*/
public final Status getState() return state;
/*** Gets the amount of memory allocated by this service.* @return memory in bytes*/
public final long getMemoryAllocated() return memoryAllocated;
/*** Gets the connector instance.* @return the connector*/
public final Connector getConnector() return connector;
/*** Gets the client address that the connector is registered to* the knowledge agent.* @return the address*/
public final String getClientAddress() return clientAddress;
/*** Gets the user id of the connector.* @return the id*/
public final String getClientId() return clientId;
/**
96

* Sets the new value of the client address.* @param address new address*/
public final void setClientAddress(final String address) this.clientAddress = address;
/*** Sets the new state of the service.* @param s new state*/
public final void setState(final Status s) this.state = s;
/*** Sets the state as active or backup replica.* @param act new state*/
public final void setActive(final boolean act) this.active = act;
/*** Sets the bundle name.* @param name bundle name*/
public final void setBundleName(final String name) this.bundleName = name;
/*** Sets the amount of memory allocated by this service.* @param mamory memory amount*/
public final void setMemoryAllocated(final long mamory) this.memoryAllocated = mamory;
97


Appendix D
Sample Classes
D.1 Sample Notification CallbackPingSubscription class is the implementation in RTE for receiving notificationsabout the address where to send ping messages. Whenever an RTE receives anotification, it first tries to shutdown ping threads if they are alive. If the value isempty, threads are shutdown and no more action is taken because Smyrna sets thisvalue in purpose to notify them that it is leaving the system and there is no need tosend ping messages any more. If the value is not empty, a new thread for sendingping messages is created.
* Subscription for the ping address that is set by Smyrna.* @author Cuneyt Caliskan*/
public class PingSubscription implements ISubscriber /*** Connector instance to communicate with the local agent.*/
private final Connector connector;/*** Interval of sending ping messages.*/
private final long pingInterval;/*** Address of the RTE in the KOR which is set in the callback address of Smyrna.*/
private final String myAddress;/*** Thread that sends the ping messages periodically.*/
private EPFDPing pinger;/**
99

APPENDIX D. SAMPLE CLASSES
* Logger instance for this class.*/
private final Logger logger;/*** Executor for the @link #pinger.*/
private Thread executor;/*** My bundle name.*/
private final String myName;
/*** Subscription for the address where to send ping messages which is set by* Smyrna.When the address changes, the previous ping thread is stopped and* a new instance is started for the new address.* @param conn connector instance.* @param interval ping sending interval.* @param clientAddress my address in the KOR.* @param bundleName my bundle name.*/
public PingSubscription(Connector conn, long interval, String clientAddress,String bundleName)
super();connector = conn;pingInterval = interval;myAddress = clientAddress;myName = bundleName;logger = Logger.getLogger(getClass());
@Overridepublic final void notificationCallback(String changedAddress)
try String pingAddress = connector.get(changedAddress + "/value",
connector.getId());shutDown();if (pingAddress.isEmpty())
return;pinger = new EPFDPing(pingAddress, connector, pingInterval,
myAddress, myName);
100

D.2. DECISION FUNCTION
executor = new Thread(pinger);executor.setName("EPFD Ping Thread");executor.start();logger.info("#PING# thread started for ping address " + pingAddress);
catch (AgentCommunicationException e) logger.warn(e.getMessage());
catch (AgentErrorException e) logger.warn(e.getMessage());
/*** Shutdowns the pinger thread if it is alive.*/
public final void shutDown() if (executor != null)
if (executor.isAlive()) pinger.shutDown();executor.interrupt();
D.2 Decision FunctionDecisionFunction class is one of the most important classes in Smyrna implementa-tion which is responsible for deciding where to migrate a service, where to place areplica, when to migrate a service and so on. It includes methods for determiningthe worst RTE in the system, service to be migrated, best RTE for a given serviceand necessary methods for calculating utility values.
public class DecisionFunction /*** Connector instance used for communication with the local agent instance.*/
private final Connector connector;/*** Client ID used in the communication via @link #connector.*/
private final String clientId;/*** My address in the KOR.
101

APPENDIX D. SAMPLE CLASSES
*/private final String servicesAddress;/*** This parameter is required to make the first decision about a RTE if it shows* a decreasing or increasing characteristic. This value indicates what* percentage of RTEs utility history to be full in order to make a healthy* decision.*/
private final double nonNullPercentage;/*** Set of RTE entries in the system.*/
private volatile ConcurrentMap<String, RTEEntry> rteEntries;/*** Logger instance for this class.*/
private final Logger logger;/*** Migration threshold is a design parameter which indicates the fraction of* utility of a selected @link #getWorstRTE() worst RTE to a selected* @link #getBestRTE(List) best RTEs utility. If the utility of the worst RTE* is @link #migrationThreshold less or equal to best RTEs utility, then* a migration takes place. It means that the selected best RTE must be at* least %10 better than the selected worst RTE. <p>* calculateUtility(worst)/calculateUtility(best) <=migrationThreshold* <b>then</b> migrate the selected candidate.*/
private final double migrationThreshold = 0.9;
/*** Constructs a decision function that makes decisions about controlling the* services in the smart environment.* @param conn the connector used for communication with the local agent.* @param srvcsAddress address of the services stored in smyrna KOR* @param nonNullPer required percentage of utility values to make decisions.*/
public DecisionFunction(final Connector conn, final String srvcsAddress,final double nonNullPer, ConcurrentMap<String, RTEEntry> rteMap)
super();connector = conn;clientId = connector.getId();servicesAddress = srvcsAddress;nonNullPercentage = nonNullPer;rteEntries = rteMap;
102

D.2. DECISION FUNCTION
logger = Logger.getLogger(getClass());
/*** Creates a replica of the given address in the best RTE. First, replicas of* this replica are searched within the KOR. If no replica is found, ends the* operation. Then, an appropriate RTE, namely the best RTE is selected to place* a replica by excluding the replica locations. If there is no such best RTE,* operation ends. Otherwise, replication signal is sent to the selected* destination.* @param serviceAddress address within the SMYRNA-KOR.*/
public final String replicate(String serviceAddress,List<String> excludeLocations)
String best = null;try
String bundleName = connector.get(serviceAddress + "/bundleName/value",clientId);
List<String> replicaLocations = getServiceLocations(bundleName);if (excludeLocations != null)
for (String repLoc : replicaLocations) String rte = repLoc.substring(0, repLoc.lastIndexOf(’/’));rte = rte.substring(0, rte.lastIndexOf(’/’));if (!excludeLocations.contains(rte))
excludeLocations.add(repLoc);
best = getBestRTE(excludeLocations);if (best == null)
logger.warn("Cannot locate a replica for service @ " +serviceAddress);
return null; else
connector.set(serviceAddress + "/replicate", best, clientId);logger.info("Replicating replica @ " + serviceAddress + " to " +
best);
catch (AgentCommunicationException e) logger.warn(e.getMessage());
catch (AgentErrorException e) logger.warn(e.getMessage());
return best;
103
APPENDIX D. SAMPLE CLASSES
/*** Determines a list of migrations that need to be performed by calculating* the worst and best RTEs. It might also result in a no operation if no* migration is necessary.* @param rteServices runtime entries including addresses and utility histories.* @param nonNullPercentage required percentage of utility values calculated* to make decisions.* @return @link Operation operation of type @link OpType#MIGRATE if any* migration decision is made, otherwise operation of type @link OpType#NOOP.*/
public final Operation migration() Operation result = new Operation(OpType.NOOP);List<String> candidateHistory = new LinkedList<String>();String worst = getWorstRTE();boolean done = false;if (worst == null)
logger.debug("Worst RTE not selected."); else
logger.debug(worst + " has been selected as the worst RTE.");while (!done)
String servicePath = getMigrationCandidate(worst, true,candidateHistory);
if (servicePath == null) logger.debug("No active service has been selected from the worst
RTE. Trying to select backup replica.");servicePath = getMigrationCandidate(worst, false,
candidateHistory);if (servicePath == null)
logger.debug("No replica has been selected from the worst RTE.");done = true;
else candidateHistory.add(servicePath);logger.debug(servicePath + " is the candidate for migration.");String serviceName = servicePath.substring(
servicePath.lastIndexOf("/") + 1);List<String> excluded = getServiceLocations(serviceName);String best = getBestRTE(excluded);if (best == null)
logger.debug("Best RTE not selected.");done = false;
else
104

D.2. DECISION FUNCTION
logger.debug(best + " is the candidate destination tomigrate " + serviceName);
double worstUtility = calculateUtility(rteEntries.get(worst));
double bestUtility = calculateUtility(rteEntries.get(best));
if (worstUtility / bestUtility <= migrationThreshold) result = new Operation(OpType.MIGRATE, servicePath,
worst, best);done = true;
else logger.debug("There is no significant difference
between worst[" + worstUtility + "] and best[" + bestUtility+ "] RTE utilities. Cancelling migraton...");
done = false;
return result;
/*** Selects the worst RTE among the given set of entries. The calculation is done* by fitting the utility values in a line by and getting its slope calculated* by least squares estimate. The slope contributes the 50% of the result, the* other half is contributed by the average utility value of the history.* @return the address of the worst RTE among the given entries or null if none* of the entries satisfies the given non null percentage*/
public final String getWorstRTE()
String worst = null;Double min = Double.POSITIVE_INFINITY;
for (Map.Entry<String, RTEEntry> entry : rteEntries.entrySet()) RTEEntry rte = entry.getValue();double utility = calculateUtility(rte);if (utility == 0)
continue;if (min > utility)
min = utility;
105

APPENDIX D. SAMPLE CLASSES
worst = rte.getRteAddress();
return worst;
/*** Selects the best RTE among the given set of entries. The calculation is done* by fitting the utility values in a line by and getting its slope calculated* by least squares estimate. The slope contributes the 50% of the result, the* other half is contributed by the average utility value of the history.* @param rteEntries data structure containing the runtime environments and* their utilities* @param excludedAddresses list of RTEs to be excluded* @return the address of the best RTE among the given entries or @code null* if none of the entries satisfies the given non null percentage*/
public final String getBestRTE(List<String> excludedAddresses) String best = null;Double max = Double.NEGATIVE_INFINITY;
for (Map.Entry<String, RTEEntry> entry : rteEntries.entrySet()) RTEEntry rte = entry.getValue();if (excludedAddresses != null && excludedAddresses.contains(
rte.getRteAddress())) continue;
double utility = calculateUtility(rte);if (utility == 0)
continue;if (max <= utility)
max = utility;best = rte.getRteAddress();
return best;
/*** Searches for the oldest and most memory consuming service in the given* runtime environment that is an active replica or not depending on* the parameter.* @param rteAddress address of the RTE to search for services
106

D.2. DECISION FUNCTION
* @param activeRequired indicates whether to consider the primary replicas* only or not.* @param excludedServices list of services to be excluded.* @return address of the oldest service in the given RTE address or null if* no service is found.*/
public final String getMigrationCandidate(String rteAddress,boolean activeRequired, List<String> excludedServices)
String service = null;try
List<String> services = connector.getNodesOfType(rteAddress,"smyrna/service", clientId);
if (services == null || services.isEmpty()) return null;
services.removeAll(excludedServices);long currentTime = System.currentTimeMillis();long jvm = Runtime.getRuntime().totalMemory();double max = Double.NEGATIVE_INFINITY;for (String s : services)
boolean isActive = true;double l_i = 0;double m_i = 0;double S_i = 0;if (activeRequired)
isActive = Boolean.parseBoolean(connector.get(s + "/isActive/value",
clientId));if (isActive)
long sLastModified = Long.parseLong(connector.get(s +"/lastModified/value", clientId));
long sMemory = Long.parseLong(connector.get(s + "/memoryUsage/value", clientId));
l_i = 1 - (sLastModified / currentTime);sMemory = sMemory / jvm;S_i = (l_i + m_i) / 2;if (S_i > max)
max = S_i;;service = s;
107

APPENDIX D. SAMPLE CLASSES
catch (AgentCommunicationException e) logger.warn(e.getMessage());
catch (AgentErrorException e) logger.warn(e.getMessage());
return service;
/*** Searches for the replica locations of the given service.* @param serviceName the service of which replica locations to be searched.* @return list of locations or null if not found.*/
public List<String> getServiceLocations(String serviceName) try
List<String> serviceLocations = connector.getNodesOfType(servicesAddress,"smyrna/replica", clientId);
if (serviceLocations == null || serviceLocations.isEmpty()) return null;
List<String> result = new LinkedList<String>();for (String service : serviceLocations)
String bundleName = connector.get(service + "/bundleName/value",clientId);
if (serviceName.equals(bundleName)) String location = connector.get(service + "/location/value",
clientId);location = location.substring(0, location.lastIndexOf(’/’));location = location.substring(0, location.lastIndexOf(’/’));result.add(location);
return result;
catch (AgentCommunicationException e) logger.warn(e.getMessage());
catch (AgentErrorException e) logger.warn(e.getMessage());
return null;
/*** Returns the array of non null utility values of the given utility array* @param utilities data set to be examined
108

D.2. DECISION FUNCTION
* @return array of non null entries*/
public final Double[] getNonNullUtilities(Double[] utilities) Double[] result = null;int dim = getNonNullUtilityCount(utilities);if (dim == 0)
return null;result = new Double[dim];int index = 0;for (int i = 0; i < utilities.length; i++)
if (utilities[i] != null) result[index] = utilities[i];index++;
return result;
/*** Calculates the number of increments in the sequence of utility values* @param utilities data set to be examined* @return number of changes from low utility to a high utility*/
public final int countUps(Double[] utilities) int ups = 0;double prev = 0;
for (int i = 0; i < utilities.length; i++) if (utilities[i] == null)
return ups;
if (utilities[i] > prev) ups++;
prev = utilities[i];
return ups;
/*** Calculates the number of decrements in the sequence of utility values* @param utilities data set to be examined* @return number of changes from high utility to a low utility
109

APPENDIX D. SAMPLE CLASSES
*/public final int countDowns(Double[] utilities)
int ups = countUps(utilities);return getNonNullUtilityCount(utilities) - ups;
/*** Calculates the average utility value of the given utility history* @param utilities data set of which the arithmetic average to be calculated* @return arithmetic average of the given data set*/
public final double getAverageUtility(Double[] utilities) int nonNull = getNonNullUtilityCount(utilities);if (nonNull == 0)
return 0;
return totalUtility(utilities) / nonNull;
/*** Calculates the total utility sum of the given array.* @param utilities data set of which the sum to be calculated* @return aggregated sum of the non null entries in the data set*/
public final double totalUtility(Double[] utilities) double total = 0;for (int i = 0; i < utilities.length; i++)
if (utilities[i] != null) total += utilities[i];
elsebreak;
return total;
/*** Returns the percentage of the non null entries in the given utility array* @param utilities array of data to be examined* @return percentage of the non null entries in the history*/
public final double getNonNullPercentage(Double[] utilities) double result = getNonNullUtilityCount(utilities);return result / utilities.length;
110

D.2. DECISION FUNCTION
/*** Returns the non null entries in the given array.* @param utilities the array which to be examined* @return array of non null utility values*/
public final int getNonNullUtilityCount(Double[] utilities) int result = 0;for (int i = 0; i < utilities.length; i++)
if (utilities[i] != null)result++;
elsebreak;
return result;
/*** Calculates the average utility values of given entries and finds the maximum* average utility.* @return maximum average utility value or 0 if there is no utility value in* the given entry map.*/
public final double getMaxAverageUtility() double max = 0;for (Map.Entry<String, RTEEntry> entry : rteEntries.entrySet())
double avg = getAverageUtility(entry.getValue().getUtilityHistory());if (avg > max)
max = avg;
return max;
/*** Calculates the utility value for decision making for the given rte.* @param rte the RTE to calculate the utility of.* @return utility of the given rte or 0 if non-null percentage is not satisfied* or maximum average utility is 0.*/
public final double calculateUtility(RTEEntry rte) if (getNonNullPercentage(rte.getUtilityHistory()) >= nonNullPercentage)
Double[] data = getNonNullUtilities(rte.getUtilityHistory());SimpleRegression sr = new SimpleRegression();
111

APPENDIX D. SAMPLE CLASSES
for (int i = 0; i < data.length; i++) sr.addData(i, data[i]);
double maxAvg = getMaxAverageUtility();if (maxAvg == 0)
return 0;double utility = getAverageUtility(rte.getUtilityHistory()) / maxAvg;double slope = sr.getSlope();slope = Math.max(-1, slope);slope = Math.min(1, slope);utility += sr.getSlope();return utility / 2;
else return 0;
112


www.kth.se
TRITA-ICT-EX-2012:266