autos & auto parts - jefferies · pdf filemkt. cap price cons. current eps estimates...
TRANSCRIPT

Mkt. Cap Price Cons. Current EPS Estimates Valuation (P/E)Company Name Ticker (MM) Rating Price Target Next FY 2015 2016 2017 2016 2017 BYD Company Limited 1211 HK HK$105,477.6 HOLD HK$42.60 HK$43.00 RMB1.20 RMB0.40 RMB0.72 RMB0.85 59.2x 50.1xBYD Company Limited 002594 CH RMB156,706.0 UNPF RMB63.29 RMB36.00 RMB1.62 RMB0.40 RMB0.72 RMB0.85 87.9x 74.5xZhengzhou Yutong Bus 600066 CH RMB48,109.4 BUY RMB21.71 RMB26.00 RMB1.96 RMB1.48 RMB1.81 RMB2.04 12.0x 10.6x
Initiating Coverage
China | Industrials | Autos & Auto Parts 2 December 2015
Autos & Auto PartsChina NEV Champions Face-Off; InitiateYutong at Buy, BYD at Hold
EQU
ITY R
ESEARC
H C
HIN
A
List of technical abbreviations
NEV: New energy vehicle
PV: Passenger vehicle or car
CV: Commercial vehicle
PHEV: Plug-in hybrid electric vehicle
BEV: Pure electric vehicle
FCV: Fuel cell vehicle
CNG: Compressed natural gas
LNG: Liquefied natural gas
BMS: Battery management system
LFP: Lithium iron phosphate
LMO: Lithium manganese oxide
NCM: Nickel manganese cobalt oxide
NCA: Nickel cobalt aluminum oxide
Zhi Aik Yeo *Equity Analyst
+852 3743 8075 [email protected] Fong, CFA *
Equity Analyst+852 3743 8074 [email protected]
Yoanna Wang *Equity Associate
+852 3743 8776 [email protected] Nan *Equity Associate
+852 3743 8746 [email protected] Yu *
Equity Analyst+852 3743 8047 [email protected]
Johnson Leung *Equity Analyst
+852 3743 8055 [email protected]
* Jefferies Hong Kong Limited
Key Takeaway
A comparative study of Yutong vs. BYD leads us to prefer the former for itshealthier fundamentals, stable growth and reasonable valuation. For BYD, webelieve excessive expectations are priced in, and risks are emerging. We initiateYutong at Buy and BYD – H/A at Hold/Underperform.
NEV bus champion vs. NEV car champion. From Star Wars vs. Star Trek to Pacquiaovs. Mayweather, from Alibaba vs. Tencent to Katy Perry vs. Taylor Swift, everyone loves astory of great rivalry. Even though BYD and Yutong may only overlap in pure electric busesfor now, we have no doubt their paths will increasingly criss-cross. Yutong currently leadsin NEV buses while BYD has the pole position in NEV cars. Not only are these the defaultleaders in China's NEVs, investors often choose between them for an industry proxy. For thisreason, we conducted a comparative study of the two Chinese NEV leaders, and our analysisleads us to conclude Yutong is a better investment choice.
Prefer Yutong for stable growth. Yutong will continue to benefit from replacementdemand and government-backed rise in NEV bus penetration. Stable dividend payout, at4% yield in FY15, will sweeten the deal. We think the market had over-penalized Yutongfor impact of a subsidy cut in FY16/17. No doubt an adjustment of subsidy requirementwould be harsher on NEV buses vs. cars, but we expect NEV buses to better cushion thereduction. Local governments, who are key customers of NEV buses, are less price sensitivethan average consumers; moreover they are bounded by the NEV purchase target of 30%.Also, our calculation on the economics of NEV buses suggests the breakeven vs. diesel buswill be extended by merely ~1.5 years in FY17 upon subsidy cut. Thus from a customerperspective, it still makes economic sense to purchase an NEV bus despite the cut.
BYD is second-best. BYD lacks Yutong's financial soundness, as it is inferior in ROE,FCF yield, cash conversion, gearing and margins. Not to mention its profit included largecontributions of government grants and R&D capitalization. Meanwhile, the market haspriced in excessive expectations for the next 2 years. We are 29-35% below consensus. Ourconcerns lie firstly with volume, as the company faces: i) limited customer base as buyersmainly originate from license restricted cities ii) cannibalization between car models, as seenfrom Qin's recent lacklustre performance iii) authorities tackling the issue of consumers notusing electric mode despite buying PHEV iv) car subsidy cuts mainly affecting PHEV relativeto BEV v) intensifying competition. Meanwhile on margins, subsidy cuts in the short termand preoccupation with LFP batteries may curtail room for margin expansion. And ability toachieve long term cost reduction on battery relies on upcoming A-share placement.
Positive oil view and battery cost decline to spur adoption. We believe theindustry’s explosive growth and strong potential are well understood. Hence in this reportwe have selectively touched on the economics of NEV car/bus in China, outlook for thedecline in battery cost, challenges in consumer adoption and government policies drivingit. Importantly, we would highlight our China Oil & Gas team’s contrarian positive view onoil price, which would spur mass NEV adoption longer term.
Recommendation & Valuation. Based on SOTP valuation for both companies (and usingDCF to cross-check), we initiate Yutong (600066 CH) at Buy with TP of Rmb26.0, while weinitiate BYD - H/A shares (1211 HK, 002594 CH) at Hold /Underperform with TP of HK$43.0/Rmb36.0. At their respective TPs, Yutong represents 13x FY17 PER, while BYD is at 42x.
Jefferies does and seeks to do business with companies covered in its research reports. As a result, investors should be aware that Jefferies may have aconflict of interest that could affect the objectivity of this report. Investors should consider this report as only a single factor in making their investmentdecision. Please see analyst certifications, important disclosure information, and information regarding the status of non-US analysts on pages 74 to 79 ofthis report.

Table of Contents
I. Executive Summary Executive Summary…………………………………………………………………..………… 3
II. Comparative Study of BYD vs. Yutong A comparison of their businesses and operations……………………………………. 5
Market Share
PV and Bus Market
Future Competition
Subsidy Adjustment Impact
Business Model
Technology Roadmap & Risk
Segment Breakdown
Volume & Volume Growth
Revenue & Revenue Growth
Gross Margin
Return on Equity
Working Capital
Net Gearing
Free Cash Flow
Government Grants
Capacity Utilization
Research & Development
Shareholding Structure
III. Sector Outlook An overview of the market and its development………………………….……….… 21
PV EV Adoption No Easy Task
Government Paving the Road for EVs
The Cost of Batteries Coming Down
Tesla and the GigaFactory raising the bar
IV. Company Pages Zhengzhou Yutong Bus (600066 CH) initiate at Buy …..……………………..… 34
Company Background
Management and Shareholders
Earnings Estimates
Valuation & Risks
BYD –H (1211 HK) initiate at HOLD……………………………………………….…… 41
Company Background
Management and Shareholders
Earnings Estimates
Valuation & Risks
BYD –A (002594 CH) initiate at Underperform.......................................... 50
Company Background
Management and Shareholders
Earnings Estimates
Valuation & Risks
V. Appendix On the Cusp of a Car Culture………………………………………………..…………… 59
Inflection Should Happen Anytime Now
Lowering Vehicle Emissions
Battery Basics
Electric Vehicle Basics
Industrials
Initiating Coverage
2 December 2015
page 2 of 79 , Equity Analyst, +852 3743 8075, [email protected] Aik Yeo
Please see important disclosure information on pages 74 - 79 of this report.
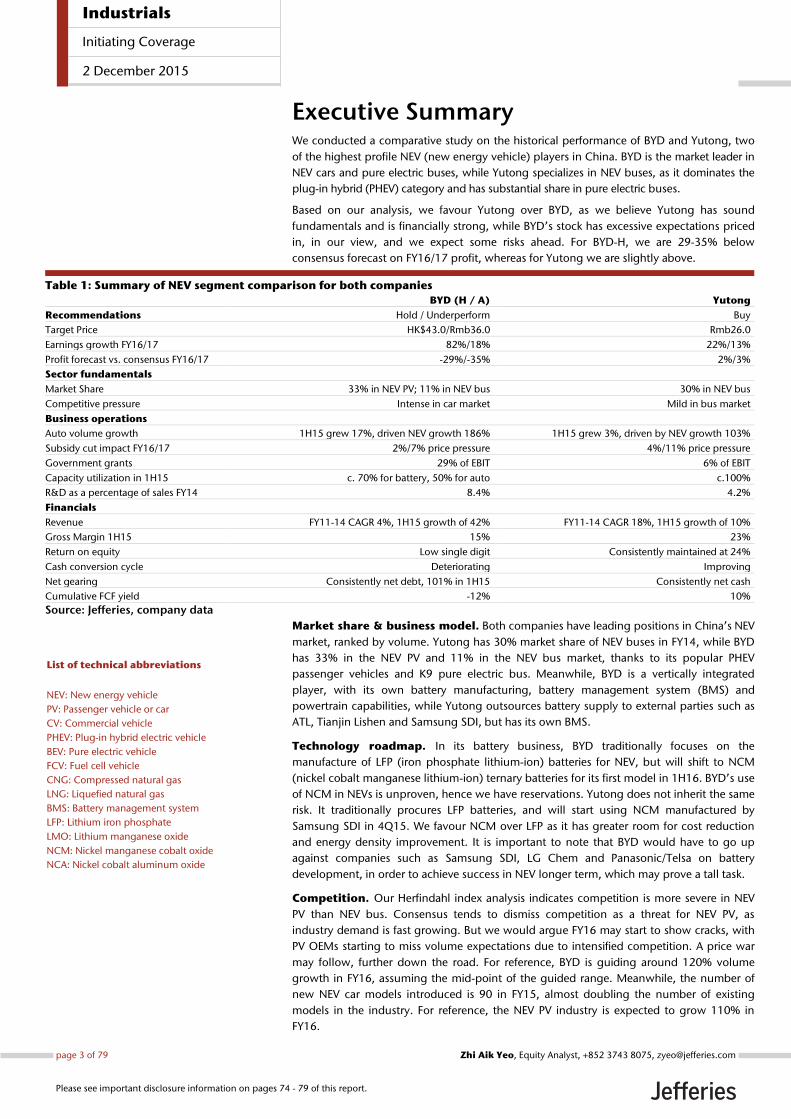
Executive Summary We conducted a comparative study on the historical performance of BYD and Yutong, two
of the highest profile NEV (new energy vehicle) players in China. BYD is the market leader in
NEV cars and pure electric buses, while Yutong specializes in NEV buses, as it dominates the
plug-in hybrid (PHEV) category and has substantial share in pure electric buses.
Based on our analysis, we favour Yutong over BYD, as we believe Yutong has sound
fundamentals and is financially strong, while BYD’s stock has excessive expectations priced
in, in our view, and we expect some risks ahead. For BYD-H, we are 29-35% below
consensus forecast on FY16/17 profit, whereas for Yutong we are slightly above.
Table 1: Summary of NEV segment comparison for both companies
BYD (H / A) Yutong
Recommendations Hold / Underperform Buy
Target Price HK$43.0/Rmb36.0 Rmb26.0
Earnings growth FY16/17 82%/18% 22%/13%
Profit forecast vs. consensus FY16/17 -29%/-35% 2%/3%
Sector fundamentals
Market Share 33% in NEV PV; 11% in NEV bus 30% in NEV bus
Competitive pressure Intense in car market Mild in bus market
Business operations
Auto volume growth 1H15 grew 17%, driven NEV growth 186% 1H15 grew 3%, driven by NEV growth 103%
Subsidy cut impact FY16/17 2%/7% price pressure 4%/11% price pressure
Government grants 29% of EBIT 6% of EBIT
Capacity utilization in 1H15 c. 70% for battery, 50% for auto c.100%
R&D as a percentage of sales FY14 8.4% 4.2%
Financials
Revenue FY11-14 CAGR 4%, 1H15 growth of 42% FY11-14 CAGR 18%, 1H15 growth of 10%
Gross Margin 1H15 15% 23%
Return on equity Low single digit Consistently maintained at 24%
Cash conversion cycle Deteriorating Improving
Net gearing Consistently net debt, 101% in 1H15 Consistently net cash
Cumulative FCF yield -12% 10%
Source: Jefferies, company data
Market share & business model. Both companies have leading positions in China’s NEV
market, ranked by volume. Yutong has 30% market share of NEV buses in FY14, while BYD
has 33% in the NEV PV and 11% in the NEV bus market, thanks to its popular PHEV
passenger vehicles and K9 pure electric bus. Meanwhile, BYD is a vertically integrated
player, with its own battery manufacturing, battery management system (BMS) and
powertrain capabilities, while Yutong outsources battery supply to external parties such as
ATL, Tianjin Lishen and Samsung SDI, but has its own BMS.
Technology roadmap. In its battery business, BYD traditionally focuses on the
manufacture of LFP (iron phosphate lithium-ion) batteries for NEV, but will shift to NCM
(nickel cobalt manganese lithium-ion) ternary batteries for its first model in 1H16. BYD’s use
of NCM in NEVs is unproven, hence we have reservations. Yutong does not inherit the same
risk. It traditionally procures LFP batteries, and will start using NCM manufactured by
Samsung SDI in 4Q15. We favour NCM over LFP as it has greater room for cost reduction
and energy density improvement. It is important to note that BYD would have to go up
against companies such as Samsung SDI, LG Chem and Panasonic/Telsa on battery
development, in order to achieve success in NEV longer term, which may prove a tall task.
Competition. Our Herfindahl index analysis indicates competition is more severe in NEV
PV than NEV bus. Consensus tends to dismiss competition as a threat for NEV PV, as
industry demand is fast growing. But we would argue FY16 may start to show cracks, with
PV OEMs starting to miss volume expectations due to intensified competition. A price war
may follow, further down the road. For reference, BYD is guiding around 120% volume
growth in FY16, assuming the mid-point of the guided range. Meanwhile, the number of
new NEV car models introduced is 90 in FY15, almost doubling the number of existing
models in the industry. For reference, the NEV PV industry is expected to grow 110% in
FY16.
List of technical abbreviations
NEV: New energy vehicle
PV: Passenger vehicle or car
CV: Commercial vehicle
PHEV: Plug-in hybrid electric vehicle
BEV: Pure electric vehicle
FCV: Fuel cell vehicle
CNG: Compressed natural gas
LNG: Liquefied natural gas
BMS: Battery management system
LFP: Lithium iron phosphate
LMO: Lithium manganese oxide
NCM: Nickel manganese cobalt oxide
NCA: Nickel cobalt aluminum oxide
Industrials
Initiating Coverage
2 December 2015
page 3 of 79 , Equity Analyst, +852 3743 8075, [email protected] Aik Yeo
Please see important disclosure information on pages 74 - 79 of this report.

Subsidy cut. The bus sector faces a more stringent subsidy requirement in 2016
compared to PV, as the bus subsidy no longer depends only on size but also on range and
energy efficiency. A PV subsidy cut, though more subtle, will mainly affect PHEVs where
BYD strength lies. On the other hand, we expect Yutong to withstand the drop in subsidy
better than BYD as its customers are mainly local governments or corporates who are less
price sensitive than average consumers. This would essentially mean passing on some of
the subsidy cut to customers. And based on our analysis, an FY17 subsidy cut merely
extends the pay-back period of NEV buses by around 1.5 more years, from 0.5 years in
FY15. Thus it still makes economic sense to purchase an NEV bus.
Volume & revenue. BYD should see a bigger ramp in volume and revenue growth in
FY16/17 as it is heavily exposed to the under-penetrated NEV PV segment. NEV PV sales
penetration was merely 0.6% in 1H15 vs. 6.8% for NEV bus. Unsurprisingly, its profit
growth will also be superior to Yutong, according to our forecasts.
Despite the strong volume growth expected, we believe BYD would have a problem
meeting volume guidance of 120-150k units in FY16. This is due to i) limited customer base
as buyers mainly originate from license restricted cities – Shenzhen & Shanghai alone
accounted for more than 70% of volume ii) cannibalization of volume despite strong
product introductions, as seen from the recent lacklustre performance of the PHEV Qin
sedan after the introduction of Tang (PHEV SUV) iii) authorities may tackle the issue of
consumers not using electric mode despite buying a PHEV iv) preferential policy towards
BEV (battery electric vehicle), as opposed to PHEV v) intensifying competition.
Meanwhile, Yutong does not face such a problem, as we believe sales penetration of NEV
bus can grow steadily due to i) requirement that 30% of government new vehicle
purchases should be NEV ii) replacement demand from retirement of yellow label vehicles
iii) still generous cash subsidy for NEV bus purchases, despite a subsidy cut in FY16/17 iv)
extensive build-out of charging facilities.
Gross margin. Yutong has a much higher margin than BYD on auto business, as BYD
remains unprofitable for conventional vehicles. Comparatively, Yutong maintains industry-
high profitability in conventional buses and even more so in NEV buses. Going forward, we
expect BYD’s GPM to pick up from 15.8% (FY15) to 16.5% (FY17). Meanwhile, Yutong
should see GPM expand from 24.6% (FY15) to 25.4% (FY17). We are more positive than
consensus on Yutong’s GPM expansion, whereas we are more negative than consensus on
BYD, due to the above-mentioned volume concerns. Note, Yutong has a track record of
improving its GPM yearly since 2010. Also, we would expect Yutong to capitalize on the
cheaper cost of NCM battery procurement in FY17, whereas BYD battery cost reduction
would be hampered by predominant use of LFP and customization cost of new BMS. Also,
BYD’s ability to achieve long term cost reduction on battery manufacturing relies on
upcoming A-share placement, which contains risk as borrowing options are limited.
Financials. Unsurprisingly, BYD’s ROE was a mere 2% in FY14 (due to various unprofitable
segments) vs. Yutong at a high 24%. This was due to Yutong enjoying much better NPM
and asset turnover. Meanwhile Yutong had a steadily improving cash conversion cycle vs.
BYD, which had seen deterioration. And Yutong enjoys a healthy FCF yield of 10% vs. BYD
at -12%. Importantly, BYD is highly geared at 103%, while Yutong has a strong net cash
position. This is partially the reason BYD is relying on an Rmb15bn A-share placement, for
capacity expansion and pay-back of debt. Also interesting to note, in 1H15, 26% of BYD’s
EBIT comes from government grants vs. 6% for Yutong. And if we were to strip off the
government grant, BYD would make 0.5% NPM in 1H15.
Recommendation & Valuation. Based on SOTP valuation for both companies (and
using DCF to cross-check), we initiate Yutong (600066 CH) at Buy with TP of Rmb26.0,
while we initiate BYD - H/A (1211 HK, 002594 CH) at Hold / Underperform with TP of
HKD43.0/Rmb36.0. At their respective TPs, Yutong represents 13x FY17 PER, while BYD is at
42x. Risks are consumer adoption of NEV PV taking off faster than expected, and subsidy cut
having a bigger impact on NEV bus demand than we anticipated.
Industrials
Initiating Coverage
2 December 2015
page 4 of 79 , Equity Analyst, +852 3743 8075, [email protected] Aik Yeo
Please see important disclosure information on pages 74 - 79 of this report.

Comparative Study of BYD vs. Yutong BYD is China’s market leader in the sale of NEV passenger vehicles (PV) and pure electric
buses, while Yutong is the market leader in NEV buses because it dominates the plug-in
hybrid (PHEV) category and is actively expanding pure electric offerings. Hence BYD is
commonly seen as having both NEV car and bus exposure, while Yutong is a NEV bus play.
Both companies are pioneers in the Chinese NEV market and we believe for both
companies, the performance of their NEV businesses are the key share price drivers, as seen
from historical trading. In the following pages, do a comparative study of both companies,
particularly on their NEV segments, to determine who has a stronger business proposition.
Below is a summary of the comparison.
Table 2: Summary of NEV segment comparison for both companies
BYD (H / A) Yutong
Recommendations Hold / Underperform Buy
Target Price HK$43.0/Rmb36.0 Rmb26.0
Upside / downside 0%/-43% 19%
Earnings growth FY16/17 82%/18% 22%/13%
Profit forecast vs. consensus FY16/17 -29%/-35% 2%/3%
Sector fundamentals
Market Share 33% in NEV PV; 11% in NEV bus 30% in NEV bus
Competitive pressure Intense Mild
Business operations
Auto volume growth 1H15 grew 17%, driven NEV growth 186% 1H15 grew 3%, driven by NEV growth 103%
Business model Vertically integrated, in-house battery, BMS Outsourced battery to ATL, Samsung SDI
Products NEV & conventional vehicle, batteries,
handset & electronic components
PHEV and EV bus;
conventional bus
Subsidy cut impact FY16/17 2%/7% price pressure 4%/11% price pressure
Government grants 29% of EBIT 6% of EBIT
Capacity utilization in 1H15 c. 70% for battery, 50% for auto c.100%
R&D as a percentage of sales FY14 8.4% 4.2%
Financials
Revenue FY11-14 CAGR 4%, 1H15 growth of 42% FY11-14 CAGR 18%, 1H15 growth of 10%
Gross Margin 1H15 15% 23%
Return on equity Low single digit Maintained at 24% consistently
Cash conversion cycle Deteriorating Improving
Net gearing Consistently net debt, 101% in 1H15 Consistently net cash
Cumulative FCF yield -12% 10%
Source: Jefferies, company data
Market Share BYD has a blended 28% of the China NEV market in FY14, and almost 30% share in 1H15.
This NEV market share is shared between the PV and bus segments, at 33% and 13% share
respectively (please refer to pie charts below).
BYD leads in the PHEV segment of PV, and has a front running position in pure electric
buses. BYD has quickly grown its market share in the PHEV sub-segment, due to the
popularity of its PHEV Qin sedan, and more recently the Tang (PHEV SUV).
More importantly, we believe Shenzhen’s restriction quota, introduced at year-end 14, was
a key factor of BYD strength this year. The policy stipulates that Shenzhen would have
100,000 units quota yearly, 20,000 of that for NEV, while 80,000 for conventional. The
20,000 NEV quota is entirely on lottery, while the 80,000 is half on lottery and half on
bidding. After the policy implementation, Shenzhen residents found it much easier to
purchase a NEV instead of a conventional car.
On the back of the restriction quota, and due to BYD being based in Shenzhen, we expect
the city to account for at least 35% of BYD’s NEV volume in FY15, the other big market
being Shanghai. But the quota is not going to grow, and we believe that will cap BYD’s
volume growth and consequently market share.
Market share in 1H15 had been
boosted by Shenzhen restriction
quota introduced in year-end 14
BYD has pole position in NEV PV and
exposure in pure electric bus.
Industrials
Initiating Coverage
2 December 2015
page 5 of 79 , Equity Analyst, +852 3743 8075, [email protected] Aik Yeo
Please see important disclosure information on pages 74 - 79 of this report.

Chart 1: China NEV PV Market Share by OEM in FY14, total
volume ~52,000 units
Source: Jefferies, CPCA
Chart 2: China New Energy Bus Market Share by OEM in
FY14, total volume ~ 23,000 units
Source: Jefferies, CAAM
Meanwhile, Yutong has seen a slight market share loss in 1H15. As the largest NEV bus
manufacturer in China, Yutong achieved 32% market share in 2014, and near 30% in 1H15,
having significant exposure to both PHEV and EV bus segments. The market share loss in
1H15 was due to relative weak growth on 6-8 meters pure electric buses, as smaller players
gained share on the back of a generous subsidy for this particular category.
Yutong sold NEV buses in more than 30 cities across China, which contributed to its leading
NEV market share in China. Notably, Yutong is one of the few NEV bus manufacturers that
has broken free of local protectionism and penetrated Chinese regions outside of its home
market.
In FY14, Yutong sold over 72% of its NEV buses to cities outside of its home region. This is
the highest proportion amongst the top 8 players. There are peers that sell a higher
proportion of NEV buses outside their home regions, but these are much smaller players.
PV and Bus Markets Between the NEV passenger vehicle and bus markets, the former had shown stronger
growth in recent times. In 1H15, NEV PV grew over 320% vs. NEV bus growth of 78%. This,
we believe is due to the lesser penetration of NEV PV of merely 0.6% as a proportion of PV
sales in China. Comparatively, NEV bus penetration was at 6.8% in 1H15.
OEMs that witnessed the strong growth to date do not want to be left out in the race. That
explains the aggressive NEV product pipelines of PV OEMs in the coming months. Other
than the aggressive introduction of new models, anecdotal evidence suggests NEV PV
consumers mainly come from license restricted cities, which limits the size of the captive
audience i.e. market. These 2 factors are causing competition to intensify and should get
more severe in the coming years.
In terms of competition, the NEV bus market is less competitive vs. NEV PV. Based on the
Herfindahl index, which measures the level of competition within a sector, NEV PV is at 19%
vs. the Bus market 23% (Chart 4). The lower the percentage, the more competitive it is.
BYD, 33%
Chery, 18% Kandi, 15%
Zotye, 13%
BAIC, 10%
SAIC, 5% Others, 5%
Yutong PHEV
24%
Yutong EV
8%
Jinlong PHEV
10%
Jinlong EV
5%
BYD EV
11%
Others PHEV
31%
Other EV
11%
Yutong has leading market share in
NEV buses. The company also leads
in share of vehicles that are sold
outside its home region.
NEV car market will see stronger
growth than NEV bus due to smaller
base & lesser penetration.
But NEV PV market is more
competitive as OEMs are all gunning
for that growth
Industrials
Initiating Coverage
2 December 2015
page 6 of 79 , Equity Analyst, +852 3743 8075, [email protected] Aik Yeo
Please see important disclosure information on pages 74 - 79 of this report.

Chart 3: Herfindahl Index (HHI) for PV and Bus markets
in 2014, PV is more competitive
Source: Jefferies, CAAM
Chart 4: Herfindahl Index (HHI) for NEV PV and NEV Bus
markets in 2014, NEV PV is more competitive
Source: Jefferies, CAAM
It is a similar story for the broader sector as a whole (Chart 3) i.e. PV market vs. Bus market.
This is hardly surprising, as even though the bus market still has many players i.e. 43 in
2014, market share is concentrated in the hands of a few big OEMs, including Yutong. On a
relative basis, PV market share is more evenly spread across the 66 players in FY14.
The market concentration ratio is very high in the bus market, which supports it being less
competitive. The combined market share of the Top 3 companies is above 41% in the
overall bus market in FY14 and has been relatively stable over the past two years. To add,
the top 5 players accounted for 54% of the market, and top 10 accounted for 75%. And
referring to the chart below, we can see that even for the different sub segments i.e. large,
medium, light bus market, the concentration among the top players remains very high.
Chart 5: Top 3 players’ market share in various bus segments - concentration is
very high
Source: Jefferies, CAAM, Company data
Future Competition The above analysis on competition is done on history, whereas if we try looking ahead into
the future, we will find PV NEV competition getting more intense. In FY15, 90 new NEV PV
models have been or would be launched locally (excluding imported models). The total
number of models will almost double from around 93 in FY14 to 183 by end-15. PHEV
models have seen significantly less competition historically, but number of car model
launches has also increased 91% from 11 (FY14) to 21 (FY15).
4.9%
10.4%
0.0%
2.0%
4.0%
6.0%
8.0%
10.0%
12.0%
PV Bus
18.8%
22.8%
0%
5%
10%
15%
20%
25%
NEV PV NEV Bus
40% 41%
56% 54%
44%
48%
55% 52%
0%
10%
20%
30%
40%
50%
60%
Total 2013 Total 2014 Large bus
2013
Large bus
2014
Medium
Bus 2013
Medium
Bus 2014
Light Bus
2013
Light Bus
2014
NEV bus market is not as competitive
as market share is dominated by a
few players…
…and it’s a similar story for the
overall bus market.
New NEV model introductions are
aggressive, expect competition to
intensify
Industrials
Initiating Coverage
2 December 2015
page 7 of 79 , Equity Analyst, +852 3743 8075, [email protected] Aik Yeo
Please see important disclosure information on pages 74 - 79 of this report.

Chart 6: Number of new NEV car models launched every year - big jump in 2015
Source: Jefferies, CAAM, Company data
However, we believe the competition in NEV PV market has yet to see its peak. In 2014, top
10 selling NEVs were manufactured by domestic brands (the 10th being a localized version
of Nissan Leaf), and together they account for 78% market share.
This contrasts with the conventional car market, where domestic brands commanded 32%
share in 2014, vs. 68% for JVs. What this means is many foreign brands have yet to step into
the market, and we see that happening over the next couple of years. Beijing Hyundai may
launch Sonata PHEV in 2016 and we expect brands like VW, GM, Ford and PSA to join the
fight in 2017. PHEV will likely to be a focus of the JVs to address the mass market segment.
Below, we illustrate the competition that BYD e6, Qin and Tang are up against currently, by
showing comparisons with other popular NEV PV models. Compared to Geely Emgrand EV
and BAIC EV200, BYD e6 is not competitive on pricing. And even though Qin & Tang still
hold an edge over the PHEV segment for now, we are afraid it might be affected by
government’s policy/ subsidy preference for BEV.
Chart 7: Comparison of key PHEV and BEV car models in China – BYD will maintain edge in PHEV for now
Source: Jefferies, company data, Wikimedia Commons
16 23
41
80
5
6
2
10
0
10
20
30
40
50
60
70
80
90
100
2012 2013 2014 2015
EV PHEV
Model e6 Geely Emgrand EV BAIC EV200 Model S Qin Tang Roewe 550 Plug-ine6先行者 帝豪EV精英型 EV200 轻秀版 85D 4dr All-wheel Drive 2015 秦双冠版 新旗舰型 2015款 2.0T 四驱豪华型 荣威550 PLUG-IN豪华版
OEM BYD Geely BAIC Tesla BYD BYD SAIC
MSRP (Rmb) 330,000 239,800 226,900 816,800 209,800 251,300 248,800
Subsidy (2015) 110,000 110,000 90,000 60,000 60,000 60,000
Post-subsidy Price 220,000 129,800 136,900 149,800 191,300 188,800
Type BEV BEV BEV BEV PHEV PHEV PHEV
0-100km/h accelerations (sec) 12 9.9 13 4.2 (0-60mph) 5.9 4.9 9.5
Top Speed (km/h) 140 140 125 250 (155mph) 185 180 200
Battery LFP NCM NCM NCA LFP LFP LFP
Battery Capacity (Kwh) 82 45 30 85 13 18.4 12
Electric Range (KM) 400 253 200 435 70 80 60
Battery Density 150wh/kg 81wh/kg
Weight (KG) 2283 1570 1290 2188 1720 2220 N/a
Estimated Home Charging Time 10 hrs 14hrs 9 hrs 12 hrs 8 hrs 10hrs 8hrs
Dimensions (mm)
Length 4,560 4,631 4,025 4,976 4,740 4,815 4,648
Width 1,822 1,789 1,720 1,963 1,770 1,855 1,827
Height 1,630 1,495 1,503 1,435 1,480 1,720 1,479
Wheelbase 2,830 2,650 2,500 2,959 2,670 2,720 2,705
Fuel consumption (L/100km) 0 0 0 0 1.6 2.4 1.6
Engine 1.5T 2.0T 1.5L
Warranty 6 years/150,000km 4 years/100,000km 5 years/100,000km 8 years 6 years/150,000km 6 years/150,000km 5 years/100,000km
Comparisons with the conventional
car market indicate that JV brands
have yet to step in to compete, and
it will just get more competitive in
the next few years
Industrials
Initiating Coverage
2 December 2015
page 8 of 79 , Equity Analyst, +852 3743 8075, [email protected] Aik Yeo
Please see important disclosure information on pages 74 - 79 of this report.

Subsidy Adjustment Impact In terms of the subsidy adjustments happening in FY16/17, we believe the pricing pressure
on Yutong will be larger than BYD, as more stringent requirements are introduced for
buses. In Table 3 below, we carried out an analysis to estimate by how much vehicle prices
need to be reduced in FY16/17, given changing subsidies, assuming customers pay the
same price as FY15. Yutong will have to cut as much as 11% in 2016 and another 7-12% in
2017, while the impact for BYD is mostly in single digits.
However in reality, it depends on the bargaining power of the OEMs over the customers.
We believe consumers of NEV cars would be more price sensitive vs. local governments’
purchase of NEV buses, as they are bounded by purchase targets. It is mandated that 30%
of annual vehicle purchase must come from NEVs. Therefore we are of the view that the
eventual impact of subsidy cut will be well cushioned by Yutong.
We are forecasting overall ASP changes by 6%/-2% for Yutong vs. -8%/-2% for BYD in
FY16/17, respectively. This forecast takes into consideration factors such as EOS, ability to
adjust product mix and bargaining power over customers.
Table 3: Subsidy impact on model pricing – bus will see generally bigger
decline in subsidy vs. car models
BYD Major Models 2016 2017
K9 (12m Bus) -4% -10%
Tang (PHEV) -1% -5%
Qin (PHEV) -1% -6%
E6 (EV) 1% -7%
Yutong Major Models 2016 2017
E7 (7m) -11% -12%
E12 (12m) 0% -11%
14m PHEV (14m) 0% -7%
Source: Jefferies estimates, company data
Business Model One basic difference between the NEV businesses of both companies: BYD is a vertically
integrated NEV manufacturer, while Yutong outsources battery supply to Tianjin Lishen and
Amperex Technology Limited (ATL), mainly LFP batteries.
ATL, which started out as the main supplier for Apple in small batteries, is now trying to
enter the large battery segment and is significantly behind market leaders such as Samsung
SDI, Panasonic/Tesla and LG Chem, in our view. And Korean competitor Samsung SDI will
be contributing ternary (NCM) lithium ion batteries to Yutong starting from 4Q15.
On the other hand, BYD is the one of the most integrated OEMs globally, thanks to its
Chairman’s long-standing focus on technology and the company's history of pursuing
vertical integration. Chairman Wang has a technical background, with a bachelor’s degree
majoring in metallurgy physical chemistry.
BYD supplies its own in-house cells for its NEVs, but it is also engaged in assembling battery
packs and even designing battery management systems (BMS) and electric motor
controllers. We thus see BYD’s integrated model could help the company gain an
advantage in NEV manufacturing at the infancy stages of the industry, as it would enjoy:
Consistency in battery standards
Easier integration with own EVs
Guaranteed supply availability
Cost savings synergies with battery manufacturing
In Table 3, we calculated the impact
on selling prices in FY16/17 if
customers still pay the same, as a
result of the subsidy cut. Buses seem
more impacted than cars.
But in reality, the impact on prices
and margins depends on other
factors as well, such as bargaining
power over customers, ability to
adjust product mix and EOS.
BYD is a vertically integrated player,
while Yutong outsources battery
manufacturing.
BYD’s advantage of vertical
integration may only stand during
the early stages of industry
development and in battery supply
shortage situations.
We expect Yutong to withstand the
subsidy reduction better despite
potentially experiencing a bigger %
subsidy cut vs. BYD
Industrials
Initiating Coverage
2 December 2015
page 9 of 79 , Equity Analyst, +852 3743 8075, [email protected] Aik Yeo
Please see important disclosure information on pages 74 - 79 of this report.

More importantly, batteries are in shortage in China currently, based on our channel
checks. This gives the company an edge in having the security of an in-house battery
supply, at a time when the industry is taking off. At present, Chinese automakers pay a
hefty Rmb2,000/kwh (USD315/kwh) for battery packs. This, in our view, is due to the
explosive growth of NEV demand in China, and specifically the increasing prevalence of
NEV buses, which necessitates heavy battery usage.
However, we expect 2H16 will be the time when supply-demand will balance, due to
aggressive battery capacity expansion in China, and 2017 will potentially see oversupply.
And over the longer term, we adopt a cautious view on whether BYD battery technology
and cost can compete with international competitors such as LG Chem, Panasonic / Tesla
and Samsung SDI. In the sections below, we will highlight the risks BYD faces in battery
technology development.
Technology Roadmap For EV power, lithium-ion batteries have so far been the preferred choice, however they can
be sub-divided into several types of chemical configuration, with varied cost, energy
efficiency, density, safety and durability. The main ones in the market are:
Iron phosphate lithium-ion (LFP)
Manganese lithium-ion (LMO)
Nickel cobalt manganese lithium-ion (NCM)
Nickel cobalt aluminum lithium-ion (NCA)
There is an obvious trade-off between energy density and safety: the higher the energy
density, the higher the chance of fire accidents. Thus far, BYD had focused on LFP, which is
believed to be the safest material, as the core battery chemistry for existing NEVs.
However, LFP batteries have limitations in other aspects, especially energy density, which
gets translated to higher costs for the same power. On the other hand, ternary battery (NCA
or NCM), which are more prone to fire accidents, are weaker on safety but more effective in
energy density. Tesla is a big proponent of the ternary NCA batteries, which it heavily
utilizes in its car models. The market seems to be gravitating towards ternary battery, after
learning how to minimize the probability of fire accidents by improving the BMS.
BYD has said it already has capability in ternary battery, in particular NCM, apart from the
LFP. While it has made 3bn units of ternary batteries for mobile phones, it hasn’t used
ternary cells in NEVs yet, due to fears of fire accidents. This constitutes our key reservation,
as the integration remains unproven. According to the company, going forward BYD will
increasingly use LFP batteries in trucks and buses and NCM batteries in light NEVs and in
particular, small-sized SUVs.
Even though Yutong doesn’t manufacturer NEV batteries, it too focuses on use of LFP for
most of its existing products, mainly through procurement from external parties. Yutong
predominantly procures LFP batteries from companies such as ATL and Tianjin Lishen, but
will shift towards NCM batteries from Samsung SDI starting in 4Q15. Yutong expects
greater cost savings from ternary in longer term because:
Energy density is higher, hence raw material need is lower
Production cost is lower per unit energy
However ternary battery will have more security concerns, hence it requires higher
standards of electrical control technology and BMS, in which Yutong currently leads, in the
NEV bus industry. Because of better compatible infrastructure and scale, management sees
greater cost saving synergies vs. peers.
But longer term, BYD would have to
go up against the global battery
giants to have an edge in NEV, which
may prove a tall task.
Lithium ion battery is the preferred
choice of EV power, but there are
different variations of this battery
type, with different pros and cons
BYD focuses on LFP traditionally, but
wants to gradually switch to NCM
BYD use of NCM is unproven as yet
Yutong will start procuring NCM in
4Q15, has traditionally used LFP
NCM is superior to LFP in energy
density and production cost, and
importantly it provides greater room
for cost savings ahead
Industrials
Initiating Coverage
2 December 2015
page 10 of 79 , Equity Analyst, +852 3743 8075, [email protected] Aik Yeo
Please see important disclosure information on pages 74 - 79 of this report.

The introduction of NCM battery will not entail any change to the plant layout or
production process, according to Yutong. And the company will only need to lift safety
standards in the storage facilities to prevent fire accidents.
Technology Risk Despite prevalent media coverage and strong growth of late, the EV industry is still at its
early stages of development given the immaturity of battery technologies. EV battery is still
evolving, and its future technology track remains unclear. It is unknown which chemical
configuration will emerge as the winner for EV battery over the longer term.
Furthermore, it is not clear whether plug-in hybrids (PHEV) or pure electric NEVs will be the
ultimate solution for clean mobility. Fuel cell vehicle (FCV) technologies are advancing fast,
as seen in the Japanese market, and it is prompting consideration as the technology of
choice for future vehicles, given higher energy efficiency and better convenience of use vs.
electric vehicles.
For BYD, the technology risk is to put most eggs into LFP technology for NEVs, only
considering a diversification to NCM recently. NCM should have greater room for cost
reduction and increase in energy density vs. LFP longer term. Even though the company
did state that NCM battery is not new to them, as they have been using ternary battery in
mobile phones, we are not sure the experience is replicable to cars. Moreover, the BMS
would have to be reconfigured to match the NCM batteries, which would come in the form
of additional costs.
However, we do recognize that BYD should be a bigger beneficiary in the short term vs.
Yutong if the demand for battery overtakes supply. This is what we are seeing in the
Chinese market currently. if BYD can hedge its technology risk appropriately, the vehicles
should benefit from vertical integration in the longer run, given more seamless integration
with batteries and ability to respond to market demand quicker vs. peers that outsource.
Yutong on the other hand, does not inherit such a technology risk, as it procures battery
from external parties, including Samsung SDI, Tianjin Lishen and ATL. We see this as the
more conservative move since the risk of aligning with the wrong technology can be costly,
even with the Chinese government’s backing of electric vehicles.
Referring to our industry section on page 28, battery manufacturing cost should continue
to decline over the longer term, and competition among the battery makers should
intensify, along with the huge capacity buildout plans. Thus Yutong would benefit as
battery makers pass on the cost savings eventually.
Segmental Breakdown BYD as a company derives a much bigger portion of its revenue from businesses outside of
autos, and at times it is seen as a conglomerate instead of an auto OEM. This is the key
reason why SOTP valuation is common used and relevant for the company. Apart from core
auto business, it has a handset component/assembly arm, solar, battery and majority
holdings in BYD Electronics (285 HK, NC).
BYD’s auto business includes both conventional and NEV segments, the latter of which is
one of the most vertically integrated vs. industry peers. It has in-house battery cell
production, assembly of battery packs and even design of battery management systems
(BMS) and electric motor controllers. BYD’s NEV revenue accounted for 35% of Auto
segment revenue or 19% of total revenue in 2014.
This business model contrasts with Yutong, which specializes in the bus space of the auto
sector, and derives most of its revenue and profit in large and medium-sized buses. In FY14,
Yutong derived 22% if its bus sales revenue from NEV buses, in particular large NEV buses.
Battery technology is still evolving
Clean mobility technology track is
undecided too
We have reservations over BYD’s
competitiveness in NCM, and it
would come at the extra cost of a
new BMS that fits
With batteries in shortage in China,
BYD has an advantage, due to the
uncertainty of battery supply
Yutong does not inherit the same
technology risk, as it sources
batteries
Long term battery cost will continue
declining on the back of EOS and
capacity buildout and that would
erode BYD’s advantage
Both companies derive the biggest
portion of their revenue and profit
from auto manufacturing.
BYD’s NEV revenue was 19% in FY14
Yutong’s NEV revenue was 22% in
FY14
Industrials
Initiating Coverage
2 December 2015
page 11 of 79 , Equity Analyst, +852 3743 8075, [email protected] Aik Yeo
Please see important disclosure information on pages 74 - 79 of this report.

Chart 8: BYD revenue by segment
Source: Jefferies, company data
Chart 9: BYD operating profit by segment
Source: Jefferies, company data
In 1H15, BYD had 56% of revenue coming from ‘autos and related products’, and 37%
from ‘mobile handset components’, with ‘rechargeable batteries and photovoltaic’
accounting for the remainder 7%. This compares with Yutong deriving 92% of revenue
from bus sales, and only 8% from transportation services and other businesses.
BYD derives an even bigger portion of its profitability from the auto segment, with 70% of
its gross profit from the segment. Mobile handsets and rechargeable batteries contribute
around 29% and 4%, respectively. For Yutong, it’s a relatively similar picture on the profit
front vs. revenue, where Yutong derives more than 90% from bus sales.
Chart 10: Yutong revenue by segment
Source: Jefferies, company data, Before 2013, all bus combined
Chart 11: Yutong gross profit by segment
Source: Jefferies, company data Before 2013, all bus combined
Volume & Volume Growth BYD total volume growth in FY14 was down 21% y/y due to sharp drop in conventional
vehicles volume. The conventional vehicle segment was down 25% to 352,200 units. Other
than F3 and S6 which saw growth, all other models experienced significant falls in volume
y/y.
In contrast to the weak showing of the conventional vehicle segment, NEV volume spiked
8.8x to 20,807 units in the same period, albeit off a small base. This was mainly driven by i)
new product launch of Qin in late-2013, which saw a strong volume ramp-up in FY14 ii)
strong policy support from the Chinese government.
10% 10% 11% 10% 9%
44% 42% 39% 39% 44%
46% 48% 51% 51% 47%
0%
20%
40%
60%
80%
100%
120%
2010A 2011A 2012A 2013A 2014A
Automobiles and related products
Mobile handset components and assembly service
Rechargeable batteries and photovoltaic business
45% 37% 33%
54% 62%
48% 67% 79%
40% 33%
-20%
0%
20%
40%
60%
80%
100%
120%
2010A 2011A 2012A 2013A 2014A
Automobiles and related products
Mobile handset components and assembly service
Rechargeable batteries and photovoltaic business
Large Bus
62%Large Bus
60%
Medium Bus
29%Medium bus
28%
Light bus
4%Light bus
5%
Total Bus
96%
Total Bus
95%
Total Bus
95%
0%
10%
20%
30%
40%
50%
60%
70%
80%
90%
100%
2010 2011 2012 2013 2014
Large Medium Light Bus Service Other
Large Bus
64%Large Bus
62%
Medium Bus
27%Medium Bus
26%
Total Bus
97%Total Bus
96%Total Bus
94%
Light bus
4%Light bus
5%
0%
10%
20%
30%
40%
50%
60%
70%
80%
90%
100%
2010 2011 2012 2013 2014
Large Medium Bus Light Service Other
We do not have clarity, but we
believe BYD’s NEV contribution to
profit is bigger than Yutong’s as
conventional car business is losing
money
BYD’s NEV volume growth in FY14
was 880%
BYD’s total volume growth was
down 21% in FY14
Industrials
Initiating Coverage
2 December 2015
page 12 of 79 , Equity Analyst, +852 3743 8075, [email protected] Aik Yeo
Please see important disclosure information on pages 74 - 79 of this report.

Table 4: Historical volume performance: BYD delivered 186% NEV volume
growth in 1H15 (units)
BYD 2013 2014 y/y 1H2015 y/y
NEV 2,120 20,807 881% 21,645 186%
E6 1,544 3,560 131% 2,900 108%
Qin 142 14,747 10285% 16,477 208%
Tang 412
Bus 434 2,500 476% 1,856 127%
Others
Non-NEV 471,880 352,193 -25% 188,355 9%
F3 84,364 110,296 31% 76,438 62%
L3 99,450 54,531 -45% 7,709 -73%
Speed 101,152 65,312 -35% 28,710 -27%
S6 93,168 98,720 6% 12,927 -75%
S7 - 6,938 58,586
Others 93,746 16,396 -83% 3,985 -27%
Source: Jefferies, company data
Again, in 1H15, BYD’s NEV volume grew a staggering 1.9x to reach 21,645 units. The
growth rate was weaker than industry NEV growth of 240% y/y but still very strong, driven
by Tang’s (launched in May) incremental volume, and Qin’s rapid volume ramp. More
specifically, industry EV segment grew 293% while PHEV grew 205% in the same period.
BYD also became the largest NEV seller in the world for the first time in May 2015, with
strong volume growth seen in PHEV units. BYD is projected to sell 50,000-60,000 units this
year, up nearly 4x y/y. Next year the company is aiming for 120,000 -150,000 units of NEV
sales, up more than 1x y/y.
The BYD Tang (released in July this year) is selling much faster than anticipated, with
monthly sales already exceeding 5,000 units in Oct 15. Management estimates 2016 sales
at 100,000, but we are not as optimistic. Meanwhile, the volume of conventional autos
grew 9% to 190,000 units in 1H15, on the back of strong S7 SUV performance, which saw
average monthly volume of 9,500 units.
Table 5: Yutong historical volume performance ; Yutong delivered 103% NEV
volume growth in 1H15 (units)
Total 2013 2014 y/y 1H2015 y/y
Total 56,068 61,398 10% 24,079 3%
By Type
NEV 3,897 7,405 90% 3,645 103%
Non-NEV 52,171 53,993 3% 20,434 -5%
By Size
Large 25,584 27,398 7% 9338 -12%
Medium 25,020 25,880 3% 11068 11%
Light 5,464 8,120 49% 3673 31%
Source: Jefferies, company data
Meanwhile for Yutong, total bus volume grew 9.5% in FY14 to 61,400 units – Large (45%),
Medium (42%) and Small (13%). NEV bus growth was up a massive 90% to 7,400 units in
FY14. This was on the back of encouraging regulatory initiatives, subsidy programs and
replacement demand.
In 1H15, total volume was up 3% y/y to 24,100 units: Large (-12%), Medium (11%) and
Small (31%). In terms of NEV, growth accelerated further from FY14’s high growth level to
103% or 3,645 units in 1H15. Large NEV buses are expected to be stronger next year due to
government’s preferential policy for bigger, more efficient modes of transport.
BYD’s NEV volume growth was
186% in 1H15
Tang volume has done well since
launch
BYD became the largest NEV seller
globally in 2015
Yutong NEV grew 90% in FY14,
103% in 1H15
Industrials
Initiating Coverage
2 December 2015
page 13 of 79 , Equity Analyst, +852 3743 8075, [email protected] Aik Yeo
Please see important disclosure information on pages 74 - 79 of this report.

Revenue & Revenue Growth In terms of absolute revenue, BYD is almost 3x the size of Yutong in 1H15. BYD had a top
line of Rmb30.4bn compared to Yutong’s Rmb10.4bn in 1H15. Comparing solely the auto
sales of both companies, BYD’s Rmb17bn worth of revenue was 78% larger than Yutong’s
Rmb9.6bn auto sales. BYD’s lead comes from its dominant positon in NEV passenger
vehicles; conventional passenger vehicles contributed too, albeit not profitable currently.
However, if we go back further in history, Yutong saw stronger revenue growth of 18%
CAGR between FY10-14 vs. a mere 4% for BYD. But in 1H15, the tables turned, as BYD’s y/y
revenue growth accelerated to a staggering 21% vs. 11% at Yutong. This is on the back of
42% y/y spike in auto revenue vs. mere 8% for Yutong in 1H15.
BYD’s 1H15 auto revenue growth accelerated, despite a slowdown in demand growth in
the PV industry (1.4% y/y volume growth).
Table 6: BYD and Yutong: Revenue Comparison (Rmb mn)
2010 2011 2012 2013 2014 1H15 11-14 CAGR
BYD 46,685 46,312 44,381 49,768 55,366 30,435 4%
y/y -1% -4% 12% 11% 21%
BYD Auto 21,550 22,136 22,551 25,291 26,270 16,962 5%
y/y 3% 2% 12% 4% 42%
Yutong 13,479 16,932 19,763 22,198 25,728 10,387 18%
y/y 53% 26% 17% 12% 16% 10%
Yutong Bus 12,917 16,161 18,740 21,010 23,977 9,554 17%
y/y 54% 25% 16% 12% 14% 8%
Source: Jefferies, company data
Referring to the table below, the main source of BYD’s auto revenue acceleration came
from the NEV business, where it was up 1.2x y/y in 1H15 to Rmb5,870mn, which
accounted for 35% of auto segment revenue or 19% of total revenue. In the same period,
NEV volume grew 1.9x, and in particular NEV bus grew 1.3x. Conventional volume grew
merely 9%.
Table 7: BYD historical volume performance; NEV growth was strong but
conventional cars’ growth remained weak despite stimulus (units)
2013 2014 y/y 1H2015 y/y
NEV (including Bus) 2,120 20,807 881% 21,645 186%
Bus 434 2,500 476% 1,856 127%
Conventional car 471,880 352,193 -25% 188,355 9%
Source: Jefferies, company data
Gross Margin For FY14, Yutong achieved higher gross margin of 24.3% vs. BYD’s 13.8%, a gap of
10.5ppt. If we look at the auto businesses alone, gross margin of 24.2% exceeded BYD by a
significant 7.6ppt. It is important to note that Yutong has been improving its gross margins
since 2010.
For 1H15, Yutong achieved higher gross margin of 23.4% vs. BYD 15.0%, a gap of 8.3ppt.
In auto manufacturing, gross margin of 23.0% exceeded BYD by 4.3ppt.
BYD is 3x the size of Yutong in
revenue terms
Yutong saw higher revenue growth
historically, but that changed in
1H15 when BYD overtook it
Unsurprisingly, the NEV segment
was the key contributor to BYD’s
strong revenue growth
Yutong has a clear superior GPM vs.
BYD; Yutong has consistently
improved its GPM since 2010
Industrials
Initiating Coverage
2 December 2015
page 14 of 79 , Equity Analyst, +852 3743 8075, [email protected] Aik Yeo
Please see important disclosure information on pages 74 - 79 of this report.

Yutong’s industry-high gross margin can be explained by economies of scale in both NEV
and conventional buses segments, delivering 25.5% and 23.9%, respectively. While it’s
easy to comprehend that NEV buses benefit from a deep government subsidy that supports
its high profitability, it is also true that Yutong commands a price premium over
competitors on conventional buses, which gives it a high margin vs. peers.
Table 8: Gross Margin Summary – Yutong had been consistently improving
GPM, much superior to BYD
Gross Margin 2010A 2011A 2012A 2013A 2014A 1H15A
BYD 17.7% 14.8% 11.6% 13.1% 13.8% 15.0%
BYD Auto 21.2% 19.0% 14.4% 14.5% 16.6% 18.8%
Yutong 17.3% 18.2% 20.0% 23.1% 24.3% 23.4%
Yutong Bus 17.6% 18.2% 19.8% 22.9% 24.2% 23.0%
Source: Jefferies, company data
Even though Yutong held a substantial lead in FY14 on gross margin, the difference has
narrowed in 1H15, due to the rapid ramp-up of BYD’s PHEV and EV bus sales. Please refer
to Table 4. We believe BYD can deliver higher profitability with scale, lower battery costs
and better product mix in the coming years. The better product mix from moving into NEV
SUVs should award the company a kicker in margins, as Tang’s contribution started only in
2H15.
Return on Equity From a return on equity (ROE) perspective, Yutong is superior to BYD by a long mile.
Referring to the chart below, Yutong achieved 24% and 21% ROE in FY14/FY13,
respectively. This compares with a mere 1.7% and 2.5% for BYD in the same period.
We conducted a DuPont analysis (Table 9 below). Breaking down into its components, BYD
achieved net margin of 0.8% in FY14, along with asset turnover of 59% and leverage of
3.7x. This generated ROE of a mere 1.7%.
This compares with Yutong’s net margin of 10.2% in FY14, coupled with asset turnover of
108% and leverage of 2.2x. This generated an ROE of 24.2%.
We believe a key reason for BYD lagging ROE is due to a much lower margin vs. Yutong. In
terms of net margin, Yutong has a superior lead over BYD, achieving 10.2% in FY14 vs.
BYD’s 0.8%. This is largely due to BYD making losses on conventional autos and solar
business, which dragged on the profitability of NEV business and mobile handset segment.
Chart 12: ROE comparison – Yutong has had consistently higher ROE than BYD
Source: Jefferies, company data
14%
7%
0% 3% 2%
35% 35%
21% 24% 24%
0%
5%
10%
15%
20%
25%
30%
35%
40%
2010A 2011A 2012A 2013A 2014A
BYD Yutong
Yutong’s superior margin is due to
EOS, deep government subsidy,
price premium commanded over
peers
BYD narrowed the gap vs. Yutong in
1H15, as it turned profitable on NEV,
and conventional car business
reduced losses
Yutong is superior in ROE by a mile,
and it has remained so over the past
few years.
Yutong has a strong lead in net
margin and asset turnover, which
contributed to its higher ROE
Industrials
Initiating Coverage
2 December 2015
page 15 of 79 , Equity Analyst, +852 3743 8075, [email protected] Aik Yeo
Please see important disclosure information on pages 74 - 79 of this report.

Table 9: ROE Breakdown – Yutong excels in net margin and asset turnover
2014 Net Margin Asset
Turnover
Asset/Equity DuPont ROE
BYD 1% 59% 3.71 2%
Yutong 10% 108% 2.20 24%
Source: Jefferies, company data
Working Capital The cash conversion cycle is a metric used to gauge the effectiveness of management and
the company’s overall health. The calculation measures how fast a company can convert
cash on hand into inventory and accounts payable, through sales and accounts receivable,
and then back into cash. Hence it indicates the efficiency of the management's ability to
employ short-term assets and liabilities to generate cash for the company.
The result, which be seen clearly from the table below, is that BYD’s cash conversion cycle
had deteriorated from 2012-14 from a negative 63 days to negative 1 day. This compares
with Yutong, which improved from 3 days in 2012 to negative 17 days in 2014.
For BYD, accounts receivable days drastically lengthened in 2014 vs. 2012, which was the
main cause of cash conversion deterioration. Although Yutong had seen a similar trend in
terms of receivable days lengthening, it was more than made up for by the expansion of
payable days. This helped Yutong improve its cash conversion cycle.
Table 10: Working capital calculation – Yutong has a superior cash conversion
cycle vs. BYD
BYD Yutong
Account Receivable Days
2012 82 73
2013 96 83
2014 148 132
Account Payable Days
2012 213 99
2013 213 97
2014 225 171
Inventory Turnover Days
2012 68 29
2013 69 29
2014 76 22
Cash Conversion Cycle
2012 (63) 3
2013 (47) 15
2014 (1) (17)
Source: Jefferies, company data
Net Gearing BYD’s net debt to equity ratio has increased over the years (getting more leveraged) due to
higher capex and unstable earnings. The ratio rose to 103% in 2014, and the company is
planning an equity raise in 2016, to carry out their capacity expansion plan.
For the company to borrow onshore from banks, total liabilities/total assets ratio is also
monitored, with 70% seen as a cap. BYD’s ratio was at 69.3% in 2014 and has not declined
in 1H15. Without replenishing the equity base or increasing asset size, this may pose risks to
their onshore borrowing ability and its liquidity situation.
Yutong’s cash conversion cycle is
better than BYD’s, which is
important to keep in mind
Yutong has seen an improving cash
cycle over the last 3 years, while BYD
has a deteriorating one
BYD’s net gearing is over 100%, and
it is relying on A-share placement to
carry out its capacity expansion plan
BYD may find it difficult to borrow
from banks
Industrials
Initiating Coverage
2 December 2015
page 16 of 79 , Equity Analyst, +852 3743 8075, [email protected] Aik Yeo
Please see important disclosure information on pages 74 - 79 of this report.

Table 11: Leverage Comparison – BYD is highly geared while Yutong is net cash
2010A 2011A 2012A 2013A 2014A
BYD
Net Debt/Equity 65.4% 69.5% 71.4% 93.6% 103.3%
Total Liability/Total Asset 60.7% 64.1% 65.5% 68.1% 69.3%
Yutong
Net Debt/Equity -36.2% -34.4% -35.5% -42.3% -55.6%
Total Liability/Total Asset 63.4% 57.5% 48.7% 48.9% 54.4%
Source: Jefferies, company data
At the other end of the spectrum, Yutong has managed a very conservative balance sheet.
The company has maintained net cash positions for years and its liability/asset ratio has
stayed within a range of 40-60%. This is the reason why Yutong is able to carry out a
generous dividend policy with pay-out ratio at 57% in FY14. We expect the pay-out ratio to
continue, accruing nearly 4% dividend yield in FY15E. \
Free Cash Flow When free cash flow is positive, it indicates the company is generating more cash than it
uses to run the business and the excess can be reinvested to grow the business. We can use
the free cash flow yield to assess the value of a company. Since this measure uses free cash
flow, the free cash flow yield provides a better measure of the company's performance.
For the period 2011 – 1H15, BYD’s free cash flow was negative, and delivered cumulative
free cash flow yield of -9%. Comparatively, Yutong achieved cumulative positive free cash
flow yield of 9%. With the exception of 2012, all other time periods saw delivered positive
free cash flow.
We believe BYD will still find it difficult to turn FCF-positive until 2017, due to the expected
huge capital outlay in terms of building out capacity. By end 2015, battery capacity will
only reach 8GWH but 14GWH by end FY16. After that the capacity flattens out, and is
expected to gradually head into positive region. Comparatively, Yutong does not have
capacity expansion plans.
Table 12: Free Cash Flow Analysis (mn Rmb)
BYD Yutong
Operating Cash Flow
2010 3,139 1,318
2011 5,985 1,446
2012 5,555 1,372
2013 2,436 2,802
2014 38 3,205
1H15 3,022 1,861
Investing Cash Flow
2010 (12,683) (603)
2011 (8,923) (999)
2012 (4,610) (2,316)
2013 (5,851) (153)
2014 (7,901) (1,714)
1H15 (4,711) (1,999)
Financing Cash Flow
2010 9,183 (645)
2011 4,736 (10)
2012 (1,217) 2,859
2013 4,508 (1,185.57)
2014 7,271 (1,177)
1H15 921 (1,520)
Free Cash Flow
2010 (5,595) 391
Yutong is cash rich, and has a
generous dividend pay-out policy,
which will translate to 4% dividend
yield FY15E
BYD had been consistently running
on negative FCF, while Yutong had
consistently positive FCF except in
2012
BYD will have difficulty turning
positive on FCF due to plans for
huge capital outlay ahead
Industrials
Initiating Coverage
2 December 2015
page 17 of 79 , Equity Analyst, +852 3743 8075, [email protected] Aik Yeo
Please see important disclosure information on pages 74 - 79 of this report.

Table 12: Free Cash Flow Analysis (mn Rmb)
2011 (2,688) 454
2012 (1,451) (524)
2013 (176) 1,636
2014 (4,014) 1,286
1H15 (2,108) 1,220
Cumulative FCF (16,032) 4,464
Market Cap 134,269 46,891
FCF Yield -12% 10%
Source: Jefferies, company data
Government Grants For this part, we are referring to government grants that are awarded to companies for new
energy vehicle R&D and capacity buildout, rather than the subsidies consumers eventually
receive for car purchase. This government grant is commonly found as ‘Other Income’ on a
company’s P&L, and it’s never easy to forecast due to the opaque nature of collection time
and award assessment.
Referring to the charts below, historically Yutong has received significantly less government
grants than BYD, both in absolute terms and as a percentage of operating profit (EBIT). In
FY14 and 1H15, Yutong collected government grants of Rmb157mn and Rmb55mn,
respectively, 20%/17% of what BYD received. In FY14 and 1H15, the Yutong government
grant as a percentage of EBIT was 5%/6% respectively, vs. 86% and 30% at BYD.
This, we believe is a function of BYD making abnormally thin operating margins.
Meanwhile, BYD has done substantially more R&D into NEV passenger vehicles, which
gives it very high government grants. Furthermore, BYD’s vertical integration, which
resulted in huge R&D into battery technology, BMS, and power train, has helped it gain in
this department.
Chart 13: Government grant accounted as income – BYD
has significantly greater grants from government (mn
Rmb)
Source: Jefferies, company data
Chart 14: Government grant as a % of EBIT – BYD has a
significantly larger portion of EBIT from grants (mn Rmb)
Source: Jefferies, company data
Capacity Utilization In terms of capacity utilization, Yutong is superior to BYD, having maintained utilization at
very high levels for the past few years. Despite the rapid growth anticipated in NEV bus,
Yutong does not have any capacity expansion plan in the near term, as it seeks to maintain
its existing 65,000-unit standard capacity. Both conventional and NEV buses can share
production platforms. The last time Yutong increased capacity was in 2012/13 when it
added 30k units capacity (investment was Rmb3.5bn).
0
100
200
300
400
500
600
700
800
2010 2011 2012 2013 2014 1H15
Yutong BYD
2% 5% 7% 11% 5% 6%
13% 19%
135%
59%
86%
29%
0%
20%
40%
60%
80%
100%
120%
140%
2010 2011 2012 2013 2014 1H15
Yutong BYD
Yutong received less government
grants vs. BYD, as it does not
participate in battery manufacturing
Here we refer to government grants
awarded for R&D into NEV and
capacity buildout. It’s different from
government subsidy
Yutong’s capacity utilization is
superior to BYD in both battery
manufacturing and auto assembly
Industrials
Initiating Coverage
2 December 2015
page 18 of 79 , Equity Analyst, +852 3743 8075, [email protected] Aik Yeo
Please see important disclosure information on pages 74 - 79 of this report.
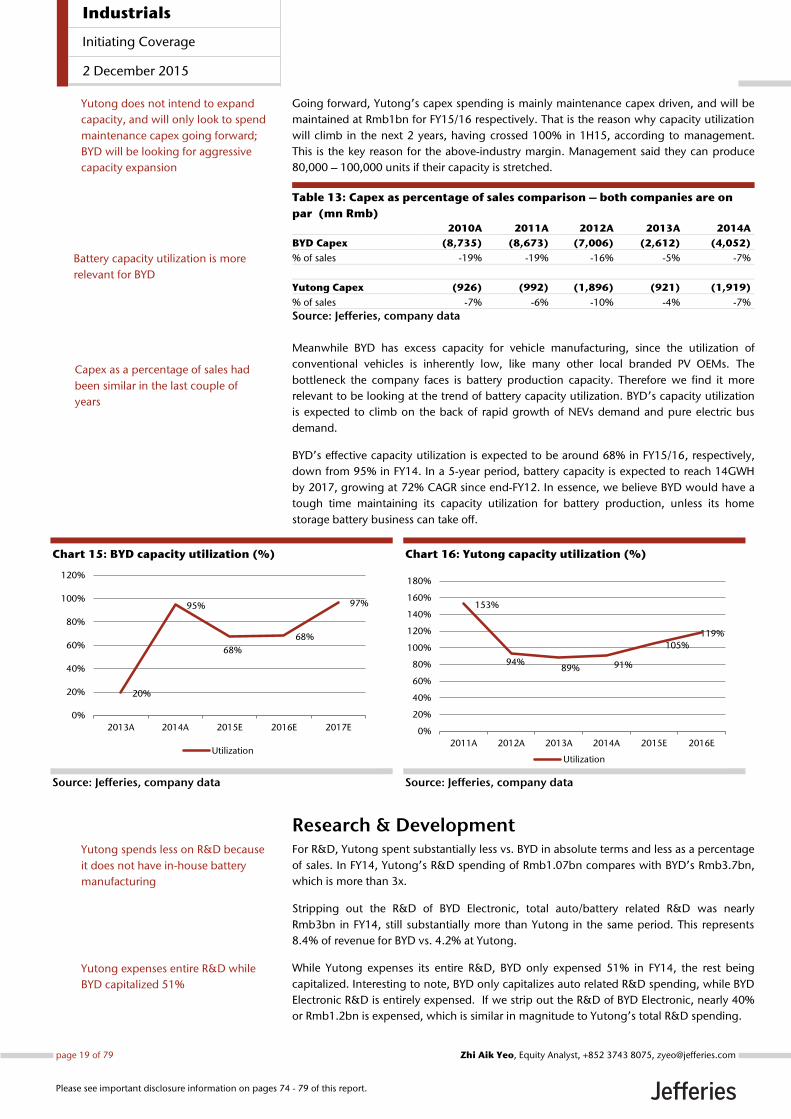
Going forward, Yutong’s capex spending is mainly maintenance capex driven, and will be
maintained at Rmb1bn for FY15/16 respectively. That is the reason why capacity utilization
will climb in the next 2 years, having crossed 100% in 1H15, according to management.
This is the key reason for the above-industry margin. Management said they can produce
80,000 – 100,000 units if their capacity is stretched.
Table 13: Capex as percentage of sales comparison – both companies are on
par (mn Rmb)
2010A 2011A 2012A 2013A 2014A
BYD Capex (8,735) (8,673) (7,006) (2,612) (4,052)
% of sales -19% -19% -16% -5% -7%
Yutong Capex (926) (992) (1,896) (921) (1,919)
% of sales -7% -6% -10% -4% -7%
Source: Jefferies, company data
Meanwhile BYD has excess capacity for vehicle manufacturing, since the utilization of
conventional vehicles is inherently low, like many other local branded PV OEMs. The
bottleneck the company faces is battery production capacity. Therefore we find it more
relevant to be looking at the trend of battery capacity utilization. BYD’s capacity utilization
is expected to climb on the back of rapid growth of NEVs demand and pure electric bus
demand.
BYD’s effective capacity utilization is expected to be around 68% in FY15/16, respectively,
down from 95% in FY14. In a 5-year period, battery capacity is expected to reach 14GWH
by 2017, growing at 72% CAGR since end-FY12. In essence, we believe BYD would have a
tough time maintaining its capacity utilization for battery production, unless its home
storage battery business can take off.
Chart 15: BYD capacity utilization (%)
Source: Jefferies, company data
Chart 16: Yutong capacity utilization (%)
Source: Jefferies, company data
Research & Development For R&D, Yutong spent substantially less vs. BYD in absolute terms and less as a percentage
of sales. In FY14, Yutong’s R&D spending of Rmb1.07bn compares with BYD’s Rmb3.7bn,
which is more than 3x.
Stripping out the R&D of BYD Electronic, total auto/battery related R&D was nearly
Rmb3bn in FY14, still substantially more than Yutong in the same period. This represents
8.4% of revenue for BYD vs. 4.2% at Yutong.
While Yutong expenses its entire R&D, BYD only expensed 51% in FY14, the rest being
capitalized. Interesting to note, BYD only capitalizes auto related R&D spending, while BYD
Electronic R&D is entirely expensed. If we strip out the R&D of BYD Electronic, nearly 40%
or Rmb1.2bn is expensed, which is similar in magnitude to Yutong’s total R&D spending.
20%
95%
68%
68%
97%
0%
20%
40%
60%
80%
100%
120%
2013A 2014A 2015E 2016E 2017E
Utilization
153%
94% 89% 91%
105%
119%
0%
20%
40%
60%
80%
100%
120%
140%
160%
180%
2011A 2012A 2013A 2014A 2015E 2016E
Utilization
Yutong spends less on R&D because
it does not have in-house battery
manufacturing
Yutong expenses entire R&D while
BYD capitalized 51%
Capex as a percentage of sales had
been similar in the last couple of
years
Yutong does not intend to expand
capacity, and will only look to spend
maintenance capex going forward;
BYD will be looking for aggressive
capacity expansion
Battery capacity utilization is more
relevant for BYD
Industrials
Initiating Coverage
2 December 2015
page 19 of 79 , Equity Analyst, +852 3743 8075, [email protected] Aik Yeo
Please see important disclosure information on pages 74 - 79 of this report.

Shareholding Structure BYD was founded in 1995 by Chairman Wang Chuanfu and listed on the Shenzhen and HK
stock exchanges in 2010/2002, respectively. At present, Mr Wang holds 21% effective stake
in the company, followed by the other co-founder, Mr. Lv Xiangyang with 10% and the
Warren Buffet backed Berkshire Hathaway with 9%. Berkshire’s stake ownership is mainly
through H-shares, while Chairman Wang’s holdings are in A-shares.
Table 14: BYD Major Shareholders
A shares H shares
% of
share capital
Wang Chuanfu 512,623,820 20.70%
Lv Xiangyang 239,228,620 9.66%
Berkshire Hathaway Inc. 225,000,000 9.09%
Youngy Investment 162,681,860 6.57%
Xia Zuoquan 118,977,060 4.81%
*Updated till Sept 15
Source: Jefferies, company data
In 1997, Yutong’s A-shares were issued on the Shanghai Stock Exchange. Currently, Yutong
is majority owned by shareholder Zhengzhou Yutong Group with 37% stake, which is in
turn controlled by the Chairman Mr. Tang Yu Xiang. Other major shareholders include GIC
(1.5%), Lions Bus (4%), Pingan Insurance (2%) and China Road Machinery (2%). And since
the company is eligible for participation through the HK-Shanghai stock connect scheme,
other foreign institutions accounted for 9% through the Hong Kong Stock Clearing body.
Table 15: Yutong Major Shareholders
A shares
% of
share capital
Zhengzhou Yutong Group 823,314,023 37.19%
Hong Kong Clearing 188,255,267 8.50%
Lions Bus (100% owned by Yutong Group) 87,428,292 3.95%
China Securities Finance Corp 65,986,258 2.98%
China Pingan-Orient Securities 46,561,632 2.10%
China Highway Vehicle & Machinery Co Ltd 44,385,192 2.00%
GIC Private Limited 32,946,068 1.49%
*Updated till Sept 15
Source: Jefferies, company data
Chart 17: BYD public shareholding structure
Source: Jefferies, company data
Chart 18: Yutong public shareholding structure
Source: Jefferies, company data
A shares
Listed, 30%
A shares
Unlisted,
33%
H shares
Listed, 37%
A shares
Listed, 86%
A shares
Unlisted,
14%
Wang Chuanfu, Lv Xiangyang and
Berkshire Hathaway are BYD’s
biggest shareholders
For Yutong, it is Yutong Parent
group, Lions Bus, CSFC, Pingan-
Orient Securities
Industrials
Initiating Coverage
2 December 2015
page 20 of 79 , Equity Analyst, +852 3743 8075, [email protected] Aik Yeo
Please see important disclosure information on pages 74 - 79 of this report.

Sector Outlook
PV EV Adoption No Easy Task Despite China’s policies on EVs, we estimate only ~294,000 electric vehicles are on the road
as at end October. Barring a sudden surge in EV sales, China will likely miss its 2015 target
with regard to both EV installed base and recharging infrastructure. China may yet see its
NEV installed base reach 5m vehicles by 2020.
Chart 19: China likely to fall short of 2015 Targets…
Source: Jefferies
Chart 20: …but could still reach the 2020 target
Source: China Association of Auto Manufacturers, Jefferies
NEV sales have accelerated in 2014, with EV sales growing by 324% YoY to ~75k units. In
2015, we believe NEV sales can grow by 150%+ to more than ~200k units. NEV would still
account for just ~1% of total PV sales in 2015 but we believe NEV sales will continue to
grow.
Chart 21: Electric Vehicles Sales pick up in 2014 and 2015
Source: China Association of Auto Manufacturers, Jefferies estimates
Forecasting 4.8m Electric Passenger Vehicles by 2020
We are forecasting China’s electrical passenger vehicles installed base to reach 4.8m
vehicles, just short of the 5mn mark. By 2020, electrical passenger vehicles sales should
reach 1.3m, accounting for just 4% of annual PV sales.
0% 20% 40% 60% 80% 100%
Charging
Poles
Charging
Stations
Electric
Vehicles 500
2,000
400
294 (59%)
636 (39%)
27 (8%)0
1,000
2,000
3,000
4,000
5,000
6,000
2011 2012 2013 2014 2015E 2016E 2017E 2018E 2019E 2020E
000's
2020 Target
0
50
100
150
200
250
2011 2012 2013 2014 2015E
000's
Battery Electric Vehicles
Plug-in Hybrid Electric Vehicles
Industrials
Initiating Coverage
2 December 2015
page 21 of 79 , Equity Analyst, +852 3743 8075, [email protected] Aik Yeo
Please see important disclosure information on pages 74 - 79 of this report.

Chart 22: Electric Vehicles Sales to Just Miss 2020 Target
Source: China Association of Auto Manufacturers, Jefferies estimates
The Payback Period is Attractive with Subsidies
The fundamental EV economic equation is higher upfront costs in the form of a battery in
exchange for lower fuel costs. The more you drive, the more quickly an EV will pay off the
upfront additional cost. For that reason, EVs are a natural fit for fleet vehicles such as buses.
For individual consumers, those who drive frequently will benefit more quickly from the
savings per “tank” fill-up with an EV. For PHEVs and BEVs, the payback period is 3 and 8
years, respectively.
If we factor in the purchase subsidies and the exemption of plate numbers fees, a BEV
payback period falls to 5 months and a PHEV is actually cheaper than its ICE counterpart. In
the table below we summarize our payback period analysis.
Chart 23: Payback Period Analysis for PV BEVs
Source: Jefferies
Chart 24: Payback Period Analysis for PV PHEVs
Source: Jefferies
In the exhibits below we highlight the sensitivity of the payback period to the price
difference and average km driven per year, and price difference and price of gasoline.
Passenger Vehicles 2014 2015E 2016E 2017E 2018E 2019E 2020E
EV PV Installed base 000's 123 345 811 1,508 2,410 3,493 4,789
YoY % Change % 154.8% 180.4% 135.1% 85.9% 59.8% 44.9% 37.1%
EV as a % of PV Installed Base % 0.1% 0.2% 0.5% 0.8% 1.2% 1.5% 1.9%
EV PV Sales 000's 75 222 466 699 909 1,091 1,309
YoY % Change % 323.8% 196.9% 110.0% 50.0% 30.0% 20.0% 20.0%
EV Sales as a % of PV Sales % 0.4% 1.1% 2.1% 3.0% 3.7% 3.9% 3.9%
EV Scrappage 0 0 0 2 7 8 13
PV Installed base 000's 123,267 141,785 161,863 181,876 203,622 228,299 257,812
YoY % Change % 16.7% 15.0% 14.2% 12.4% 12.0% 12.1% 12.9%
PV Sales 000's 19,700 20,488 22,537 22,987 24,826 28,054 33,665
YoY % Change % 9.9% 4.0% 10.0% 2.0% 8.0% 13.0% 20.0%
Scrappage 000's 2,351 2,713 2,561 2,766 3,088 3,195 3,501
The upfront purchasing cost for BEV is 4.2%
higher than ICE in Shanghai, if plate number
fees are considered.
Industrials
Initiating Coverage
2 December 2015
page 22 of 79 , Equity Analyst, +852 3743 8075, [email protected] Aik Yeo
Please see important disclosure information on pages 74 - 79 of this report.

Chart 25: Sensitivity Analysis of Price Difference and Annual Driving Distance –
payback period in years
Source: Jefferies
Chart 26: Sensitivity Analysis of Price Difference and Fuel Cost – payback
period in years
Source: Jefferies
Challenges to EV Adoption
We believe the following factors are key challenges to EV adoption in China:
Higher upfront cost: According to the US DOE, the initial purchase price plays
a more critical role in customer adoption than the levelized cost. In other words,
while NEV can yield cost savings over the lifetime of the car, consumers may still
be hesitant to make the initial investment. The purchase subsidies can help to
partially offset the higher cost of domestically produced PHEV and BEV. However,
given the higher cost of BEV, BEVs can still be 66.5% more expensive than ICE
counterparts even after factoring in the purchasing subsidy.
Lack of recharging network: Gasoline and diesel are universally available
across China, allowing vehicles to travel all corners of the country (and even
across international borders). China’s EV infrastructure is rapidly expanding but its
2015 targets, which they’ll likely miss, pale in comparison to gasoline and diesel.
There are ~50,000 gasoline/diesel service stations. By the end of 2014, China had
780 charging stations. By 2020, the government aims to construct an additional
12,000 charging stations, so still far behind gasoline stations.
Lengthy charging times: A faster charger like Tesla’s Superchargers can charge
an EV up to 80% in just 40 minutes (a 100% charge will take 75 minutes). The
alternative is a slow charger which typically requires owners to charge the EV
overnight. Hence the government’s target to build 400,000 charging poles by
2015. Most of these charging poles will likely be situated in residential apartment
complexes and office buildings.
Range anxiety: Tesla’s Model S offers a range of 253-270 miles, likely more than
sufficient for the average daily driver. However, most BEVs have a range of 100
miles or less, about one-third the range of gasoline cars.
Technology and service risk: An automobile is typically the second largest
purchase a consumer makes, after a home. With such a significant investment,
Price Difference
0.40 50,000 75,000 100,000 125,000 150,000 175,000 200,000 225,000
50,000 4.6 6.8 9.1 11.4 13.7 16.0 18.3 20.5
75,000 3.0 4.6 6.1 7.6 9.1 10.6 12.2 13.7
100,000 2.3 3.4 4.6 5.7 6.8 8.0 9.1 10.3
125,000 1.8 2.7 3.7 4.6 5.5 6.4 7.3 8.2
150,000 1.5 2.3 3.0 3.8 4.6 5.3 6.1 6.8
175,000 1.3 2.0 2.6 3.3 3.9 4.6 5.2 5.9
200,000 1.1 1.7 2.3 2.9 3.4 4.0 4.6 5.1
225,000 1.0 1.5 2.0 2.5 3.0 3.5 4.1 4.6
250,000 0.9 1.4 1.8 2.3 2.7 3.2 3.7 4.1An
nu
al
Dri
vin
g D
ista
nce
Price Difference
0.40 25,000 50,000 75,000 100,000 125,000 150,000 175,000 200,000
5.60 1.1 2.2 3.3 4.4 5.4 6.5 7.6 8.7
5.85 1.0 2.0 3.0 4.1 5.1 6.1 7.1 8.1
6.10 1.0 1.9 2.9 3.8 4.8 5.7 6.7 7.6
6.35 0.9 1.8 2.7 3.6 4.5 5.4 6.3 7.2
6.60 0.8 1.7 2.5 3.4 4.2 5.1 5.9 6.8
6.85 0.8 1.6 2.4 3.2 4.0 4.8 5.6 6.4
7.10 0.8 1.5 2.3 3.0 3.8 4.6 5.3 6.1
7.35 0.7 1.5 2.2 2.9 3.6 4.4 5.1 5.8
7.60 0.7 1.4 2.1 2.8 3.5 4.2 4.8 5.5
Fue
l C
ost
(R
mb
pe
r li
ter)
Industrials
Initiating Coverage
2 December 2015
page 23 of 79 , Equity Analyst, +852 3743 8075, [email protected] Aik Yeo
Please see important disclosure information on pages 74 - 79 of this report.

consumers may tend toward the “tried and true” rather than take a risk on new
technology, new products, and even entirely new companies. EVs are likely to
require service from OEMs that have the specific expertise, parts, and tools. New
EVs do not yet have lengthy track records in terms of maintenance issues, battery
life, motor/drivetrain wear, etc.
Chinese market dominated by local players
BYD and Zhongtai captured 39% and 18% of NEV sales in China in the 1H15. In fact, the
top five OEMs among NEV players in 2015 and 1H14 were domestic companies. As we
mentioned above, only domestically produced EVs are eligible to be included in the MIIT
catalog and buyers can receive purchase subsidies.
Even with the effective exclusion of foreign NEV, the competition between domestic OEMs
is intense. Based on the Herfindahl index, which measures the level of competition within a
sector, NEV PV is at 19% in 2014. The lower the percentage, the more competitive the
market.
Chart 27: China NEV PV Market Share by OEM in 1H15
Source: CPCA, Jefferies
Chart 28: China NEV PV Market Share by Model in 1H15
Source: CPCA, Jefferies
Buses prove to be a different story
We believe NEVs are suited for fleet vehicles such as buses. The total lifetime costs of a
vehicle are more important in the decision making process for fleet owners than for
individual consumers. The Chinese government provides a direct subsidy of Rmb250,000-
500,000 per vehicle. Fleet vehicles’ higher utilization rates, coupled with lower
maintenance costs, translate to comparatively lower payback periods. Predictable routes
and centralized facilities limit the capital expenditure for recharging facilities and range
anxiety.
For fleet vehicles with higher utilization, there are challenges given the limited range of a
battery and lengthy charging times. We believe in these cases, PHEVs would be a better fit
than BEVs.
There are 43 players in the NEV bus market but it is relatively concentrated. The Top 3 have
a combined market share of above 41%, which has been relatively stable over the past two
years. Yutong is the largest with 32% market share in 2014.
BYD
39%
ZOTYE
18%
BAIC
12%
Chery
11%
SAIC
7%
Others
14%
Passenger Vehicle By Model Sales Market Share
BYD Qin 16,477 33%
BAIC e 5,803 11%
ZOTYE e20 4,913 10%
ZOTYE yun100 4,347 9%
SAIC ROEWE 550 3,321 7%
QQ 3,208 6%
BYD e6 2,900 6%
JAC IEV 2,591 5%
KANDI 2,547 5%
Chery eQ 2,129 4%
Others 2,391 5%
Total 50,627 100%
Domestic models enjoy more favorable
polices than imported models.
Currently, imported models do not
receive purchase subsidies.
Industrials
Initiating Coverage
2 December 2015
page 24 of 79 , Equity Analyst, +852 3743 8075, [email protected] Aik Yeo
Please see important disclosure information on pages 74 - 79 of this report.

Chart 29: China New Energy Bus Market Share by OEM in FY14
Source: Jefferies, CAAM
Government Paving the Road for EVs With the potential inflection in car penetration set to exacerbate energy security and
environmental concerns, the government is intent on breaking oil’s monopoly on motor
vehicle fuel. In the Energy saving And New Energy Vehicle Plan for 2012–2020, the
government set a 2015 target of 500,000m electric vehicles, PHEV and pure EVs, on the
road. By 2020, the government is targeting electric vehicles to reach 5m.
Electric vehicles, including plug-in hybrid and pure EVs, are not the only solution though.
Natural gas vehicles (NGV) are one alternative. China already has 4.6m on the road at the
end of 2014, including 4.4m CNG vehicles. Hydrogen fuel cells are zero emission vehicles
but are considerably more expensive than electric vehicles. The government can manage
the problem by resorting to demand side management. Driving habits are indeed changing
in wealthier countries. For the purposes of this report, we focus primarily on electric
vehicles.
Government policy to encourage the NEV industry and adoption
China has long held aspirations to be a leader in New Energy Vehicles. The 8th Five-Year
Plan first mentioned New Energy Vehicles as a national science and technology project. The
government included New Energy Vehicles as a key project for the National High
Technology Research and Development Plan within the 11th Five-Year Plan.
In Jan 2009, the "10 Cities, 1,000 Vehicles plan” was launched with a target of adding 10
demonstration cities each year with 1,000 new NEVs for each demonstration city. Note, the
scheme officially ended in 2012 with 27,000 NEVs added across 25 demonstration cities,
falling short of its original targets. In March 2009, the State Council announced the
Automobile Industry Restructuring and Revitalization Plan to develop new energy vehicles
as a national strategy to industrialize BEVs, PHEVs and key components. By 2011, the sales
of NEVs should reach 5% of total sales of passenger vehicles.
In 2012, the State Council introduced the Energy Saving and New Energy Vehicle Industry
Development Plan. The Plan is targeting the NEV installed base to reach 500,000 vehicles
by 2015 and 5,000,000 by 2020. In 2020, NEV production capacity is targeted to reach
2,000,000 vehicles, with battery costs falling to Rmb1,500 per kWh. The previous “10
Cities, 1,000 Vehicles Plan” was effectively broadened.
In Sep 2013, the Ministry of Finance, Ministry of Industry and Information Technology,
National Development and Reform Commission and Ministry of Science and Technology
announced the promotion and application of NEV. There are now 88 demonstration cities
in 39 areas listed as NEVs demonstration cities. Please see Table 16 for details. Although the
latest detailed figures for 88 cities are not yet available, it appears the targets will likely not
be met.
Yutong
PHEV
24%
Yutong EV
8%
Jinlong
PHEV
10%
Jinlong EV
5%
BYD EV
11%
Others
PHEV
31%
Other EV
11%
By 2020, the government is targeting
electric vehicles to reach 5m.
China has long aspired to be a leader in
New Energy Vehicles.
Industrials
Initiating Coverage
2 December 2015
page 25 of 79 , Equity Analyst, +852 3743 8075, [email protected] Aik Yeo
Please see important disclosure information on pages 74 - 79 of this report.

Table 16: NEVs promotion plan in 88 demonstration cities (2013 – 2015)
District Number of Cities
2013-2015
Plan
2013-Sep 2014
(Cumulative)
% of
Completion
Zhejiang province 4 10,100 5,203 52%
Beijing 1 35,020 4,762 14%
Shenzhen 1 35,000 4,189 12%
Hefei 1 5,720 4,145 72%
Shanghai 1 10,000 4,022 40%
Jiangsu province 6 18,085 3,118 17%
Tianjin 1 12,000 1,726 14%
Zhengzhou 1 5,500 1,423 26%
Guangdong province 7 10,000 1,369 14%
Guangzhou 1 10,000 1,241 12%
Chongqing 1 10,000 995 10%
Hebei province 10 13,141 803 6%
Xi'an 1 11,000 710 6%
Xiangyang 1 5,000 561 11%
Qingdao 1 5,200 510 10%
Changzhutan 3 6,100 492 8%
Taiyuan 1 5,000 489 10%
Wuhan 1 10,500 389 4%
Chengdu 1 5,000 298 6%
Wuhu 1 5,110 252 5%
Shenyang 1 5,000 232 5%
Dalian 1 5,000 225 5%
Yunnan province 4 5,000 223 4%
Weifang 1 5,500 174 3%
Linyi 1 5,690 173 3%
Guizhou 6 6,000 166 3%
Xinxiang 1 5,000 153 3%
Fujian province 10 10,000 153 2%
Ningbo 1 5,000 119 2%
Jiangxi province 7 5,300 118 2%
Zibo 1 5,000 63 1%
Luzhou 1 5,000 48 1%
Changchun 1 10,000 33 0%
Inner Mongolia 2 5,000 25 1%
Ha'erbin 1 5,000 5 0%
Jincheng 1 6,000 3 0%
Lanzhou 1 5,000 3 0%
Liaocheng 1 5,010 3 0%
Haikou 1 5,000 0 0%
Total 88 335,976 38,616 11%
Source: MIIT, Jefferies
To accomplish these goals, the government has introduced financial incentives such as
purchase subsidies and tax incentives; non-financial incentives such as exemptions from
license-registration lotteries; and the aggressive development of NEV recharging station
infrastructure.
We discuss these policies in the sections below.
Financial incentives: Purchase subsidies to lower upfront costs
According to U.S. DOE, the initial purchase price of a vehicle is an important factor for most
consumers. In September 2013, the Ministry of Finance, Ministry of Industry and
Information Technology, NDRC and Ministry of Science and Technology introduced
national purchase subsidies of Rmb35,000-60,000 to help encourage the adoption of NEV;
vehicles equipped with longer ranges (and higher price tags) are eligible for higher
purchase subsidies. Fuel Cell PVs are eligible for a purchase subsidy of Rmb200,000.
Industrials
Initiating Coverage
2 December 2015
page 26 of 79 , Equity Analyst, +852 3743 8075, [email protected] Aik Yeo
Please see important disclosure information on pages 74 - 79 of this report.

Vehicles must be included in the Ministry of Industry and Information (MIIT) catalogue to
qualify for the national purchase subsidy; the Ministry of Finance is responsible for paying
purchase subsidies to manufacturers on a quarterly basis. Since 2009, the MIIT has
approved 75 batches of vehicles, or 183 passenger vehicles in total. Currently, only vehicles
produced by domestic OEMs or JVs have been included in the catalogue. Despite Tesla’s
global recognition and popularity, it has yet to be included in the MITT catalogue.
We summarize the national purchase subsidy in the table below.
Table 17: National Purchase Subsidies for New Energy Vehicles
Note: R stands for the range of the passenger vehicle. The range was changed from 80
km ≤ R ≤ 150 km to 100 km ≤ R ≤ 150 km beginning 2016.
Source: MOF, NDRC, MIIT, MOST, Jefferies
The purchase of NEV buses likewise benefits from purchase subsidy of Rmb250,000-
500,000 (see Table 180). For NEV buses, the length of the bus is the determining factor in
the amount of the purchase subsidy.
The national purchase subsidies were lowered by a total of 10% in 2014 and 2015.
Originally, the government proposed lowering the national purchase subsidy by 10% each
year but later relented. In April 2015, Ministry of Finance, Ministry of Industry and
Information Technology, National Development and Reform Commission and Ministry of
Science and Technology published new purchase subsidies. Most of the PV purchase
subsidies were lower than the previous purchase subsidies. The purchase subsidies in 2017
and 2018 will be 20% lower than the 2016 benchmark. The purchase subsidies in 2019 and
2020 will be 40% lower than 2016 levels.
Chart 30: Declining Purchasing Subsidies for BEV PV
Source: MOF, NDRC, MIIT, MOST, Jefferies
Chart 31: Declining Purchasing Subsidies for PHEV PV
Source: MOF, NDRC, MIIT, MOST, Jefferies
Likewise, the purchase subsidies for NEV buses are being reconfigured. Previously, bus
subsidies were determined according to the length of the bus. BEV Bus purchase subsidies
will be determined according to Ekg, (Electric energy per kilometre and kilogram), and
battery driving range. PHEV bus purchase subsidies will be determined according to the
range and the length of bus. We summarize the new purchase scheme effective 2016 in the
table below. In 2017, the purchases subsidies will decline by 20% from 2016 levels. In
2019, the purchase subsidies will decline by 40% from 2016 levels.
Rmb('000) 2013 2014 2015 2016 2017 2018 2019 2020
Passenger Vehicle
BEV (80 km ≤ R < 150 km) 35.0 33.3 31.5 25.0 20.0 20.0 15.0 15.0
BEV (150 km ≤ R < 250km) 50.0 47.5 45.0 45.0 36.0 36.0 27.0 27.0
BEV (R ≥ 250 km) 60.0 57.0 54.0 55.0 44.0 44.0 33.0 33.0
PHEV (R ≥ 50 km) 35.0 33.3 31.5 30.0 24.0 24.0 18.0 18.0
Fuel Cell Passenger Vehicle 200.0 190.0 180.0 200.0 200.0 200.0 200.0 200.0
0
10
20
30
40
50
60
70
20
13
20
14
20
15
20
16
20
17
20
18
20
19
20
20
Rmb (000's)
80 km ≤ R < 150 km
150 km ≤ R < 250km
R ≥ 250 km
15
20
25
30
35
40
20
13
20
14
20
15
20
16
20
17
20
18
20
19
20
20
Rmb (000's)
Purchase Subsidies for PHEV
Table 18: National Purchase Subsidies
Source: MOF, NDRC, MIIT, MOST, Jefferies
Local governments will continue to
subsidize NEVs in the coming years.
In Beijing, the local subsidy will be
the same level as national subsidy for
BEV Bus until Dec 31th 2017.
Industrials
Initiating Coverage
2 December 2015
page 27 of 79 , Equity Analyst, +852 3743 8075, [email protected] Aik Yeo
Please see important disclosure information on pages 74 - 79 of this report.

Table 19: National Purchase Subsidies for NEV Buses, Effective 2016
Note: R stands for the range Source: MOF, Jefferies
The purchase subsidy listed in the table above refers to bus length between 10 and 12
meters (including 12 meters). For PHEV, if the length of bus is below 6 meters, the purchase
subsidy will be 0.2 for each range. If the length of bus is between 6 and 8 meters (including
8 meters), the purchase subsidy will be 0.5 for each range. If the length of bus is between 8
and 10 meters (including 10 meters), the purchase subsidy will be 0.5 for each range. If the
length of bus is greater than 10 meters or double decker bus the purchase subsidy will be
1.2 for each range. For BEV, the subsidy for other lengths is also referred to Ekg and Range.
Some local provincial and city governments offer an additional purchase subsidy to further
encourage NEV adoption. For example, Shenzhen offers a one-for-one local purchase
subsidy on top of the national subsidy. However, local subsidies are subject to their own
local subsidy catalogue. The local subsidy catalogue can be different from the national
subsidy catalogue, with the former often showing preference for local manufacturers.
We highlight the purchase subsidies of select cities in the table below.
Table 20: Local Purchase Subsidies for New Energy Vehicles in 2015
Note: R stands for the range of the passenger Source: Local DRC, Jefferies
On top of national and local purchase subsidies, effective Sep 2014, the purchase of NEVs is
exempt from the 10% vehicle purchase tax. The tax exemption is scheduled to expire at
end 2017. Although the purchase subsidy has been limited to domestic or JV NEVs, the
vehicle purchase tax exemption includes imports as well. In the fifth batch of models,
BMW’s 1Z21 BEV and i3 1Z41 PHEV model were included.
Non-financial subsidies – Free Licenses
In addition to purchase subsidies and tax emptions, the government is using other
incentives to encourage NEV adoption. Some local governments have opted to hand out
license plates to purchasers of New Energy Vehicles. In several of China’s larger and more
congested cities, the government is using auctions and lotteries to issue new license plate
numbers. A free license plate is more valuable than the actual subsidy.
Type (Ekg,Wh/km·kg)
6 ≤ R < 20 20 ≤ R < 5050 ≤ R < 100100 ≤ R < 150150 ≤ R < 250 R ≥ 250
BEV Ekg < 0.25 220 260 300 350 420 500
0.25 ≤ Ekg < 0.35 200 240 280 320 380 460
0.35 ≤ Ekg < 0.5 180 220 240 280 340 420
0.5 ≤ Ekg < 0.6 160 180 220 250 330 360
0.6 ≤ Ekg < 0.7 120 140 160 200 240 300
PHEV NA NA 200 230 250 250
R (km)
Rmb('000) Beijing Tianjin Taiyuan Dalian Shanghai Qingdao Guangzhou Nanchang
Passenger Vehicle
BEV (80 km ≤ R < 150 km) 31.5 31.5 20.0 25.2 40.0 35.0 35.0 25.0
BEV (150 km ≤ R < 250 km) 45.0 45.0 36.0 50.0 50.0 36.0
BEV (R ≥ 250 km) 54.0 54.0 43.2 60.0 60.0 44.0
PHEV (R ≥ 50km) 31.5 25.2 30.0 35.0 35.0 24.0
Bus
BEV (6m≤L<8m) 300.0 240.0 300.0 60.0 300.0 85.0
BEV (8m≤L<10m) 400.0 320.0 400.0 80.0 400.0 110.0
BEV (L≥10m) 500.0 400.0 500.0 100.0 500.0 150.0
PHEV (L≥10m) 200.0 250.0 50.0 250.0 80.0
In addition to central and local
purchase subsidies, purchase tax is
waived for NEVs, further reducing
the purchase costs.
Industrials
Initiating Coverage
2 December 2015
page 28 of 79 , Equity Analyst, +852 3743 8075, [email protected] Aik Yeo
Please see important disclosure information on pages 74 - 79 of this report.
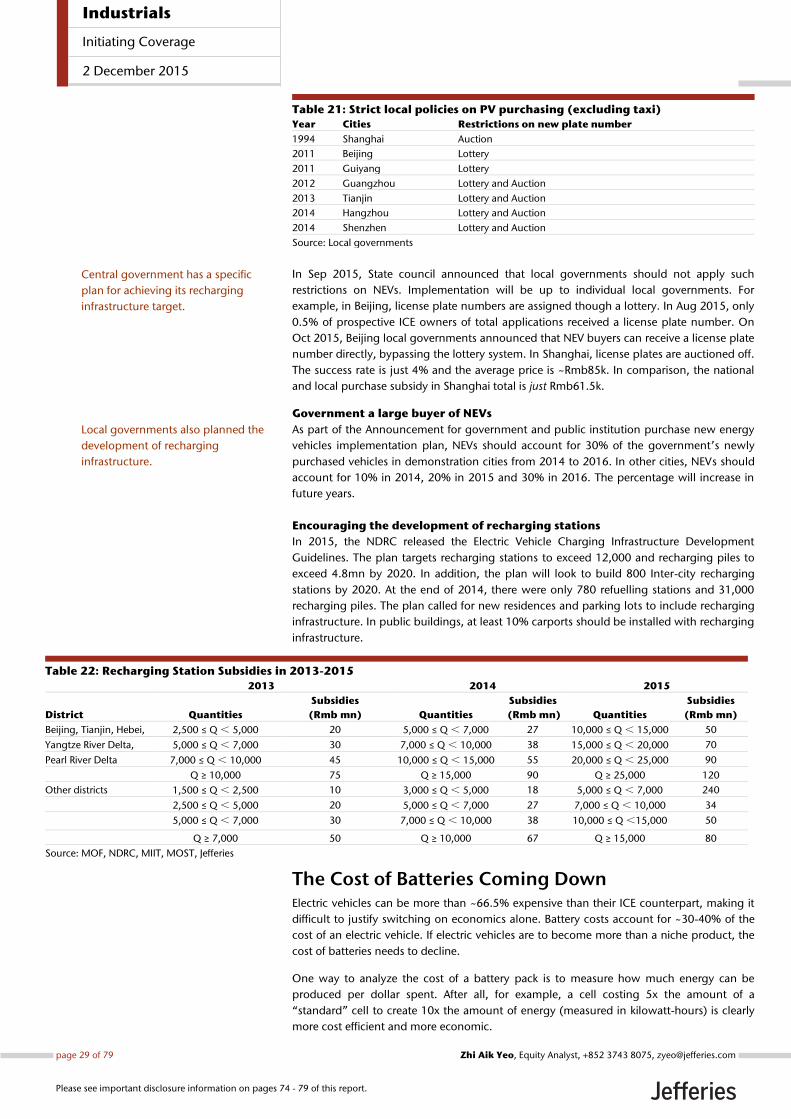
Table 21: Strict local policies on PV purchasing (excluding taxi)
Year Cities Restrictions on new plate number
1994 Shanghai Auction
2011 Beijing Lottery
2011 Guiyang Lottery
2012 Guangzhou Lottery and Auction
2013 Tianjin Lottery and Auction
2014 Hangzhou Lottery and Auction
2014 Shenzhen Lottery and Auction
Source: Local governments
In Sep 2015, State council announced that local governments should not apply such
restrictions on NEVs. Implementation will be up to individual local governments. For
example, in Beijing, license plate numbers are assigned though a lottery. In Aug 2015, only
0.5% of prospective ICE owners of total applications received a license plate number. On
Oct 2015, Beijing local governments announced that NEV buyers can receive a license plate
number directly, bypassing the lottery system. In Shanghai, license plates are auctioned off.
The success rate is just 4% and the average price is ~Rmb85k. In comparison, the national
and local purchase subsidy in Shanghai total is just Rmb61.5k.
Government a large buyer of NEVs
As part of the Announcement for government and public institution purchase new energy
vehicles implementation plan, NEVs should account for 30% of the government’s newly
purchased vehicles in demonstration cities from 2014 to 2016. In other cities, NEVs should
account for 10% in 2014, 20% in 2015 and 30% in 2016. The percentage will increase in
future years.
Encouraging the development of recharging stations
In 2015, the NDRC released the Electric Vehicle Charging Infrastructure Development
Guidelines. The plan targets recharging stations to exceed 12,000 and recharging piles to
exceed 4.8mn by 2020. In addition, the plan will look to build 800 Inter-city recharging
stations by 2020. At the end of 2014, there were only 780 refuelling stations and 31,000
recharging piles. The plan called for new residences and parking lots to include recharging
infrastructure. In public buildings, at least 10% carports should be installed with recharging
infrastructure.
Table 22: Recharging Station Subsidies in 2013-2015
2013 2014 2015
District Quantities
Subsidies
(Rmb mn) Quantities
Subsidies
(Rmb mn) Quantities
Subsidies
(Rmb mn)
Beijing, Tianjin, Hebei, 2,500 ≤ Q < 5,000 20 5,000 ≤ Q < 7,000 27 10,000 ≤ Q < 15,000 50
Yangtze River Delta, 5,000 ≤ Q < 7,000 30 7,000 ≤ Q < 10,000 38 15,000 ≤ Q < 20,000 70
Pearl River Delta 7,000 ≤ Q < 10,000 45 10,000 ≤ Q < 15,000 55 20,000 ≤ Q < 25,000 90
Q ≥ 10,000 75 Q ≥ 15,000 90 Q ≥ 25,000 120
Other districts 1,500 ≤ Q < 2,500 10 3,000 ≤ Q < 5,000 18 5,000 ≤ Q < 7,000 240
2,500 ≤ Q < 5,000 20 5,000 ≤ Q < 7,000 27 7,000 ≤ Q < 10,000 34
5,000 ≤ Q < 7,000 30 7,000 ≤ Q < 10,000 38 10,000 ≤ Q <15,000 50
Q ≥ 7,000 50 Q ≥ 10,000 67 Q ≥ 15,000 80
Source: MOF, NDRC, MIIT, MOST, Jefferies
The Cost of Batteries Coming Down Electric vehicles can be more than ~66.5% expensive than their ICE counterpart, making it
difficult to justify switching on economics alone. Battery costs account for ~30-40% of the
cost of an electric vehicle. If electric vehicles are to become more than a niche product, the
cost of batteries needs to decline.
One way to analyze the cost of a battery pack is to measure how much energy can be
produced per dollar spent. After all, for example, a cell costing 5x the amount of a
“standard” cell to create 10x the amount of energy (measured in kilowatt-hours) is clearly
more cost efficient and more economic.
Local governments also planned the
development of recharging
infrastructure.
Central government has a specific
plan for achieving its recharging
infrastructure target.
Industrials
Initiating Coverage
2 December 2015
page 29 of 79 , Equity Analyst, +852 3743 8075, [email protected] Aik Yeo
Please see important disclosure information on pages 74 - 79 of this report.

Experience Curve helping to drive battery costs lower
Battery costs have already declined considerably. According to one study published in
Nature Climate Change in March 2015, Renault-Nissan and Tesla Motor battery costs have
already reached ~US$300/kWh. We believe Tesla Motor’s battery packs may be as low as
US$250/kWh. The learning rate of battery packs was observed to be 6-9% from 2007 to 2014.
Admittedly, not as large a decline as Swanson’s Law seen in solar; Richard Swanson observed
that module prices declined by 20% for every doubling of cumulative volume shipped.
What is the experience curve?
Bruce Henderson of Boston Consulting Group is credited for coining the term, the
experience curve. The experience curve, not to be confused with Moore’s Law, postulates
that learning, specialization, investment and scale leads “costs [to] decline by some
characteristic amount each time accumulated experience is doubled.” The experience curve
is often steeper in new, fast growing industries.
Labor costs should decline as the labor force become more experienced and specialized. As
an industry grows, more new production capacity is added. The incremental capital cost is
typically less than the increase in production, contributing to lower production costs. The
increased scale will also allow for greater specialization. An increase in production unit size
can lead to lower incremental capital costs and a steeper experience curve. Automation will
also contribute to scale and lower costs.
DOE setting stretch goals for 2022
The US Department of Energy (DOE)’s EV Everywhere program is targeting to reduce the
production costs, the size and weight of electric batteries. The program’s stretch goal is for
battery costs to reach US$125/kWh by 2022. Combined with the lowering the weight of
vehicles and costs of electric drive systems, the all-in cost of an electric vehicle with a 280-
mile range will be similar to a comparable ICE vehicle. Link
Skeptics argue we have already reached the limits of the experience curve
The experience curve does eventually plateau. Skeptics highlight this inevitability to argue
that, barring significant advancements in battery chemistry, lithium ion batteries are
unlikely to reach US$125/kWh in the medium term. We believe this is premature.
The battery industry is far from new and lithium-based based batteries have been
commercially available since 1991. However, the application of lithium-ion batteries in
electric vehicles is a recent event and we have not yet seen the production of lithium ion
batteries at this scale. More specifically, we believe as the production of lithium-ion
increases we can see improvements in the manufacturing process, including:
Yield. Factory yields are dependent on experience curves and employees being
able to identify and fix production process or component quality or handling issues.
Materials. Materials costs do not currently benefit from volume discounts since
the amounts ordered are for relatively small production volumes. Shifting to
higher volumes for pre-manufactured products could drop costs by multiples of
current levels, while purchasing raw materials on an exponentially larger scale
should also drive cost economies.
Efficiency and speed of throughput refers mostly to the ability to shorten the
amount of time the cell materials spend in the coating machines, thereby
increasing the throughput and lowering the capex per unit. Today coating
machines are among the most expensive machines, the most difficult to order
(from a lead time perspective) and the source of the biggest bottleneck.
Experience in other industrial manufacturing processes using the same coaters has
shown that rated speeds can often be exceeded.
Over-engineering. In some cases, the battery pack may be over-engineered,
especially for vehicle applications where safety and reliability are paramount.
Redesigning battery packs to use fewer materials (in the wiring, casing, etc.) and
lower cost materials without compromising quality or safety could reduce module
costs by possibly more than half.
In the next section, we will discuss how Tesla and other companies may be able to realize
lower battery costs in the medium term.
A battery cost of US$125/kWh, lighter
vehicles and a cheaper electric drive system
would make a 280-mile range EV
competitive with ICE vehicles
“Price and cost data show that costs decline
by some characteristic amount each time
accumulated experience is doubled.”
- Bruce Henderson of BCG
Industrials
Initiating Coverage
2 December 2015
page 30 of 79 , Equity Analyst, +852 3743 8075, [email protected] Aik Yeo
Please see important disclosure information on pages 74 - 79 of this report.

Tesla and the GigaFactory raising the bar At an estimated battery cost of US$250/kWh, Tesla has already set the bar quite high for
industry leaders. In breaking with industry norms at the time, Tesla used commodity
lithium ion battery cells and relied on engineer and manufacturing improvements to arrive
at lower battery costs. Tesla’s battery packs use 18650 format lithium ion cells, the same
type of cells found in laptop batteries and other consumer electronics. These cells are
manufactured in high volume and have a relatively low cost of $250/kWh.
Driving costs down to US$125/kWh
We believe Tesla can lower its battery costs from an estimated US$250/kWh to
US$125/kWh in 2020, exceeding the expectations of the DOE’s EV Everywhere report. The
battery costs can be divided into two categories: cell-level costs and pack-level costs.
Currently, we estimate the Tesla battery’s cell-level costs to account for ~50%, or about
$125/kWh, of all-in battery pack cost.
More specifically, we believe there are additional cost savings that could come from:
Cell architecture changes;
Economies of scale;
Supply chain optimization;
Increased automation; and
Domestication of production
Exhibit 1: Tesla Battery Costs Falling to US$125/kWh
Source: Jefferies estimates
Tesla’s First Gigafactory to further drive down the costs
Tesla’s Gigafactory will be a major factor in the company’s plans to lower battery costs. By
2020, the Gigafactory is expected to reach a production capacity of 35GW of cells and
50GWh of battery packs in 2020, producing enough battery packs for 500,000 EVs. The
company will need to source 15GWh of cells externally. The Gigafactory has already started
construction in 2014 in Nevada and is expected to start producing cells in 2016.
The company believes the Gigafactory will help the company reduce the cost of its battery
packs by more than 30% in the first year of production of the Model 3. We believe the
Gigafactory can potentially lower battery costs through economies of scale; supply chain
optimization; increased automation; and domestication of production.
0
50
100
150
200
250
300
To
tal
Bat
tery
Co
sts
Cath
od
e
An
od
e
Rep
laci
ng
ele
ctro
lyte
s
an
d e
limin
ati
ng
sep
era
tor
Oth
er
com
po
net
cost
red
uct
ion
s
Elect
rod
e S
olv
en
t D
ryin
g
& R
eco
very
Batt
ery
Co
sts
Qu
alit
y c
on
tro
l te
stin
g
Pack
fra
me,
har
dw
are
, &
circ
uit
ry
Cell
& p
ack-
level la
bo
r
Dep
reci
ati
on
Warr
an
ty &
oth
er
Futu
re B
atte
ry C
ost
US$/kWh
~30% of cost savings
~70% of cost savings
Industrials
Initiating Coverage
2 December 2015
page 31 of 79 , Equity Analyst, +852 3743 8075, [email protected] Aik Yeo
Please see important disclosure information on pages 74 - 79 of this report.

Gigafactory to bring down pack-level costs
We expect pack-level costs to be reduced by an even greater magnitude, driven in large
part by the Gigafactory, which is expected to boost Tesla’s potential output from ~4 GWh
annually currently (i.e., 50K vehicles in 2015 at 85kWh each) to ~50 GWh. The Gigafactory
will bring advantages from scale, optimization of supply chain, increased automation, and
perhaps most importantly, domestication of production.
Tesla’s batteries (through Panasonic) are produced on Japanese soil, one of the most
expensive places to have a manufacturing plant in the world. Having the Gigafactory in
Nevada will bring about massive cost reductions, from factors such as the lower price of
electricity to put on the lights in the factory compared to Japan to the elimination of
shipping fees to bring cells to California from Japan.
Overall, we believe that the costs of quality control testing, pack frame, hardware &
circuitry, cell & pack-level labor, and warranty & other will all decrease by ~75% as a result
of the Gigafactory and greater scale. For depreciation, we stay anchored to Tesla’s 9% of
COGS, to yield a 50% cost reduction (in line with the reduction from $250/kWh to
$125/kWh for the overall battery pack).
Cell Architecture Changes to Drive 30% of the Cost Reduction
We believe Tesla can reduce cell-level costs by at least 30%, which implies a reduction from
the current cell-level cost of ~$125/kWh to ~$88/kWh. The most important components
that will reduce the overall cost are the cathode, anode, electrolyte, and electrode solvent.
In slightly more detail:
Replacement of current nickel cobalt aluminum (NCA) cathode with a more
efficient (i.e. higher capacity and higher voltage) lithium-rich nickel cobalt
manganese (LR-NCM) cathode.
Increase in the percentage of silicon in the synthetic graphene anode from 4-5%
currently to 8-10%, which increases anode lithium storage capacity and allows for
a ~20% smaller anode.
Replacement of liquid electrolyte with ionic gel eliminates the need for a
separator.
Replacement of the NMP-based electrode solvent used for the cathode with a
water-based electrode solvent, which reduces the overall electrode solvent
material cost and eliminates the electrode solvent recovery process.
Industrials
Initiating Coverage
2 December 2015
page 32 of 79 , Equity Analyst, +852 3743 8075, [email protected] Aik Yeo
Please see important disclosure information on pages 74 - 79 of this report.

Zhengzhou Yutong Bus (600066 CH) –
Initiate at Buy Yutong will continue to benefit from product mix improvement and economies
of scale, as the policy environment remains favourable. In our view, consensus
has been overly cautious on subsidy cut – we believe Yutong can offset it by
passing it on to customers and lowering the cost of production. With a steady
dividend yield and superior products, Yutong is a Buy.
Continued mix improvement, economies of scale. Various supportive policies from
the Chinese government to promote new energy buses are expected to filter through to the
sector growth. These include i) requirement that 30% of government new vehicle
purchases should be NEV ii) exemption of vehicle purchasing tax for NEVs iii) generous cash
subsidy for new energy bus purchases (Rmb300-500k per unit) iv) extensive build out of
charging facilities v) retirement of yellow label vehicles. Although the conventional bus
market is expected to be down marginally, NEV strength is expected to offset the weakness
through mix improvement and NEV margin expansion. We expect Yutong to experience
55%/36% NEV volume growth in FY16/17, respectively.
Align with the market leader with superior products. As the largest NEV bus
manufacturer in China, Yutong has 10% of overall bus market and 32% of NEV bus market
in 2014. The company is the only electric bus manufacturer in China that has managed to
break through local protectionism and penetrate into other regions. Note that Yutong sold
over 70% of its electric buses to cities outside its home region. That is due to its strong
technological edge and competitive pricing. Yutong boasts superiority with regard to: i)
safety ii) reliability iii) fuel efficiency. In addition, Yutong electric buses are 10-20% lighter
than competing models, given better design and engineering. Due to the lighter weight
and more advanced control electronics, Yutong electric buses are also more fuel efficient
than others.
Expect margin improvement. Industry EV battery cost is expected to drop sharply,
according to our forecast, refer to page 33. This could help lower Yutong’s production cost
as the company outsources its battery. We believe battery cost could decline by more than
10% each year. Currently Yutong sources batteries from ATL and will also source from
Samsung SDI going forward. EV batteries account for ~50% of EV bus COGS. Despite the
gradual reduction of government subsidy, we believe the GPM of its NEV buses can be
sustained in the next few years, offset by battery cost decline. Overall, we expect gross
margin improvement to 24.6%/25.0% in FY16/17 respectively from 24.6% in FY15. This is
despite an expected decline in government subsidy in the next 2 years. Specifically, we
expect NEV bus to see 3%/11% price pressure in FY16/17; however, Yutong will seek to
pass it on to customers, who are mainly local governments/corporates and not as sensitive
on price.
High dividend pay-out and yield. Yutong’s 56% dividend payout in FY14 is the highest
among Chinese auto OEMs and we expect its high payout ratio to be maintained into
2015/16E, as cash position remains strong. Yutong was Rmb5.7bn net cash at the end of
1H15. Free cash flow of Rmb1.3bn at end FY14 is expected to be maintained in FY15-17,
despite decline in government subsidy. The company promised at least 45% payout for
FY15 and 16, but we expect the payout ratio to stay above 50%. Thus dividend yield would
translate to 4% FY15E.
Valuation/Risks
Our SOTP-based price target is at HK$26.0, implying 13x 2017e P/E (+1 S.D of its historical
forward P/E range). Risks include unfavourable policy shift by the government, and bigger
than expected slowdown at the conventional vehicle business.
Table 23: 600066 CH Yutong
Market Data
52 Week Range Rmb12.1 - Rmb24.8
Total Entprs. Value (Rmb M): 42,321.0
Market Cap. (Rmb M): 45,585.0
Share Out. (M): 2,216.0
Float (M): 1,076.5
Avg. Daily Vol. (M): 17.4
Source: Bloomberg as of Nov 27 2015
Chart 32: Yutong Price Performance
Source: Bloomberg as of Nov 27 2015
Industrials
Initiating Coverage
2 December 2015
page 33 of 79 , Equity Analyst, +852 3743 8075, [email protected] Aik Yeo
Please see important disclosure information on pages 74 - 79 of this report.

Company Background Zhengzhou Yutong is principally engaged in the manufacture and sale of buses. The
company’s main product portfolio consists of new energy passenger buses, school
coaches, enterprise shuttle buses, caravans, motor homes, sightseeing buses, urban buses
as well as customized passenger buses, among others. It has the largest market share of
large and medium size buses in China and is a market leader for NEV buses. It also provides
ground passenger transportation services. Yutong sells buses domestically and overseas. In
2014, c.16% of its revenue was generated from markets outside mainland China.
Chart 33: Yutong net profit summary (Rmb mn)
Source: Jefferies, company data
Chart 34: Yutong market share summary
Source: Jefferies, company data
Management and Shareholders Mr. Tang Yuxiang is the president and major shareholder. He was selected by Forbes in
2009 as among the best CEOs of China’s listed companies, based on Yutong’s excellent
ability to generate returns for investors. He is a veteran of the firm, having joined Yutong
back in 1981 and gradually risen to the management level. He was made chairman in 2001.
Tang, together with other partners of Yutong Group, holds c. 41% of Yutong Listco.
Mr. Liu Chunzhi has been serving as Chief Financial Officer in Yutong Bus since 2012. He
has held various roles with GE China, GE Energy and GE Infrastructure, and Haier.
Mr. Niu Bo is General Manager and Director in Zhengzhou Yutong Bus Co Ltd. He has a
bachelor’s degree in auto design and joined the company in 1997 as a designer. He worked
in various roles within the firm and became deputy general manager in 2008. He was made
general manager in 2010.
Earnings Estimates FY 16
We forecast FY16 revenue to grow 16% to Rmb35.6bn. NEV bus revenue is expected to be
the key driver, growing 64% to Rmb13.6bn.
Gross margin is expected to increase to 24.6% from 24.1% (FY15E) thanks to higher
product mix of NEV. Operating margin is expected to increase slightly to 13.3%.
FY16 profit is expected at Rmb4.0bn, growing 22%.
FY 16 other key assumptions
- NEV bus volume grows 55% to 25,900 units, 33% of total bus sold
- Conventional buses volume declines 3% to 51,000 units
860
1,181
1,550
2,263
2,613
946
156 202
494 637
1,477
0.0
500.0
1,000.0
1,500.0
2,000.0
2,500.0
3,000.0
2010 2011 2012 2013 2014 1H15
Net profit Dividend Payout
11.2%
11.6%
12.1%
11.8%
11.6%
12.0%
10.6%
10.8%
11.0%
11.2%
11.4%
11.6%
11.8%
12.0%
12.2%
12.4%
0.0
10,000.0
20,000.0
30,000.0
40,000.0
50,000.0
60,000.0
70,000.0
2010 2011 2012 2013 2014 9M15
Volume Market Share
Industrials
Initiating Coverage
2 December 2015
page 34 of 79 , Equity Analyst, +852 3743 8075, [email protected] Aik Yeo
Please see important disclosure information on pages 74 - 79 of this report.

FY 17
We forecast FY17 sales to grow 11%, as NEV bus subsidy experiences a steeper decline and
upon 2016’s larger base. Overall bus volume is expected to grow 8%. ASP slightly increases
by 2% due to a higher mix of NEV buses. Gross margin is expected to remain flattish at 25%
due to higher mix towards NEV.
Operating margin is expected to be 13.6%, thanks to larger scale and better mix. 2017
earnings growth is expected to be 13%.
FY 17 other key assumptions
- NEV bus volume grows 36% to 35,000 units, 42% of total bus sold
- Conventional buses’ volume further declines 6% to 48,000 units
Table 24: Yutong Volume Assumptions
2014A 2015E y/y 2016E y/y 2017E y/y
Bus Sales Volume 61,398 69,543 13% 77,242 11% 83,457 8%
ICE Bus 53,993 52,882 -2% 51,370 -3% 48,145 -6%
Large 21,386 21,904 2% 19,264 -12% 16,848 -13%
Medium 24,487 24,986 2% 25,616 3% 25,978 1%
Small 8,120 5,992 -26% 6,490 8% 5,319 -18%
NEV Bus 7,405 16,661 125% 25,873 55% 35,312 36%
Large 6,012 6,179 3% 10,504 70% 14,706 40%
Medium 1,393 3,483 150% 6,269 80% 8,776 40%
Small - 7,000 9,100 30% 11,830 30%
Source: Jefferies estimates, company data
Table 25: Yutong Financial Forecasts and Key Assumptions
Rmb mn 2014 2015 2016 2017
Operating Revenue 25,728 30,626 35,565 39,383
Less: Business tax and surcharges 155 184 213 236
COGS (19,481) (23,104) (26,640) (29,378)
Gross profit 6,092 7,338 8,712 9,769
GPM% 23.8% 24.1% 24.6% 25.0%
SG&A (2,970) (3,470) (3,995) (4,463)
Operating Profit (Loss) 3,122 3,867 4,717 5,306
Operating Profit Margin 12.2% 12.7% 13.3% 13.6%
Finance cost 25 0 7 14
Net Profit Before Tax 3,051 3,825 4,682 5,278
Income Tax Expense (398) (497) (609) (686)
Net profit 2,653 3,327 4,073 4,592
Minorities (40) (50) (61) (69)
Net profit to shareholder 2,613 3,277 4,012 4,522
EPS 1.77 1.48 1.81 2.04
Source: Jefferies estimates, company data
Industrials
Initiating Coverage
2 December 2015
page 35 of 79 , Equity Analyst, +852 3743 8075, [email protected] Aik Yeo
Please see important disclosure information on pages 74 - 79 of this report.

Valuation We initiate on Yutong with a ‘Buy’ rating and a target price of Rmb26.0, based on 2x 2017
NEV EV/Sales and a 10x traditional business PER. We use 2X EV/Sales multiple, lower than
that of BYD due to Yutong’s lack of core battery technology. This yields a PEG ratio of 0.9.
However, due to the company’s size, it currently commands 80% of its key supplier—ATL’s
battery production, which gives it strong negotiation power in sourcing batteries. The 10X
PER for traditional business is in line with 2017 PER for heavy duty truck sector, a sector
expected to see further declining demand.
This implies 13x 17E PER for the whole company. This is an attractive multiple, especially
given Yutong’s ability to consistently achieve industry high profit margin. We appreciate its
leading position as a NEV bus manufacturer and ability to gain market share as the sector
matures. We also expect the stock to generate 15E dividend yield of 4%.
Table 26: Yutong sum of the parts (SOTP) valuation (mn Rmb)
EV/Sales 2017e Sales Multiples Value 2017e Net Debt Market Cap %
NEV segment 18,173 2x 36,347 (3,676.25) 40,023 69%
P/E 2017e Net Profit Multiples Value Market Cap
Conventional bus and other business 1,803 10x 18,028 - 18,028 31%
Total 58,051
TP Rmb 26. 0
Source: Jefferies estimates, company data
Risks NEV market demand is highly sensitive to government subsidy. Unfavourable policies could
impact the company’s sales and earnings. Yutong also faces more competition from smaller
market players in NEV space, supported by the generous subsidy and local government
protectionism. The competition and expansion bottleneck could impact Yutong’s product
pricing and margin. The bus sector is also sensitive to China’s and global economic growth;
a slowdown could also impact Yutong’s revenue and earnings.
Chart 35: Yutong forward PER range
Source: Factset
-1 sdv, 9.40
+1 sdv, 12.28
Average, 10.84
6.00
7.00
8.00
9.00
10.00
11.00
12.00
13.00
14.00
15.00
16.00
11
/20
11
1/2
01
2
3/2
01
2
5/2
01
2
7/2
01
2
9/2
01
2
11
/20
12
1/2
01
3
3/2
01
3
5/2
01
3
7/2
01
3
9/2
01
3
11
/20
13
1/2
01
4
3/2
01
4
5/2
01
4
7/2
01
4
9/2
01
4
11
/20
14
1/2
01
5
3/2
01
5
5/2
01
5
7/2
01
5
9/2
01
5
11
/20
15
PE -1 sdv +1 sdv Average
Industrials
Initiating Coverage
2 December 2015
page 36 of 79 , Equity Analyst, +852 3743 8075, [email protected] Aik Yeo
Please see important disclosure information on pages 74 - 79 of this report.

Chart 36: Yutong forward PBR range
Source: Factset
Chart 37: Yutong forward EV/Sales range
Source: Bloomberg
Discounted cash flow (DCF) valuation We also use DCF analysis to cross-check the valuation for Yutong, which yields a valuation
of Rmb32 based on WACC of 8.4%. This is higher than the RMB26 generated by SOTP
method.
Cash flow forecast
Cash flow for our forecast period of 2015-2017 is based on what we have outlined in the
section Financial Forecasts and Key Assumptions.
Yutong has run a successful and relatively steady business with strong cash generation
ability, which we expect to continue in our DCF analysis. Its capex has been controlled and
there is no near term capacity expansion plan. Thus we expect
-1 sdv, 1.86
+1 sdv, 3.00
Average, 2.43
1.00
1.50
2.00
2.50
3.00
3.50
4.00
11
/20
11
1/2
01
2
3/2
01
2
5/2
01
2
7/2
01
2
9/2
01
2
11
/20
12
1/2
01
3
3/2
01
3
5/2
01
3
7/2
01
3
9/2
01
3
11
/20
13
1/2
01
4
3/2
01
4
5/2
01
4
7/2
01
4
9/2
01
4
11
/20
14
1/2
01
5
3/2
01
5
5/2
01
5
7/2
01
5
9/2
01
5
11
/20
15
PB -1 sdv +1 sdv Average
0.0
0.2
0.4
0.6
0.8
1.0
1.2
1.4
1.6
1.8
2.0
EV/Sales Average +1 STD -1 STD
+1 SDV 1.3
-1 SDV 0.6
Average, 0.9
Industrials
Initiating Coverage
2 December 2015
page 37 of 79 , Equity Analyst, +852 3743 8075, [email protected] Aik Yeo
Please see important disclosure information on pages 74 - 79 of this report.

Top-line growth would slow significantly after 2017 as NEV volume growth slows with
steeper subsidy cut
NEV margin will start declining after 2018 as subsidy declines. Traditional bus margin
will decline after 2016 due to shrinking volume.
The company’s depreciation and working capital changes would remain in a relatively
small range as it did historically.
WACC
Our base case assumption for Yutong is 8.4%, based on the following:
The equity risk premium (ERP) is based on our strategy team’s view of ERP in China.
The risk-free rate is based on China’s 10-year bond yield
Beta used is Yutong’s historical beta. Its share has lower volatility than the general
market
We estimate the firm’s borrowing cost is low at 4.5%
Target debt to capital ratio is assumed to be 10%. The company has net cash position
historically but a moderate leverage will let it utilize its capital even more effectively.
Terminal value
We assume the free cash flow’s terminal growth rate to be around 0% after 2025. As the
Chinese economy reaches a more mature state in the long term, no growth is possible,
similar to what has been seen in other mature markets.
Industrials
Initiating Coverage
2 December 2015
page 38 of 79 , Equity Analyst, +852 3743 8075, [email protected] Aik Yeo
Please see important disclosure information on pages 74 - 79 of this report.

Chart 38: DCF for Yutong
Source: Jefferies estimates, company data
2014A 2015E 2016E 2017E 2018E 2019E 2020E 2021E 2022E 2023E 2024E 2025E
Total Revenue 25,728 30,626 35,565 39,383 40,977 41,687 42,510 43,371 43,800 44,695 45,149 46,079
NEV Bus Sales 4,795 8,292 13,613 18,173 18,750 18,988 19,782 20,404 21,047 21,710 22,394 23,100
ICE Bus Sales 19,181 20,436 19,749 18,770 19,688 20,117 20,095 20,280 20,040 20,216 19,959 20,125
Others 1,752 1,897 2,203 2,440 2,539 2,583 2,634 2,687 2,713 2,769 2,797 2,855
Total Units 61,398 69,543 77,242 83,457 89,061 92,644 93,907 95,873 97,217 99,279 100,709 102,875
NEV Units 7,405 16,661 25,873 35,312 38,108 40,013 41,350 42,733 44,162 45,641 47,170 48,751
ICE Volume 53,993 52,882 51,370 48,145 50,954 52,631 52,557 53,140 53,054 53,638 53,539 54,123
Total Gross Margin 24.3% 24.6% 25.1% 25.4% 25.1% 24.7% 24.7% 24.8% 24.8% 24.8% 24.9% 24.9%
NEV 27.0% 27.0% 27.5% 28.0% 28.0% 27.0% 27.0% 27.0% 27.0% 27.0% 27.0% 27.0%
ICE 23.5% 23.5% 23.5% 23.0% 22.5% 22.5% 22.5% 22.5% 22.5% 22.5% 22.5% 22.5%
Total GP 6,247 7,521 8,925 10,005 10,306 10,291 10,515 10,739 10,867 11,099 11,233 11,475
NEV 1,292 2,235 3,744 5,089 5,250 5,127 5,341 5,509 5,683 5,862 6,046 6,237
ICE 4,511 4,807 4,645 4,321 4,434 4,530 4,525 4,567 4,513 4,553 4,495 4,532
EBIT 3,122 3,867 4,717 5,306 5,316 5,408 5,515 5,627 5,682 5,799 5,857 5,978
EBIT Margin 12.1% 12.6% 13.3% 13.5% 13.0% 13.0% 13.0% 13.0% 13.0% 13.0% 13.0% 13.0%
NOPAT 2,654 3,287 4,010 4,510 4,519 4,597 4,688 4,783 4,830 4,929 4,979 5,081
Tax Rate 15.0% 15.0% 15.0% 15.0% 15.0% 15.0% 15.0% 15.0% 15.0% 15.0% 15.0% 15.0%
+ D&A 662 861 969 1,047 1,049 1,025 1,045 1,067 1,077 1,099 1,110 1,133
2.6% 2.8% 2.7% 2.7% 2.6% 2.5% 2.5% 2.5% 2.5% 2.5% 2.5% 2.5%
+ Chg. In Working Capital 548 (234) (1,620) (859) - 834 1,700 1,735 1,752 1,788 1,806 1,843
2.1% -8.0% -3.0% -4.0% 0.0% 2.0% 4.0% 4.0% 4.0% 4.0% 4.0% 4.0%
- CapEx 1,919 1,436 1,385 1,746 1,816 1,848 1,884 1,922 1,941 1,981 2,001 2,042
7.5% 4.7% 3.9% 4.4% 4.4% 4.4% 4.4% 4.4% 4.4% 4.4% 4.4% 4.4%
FCFF 1,944 2,479 1,974 2,953 3,751 4,608 5,550 5,662 5,718 5,835 5,894 6,015
27.5% -20.4% 49.6% 27.0% 22.8% 20.4% 2.0% 1.0% 2.0% 1.0% 2.1%
Assumptions Growth Rate
WACC 8.4% 32 -1.0% -0.5% 0.0% 0.5% 1.0%
NPV FCFF 31,864 6.4% 39 40 42 44 46
Terminal Growth Rate 0% 7.4% 34 35 36 37 39
Terminal Value 71,294 WACC 8.4% 30 31 32 33 34
PV of Terminal Value 31,497 9.4% 27 28 29 29 30
Total Enterprise Value 63,361 10.4% 25 25 26 26 27
Terminal Value as % of EV 50%
Net Cash (as of Dec 31, 2015) 6,931
Equity Value (RMB mn) 70,292
Shares 2,216
Implied Price (RMB) 32
Industrials
Initiating Coverage
2 December 2015
page 39 of 79 , Equity Analyst, +852 3743 8075, [email protected] Aik Yeo
Please see important disclosure information on pages 74 - 79 of this report.

Chart 39: Financial Summary
Source: Jefferies, company data
Profit & Loss Cash flow
Rmb mn 2013 2014 2015E 2016E 2017E Rmb mn 2013 2014 2015E 2016E 2017E
Revenue 22,198 25,728 30,626 35,565 39,383 Net Profit 2,291 2,653 3,327 4,073 4,592
% change YoY 12.3% 15.9% 19.0% 16.1% 10.7% Depreciation 643 662 861 969 1,047
Gross Profit 4,980 6,092 7,338 8,712 9,769 Working Capital Chg 1,460 548 -234 -1,620 -859
Gross margin 22.4% 23.7% 24.0% 24.5% 24.8% Others -1,592 -656 0 0 0
EBITDA 3,016 3,783 4,729 5,686 6,354 Operating Cash Flow 2,802 3,205 3,955 3,422 4,780
EBITDA margin 13.6% 14.7% 15.4% 16.0% 16.1%
Operating Profit 2,372 3,122 3,867 4,717 5,306 Capital Expenditure -1,165 -1,919 -1,436 -1,385 -1,746
Operating margin 10.7% 12.1% 12.6% 13.3% 13.5% Others 807 -536 0 0 0
Net Int expense 3 25 0 7 14 Investing Cash Flow -153 -1,714 -1,536 -1,285 -1,846
LT inv. Income 36 98 98 98 98
Other Income/expense 207 -194 -141 -141 -141 Debt Raised -285 -195 144 138 175
Earnings before tax 2,618 3,051 3,825 4,682 5,278 Equity Raised 47 34 0 0 0
Tax -328 -398 -497 -609 -686 Dividends Paid -932 -922 -1,500 -1,830 -2,206
as % of EBT 12.5% 13.1% 13.0% 13.0% 13.0% Financing Cash Flow -1,186 -1,177 -1,356 -1,692 -2,032
Net profit after Tax 2,291 2,653 3,327 4,073 4,592
Net profit to shareholder 2,263 2,613 3,277 4,012 4,522 Beginning Cash 2,988 4,450 4,784 5,846 6,292
Share outstanding 1,274 1,477 2,216 2,216 2,216 Ending Cash 4,450 4,784 5,846 6,292 7,195
EPS - Reported 1.53 1.77 1.48 1.81 2.04
% change YoY -33.8% 15.6% -16.4% 22.4% 12.7% DPS (Rmb) 0.50 1.00 0.81 1.00 1.12
Balance sheet Ratio Analysis
Rmb mn 2013 2014 2015E 2016E 2017E % 2013 2014 2015E 2016E 2017E
Cash 5,613 6,016 7,075 7,521 8,423 EBITDA margin 13.6% 14.7% 15.4% 16.0% 16.1%
Fixed Assets 3,874 4,586 5,161 5,576 6,274 Operating margin 10.7% 12.1% 12.6% 13.3% 13.5%
Investment 142 0 100 0 100 Net margin 10.2% 10.2% 10.7% 11.3% 11.5%
Working Capitals -600 -1,147 -913 707 1,566 SG&A/sales -8.1% -9.9% -9.9% -11.6% -12.7%
Other Assets 1,247 2,014 2,014 2,014 2,014
Assets Employed 10,276 11,469 13,436 15,817 18,377 Revenue growth 12% 16% 19% 16% 11%
Gross profit growth 30% 22% 20% 19% 12%
Shareholders' Funds 7,315 9,478 10,804 12,582 14,763 EBITDA growth 44% 25% 25% 20% 12%
Minorities 33 56 106 168 237 Operating profit growth 32% 32% 24% 22% 12%
Short Term Debt 195 4 0 0 0 Net profit growth 46% 15% 25% 22% 13%
Long Term Debt 4 0 144 282 457
Other Liabilities 566 604 604 604 604 Net debt to equity -57% -55% -55% -48% -46%
Capital Employed 10,276 11,469 13,436 15,817 18,377 ROE 24% 24% 26% 27% 26%
ROA 14% 13% 13% 15% 16%
Total Net Debt -5,414 -6,012 -6,931 -7,238 -7,967
BVPS 7.4 7.3 5.7 6.7 7.7 PER(X) 13.9 12.0 14.3 11.7 10.4
Industrials
Initiating Coverage
2 December 2015
page 40 of 79 , Equity Analyst, +852 3743 8075, [email protected] Aik Yeo
Please see important disclosure information on pages 74 - 79 of this report.

BYD Company - H (1211 HK); Initiate at
Hold Government encouragement and economies of scale will keep BYD on a high
growth track, but we feel that this is well priced in. We believe what consensus
has failed to recognize is the risk of volume disappointment, as a result of
competition, cannibalization and more stringent requirements for getting an
NEV. Also subsidy cuts may have a bigger impact on margin than expected.
Government encouragement and EOS remains in favour. With the rapid buildout of
charging infrastructure, and continued drop in battery cost and shortened charging time,
we believe NEV could become a much more attractive proposition longer term. But near
term, it will still be driven by consumers seeking an easier way to get a new license plate, or
a free license plate. Nonetheless, we expect BYD to see 84%/21% NEV sales volume growth
in FY16/17, respectively. This is after including the reduction of government subsidy, which
should have 2%/6.5% impact on pricing in the 2 years. And on the back of economies of
scale in batteries, we still expect gross margin improvement.
Competition intensifying of late. Various OEMs have launched EV/PHEV products, or
announced plans for equity placement to expand NEV ventures. In FY15, 90 new NEV PV
models would be launched locally (excluding imported models). The total number of
models will almost double from around 93 in FY14 to 183 by end-15. PHEV models, in
which BYD competes keenly, will also increase 91% from 11 (FY14) to 21 (FY15). In 2014,
the top 10 selling NEVs were all manufactured by domestic brands, and accounted for 78%
market share. This contrasts with the conventional car market, where domestic brands
commanded 32% share in 2014, vs. 68% for JVs. What this means is many foreign brands
have yet to step into the segment, and that should change over the next couple of years.
Recent volume momentum not as strong as it seems. The market had reacted
positively to recent volume momentum on Tang PHEV SUV. Although Tang started
shipment only in June, it is currently doing better than expectation, with monthly volume
already exceeding 3,200 units in Oct. But we also observed cannibalization on the Qin
PHEV. Ever since Tang was introduced, Qin’s volume had fallen almost 50% from the peak
of above 4,000 units. This also seems to suggest the appeal of the BYD brand is not that
strong. And interestingly, anecdotal evidence suggests most existing buyers are motivated
by the free license plate, as opposed to genuinely wanting to drive an EV. This is a loop-
hole the government may seek to close in the coming months. Shanghai has started asking
buyers to show evidence of charging facilities ownership; other cities may follow suit.
High risk, high returns. For BYD, the technology risk involved is putting too much
focus on LFP technology, only recently considering a diversification to NCM. NCM should
provide greater room for cost reduction and increase in energy density vs. the LFP, in our
view. Even though company did state that NCM battery is not new to them, we have
doubts over its immediate feasibility and the cost to customize a new BMS system to fit.
However, we do recognize that BYD should be a bigger beneficiary vs. Yutong if the
demand for battery supersedes supply, which is what we have observed in the Chinese
market at present. And if BYD is able to hedge its technology risk appropriately, it should
benefit from vertical integration in the longer run, given more seamless integration with
batteries and ability to respond to market demand quicker vs. peers that outsource.
Valuation/Risks
Our SOTP-based price target is at HK$43, implying 42x 2017e PER (average of its historical
forward PER range). Risks include unfavourable policy shift by the government, and bigger
than expected losses at the conventional vehicle business.
Table 27: 1211 HK
Market Data
52 Week Range Rmb18.7 - Rmb62.3
Total Entprs. Value (HK$ M): 215,485.7
Market Cap. (HK$M): 151,980.8
Share Out. (M): 2,476.0
Float (M): 690.0
Avg. Daily Vol. (M): 7.5
Source: Bloomberg as of Nov 27 2015
Chart 40: BYD (H) Price Performance
Source: Bloomberg as of Nov 27 2015
Industrials
Initiating Coverage
2 December 2015
page 41 of 79 , Equity Analyst, +852 3743 8075, [email protected] Aik Yeo
Please see important disclosure information on pages 74 - 79 of this report.

Company Background BYD Company Limited (stock code: H Shares: 1211 HK; A Shares: 002594 CH) is principally
engaged in auto business which includes traditional fuel-engined vehicles and new energy
vehicles Other key segments include rechargeable battery and photovoltaic business,
handset components and assembly services.
The company entered automobile business in 2003 and became a pioneer in the research
and development and promotion of new energy vehicles. BYD is one of the leading
rechargeable battery manufacturers in the global arena and is a leading supplier for
handset components and assembly operations.
Chart 41: BYD Revenue Breakdown
Source: Jefferies, company data
Chart 42: BYD Net Profit Trend vs. Auto Segment
Operating Result (mn Rmb)
Source: Jefferies, company data
Management and Shareholders Mr. Wang Chuanfu is the founder, chairman and major shareholder of BYD. In 1995 he
founded Shenzhen BYD Battery Company with Lu Xiang-yang and took the position of
general manager. He led it from a small battery assembler to an NEV market leader. He has
a technical background, with a bachelor’s degree in metallurgy physical chemistry from
Central South University of Technology (currently Central South University) in 1987 and a
master’s degree in metallurgy physical chemistry from Beijing Non-Ferrous Research
Institute in the PRC in 1990. He holds around 20% of the company.
Mr. Lu Xiang-yang co- founded Shenzhen BYD Battery Company with Mr. Wang
Chuanfu. Prior to that he worked at Chaohu Centre Branch of the People’s Bank of China.
He is the Vice Chairman and a Non-Executive Director of BYD and also the chairman of
Guangzhou Youngy Management & Investment Group, a Director of Ganzi Rongda
Lithium Industry and the Vice chairman of BYD Charity Foundation. Lu is also a major
shareholder of the company.
Mr. Wu Jing-sheng Mr. Wu is a Vice President and Chief Financial Officer, and also a non-
executive director of BYD Electronic (International), a director of Shenzhen BYD Daimler
New Technology. He is also the chairman of Shenzhen BYD International Financial Leasing,
the chairman of Shenzhen BYD Electric Car Investment, vice chairman of Guangzhou
Guang Qi BYD New Energy Bus, the chairman of Shenzhen Dicheng New Energy and
chairman of BYD Charity Foundation.
10% 10% 11% 10% 9%
44% 42% 39% 39% 44%
46% 48% 51% 51% 47%
0%
20%
40%
60%
80%
100%
2010A 2011A 2012A 2013A 2014A
Automobiles and related products
Mobile handset components and assembly service
Rechargeable batteries and photovoltaic business
2523
1385
81
553 434 467
1743 1898
1058 825 758
1290
0.0
500.0
1,000.0
1,500.0
2,000.0
2,500.0
3,000.0
2010 2011 2012 2013 2014 1H15Net profit Auto Segment result
Industrials
Initiating Coverage
2 December 2015
page 42 of 79 , Equity Analyst, +852 3743 8075, [email protected] Aik Yeo
Please see important disclosure information on pages 74 - 79 of this report.

Earnings Estimates FY 16
We forecast FY16 revenue to grow 20% from Rmb62.9bn to Rmb75.2bn, driven by ‘Auto
and related products’ segment sales, expected to grow 31%. Among auto sales, NEV
revenue is expected to grow 69% to Rmb25.6bn.
Gross margin is expected to increase to 16.4% from 15.8% (FY15E) thanks to higher
margins achieved in the ‘Auto and related products’ segment and better product mix
generated from greater contribution of NEV. Correspondingly, operating margin is
expected to increase 0.6ppt to 4%.
As a result of the above, FY16 profit is expected at Rmb1.8bn, on the back of 82% core
earnings growth (excluding the one-off disposal gain in FY15).
FY 16 other key assumptions
- NEV auto volume grows 84% to 105,000 units
- Conventional vehicles’ volume declines 3% to 336,900 units
- Mobile handset segment revenue declines 5% y/y due to sale of subsidiary,
Shenzhen BYD Electronic Co.
- Rechargeable batteries and photovoltaic business revenue grows 10%.
FY 17
We forecast FY17 revenue to grow 5%, still driven by ‘Auto and related products’ segment
sales, expected to grow 18%. Facing subsidy cuts, we expect NEV sales to slow due to
lower pricing and larger base achieved in 2016.
Gross margin is expected to increase further to 16.4%, as NEV contributes a larger portion
of ‘Auto and related products’ segment sales. Correspondingly operating margin is
expected to increase 4.4%.
FY17 profit is expected to grow 18% to Rmb2.1bn.
FY 17 other key assumptions
- NEV auto volume grows 21% to 126,500 units
- Conventional vehicles volume declines 10% to 303,182 units
- Mobile handset segment revenue grows 5% y/y
- Rechargeable batteries and photovoltaic business revenue grows 10%.
Table 28: BYD auto key assumptions
2014A 2015E y/y 2016E y/y 2017E y/y
Auto Sales Volume 373,000 405,348 9% 441,838 9% 429,751 -3%
NEV 20,807 57,090 174% 104,969 84% 126,569 21%
E6 3,560 5,130 44% 6,669 30% 8,670 30%
Qin 14,747 31,000 110% 25,000 -19% 10,000 -60%
Tang - 16,000 35,200 120% 40,000 14%
Bus 2,500 4,300 72% 6,100 42% 7,195 18%
Others - 660 32,000 4748% 60,704 90%
Non-NEV 352,193 348,258 -1% 336,869 -3% 303,182 -10%
F3 110,296 128,039 16% 121,637 -5% 109,473 -10%
L3 54,531 10,484 -81% 5,242 -50% 4,194 -20%
Speed 65,312 52,217 -20% 46,995 -10% 39,946 -15%
S6 98,720 18,016 -82% 7,206 -60% 2,883 -60%
S7 6,938 98,860 1325% 69,202 -30% 62,282 -10%
Others 16,396 40,642 148% 86,586 113% 84,405 -3%
Auto ASP
NEV 348,488 265,040 -24% 243,977 -8% 239,711 -2%
ICE 54,002 55,587 3% 58,006 4% 55,391 -5%
Source: Jefferies estimates, company data
Industrials
Initiating Coverage
2 December 2015
page 43 of 79 , Equity Analyst, +852 3743 8075, [email protected] Aik Yeo
Please see important disclosure information on pages 74 - 79 of this report.

Table 29: BYD Financial Forecasts and Key Assumptions
Rmb mn 2014A 2015E 2016E 2017E
Operating Revenue 55,366 62,878 75,232 78,720
Rechargeable batteries and photovoltaic business 4,980 5,478 6,026 6,327
Mobile handset components and assembly service 24,116 22,910 24,056 25,259
Automobiles and related products 26,270 34,490 45,151 47,134
COGS -47,743 -52,945 -62,870 -65,703
Gross profit 7,623 9,933 12,362 13,016
GPM% 13.8% 15.8% 16.4% 16.5%
SG&A (4,829) (5,911) (6,921) (7,006)
R&D Expense (1,865) (1,886) (2,407) (2,519)
Operating Profit (Loss) 929 2,136 3,034 3,491
Operating Profit Margin 1.7% 3.4% 4.0% 4.4%
Finance cost (1,397) (1,416) (1,335) (1,385)
Government Grant 798 800 850 900
Investment income (122) (150) (150) (150)
Net Profit Before Tax 874 1,502 2,470 2,868
Income Tax Expense (134) (225) (370) (430)
Net profit 740 1,277 2,099 2,438
Minorities (306) (293) (308) (323)
Net profit to
shareholder
434 984 1,791 2,115
EPS 0.18 0.40 0.72 0.85
Source: Jefferies estimates, company data
BYD (H) Valuation We initiate BYD with a ‘Hold’ and a target price of HK$43.0, based on sum of the parts
(SOTP) valuation where NEV business accounts for 65% of the company’s valuation.
We used enterprise-value-to-2017-sales to value BYD’s NEV business as it is still a fast
growing business with uncertain earnings. NEV is valued with 2.5x EV/Sales, at a slight
discount to Tesla 2017 consensus. BYD is already profitable on NEV business vs. Tesla but
we penalize it for its lesser technology edge vs. the latter.
Traditional business is valued at 0.9X EV/sales, in line with Chinese peers
BYD Battery & Solar businesses are valued using Price-Book Ratio as the business arm
supplies battery to NEV business and mobile handsets and has uncertain segment earnings
BYD Electronic (285 HK, NC) and Holitech (002271 CH, NC) are valued using current
market value
The target price implies 42x 2017E PER for the company as a whole and a PEG of 1.5. This
assumes the company’s NEV business will reach a larger scale and its battery R&D
capability will support its profit growth from here.
Table 30: BYD sum of the parts (SOTP) (mn Rmb)
EV/Sales 2017e Sales Multiples Value Net Debt % 2017e Net Debt Market Cap %
New Energy Vehicles 30,340 2.5x 75,850 80% 18,556 57,294 65%
Conventional Vehicles 16,794 0.9x 15,114 20% 4,639 10,475 12%
Parent Electronic 1,000 1x 1,000 1,000 1%
P/B 2017e Book
Value
Multiples Value
Battery & Solar 11,000 1x 11,000 11,000 12%
Market Value Market Value % Owned HKDCNY
BYD Elec (285 HK, NC) 10,770 65% 0.8 5,836 7%
HoliTech (002217 CH, NC) 3,035 3%
Total 88,641
TP HK$ 43.0
Source: Jefferies estimates, company data
Industrials
Initiating Coverage
2 December 2015
page 44 of 79 , Equity Analyst, +852 3743 8075, [email protected] Aik Yeo
Please see important disclosure information on pages 74 - 79 of this report.
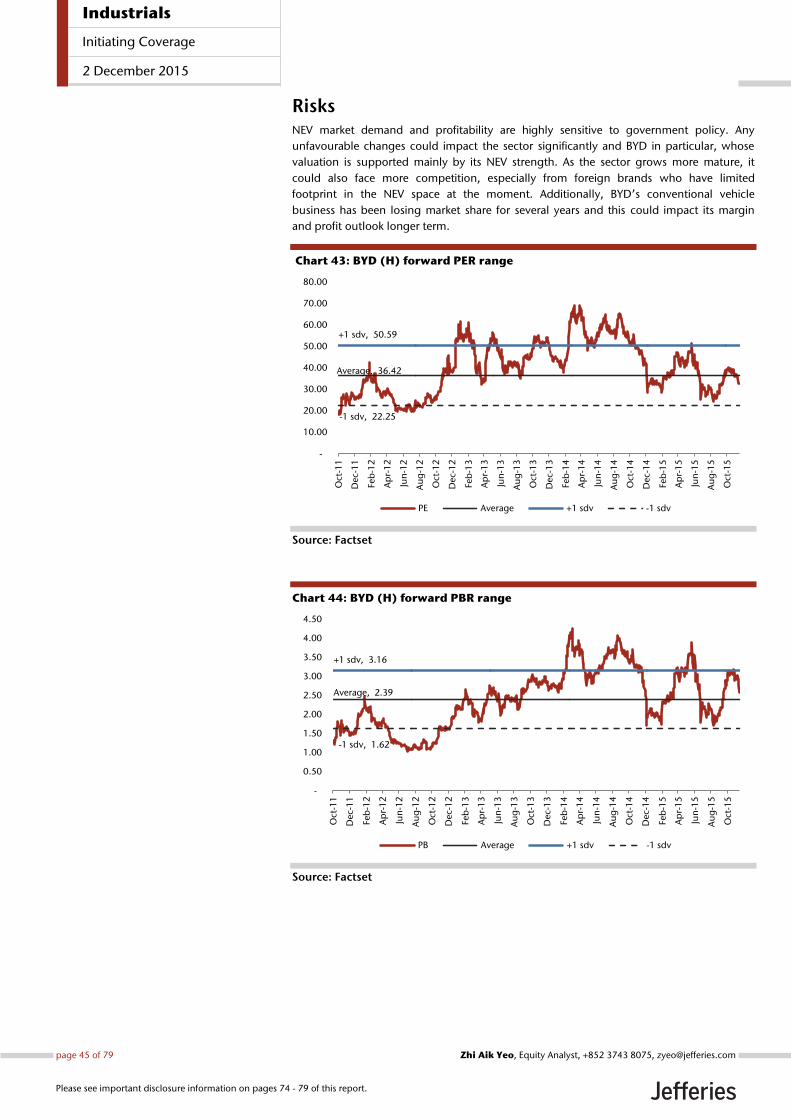
Risks NEV market demand and profitability are highly sensitive to government policy. Any
unfavourable changes could impact the sector significantly and BYD in particular, whose
valuation is supported mainly by its NEV strength. As the sector grows more mature, it
could also face more competition, especially from foreign brands who have limited
footprint in the NEV space at the moment. Additionally, BYD’s conventional vehicle
business has been losing market share for several years and this could impact its margin
and profit outlook longer term.
Chart 43: BYD (H) forward PER range
Source: Factset
Chart 44: BYD (H) forward PBR range
Source: Factset
Average, 36.42
+1 sdv, 50.59
-1 sdv, 22.25
-
10.00
20.00
30.00
40.00
50.00
60.00
70.00
80.00
Oct
-11
Dec-
11
Feb
-12
Ap
r-1
2
Jun
-12
Au
g-1
2
Oct
-12
Dec-
12
Feb
-13
Ap
r-1
3
Jun
-13
Au
g-1
3
Oct
-13
Dec-
13
Feb
-14
Ap
r-1
4
Jun
-14
Au
g-1
4
Oct
-14
Dec-
14
Feb
-15
Ap
r-1
5
Jun
-15
Au
g-1
5
Oct
-15
PE Average +1 sdv -1 sdv
Average, 2.39
+1 sdv, 3.16
-1 sdv, 1.62
-
0.50
1.00
1.50
2.00
2.50
3.00
3.50
4.00
4.50
Oct
-11
Dec-
11
Feb
-12
Ap
r-1
2
Jun
-12
Au
g-1
2
Oct
-12
Dec-
12
Feb
-13
Ap
r-1
3
Jun
-13
Au
g-1
3
Oct
-13
Dec-
13
Feb
-14
Ap
r-1
4
Jun
-14
Au
g-1
4
Oct
-14
Dec-
14
Feb
-15
Ap
r-1
5
Jun
-15
Au
g-1
5
Oct
-15
PB Average +1 sdv -1 sdv
Industrials
Initiating Coverage
2 December 2015
page 45 of 79 , Equity Analyst, +852 3743 8075, [email protected] Aik Yeo
Please see important disclosure information on pages 74 - 79 of this report.

Chart 45: BYD forward EV/ Sales range
Source: Factset
Auto segment discounted cash flow (DCF) valuation We use DCF analysis to cross check the value of BYD’s auto business, which yields a price of
Rmb25 based on WACC of 8.3%. Assuming other business value remains the same, this
indicates company target price of Rmb37.8 or HK$45.5, slightly higher than the target price
generated by peer comparison method.
Cash flow forecast
Cash flow for our forecast period of 2015-2017 is based on what we have outlined in the
section Financial Forecasts and Key Assumptions.
From 2017 and beyond, we expect the company to settle into a more mature state than
before. Hence, the following expectations:
Capacity expansion as well as top-line growth would slow after 18 months of building
battery capacity
ASP may drop as a result of competition and declining government subsidy, thus gross
profit margin could decline
We expect efficiency gains from a larger production scale and higher utilization to offset
cost inflation, resulting in a largely unchanged operating margin.
As the company’s NEV scale improves and it relies less on government subsidy, working
capital requirement could improve as receivable turnover days decline. The company’s
scale would allow it even better procurement credit terms in the future.
WACC
Our base case assumption for BYD is 8.3%, based on the following:
As the company is dual listed in China and HK, the equity risk premium (ERP) is based
on our strategy team’s view of ERP in Hong Kong and China.
The risk-free rate is a blend of HK and China 10-year bond yields as BYD could raise
domestic or offshore debts. We assume this converges to 3% as China cuts while US raises.
Beta is benchmarked against Dongfeng, GAC and Brilliance.
Weighted average yield of debt is based on historical cost of debt for the company
Target debt to capital ratio in our assumption is 30%, close to its current level
Average, 1.56
+1 sdv, 1.96
-1 sdv, 1.17
-
0.50
1.00
1.50
2.00
2.50
3.00
Oct
-11
Dec-
11
Feb
-12
Ap
r-1
2
Jun
-12
Au
g-1
2
Oct
-12
Dec-
12
Feb
-13
Ap
r-1
3
Jun
-13
Au
g-1
3
Oct
-13
Dec-
13
Feb
-14
Ap
r-1
4
Jun
-14
Au
g-1
4
Oct
-14
Dec-
14
Feb
-15
Ap
r-1
5
Jun
-15
Au
g-1
5
Oct
-15
EV/Sales Average +1 sdv -1 sdv
Industrials
Initiating Coverage
2 December 2015
page 46 of 79 , Equity Analyst, +852 3743 8075, [email protected] Aik Yeo
Please see important disclosure information on pages 74 - 79 of this report.

Terminal value
We assume the free cash flow’s terminal growth rate to be around 3% after 2025. Most of
the free cash flow growth should come from the efficiency gains in operations and reduced
capex, as the company achieves larger battery capacity.
In the long term, car sales growth could come down to zero, as is the case in mature
economies such as the US and Japan. We expect the growth of car sales to start slowing
down as early as 2020 when penetration crosses 160 per 1,000 people as China
approaches a saturation point. This compares with the history of Japan and Korea, which
experienced sharply slower vehicle sales after the penetration rate reached 150 per 1,000
people.
Industrials
Initiating Coverage
2 December 2015
page 47 of 79 , Equity Analyst, +852 3743 8075, [email protected] Aik Yeo
Please see important disclosure information on pages 74 - 79 of this report.

Chart 46: DCF for BYD Auto segment (mn Rmb)
Source: Jefferies, company data
BYD Auto (mn Rmb) 2014A 2015E 2016E 2017E 2018E 2019E 2020E 2021E 2022E 2023E 2024E 2025E
Automobiles and related products rev 26,270 34,490 45,151 47,134 48,182 49,459 49,667 49,216 50,766 52,411 54,157 56,007
New energy vehicle business 7,251 15,131 25,610 30,340 32,706 34,898 35,543 36,201 38,011 39,912 41,907 44,002
Internal combustion engine vehicle business 19,019 19,359 19,540 16,794 15,475 14,561 14,124 13,015 12,755 12,500 12,250 12,005
Total Units 373,000 405,348 441,838 429,751 427,249 432,531 440,188 434,259 437,393 441,055 445,265 450,042
NEV Units 20,807 57,090 104,969 126,569 139,226 153,148 160,806 168,846 177,288 186,153 195,460 205,233
ICE Volume 352,193 348,258 336,869 303,182 288,023 279,382 279,382 265,413 260,105 254,903 249,805 244,809
Auto Gross Margin 16.6% 19.1% 19.5% 19.7% 19.4% 19.2% 19.2% 19.4% 19.5% 19.6% 19.7% 19.8%
NEV 19.3% 24.4% 23.4% 22.9% 22.0% 21.3% 21.3% 21.3% 21.3% 21.3% 21.3% 21.3%
ICE 15.6% 15.0% 14.5% 14.00% 14.0% 14.0% 14.0% 14.0% 14.0% 14.0% 14.0% 14.0%
Total Gross Profit 4,369 6,591 8,825 9,302 9,360 9,484 9,560 9,545 9,895 10,265 10,656 11,068
NEV 1,396 3,687 5,992 6,951 7,193 7,445 7,583 7,723 8,109 8,515 8,941 9,388
ICE 2,973 2,904 2,833 2,351 2,167 2,039 1,977 1,822 1,786 1,750 1,715 1,681
SG&A+ R&D as % of Sales 13.7% 12.0% 12.0% 11.0% 10.0% 10.0% 10.0% 10.0% 10.0% 10.0% 10.0% 10.0%
EBIT 758 2,452 3,407 4,117 4,542 4,538 4,594 4,624 4,818 5,024 5,240 5,468
EBIT Margin 2.9% 7.1% 7.5% 8.7% 9.4% 9.2% 9.2% 9.4% 9.5% 9.6% 9.7% 9.8%
NOPAT 645 2,084 2,896 3,500 3,861 3,857 3,904 3,930 4,096 4,270 4,454 4,647
Tax Rate 15% 15% 15% 15% 15% 15% 15% 15% 15% 15% 15% 15%
+ D&A 2,420 3,004 3,933 4,106 3,956 4,061 4,078 4,041 4,168 4,303 4,447 4,598
9.2% 8.7% 8.7% 8.7% 8.2% 8.2% 8.2% 8.2% 8.2% 8.2% 8.2% 8.2%
+ Chg. In Working Capital (3,152) (2,759) (1,355) (1,885) (964) - 993 984 1,015 1,048 1,083 1,120
-12% -8% -3.0% -4.0% -2.0% 0.0% 2.0% 2.0% 2.0% 2.0% 2.0% 2.0%
- CapEx 5,061 4,920 6,441 5,310 3,983 2,604 2,615 2,592 2,673 2,760 2,852 2,949
19.3% 14.3% 14.3% 11.3% 8.3% 5.3% 5.3% 5.3% 5.3% 5.3% 5.3% 5.3%
FCFF (5,149) (2,591) (967) 410 2,870 5,313 6,360 6,364 6,606 6,862 7,132 7,417
-50% -63% -142% 600% 85% 20% 0% 4% 4% 4% 4%
Assumptions Growth Rate
WACC 8.3% 25 2.0% 2.5% 3.0% 3.5% 4.0%
NPV FCFF 25,277 7.3% 29 31 35 40 45
Terminal Growth Rate 3% 7.8% 25 27 30 33 37
Terminal Value 140,263 WACC 8.3% 21 23 25 28 31
PV of Terminal Value 62,837 8.8% 18 20 22 24 26
Total Enterprise Value 88,114 9.3% 16 17 19 20 22
Terminal Value as % of EV 71%
Net Cash (as of Dec 31, 2015) (25,424)
Equity Value (mn RMB) 62,690
Shares 2,476
Implied Price (Rmb) 25
RMB: HKD 1.20
Industrials
Initiating Coverage
2 December 2015
page 48 of 79 , Equity Analyst, +852 3743 8075, [email protected] Aik Yeo
Please see important disclosure information on pages 74 - 79 of this report.

Chart 47: Financial Summary
Source: Jefferies, company data
Industrials
Initiating Coverage
2 December 2015
page 49 of 79 , Equity Analyst, +852 3743 8075, [email protected] Aik Yeo
Please see important disclosure information on pages 74 - 79 of this report.

BYD Company – A (002594 CH); initiate at Underperform Government encouragement and economies of scale will keep BYD on a high
growth track, but we feel that this is well priced in. We believe what consensus
has failed to recognize is the risk of volume disappointment, as a result of
competition, cannibalization and more stringent requirements for getting an
NEV. Also subsidy cuts may have a bigger impact on margin than expected.
Government encouragement and EOS remains in favour. With the rapid buildout of
charging infrastructure, and continued drop in battery cost and shortened charging time,
we believe NEV could become a much more attractive proposition longer term. But near
term, it will still be driven by consumers seeking an easier way to get a new license plate, or
a free license plate. Nonetheless, we expect BYD to see 84%/21% NEV sales volume growth
in FY16/17, respectively. This is after including the reduction of government subsidy, which
should have 2%/6.5% impact on pricing in the 2 years. And on the back of economies of
scale in batteries, we still expect gross margin improvement.
Competition intensifying of late. Various OEMs have launched EV/PHEV products, or
announced plans for equity placement to expand NEV ventures. In FY15, 90 new NEV PV
models would be launched locally (excluding imported models). The total number of
models will almost double from around 93 in FY14 to 183 by end-15. PHEV models, in
which BYD competes keenly, will also increase 91% from 11 (FY14) to 21 (FY15). In 2014,
the top 10 selling NEVs were all manufactured by domestic brands, and accounted for 78%
market share. This contrasts with the conventional car market, where domestic brands
commanded 32% share in 2014, vs. 68% for JVs. What this means is many foreign brands
have yet to step into the segment, and that should change over the next couple of years.
Recent volume momentum not as strong as it seems. The market had reacted
positively to recent volume momentum on Tang PHEV SUV. Although Tang started
shipment only in June, it is currently doing better than expectation, with monthly volume
already exceeding 3,200 units in Oct. But we also observed cannibalization on the Qin
PHEV. Ever since Tang was introduced, Qin’s volume had fallen almost 50% from the peak
of above 4,000 units. This also seems to suggest the appeal of the BYD brand is not that
strong. And interestingly, anecdotal evidence suggests most existing buyers are motivated
by the free license plate, as opposed to genuinely wanting to drive an EV. This is a loop-
hole the government may seek to close in the coming months. Shanghai has started asking
buyers to show evidence of charging facilities ownership; other cities may follow suit.
High risk, high returns. For BYD, the technology risk involved is putting too much
focus on LFP technology, only recently considering a diversification to NCM. NCM should
provide greater room for cost reduction and increase in energy density vs. the LFP, in our
view. Even though company did state that NCM battery is not new to them, we have
doubts over its immediate feasibility and the cost to customize a new BMS system to fit.
However, we do recognize that BYD should be a bigger beneficiary vs. Yutong if the
demand for battery supersedes supply, which is what we have observed in the Chinese
market at present. And if BYD is able to hedge its technology risk appropriately, it should
benefit from vertical integration in the longer run, given more seamless integration with
batteries and ability to respond to market demand quicker vs. peers that outsource.
Valuation/Risks
Our SOTP-based price target is at Rmb36.0, implying 42x 2017e P/E (-1 S.D OF its historical
forward P/E range). Risks include unfavourable policy shift by the government, and bigger
than expected losses at the conventional vehicle business.
Table 31: 002594 CH BYD (A)
Market Data
52 Week Range Rmb33.8 - Rmb87.6
Total Entprs. Value (RmbM): 177,424.7
Market Cap. (Rmb M): 125,329.0
Share Out. (M): 2,476.0
Float (M): 436.0
Avg. Daily Vol. (M): 26.5
Source: Bloomberg as of Nov 27 2015
Chart 48: BYD (A) price performance
Source: Bloomberg as of Nov 27 2015
Industrials
Initiating Coverage
2 December 2015
page 50 of 79 , Equity Analyst, +852 3743 8075, [email protected] Aik Yeo
Please see important disclosure information on pages 74 - 79 of this report.

Company Background BYD Company Limited (stock code: H Shares: 1211 HK; A Shares: 002594 CH) is principally
engaged in auto business which includes traditional fuel-engined vehicles and new energy
vehicles. Other key segments include rechargeable battery and photovoltaic business,
handset components and assembly services.
The company entered automobile business in 2003 and became a pioneer in the research
and development and promotion of new energy vehicles. BYD is one of the leading
rechargeable battery manufacturers in the global arena and is a leading supplier for
handset components and assembly operations.
Chart 49: BYD Revenue Breakdown
Source: Jefferies, company data
Chart 50: BYD Net Profit Trend vs. Auto Segment
Operating Result (Rmb mn)
Source: Jefferies, company data
Management and Shareholders Mr. Wang Chuanfu is the founder, chairman and major shareholder of BYD. In 1995 he
founded Shenzhen BYD Battery Company with Lu Xiang-yang and took the position of
general manager. He led it from a small battery assembler to an NEV market leader. He has
a technical background, with a bachelor’s degree in metallurgy physical chemistry from
Central South University of Technology (currently Central South University) in 1987 and a
master’s degree in metallurgy physical chemistry from Beijing Non-Ferrous Research
Institute in the PRC in 1990. He holds around 20% of the company.
Mr. Lu Xiang-yang co-founded Shenzhen BYD Battery Company with Mr. Wang
Chuanfu. Prior to that he worked at Chaohu Centre Branch of the People’s Bank of China.
He is the Vice Chairman and a Non-Executive Director of BYD and also the chairman of
Guangzhou Youngy Management & Investment Group, a Director of Ganzi Rongda
Lithium Industry and the Vice chairman of BYD Charity Foundation. Lu is also a major
shareholder of the company.
Mr. Wu Jing-sheng Mr. Wu is a Vice President and Chief Financial Officer, and also a non-
executive director of BYD Electronic (International), a director of Shenzhen BYD Daimler
New Technology. He is also the chairman of Shenzhen BYD International Financial Leasing,
the chairman of Shenzhen BYD Electric Car Investment, vice chairman of Guangzhou
Guang Qi BYD New Energy Bus, the chairman of Shenzhen Dicheng New Energy and
chairman of BYD Charity Foundation.
10% 10% 11% 10% 9%
44% 42% 39% 39% 44%
46% 48% 51% 51% 47%
0%
20%
40%
60%
80%
100%
2010A 2011A 2012A 2013A 2014A
Automobiles and related products
Mobile handset components and assembly service
Rechargeable batteries and photovoltaic business
2523
1385
81
553 434 467
1743 1898
1058 825 758
1290
0.0
500.0
1,000.0
1,500.0
2,000.0
2,500.0
3,000.0
2010 2011 2012 2013 2014 1H15Net profit Auto Segment result
Industrials
Initiating Coverage
2 December 2015
page 51 of 79 , Equity Analyst, +852 3743 8075, [email protected] Aik Yeo
Please see important disclosure information on pages 74 - 79 of this report.

Earnings Estimates FY 16
We forecast FY16 revenue to grow 20% from Rmb62.9bn to Rmb75.2bn, driven by ‘Auto
and related products’ segment sales, expected to grow 31%. Among auto sales, NEV
revenue is expected to grow 69% to Rmb25.6bn.
Gross margin is expected to increase to 16.4% from 15.8% (FY15E) thanks to higher
margins achieved in the ‘Auto and related products’ segment and better product mix
generated from greater contribution of NEV. Correspondingly, operating margin is
expected to increase 0.6ppt to 4%.
As a result of the above, FY16 profit is expected at Rmb1.8bn, on the back of 82% core
earnings growth (excluding the one-off disposal gain in FY15).
FY 16 other key assumptions
- NEV auto volume grows 84% to 105,000 units
- Conventional vehicles’ volume declines 3% to 336,900 units
- Mobile handset segment revenue declines 5% y/y due to sale of subsidiary,
Shenzhen BYD Electronic Co.
- Rechargeable batteries and photovoltaic business revenue grows 10%.
FY 17
We forecast FY17 revenue to grow 5%, still driven by ‘Auto and related products’ segment
sales, expected to grow 18%. Facing subsidy cuts, we expect NEV sales to slow due to
lower pricing and larger base achieved in 2016.
Gross margin is expected to increase further to 16.4%, as NEV contributes a larger portion
of ‘Auto and related products’ segment sales. Correspondingly operating margin is
expected to increase 4.4%.
FY17 profit is expected to grow 18% to Rmb2.1bn.
FY 17 other key assumptions
- NEV auto volume grows 21% to 126,500 units
- Conventional vehicles volume declines 10% to 303,182 units
- Mobile handset segment revenue grows 5% y/y
- Rechargeable batteries and photovoltaic business revenue grows 10%.
Table 32: BYD auto key assumptions
2014A 2015E y/y 2016E y/y 2017E y/y
Auto Sales Volume 373,000 405,348 9% 441,838 9% 429,751 -3%
NEV 20,807 57,090 174% 104,969 84% 126,569 21%
E6 3,560 5,130 44% 6,669 30% 8,670 30%
Qin 14,747 31,000 110% 25,000 -19% 10,000 -60%
Tang - 16,000 35,200 120% 40,000 14%
Bus 2,500 4,300 72% 6,100 42% 7,195 18%
Others - 660 32,000 4748% 60,704 90%
Non-NEV 352,193 348,258 -1% 336,869 -3% 303,182 -10%
F3 110,296 128,039 16% 121,637 -5% 109,473 -10%
L3 54,531 10,484 -81% 5,242 -50% 4,194 -20%
Speed 65,312 52,217 -20% 46,995 -10% 39,946 -15%
S6 98,720 18,016 -82% 7,206 -60% 2,883 -60%
S7 6,938 98,860 1325% 69,202 -30% 62,282 -10%
Others 16,396 40,642 148% 86,586 113% 84,405 -3%
Auto ASP
NEV 348,488 265,040 -24% 243,977 -8% 239,711 -2%
ICE 54,002 55,587 3% 58,006 4% 55,391 -5%
Source: Jefferies estimates, company data
Industrials
Initiating Coverage
2 December 2015
page 52 of 79 , Equity Analyst, +852 3743 8075, [email protected] Aik Yeo
Please see important disclosure information on pages 74 - 79 of this report.

Table 33: BYD Financial Forecasts and Key Assumptions
Rmb mn 2014A 2015 2016 2017
Operating Revenue 55,366 62,878 75,232 78,720
Rechargeable batteries and photovoltaic business 4,980 5,478 6,026 6,327
Mobile handset components and assembly service 24,116 22,910 24,056 25,259
Automobiles and related products 26,270 34,490 45,151 47,134
COGS -47,743 -52,945 -62,870 -65,703
Gross profit 7,623 9,933 12,362 13,016
GPM% 13.8% 15.8% 16.4% 16.5%
SG&A (4,829) (5,911) (6,921) (7,006)
R&D Expense (1,865) (1,886) (2,407) (2,519)
Operating Profit (Loss) 929 2,136 3,034 3,491
Operating Profit Margin 1.7% 3.4% 4.0% 4.4%
Finance cost (1,397) (1,416) (1,335) (1,385)
Government Grant 798 800 850 900
Investment income (122) (150) (150) (150)
Net Profit Before Tax 874 1,502 2,470 2,868
Income Tax Expense (134) (225) (370) (430)
Net profit 740 1.277 2,099 2,438
Minorities (306) (293) (308) (323)
Net profit to
shareholder
434 984 1,791 2,115
EPS 0.18 0.96 0.72 0.85
Source: Jefferies estimates, company data
BYD (A) Valuation We initiate BYD A with an ‘Underperform’ rating and a target price of Rmb36.0, based on
sum of the parts (SOTP) valuation method where NEV business accounts for 65% of the
company’s valuation.
We used enterprise-value-to-2017-sales to value BYD’s NEV business as it is still a fast
growing business with uncertain earnings. NEV is valued with 2.5x EV/Sales, at a slight
discount to Tesla 2017 consensus. BYD already is profitable on the NEV business vs. Tesla
remaining in loss, but we penalize it for its lesser technology edge vs. the latter.
Traditional business is valued at 0.9X EV/sales, in line with Chinese peers
BYD Battery & Solar businesses are valued using Price-Book Ratio as the business arm
supplies battery to NEV business and mobile handsets and has uncertain segment earnings
BYD Electronic (285 HK, NC) and Holitech (002271 CH, NC) are valued using current
market value
The target price implies a 42x 2017E PER for the company on a whole and a PEG of 1.5. This
assumes the company’s NEV business will reach a larger scale and its battery R&D
capability will support its profit growth from here.
Industrials
Initiating Coverage
2 December 2015
page 53 of 79 , Equity Analyst, +852 3743 8075, [email protected] Aik Yeo
Please see important disclosure information on pages 74 - 79 of this report.
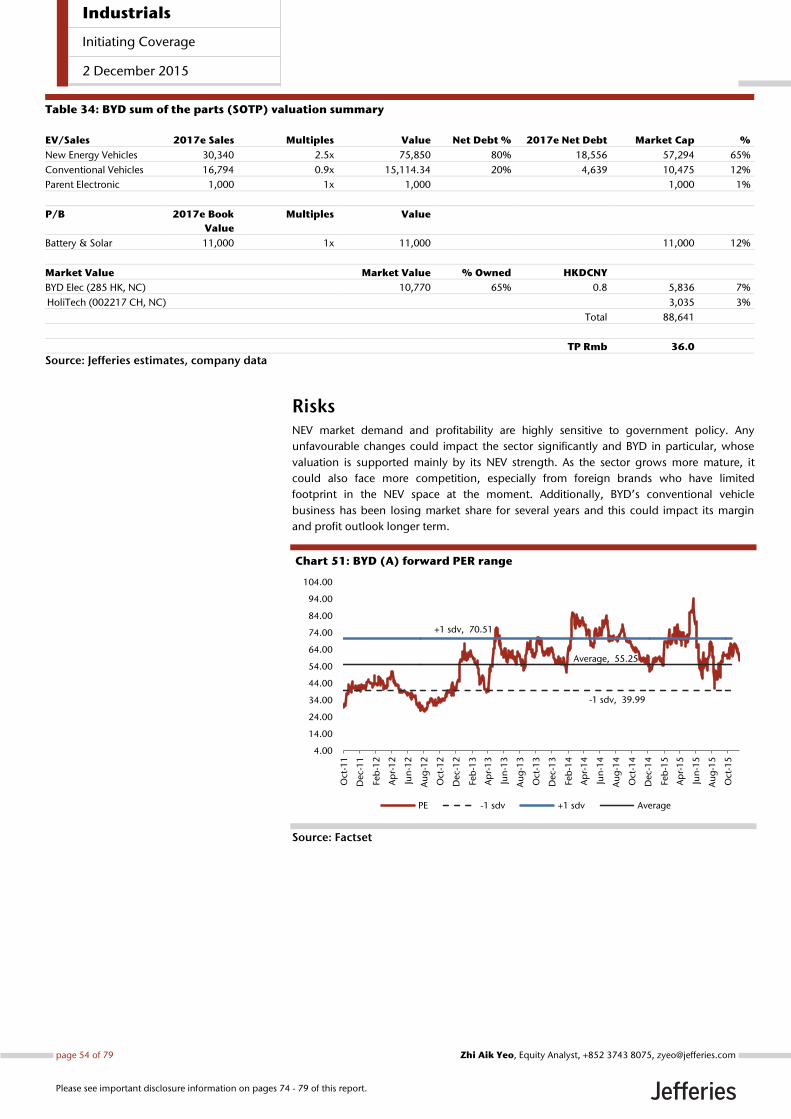
Table 34: BYD sum of the parts (SOTP) valuation summary
EV/Sales 2017e Sales Multiples Value Net Debt % 2017e Net Debt Market Cap %
New Energy Vehicles 30,340 2.5x 75,850 80% 18,556 57,294 65%
Conventional Vehicles 16,794 0.9x 15,114.34 20% 4,639 10,475 12%
Parent Electronic 1,000 1x 1,000 1,000 1%
P/B 2017e Book
Value
Multiples Value
Battery & Solar 11,000 1x 11,000 11,000 12%
Market Value Market Value % Owned HKDCNY
BYD Elec (285 HK, NC) 10,770 65% 0.8 5,836 7%
HoliTech (002217 CH, NC) 3,035 3%
Total 88,641
TP Rmb 36.0
Source: Jefferies estimates, company data
Risks NEV market demand and profitability are highly sensitive to government policy. Any
unfavourable changes could impact the sector significantly and BYD in particular, whose
valuation is supported mainly by its NEV strength. As the sector grows more mature, it
could also face more competition, especially from foreign brands who have limited
footprint in the NEV space at the moment. Additionally, BYD’s conventional vehicle
business has been losing market share for several years and this could impact its margin
and profit outlook longer term.
Chart 51: BYD (A) forward PER range
Source: Factset
-1 sdv, 39.99
+1 sdv, 70.51
Average, 55.25
4.00
14.00
24.00
34.00
44.00
54.00
64.00
74.00
84.00
94.00
104.00
Oct
-11
Dec-
11
Feb
-12
Ap
r-1
2
Jun
-12
Au
g-1
2
Oct
-12
Dec-
12
Feb
-13
Ap
r-1
3
Jun
-13
Au
g-1
3
Oct
-13
Dec-
13
Feb
-14
Ap
r-1
4
Jun
-14
Au
g-1
4
Oct
-14
Dec-
14
Feb
-15
Ap
r-1
5
Jun
-15
Au
g-1
5
Oct
-15
PE -1 sdv +1 sdv Average
Industrials
Initiating Coverage
2 December 2015
page 54 of 79 , Equity Analyst, +852 3743 8075, [email protected] Aik Yeo
Please see important disclosure information on pages 74 - 79 of this report.

Chart 52: BYD (A) forward PBR range
Source: Factset
Chart 53: BYD (A) forward EV/ Sales range
Source: Factset
Auto segment discounted cash flow (DCF) valuation We use DCF analysis to cross check the value of BYD’s auto business, which yields a price of
Rmb25 based on WACC of 8.3%. Assuming other business value remains the same, this
indicates company target price of Rmb37.8, slightly higher than the target price generated
by peer comparison method.
Cash flow forecast
Cash flow for our forecast period of 2015-2017 is based on what we have outlined in the
section Financial Forecasts and Key Assumptions.
From 2017 and beyond, we expect the company to settle into a more mature state than
before. Hence, the following expectations:
Capacity expansion as well as top-line growth would slow after 18 months of building
battery capacity
ASP may drop as a result of competition and declining government subsidy, thus gross
profit margin could decline
-1 sdv, 2.27
+1 sdv, 4.48
Average, 3.37
-
1.00
2.00
3.00
4.00
5.00
6.00
7.00
8.00
Oct
-11
Dec-
11
Feb
-12
Ap
r-1
2
Jun
-12
Au
g-1
2
Oct
-12
Dec-
12
Feb
-13
Ap
r-1
3
Jun
-13
Au
g-1
3
Oct
-13
Dec-
13
Feb
-14
Ap
r-1
4
Jun
-14
Au
g-1
4
Oct
-14
Dec-
14
Feb
-15
Ap
r-1
5
Jun
-15
Au
g-1
5
Oct
-15
PB -1 sdv +1 sdv Average
-1 sdv, 1.14
+1 sdv, 1.93
Average, 1.54
0.50
1.00
1.50
2.00
2.50
3.00
Oct
-11
Dec-
11
Feb
-12
Ap
r-1
2
Jun
-12
Au
g-1
2
Oct
-12
Dec-
12
Feb
-13
Ap
r-1
3
Jun
-13
Au
g-1
3
Oct
-13
Dec-
13
Feb
-14
Ap
r-1
4
Jun
-14
Au
g-1
4
Oct
-14
Dec-
14
Feb
-15
Ap
r-1
5
Jun
-15
Au
g-1
5
Oct
-15
PB -1 sdv +1 sdv Average
Industrials
Initiating Coverage
2 December 2015
page 55 of 79 , Equity Analyst, +852 3743 8075, [email protected] Aik Yeo
Please see important disclosure information on pages 74 - 79 of this report.

We expect efficiency gains from a larger production scale and higher utilization to offset
cost inflation, resulting in a largely unchanged operating margin.
As the company’s NEV scale improves and it relies less on government subsidy, working
capital requirement could improve as receivable turnover days decline. The company’s
scale would allow it even better procurement credit terms in the future.
WACC
Our base case assumption for BYD is 8.3%, based on the following:
As the company is dual listed in China and HK, the equity risk premium (ERP) is based
on our strategy team’s view of ERP in Hong Kong and China.
The risk-free rate is a blend of HK and China 10-year bond yields as BYD could raise
domestic or offshore debts. We assume this converges to 3% as China cuts while US raises.
Beta is benchmarked against Dongfeng, GAC and Brilliance.
Weighted average yield of debt is based on historical cost of debt for the company
Target debt to capital ratio in our assumption is 30%, close to its current level
Terminal value
We assume the free cash flow’s terminal growth rate to be around 3% after 2025. Most of
the free cash flow growth should come from the efficiency gains in operations and reduced
capex, as the company achieves larger battery capacity.
In the long term, car sales growth could come down to zero, as is the case in mature
economies such as the US and Japan. We expect the growth of car sales to start slowing
down as early as 2020 when penetration crosses 160 per 1,000 people as China
approaches a saturation point. This compares with the history of Japan and Korea, which
experienced sharply slower vehicle sales after the penetration rate reached 150 per 1,000
people.
Industrials
Initiating Coverage
2 December 2015
page 56 of 79 , Equity Analyst, +852 3743 8075, [email protected] Aik Yeo
Please see important disclosure information on pages 74 - 79 of this report.

Chart 54: DCF for BYD Auto segment
Source: Jefferies, company data
BYD Auto 2014A 2015E 2016E 2017E 2018E 2019E 2020E 2021E 2022E 2023E 2024E 2025E
Automobiles and related products 26,270 34,490 45,151 47,134 48,182 49,459 49,667 49,216 50,766 52,411 54,157 56,007
New energy vehicle business Rev 7,251 15,131 25,610 30,340 32,706 34,898 35,543 36,201 38,011 39,912 41,907 44,002
Internal combustion engine vehicle business 19,019 19,359 19,540 16,794 15,475 14,561 14,124 13,015 12,755 12,500 12,250 12,005
Total Units 373,000 405,348 441,838 429,751 427,249 432,531 440,188 434,259 437,393 441,055 445,265 450,042
NEV Units 20,807 57,090 104,969 126,569 139,226 153,148 160,806 168,846 177,288 186,153 195,460 205,233
ICE Volume 352,193 348,258 336,869 303,182 288,023 279,382 279,382 265,413 260,105 254,903 249,805 244,809
Auto Gross Margin 16.6% 19.1% 19.5% 19.7% 19.4% 19.2% 19.2% 19.4% 19.5% 19.6% 19.7% 19.8%
NEV 19.3% 24.4% 23.4% 22.9% 22.0% 21.3% 21.3% 21.3% 21.3% 21.3% 21.3% 21.3%
ICE 15.6% 15.0% 14.5% 14.00% 14.0% 14.0% 14.0% 14.0% 14.0% 14.0% 14.0% 14.0%
Total Gross Profit 4,369 6,591 8,825 9,302 9,360 9,484 9,560 9,545 9,895 10,265 10,656 11,068
NEV 1,396 3,687 5,992 6,951 7,193 7,445 7,583 7,723 8,109 8,515 8,941 9,388
ICE 2,973 2,904 2,833 2,351 2,167 2,039 1,977 1,822 1,786 1,750 1,715 1,681
SG&A+ R&D as % of Sales 13.7% 12.0% 12.0% 11.0% 10.0% 10.0% 10.0% 10.0% 10.0% 10.0% 10.0% 10.0%
EBIT 758 2,452 3,407 4,117 4,542 4,538 4,594 4,624 4,818 5,024 5,240 5,468
EBIT Margin 2.9% 7.1% 7.5% 8.7% 9.4% 9.2% 9.2% 9.4% 9.5% 9.6% 9.7% 9.8%
NOPAT 645 2,084 2,896 3,500 3,861 3,857 3,904 3,930 4,096 4,270 4,454 4,647
Tax Rate 15% 15% 15% 15% 15% 15% 15% 15% 15% 15% 15% 15%
+ D&A 2,420 3,004 3,933 4,106 3,956 4,061 4,078 4,041 4,168 4,303 4,447 4,598
9.2% 8.7% 8.7% 8.7% 8.2% 8.2% 8.2% 8.2% 8.2% 8.2% 8.2% 8.2%
+ Chg. In Working Capital (3,152) (2,759) (1,355) (1,885) (964) - 993 984 1,015 1,048 1,083 1,120
-12% -8% -3.0% -4.0% -2.0% 0.0% 2.0% 2.0% 2.0% 2.0% 2.0% 2.0%
- CapEx 5,061 4,920 6,441 5,310 3,983 2,604 2,615 2,592 2,673 2,760 2,852 2,949
19.3% 14.3% 14.3% 11.3% 8.3% 5.3% 5.3% 5.3% 5.3% 5.3% 5.3% 5.3%
FCFF (5,149) (2,591) (967) 410 2,870 5,313 6,360 6,364 6,606 6,862 7,132 7,417
-50% -63% -142% 600% 85% 20% 0% 4% 4% 4% 4%
Assumptions Growth Rate
WACC 8.3% 25 2.0% 2.5% 3.0% 3.5% 4.0%
NPV FCFF 25,277 7.3% 29 31 35 40 45
Terminal Growth Rate 3% 7.8% 25 27 30 33 37
Terminal Value 140,263 WACC 8.3% 21 23 25 28 31
PV of Terminal Value 62,837 8.8% 18 20 22 24 26
Total Enterprise Value 88,114 9.3% 16 17 19 20 22
Terminal Value as % of EV 71%
Net Cash (as of Dec 31, 2015) (25,424)
Equity Value (RMB mn) 62,690
Shares 2,476
Implied Price (RMB) 25
RMB: HKD 1.20
Industrials
Initiating Coverage
2 December 2015
page 57 of 79 , Equity Analyst, +852 3743 8075, [email protected] Aik Yeo
Please see important disclosure information on pages 74 - 79 of this report.

Chart 55: Financial Summary
Source: Jefferies, company data
Industrials
Initiating Coverage
2 December 2015
page 58 of 79 , Equity Analyst, +852 3743 8075, [email protected] Aik Yeo
Please see important disclosure information on pages 74 - 79 of this report.

Appendix Electric Vehicles Can Help Address Energy Security and Air Pollution
China has the world's largest car market with 23m vehicles sold in 2011, but the truth is,
China's passenger car penetration is a mere 7.8 vehicles per 100 people. The inflection for
China's increased car penetration and oil demand is happening now, or soon will be.
Assuming no hard landing, China's oil demand should inflect in ~2017 and plateau in
~2025.
Over this time, China would have to add or find substitutes for 24-38 mmboe/d of
transportation energy demand (~125-200% of current US oil consumption), according to
our calculations. That amounts to an average annual increase of ~2.4-3.8 mmboe/d over
the next 10 years. Such a dramatic increase in oil demand puts evermore pressure on the
policy makers to address the nation’s energy security and air pollution.
The prospect of importing an ever larger proportion of China’s oil needs from the most
politically unstable regions of the world, likely has China’s energy policy-makers and
defence establishment working on scenario analyses and defence contingencies. China will
have to break oil’s monopoly on motor vehicle fuel. We believe electric vehicles will be a
major part of the eventual solution.
On the cusp of a car culture Historically, the growth of oil consumption in rapidly developing nations is skewed by the
car ownership threshold. Oil consumption increases linearly with GDP until an inflection
point when per capita PPP GDP hits ~US$10,000/head. China’s PPP per capita GDP has
exceeded US$12,000 (World Bank 2011) in 2014, with oil demand growing 2.2% for the
year.
China’s oil demand inflection point has been delayed by its unbalanced economy. Per
capita GDP may be strong but it is skewed towards investment. Oil demand is driven by
increasing personal vehicle penetration and increased driving habits, which are functions of
per capita household consumption. That oil demand inflection occurs at a per capita PPP
household consumption of ~US$4,000, a level China has just about reached.
Pent-up demand still filling up roads
The explosion of private car ownership was (and still is) largely driven by pent-up demand,
partially divorced from income growth. Car ownership in low income provinces has surged
to levels reached by richer provinces at twice the per capita GDP. This is pent-up demand
released by massive investment in roads and liberalized licensing, which occurred at similar
times nationwide.
To be sure, rich provinces do have higher car penetration than poor provinces. But less
than their relative wealth levels would imply. Also, to be sure, with the exception of the
saturated municipalities of Beijing and Shanghai, car penetration does not appear to be
plateauing in any province, whether rich or poor.
Analysing the data
Plotting car penetration versus per capita GDP for China’s provinces and municipalities for
22 years results in the charts below. Judging by the plotted data alone, we can see that car
penetration versus per capita GDP covers a wide range over the years. Patterns for various
provinces appear to be highly variable – car penetration in poor provinces has not followed
in the footsteps of rich provinces.
On a log scale, we can see that car penetration is inflecting, but across a range of per capita
GDPs. Similarly, we have plotted car penetration versus per capita household consumption
for the past 22 years, and failed to get a materially tighter pattern.
Per capita GDP is not the only driver of car penetration. Per capita household consumption
is somewhat more indicative but ultimately of limited improvement.
Oil security is the most important part of
achieving energy security.
– Zhang Guobao, former Director of
National Energy Administration
Car penetration is driven by massive
investment in roads and liberalized
licensing.
Industrials
Initiating Coverage
2 December 2015
page 59 of 79 , Equity Analyst, +852 3743 8075, [email protected] Aik Yeo
Please see important disclosure information on pages 74 - 79 of this report.

Chart 56: Passenger vehicle penetration vs. per capita GDP,
China provinces and municipalities1991-2013
Source: CEIC, China NBS, World Bank, Jefferies
Chart 57: Passenger vehicle penetration vs. per capita GDP,
China provinces and municipalities1991-2013 (log scale)
Source: CEIC, China NBS, World Bank, Jefferies
Chart 58: Passenger vehicle penetration vs. per household
consumption, China provinces and municipalities1991-
2013
Source: CEIC, China NBS, World Bank, Jefferies
Chart 59: Passenger vehicle penetration vs. per household
consumption, China provinces and municipalities1991-
2013 (log scale)
Source: CEIC, China NBS, World Bank, Jefferies
Inflecting at the same time but at different income levels
We find that car penetration has been inflecting across every province in China, whether
rich or poor. Poor provinces are not waiting to get richer before filling their roads with cars.
Time appears to be an important factor in car penetration. Car penetration in various
provinces surges at different per capita GDP levels but in similar years. This is pent-up
demand released by massive investment in roads and liberalized licensing, which occurred
nationwide at similar times in the past decade.
0
5
10
15
20
25
0 5 10 15 20 25
Cars/100 heads
Per capita PPP GDP ('000 2011 US$)
0
5
10
15
20
25
1 10 100
Cars/100 heads
Per capita PPP GDP ('000 2011 US$)
0
5
10
15
20
25
0 1 2 3 4 5 6 7 8 9 10
Cars/100 heads
Per capita PPP GDP ('000 2011 US$)
0
5
10
15
20
25
0.1 1 10
Cars/100 heads
Household consumption PPP ('000 2011 US$)
Industrials
Initiating Coverage
2 December 2015
page 60 of 79 , Equity Analyst, +852 3743 8075, [email protected] Aik Yeo
Please see important disclosure information on pages 74 - 79 of this report.

Chart 60: Passenger car penetration vs. per capita GDP,
select provinces 1991-2013
Source: CEIC, China NBS, World Bank, Jefferies
Chart 61: Passenger car penetration vs. per capita GDP:
Low, average, high income provinces 1991-2013
Source: CEIC, China NBS, World Bank, Jefferies
Chart 62: Passenger car penetration vs. per capita GDP: low
income provinces 1991-2013
Source: CEIC, China NBS, World Bank, Jefferies
Chart 63: Passenger car penetration vs. per capita GDP:
low-middle income provinces 1991-2013
Source: CEIC, China NBS, World Bank, Jefferies
Chart 64: Passenger penetration vs. per capita GDP: high-
middle income provinces 1991-2013
Source: CEIC, China NBS, World Bank, Jefferies
Chart 65: Passenger penetration vs. per capita GDP: high
income provinces 1991-2013
Source: CEIC, China NBS, World Bank, Jefferies
0
2
4
6
8
10
12
14
16
0 2 4 6 8 10 12 14 16 18 20
Cars/100 heads
Per capita PPP GDP ('000 2011 US$)
0
2
4
6
8
10
12
14
16
0 2 4 6 8 10 12 14 16 18
Cars/100 heads
Per capita PPP GDP ('000 2011 US$)
2013
2012
20112010
20092008
2013
2012
2011
2010
2009
2008
2013
2012
2011
20102009
2008
0
1
2
3
4
5
6
7
0 1 2 3 4 5 6 7 8 9
Cars/100 heads
Per capita PPP GDP ('000 2011 US$)
0
1
2
3
4
5
6
7
8
9
10
0 1 2 3 4 5 6 7 8 9 10
Cars/100 heads
Per capita PPP GDP ('000 2011 US$)
0
2
4
6
8
10
12
0 2 4 6 8 10 12 14 16
Cars/100 heads
Per capita PPP GDP (2005 US$)
0
5
10
15
20
25
0 5 10 15 20 25
Cars/100 heads
Per capita PPP GDP ('000 2011 US$)
Industrials
Initiating Coverage
2 December 2015
page 61 of 79 , Equity Analyst, +852 3743 8075, [email protected] Aik Yeo
Please see important disclosure information on pages 74 - 79 of this report.
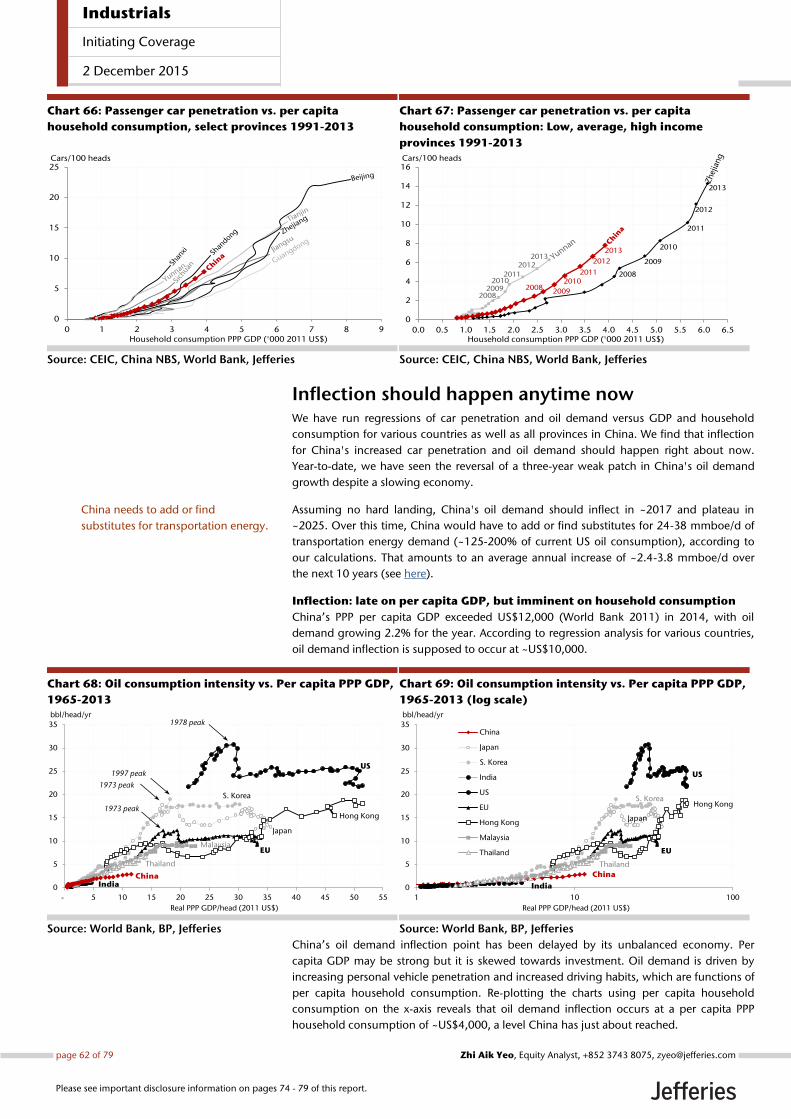
Chart 66: Passenger car penetration vs. per capita
household consumption, select provinces 1991-2013
Source: CEIC, China NBS, World Bank, Jefferies
Chart 67: Passenger car penetration vs. per capita
household consumption: Low, average, high income
provinces 1991-2013
Source: CEIC, China NBS, World Bank, Jefferies
Inflection should happen anytime now We have run regressions of car penetration and oil demand versus GDP and household
consumption for various countries as well as all provinces in China. We find that inflection
for China's increased car penetration and oil demand should happen right about now.
Year-to-date, we have seen the reversal of a three-year weak patch in China's oil demand
growth despite a slowing economy.
Assuming no hard landing, China's oil demand should inflect in ~2017 and plateau in
~2025. Over this time, China would have to add or find substitutes for 24-38 mmboe/d of
transportation energy demand (~125-200% of current US oil consumption), according to
our calculations. That amounts to an average annual increase of ~2.4-3.8 mmboe/d over
the next 10 years (see here).
Inflection: late on per capita GDP, but imminent on household consumption
China’s PPP per capita GDP exceeded US$12,000 (World Bank 2011) in 2014, with oil
demand growing 2.2% for the year. According to regression analysis for various countries,
oil demand inflection is supposed to occur at ~US$10,000.
Chart 68: Oil consumption intensity vs. Per capita PPP GDP,
1965-2013
Source: World Bank, BP, Jefferies
Chart 69: Oil consumption intensity vs. Per capita PPP GDP,
1965-2013 (log scale)
Source: World Bank, BP, Jefferies
China’s oil demand inflection point has been delayed by its unbalanced economy. Per
capita GDP may be strong but it is skewed towards investment. Oil demand is driven by
increasing personal vehicle penetration and increased driving habits, which are functions of
per capita household consumption. Re-plotting the charts using per capita household
consumption on the x-axis reveals that oil demand inflection occurs at a per capita PPP
household consumption of ~US$4,000, a level China has just about reached.
0
5
10
15
20
25
0 1 2 3 4 5 6 7 8 9
Cars/100 heads
Household consumption PPP GDP ('000 2011 US$)
0
2
4
6
8
10
12
14
16
0.0 0.5 1.0 1.5 2.0 2.5 3.0 3.5 4.0 4.5 5.0 5.5 6.0 6.5
Cars/100 heads
Household consumption PPP GDP ('000 2011 US$)
20132012
20112010
20092008
2013
2012
2011
2010
2009
2008
2013
2012
20112010
20092008
Japan
S. Korea
0
5
10
15
20
25
30
35
- 5 10 15 20 25 30 35 40 45 50 55
bbl/head/yr
Real PPP GDP/head (2011 US$)
1978 peak
ChinaIndia
EU
1973 peak
US1997 peak
1973 peak
Malaysia
Thailand
Hong Kong Japan
S. Korea
0
5
10
15
20
25
30
35
1 10 100
bbl/head/yr
Real PPP GDP/head (2011 US$)
China
Japan
S. Korea
India
US
EU
Hong Kong
Malaysia
Thailand
China
India
EU
US
Thailand
Hong Kong
China needs to add or find
substitutes for transportation energy.
Industrials
Initiating Coverage
2 December 2015
page 62 of 79 , Equity Analyst, +852 3743 8075, [email protected] Aik Yeo
Please see important disclosure information on pages 74 - 79 of this report.

Chart 70: Oil consumption intensity vs. Per capita
household consumption, 1966-2013
Source: World Bank, BP, Jefferies
Chart 71: Oil consumption intensity vs. Per capita
household consumption, 1966-2013 (log scale)
Source: World Bank, BP, Jefferies
Car penetration for many countries also appears to inflect at about a PPP per capita
household consumption of US$4,000. We believe the growth in China’s car penetration
was driven, in large part, by pent-up demand; it will soon be driven by growing levels of
consumption.
Chart 72: Passenger vehicle penetration vs. Per capita
household consumption, 2000-2011
Source: World Bank, Jefferies
Chart 73: Passenger vehicle penetration vs. Per capita
household consumption 2000-2011 (log scale)
Source: World Bank, Jefferies
Lowering Vehicle Emissions Despite China’s ~140m fleet of motor vehicles and the daily congestion during rush hour in
China’s major metropolises, vehicle emissions are not yet as big a source of air pollution as
they are for some other developed countries. According to the Ministry of Environmental
Protection, motor vehicles emissions, excluding motorcycles, accounted for fewer than 5%
of total particulate matter emissions and SO2 emissions. Motor vehicles emissions do
account for 26% of total NOX emissions in China though.
As China’s population becomes wealthier, per capita income increases and China develops
a middle class, we expect vehicle ownership and, in-turn, vehicle emissions to accelerate
along the S-curve. According to McKinsey, the number of high-income urban households –
those earning more than Rmb80,000 a year -- will expand greatly, to 58% in 2020, from
17% in 2011.
0
5
10
15
20
25
30
35
- 5 10 15 20 25 30 35 40
bbl/head/year
Per capita household consumption ('000 2011 US$)
US
India
EU
Hong Kong
S. KoreaJapan
Malaysia
Thailand
China
0
5
10
15
20
25
30
35
1 10 100
bbl/head/year
Per capita household consumption ('000 2011 US$)
US
India
EU
Hong Kong
S. KoreaJapan
Malaysia
Thailand
China
0
100
200
300
400
500
- 2 4 6 8 10 12 14 16 18 20
Vehicles/1000
Per capita household consumption ('000 2011 US$)
EU
S. Korea
Japan
Malaysia
ThailandChina
Poland
MexicoKazakhstanHong Kong
0
100
200
300
400
500
1 10 100
Vehicles/1000
Per capita household consumption ('000 2011 US$)
EU
S. Korea
Japan
Malaysia
ThailandChina
Poland
MexicoKazakhstan
Hong Kong
Industrials
Initiating Coverage
2 December 2015
page 63 of 79 , Equity Analyst, +852 3743 8075, [email protected] Aik Yeo
Please see important disclosure information on pages 74 - 79 of this report.

HDT and Yellow Label are today’s problems
Trucks account for 22% of China’s motor vehicles but are responsible for 78% of China’s
vehicle particulate matter emissions. Heavy duty trucks account for 60% of vehicle
particulate matter emissions despite representing only 4% of China’s motor vehicles.
However, yellow label vehicles are another headache for regulators; these are vehicles that
fail to meet GuoI for gasoline vehicles and GuoIII for diesel vehicles. Yellow label vehicles
account for 11% of China’s motor vehicle fleet, but contribute 79% of China’s vehicle
particulate matter emissions.
Chart 74: Motor Vehicle (2013)
Source: MEP, Jefferies
Chart 75: Vehicles PM Emission (2013)
Source: MEP, Jefferies
Chart 76: “Yellow Label” Motor Vehicles on the Decline
Source: MEP, Jefferies
Chart 77: “Yellow Label” Accounts for Most Emissions
Source: MEP, Jefferies
Yellow Label vehicles are low hanging fruit
Yellow label vehicles are a significant problem for environmental regulators. The fact that
yellow label vehicles have declined from 20% of China’s motor vehicle fleet in 2010 to 11%
today would seem to be encouraging. However, yellow label vehicles’ decline in market
share is driven by the growth in motor vehicles over the past few years. In fact, yellow label
vehicles have only declined in number terms by a 2010-13 CAGR of 5%.
Eliminating yellow label vehicles is an effective way to lower air pollution in China. By 2015,
the aim is to eliminate all yellow label cars in JingJinJi, the Yangtze River Delta and the Pearl
River Delta. By 2017, the aim is to eliminate all yellow labels in China. The difficulty remains
local enforcement. One possible remedy is to offer subsidies. For example, last year, Beijing
offered subsidies of Rmb2,500-14,500 to people who turned in old vehicles; the subsidies
did not apply to vehicles that failed to meet the most basic of emission standards.
Tighter emission requirements coming to pass
Implementation of EuroIV (renamed GuoIV in China) fuel has been delayed for 3 years as
regulators and operators bicker over financing. The NDRC's subsequent pricing guidance
Mini PV3%
Small PV79%
Mid & Large PV2%
Light-Duty Truck10%
MDT2%
HDT4%
Small PV4%
Mid & Large PV18%
Light-Duty Truck10% MDT
8%
HDT60%
0%
5%
10%
15%
20%
25%
30%
13.0
13.5
14.0
14.5
15.0
15.5
16.0
2010 2011 2012 2013
% of Fleetmn
0%
10%
20%
30%
40%
50%
60%
70%
80%
90%
100%
CO HC NOX PMYellow Label Other Motor Vehicles
China aims to eliminate all yellow
labels by 2017 against air pollution
China passed stricter vehicle
emission standards against air
pollution
Industrials
Initiating Coverage
2 December 2015
page 64 of 79 , Equity Analyst, +852 3743 8075, [email protected] Aik Yeo
Please see important disclosure information on pages 74 - 79 of this report.

for GuoIV (gasoline/diesel price increases of Rmb290/370 per ton) results in an estimated
~US$3.85/bbl increase to GRM when fully implemented, according to our calculations.
Sinopec believes costs will only increase marginally as much of the capex has already been
spent. We believe risks to refining margins are to the upside.
Euro IV finally
After a delay of +3 years, China has finally committed to implementing Euro IV fuel
standards in 2014 (Jan 1 for gasoline, yearend for diesel). From Euro III, Euro IV is the next
generation of vehicle emissions standards, implementing advanced vehicle fuel and
emissions management systems.
The technical gist
Emissions control systems on the vehicle remove nitrous oxides (NOx), carbon monoxide
(CO) and unburned hydrocarbons (HC) using computerized fuel injection, exhaust gas
recirculation and, most importantly, a three-way catalytic converter (removes NOx, CO and
HC). A catalytic converter cannot function correctly if the sulphur dioxide (SO2) content of
emissions exceeds its design parameters. The more advanced the catalytic converter, the
lower SO2 levels it can tolerate in the exhaust.
Chart 78: China and EU diesel sulfur levels
Source: European Commission, DieselNet, Jefferies
Chart 79: China and EU gasoline sulfur levels
Source: European Commission, DieselNet, Jefferies
With China’s vehicle ownership likely to accelerate in the coming years, China needs to
implement stricter emission requirements.
Exhibit 2: Implementation of Emission Standards for New Vehicles
Source: MEP, Jefferies
Exhibit 3: Emission Standards for Gasoline Vehicles
Source: MEP, Jefferies
-
250
500
750
1,000
1,250
1,500
1,750
2,000
Jan
-95
Jan
-96
Jan
-97
Jan
-98
Jan
-99
Jan
-00
Jan
-01
Jan
-02
Jan
-03
Jan
-04
Jan
-05
Jan
-06
Jan
-07
Jan
-08
Jan
-09
Jan
-10
Jan
-11
Jan
-12
Jan
-13
Jan
-14
Jan
-15
Jan
-16
ppm
Euro I, 2000 ppm
Euro II, 500 ppm
Euro III, 350 ppm
Euro IV, 50 ppm
Euro V, 10 ppm
ChinaEU
-
250
500
750
1,000
1,250
1,500
1,750
2,000Ja
n-9
5
Jan
-96
Jan
-97
Jan
-98
Jan
-99
Jan
-00
Jan
-01
Jan
-02
Jan
-03
Jan
-04
Jan
-05
Jan
-06
Jan
-07
Jan
-08
Jan
-09
Jan
-10
Jan
-11
Jan
-12
Jan
-13
Jan
-14
Jan
-15
Jan
-16
ppm
Euro I, 2000 ppm
Euro II, 500 ppm
Euro III, 150 ppm
Euro IV, 50 ppm
Euro V, 10 ppm
ChinaEU
Car Type 2006 2007 2008 2009 2010 2011 2012 2013
Light Vehicles Diesel Vehicles Guo II Guo III
Gasoline Vehicles Guo II Guo III Guo IV
Gas fueled Vehicles Guo II Guo III Guo IV
Heavy Vehicles Diesel Vehicles Guo II Guo III Guo IV
Gasoline Vehicles Guo II Guo III Guo IV
Gas fueled Vehicles Guo II Guo III Guo IV Guo V
Motorcycle Motorcycles & mopeds Guo II Guo III
Motor tricycle Guo II Guo III
Low-speed Vehicles N/A Guo I Guo II
Non-road Mobile Machinery Diesel Engine N/A Guo I Guo II
Small gasoline Engine N/A Guo I
Environmental Indicators
GB17930
Guo III
GB17930
Guo IV
GB17930
Guo V Beijing Shanghai Guangdong Jiangsu
Sulfur Content (ppm) ≤150 ≤50 ≤10 ≤10 ≤10 ≤50 ≤10
Summer vapor pressure (kPa) ≤72 40-68 40-65 40-65 42-65 45-60 40-65
Olefin (vol%) ≤30 ≤28 ≤24 ≤24 ≤25 ≤25 ≤25
Manganese content (mg/L) ≤16 ≤8 ≤2 ≤2 ≤2 ≤8 ≤2
Aromatics + Olefin (vol%) ≤70 ≤68 N/A N/A ≤60 ≤60 N/A
Aromatics (vol%) N/A N/A ≤40 ≤40 N/A N/A ≤40
Implementation Date 1-Jan-10 1-Jan-14 1-Jan-18 18-Dec-13 1-Sep-13 1-Jun-10 31-Oct-13
Industrials
Initiating Coverage
2 December 2015
page 65 of 79 , Equity Analyst, +852 3743 8075, [email protected] Aik Yeo
Please see important disclosure information on pages 74 - 79 of this report.

Exhibit 4: Emission Standards for Diesel Vehicles
Source: MEP, Jefferies
Battery Basics A battery is a unit of one or more cells (also termed batteries themselves) in which chemical
energy is converted into electricity, and in the case of electric vehicles, mechanical energy.
Energy is created when chemical reactions transfer energy from the electrodes to the
electrolyte at their interface. The key components of a battery are the cathode, anode,
separator, and electrolyte.
We discuss the component in more detail below:
Cathode: The positive end of the battery. It creates power by attracting electrons through
a circuit with positive ions. A cathode can be made out of several materials including lead-
acid (Pb+), carbon-zinc, alkaline, nickel metal hydride (NiMH), nickel cadmium (NiCd),
manganese lithium-ion (Mn Li-ion), iron phosphate lithium-ion (PO4 Li-ion), nickel cobalt
manganese lithium-ion (NCM Li-ion), and nickel cobalt aluminum lithium-ion (NCA Li-ion).
Anode: The negative end of the battery. It acts as a counterpart to the cathode. The ions
are stored in the anode when the battery is charged.
Separator: A thin film within the electrolyte that separates the anode and the cathode. It is
made out of a polymer and is microporous, which means that it facilitates the transfer of
ions while preventing the anode and cathode from touching, which would cause the cell to
short out.
Electrolyte: A liquid that houses the anode, cathode, and separator and ensures ion
transfer between the electrodes. The electrolyte is made up of organic solvents and lithium
salts. An important quality of the electrolyte is that it is not electrically conductive, which
would cause the cell to short out if the electrons were able to pass between the cathode
and anode within the cell, instead of being forced through an external circuit.
Exhibit 5: A Visual Diagram of a Battery
Source: MEP, Jefferies
Regular
Diesel
Environmental Indicators
GB19147
Guo III
GB1914
Guo IV
GB17947
Guo V Beijing Shanghai Guangdong Hainan GB252
Sulfur Content (ppm) ≤350 ≤50 ≤10 ≤10 ≤10 ≤50 ≤50 ≤350
Cetane ≥49 ≥49 ≥51 ≥51 ≥51 ≥51 ≥49 ≥45
Density (kg/m3) 810-850 810-850 810-850 800-845 800-845 800-845 810-850 Report
PAHs (%) ≤11 ≤11 ≤11 ≤11 ≤11 ≤11 ≤11 N/A
Lubrication (µm) ≤460 ≤460 ≤460 ≤460 ≤460 ≤460 ≤460 N/A
Implementation Date 1-Jul-11 1-Jan-15 1-Jan-18 31-May-12 1-Sep-13 1-Jun-10 20-Nov-13 1-Jul-13
Vehicle Use Diesel
Industrials
Initiating Coverage
2 December 2015
page 66 of 79 , Equity Analyst, +852 3743 8075, [email protected] Aik Yeo
Please see important disclosure information on pages 74 - 79 of this report.

A battery’s characteristics depend, in large part, on their constituent materials. There are a
wide range of battery systems made from varied metals, each with distinct attributes.
We discuss the most common battery systems below:
Lead Acid Batteries. Lead-based battery technology was first developed in 1859 and
today’s flooded batteries are not significantly different from those made 100 years ago.
Lead acid batteries are widely used in automobiles, aircraft, uninterruptible power supply
(UPS) applications, motive power (forklifts), telecom, and reserve power. The benefits of
lead acid technology are that it is proven, with over 100 years of commercial/residential
use, and it is safe. Additionally, lead-acid batteries are the cheapest battery technology
available. The disadvantage of this battery type is that it has lower energy density in
comparison to the newer advanced battery technologies, is significantly heavier, and has
greater life cycle constraints. Newer lead acid technologies such as absorbent glass mat
(AGM) have a better cycle life and are used in start-stop systems in cars that require
frequent charging and discharging.
Nickel-Cadmium (NiCd). NiCd batteries make up a small niche of the industrial battery
market with only 4% of total units. NiCd batteries are largely used in industrial applications
including industrial and telecom standby power, and in the aviation and rail markets for
back-up power and starting systems. Additionally, NiCd batteries are used in consumer
electronics and power tools. The batteries have better energy density than lead acid
batteries and a longer cycle life, but are environmentally unfriendly, and are 1.5x to 3.0x
the price of lead acid batteries in industrial applications.
Nickel-Metal-Hydride (NiMH). NiMH batteries are used in the transportation (hybrid
vehicles) and consumer electronic markets. The first wave of hybrid vehicle adoption has
been driven by NiMH batteries. NiMH technology represented a revolution for the auto
business as the technology offers high enough energy density and low enough weight to
be functional for assisting in powering vehicles.
NiMH has higher energy density compared to lead acid and NiCd batteries, but it has
reduced cycle life vs. NiCd. While battery life is a constraint, with proper energy
management systems NiMH batteries can be kept from fully discharging, thereby extending
overall battery life to an acceptable level – in the case of hybrid automobile batteries
increasing expected battery life to more than 10 years. NiMh was the preferred chemical
configuration for hybrid vehicles such as the Prius based on its lower cost and higher safety
profile (at the time). The disadvantages of NiMh include a high self-discharge rate.
Lithium-ion. Lithium-based batteries were first introduced by Sony in 1991. The initial
application for Li-ion batteries was in consumer electronics as portable batteries for laptops
and cell phones. Lithium-based batteries now serve the consumer electronic, military and
space industries and most recently, the hybrid vehicle market. Li-ion batteries have higher
energy density than predecessor chemistries, and at the same time have lower weight and
can potentially be produced at significantly lower cost at scale production. As a result, Li-
ion has become the technology of choice for the consumer electronics industry and a
natural progression in the HEV/EV market.
Lithium batteries typically use a carbon anode material, a metal oxide or phosphate for the
cathode material, and a lithium salt as the electrolyte. The most commonly used
commercial lithium battery chemistries typically vary on the material used for the cathode.
Common chemical combinations include:
Lithium cobalt oxide (LiCoO2): This chemical combination has the highest
energy capacity, as much as 200+ Wh/kg and is used in laptops and consumer
electronics. The tradeoff is greater risk of thermal runaway and shorter cycle life.
Cannot be charged or discharged at current higher than its rating.
Lithium iron phosphate (LiFePO4): Phosphate batteries are typically more
stable and safer, have improved cycle counts and shelf life, but have lower energy
Industrials
Initiating Coverage
2 December 2015
page 67 of 79 , Equity Analyst, +852 3743 8075, [email protected] Aik Yeo
Please see important disclosure information on pages 74 - 79 of this report.

density. Excellent safety and life span, moderate specific energy and elevated self-
discharge.
Lithium manganese oxide (LiMn2O4): Spinel structure provides lower
internal resistance, capacity is one-third lower than Li-cobalt and higher than
Liphosphate but still 50% more than nickel-based batteries. Engineers can design
for long life, maximum load current (specific power), or high capacity (specific
energy).
Lithium nickel cobalt aluminium oxide (LiNiCoAlO2): This chemical
combination is less commonly used in consumer electronics, but has high specific
energy and power densities and a good lifespan, making it attractive for the EV
industry. Tesla uses a lithium nickel cobalt aluminium oxide (NCA) combination in
its batteries. Lithium cobalt oxide is the most commonly used combination for
consumer electronics and has very high specific energy, but its stability and
lifespan are insufficient for vehicle applications. Lithium iron phosphate and
lithium manganese are safer with better life but lower capacity. NCA has higher
energy and power density and a good life span.
Lithium polymer (LiPo): In LiPo cells, the lithium salt electrolyte is not held in
an organic solvent but in a solid polymer composite. It is sold in flexible pouch
cells that can be shaped in almost any way but require a solid casing to retain
their shape.
Storing and generating electricity
Electricity is generated in the process of discharging when ion cells travel within the
electrolyte and through the separator from the negatively-charged anode to the positively-
charged cathode. Simultaneously, electrons flow through a circuit outside of the battery
that connects the anode to the cathode.
When the battery is charging, ions migrate from the positively charged cathode, passing
through the separator within the electrolyte, to be housed between the layers of the
negatively-charged anode. Simultaneously, electrons flow from the cathode to the anode
through an external circuit. This process allows the battery to take in and store energy for
future use. Charging continues until the process is either stopped to use the battery (hence,
to enter the discharging phase and reverse the flow of both the ions and the electrons) or
until there has been a complete transfer of all of the ions over to the anode to become fully
charged. When the ions are fully transferred from the cathode to the anode, the battery
stops charging, because the electrons can only move if the ions are moving.
Conversely, when the battery is discharging, both the ions and the electrons travel in the
opposite direction of their journey during charging. Ions flow from the negatively-charged
anode, through the electrolyte and separator, to the positively-charged cathode.
Simultaneously, the electrons move from the anode to the cathode through an external
circuit that includes an electrically conductive path within the device being powered
Discharging continues until the process is either stopped to recharge the battery (hence, to
enter the charging phase and reverse the flow of both the ions and the electrons) or until
there has been a complete transfer of all of the ions over to the cathode (i.e., the battery is
exhausted).
Industrials
Initiating Coverage
2 December 2015
page 68 of 79 , Equity Analyst, +852 3743 8075, [email protected] Aik Yeo
Please see important disclosure information on pages 74 - 79 of this report.

Exhibit 6: A Battery in Charging and Discharging States
Source: MEP, Jefferies
Measuring battery performance
Batteries are assessed on several different metrics that quantify their performance and
safety. The most important terms to describe the performance of batteries are capacity,
voltage, energy, and power.
Capacity is a measure of the amount of electrons that an individual battery cell provides.
This metric is calculated in terms of milli-ampere-hours/gram (mAH/g, based on weight) or
milli-ampere-hours/cubic centimeter (mAh/cc, based on volume). The capacity of a battery
determines how long it will be able to generate power in the discharging state. An analogy
for this measurement is the amount of water in a hose.
Voltage is a measure of electric force, which is derived from the difference in potential
energy between the anode and the cathode, and is a function of the metal used in the
cathode. In today’s cells, if the metal is cobalt, nickel, manganese, or any combination of
those, the average voltage is about 3.7V (iron phosphate cells average 3.3V). An analogy of
the voltage of a battery is to think about the pressure strength of water flowing out of a
hose.
Energy is calculated as capacity multiplied by voltage and is expressed as a watt-hour, or
in the case of electric vehicles, kilowatt-hours (kWh, or 1,000 watt-hours).
Power is calculated as energy divided by time, expressed in watts. High power batteries
with rapid discharge capability are used for bursts of energy, such as in vehicular
acceleration and portable tools.
Aside from the key performance metrics of capacity, voltage, energy, and power, the
lifetime and efficiency of batteries are described and impacted by other qualities inherent in
all batteries. These qualities, which include memory effect, cycle life, conditioning, self-
discharge, and material density, are described in more detail below.
Industrials
Initiating Coverage
2 December 2015
page 69 of 79 , Equity Analyst, +852 3743 8075, [email protected] Aik Yeo
Please see important disclosure information on pages 74 - 79 of this report.
Electric Vehicle Basics The electric vehicle industry has traditionally been broken down into three main categories,
depending on the reliance of existing drivetrains to all-electric vehicles:
Hybrid Electric Vehicle (HEV) refers to a vehicle that uses both an internal combustion
engine (using conventional gasoline, diesel, or biodiesel) in tandem with either an electric
motor powered by a rechargeable battery (either NiMH or Li-Ion) much larger and more
powerful than the 12V starter battery. There are many different types of hybrids used by
OEMs that offer varying degrees of improved fuel economy and reduced carbon emissions
depending on the vehicle’s target market. However, current models produced by major
OEMs generally fall into two broad categories of “strong” or “mild” hybrid.
Typically, a strong hybrid includes a smaller internal combustion engine (compared to a
traditional ICE vehicle) assisted by a separate electric motor that can provide added torque
or can propel the vehicle while shutting off the internal combustion engine at lower
speeds. The result is better city mileage relative to highway mileage performance. The
electric motor is powered by a large rechargeable electric battery that can be charged either
by regenerative braking (utilizing the kinetic energy from braking) or by the internal
combustion engine.
A mild hybrid can only be propelled by an internal combustion engine and a smaller
electric motor is used to provide a boost to the ICE, which is typically smaller to save on
fuel. Because mild hybrids lack an electric drive train they require a much smaller
rechargeable battery compared to strong hybrids and also have fewer additional
components. The rechargeable battery can be charged by either the internal combustion
engine or through regenerative braking. Since mild hybrids lack the ability to run
exclusively on an electric engine, they usually have better highway mileage than city
mileage (similar to conventional ICE vehicles).
Plug-In Hybrid Electric Vehicle (PHEV) differ from strong hybrid HEVs in that PHEVs
have an all-electric range (approximately 31–50 miles in select PHEV models) and can be
plugged into an electric outlet to charge their primary battery. PHEVs utilize the electric
drive train as the main source of propulsion while the purpose of the internal combustion
engine is to extend the vehicles driving range (beyond 40 miles).
Depending on the PHEV configuration, a combustion engine can be used as an optional
and direct source of propulsion (Parallel Hybrid) or a combustion engine can be used but
only as a power source to drive the electric motor (Series Hybrid). Batteries for PHEVs,
regardless of configuration, will require superior energy densities capable of storing a much
greater amount of energy and providing sufficient power for longer sustained periods than
batteries for current HEVs.
Fuel economy for PHEVs can greatly exceed that of conventional HEVs given that most daily
commutes are shorter than the all-electric range of 31–50 miles. PHEVs could be well suited
for markets that have very high fuel costs but low electricity costs and regions where
relatively clean energy sources such as nuclear, hydro, and other renewables are more
commonly used. The disadvantages for owning PHEVs are the high up-front cost of the
batteries and the lack of infrastructure or stations that will enable rapid recharging.
Electric Vehicle (EV or BEV) is the purest form of electrified vehicle in that it relies solely
on an electrical motor(s) as its source of propulsion. EVs do not emit any notable
greenhouse gases during the operation although it can be argued that EVs GHG emission to
the generation source. An EV electric motor is propelled by a high powered, large capacity
rechargeable battery pack (larger than a typical PHEV battery pack) that can be recharged
by connecting to an electric outlet.
Current EV designs travel 62–270 miles before they need to be recharged, but do not have
the benefit of range extension. Early entrants into the EV space include the Tesla Roadster;
the Nissan Leaf was the first significant “mass market” EV introduced in 2011.
Industrials
Initiating Coverage
2 December 2015
page 70 of 79 , Equity Analyst, +852 3743 8075, [email protected] Aik Yeo
Please see important disclosure information on pages 74 - 79 of this report.
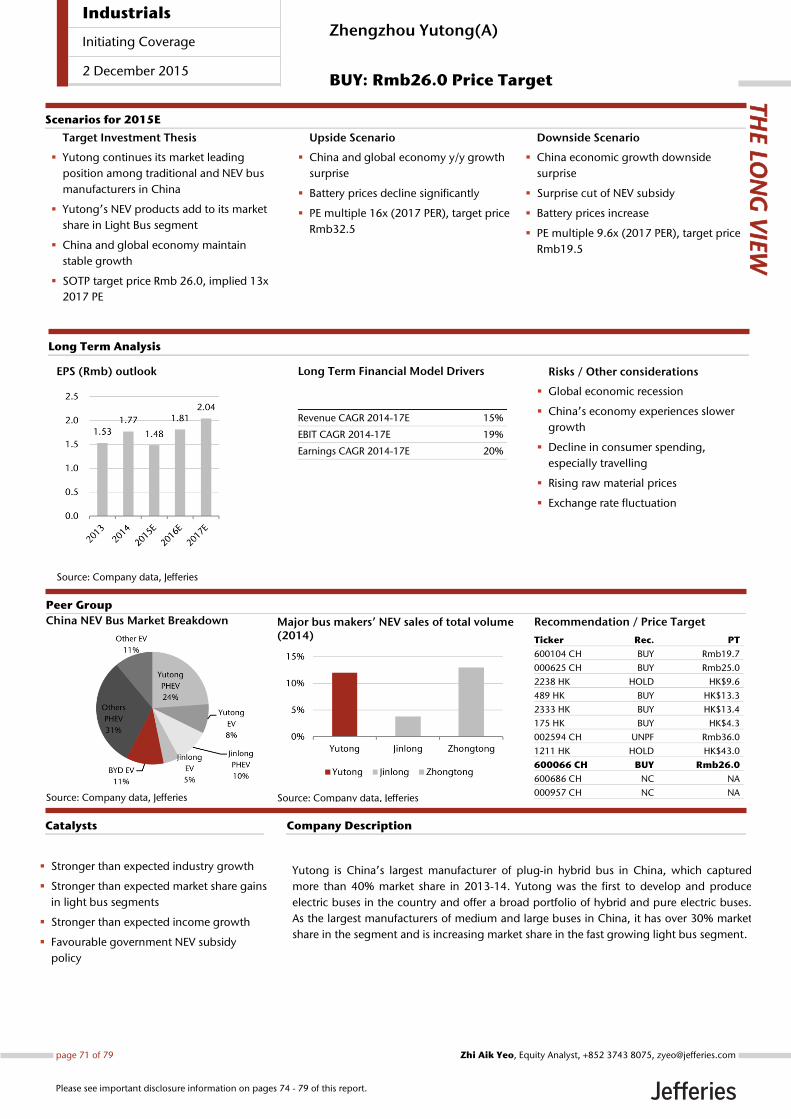
EPS (Rmb) outlook
Source: Company data, Jefferies
Yutong is China’s largest manufacturer of plug-in hybrid bus in China, which captured
more than 40% market share in 2013-14. Yutong was the first to develop and produce
electric buses in the country and offer a broad portfolio of hybrid and pure electric buses.
As the largest manufacturers of medium and large buses in China, it has over 30% market
share in the segment and is increasing market share in the fast growing light bus segment.
Stronger than expected industry growth
Stronger than expected market share gains
in light bus segments
Stronger than expected income growth
Favourable government NEV subsidy
policy
Catalysts
Target Investment Thesis
Yutong continues its market leading
position among traditional and NEV bus
manufacturers in China
Yutong’s NEV products add to its market
share in Light Bus segment
China and global economy maintain
stable growth
SOTP target price Rmb 26.0, implied 13x
2017 PE
Upside Scenario
China and global economy y/y growth
surprise
Battery prices decline significantly
PE multiple 16x (2017 PER), target price
Rmb32.5
Downside Scenario
China economic growth downside
surprise
Surprise cut of NEV subsidy
Battery prices increase
PE multiple 9.6x (2017 PER), target price
Rmb19.5
Long Term Analysis
Scenarios for 2015E
China NEV Bus Market Breakdown
Source: Company data, Jefferies
Major bus makers’ NEV sales of total volume (2014)
Source: Company data, Jefferies
Company Description
THE LO
NG
VIE
W
Peer Group
Zhengzhou Yutong(A)
BUY: Rmb26.0 Price Target
Risks / Other considerations
Global economic recession
China’s economy experiences slower
growth
Decline in consumer spending,
especially travelling
Rising raw material prices
Exchange rate fluctuation
Long Term Financial Model Drivers
Revenue CAGR 2014-17E 15%
EBIT CAGR 2014-17E 19%
Earnings CAGR 2014-17E 20%
Recommendation / Price Target
Ticker Rec. PT
600104 CH BUY Rmb19.7
000625 CH BUY Rmb25.0
2238 HK HOLD HK$9.6
489 HK BUY HK$13.3
2333 HK BUY HK$13.4
175 HK BUY HK$4.3
002594 CH UNPF Rmb36.0
1211 HK HOLD HK$43.0
600066 CH BUY Rmb26.0
600686 CH NC NA
000957 CH NC NA
Industrials
Initiating Coverage
2 December 2015
page 71 of 79 , Equity Analyst, +852 3743 8075, [email protected] Aik Yeo
Please see important disclosure information on pages 74 - 79 of this report.

EPS (Rmb) outlook
Source: Company data, Jefferies
BYD Company Limited (stock code: H Shares: 1211 HK; A Shares: 002594 CH) is principally
engaged in rechargeable battery and photovoltaic business, handset components and
assembly services, as well as automobile business which includes traditional fuel-engined
vehicles and new energy vehicles while taking advantage of its technological superiority to
actively develop business relating to the area of new energy products.
Stronger than expected industry growth
Stronger than expected market share gains
in light bus segments
Stronger than expected income growth
Favourable government NEV subsidy
policy
Catalysts
Target Investment Thesis
BYD maintains its NEV PV market leading
position in China
BYD new NEV models maintain their price
and battery competitive advantages over
others
China and global economy maintain
stable growth
SOTP Target Price HK$43.0, implying 42x
17e PE
Upside Scenario
China and global economy y/y growth
surprise
More stimulus to support NEV demand
Battery prices increase
PE multiple 53x (2017 PER), target price
HK$53.8
Downside Scenario
China economic growth downside
surprise
Surprise cuts of NEV subsidy
Battery industry oversupplies
PE multiple 32x (2017 PER), target price
HK$32.3
Long Term Analysis
Scenarios for 2015E
NEV sales mix of major NEV OEMs
Source: Company data, Jefferies
Passenger vehicle sales volume
Source: Company data, Jefferies
Company Description
THE LO
NG
VIE
W
Peer Group
BYD(H)
HOLD: HK$43.0 Price Target
Risks / Other considerations
China’s economy experiences slower
growth
Decline in consumer spending
Change in China NEV subsidy policy
Stronger than expected
Global economic recession
Significant decline in battery price
Long Term Financial Model Drivers
Revenue CAGR 2014-17E 12%
EBIT CAGR 2014-17E 55%
Earnings CAGR 2014-17E 70%
Recommendation / Price Target
Ticker Rec. PT
600104 CH BUY Rmb19.7
200625 CH BUY HK$25.5
2238 HK HOLD HK$9.6
1114 HK HOLD HK$10.8
489 HK BUY HK$13.3
2333 HK BUY HK$13.4
175 HK BUY HK$4.3
002594 CH UNPF Rmb36.0
1211 HK HOLD HK$43.0
Zoyte-unlisted NC NA
Chery-unlisted NC NA
Industrials
Initiating Coverage
2 December 2015
page 72 of 79 , Equity Analyst, +852 3743 8075, [email protected] Aik Yeo
Please see important disclosure information on pages 74 - 79 of this report.

EPS (Rmb) outlook
Source: Company data, Jefferies
BYD Company Limited (stock code: H Shares: 1211 HK; A Shares: 002594 CH) is principally
engaged in rechargeable battery and photovoltaic business, handset components and
assembly services, as well as automobile business which includes traditional fuel-engined
vehicles and new energy vehicles while taking advantage of its technological superiority to
actively develop business relating to the area of new energy products.
Stronger than expected industry growth
Stronger than expected market share gains
in light bus segments
Stronger than expected income growth
Favourable government NEV subsidy
policy
Catalysts
Target Investment Thesis
BYD continues its NEV PV market leading
position in China
BYD new NEV models maintain its price
and battery competitive advantages over
others
China and global economy maintain
stable growth
SOTP target Price Rmb36.0, implying 42x
17e PE
Upside Scenario
China and global economy y/y growth
surprise
More stimulus to support NEV demands
Battery prices increase
PE multiple 53x (2017 PER), target price
Rmb45.0
Downside Scenario
China economic growth downside
surprise
Surprise cut of NEV subsidy
Battery industry oversupplies
PE multiple 32x (2017 PER), target price
Rmb27.0
Long Term Analysis
Scenarios for 2015E
NEV sales mix of major NEV OEMs
Source: Company data, Jefferies
Passenger vehicle sales volume
Source: Company data, Jefferies
Company Description
THE LO
NG
VIE
W
Peer Group
BYD(A)
UNDERPERFORM: Rmb36.0 Price Target
Risks / Other considerations
China’s economy experiences slower
growth
Decline in consumer spending
Change in China NEV subsidy policy
Stronger than expected
Global economic recession
Significant decline in battery price
Long Term Financial Model Drivers
Revenue CAGR 2014-17E 12%
EBIT CAGR 2014-17E 55%
Earnings CAGR 2014-17E 70%
Recommendation / Price Target
Ticker Rec. PT
600104 CH BUY Rmb19.7
200625 CH BUY HK$25.5
2238 HK HOLD HK$9.6
1114 HK HOLD HK$10.8
489 HK BUY HK$13.3
2333 HK BUY HK$13.4
175 HK BUY HK$4.3
002594 CH UNPF Rmb36.0
1211 HK HOLD HK$43.0
Zoyte-unlisted NC NA
Chery-unlisted NC NA
Industrials
Initiating Coverage
2 December 2015
page 73 of 79 , Equity Analyst, +852 3743 8075, [email protected] Aik Yeo
Please see important disclosure information on pages 74 - 79 of this report.

Company DescriptionBYD Company Limited is principally engaged in the research, development, manufacture and distribution of automobiles, secondaryrechargeable batteries and mobile phone components. The company operates its businesses primarily through automobile business, whichprovides automobiles, including G6, S6 and other series; secondary rechargeable battery business, which provides lithium-ion batteries andnickel batteries, which are applied in mobile phones, digital cameras, electric tools, electric toys and other portable electronic devices, aswell as mobile phone components and assembly businesses, which offers casings, keypads, liquid crystal display (LCD) modules, cameras,flexible circuit boards, chargers, and mobile phone design and assembly services. The company operates its business within the domesticmarket and in overseas markets.
Zhengzhou Yutong Bus Co., Ltd. is principally engaged in the manufacture and sale of buses. The company’s main product portfolio consistsof school coaches, enterprise shuttle buses, caravans, motor homes, new energy buses, sightseeing buses, urban buses among others. It alsoprovides ground passenger transportation services. The company distributes its products within domestic markets and to overseas markets.
Analyst Certification:I, Zhi Aik Yeo, certify that all of the views expressed in this research report accurately reflect my personal views about the subject security(ies) andsubject company(ies). I also certify that no part of my compensation was, is, or will be, directly or indirectly, related to the specific recommendationsor views expressed in this research report.I, Joseph Fong, CFA, certify that all of the views expressed in this research report accurately reflect my personal views about the subject security(ies) andsubject company(ies). I also certify that no part of my compensation was, is, or will be, directly or indirectly, related to the specific recommendationsor views expressed in this research report.I, Yoanna Wang, certify that all of the views expressed in this research report accurately reflect my personal views about the subject security(ies) andsubject company(ies). I also certify that no part of my compensation was, is, or will be, directly or indirectly, related to the specific recommendationsor views expressed in this research report.I, Lucinda Nan, certify that all of the views expressed in this research report accurately reflect my personal views about the subject security(ies) andsubject company(ies). I also certify that no part of my compensation was, is, or will be, directly or indirectly, related to the specific recommendationsor views expressed in this research report.I, Laban Yu, certify that all of the views expressed in this research report accurately reflect my personal views about the subject security(ies) and subjectcompany(ies). I also certify that no part of my compensation was, is, or will be, directly or indirectly, related to the specific recommendations or viewsexpressed in this research report.I, Johnson Leung, certify that all of the views expressed in this research report accurately reflect my personal views about the subject security(ies) andsubject company(ies). I also certify that no part of my compensation was, is, or will be, directly or indirectly, related to the specific recommendationsor views expressed in this research report.Registration of non-US analysts: Zhi Aik Yeo is employed by Jefferies Hong Kong Limited, a non-US affiliate of Jefferies LLC and is not registered/qualified as a research analyst with FINRA. This analyst(s) may not be an associated person of Jefferies LLC, a FINRA member firm, and therefore maynot be subject to the NASD Rule 2711 and Incorporated NYSE Rule 472 restrictions on communications with a subject company, public appearancesand trading securities held by a research analyst.
Registration of non-US analysts: Joseph Fong, CFA is employed by Jefferies Hong Kong Limited, a non-US affiliate of Jefferies LLC and is notregistered/qualified as a research analyst with FINRA. This analyst(s) may not be an associated person of Jefferies LLC, a FINRA member firm, andtherefore may not be subject to the NASD Rule 2711 and Incorporated NYSE Rule 472 restrictions on communications with a subject company, publicappearances and trading securities held by a research analyst.
Registration of non-US analysts: Yoanna Wang is employed by Jefferies Hong Kong Limited, a non-US affiliate of Jefferies LLC and is not registered/qualified as a research analyst with FINRA. This analyst(s) may not be an associated person of Jefferies LLC, a FINRA member firm, and therefore maynot be subject to the NASD Rule 2711 and Incorporated NYSE Rule 472 restrictions on communications with a subject company, public appearancesand trading securities held by a research analyst.
Registration of non-US analysts: Lucinda Nan is employed by Jefferies Hong Kong Limited, a non-US affiliate of Jefferies LLC and is not registered/qualified as a research analyst with FINRA. This analyst(s) may not be an associated person of Jefferies LLC, a FINRA member firm, and therefore maynot be subject to the NASD Rule 2711 and Incorporated NYSE Rule 472 restrictions on communications with a subject company, public appearancesand trading securities held by a research analyst.
Registration of non-US analysts: Laban Yu is employed by Jefferies Hong Kong Limited, a non-US affiliate of Jefferies LLC and is not registered/qualified as a research analyst with FINRA. This analyst(s) may not be an associated person of Jefferies LLC, a FINRA member firm, and therefore maynot be subject to the NASD Rule 2711 and Incorporated NYSE Rule 472 restrictions on communications with a subject company, public appearancesand trading securities held by a research analyst.
Registration of non-US analysts: Johnson Leung is employed by Jefferies Hong Kong Limited, a non-US affiliate of Jefferies LLC and is not registered/qualified as a research analyst with FINRA. This analyst(s) may not be an associated person of Jefferies LLC, a FINRA member firm, and therefore maynot be subject to the NASD Rule 2711 and Incorporated NYSE Rule 472 restrictions on communications with a subject company, public appearancesand trading securities held by a research analyst.
As is the case with all Jefferies employees, the analyst(s) responsible for the coverage of the financial instruments discussed in this report receivescompensation based in part on the overall performance of the firm, including investment banking income. We seek to update our research asappropriate, but various regulations may prevent us from doing so. Aside from certain industry reports published on a periodic basis, the large majorityof reports are published at irregular intervals as appropriate in the analyst's judgement.
Industrials
Initiating Coverage
2 December 2015
page 74 of 79 , Equity Analyst, +852 3743 8075, [email protected] Aik Yeo
Please see important disclosure information on pages 74 - 79 of this report.

Explanation of Jefferies RatingsBuy - Describes securities that we expect to provide a total return (price appreciation plus yield) of 15% or more within a 12-month period.Hold - Describes securities that we expect to provide a total return (price appreciation plus yield) of plus 15% or minus 10% within a 12-month period.Underperform - Describes securities that we expect to provide a total return (price appreciation plus yield) of minus 10% or less within a 12-monthperiod.The expected total return (price appreciation plus yield) for Buy rated securities with an average security price consistently below $10 is 20% or morewithin a 12-month period as these companies are typically more volatile than the overall stock market. For Hold rated securities with an averagesecurity price consistently below $10, the expected total return (price appreciation plus yield) is plus or minus 20% within a 12-month period. ForUnderperform rated securities with an average security price consistently below $10, the expected total return (price appreciation plus yield) is minus20% or less within a 12-month period.NR - The investment rating and price target have been temporarily suspended. Such suspensions are in compliance with applicable regulations and/or Jefferies policies.CS - Coverage Suspended. Jefferies has suspended coverage of this company.NC - Not covered. Jefferies does not cover this company.Restricted - Describes issuers where, in conjunction with Jefferies engagement in certain transactions, company policy or applicable securitiesregulations prohibit certain types of communications, including investment recommendations.Monitor - Describes securities whose company fundamentals and financials are being monitored, and for which no financial projections or opinionson the investment merits of the company are provided.
Valuation MethodologyJefferies' methodology for assigning ratings may include the following: market capitalization, maturity, growth/value, volatility and expected totalreturn over the next 12 months. The price targets are based on several methodologies, which may include, but are not restricted to, analyses of marketrisk, growth rate, revenue stream, discounted cash flow (DCF), EBITDA, EPS, cash flow (CF), free cash flow (FCF), EV/EBITDA, P/E, PE/growth, P/CF,P/FCF, premium (discount)/average group EV/EBITDA, premium (discount)/average group P/E, sum of the parts, net asset value, dividend returns,and return on equity (ROE) over the next 12 months.
Jefferies Franchise PicksJefferies Franchise Picks include stock selections from among the best stock ideas from our equity analysts over a 12 month period. Stock selectionis based on fundamental analysis and may take into account other factors such as analyst conviction, differentiated analysis, a favorable risk/rewardratio and investment themes that Jefferies analysts are recommending. Jefferies Franchise Picks will include only Buy rated stocks and the numbercan vary depending on analyst recommendations for inclusion. Stocks will be added as new opportunities arise and removed when the reason forinclusion changes, the stock has met its desired return, if it is no longer rated Buy and/or if it triggers a stop loss. Stocks having 120 day volatility inthe bottom quartile of S&P stocks will continue to have a 15% stop loss, and the remainder will have a 20% stop. Franchise Picks are not intendedto represent a recommended portfolio of stocks and is not sector based, but we may note where we believe a Pick falls within an investment stylesuch as growth or value.
Risks which may impede the achievement of our Price TargetThis report was prepared for general circulation and does not provide investment recommendations specific to individual investors. As such, thefinancial instruments discussed in this report may not be suitable for all investors and investors must make their own investment decisions basedupon their specific investment objectives and financial situation utilizing their own financial advisors as they deem necessary. Past performance ofthe financial instruments recommended in this report should not be taken as an indication or guarantee of future results. The price, value of, andincome from, any of the financial instruments mentioned in this report can rise as well as fall and may be affected by changes in economic, financialand political factors. If a financial instrument is denominated in a currency other than the investor's home currency, a change in exchange rates mayadversely affect the price of, value of, or income derived from the financial instrument described in this report. In addition, investors in securities suchas ADRs, whose values are affected by the currency of the underlying security, effectively assume currency risk.
Other Companies Mentioned in This Report• BYD Company Limited (002594 CH: RMB63.29, UNDERPERFORM)• BYD Company Limited (1211 HK: HK$42.60, HOLD)• Zhengzhou Yutong Bus Co., Ltd. (600066 CH: RMB21.71, BUY)
Industrials
Initiating Coverage
2 December 2015
page 75 of 79 , Equity Analyst, +852 3743 8075, [email protected] Aik Yeo
Please see important disclosure information on pages 74 - 79 of this report.

Industrials
Initiating Coverage
2 December 2015
page 76 of 79 , Equity Analyst, +852 3743 8075, [email protected] Aik Yeo
Please see important disclosure information on pages 74 - 79 of this report.

Distribution of RatingsIB Serv./Past 12 Mos.
Rating Count Percent Count Percent
BUY 1132 53.60% 323 28.53%HOLD 827 39.16% 164 19.83%UNDERPERFORM 153 7.24% 19 12.42%
Industrials
Initiating Coverage
2 December 2015
page 77 of 79 , Equity Analyst, +852 3743 8075, [email protected] Aik Yeo
Please see important disclosure information on pages 74 - 79 of this report.

Other Important DisclosuresJefferies Equity Research refers to research reports produced by analysts employed by one of the following Jefferies Group LLC (“Jefferies”) groupcompanies:United States: Jefferies LLC which is an SEC registered firm and a member of FINRA.United Kingdom: Jefferies International Limited, which is authorized and regulated by the Financial Conduct Authority; registered in England andWales No. 1978621; registered office: Vintners Place, 68 Upper Thames Street, London EC4V 3BJ; telephone +44 (0)20 7029 8000; facsimile +44 (0)207029 8010.Hong Kong: Jefferies Hong Kong Limited, which is licensed by the Securities and Futures Commission of Hong Kong with CE number ATS546; locatedat Suite 2201, 22nd Floor, Cheung Kong Center, 2 Queen’s Road Central, Hong Kong.Singapore: Jefferies Singapore Limited, which is licensed by the Monetary Authority of Singapore; located at 80 Raffles Place #15-20, UOB Plaza 2,Singapore 048624, telephone: +65 6551 3950.Japan: Jefferies (Japan) Limited, Tokyo Branch, which is a securities company registered by the Financial Services Agency of Japan and is a memberof the Japan Securities Dealers Association; located at Hibiya Marine Bldg, 3F, 1-5-1 Yuraku-cho, Chiyoda-ku, Tokyo 100-0006; telephone +813 52516100; facsimile +813 5251 6101.India: Jefferies India Private Limited (CIN - U74140MH2007PTC200509), which is licensed by the Securities and Exchange Board of India as a MerchantBanker (INM000011443), Research Analyst (INH000000701) and a Stock Broker with Bombay Stock Exchange Limited (INB011491033) and NationalStock Exchange of India Limited (INB231491037) in the Capital Market Segment; located at 42/43, 2 North Avenue, Maker Maxity, Bandra-KurlaComplex, Bandra (East) Mumbai 400 051, India; Tel +91 22 4356 6000.This material has been prepared by Jefferies employing appropriate expertise, and in the belief that it is fair and not misleading. The information setforth herein was obtained from sources believed to be reliable, but has not been independently verified by Jefferies. Therefore, except for any obligationunder applicable rules we do not guarantee its accuracy. Additional and supporting information is available upon request. Unless prohibited by theprovisions of Regulation S of the U.S. Securities Act of 1933, this material is distributed in the United States ("US"), by Jefferies LLC, a US-registeredbroker-dealer, which accepts responsibility for its contents in accordance with the provisions of Rule 15a-6, under the US Securities Exchange Act of1934. Transactions by or on behalf of any US person may only be effected through Jefferies LLC. In the United Kingdom and European EconomicArea this report is issued and/or approved for distribution by Jefferies International Limited and is intended for use only by persons who have, or havebeen assessed as having, suitable professional experience and expertise, or by persons to whom it can be otherwise lawfully distributed. JefferiesInternational Limited has adopted a conflicts management policy in connection with the preparation and publication of research, the details of whichare available upon request in writing to the Compliance Officer. Jefferies International Limited may allow its analysts to undertake private consultancywork. Jefferies International Limited’s conflicts management policy sets out the arrangements Jefferies International Limited employs to manage anypotential conflicts of interest that may arise as a result of such consultancy work. For Canadian investors, this material is intended for use only byprofessional or institutional investors. None of the investments or investment services mentioned or described herein is available to other personsor to anyone in Canada who is not a "Designated Institution" as defined by the Securities Act (Ontario). In Singapore, Jefferies Singapore Limited isregulated by the Monetary Authority of Singapore. For investors in the Republic of Singapore, this material is provided by Jefferies Singapore Limitedpursuant to Regulation 32C of the Financial Advisers Regulations. The material contained in this document is intended solely for accredited, expert orinstitutional investors, as defined under the Securities and Futures Act (Cap. 289 of Singapore). If there are any matters arising from, or in connectionwith this material, please contact Jefferies Singapore Limited, located at 80 Raffles Place #15-20, UOB Plaza 2, Singapore 048624, telephone: +656551 3950. In Japan this material is issued and distributed by Jefferies (Japan) Limited to institutional investors only. In Hong Kong, this report isissued and approved by Jefferies Hong Kong Limited and is intended for use only by professional investors as defined in the Hong Kong Securities andFutures Ordinance and its subsidiary legislation. In the Republic of China (Taiwan), this report should not be distributed. The research in relation tothis report is conducted outside the PRC. This report does not constitute an offer to sell or the solicitation of an offer to buy any securities in the PRC.PRC investors shall have the relevant qualifications to invest in such securities and shall be responsible for obtaining all relevant approvals, licenses,verifications and/or registrations from the relevant governmental authorities themselves. In India this report is made available by Jefferies India PrivateLimited. In Australia this information is issued solely by Jefferies International Limited and is directed solely at wholesale clients within the meaning ofthe Corporations Act 2001 of Australia (the "Act") in connection with their consideration of any investment or investment service that is the subject ofthis document. Any offer or issue that is the subject of this document does not require, and this document is not, a disclosure document or productdisclosure statement within the meaning of the Act. Jefferies International Limited is authorised and regulated by the Financial Conduct Authorityunder the laws of the United Kingdom, which differ from Australian laws. Jefferies International Limited has obtained relief under Australian Securitiesand Investments Commission Class Order 03/1099, which conditionally exempts it from holding an Australian financial services licence under theAct in respect of the provision of certain financial services to wholesale clients. Recipients of this document in any other jurisdictions should informthemselves about and observe any applicable legal requirements in relation to the receipt of this document.
This report is not an offer or solicitation of an offer to buy or sell any security or derivative instrument, or to make any investment. Any opinion orestimate constitutes the preparer's best judgment as of the date of preparation, and is subject to change without notice. Jefferies assumes no obligationto maintain or update this report based on subsequent information and events. Jefferies, its associates or affiliates, and its respective officers, directors,and employees may have long or short positions in, or may buy or sell any of the securities, derivative instruments or other investments mentioned ordescribed herein, either as agent or as principal for their own account. Upon request Jefferies may provide specialized research products or servicesto certain customers focusing on the prospects for individual covered stocks as compared to other covered stocks over varying time horizons orunder differing market conditions. While the views expressed in these situations may not always be directionally consistent with the long-term viewsexpressed in the analyst's published research, the analyst has a reasonable basis and any inconsistencies can be reasonably explained. This materialdoes not constitute a personal recommendation or take into account the particular investment objectives, financial situations, or needs of individualclients. Clients should consider whether any advice or recommendation in this report is suitable for their particular circumstances and, if appropriate,seek professional advice, including tax advice. The price and value of the investments referred to herein and the income from them may fluctuate. Pastperformance is not a guide to future performance, future returns are not guaranteed, and a loss of original capital may occur. Fluctuations in exchangerates could have adverse effects on the value or price of, or income derived from, certain investments. This report has been prepared independently ofany issuer of securities mentioned herein and not in connection with any proposed offering of securities or as agent of any issuer of securities. Noneof Jefferies, any of its affiliates or its research analysts has any authority whatsoever to make any representations or warranty on behalf of the issuer(s).Jefferies policy prohibits research personnel from disclosing a recommendation, investment rating, or investment thesis for review by an issuer priorto the publication of a research report containing such rating, recommendation or investment thesis. Any comments or statements made herein arethose of the author(s) and may differ from the views of Jefferies.
This report may contain information obtained from third parties, including ratings from credit ratings agencies such as Standard & Poor’s. Reproductionand distribution of third party content in any form is prohibited except with the prior written permission of the related third party. Third party content
Industrials
Initiating Coverage
2 December 2015
page 78 of 79 , Equity Analyst, +852 3743 8075, [email protected] Aik Yeo
Please see important disclosure information on pages 74 - 79 of this report.

providers do not guarantee the accuracy, completeness, timeliness or availability of any information, including ratings, and are not responsible forany errors or omissions (negligent or otherwise), regardless of the cause, or for the results obtained from the use of such content. Third party contentproviders give no express or implied warranties, including, but not limited to, any warranties of merchantability or fitness for a particular purpose oruse. Third party content providers shall not be liable for any direct, indirect, incidental, exemplary, compensatory, punitive, special or consequentialdamages, costs, expenses, legal fees, or losses (including lost income or profits and opportunity costs) in connection with any use of their content,including ratings. Credit ratings are statements of opinions and are not statements of fact or recommendations to purchase, hold or sell securities. Theydo not address the suitability of securities or the suitability of securities for investment purposes, and should not be relied on as investment advice.
Jefferies research reports are disseminated and available primarily electronically, and, in some cases, in printed form. Electronic research issimultaneously available to all clients. This report or any portion hereof may not be reprinted, sold or redistributed without the written consent ofJefferies. Neither Jefferies nor any officer nor employee of Jefferies accepts any liability whatsoever for any direct, indirect or consequential damagesor losses arising from any use of this report or its contents.
For Important Disclosure information, please visit our website at https://javatar.bluematrix.com/sellside/Disclosures.action or call 1.888.JEFFERIES
© 2015 Jefferies Group LLC
Industrials
Initiating Coverage
2 December 2015
page 79 of 79 , Equity Analyst, +852 3743 8075, [email protected] Aik Yeo
Please see important disclosure information on pages 74 - 79 of this report.