av oida n ce o ss s avoidance of unnecessary dose to
TRANSCRIPT

IAEA-TECDOC-1667
Avoidance of Unnecessary Dose to Patients While Transitioning
from Analogue to Digital Radiology
INTERNATIONAL ATOMIC ENERGY AGENCYVIENNA
ISBN 978–92–0–121010–4ISSN 1011–4289
IAEA
-TECD
OC
-1667 n
AvOID
An
CE O
f Un
nEC
EssAry D
OsE TO
PATIEnTs W
hIlE Tr
An
sITIOn
Ing
frO
m A
nA
lOg
UE TO
DIg
ITAl r
AD
IOlO
gy
IAEA SAFETY STANDARDS AND RELATED PUBLICATIONS
IAEA SAFETY STANDARDS
Under the terms of Article III of its Statute, the IAEA is authorized to establish or adopt standards of safety for protection of health and minimization of danger to life and property, and to provide for the application of these standards.
The publications by means of which the IAEA establishes standards are issued in the IAEA Safety Standards Series. This series covers nuclear safety, radiation safety, transport safety and waste safety. The publication categories in the series are Safety Fundamentals,Safety Requirements and Safety Guides.
Information on the IAEA�s safety standards programme is available at the IAEA Internet site
http://www-ns.iaea.org/standards/
The site provides the texts in English of published and draft safety standards. The texts of safety standards issued in Arabic, Chinese, French, Russian and Spanish, the IAEA Safety Glossary and a status report for safety standards under development are also available. For further information, please contact the IAEA at PO Box 100, 1400 Vienna, Austria.
All users of IAEA safety standards are invited to inform the IAEA of experience in their use (e.g. as a basis for national regulations, for safety reviews and for training courses) for the purpose of ensuring that they continue to meet users� needs. Information may be provided via the IAEA Internet site or by post, as above, or by email to [email protected].
RELATED PUBLICATIONS
The IAEA provides for the application of the standards and, under the terms of Articles III and VIII.C of its Statute, makes available and fosters the exchange of information relating to peaceful nuclear activities and serves as an intermediary among its Member States for this purpose.
Reports on safety and protection in nuclear activities are issued as Safety Reports, which provide practical examples and detailed methods that can be used in support of the safety standards.
Other safety related IAEA publications are issued as Radiological Assessment Reports, the International Nuclear Safety Group�s INSAG Reports, Technical Reports and TECDOCs. The IAEA also issues reports on radiological accidents, training manuals and practical manuals, and other special safety related publications.
Security related publications are issued in the IAEA Nuclear Security Series.The IAEA Nuclear Energy Series consists of reports designed to encourage and assist
research on, and development and practical application of, nuclear energy for peaceful uses. The information is presented in guides, reports on the status of technology and advances, and best practices for peaceful uses of nuclear energy. The series complements the IAEA�s safety standards, and provides detailed guidance, experience, good practices and examples in the areas of nuclear power, the nuclear fuel cycle, radioactive waste management and decommissioning.

Avoidance of Unnecessary Dose to Patients While Transitioning from
Analogue to Digital Radiology

The following States are Members of the International Atomic Energy Agency:
AFGHANISTANALBANIAALGERIAANGOLAARGENTINAARMENIAAUSTRALIAAUSTRIAAZERBAIJANBAHRAINBANGLADESHBELARUSBELGIUMBELIZEBENINBOLIVIABOSNIA AND HERZEGOVINABOTSWANABRAZILBULGARIABURKINA FASOBURUNDICAMBODIACAMEROONCANADACENTRAL AFRICAN REPUBLICCHADCHILECHINACOLOMBIACONGOCOSTA RICACÔTE D�IVOIRECROATIACUBACYPRUSCZECH REPUBLICDEMOCRATIC REPUBLIC OF THE CONGODENMARKDOMINICAN REPUBLICECUADOREGYPTEL SALVADORERITREAESTONIAETHIOPIAFINLANDFRANCEGABONGEORGIAGERMANY
GHANAGREECEGUATEMALAHAITIHOLY SEEHONDURASHUNGARYICELANDINDIAINDONESIAIRAN, ISLAMIC REPUBLIC OF IRAQIRELANDISRAELITALYJAMAICAJAPANJORDANKAZAKHSTANKENYAKOREA, REPUBLIC OFKUWAITKYRGYZSTANLATVIALEBANONLESOTHOLIBERIALIBYALIECHTENSTEINLITHUANIALUXEMBOURGMADAGASCARMALAWIMALAYSIAMALIMALTAMARSHALL ISLANDSMAURITANIAMAURITIUSMEXICOMONACOMONGOLIAMONTENEGROMOROCCOMOZAMBIQUEMYANMARNAMIBIANEPALNETHERLANDSNEW ZEALANDNICARAGUANIGERNIGERIA
NORWAYOMANPAKISTANPALAUPANAMAPARAGUAYPERUPHILIPPINESPOLANDPORTUGALQATARREPUBLIC OF MOLDOVAROMANIARUSSIAN FEDERATIONSAUDI ARABIASENEGALSERBIASEYCHELLESSIERRA LEONESINGAPORESLOVAKIASLOVENIASOUTH AFRICASPAINSRI LANKASUDANSWEDENSWITZERLANDSYRIAN ARAB REPUBLICTAJIKISTANTHAILANDTHE FORMER YUGOSLAV REPUBLIC OF MACEDONIATUNISIATURKEYUGANDAUKRAINEUNITED ARAB EMIRATESUNITED KINGDOM OF GREAT BRITAIN AND NORTHERN IRELANDUNITED REPUBLIC OF TANZANIAUNITED STATES OF AMERICAURUGUAYUZBEKISTANVENEZUELAVIETNAMYEMENZAMBIAZIMBABWE
The Agency’s Statute was approved on 23 October 1956 by the Conference on the Statute of the IAEA held atUnited Nations Headquarters, New York; it entered into force on 29 July 1957. The Headquarters of the Agency aresituated in Vienna. Its principal objective is “to accelerate and enlarge the contribution of atomic energy to peacehealth and prosperity throughout the world’’.
,

IAEA-TECDOC-1667
AVOIDANCE OF UNNECESSARY DOSE TO PATIENTS WHILE TRANSITIONING FROM
ANALOGUE TO DIGITAL RADIOLOGY
INTERNATIONAL ATOMIC ENERGY AGENCY VIENNA, 2011
COPYRIGHT NOTICE
All IAEA scientific and technical publications are protected by the terms of the Universal Copyright Convention as adopted in 1952 (Berne) and as revised in 1972 (Paris). The copyright has since been extended by the World Intellectual Property Organization (Geneva) to include electronic and virtual intellectual property. Permission to use whole or parts of texts contained in IAEA publications in printed or electronic form must be obtained and is usually subject to royalty agreements. Proposals for non-commercial reproductions and translations are welcomed and considered on a case-by-case basis. Enquiries should be addressed to the IAEA Publishing Section at: Sales and Promotion, Publishing Section International Atomic Energy Agency Vienna International Centre PO Box 100 1400 Vienna, Austria fax: +43 1 2600 29302 tel.: +43 1 2600 22417 email: [email protected] http://www.iaea.org/books
For further information on this publication, please contact:
Radiation Protection of Patients Unit International Atomic Energy Agency
Vienna International Centre PO Box 100
1400 Vienna, Austria email: [email protected]
© IAEA, 2011
Printed by the IAEA in Austria October 2011
IAEA-TECDOC-1667
IAEA Library Cataloguing in Publication Data Avoidance of unnecessary dose to patients while transitioning from analogue to digital radiology. – Vienna : International Atomic Energy Agency, 2011. p. ; 30 cm. – (IAEA-TECDOC series, ISSN 1011-4289 ; no. 1667) ISBN 978-92-0-121010-4 Includes bibliographical references. 1. Diagnostic imaging – Safety measures. 2. Ionizing radiation – Dosage – Safety measures. 3. Radiography, Medical – Digital techniques. 4. Radiation protection. I. International Atomic Energy Agency. II. Series.
IAEAL 11-00708

FOREWORD
In the last 30–40 years, the pace of innovation in medical imaging has increased, starting with the introduction of computed tomography (CT) in the early 1970s. Since its introduction in the early 1980s, digital radiography has progressed and film-screen systems are steadily being replaced by digital systems, either ‘photostimulable’ phosphor plates or direct radiography devices. Digital detectors have many advantages, some of which include lower energy requirements, shorter exposure times, possible use of the small focal spot, better dynamic range and greater latitude, almost immediate availability of the images, electronic storage and sharing, no use of chemicals. The radiation dose needed to obtain a similar image quality is lower, but the latitude of the digital systems also allows much higher doses to be delivered without being detected. It is thus very important to ensure that the benefit to be gained from this technology will not be outweighed by radiation risk.
Regulation, industrial standardization, safety procedures, and advice on best practice always lag behind industrial and clinical innovations. This monograph is designed to help the medical community make a contribution to dose reduction, preferably without any loss in the level of confidence in the images produced, when replacing their film-screen systems by digital ones.
This monograph was developed within the IAEA’s statutory framework of responsibility to establish standards for the protection of people against exposure to ionizing radiation, and to provide for the worldwide application of these standards. The Fundamental Safety Principles and the International Basic Safety Standards for Protection against Ionizing Radiation and for the Safety of Radiation Sources (the BSS), issued by the IAEA and co-sponsored by the European Atomic Energy Community, Food and Agriculture Organization of the United Nations, International Labour Organization, International Maritime Organization, OECD Nuclear Energy Agency, Pan American Health Organization, United Nations Environment Programme and World Health Organization, require the radiation protection of patients undergoing medical exposures through justification of the procedures involved and through optimization. In keeping with its responsibility for the application of standards, the IAEA programme on radiological protection of patients encourages the reduction of patient doses in diagnostic and interventional radiological procedures. This monograph, including data from a coordinated research project (CRP) on this topic, is a further contribution to the resources provided by the IAEA in support of implementation of the BSS.
The International Action Plan for the Radiological Protection of Patients, approved by the General Conference of the IAEA in September 2002, requires that: “The practice-specific documents under preparation should be finalized as guidance rather than regulations, and they should include input from professional bodies, from international organizations and from authorities with responsibility for radiation protection and medical care.” This monograph is prepared and issued in this spirit. In the first instance, it provides advice for those involved in one of the more dose intensive areas developing in radiology today.
The IAEA officer responsible for this publication was M.M. Rehani of the Division of Radiation, Transport and Waste Safety.

EDITORIAL NOTE
The use of particular designations of countries or territories does not imply any judgement by the
publisher, the IAEA, as to the legal status of such countries or territories, of their authorities and
institutions or of the delimitation of their boundaries.
The mention of names of specific companies or products (whether or not indicated as registered) does
not imply any intention to infringe proprietary rights, nor should it be construed as an endorsement
or recommendation on the part of the IAEA.

CONTENTS
1. INTRODUCTION ........................................................................................................... 1
1.1. Background ......................................................................................................... 1 1.2. Introduction to CR and DR ................................................................................. 1
1.2.1. Film-screen systems ............................................................................. 1 1.2.2. The digital image .................................................................................. 2 1.2.3. Computed radiography (CR) – cassette-based ..................................... 4 1.2.4. Direct radiography (DR) – cassette-less or mobile .............................. 6
1.3. Implications for patient dose and image quality ................................................. 7 1.4. Use of detector dose indices or exposure indicators ........................................... 8 1.5. Patient dose ......................................................................................................... 8 1.6. Diagnostic reference levels ............................................................................... 10 1.7. ICRP recommendations .................................................................................... 10
2. REVIEW ........................................................................................................................ 13
3. MATERIALS AND METHODS OF THE CRP ........................................................... 17
3.1. Selection of sites and hospitals ......................................................................... 17 3.2. Description of imaging systems, patient population and medical
resources ........................................................................................................... 17 3.3. Selection of procedures .................................................................................... 18 3.4. Dosimetry and image quality ............................................................................ 18
3.4.1. Entrance surface air kerma data ......................................................... 19 3.4.2. HVL data ............................................................................................ 19 3.4.3. Quality control (QC)........................................................................... 19
3.5. ESD calculation ................................................................................................ 19 3.6. Actual patient doses .......................................................................................... 21 3.7. Retake analysis ................................................................................................. 21 3.8. Phantom studies ................................................................................................ 22
3.8.1. Beam hardening and prefiltration ....................................................... 22 3.8.2. The phantom plate .............................................................................. 23 3.8.3. Evaluation of phantom images ........................................................... 23 3.8.4. Contrast to noise ratio (CNR) ............................................................. 24 3.8.5. Spatial resolution ................................................................................ 24 3.8.6. Low contrast detectability .................................................................. 24
3.9. Image quality criteria ........................................................................................ 24 3.9.1. Effect of monitor resolution ............................................................... 25 3.9.2. Comparison of soft copy (display) versus hard copy (films) ............. 25
3.10. Retake rate ........................................................................................................ 25 3.11. Optimization ..................................................................................................... 25 3.12. TLD inter-hospital comparison ........................................................................ 26
4. RESULTS FROM THE CRP ........................................................................................ 27
4.1. HVL .................................................................................................................. 27 4.2. Entrance surface air kerma and entrance skin dose .......................................... 27 4.3. Patient dose data ............................................................................................... 31 4.4. Summary of dosimetry ..................................................................................... 38 4.5. TLD results ....................................................................................................... 39

4.6. Phantom results ................................................................................................. 40 4.7. Retake analysis ................................................................................................. 43 4.8. Soft/hard copy image quality ............................................................................ 45
5. CONC LUSIONS .......................................................................................................... 51
5.1. Dosimetry ......................................................................................................... 51 5.2. Phantom studies ................................................................................................ 51 5.3. Retake rate ........................................................................................................ 51 5.4. Training ............................................................................................................ 52 5.5. Future work ....................................................................................................... 52
6. ADVICE FOR GOOD PRACTICE ............................................................................... 53
REFERENCES ......................................................................................................................... 55
ANNEX I. DEFINITIONS ................................................................................................. 61
ANNEX II. PROTOCOLS AND SAMPLE FORMS .......................................................... 65
ANNEX III. IAEA DIGITAL PHANTOM – DESCRIPTION AND INSTRUCTIONS FOR USE .......................................................................................................... 71
ANNEX IV. IMAGE QUALITY DATA SHEET (SAMPLE) ............................................. 79
ANNEX V. DETAILS OF THE PARTICIPANTS OF THE CRP ...................................... 83
CONTRIBUTORS TO DRAFTING AND REVIEW ............................................................. 85

1. INTRODUCTION
1.1. BACKGROUND
In recent years there has been a very rapid introduction of digital imaging technologies in diagnostic radiology. 20 years ago, the vast majority of radiology departments were using conventional film/screen (F/S) imaging. Now there are many models and technologies of digital imaging to choose from, and these are fast becoming the norm, with most new equipment purchases being digital because of easier image handling, easier storage, and consistency of quality.
Computed radiography (CR) is currently the most popular, as it can be used with existing X ray equipment. Direct radiography (DR) is however gaining ground as the capital costs reduce, and when a complete X ray system has to be replaced, DR is often purchased, meaning the possibility to get rid of all cassette handling.
The change of technology from film to digital is however quite significant. This change not only requires examination and revision of work practices, but also offers an opportunity to optimize patient dose. There is however a potential hazard in this transition – that patient dose will rise rather than fall or remain the same. A transition without critical examination of procedures and technical issues, and without dose estimation, may see significant unnecessary patient dose increases without any gain in diagnostic benefit. This important issue is discussed later in this document.
The purpose of this publication is to address some of the requirements of the Fundamental Safety Principles [1] and the International Basic Safety Standards for Protection against Ionizing Radiation and for the Safety of Radiation Sources (BSS) [2] issued by the IAEA. It will bring the principles and standards in these foundational publications, particularly with respect to optimization, to bear on the new digital radiography practices. It particularly focuses on radiation protection of the patient when transitioning from film to digital and is provided within the framework envisaged in the supporting Safety Reports Series No. 39, on Applying Radiation Safety Standards in Diagnostic Radiology and Interventional Procedures Using X Rays [3]. Further, the experience gained in doing the work presented in this publication will have impact on the revision of the existing safety guide RS-G-1.5 [4].
This and other similar IAEA projects have a common goal: to increase awareness of the dose implications of new imaging technologies, and to provide advice to member states on how to manage the change [5], the dose, and the image quality.
1.2. INTRODUCTION TO CR AND DR
A brief overview of digital imaging techniques and the comparison to film/screen imaging is warranted, in order to understand how the technologies impact upon patient dose and image quality.
1.2.1. Film-screen systems
For many decades, X ray images have been formed by a two-stage process, film/screen imaging. Firstly, the X ray photons are converted to visible light in a phosphor (the screen). The resulting visible light then creates a latent image on a special photographic film emulsion maintained in intimate contact with the screen. After these two stages, the film must be
1
processed in order to become a conventional (analog) image. This highly complex process, while more efficient in the use of radiation than non-screen films, has some disadvantages.
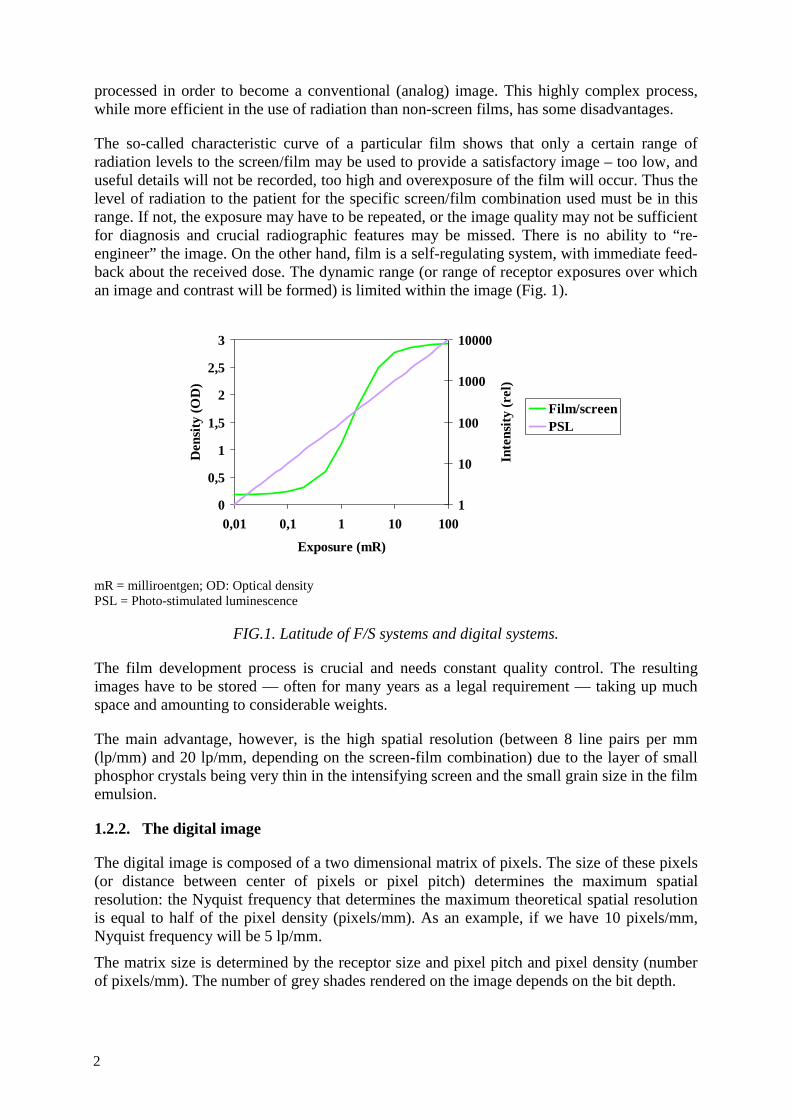
The so-called characteristic curve of a particular film shows that only a certain range of radiation levels to the screen/film may be used to provide a satisfactory image – too low, and useful details will not be recorded, too high and overexposure of the film will occur. Thus the level of radiation to the patient for the specific screen/film combination used must be in this range. If not, the exposure may have to be repeated, or the image quality may not be sufficient for diagnosis and crucial radiographic features may be missed. There is no ability to “re-engineer” the image. On the other hand, film is a self-regulating system, with immediate feed-back about the received dose. The dynamic range (or range of receptor exposures over which an image and contrast will be formed) is limited within the image (Fig. 1).
mR = milliroentgen; OD: Optical density PSL = Photo-stimulated luminescence
FIG.1. Latitude of F/S systems and digital systems.
The film development process is crucial and needs constant quality control. The resulting images have to be stored — often for many years as a legal requirement — taking up much space and amounting to considerable weights.
The main advantage, however, is the high spatial resolution (between 8 line pairs per mm (lp/mm) and 20 lp/mm, depending on the screen-film combination) due to the layer of small phosphor crystals being very thin in the intensifying screen and the small grain size in the film emulsion.
1.2.2. The digital image
The digital image is composed of a two dimensional matrix of pixels. The size of these pixels (or distance between center of pixels or pixel pitch) determines the maximum spatial resolution: the Nyquist frequency that determines the maximum theoretical spatial resolution is equal to half of the pixel density (pixels/mm). As an example, if we have 10 pixels/mm, Nyquist frequency will be 5 lp/mm.
The matrix size is determined by the receptor size and pixel pitch and pixel density (number of pixels/mm). The number of grey shades rendered on the image depends on the bit depth.
0
0,5
1
1,5
2
2,5
3
0,01 0,1 1 10 100
Exposure (mR)
Den
sity
(OD
)
1
10
100
1000
10000
Inte
nsity
(rel
)
Film/screenPSL
2
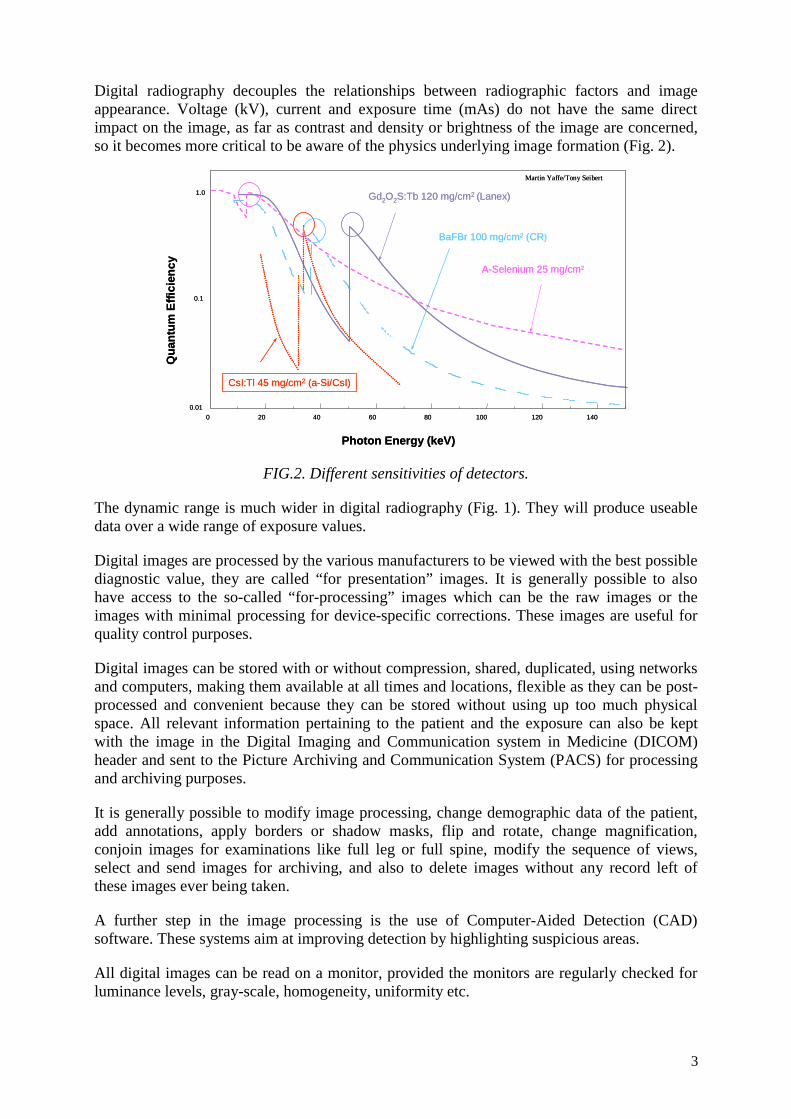
Digital radiography decouples the relationships between radiographic factors and image appearance. Voltage (kV), current and exposure time (mAs) do not have the same direct impact on the image, as far as contrast and density or brightness of the image are concerned, so it becomes more critical to be aware of the physics underlying image formation (Fig. 2).
FIG.2. Different sensitivities of detectors.
The dynamic range is much wider in digital radiography (Fig. 1). They will produce useable data over a wide range of exposure values.
Digital images are processed by the various manufacturers to be viewed with the best possible diagnostic value, they are called “for presentation” images. It is generally possible to also have access to the so-called “for-processing” images which can be the raw images or the images with minimal processing for device-specific corrections. These images are useful for quality control purposes.
Digital images can be stored with or without compression, shared, duplicated, using networks and computers, making them available at all times and locations, flexible as they can be post-processed and convenient because they can be stored without using up too much physical space. All relevant information pertaining to the patient and the exposure can also be kept with the image in the Digital Imaging and Communication system in Medicine (DICOM) header and sent to the Picture Archiving and Communication System (PACS) for processing and archiving purposes.
It is generally possible to modify image processing, change demographic data of the patient, add annotations, apply borders or shadow masks, flip and rotate, change magnification, conjoin images for examinations like full leg or full spine, modify the sequence of views, select and send images for archiving, and also to delete images without any record left of these images ever being taken.
A further step in the image processing is the use of Computer-Aided Detection (CAD) software. These systems aim at improving detection by highlighting suspicious areas.
All digital images can be read on a monitor, provided the monitors are regularly checked for luminance levels, gray-scale, homogeneity, uniformity etc.
Photon Energy (keV)
0 20 40 60 80 100 120 1400.01
0.1
1.0
Qua
ntum
Effi
cien
cy
BaFBr 100 mg/cm² (CR)
Gd2O2S:Tb 120 mg/cm2 (Lanex)
CsI:Tl 45 mg/cm2 (a-Si/CsI)
Martin Yaffe/Tony Seibert
A-Selenium 25 mg/cm2
Photon Energy (keV)
0 20 40 60 80 100 120 1400.01
0.1
1.0
Qua
ntum
Effi
cien
cy
BaFBr 100 mg/cm² (CR)
Gd2O2S:Tb 120 mg/cm2 (Lanex)
CsI:Tl 45 mg/cm2 (a-Si/CsI)
Martin Yaffe/Tony Seibert
A-Selenium 25 mg/cm2
3
Many new technologies are now emerging; digital mammography is mature enough to be relied upon in many countries even for screening for breast cancer, tomosynthesis, double energy images, double energy with contrast injection are all being tested for different applications.
There are various ways of obtaining a digital image:
• Digitization of analog films by taking a video of the transilluminated radiograph, with a laser digitizer or with a Charge Couple Devices (CCD) digitizer.
• Non-photographic capture with digital development.
o Xeroradiography
o Selenium drum detector
• (Mostly) Cassette-based Computed Radiography (CR) that can use existing radiographic units.
• Cassetteless CCD with scintillators.
o Linear scanning arrays
o Optically coupled camera
• Cassetteless Flat Panel Detectors (FPD) that require new radiographic units, FPDs replacing the bucky frame.
o FPD using direct conversion (no scintillator, Amorphous Selenium).
o FPD using indirect conversion (with scintillator, Amorphous Silicon).
• Removable FPDs are also now available to be used with existing radiographic units.
We will only give details for those digital systems that are mostly used:
1.2.3. Computed radiography (CR) – cassette-based
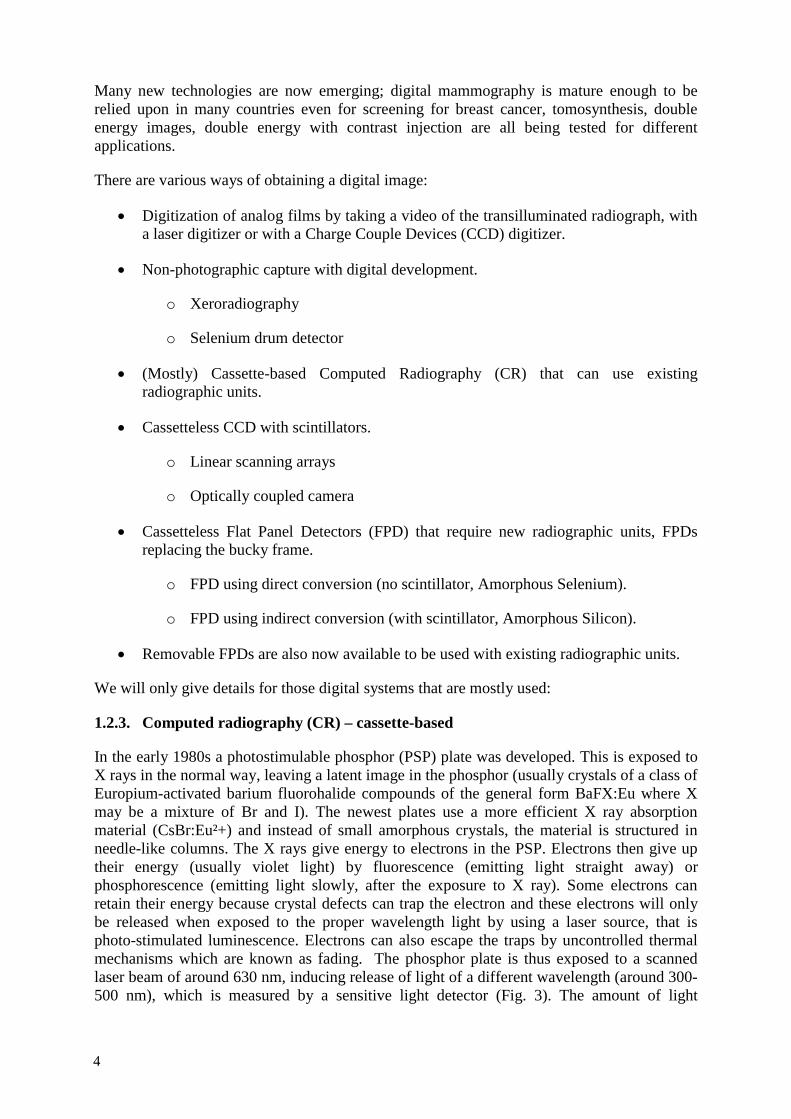
In the early 1980s a photostimulable phosphor (PSP) plate was developed. This is exposed to X rays in the normal way, leaving a latent image in the phosphor (usually crystals of a class of Europium-activated barium fluorohalide compounds of the general form BaFX:Eu where X may be a mixture of Br and I). The newest plates use a more efficient X ray absorption material (CsBr:Eu²+) and instead of small amorphous crystals, the material is structured in needle-like columns. The X rays give energy to electrons in the PSP. Electrons then give up their energy (usually violet light) by fluorescence (emitting light straight away) or phosphorescence (emitting light slowly, after the exposure to X ray). Some electrons can retain their energy because crystal defects can trap the electron and these electrons will only be released when exposed to the proper wavelength light by using a laser source, that is photo-stimulated luminescence. Electrons can also escape the traps by uncontrolled thermal mechanisms which are known as fading. The phosphor plate is thus exposed to a scanned laser beam of around 630 nm, inducing release of light of a different wavelength (around 300-500 nm), which is measured by a sensitive light detector (Fig. 3). The amount of light
4
released is proportional to the original radiation intensity at that point. The newer needle-crystalline PSP plates offer reduction of lateral scattering of the emitted fluorescent light. The channeling of the light through the needles allows for better dose efficiency without losing spatial resolution. The emitted light is directed to a photomultiplier tube (PMT) and the PMT signal is digitized using analog-to-digital converter (ADC). The digital image is an array of ADC code values that represent density information, the array locations representing spatial information. The phosphor image is then erased and the plate re-used. The laser spot size mainly determines the resolution, and is normally about 100 μm for general radiography, and 50 μm for mammography.
FIG. 3. Principle of CR System (courtesy Dr JCP Heggie).
This process has a wide dynamic range of commonly 4,096 grey levels, and a maximum resolution of about 10 lp/mm - not as good as film, but some systems can still be just satisfactory for high resolution imaging such as bone imaging or mammography [6]. Spatial resolution is dependent on sampling frequency and may be dependent on receptor size.
The reader can be single sided or dual sided for better signal-to-noise ratio.
CR can be used with existing X ray equipment, the film/screen cassette simply being exchanged for a CR cassette. However the X ray unit’s automatic exposure control system must be recalibrated to suit the different characteristics of the CR detector – a point which is often overlooked, and which can contribute to wasted radiation dose to the patient. The CR cassette can be used for bedside examinations also as a regular S/F cassette. There is however potential for the PSP to get scratched after intensive use.
The reading process can be centralized or distributed depending on the number of readers and the geographical relative position of the radiographic rooms.
The digital image is however easily amenable to post-acquisition processing. The displayed grey scale can be adjusted to highlight lighter or darker areas, and potentially a lower radiation exposure can be used for the same diagnostic image quality.
5
1.2.4. Direct radiography (DR) – cassette-less or mobile
In DR imaging, the X ray photons are converted to an electronic signal within the detector, by at least three different technologies.
1.2.4.1. Charge-coupled detector (CCD)
CCD systems are commonly used in many forms of visible light imaging, and can be adapted to X ray imaging with the addition of a fluorescent screen, but due to the complexity of the detector itself, are applicable to small field imaging only. They have high spatial resolution (up to 12 lp/mm), and the image may be manipulated in the same way as for CR.
1.2.4.2. Indirect flat panel detectors (IDR)
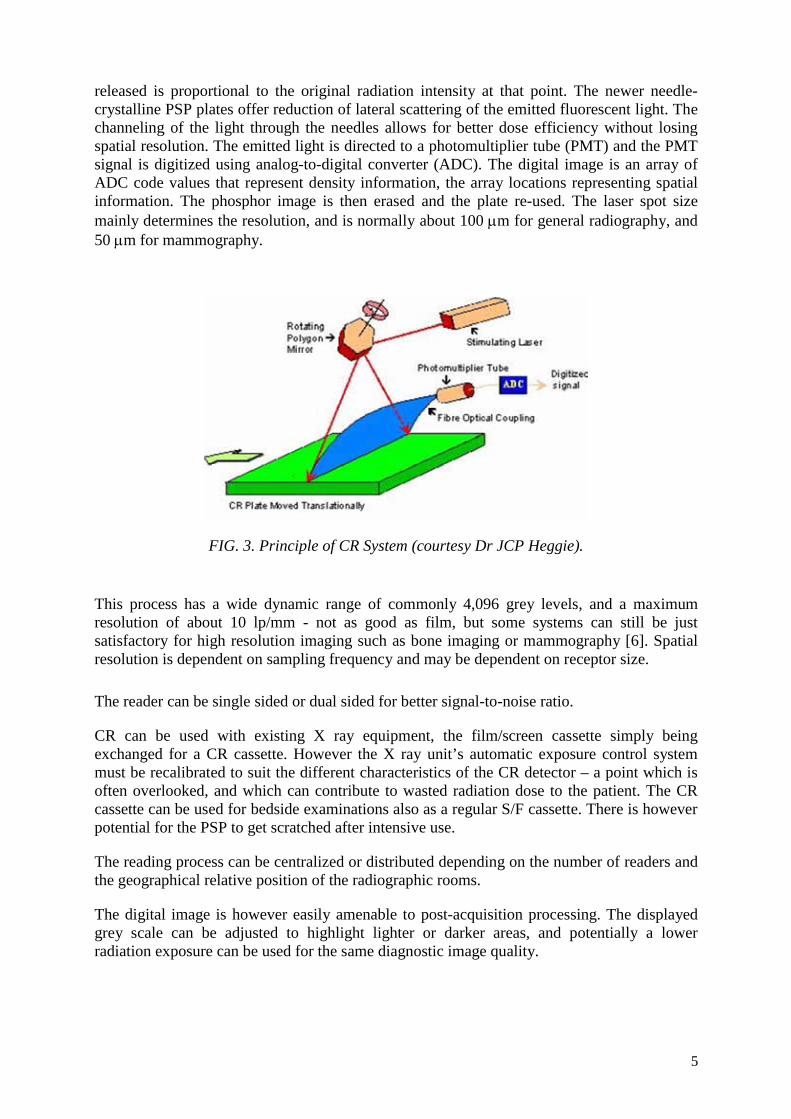
Indirect “flat panel” systems use scintillators with good x ray stopping power such as CsI:Tl (Cesium Iodide doped with Thallium) or Gd2O2S:Tb (Gadolinium Oxysulfide doped with Thallium) as the radiation detector (Fig. 4). The process is in three steps: first the CsI scintillator absorbs the X ray energy and converts it to visible light, just as it does in an image intensifier. Secondly, a low noise a-Si (amorphous silicon) photodiode array absorbs the light and converts it to an electronic charge, each photodiode being a pixel of the resultant image. Lastly, the charge is read by a TFT (thin film transistor) readout plate and turned into digital data. Ideally, the magnitude of the digital signal in each pixel is directly proportional to the X ray intensity absorbed by the CsI crystal above it. Pixel size is typically 100 μm, which implies a limiting spatial resolution of about 5 lp/mm.
FIG. 4. Indirect flat panel system (courtesy Dr JCP Heggie).
1.2.4.3. Direct flat panel detectors (DDR)
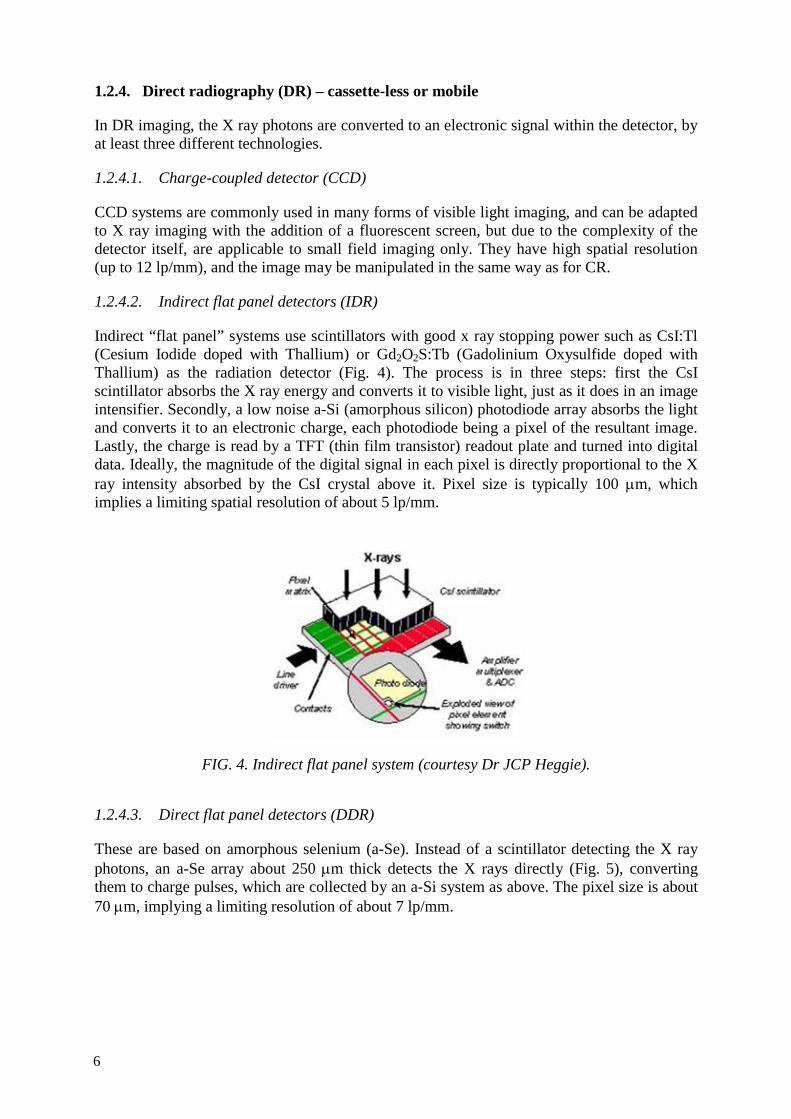
These are based on amorphous selenium (a-Se). Instead of a scintillator detecting the X ray photons, an a-Se array about 250 μm thick detects the X rays directly (Fig. 5), converting them to charge pulses, which are collected by an a-Si system as above. The pixel size is about 70 μm, implying a limiting resolution of about 7 lp/mm.
6
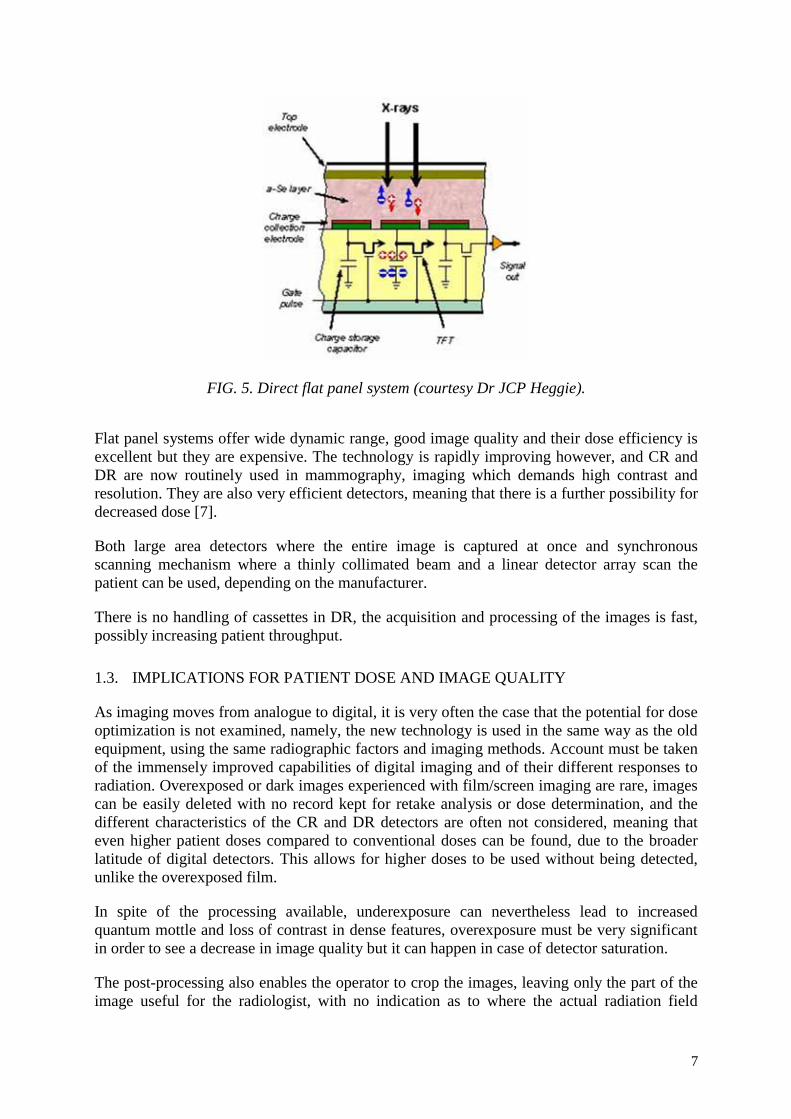
FIG. 5. Direct flat panel system (courtesy Dr JCP Heggie).
Flat panel systems offer wide dynamic range, good image quality and their dose efficiency is excellent but they are expensive. The technology is rapidly improving however, and CR and DR are now routinely used in mammography, imaging which demands high contrast and resolution. They are also very efficient detectors, meaning that there is a further possibility for decreased dose [7].
Both large area detectors where the entire image is captured at once and synchronous scanning mechanism where a thinly collimated beam and a linear detector array scan the patient can be used, depending on the manufacturer.
There is no handling of cassettes in DR, the acquisition and processing of the images is fast, possibly increasing patient throughput.
1.3. IMPLICATIONS FOR PATIENT DOSE AND IMAGE QUALITY
As imaging moves from analogue to digital, it is very often the case that the potential for dose optimization is not examined, namely, the new technology is used in the same way as the old equipment, using the same radiographic factors and imaging methods. Account must be taken of the immensely improved capabilities of digital imaging and of their different responses to radiation. Overexposed or dark images experienced with film/screen imaging are rare, images can be easily deleted with no record kept for retake analysis or dose determination, and the different characteristics of the CR and DR detectors are often not considered, meaning that even higher patient doses compared to conventional doses can be found, due to the broader latitude of digital detectors. This allows for higher doses to be used without being detected, unlike the overexposed film.
In spite of the processing available, underexposure can nevertheless lead to increased quantum mottle and loss of contrast in dense features, overexposure must be very significant in order to see a decrease in image quality but it can happen in case of detector saturation.
The post-processing also enables the operator to crop the images, leaving only the part of the image useful for the radiologist, with no indication as to where the actual radiation field
7

initially was, causing loss of contrast if improperly collimated and of course unnecessary exposure to the patient.
Digital detectors are more sensitive to scatter, thus requiring avoidance of exposure to stray radiation (for CR) and careful use of anti-scatter methods (grids or air-gap) [8].
1.4. USE OF DETECTOR DOSE INDICES OR EXPOSURE INDICATORS
Since appearance of the image and dose are decoupled, a way to evaluate exposure accuracy is to use the detector dose indices (DDI) or exposure indicators provided by various manufacturers. These DDIs are an indicator of detector dose, not patient dose, and the goal is to achieve a specific value of these DDIs for specific examination. Unfortunately, all manufacturers use different DDIs, some being linear, some logarithmic with exposure and they advise a very wide range of exposures as optimal. AAPM task group 116 [9] have tackled this issue with the purpose of recommending a standard indicator which reflects the radiation exposure that is incident on a detector after every exposure event and that reflects the noise level in the image. Their intent is to facilitate the production of consistent, reproducible, high-quality digital images at acceptable dose levels for the patient.
Exposure indicators may parallel the concept of speed classes used by film manufacturers. In fact one of the manufacturers’ mimics the speed classes by using different exposure indicator ranges for speed classes 400, 200 and 100.
They can be used to monitor differences in exposure between digital systems at a given institution, or to compare techniques at different institutions, or to estimate the quality of the images with relation to the noise levels.
Exposure indicators require careful calibration of the image detector if they are to be used as a surrogate for proper exposure of detector and even more so if they are to be used for patient entrance dose or effective dose estimations.
1.5. PATIENT DOSE
Several dosimetric quantities are used in diagnostic imaging [10]. Some of these are:
• Exposure at skin entrance, free-in-air • Incident air kerma (Ki), free-in-air • Entrance surface air kerma ESAK (Ke) (or absorbed dose) • Entrance surface absorbed dose, with backscatter (ESD) • Kerma (or dose)-area product, free-in-air (KAP or DAP)
The first three were used in this study, and the relationship between the measured quantities is described in section 3.4.
“Patient dose” can mean either entrance skin dose, or effective dose. Entrance skin dose (ESD) is the absorbed dose at the skin surface. The dose to organs below the skin is determined by the absorption of the X ray beam by the underlying tissues, as well as scatter of the radiation in tissue.
Organ dose can only be calculated, or simulated using dosimeters such as thermoluminescent dosimeters (TLD) embedded in a dedicated anthropomorphic and tissue equivalent phantom
8
of standardized dimensions and weight (the ICRP “reference man” [11] for example). Measurement in a phantom has a number of constraints to accuracy, not the least of which are the homogeneity of the phantom compared to real tissue, and the variation between the geometry of a phantom and an actual patient.
Calculation of organ dose may be performed using Monte Carlo techniques embodied in a number of commercially available computer programs, but again has limitations. The mathematical model for a human is even less truly anthropomorphic than a phantom, and again one model is sometimes used for all adult shapes and sizes, when obviously the organ size and physical relationships will vary widely in real life. Efforts have been made to conform the phantoms to patient, using actual Computed Tomography (CT) data of patients.
However, even with these limitations, dose simulation or calculation does give a reasonable or even in some cases good estimate of actual organ dose.
Effective dose (ED) takes into account the relative biological effect (radiation weighting factor) of the radiation in use – in the case of X rays, this is defined as 1. It also includes the relative sensitivity of individual organs to radiation (tissue weighting factor). The effective dose is defined as the sum of (organ dose x tissue weighting factor) for all irradiated organs. It is the quantity which can be related to biological risk due to radiation exposure.
Thus ESD itself is not necessarily the most important quantity – it can however be used to estimate ED. These estimations are however of variable accuracy, so it is ESD, which will mostly be used in this study as an indicator of patient dose. When comparing data for one particular and common X ray examination, such as a chest X ray, ESD is a sufficient indicator.
ESD and ED can be recalculated back from the DDIs provided the detector has been properly calibrated and the beam parameters and irradiation geometry are well known.
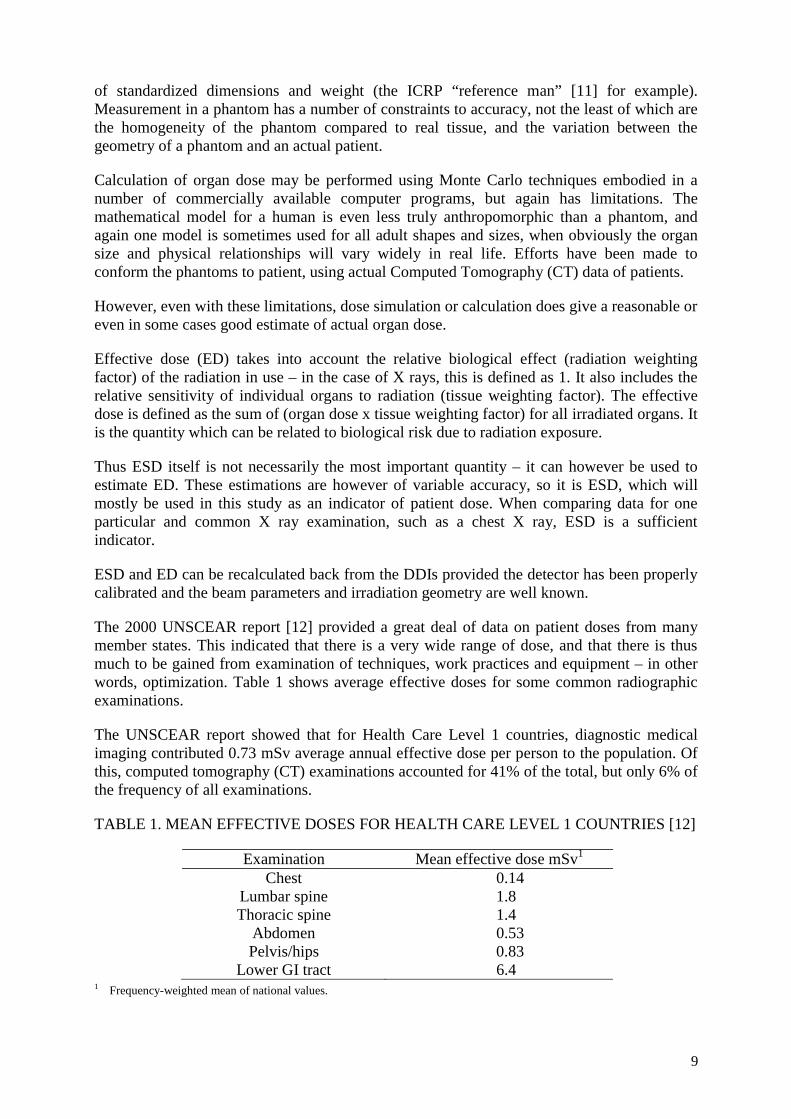
The 2000 UNSCEAR report [12] provided a great deal of data on patient doses from many member states. This indicated that there is a very wide range of dose, and that there is thus much to be gained from examination of techniques, work practices and equipment – in other words, optimization. Table 1 shows average effective doses for some common radiographic examinations.
The UNSCEAR report showed that for Health Care Level 1 countries, diagnostic medical imaging contributed 0.73 mSv average annual effective dose per person to the population. Of this, computed tomography (CT) examinations accounted for 41% of the total, but only 6% of the frequency of all examinations.
TABLE 1. MEAN EFFECTIVE DOSES FOR HEALTH CARE LEVEL 1 COUNTRIES [12]
Examination Mean effective dose mSv1
Chest 0.14 Lumbar spine 1.8 Thoracic spine 1.4
Abdomen 0.53 Pelvis/hips 0.83
Lower GI tract 6.4 1 Frequency-weighted mean of national values.
9

Recently, the UK Health Protection Agency estimated that between 1997/1998 and 2001/2002, the contribution of conventional radiology to total collective dose from X ray examinations in the UK fell from 43.9% (8473 man Sv) to 34.0% (7720 man Sv) [13]. The contribution from CT however increased from 39.7% to 46.9% in the same period. This probably reflects the increasing popularity of CT over conventional X rays as well as increasing use of CT. It is not known yet whether the widespread introduction of digital techniques will also result in an increase in the use of and dose from conventional X ray procedures.
1.6. DIAGNOSTIC REFERENCE LEVELS
ICRP [14] proposed the use of guidance levels, called diagnostic reference levels (DRL), for radiation doses to patients. These levels, which are a form of investigation level, apply to an easily measurable quantity, often ESD, which, in normal practice, should not be exceeded. They are only intended to be a guide to those doses, which if exceeded, should prompt a review of practices in order to optimize patient dose. If the dose also falls substantially below reference levels, it is possible that the intended diagnostic information is not being collected.
The European Union also uses the term “Diagnostic Reference Level (DRL)” [15] to describe a similar concept.
Guidance or reference levels however must not be applied to individual patients They are meant to be used in reference to a population of standard-sized patients, or a standard phantom as mentioned in 1.4 above. They can be used as the exposure indicators, to monitor differences in doses between different radiographic equipment, different detection systems (F/S or digital), to compare techniques between institutions or between countries.
Various bodies have published Diagnostic Reference Levels [15], or Guidance Levels [2] (see Table 12). It must, however, be recognized that most published DRLs were derived from S/F technique whereas a vast majority of radiography equipment is now digital and next DRLs have yet to be published for many examinations.
1.7. ICRP RECOMMENDATIONS
ICRP published a major recommendation on managing dose in digital radiology, ICRP Publication 93 [16] in 2004. To quote from the guest editorial, “While digital techniques have the potential to reduce patient doses, they also have the potential to significantly increase them”. It is known and recognized by the ICRP that since the introduction of digital techniques, doses have often increased measurably and significantly. Quoting again from ICRP 93 [16], “The reasons for this are multiple. Technologists know that an underexposed image will need to be repeated. As a result, there is a tendency to give more dose then is necessary. Most systems do not track unsatisfactory images that have been deleted, and although the data are present, few systems display meaningful dose or exposure factors for the patient record”. As with multislice CT, there is a further tendency to request more or more frequent examinations, simply because it is possible and easy, rather than because it is medically needed.
The purpose of ICRP 93 [16] then was to provide the basic background information to digital radiology, needed by any of the medical and scientific personnel involved in radiology, to enable them to not only understand the technology, but also the aspects which affect patient dose.
10

Actions that can affect dose are listed in ICRP 93 [16]. All must be understood by the user, ideally before any move is made to convert to digital imaging.
TABLE 2. ACTIONS THAT CAN INCREASE OR REDUCE PATIENT DOSE (ADAPTED FROM ICRP 93 [16] AND REPRODUCED WITH PERMISSION)
Action Influence on patient dose
Influence on image quality or diagnostic information
General (for projection radiography and fluoroscopy)
Reduction of noise perception in the image (i.e. the perception of the signal-to-noise ratio)
Increase Improvement
Significant reduction of noise (with saturation of the detector in some areas) (e.g. for the lung in chest images)
Increase Deterioration, retakes
Deletion of image files at the viewing station or workstation of apparently non-useful imagesa
Increase Possible loss of some useful information Difficult to control repeated exposure
Allowing poor conditions in the use of the visualisation monitor (e.g. insufficient brightness or contrast, poor spatial resolution, etc.)
Increase Loss of information
Improvement in use of the capabilities of the workstation to visualise images (window and level, inversion, magnification, etc.)
Decrease Allows more information to be obtained from the same image
Existence of post-processing problems, problems in the digitiser, printer, local hard disk, faults in electrical power supply, problems in the network, etc. during the archiving of images
Increase Occasional loss of images or retakes
Loss of images in the network or the PACS due to improper identification or other reasons
Increase Retakes
Existence of false lesions or pathologies due to artefacts introduced by incorrect digital post processingb
No effect Loss of information and need for retakes
Images stored in the PACS cannot be (sometimes) post processed
Increase Does not permit re-analysis of images Possible retakes
Use of different post processing (could sometimes avoid repetitions)
Decrease by avoiding retakes
Improvement
Allowing easy access to the PACS and teleradiology to look at previous images
Decrease Improvement
Use of digital radiology to obtain an unjustified increase in the number of procedures
Increase Information not always necessary
11

TABLE 2. ACTIONS THAT CAN INCREASE OR REDUCE PATIENT DOSE (ADAPTED FROM ICRP 93 [16] AND REPRODUCED WITH PERMISSION) (CONT.)
Action Influence on patient dose
Influence on image quality or diagnostic information
Implement dose indication on the console of the X ray system
Decrease c No effect
Specific for projection radiography
Permitting incorrect calibration or misuse or lack of use of automatic exposure system
Increase Degradation, retakes
Use deteriorated storage-phosphor plates Increase due to retakes
Loss of quality, retakes
Reduce the number of images per procedure (e.g. avoid the lumbosacral spine image)d
Decrease Remains unchanged
Use appropriate tube potential. In general, establish correct radiographic techniques for digital systems
Decrease Slight deterioration or improvement
Availability of a workstation for post processing (also for radiographers) to avoid some retakes
Decrease Improvement
Specific for digital fluoroscopy Increase the number of images per examination with digital fluoroscopy
Increase Improvement
Use magnification (the use of small field sizes with the image intensifier or flat-panel detector) to improve spatial resolution
Can increase skin dose
Improvement
Use of high-dose fluoroscopy or high-dose mode in digital acquisition
Increase Improvement
Use of digital serial radiographs (26 frames/s) instead of fluoroscopy
Could increase
Possible improvement
Use of virtual collimation Decrease No effect Use of pulsed fluoroscopy Can decrease Sometimes slight
deterioration PACS D a If a dose register exists on the X ray system or in the radiology information system, one would know which images had been deleted and would have some basic dosimetric information. b The use of post processing to enhance visibility of some structures may lead to an increase in false- positive diagnoses. c Can avoid repetitions and helps to optimize radiographic techniques. d Using adequate post processing, it is possible to obtain more information from previous images avoiding extra projections that could be usual in film-screen radiology (e.g. lumbosacral junction projection in lumbar spine examinations).
12

2. REVIEW
As long ago as 1978, Motz and Danos [17] analyzed the potential for information content and image contrast in radiology, and foresaw that “The advent of image processing which, upon full development of the needed technology, should permit arbitrary changes and manipulation of image contrast” and that “it will be possible to determine the patient exposure by the image information content desired rather than by the image visibility requirements on X ray film”. This, long before the invention of CR technology, is the basis for the possibilities in digital imaging.
In 1983, Sonoda et al [18] announced a new imaging processor based on stimulated luminescence, which immediately became known as computed radiography, after computed tomography.
One of the first publications involving CR [19] immediately stressed the potential for dose reduction in children compared to fast detail screen/film imaging– up to 85% reduction was reported using a prototype (Fuji) CR system without unacceptable loss of image quality.
In the next 10 years, many studies reported sometimes dramatic decreases in dose achieved by use of CR. For example Marshall et al compared film/screen, 100mm film, digital spot imaging, a scanned slit system and an early CR system, and found that ESD could be reduced by a factor of at least 5 compared to film/screen, depending on X ray projection [20]. Huda et al [21] compared the mAs required to generate a constant CR phosphor signal (as exposure index) to the mAs required to obtain a constant film density with various film/screen speeds for a range of attenuators. They proposed using such relative response data to select technique factors to minimize patient dose – in effect optimization. Hufton et al [22] measured patient dose from CR compared to a 600 speed film/screen system in paediatric examinations. They found that while maintaining image quality it was possible to reduce dose by an average of 40%, except for chest examinations where the dose was similar.
However as longer term experience was gained, it started to emerge that these potential benefits were sometimes not realized, due to either technical factors or lack of close examination of procedural factors when changing to CR. Heggie [23] compared doses from CR to those collected over a 10 year period using film/screen. He found that doses had in general decreased although not always significantly, with the important exception of PA chest radiography, where doses with CR had in fact increased by up to 18%.
Studies of dose in paediatric chest radiography supported Heggie’s conclusions. Nickoloff et al [24] found that film/screen imaging using a high (~140) peak tube potential (kVp) and Cu/Al filtration compared to CR gave lower ESDs by a factor of about 3.6. Peters and Brennan [25] measured the mAs required to give acceptable mobile chest X ray images, and compared the resulting CR exposure index to that suggested by the CR manufacturer. The required exposure index was up to 40% lower than the suggested value. Willis [26] also examined CR in paediatric chest imaging, with similar conclusions.
Vano et al [27] implemented a real-time monitoring system for patient dose at the time of transition to CR, in which moving average ESD and dose-area product (DAP) are continually displayed centrally, with warning messages displayed if reference values are exceeded, prompting corrective actions if necessary. They found that initially doses increased by up to 30%, mainly due to lack of radiographer training in the new technology, especially in X ray rooms where automatic exposure control (AEC) systems were not installed.
13

A more critical approach to the use of CR was required. By this time however the newer technology of DR was more widely available. A similar focus was placed on the potential of DR in dose reduction, albeit now with a more critical approach as a result of the CR experience and often looking at image quality in association with dose.
Chest imaging remained a focus. Radiographic technique, grid properties and kVp were investigated with dedicated chest phantoms, showing that dose could be reduced, at higher kVp, but at the cost of a small decrease in signal-to-noise ratio (SNR) [28].
The choice of optimum kVp for CR chest imaging had been mentioned by many authors, for example [29-31]. Honey et al [32] explored this further, pointing out that, unlike film/screen imaging [33], there was no accepted guidance on radiographic technique for digital chest imaging. Further, there were different methods of assessing image quality assessment and methods of matching dose at varying tube potentials. Honey considered the X ray tube energy spectrum and the absorption characteristics of CR plates, which are very different to those of rare earth film screens. The work suggested a lowering of tube potential to around 90 kVp, with image quality poorest at 125 kVp – commonly used in film/screen imaging – without dose penalty.
The advent of DR prompted investigation of the relative merits of CR and DR (and in some cases amorphous selenium receptors) in chest imaging and the potential for dose reduction using DR [34-37]. ESD was found to be lower with DR, while maintaining or even improving image quality.
Hamer [38] also examined the effect of tube potential on contrast-detail performance in direct and indirect DR compared to CR, suggesting a potential dose reduction of 68% at 70 kVp and 81% at 113 kVp using indirect DR. The relationship between dose reduction and kVp is the reverse to that known in CR, due to the different detector performance at high photon energies.
It was realized that paediatrics stood to gain much from digital imaging [39-43] as long as it was used correctly.
Other studies have looked at details of digital imaging techniques, such as patient thickness [44], or particular projections [45], again showing the potential for dose reduction, especially with DR.
Slovis [46] and later Willis [47-48] pointed out that the “uncoupling” of the image acquisition from the display in CR and DR introduces the hazard of overexposure without degradation of image quality while overexposure leads to film/screen images that are unacceptably dark... Indeed the reduced noise and graininess of overexposed digital images may often be preferable to the radiographer and radiologist. Slovis noted that a 35-50% reduction in (paediatric) radiation dose was possible with equal contrast and density, if a higher level of noise, or mottle, was accepted.
The phenomenon of “exposure creep” in CR had been recognized for some time [49-50], and, of course, this phenomenon also exists in DR. Willis [47-48, 51] proposed strategies for use in paediatric CR examinations including monitoring of the provided exposure indicator, definition (by manufacturers) of the radiation exposure needed to provide an acceptable image with their detectors, and facilitation of reject analysis (again by manufacturers).
14
Wilkinson [52] and Doyle [53] pointed out that existing X ray equipment should be adapted to the digital environment, especially the AEC system. In film/screen imaging, the AEC is adjusted to give a constant film optical density regardless of the X ray beam quality. In CR the AEC should be adjusted to provide a constant signal level in the resultant image. Doyle et al [53] investigated the use of three means of achieving this: the CR manufacturer’s exposure indicator, the dose to the image receptor, and the image noise level. All these require an initial decision as to the target level and the difference across all methods was only approximately 10%.
We are now at the point where the technologies of CR and direct and indirect DR are accepted and in widespread use. Radiology professionals now appreciate the advantages of these technologies and potential for dose reduction.
However the potential for increase in dose must be addressed. ICRP 93 [16] mentions a few of the latent problems: the ease with which digital images may be deleted (often without record), an increase in number of examinations due to the ease of acquisition and storage, use of higher doses to reduce image noise without increase in diagnostic benefit, and use of inappropriate levels of image compression (which may cause loss of information and thus wasted dose). The time has now come for a more systematic approach to optimization.
Willis [47-48] summarized the outcomes from an ALARA (“as low as reasonably achievable”) conference concentrating on paediatric radiology. In particular he pointed to the massive dose reductions achieved in mammography by the use of standardization, recommending that a similar approach be taken. This would include standardization of nomenclature. Currently each manufacturer has its own proprietary approach (including that for detector dose indicators such as Sensitivity number S, Exposure index EI or EXI, logarithmic median LgM, etc.).
Bath et al [54] suggested a strategy for optimization based on firstly determining optimal radiographic technique factors, determining optimal image display parameters, and finally determining optimal dose level. The strategy was applied to an animal model, using a live rabbit as phantom for neonates [42].
Samei et al [55] took a more technical approach based on the signal and noise characteristics of digital images. Signal was defined as the difference in detector signal with and without a target present against a uniform background. Noise was determined from this background. The figure of merit used was signal-difference-to-noise ratio squared per unit free-in-air dose. Three applications of the process showed that: a higher beam quality was indicated in indirect DR chest imaging; in direct DR mammography, a tungsten target/molybdenum filter combination (W/Mo) was preferable to conventional Mo/Mo combinations; and use of high Z filtration can improve image quality and noise in breast cone-beam CT imaging using indirect DR as a detector.
Studies into possible dose reduction continue to appear. Compagnone et al [56] compared screen/film, CR and DR for a range of common radiographic examinations in adults and found that effective doses using DR were lower by ~29% and ~43% compared to film/screen and CR respectively. Interestingly, CR showed higher doses than film/screen in this study. They point out again the need for optimization, but also that this may take some time to finalize as it is a dynamic process. Aldrich et al [57] also found a similar relationship. They however opted to decrease noise in chest DR imaging by increasing dose. Even after this process, ESD on DR was around two thirds that for CR and film/screen chest imaging.
15

Image quality control of soft copy display systems (cathode ray tube (CRT) or liquid crystal display (LCD)) is often omitted or relegated to lesser importance than dose control. Display systems are expensive and not easy to standardize, making quality assurance (QA) even more important. As Seto et al [58] point out, there are as yet no comprehensive standards for QA of soft copy display systems. Finally, defective pixels in LCD displays are not always easy to detect. Most companies produce software to produce a weighted-average replacement for a defective pixel count; however, this has the potential to hide real data if there is a cluster of defective pixels. Kimpe [59] has examined whether defective pixels really do have clinical relevance, and suggests a method of “masking” defective pixels so they are almost invisible.
Ramli et al [60] compared CR with film and selenium plate imaging of the chest from the points of view of both image quality and dose. They found no significant difference for either image quality or dose between the three technologies.
In a special issue of European Journal of Radiology, presenting an update of Digital Radiography, Schaefer-Prokop et al [61] compared all digital detectors in the market in terms of technology used, characteristics that determine image quality, image processing and softcopy displays, concluding that it is likely that CR and DR systems will coexist for the next few years. Uffmann and Schaefer-Prokop [62] debated on the balance between image quality and radiation dose which is more flexible with digital systems, assessment of dose-relevant parameters can lead to dose control as part of the routine overall quality control programme.
Lastly, the tests and testing protocols needed for performance evaluation and routine quality control of CR and DR remain to be universally agreed upon, although there are moves towards consensus, for example [63–66].
16

3. MATERIALS AND METHODS OF THE CRP
This monograph uses data collected in the framework of a coordinated research project (CRP) entitled “Avoidance of unnecessary dose to patients while transitioning from analogue to digital radiology” (project carried out from 2003-2004), and recommendations as provided by the ICRP publication to support application of recommendation.
3.1. SELECTION OF SITES AND HOSPITALS
Table 3 shows the countries which participated in the CRP. The participant of each country had the task of selecting hospitals and X ray equipment to be included in the data collection where appropriate. Also shown is the number of hospitals and X ray units involved. Only two hospitals in Australia contributed patient dose data, and seven hospitals contributed entrance surface air kerma (ESAK) data. Appendix V lists the participating hospitals in each country.
TABLE 3. PARTICIPATING COUNTRIES AND NUMBERS OF HOSPITALS AND X RAY UNITS
Country Australia B
Austria A
India C
Malaysia D
Thailand E
Hospitals 4 1 1 1 1 X ray units 12 2 1 3 2
3.2. DESCRIPTION OF IMAGING SYSTEMS, PATIENT POPULATION AND MEDICAL RESOURCES
All hospitals had digital systems at the time of the study. Of these all but one were CR only, and one hospital had one CR room and one DR room (see Table 4).
All were university teaching hospitals with the wide resultant patient mix. All had staff radiologists available, and all studies were performed by technologists (radiographers) with the required local qualifications. All but two hospitals had a qualified medical physicist on site. The two without on-site support had access to an external qualified medical physicist.
TABLE 4. INFORMATION ON PARTICIPATING HOSPITALS
Hospital Radiography Procedures per year
Imaging method(s) (F/S, CR, DR) and
manufacturer
AEC used?(Y/N/Partly)
B3 Westmead (Australia)
65,000 Only 1 unit out of 4 contributed to patient
dose measurements
CR (Agfa) Partly
B1 St Vincents (Australia)
50,000 Only 2 unit out of 3 contributed to patient
dose measurements
CR (Agfa) Yes
B4 Sydney Adventist (Australia)
40,000 Did not contribute to patient dose study
(3 units)
CR (Agfa) Yes
B2 St George (Australia)
Possible error in ESAK measurements, withdrew (2 units)
FS
17
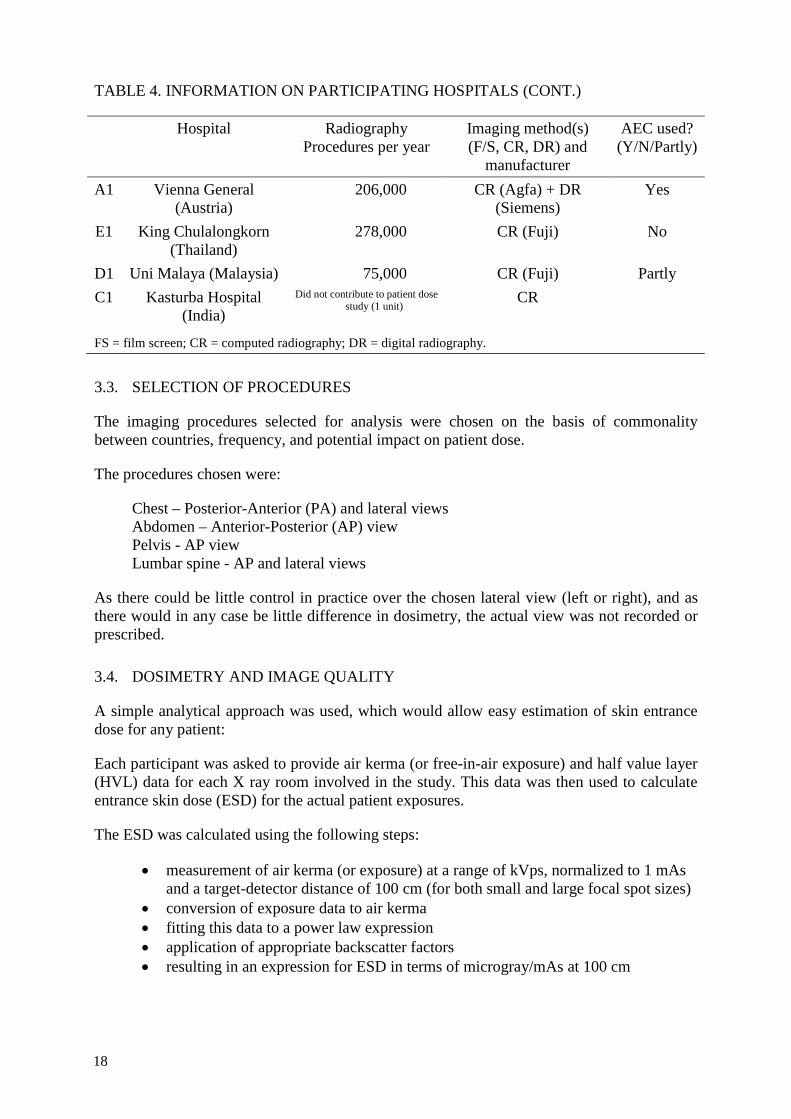
TABLE 4. INFORMATION ON PARTICIPATING HOSPITALS (CONT.)
Hospital Radiography Procedures per year
Imaging method(s) (F/S, CR, DR) and
manufacturer
AEC used?(Y/N/Partly)
A1 Vienna General (Austria)
206,000 CR (Agfa) + DR (Siemens)
Yes
E1 King Chulalongkorn (Thailand)
278,000 CR (Fuji) No
D1 Uni Malaya (Malaysia) 75,000 CR (Fuji) Partly C1 Kasturba Hospital
(India) Did not contribute to patient dose
study (1 unit) CR
FS = film screen; CR = computed radiography; DR = digital radiography.
3.3. SELECTION OF PROCEDURES
The imaging procedures selected for analysis were chosen on the basis of commonality between countries, frequency, and potential impact on patient dose.
The procedures chosen were:
Chest – Posterior-Anterior (PA) and lateral views Abdomen – Anterior-Posterior (AP) view Pelvis - AP view Lumbar spine - AP and lateral views
As there could be little control in practice over the chosen lateral view (left or right), and as there would in any case be little difference in dosimetry, the actual view was not recorded or prescribed.
3.4. DOSIMETRY AND IMAGE QUALITY
A simple analytical approach was used, which would allow easy estimation of skin entrance dose for any patient:
Each participant was asked to provide air kerma (or free-in-air exposure) and half value layer (HVL) data for each X ray room involved in the study. This data was then used to calculate entrance skin dose (ESD) for the actual patient exposures.
The ESD was calculated using the following steps:
• measurement of air kerma (or exposure) at a range of kVps, normalized to 1 mAs and a target-detector distance of 100 cm (for both small and large focal spot sizes)
• conversion of exposure data to air kerma • fitting this data to a power law expression • application of appropriate backscatter factors • resulting in an expression for ESD in terms of microgray/mAs at 100 cm
18
Participants were provided with a protocol and prepared data table. These are reproduced in Appendix II. Data files were centrally analyzed by one participant.
3.4.1. Entrance surface air kerma data
The supplied data, once normalized to 100 cm focus to detector distance (FDD) and 1 mAs, were fitted to a power law using KaleidoGraph [59].
3.4.2. HVL data
Participants were asked to provide the X ray beam quality (HVL) for each X ray unit in mm Al at (preferably) 80 kVp, although some measurements were performed at 60 or 70 kVp. The fact that 7 units were measured at 81 kVp was ignored – this was simply due to the available kVp settings on those units, and would make little difference to HVL.
3.4.3. Quality control (QC)
Before data collection, participants were asked to check that the X ray equipment, kVp and timer, for all participating units were accurate to within IEC limits (+/-10% for kVp and +/- 10% + 1 ms for time) [60] using a calibrated non-invasive measurement device.
3.5. ESD CALCULATION
To convert the ESAK data to ESD, backscatter factors (B) are needed. Petoussi-Hens et al [61] have calculated Bs for a range of kVps, field sizes, tissue models, and beam filtrations. To use this information, we have to be confident that these HVL’s as a function of kVp and filtration match the measured data. The closest fit of supplied pooled data to the Petoussi-Hens data was chosen, and checked on a simple plot of HVL and kVp (see Figure 4). B data for a beam filtration of 3 mm Al were used (Fig. 6a), except for the 3 units at Saint-Vincents hospital (Melbourne) in which deliberately high total filtration was used in an effort to reduce patient dose. In this case Petoussi-Hens B data for 3mm Al+0.1 mm Cu filtration were used (Fig. 6b). The actual total filtration in the X ray beam for each unit was not known. Bs for ICRU tissue were selected [62].
19
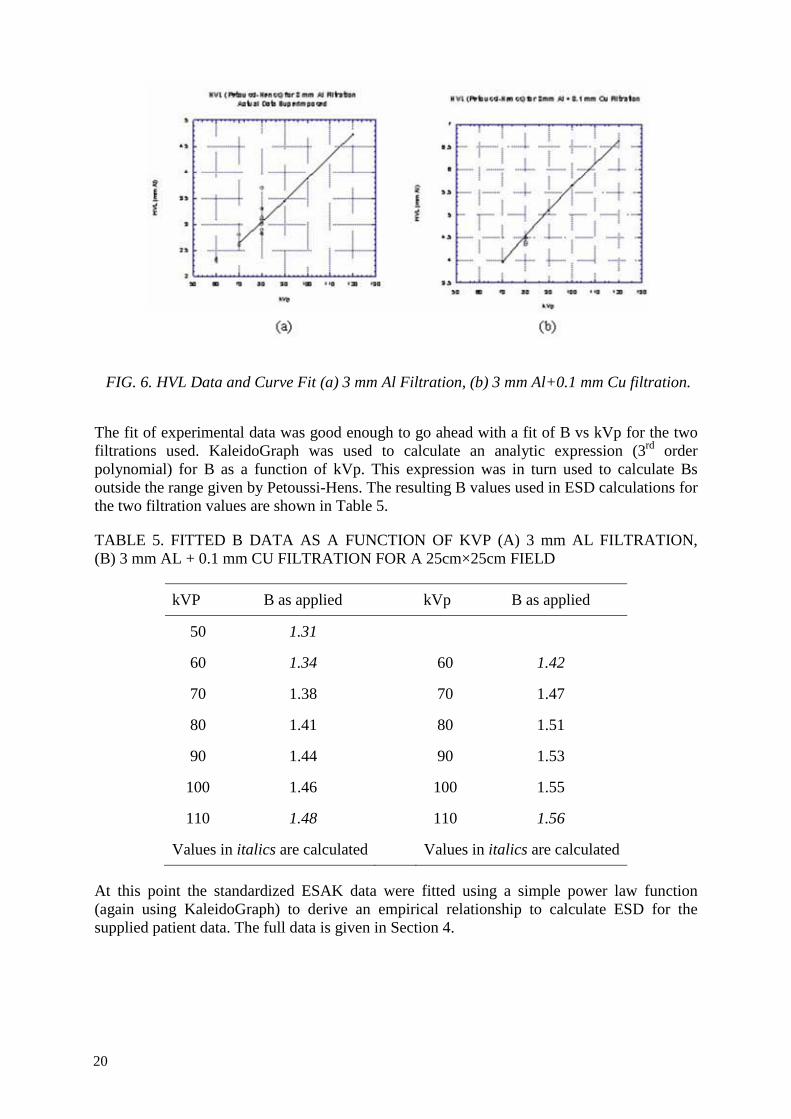
FIG. 6. HVL Data and Curve Fit (a) 3 mm Al Filtration, (b) 3 mm Al+0.1 mm Cu filtration.
The fit of experimental data was good enough to go ahead with a fit of B vs kVp for the two filtrations used. KaleidoGraph was used to calculate an analytic expression (3rd order polynomial) for B as a function of kVp. This expression was in turn used to calculate Bs outside the range given by Petoussi-Hens. The resulting B values used in ESD calculations for the two filtration values are shown in Table 5.
TABLE 5. FITTED B DATA AS A FUNCTION OF KVP (A) 3 mm AL FILTRATION, (B) 3 mm AL + 0.1 mm CU FILTRATION FOR A 25cm×25cm FIELD
kVP B as applied kVp B as applied
50 1.31
60 1.34 60 1.42
70 1.38 70 1.47
80 1.41 80 1.51
90 1.44 90 1.53
100 1.46 100 1.55
110 1.48 110 1.56
Values in italics are calculated Values in italics are calculated
At this point the standardized ESAK data were fitted using a simple power law function (again using KaleidoGraph) to derive an empirical relationship to calculate ESD for the supplied patient data. The full data is given in Section 4.
20
3.6. ACTUAL PATIENT DOSES
Participating hospitals were asked to collect actual patient exposure information for the selected projections. The data required was:
• X ray unit used (limited to those units for which ESAK data were collected) • Date of examination • Age • Sex • Weight • Height • kVp • mAs • Was this a retake and if so, what was the reason? • Modality (film, CR, DR) • Grid used (Yes/No)
Later in the study, it was also requested that the exposure method for each X ray unit be supplied, i.e. manual or AEC.
It was expected that a wide range of patient weights and heights would be experienced at each hospital. As this wide range would distort the average patient dose, it was decided to restrict the data that would be included in the analysis to certain weight/height ranges. As hospitals with European and Asian patient populations and thus quite different characteristics were involved, two ranges were necessary. The ranges used were:
• European male – 70 +/- 10 kg • European female – 60 +/- 10 kg • Asian male – 60 +/- 10 kg • Asian female – 50 +/- 10 kg • Age – 20-60 years
3.7. RETAKE ANALYSIS
An analysis of the numbers of, and reasons for, repeated X rays was performed at selected sites on the basis of the following causes:
• positioning and collimation (incorrect position, collimation obscuring relevant body parts)
• radiographic techniques (including detector centering, failure of patient breathholding)
• incorrect exposure factors (kVp, mAs, autoprogram selection) • patient movement • artifacts (other than patient movement) • other (wrong patient, wrong body part, misidentification etc.)
21

3.8. PHANTOM STUDIES
In order to obtain objective information on the digital images, an X ray phantom, Vienna I, was designed and constructed by one participant. The main purpose of the phantom was to investigate how far the patient dose could be reduced without affecting image quality.
The phantom (see photograph in Fig. III.5) has various components, which are described below, and in more detail in Appendix III.
3.8.1. Beam hardening and prefiltration
A dedicated phantom used to determine image quality parameters such as spatial resolution, contrast, or low contrast detectability, will normally attenuate and harden the X ray beam far less than the human body. Therefore an additional absorber should be used, otherwise in film-screen radiography (especially at high tube potentials) the shortest available exposure time might be too long to yield a correctly exposed image. In digital radiology, too high an exposure will not result in an unusable image, but the image quality parameters derived will not represent the situation in a clinical image.
If part of the phantom serves as body-equivalent absorber (prefilter), exposure conditions are much better defined, because (a) the X ray equipment will work in the dose range it is designed to, and (b) the beam quality (X ray spectral distribution) incident on the detector will more closely represent patient exit spectrum. This is especially important if image quality at different spectral settings (kVp, added filtration) or detectors with different spectral sensitivity (CR and DR) are to be compared.
In regular radiology quality control a common choice for the prefilter is 0.25 mm of aluminium (at 70 kVp) and an additional 1 to 1.5 mm of copper at 100 kVp. While these materials can be used separately or together to obtain appropriate attenuation, because the effective atomic numbers of aluminium and tissue are considerably different (Al=13, average soft tissue=7.64) their effect on beam quality (HVL) will also be different.
This is not a problem in QC acceptance and constancy checks but will not allow a direct comparison of system imaging characteristics in clinical exposures. A widely available material used for beam attenuation is polymethyl methacrylate (PMMA) (Lucite, Perspex, Plexiglas). PMMA consists of the elements C, H, and O and is a better tissue equivalent material than aluminium. Nevertheless, the effective atomic number is lower than for average soft tissue (6.56 compared to 7.64). To take into account hard tissues in the body, a material with slightly higher effective atomic number than soft tissue would be preferable. polytetrafluorethylene (PTFE, Teflon) represents a good choice, because it is readily available and, with an effective atomic number of 8.48, fulfills this requirement. If an absorber with an effective atomic number equal to tissue is needed, thin slices of PTFE and PMMA can be stacked alternately.
In Vienna I, 8 cm of Teflon is used as the prefilter. This thickness was calculated to provide attenuation approximately corresponding to an average patient in the abdominal and pelvic body region. The prefilter is made of 2 slabs of 4 cm each allowing also the use of one single slab to mimic patient attenuation in the chest region. The prefilter will fit into the guides under the collimator assembly. Adaptors to fit the slit widths of most systems are provided. Photographs of the phantom and its components are given in Appendix III, the information sheet provided with the phantom.
22

3.8.2. The phantom plate
In digital radiology every image presented to the user has been subjected to digital image processing. The algorithms applied may be rather sophisticated as in the case of multi-spectral image enhancement or very simple as in latitude (contrast) adjustment and normalization. The latter two image processing steps will be applied to every image since the high dynamic range of digital imaging modalities will produce images with extremely poor contrast otherwise. For latitude adjustment several algorithms are used, some depending on the image histogram. To ensure that the image processing applied will work in a similar way as in a clinical image, the phantom image should produce a histogram of adequate width (latitude). Therefore the phantom contains a step wedge made of aluminium containing 7 steps from 0 to 45.7 mm height. Using this wedge will result in an image latitude corresponding approximately to a standard patient’s X ray taken at 70 kVp in the abdominal/pelvic region.
The central area (5 by 5 cm) of the phantom plate is kept free of structures to provide a homogeneous area for signal normalization. Also, in many X ray systems, the central AEC chamber will be located there. To quantify spatial resolution a line pair test pattern was included. To judge a system’s ability to image fine structures such as trabecular patterns with rather low contrast in bony tissues, a porcine vertebral body embedded into PMMA is included in the phantom.
Adjacent to the central field, two square-sectioned holes 1 cm deep and 5 cm in diameter are located for contrast to noise ratio (CNR) measurement. A spare hole can be used to accommodate additional inserts like a disk made from bone equivalent material to measure contrast and CNR between background and bony tissues.
A low contrast detectability insert with details of 5 mm diameter ranging from 0.71 to 8 per cent contrast and 10 mm details from 0.71 to 5.66 per cent contrast in steps of square root of 2 complete the phantom. The details are randomly distributed. Their number and contrast are shown in Fig. III.4. Appendix III contains a photograph and an X ray image of the phantom (Fig. III.5 and III.6).
3.8.3. Evaluation of phantom images
The three most important image quality parameters to be measured with this phantom include CNR, spatial resolution and low contrast detectability. Participants were advised to take two, preferably three, images with identical settings to measure these parameters. In CR, particularly, image quality may depend on individual plate conditions and the time delay between image acquisition and readout.
Post-processing can have a significant effect on image parameters. Designed to provide enhanced images for the radiologist, post-processing can be used to provide corrections for the image receptor properties, and increase contrast and latitude, suppress noise and increase spatial resolution. While diagnostically useful, these functions can make measurements of the basic imaging properties of a digital X ray system difficult or impossible to determine. Such measurements must be made with unprocessed or “raw” images, unless the measurements are being made to specifically evaluate a processing mode.
Some equipment manufacturers provide an unprocessed image, or allow access to test protocols, which acquire images with little or no processing. It is critically important however for the user to know what if any post-processing is applied, and to be able to obtain unprocessed data.
23

3.8.4. Contrast to noise ratio (CNR)
The contrast to noise ratio was determined using the 5 cm diameter holes located on the central axis of the phantom. Regions of interest (ROIs) of about 1 cm diameter were placed closely together in pairs, one in the borehole, the other just outside. The standard protocol was to evaluate 4 pairs of ROIs in each hole (left and right side of phantom plate) resulting in 8 CNR measurements per image (see Figure III.7).
3.8.5. Spatial resolution
High contrast spatial resolution was to be determined using approximately twofold magnification. In soft reading this implied the use of a display magnifier tool (assuring that the reading is not limited by monitor pixel size). With hard copy films the use of a common magnifying glass was advised.
3.8.6. Low contrast detectability
The minimum detectable contrast for 5 and 10 mm structures was calculated from the number of recognized details reported by every observer individually. In order to obtain valid statistics more than one image taken with identical exposure setting was presented to each observer in random order. Since a rather high degree of interobserver variability was anticipated, at least three observers were asked to analyze the low contrast sections of the images.
3.9. IMAGE QUALITY CRITERIA
The image quality criteria component was performed at one participating hospital. The aims and objectives were:
- Development of image quality criteria for normal radiographs i.e. chest PA, lumbar spine (AP, Lateral), abdomen AP and pelvis AP
- Analysis of the effect of monitor resolution on diagnostic information - Analysis of the quality of radiographs between hard copy and soft copy - Analysis of retake rates - Associated optimization actions
• Training of radiographers • Quality control actions on conventional equipment
The basis for image quality was the European guidelines [30]. A spreadsheet was prepared for data collection based on the EU criteria (see Appendix IV).
Display monitors used were Barco high resolution monitors (1280 x 1046 pixels). A CRT monitor (Samsung Syncmaster 1100p) was used for low resolution images. Hard copies were made with a Kodak Dryview 8100 laser printer.
The reporting was performed with a General Electric Pathspeed Workstation v 7.12 with post processing capabilities. There was no image compression for reporting on the high resolution monitors, however lossy compression was used for transmitting the images to the low resolution monitor. Printed films were viewed on standard viewing boxes.
24
3.9.1. Effect of monitor resolution
The effect of monitor resolution on diagnostic quality (comparison of high resolution and low resolution) was checked by randomly selecting chest radiographs. Only erect chest radiographs were used. These were then interpreted independently by three radiologists on both a high resolution monitor and a low resolution monitor under appropriate lighting conditions. The quality of the image was noted on the data spreadsheet. Lumbar spine radiographs and abdominal radiographs were assessed similarly.
3.9.2. Comparison of soft copy (display) versus hard copy (films)
The same radiographs used above were then laser printed. Again 3 independent radiologists assessed the films for quality. For this procedure only the high resolution monitors were used.
The details regarding the exposure parameters for each film (kVp, mAs) were also recorded.
The data regarding hard and soft copy comparison and comparison between high and low resolution monitors were sent to the project data collator who performed the analysis.
3.10. RETAKE RATE
Retake analysis was performed at three participating hospitals. A log book was maintained to document the details of any repeated radiographs. These were divided into those due to operator error, and those due to equipment errors.
QA on the X ray units (beam alignment, field congruence, focal spot, HVL etc) was performed periodically.
3.11. OPTIMIZATION
A retraining seminar for radiographers was given at all participating sites on the need for and benefits of collimation, good technique selection, quality control, and thereby reduction of the radiation dose to the patient. The seminar included theory and practical modules. A good evaluation of the effects of this seminar would be to do the patients ESD measurements again.
It is not only radiographers who can benefit from retraining, but also radiologists.
A retraining program should include as a minimum:
• Description of CR and DR systems, and their properties (especially latitude/sensitivity)
• The image acquisition process and post-processing • The meaning and use of exposure indices • Image analysis • Quality control (QC) • Patient dose management
25
Other aspects which could be included are:
• Image transfer and archiving • Workstations • Image presentation
For a full description, see Annex C of ICRP 93 [13]. The time required would approximately range from 1 to 6 hours, depending on the audience. Radiographers should receive the full range of topics, and radiologists could concentrate on the equipment, analysis and dose management aspects.
3.12. TLD INTER-HOSPITAL COMPARISON
As described earlier doses to patients were calculated using ESAK derived from measurements performed at the participating hospitals. For these measurements, locally available ion chambers and electrometers were used. To ensure the integrity of this data and to compare instrument calibrations all hospitals were asked to irradiate TLDs using a defined protocol.
TLDs used were Thermo Scientific (formerly Harshaw) TLD 100. Participating hospitals were asked to irradiate sealed batches containing 3 TLD dosimeters each at 70 and 90 kVp with each X ray tube assembly used in the project at 120 cm focus-TLD distance. TLDs were placed on the surface of a phantom consisting of a 15 cm thick stack of acrylic sheets of minimum 25 by 25 cm area. Three consecutive exposures applying automatic exposure control (if available) were used to irradiate the TLDs and the resultant mAs noted and reported.
Participants were also asked to supply data on inherent filtration or half value layer of the X ray equipment used as well as the measured distance from focus to the phantom top surface. Background radiation was assessed using one dedicated TLD set per hospital and subtracted. TLDs were read out using a Harshaw TLD 4000. Calibration was performed individually for every TLD chip by irradiation with a clinical X ray system (Siemens Polydoros 50S with a Biangulux 150/12/50 tube) against a reference class dosimeter (PTW Unidos, chamber Type M77334 1cc calibrated by PTB, Braunschweig, Germany). A fading correction (for the time between dosimeter exposure and reading) was applied. Backscatter factors for acrylic were applied and measurements were compared to local readings at each participating hospital.
26

4. RESULTS FROM THE CRP
4.1. HVL
Figure 7 shows the distribution of HVLs measured on participating X ray units where 80 kVp was used as requested. Of these, it was only possible to select 81 kVp on 7 units, but the difference in HVL between 80 and 81 kVp is negligible. The remaining 3 units had HVL measured at 60 or 70 kVp, and are not included in Fig. 7. The HVL is plotted as a function of individual X ray unit.
FIG. 7. HVL data.
The three higher values (units 9-11) come from a hospital which deliberately uses extra filtration to reduce skin dose. This data was treated separately. Unit 1 is at a hospital, which appears to use normal levels of filtration, and is the only participating X ray unit at this site.
The mean HVLs are shown in Table 6.
TABLE 6. MEAN HVL VALUES
kVp No. of X ray Units Mean HVL (mm Al) 60 2 2.31 70 4 2.70
80/81 11 3.09 81 (high filtration) 3 4.42
4.2. ENTRANCE SURFACE AIR KERMA AND ENTRANCE SKIN DOSE
The ESAK data were analyzed and normalized to units of microgray per mAs at 1m. As mentioned in Section 3, backscatter factors were applied to the ESAK data to obtain ESD, and for this step beam HVL was required.
27
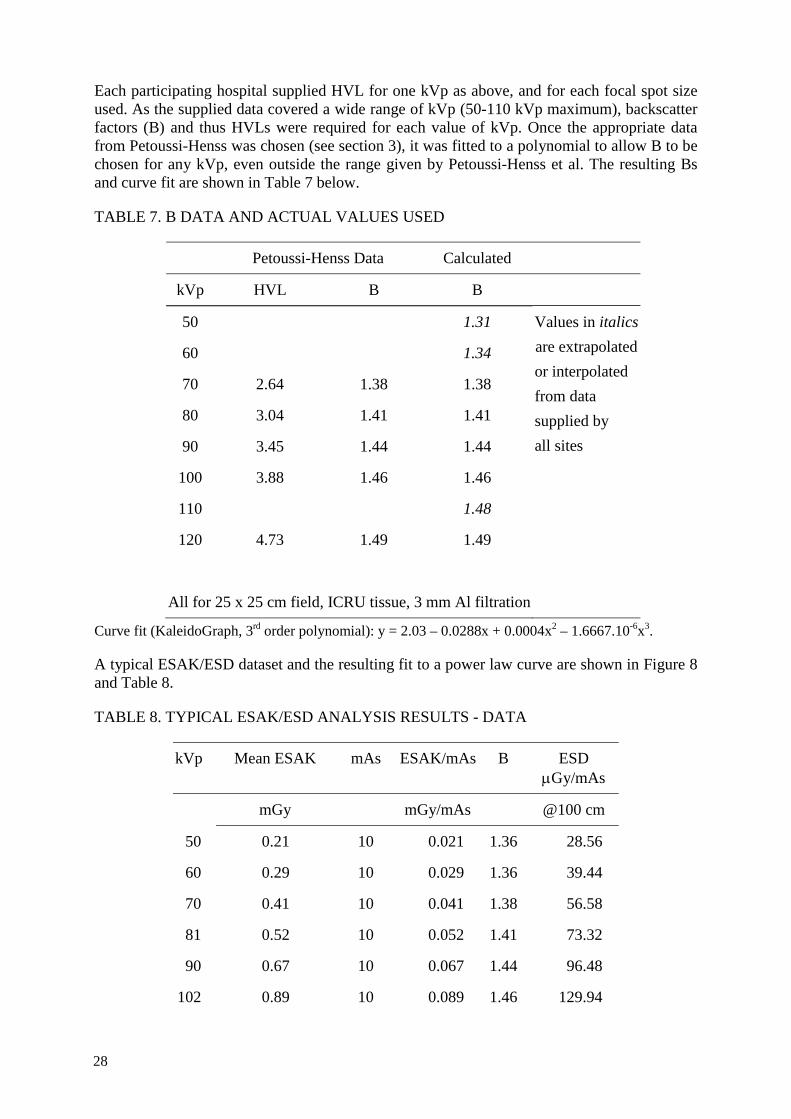
Each participating hospital supplied HVL for one kVp as above, and for each focal spot size used. As the supplied data covered a wide range of kVp (50-110 kVp maximum), backscatter factors (B) and thus HVLs were required for each value of kVp. Once the appropriate data from Petoussi-Henss was chosen (see section 3), it was fitted to a polynomial to allow B to be chosen for any kVp, even outside the range given by Petoussi-Henss et al. The resulting Bs and curve fit are shown in Table 7 below.
TABLE 7. B DATA AND ACTUAL VALUES USED
Petoussi-Henss Data Calculated
kVp HVL B B
50 1.31 Values in italics are extrapolated or interpolated from data supplied by all sites
60 1.34
70 2.64 1.38 1.38
80 3.04 1.41 1.41
90 3.45 1.44 1.44
100 3.88 1.46 1.46
110 1.48
120 4.73 1.49 1.49
All for 25 x 25 cm field, ICRU tissue, 3 mm Al filtration
Curve fit (KaleidoGraph, 3rd order polynomial): y = 2.03 – 0.0288x + 0.0004x2 – 1.6667.10-6x3.
A typical ESAK/ESD dataset and the resulting fit to a power law curve are shown in Figure 8 and Table 8.
TABLE 8. TYPICAL ESAK/ESD ANALYSIS RESULTS - DATA
kVp Mean ESAK mAs ESAK/mAs B ESD μGy/mAs
mGy mGy/mAs @100 cm
50 0.21 10 0.021 1.36 28.56
60 0.29 10 0.029 1.36 39.44
70 0.41 10 0.041 1.38 56.58
81 0.52 10 0.052 1.41 73.32
90 0.67 10 0.067 1.44 96.48
102 0.89 10 0.089 1.46 129.94
28

TABLE 8. TYPICAL ESAK/ESD ANALYSIS RESULTS – DATA (CONT.)
kVp Mean ESAK mAs ESAK/mAs B ESD μGy/mAs
mGy mGy/mAs @100 cm
109 1 10 0.1 1.46 146.00
Large focus, focus-chamber distance (FCD) = 100 cm
FIG. 8. Typical ESAK analysis results - curve fit.
The ESAK results for all hospitals are summarized in Table 9. Only large focus data is given. Some hospitals did not provide small focus data.
TABLE 9. SUMMARY OF ESAK RESULTS FOR ALL HOSPITALS (LARGE FOCUS ONLY)
Country Site (hospital)
Film/CR/DR X-Ray unit HVL Curve Fit
kVp mm Al a N
A 1 CR Room 1 60 2.33 0.015628 1.9825
1 DR Room 2 60 2.29 0.014122 2.0017
B 1 CR Room 1 80 2.89 0.005267 2.2431
1 CR Casualty 80 3.00 0.003327 2.2273
1 CR Room 8 81 3.30 0.004264 2.2233
withdrew 2 Film Room 1 70 2.60 0.001766 2.3279
withdrew 2 Film Room 3 70 2.8 0.000567 2.6337
29
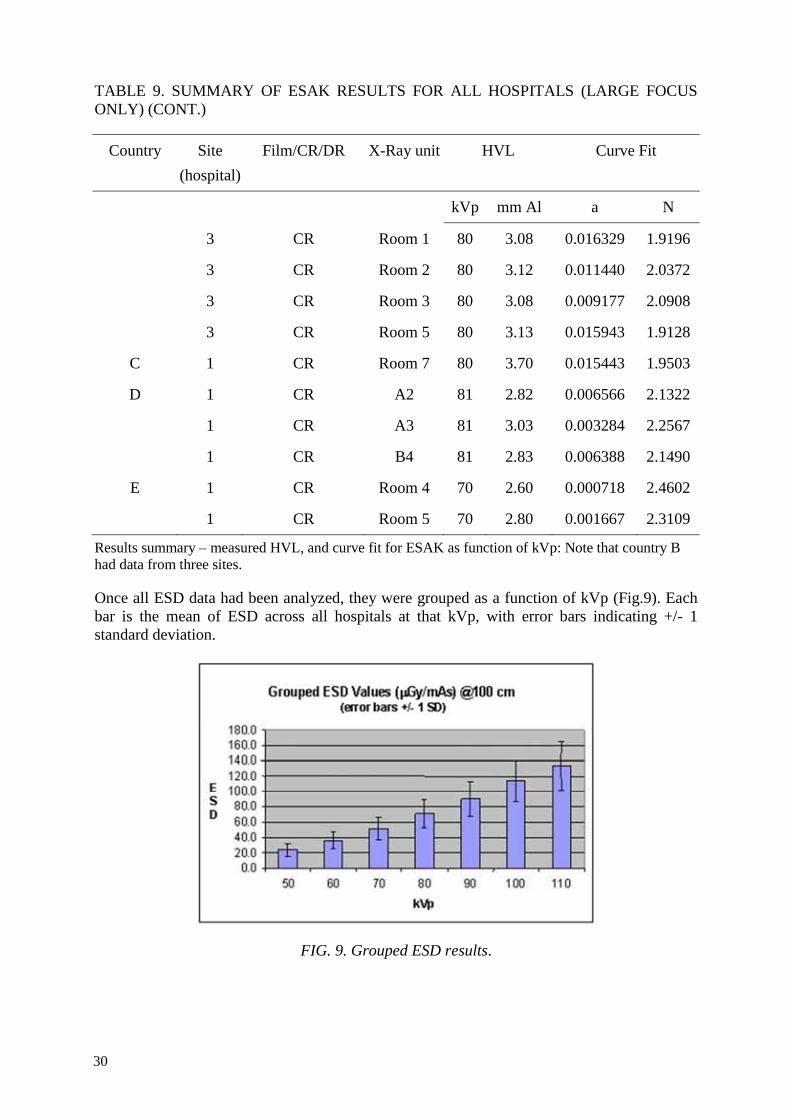
TABLE 9. SUMMARY OF ESAK RESULTS FOR ALL HOSPITALS (LARGE FOCUS ONLY) (CONT.)
Country Site (hospital)
Film/CR/DR X-Ray unit HVL Curve Fit
kVp mm Al a N
3 CR Room 1 80 3.08 0.016329 1.9196
3 CR Room 2 80 3.12 0.011440 2.0372
3 CR Room 3 80 3.08 0.009177 2.0908
3 CR Room 5 80 3.13 0.015943 1.9128
C 1 CR Room 7 80 3.70 0.015443 1.9503
D 1 CR A2 81 2.82 0.006566 2.1322
1 CR A3 81 3.03 0.003284 2.2567
1 CR B4 81 2.83 0.006388 2.1490
E 1 CR Room 4 70 2.60 0.000718 2.4602
1 CR Room 5 70 2.80 0.001667 2.3109
Results summary – measured HVL, and curve fit for ESAK as function of kVp: Note that country B had data from three sites.
Once all ESD data had been analyzed, they were grouped as a function of kVp (Fig.9). Each bar is the mean of ESD across all hospitals at that kVp, with error bars indicating +/- 1 standard deviation.
FIG. 9. Grouped ESD results.
30
4.3. PATIENT DOSE DATA
The submitted actual exposure data supplied was not as extensive as hoped. 11 X-ray units from 3 hospitals did not supply patient dose data (Table 4). This appeared to be due to the constraints placed on patient weight. The two predominantly European-population countries may differ in mean height and weight, and the population no longer seems to conform to the ICRP “standard man” [8]. There is no ICRP “standard man” for Asian populations; however, the IAEA has conducted a study published as TECDOC-1005 [63]. When the small amount of patient doses data provided was later questioned, it appeared that many patients fell outside (mainly above) the required range.
The IAEA study (conducted between 1988 and 1993) showed similar mean values to those chosen for this study (see Table 10).
TABLE 10. SELECTED ASIAN PATIENT WEIGHT RANGE AND IAEA ASIAN WEIGHT DATA
This study IAEA TECDOC-1005 1
Male 60 +/- 10 kg 56.5 +/- 4.1 kg, range 51.5 - 63.9, range mid-point 58
Female 50 +/- 10 kg 48.8 +/- 3.4 kg, range 44.2 - 54.5, range mid-point 50 1 population-weighted mean, ages 20-50 years.
In the largest European submitted dataset (Vienna), the mean weights were 73.0 +/- 7.4 kg (male) and 65.3 +/- 7.5 kg (female). In the largest Asian dataset (Bangkok), the mean weights were 59.8 +/- 6.4 kg (male) and 52.0 +/- 5.3 kg (female).
In all, 5 hospitals (three with European patient populations, and two with Asian) provided data. One was in an orthopaedic unit, and did not perform chest examinations. Lateral chest examinations were also not commonly performed.
For each patient exposure, the previously calculated normalized ESD values were applied to the supplied data and entrance skin dose calculated. Table 11 shows the mean ESDs (mGy) together with the standard deviation (SD) as a function of X ray projection and participating hospital.
31

TAB
LE 1
1. S
UM
MA
RY
OF
PATI
ENT
ENTR
AN
CE
SKIN
DO
SE R
ESU
LTS
(mG
y)
Cou
ntry
H
ospi
tal/
room
C
hest
PA
C
hest
Lat
.
Abd
omen
PA
Lu
mba
r Spi
ne
AP
Lum
bar S
pine
La
t. Pe
lvis
AP
Mea
n SD
M
ean
SD
Mea
n SD
M
ean
SD
Mea
n SD
M
ean
SD
A
A1/
1
3.
44(1
7)
1.56
11
.67(
17)
2.12
3.
41(1
2)
0.43
A
A1/
2
4.
58(2
0)
2.26
14
.37(
20)
2.26
3.
89(1
7)
0.83
B
B1/
1 0.
36
0.27
2.
05
1.82
5.66
3.
89
B
B1/
8 0.
19
0.04
0.
66
0.13
B
B3/
1 0.
12
0.04
0.
43
0.27
3.30
1.
73
D
D1/
2 0.
12(1
7)
0.03
3.
31(1
0)
0.81
2.
30(1
3)
1.49
4.
95(5
) 0.
95
2.60
(6)
0.72
D
D1/
3 0.
12(1
4)
0.04
3.
54(3
) 0.
33
2.28
(1)
1.02
4.
23(1
) 0.
88
1.77
(1)
0.61
D
D1/
4 0.
14(1
) 0.
04
3.22
(3)
0.42
1.
61(5
) 1.
18
E E1
/4
0.17
(99)
0.
05
0.42
0.
242.
79(3
0)
0.72
2.
79(8
3)
0.62
7.
22(8
0)
0.81
2.
21(7
) 0.
53
E E1
/5
0.11
(161
) 0.
05
0.4(
6)
0.13
3.26
(48)
0.
66
3.28
(86)
0.
57
8.06
(89)
1.
80
1.49
(10)
0.
34
Mea
n of
mea
ns
0.
17
0.
79
3.
58
2.
90
8.
42
2.
56
Std
Dev
0.
08
0.
71
0.
94
0.
97
3.
93
0.
94
Med
ian
0.12
0.75
2.26
1.94
6.17
1.75
3rd
Qua
rtile
0.
18
0.
66
3.
43
3.
36
10
.77
3.
21
Num
ber o
f pat
ient
s are
giv
en in
bra
cket
s whe
re k
now
n.
32

The mean ESDs compare well to such published data as the IAEA Basic Safety Standard guidance levels [2], the European Union (EU) Diagnostic Reference Levels [12], the National Radiological Protection Board (NRPB) [64], and American Association of Physicists in Medicine (AAPM) [65] — see Table 12. It should be noted however that all guidance levels were determined using film/screen imaging, and are not specific for digital imaging [66]. Another factor that could explain the lower doses in this study is the mix of Asian and European populations, of different weights. As indicated above the mean weight of European participants was higher than Asian.
The results in Table 11 are however skewed, and the median values are a better indicator than the mean. There may be various reasons for this — for example in Country B, Hospital B1, Room 8 used an AEC whereas Room 1 did not (see also Fig. 12 for an example). The Hospital A1 has a mixture of CR and DR, and AEC is used, yet the doses are significantly higher than the group mean for one projection (lateral lumbar spine), and somewhat higher for lumbar spine PA and abdomen AP. This may reflect local protocols. The Hospital E1 did not use AEC in either room, yet their doses were not high by comparison.
TABLE 12. COMPARISON OF ESD VALUES (mGy) FROM THIS STUDY WITH PUBLISHED REFERENCE/GUIDANCE LEVELS
Examination BSS EU NRPB AAPM This study (3rd quartile)
Pelvis AP 10 10 4 - 3.21
Lumbar spine AP
10 10 6 5 3.36
Lumbar spine lat.
30 30 14 - 10.77
Chest PA 0.4 0.3 0.2 0.25 0.18
Chest lat. 1.5 1.5 1 - 0.66
Figure 10 shows the variation in ESD for the same projection between participating sites, in this case PA chest and AP lumbar spine.
33

(a)
(b)
FIG. 10. Variation in ESD for chest PA and AP lumbar spine.
The variation in ESD for the same examination was a factor of 3 or more. While some variation is expected on the basis of different X ray equipment and digital imaging systems, this cannot explain the entire range. The remainder can really only be explained by variations in radiographic technique, and lack of an optimization philosophy in the imaging process.
0
1
2
3
4
5
Mea
n ES
D m
Gy
Hospital
ESD Lumbar Spine AP
0
0.1
0.2
0.3
0.4
Mea
n ES
D m
Gy
Hospital
ESD Chest PA
34
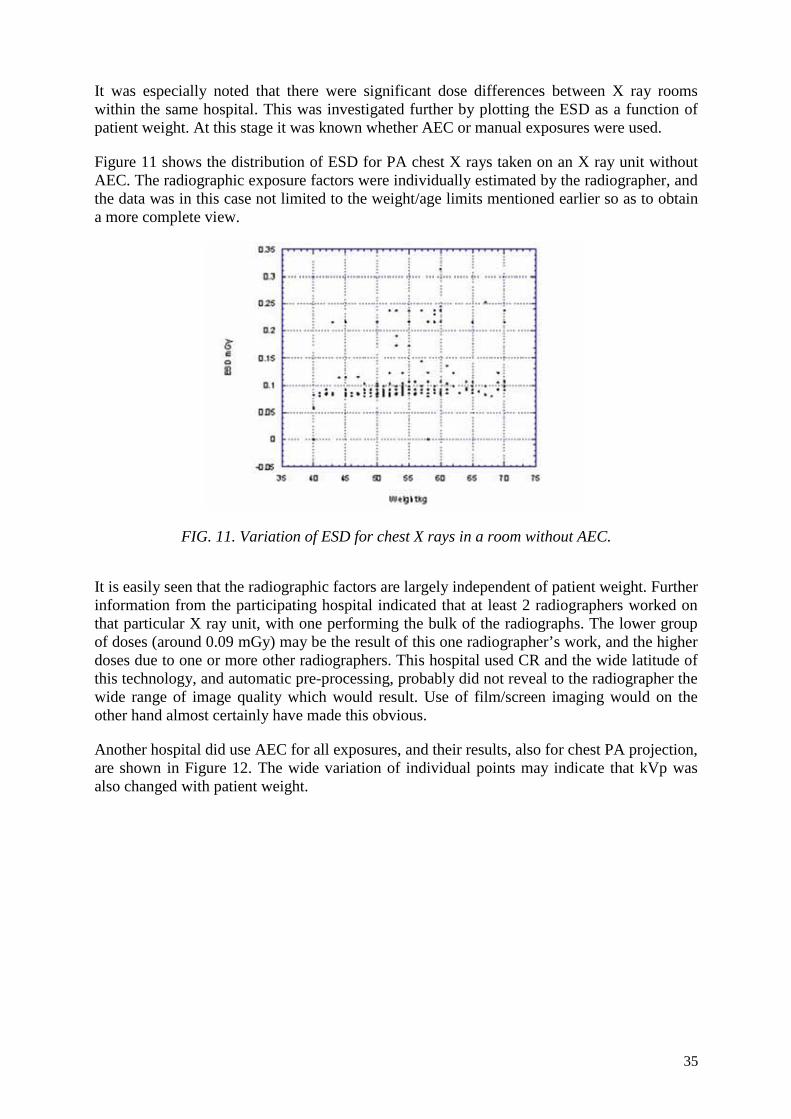
It was especially noted that there were significant dose differences between X ray rooms within the same hospital. This was investigated further by plotting the ESD as a function of patient weight. At this stage it was known whether AEC or manual exposures were used.
Figure 11 shows the distribution of ESD for PA chest X rays taken on an X ray unit without AEC. The radiographic exposure factors were individually estimated by the radiographer, and the data was in this case not limited to the weight/age limits mentioned earlier so as to obtain a more complete view.
FIG. 11. Variation of ESD for chest X rays in a room without AEC.
It is easily seen that the radiographic factors are largely independent of patient weight. Further information from the participating hospital indicated that at least 2 radiographers worked on that particular X ray unit, with one performing the bulk of the radiographs. The lower group of doses (around 0.09 mGy) may be the result of this one radiographer’s work, and the higher doses due to one or more other radiographers. This hospital used CR and the wide latitude of this technology, and automatic pre-processing, probably did not reveal to the radiographer the wide range of image quality which would result. Use of film/screen imaging would on the other hand almost certainly have made this obvious.
Another hospital did use AEC for all exposures, and their results, also for chest PA projection, are shown in Figure 12. The wide variation of individual points may indicate that kVp was also changed with patient weight.
35
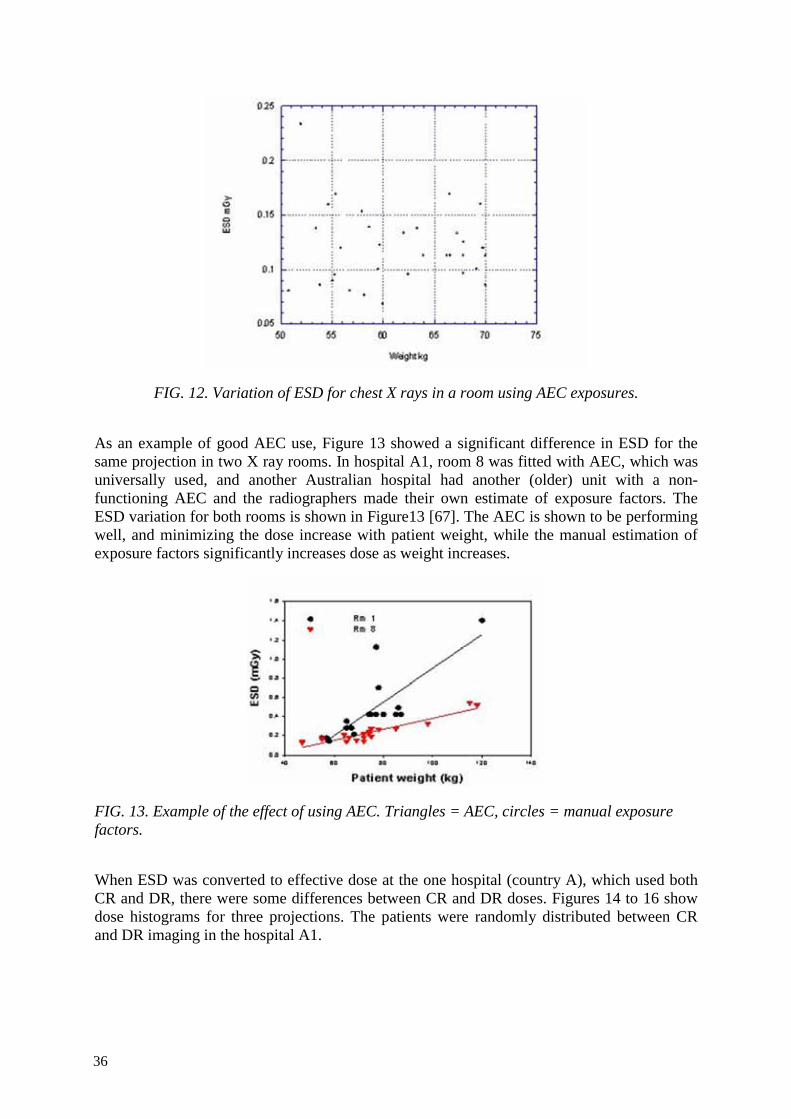
FIG. 12. Variation of ESD for chest X rays in a room using AEC exposures.
As an example of good AEC use, Figure 13 showed a significant difference in ESD for the same projection in two X ray rooms. In hospital A1, room 8 was fitted with AEC, which was universally used, and another Australian hospital had another (older) unit with a non-functioning AEC and the radiographers made their own estimate of exposure factors. The ESD variation for both rooms is shown in Figure13 [67]. The AEC is shown to be performing well, and minimizing the dose increase with patient weight, while the manual estimation of exposure factors significantly increases dose as weight increases.
FIG. 13. Example of the effect of using AEC. Triangles = AEC, circles = manual exposure factors.
When ESD was converted to effective dose at the one hospital (country A), which used both CR and DR, there were some differences between CR and DR doses. Figures 14 to 16 show dose histograms for three projections. The patients were randomly distributed between CR and DR imaging in the hospital A1.
36

FIG. 14. Effective dose distribution for AP pelvis – CR and DR.
FIG. 15. Effective dose distribution for AP lumbar spine – CR and DR.
37

FIG. 16. Effective dose distribution for lateral lumbar spine – CR and DR.
The mean effective doses were: pelvis, 0.47 mSv (0.44 mSv for DR, 0.51 mSv for CR), AP lumbar spine, 0.33 mSv (0.29 mSv for DR, 0.38 mSv for CR); lateral lumbar spine, 0.22 mSv (0.21 mSv for DR, 0.24 mSv for CR).
Observation of radiography in one hospital revealed a further problem – when radiographers in that hospital (and anecdotally, in other hospitals) move from film to digital imaging, they frequently omit to collimate the X ray field to the region of interest, preferring to collimate the resulting digital image, if at all. In the observed case (where the patients were of smaller stature), this resulted in chest radiographs including the abdomen and/or neck in the field. This has obvious and potentially serious dosimetric implications.
A further and well-known observation is the fact that some CR software will allow the user to discard an image without any record being kept. This means that retake rates are not known, and patients may receive an unrecorded number of exposures.
4.4. SUMMARY OF DOSIMETRY
In summary, the study of ESAK and actual patient dose showed that:
• there was the expected variation between hospitals;
• that use of AEC significantly reduced patient dose for most examinations. It was more difficult to see a trend for chest examinations since the radiographic factors do not vary with weight without AEC;
• that radiographer work practices may change for some reason when changing to digital imaging, for example lack of collimation;
• the lack of a record of discarded images in some CR systems can increase patient dose without this being recognized.
38

4.5. TLD RESULTS
Five hospitals provided TLD data. The results were normalized in the same way as the ESD calculations above, i.e. microgray/mAs at 100 cm. The results are summarized in Table 13.
The range of error was –9.4% to 9.5%, with a mean of –0.8% and standard deviation of 6.1%. This was considered to be an acceptable variation between calculated and measured ESD, and validated the ESD calculations.
TABLE 13. SUMMARY OF TLD VS CALCULATED ESD RESULTS
μGy/mAs@100cm
Country Hospital/Room kVp TLD Calc. Difference (%)
A A1/2 70 71.5 70.6 -1.3
A A1/2 90 116.7 117.1 0.3
A A1/1 70 70.0 71.1 1.5
A A1/1 90 111.4 120.6 7.6
B B1/1 70 67.0 74.0 9.5
B B1/1 90 118.2 129.7 8.9
B B1/8 70 55.8 54.6 -2.2
B B1/8 90 95.3 94.9 -0.4
C C1/7 70 64.6 61.1 -5.7
C C1/7 90 103.2 100.5 -2.7
D D1/2 70 61.4 56.6 -8.5
D D1/2 90 105.6 96.5 -9.4
D D1/3 70 53.6 49.7 -7.8
D D1/3 90 93.1 86.4 -7.8
E E1/4 70 26.7 25.4 -5.1
E E1/4 90 45.6 45.9 0.7
E E1/5 70 31.1 31.3 0.6
E E1/5 90 51.0 55.4 7.9
39

4.6. PHANTOM RESULTS
CNR, spatial resolution and low contrast detectability were tested using a CR and a DR system at the Department of Diagnostic Radiology, Vienna General Hospital, Vienna, Austria (CR: Agfa ADC compact, sensitivity class 400, plate size 35x43 cm; DR: Siemens Multix FD). Data were collected from images made with a standard anti-scatter grid at standard dose levels (using the protocol for lumbar spine), and 2, 4, ½ and ¼ times this value, and using AEC. Low contrast details were evaluated by 4 observers and minimum contrast necessary calculated. Spatial resolution was determined by one observer only, CNR was measured as described in Appendix III.
Figures 17 and 18 show the minimum contrasts necessary to detect 5 mm and 10 mm details respectively in the low contrast test pattern. Error bars indicate +/- 1 standard deviation of the observations (two images times 4 observers per dose level). The minimum object contrast necessary to confidently detect a detail of 5 mm size is lower for CR than for DR, whereas no significant difference is seen with the 10 mm sized details for image processing parameters and beam qualities used.
FIG. 17. Minimum contrast needed to distinguish 5 mm objects.
FIG. 18. Minimum contrast needed to distinguish 10 mm objects.
Figure 19 shows spatial resolution (test pattern object contrast: 50 µm lead). Due to reduced noise with higher doses the visibility of the pattern for the human observer, and thus, spatial resolution as determined with this test, increases. Spatial resolution of the DR system is superior to CR, although pixel sizes are approximately equivalent.
40

FIG.19. Spatial resolution as a function of ESD.
Contrast to noise ratios are approximately the same at dose levels typically used, except that at very high dose levels where the CR system seems to exhibit a higher CNR (Fig. 20).
FIG. 20. CNR as a function of ESD.
A common feature of the results of Figures 17 to 20 is the minimal improvement, or even absence of improvement beyond a certain ESD value. For both 5 and 10 mm low contrast details, this value is of the order of 3 mGy. Similarly spatial resolution shows no improvement beyond the same value. CNR improves very slowly beyond about 5 mGy.
The obvious conclusion is that, as has been stated earlier, increased dose does not automatically result in improved image quality or diagnostic value. A key element of optimization is the determination of not only a dose point beyond which no significant image improvement is possible, but also how much lower dose can be reduced while still obtaining a diagnostic image.
The phantom Vienna I digital, designed for use with digital projection radiographic devices, seems to be useful to evaluate imaging characteristics. It was tested using a CR and a DR system.
In this phantom, the patient equivalent prefilter represents a compromise. A close-to-focus design was necessary since this phantom was designed to be used in a multicenter study. Easy transportability was therefore a prerequisite prohibiting the use of full-size Teflon sheets in a close-to-detector geometry. To enable the formation of a proper scatter field at the detector the phantom plate was constructed from a 3 cm thick PMMA sheet.
41

Contrast levels listed in Table 14 were calculated using tabulated attenuation coefficients for 70 kV spectra [68-70]. The values represent contrast against the background without scatter for detail sizes with a modulation transfer function value of 1, i.e. 100 per cent.
TABLE 14. NUMBER OF LOW CONTRAST DETAILS IN VIENNA I PHANTOM
Contrast (%) No. of 10 mm diameter objects
No. of 5 mm diameter objects
8 3 5.66 1 3 4 2 3 2.83 2 3 2 2 3 1.41 2 3 1 2 3 0.71 2 3
In the CR system examined at high dose levels, the minimum object contrast needed for detection of the smaller (5 mm) details is higher than for the DR system whereas no difference was observed for the 10 mm details. This corresponds well to the measurement of spatial resolution showing a significantly lower resolution for the CR system, although Nyquist frequencies (pixel sizes) of the two systems are almost identical. This fact can be attributed to scatter in the screen readout and the finite dimension of the laser beam. Despite the smaller spatial resolution a lower level of noise in the CR system as compared with DR could not be observed in the dose range clinically used. At high doses, signal to noise ratio seems slightly better in the CR system. A closer examination of this effect will necessitate more data (images taken at various dose levels without grid, for example) and a more in-depth analysis.
The limiting factor in obtaining quantitative data is the human observer necessary to analyze the low contrast details. In some cases (especially for the larger details) interobserver agreement was rather poor. In one image, e.g., one observer detected 0.7% contrast, whereas another had a threshold of 2.8%. A computerized analysis with selectable confidence levels would be preferable. Then a standardized receiver operating characteristic (ROC) analysis would produce comparable results for different systems. Also, the choice of detail diameters should be increased (by, e.g., adding a set of 2.5 and 7.5 mm details, respectively, to get a better idea of the modulation transfer function (MTF)). Lastly, contrast should be measured to confirm the calculated values. Ideally, soft and hard tissue contrast should be available. In this phantom the contrast is defined by boreholes in PMMA, and thus can be regarded as soft tissue contrast (varying mass thickness of PMMA as soft tissue equivalent).
The phantom developed seems to be appropriate to measure minimum contrast, CNR and spatial resolution for digital projection radiographic devices such as CR and DR. Image quality can be compared between these. Further improvements should include computerized ROC analysis of low contrast details as well as a wider choice of low contrast detail diameters.
42

4.7. RETAKE ANALYSIS
At the hospital E1, the retake analysis (CR only) showed that the main cause was patient positioning (Fig. 21). The total number of examinations included was 934, with 84 retakes (9%). At this hospital, positioning and collimation were grouped together. The number of retakes due to radiographic techniques was a little surprising, as it would be expected that the latitude of CR would make this rate very low. Technique errors included incorrect inspiration and detector centering. Exposure factors included wrong kVp or mAs (manual exposures).
FIG. 21. Retake analysis – hospital in country E.
At the hospital D1 (also CR only), a much larger number of examinations (4523) was collected, however the percentage of retakes was smaller (1.5%), a total of 68, with 7 images having two causes for the retake. This retake rate is remarkably low – it is expected that retake rates would be of the order of 5-10%. The distribution of causes and rate of retakes at the hospital D1 is shown in Fig. 22. It is interesting to note that the analysis could only be performed after the existing practice by some radiographers of deleting images before retake was changed.
43
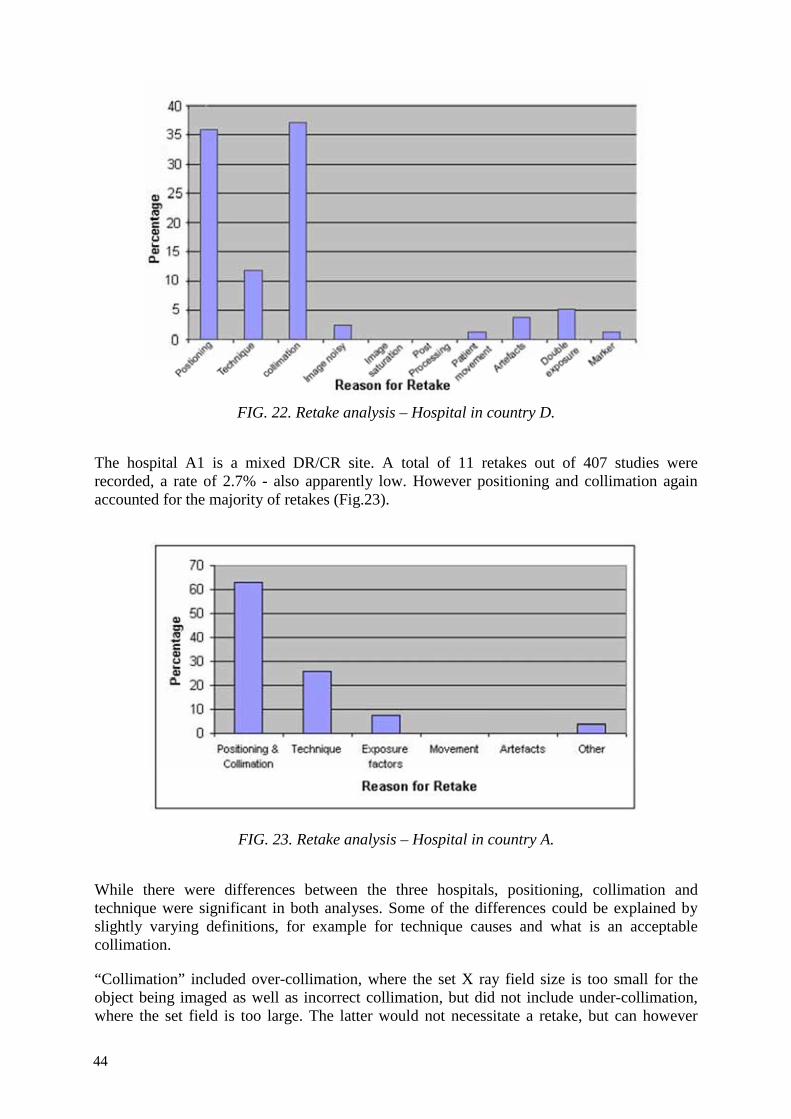
FIG. 22. Retake analysis – Hospital in country D.
The hospital A1 is a mixed DR/CR site. A total of 11 retakes out of 407 studies were recorded, a rate of 2.7% - also apparently low. However positioning and collimation again accounted for the majority of retakes (Fig.23).
FIG. 23. Retake analysis – Hospital in country A.
While there were differences between the three hospitals, positioning, collimation and technique were significant in both analyses. Some of the differences could be explained by slightly varying definitions, for example for technique causes and what is an acceptable collimation.
“Collimation” included over-collimation, where the set X ray field size is too small for the object being imaged as well as incorrect collimation, but did not include under-collimation, where the set field is too large. The latter would not necessitate a retake, but can however
44

have a significant impact on patient dose through irradiation of organs not required for the examination, or simply by creation of a larger irradiated volume which increases scatter dose to organs outside the X ray field.
The seemingly very low retake rate at two hospitals is not so unusual in the light of some publications. As early as 1995, Siegel [71] reported a reduction from as high as 8% to as low as 0.3% after transition from film/screen to CR. Polunin [72] reported a less dramatic change, from 8.8% to 4.6%. Much of course depends on the definition of an image requiring a retake.
The hospital with the lowest rate has had for more than 10 years a very thorough QC program run by a dedicated senior radiographer and a physicist. The hospital has also been ISO-accredited for 4 years and retake rates are a key audit indicator. Thus their low rate is an achievable goal given resources and commitment to QC.
4.8. SOFT/HARD COPY IMAGE QUALITY
The process of shifting over from hard copy to soft may be gradual. Although the recommendation is to shift to soft copy soonest; gaining experience is necessary. The work presented herewith describes the experience that may be helpful. One centre (hospital D1) was nominated to collate and analyze the soft/hard copy data from CR images. Three participating countries (C. D and E) provided data. Three radiologists evaluated 50 images each of three examinations – chest PA, lumbar spine AP and pelvis AP – according to EU image evaluation criteria [30]. Analysis was based on total scores for positioning criteria and image quality and scores for image noise and overall image quality, for each image on both display types. Intra-observer analysis was performed using box plot and Spearman rank correlation. The soft copy display details are shown in Table 15. The luminance of the monitor used in Malaysia was measured, and is shown in Table 16. Film viewing box data is shown in Table 17, and hard copy printer data in Table 18.
TABLE 15. SOFT COPY MONITOR DETAILS
Property India Malaysia Thailand Monitor type CRT LCD LCD Manufacturer and model
Barco Barco MFGD 3220D Totoku ME201L
Useful viewing size 51 cm 42.4 cm x 31.8 cm 51 cm Displayed resolution 1200 x 1600 @ 75Hz
(portrait) 1536 x 2048 @ 59 Hz (portrait) 2048 x 1536 @ 60 Hz (landscape)
1200 x 1600 @ 60Hz
Depth (bits) 8 10 10 Pitch size Unknown 0.207 x 0.207 mm Unknown Graphics card Matrox Millennium
G200 BarcoMed 3MP2FH Matrox
Millennium G200
Luminance range 246 – 296 cd.m-2 479 – 483 cd.m-2 ~ 100 cd.m-2
45
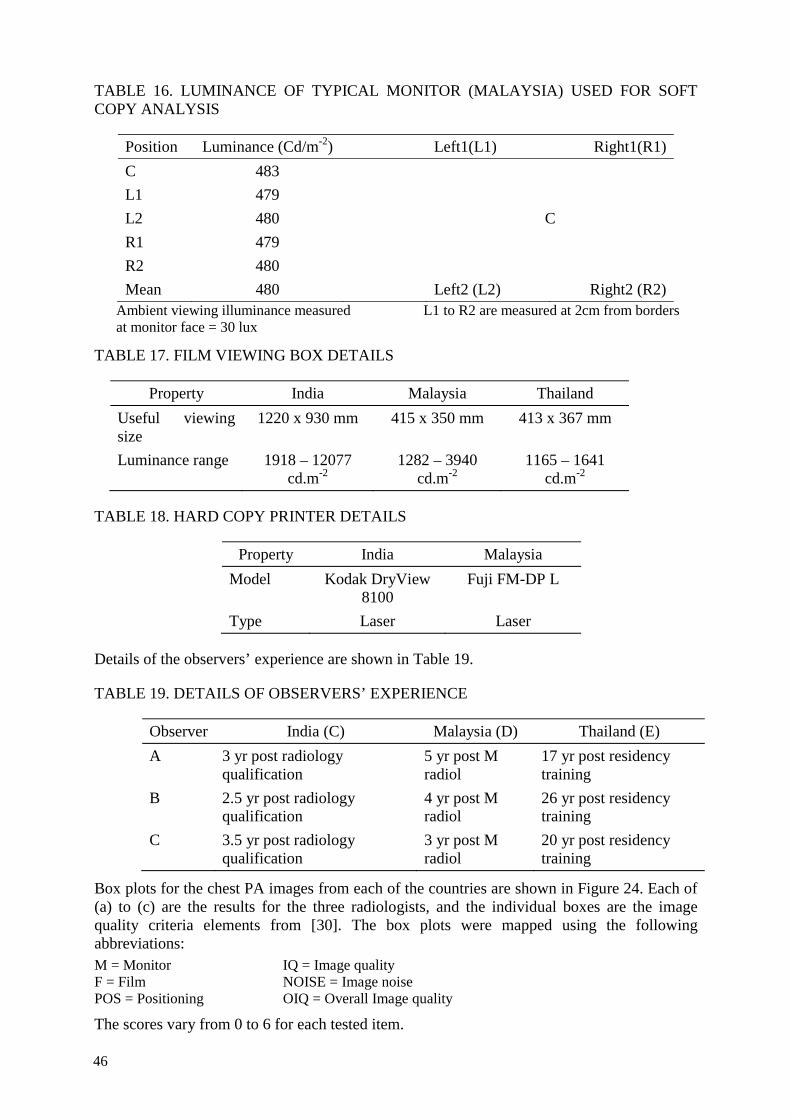
TABLE 16. LUMINANCE OF TYPICAL MONITOR (MALAYSIA) USED FOR SOFT COPY ANALYSIS
Position Luminance (Cd/m-2) Left1(L1) Right1(R1) C 483 L1 479 L2 480 C R1 479 R2 480 Mean 480 Left2 (L2) Right2 (R2)
Ambient viewing illuminance measured L1 to R2 are measured at 2cm from borders at monitor face = 30 lux
TABLE 17. FILM VIEWING BOX DETAILS
Property India Malaysia Thailand Useful viewing size
1220 x 930 mm 415 x 350 mm 413 x 367 mm
Luminance range 1918 – 12077 cd.m-2
1282 – 3940 cd.m-2
1165 – 1641 cd.m-2
TABLE 18. HARD COPY PRINTER DETAILS
Property India Malaysia Model Kodak DryView
8100 Fuji FM-DP L
Type Laser Laser
Details of the observers’ experience are shown in Table 19.
TABLE 19. DETAILS OF OBSERVERS’ EXPERIENCE
Observer India (C) Malaysia (D) Thailand (E) A 3 yr post radiology
qualification 5 yr post M radiol
17 yr post residency training
B 2.5 yr post radiology qualification
4 yr post M radiol
26 yr post residency training
C 3.5 yr post radiology qualification
3 yr post M radiol
20 yr post residency training
Box plots for the chest PA images from each of the countries are shown in Figure 24. Each of (a) to (c) are the results for the three radiologists, and the individual boxes are the image quality criteria elements from [30]. The box plots were mapped using the following abbreviations: M = Monitor IQ = Image quality F = Film NOISE = Image noise POS = Positioning OIQ = Overall Image quality
The scores vary from 0 to 6 for each tested item.
46

(a) Malaysia (country D)
47

(b) India (country C)
48
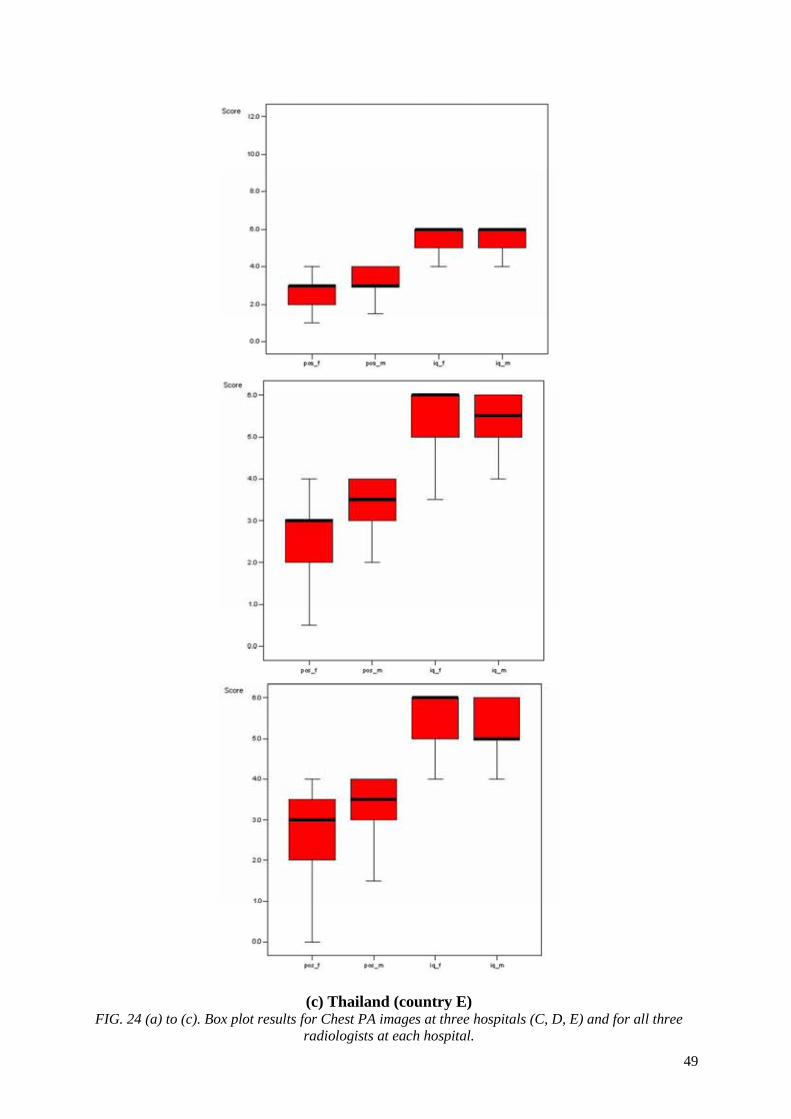
(c) Thailand (country E) FIG. 24 (a) to (c). Box plot results for Chest PA images at three hospitals (C, D, E) and for all three
radiologists at each hospital. 49
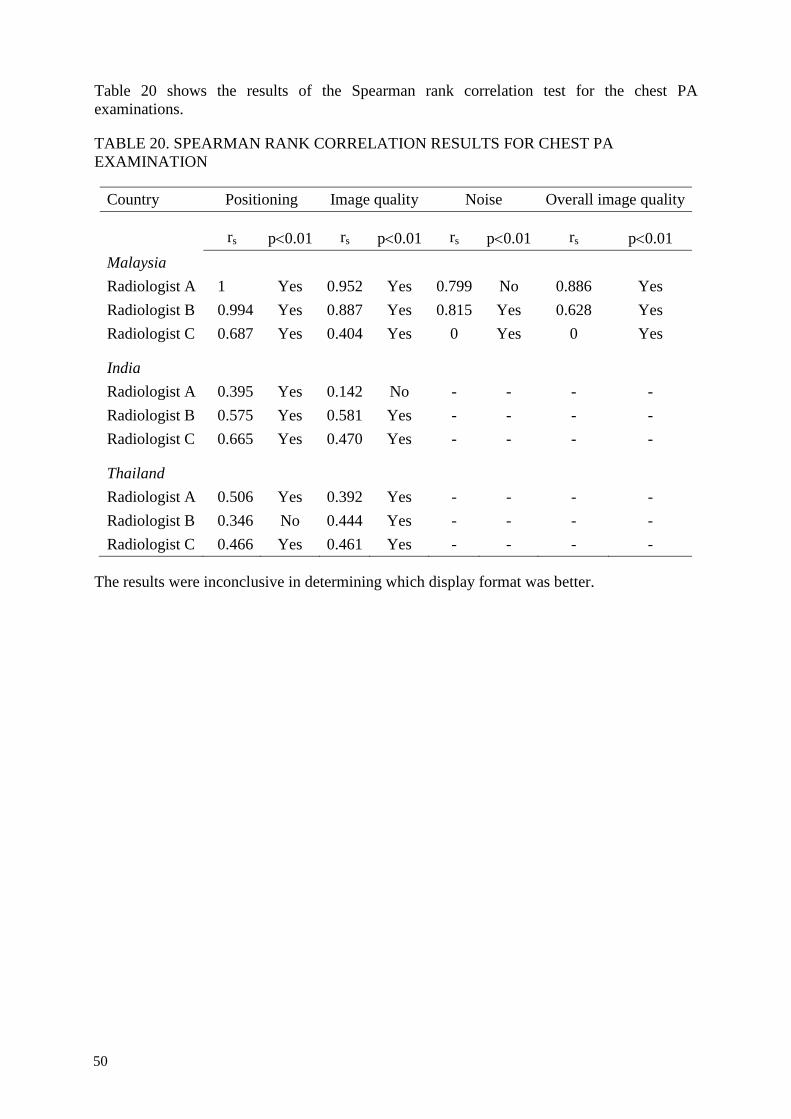
Table 20 shows the results of the Spearman rank correlation test for the chest PA examinations.
TABLE 20. SPEARMAN RANK CORRELATION RESULTS FOR CHEST PA EXAMINATION
Country Positioning Image quality Noise Overall image quality
rs p<0.01 rs p<0.01 rs p<0.01 rs p<0.01 Malaysia Radiologist A 1 Yes 0.952 Yes 0.799 No 0.886 Yes Radiologist B 0.994 Yes 0.887 Yes 0.815 Yes 0.628 Yes Radiologist C 0.687 Yes 0.404 Yes 0 Yes 0 Yes
India Radiologist A 0.395 Yes 0.142 No - - - - Radiologist B 0.575 Yes 0.581 Yes - - - - Radiologist C 0.665 Yes 0.470 Yes - - - -
Thailand Radiologist A 0.506 Yes 0.392 Yes - - - - Radiologist B 0.346 No 0.444 Yes - - - - Radiologist C 0.466 Yes 0.461 Yes - - - -
The results were inconclusive in determining which display format was better.
50

5. CONCLUSIONS
5.1. DOSIMETRY
The calculations of ESD from ESAK data were validated, within +/- 10%, which is acceptable. Use of this approach allowed comparison of actual patient ESDs for a range of projections, at a number of hospitals. This showed some important results:
• the range of ESD for a particular examination was wider than explicable through equipment variations but as wide as expected from studies in the literature
• radiographic technique must play a large factor
• use of AEC on the X ray unit wherever this is available has a significant effect on patient dose – estimating exposure factors can result in high doses, while over- or under-exposures will frequently not be obvious after digital image acquisition.
While none of the above is a particularly new finding, this study yet again emphasizes the need for a considered approach to radiographic imaging. The transition from film to digital offers a special and important opportunity to optimize dose.
5.2. PHANTOM STUDIES
The phantom presented seems to be appropriate to measure minimum contrast, CNR and spatial resolution for digital projective radiographic devices such as CR and DR. Image quality can be compared between these. Further improvements should include computerized ROC analysis of low contrast details as well as a wider choice of low contrast detail diameters.
A study of the CNR plots (Figs. 16, 17) indicates that, beyond a certain dose level, there is little additional increase in image quality with increasing patient dose (ESD). The well-known common practice of simply using film/screen radiographic parameters after transitioning to digital imaging will in many cases result in a higher than necessary dose. One way of optimizing dose would be to measure CNR as a function of dose, as above, and, in conjunction with image quality assessment, determine an appropriate dose, i.e. exposure parameters, for each common X ray examination.
5.3. RETAKE RATE
There was a significant difference in retake rates between the three hospitals where studies were performed (9%, 2.7% and 1.5%). In all three cases however the primary cause was a combination of collimation and patient positioning. While low rates after transition to digital imaging have been reported in the literature, very low rates seem unusual. The local definition of what constitutes a retake can have an effect on the overall rate, as can the training and familiarization of staff. It is entirely possible, but not proven, that good training can itself significantly reduce retake rates by teaching staff how to obtain diagnostic quality by appropriate post-processing of images.
Also possible, but not proven, is that low retake rates can in part be due to not including images for which records were not kept..
51
5.4. TRAINING
The importance of thorough training for all staff – radiographers and radiologists – at the time of transition cannot be overemphasized. Not only does this acquaint staff with the new technologies, it also allows re-examination of working procedures. Timely training in particular should be designed to prevent old habits from being inappropriately carried forward, and prevent bad habits from developing. A very good example of a bad habit is deletion of digital images without record and sometimes without the need, or post-cropping images.
Training should be conducted by people who are experienced in the new technology, and have the firm support of the departmental management.
5.5. FUTURE WORK
Both the literature and the outcome of this study show that there is great scope and need for more detailed work in the application of digital techniques to clinical use, as opposed to the technology itself. Some particular areas which could be examined are:
• staff training needs and effects of re-training seminars
• the selection of radiographic parameters for adequate imaging with minimal dose – optimization of image quality and dose
• the design and use of digital displays for image interpretation, including how images are perceived and presented to the radiologist
• a deeper examination of retake analysis results
• the design, use and effects of post-processing protocols.
The complexity of the change from analogue to digital imaging must not be overestimated, but there is a risk that with the pressure to maintain service, users will just quickly switch without seizing the rare opportunity to re-examine how their imaging is performed and reported and in the process reduce patient dose while at least maintaining if not improving diagnostic outcome.
52

6. ADVICE FOR GOOD PRACTICE
A number of issues are apparent from the literature, which should be considered at the time film is replaced by digital imaging, whether CR or DR, as an optimization measure. Some advices for good practice are:
Before purchasing digital systems:
• ensure that the system being purchased is appropriate for the needs of the radiographic centre — this will include the display systems, the reading environment, the digital image quality (especially pixel size), the match of the X ray equipment to the digital system;
• record typical radiographic parameters for common examinations, and collect patient dose data (ESD or DAP values), as a baseline:
• check that digital noise reduction processing is available for the system;
• it is strongly recommended that all digital imaging systems include a process for automatic recording of retakes;
• it is strongly recommended that detector exposure indices are standardized and are included in the DICOM header of the images to be kept in the patient’s file.
After purchase:
• arrange for training of staff, not only in proper operation of the equipment, but also in dose optimization – this is the critical first step and must be performed before the equipment is put to clinical use;
• in the process of retraining radiographers in the new technology, include an awareness of the potential for dose reduction and the wide dynamic range of digital systems, i.e. their ability to provide diagnostic images over a wide range of exposures which can lead to unnecessarily high doses;
• determine, if possible using a phantom, how much patient dose can be reduced before image quality, and thus diagnostic benefit, is affected;
• critically examine the manufacturer’s supplied and pre-set acquisition, analysis and display protocols — remember that “best image quality” may be the goal without consideration of patient dose but that required diagnostic information can be maintained with a lower dose and even noisier images;
• review quality control protocols to suit the new imaging technology, preferably using accepted international or national standards;
• ensure that AEC devices, if fitted, are adjusted for the digital system used (this will apply to CR), and that they are used routinely (as opposed to manually estimating radiographic exposure); be aware that the energy responses and sensitivities of digital radiography systems differ from those of screen-film combinations (and differ from each other) and that this affects the AEC calibration, requiring for example different tube potentials or different filtrations to be used for specific types of examinations and patient sizes;
53
• be aware that added filtration can decrease dose to patient without compromising image quality, provided tube output is high enough;
• learn how to identify artefacts correctly for CR (cracks on PSP plates, radiation transmitted through defects in back of cassette, double-loaded cassettes, image processing artefacts, artefacts due to inappropriate collimation, dirt in the CR reader, ghosting, etc...) and DR (ghosting, lag, uncorrected images for non-uniformity, metal in the X ray field affecting the outcome of the image processing;
• require recording of retakes, including the reasons, which is especially important when using digital imaging software which does not automatically record retake information.
On an ongoing basis:
• ensure that radiographers use correct collimation – only that part of the patient’s body necessary for the examination should be irradiated. That should avoid loss of contrast and improper exposure indicator values;
• ensure that radiographers check the detector dose indices for consistency and relevance;
• ensure that an appropriate technical QA program is in place, which includes not only the X ray unit, but also display devices, processing and image storage plates (for CR);
• perform a regular retake analysis. Although it was initially considered useless for digital radiography because of the tolerance of digital detectors to faulty exposures, reasons for repeated examinations remain: among them we can list artefacts, mispositioning, over-collimation, patient motion, inadequate inspiration, multiple exposure, over or under-exposure (incorrect choice of radiographic parameters) resulting in high or low DDIs, incorrect alignment of the X ray bean and the grid, wrong marker, missing marker, wrong examination, wrong patient, lost image, etc... Some of these errors can be recovered by adequate post-processing, others require a repeat examination;
• document errors;
• measure typical patient ESD values or record typical patient DAP values, and compare to published and local reference levels;
• Periodically review, discuss the results and make adjustments as needed.
54

REFERENCES
[1] EUROPEAN ATOMIC ENERGY COMMUNITY, FOOD AND AGRICULTURE ORGANIZATION OF THE UNITED NATIONS, INTERNATIONAL ATOMIC ENERGY AGENCY, INTERNATIONAL LABOUR ORGANIZATION, INTERNATIONAL MARITIME ORGANIZATION, OECD NUCLEAR ENERGY AGENCY, PAN AMERICAN HEALTH ORGANIZATION, UNITED NATIONS ENVIRONMENT PROGRAMME, WORLD HEALTH ORGANIZATION, Fundamental Safety Principles; Safety Fundamentals, IAEA Safety Standards Series No. SF-1, IAEA, Vienna (2006).
[2] FOOD AND AGRICULTURE ORGANIZATION OF THE UNITED NATIONS, INTERNATIONAL ATOMIC ENERGY AGENCY, INTERNATIONAL LABOUR ORGANISATION, OECD NUCLEAR ENERGY AGENCY, PAN AMERICAN HEALTH ORGANIZATION, WORLD HEALTH ORGANIZATION, International Basic Safety Standards for Protection against Ionizing Radiation and for the Safety of Radiation Sources, Safety Series No. 115, IAEA, Vienna (1996).
[3] INTERNATIONAL ATOMIC ENERGY AGENCY, INTERNATIONAL LABOUR OFFICE, INTERNATIONAL ORGANIZATION FOR MEDICAL PHYSICS, INTERNATIONAL SOCIETY OF RADIOLOGY, PAN AMERICAN HEALTH ORGANIZATION, WORLD HEALTH ORGANIZATION, Applying Radiation Safety Standards in Diagnostic Radiology and Interventional Procedures Using X Rays, IAEA Safety Report Series No. 39, IAEA, Vienna (2006).
[4] INTERNATIONAL ATOMIC ENERGY AGENCY, Radiological Protection for Medical Exposure to Ionizing Radiation, IAEA Safety Standards Series No. RS-G-1.5, IAEA, Vienna (2002).
[5] NG, K-H., REHANI, M.M., X ray imaging goes digital, BMJ 333 (2006) 765-766.
[6] PISANO, E.D., et al., Diagnostic performance of digital versus film mammography for breast-cancer screening, NEJM 353(17) (2005) 1773-1783.
[7] COMPAGNONE, G., et al., Patient dose in digital projection radiography. Radiation Protection Dosimetry, (2008) 1-3.
[8] DOYLE, P., Assessment and Optimisation of Digital Radiography Systems for Clinical Use, PhD thesis, Department of Clinical Physics, Faculty of Medicine, University of Glasgow, (2008).
[9] AMERICAN ASSOCIATION of PHYSICISTS in MEDICINE, An Exposure Indicator for Digital Radiography, report 116 (2009) College Park, MD.
[10] INTERNATIONAL ATOMIC ENERGY AGENCY, Dosimetry in Diagnostic Radiology: An International Code of Practice, Technical Report Series 457, Vienna (2007).
[11] INTERNATIONAL COMMISSION ON RADIATION PROTECTION, Reference man: anatomical, physiological and metabolic characteristics, ICRP Publication 23, Elsevier, Amsterdam (1975).
55

[12] UNITED NATIONS, “Medical Radiation Exposures”, Volume I, Appendix D, Sources and Effects of Ionizing Radiation, 2000 Report to the General Assembly, Scientific Committee on the Effects of Atomic Radiation (UNSCEAR), UN, New York (2000).
[13] WATSON, S.J., JONES, A.L., OATWAY, W.B., HUGHES, J.S., Ionising Radiation Exposure of the UK Population: 2005 Review, Report HPA-RPD-001, Health Protection Agency, UK (2005).
[14] INTERNATIONAL COMMISSION ON RADIATION PROTECTION, The 2007 Recommendations of the International Commission on Radiological Protection, ICRP Publication 103, Elsevier (2007).
[15] Guidance on diagnostic reference levels (DRLs) for medical exposures, Radiation Protection 109, European Commission (1999). Available at:http://ec.europa.eu/energy/nuclear/radioprotection/publication/109_en.htm
[16] INTERNATIONAL COMMISSION ON RADIOLOGICAL PROTECTION, Managing Patient Dose in Digital Radiology, ICRP Publication 93, Elsevier, Amsterdam (2004).
[17] MOTZ, J.W., DANOS, M., Image information content and patient exposure, Med Phys 5(1) (1978) 8-22.
[18] SONODA, M., TAKANO, M., MIYAHARA, J., KATO, H., Computed radiography optimizing scanning laser stimulated luminescence, Radiology 148 (1983) 833-838.
[19] KOGUTT, M.S., JONES, J.P., PERKINS, D.D., Low-dose digital computed radiography in paediatric chest imaging, AJR 151(4) (1988) 775-779.
[20] MARSHALL, N.W., FAULKNER, K., BUSCH, H.P., MARSH, D.M,, PFENNING, H., A comparison of radiation dose in examination of the abdomen using different imaging techniques, Br J Radiol 67(797) (1994) 478-484.
[21] HUDA, W., RILL, L.N., BRUNER, A.P.. Relative speeds of Kodak computed radiography phosphors and screen-film systems, Med Phys 24 (10) (1997) 1621-1628.
[22] HUFTON, A.P., DOYLE, S.M., CARTY, H.M., Digital radiography in paediatrics; radiation dose considerations and magnitude of possible dose reduction, Br J Radiol 71(842) (1998) 186-189.
[23] HEGGIE, J.C., WILKINSON, L.E., Radiation doses from common radiographic procedures; a ten year perspective, Australasian Phys Sci Med 23(4) (2000) 124-134.
[24] NICKOLOFF, E.L., et al., Pediatric high kV/filtered airway radiographs: comparison of CR and film-screen systems, Pediatric Radiol 32(7) (2002) 476-484.
[25] PETERS, S.E., BRENNAN, P.C., Digital radiography: are the manufacturers’ settings too high? Optimisation of the Kodak digital radiography system with aid of the computed radiography dose index, Eur Radiol 12(9) (2002) 2381-2387.
[26] WILLIS, C.E., Computed radiography: a higher dose? Pediatric Radiol 32(10) (2002) 745-750.
56

[27] VANO, E., FERNANDEZ, J.M., GUIBELAIDE, E., GONZALEZ, L., PEDROSA, C.S., Real-time measurement and audit of radiation dose to patients undergoing computed radiography, Radiology 225(1) (2002) 283-288.
[28] RILL, L.N., BRATEMAN, L., ARREOLA, M., Evaluating radiographic parameters for mobile chest computed radiography: phantoms, image quality and effective dose, Medical Physics 30(10) (2003) 2727-2735.
[29] NOBUHIRO, O., et al., Optimal beam quality for chest radiography, Invest. Radiol. 31 (1996) 126-131.
[30] TINGBERG, A., SJOSTRUM, D., Search for optimal tube voltage for image plate radiography, Prog Biomed Optics Imaging 4 (2003) 187-196.
[31] FETTERLEY, K.A., HANGIANDREOU, N.J., Effects of the X ray spectra on the DQE of a computed radiography system, Med Phys 28 (2001) 241-248.
[32] HONEY, I.D., MACKENZIE, A., EVANS, D.S., Investigation of optimum energies for chest imaging using film-screen and computed radiography, Brit J Radiol, 78(929) (2005) 422-427.
[33] European Guidelines on Quality Criteria for Diagnostic Images, Report EUR 16260, Office for Official Publications of the European Communities, Luxembourg (1996).
[34] SCHAEFER-PROKOP, C., ULFMANN, M., EISENHUBER, E., PROKOP, M., Digital radiography of the chest: detector techniques and performance parameters, J Thor Imaging, 18(3) (2003) 124-137.
[35] BACHER K., et al., Dose reduction in patients undergoing chest imaging: digital amorphous silicon flat-panel detector radiography versus conventional film-screen radiography and phosphor-based computed radiography, AJR 181(4) (2003) 923-929.
[36] SAINANI, F., GHIRADI, C., RODELLA, C.A., FEROLDI, P., CHIESA, A., Radiation dose in digital chest radiography: comparison among three technologies, Radiologica Medica 107(4) (2004) 401-407.
[37] UFFMANN, M., et al., Computed and direct radiography: influence of acquisition dose on the detection of simulated lung lesions, Investigative Radiol 40(5) (2005) 249-256.
[38] HAMER, O.W., et al., Amorphous silicon flat-panel X ray detector versus storage phosphor-based computed radiography: contrast-detail phantom study at different tube voltages and detector entrance doses, Investigative Radiol 38(4) (2003) 212-220.
[39] DON, S., Radiosensitivity of children: potential for overexposure in CR and DR and magnitude of doses in ordinary radiographic examinations, Pediatric Radiology 34Suppl 3 (2004) S167-172.
[40] MACCUTCHEON, D.W., Management of pediatric radiation dose using Fuji computed radiography, Pediatric Radiol 34 Suppl 3 (2004) S201-6.
[41] SCHAETZING, R., Management of pediatric radiation dose using Agfa computed radiography, Pediatric Radiol 34 Suppl 3 (2004) S207-14.
57

[42] HANSSON, J., et al, An optimisation strategy in a digital environment applied to neonatal chest imaging, Rad Prot Dosimetry 114(1-3) (2005) 278-285.
[43] OFFIAH, A.C., GREHAN, J., HALL, C.M., TODD-POKROPEK, A., Optimal exposure parameters for digital radiography of the infant skull: a pilot study, Clin Radiol 60(11) (2005) 1195-1204.
[44] ULLMAN, G., et al., The influence of patient thickness and imaging system on patient dose and physical image quality in digital chest imaging, Rad Prot Dosimetry 114(1-3) (2005) 294-297.
[45] PERSLIDEN, J., BECKMAN, K.W., GEIJER, H., ANDERSSON, T., Dose-image ptimizing n in digital radiology with a direct digital detector: an example applied to
pelvic examinations, Eur Radiol, 12(6) (2002) 1584-1588.
[46] SLOVIS, T.L., CT and computed radiography: the pictures are great, but is the radiation dose greater than required? AJR 179(1) (2002) 39-41.
[47] WILLIS, C.E., Strategies for dose reduction in ordinary radiographic examinations using CR and DR, Pediatric Radiol 34 Suppl 3 (2004) S196-200.
[48] WILLIS, C.E., SLOVIS, T.L., The ALARA Concept in Pediatric CR and DR: Dose Reduction in Pediatric Radiographic Exams – a White Paper Conference Executive Summary, Radiology 234 (2005) 343-344.
[49] FREEDMAN, M., et al., The potential for unnecessary patient exposure from the use of storage phosphor imaging systems, SPIE 1897 (1993) 472-479.
[50] GUR, D., et al., Natural migration to a higher dose in CR imaging, Proc 8th European Congress of Radiology, Vienna, Sept 12-17, p. 154 (1993).
[51] WILLIS C., E., Optimizing digital radiography of children, European Journal of Radiology, 72 (2009) 266-273.
[52] WILKINSON, L.E., HEGGIE, J.C.P., Determination of correct AEC function with computed radiography cassettes, Australas Phys Eng Sci Med 20(3) (1996) 186-191.
[53] DOYLE, P., GENTLE, D., MARTIN, C.J., Optimising automatic exposure control in computed radiography and the impact on patient dose, Rad Prot Dosimetry 114 (1-3) (2005) 236-239.
[54] BATH, M., HAKANSSON, M., HANSSON, J., MANSSON, L.G., A conceptual optimization strategy for radiography in a digital environment, Rad Prot Dosimetry 114 (1-3) (2005) 230-235.
[55] SAMEI, E., DOBBINS, J.T., LO, J.Y., TORNAI, M.P., A framework for optimizing the radiographic technique in digital X ray imaging, Rad Prot Dosimetry 114 (1-3) (2005) 220-229.
[56] COMPAGNONE, G., et al., Comparison of radiation doses to patients undergoing standard radiographic examinations with conventional screen-film radiography, computed radiography and direct digital radiography, BJR 79 (2006) 899-904.
58

[57] ALDRICH, J.E., DURAN, E., DUNLOP, P., MAYO, J.R., Optimisation of dose and image quality for computed radiography and digital radiography, J Dig Imaging 19(2) (2006) 126-131.
[58] SETO, E., URSANI, A., CAFAZZO, J.A., ROSSOS, P.G., EASTY, A.C., Image quality assurance of soft copy display systems, J Dig Imaging 18 (4) (2005) 280-286.
[59] KIMPE, T., Defective pixels in medical LCD displays: Problem analysis and fundamental solution, J Dig Imaging 19 (1) (2006) 76-84.
[60] RAMLI K, et al., Computed and conventional chest radiography: A comparison of image quality and radiation dose, Australasian Radiol 49 (2005) 460-466.
[61] SCHAEFER-PROKOP C.M., et al., DR and CR: Recent advances in technology, European Journal of Radiology, 72 (2009) 194-201.
[62] UFFMANN M. and SCHAEFER-PROKOP, C.M., DR and CR: Digital radiography: The balance between image quality and required radiation dose, European Journal of Radiology, 72 (2009) 202-208.
[63] SAMEI, E., et al, Performance evaluation of computed radiography systems, Med Phys 28 (3) (2001) 361-371.
[64] ZOETELIEF, J., et al, Quality control of equipment used in digital and interventional radiology, Rad Prot Dosimetry 117 (2005) 277-282.
[65] DOYLE, P., et al., Measurement of the Performance Characteristics od Diagnostic X-ray Systems: Digital Imaging Systems., Fairmount House, York: Institute of Physics and Engineering in Medicine (2009) Report No 32 part vii.
[66] AMERICAN ASSOCIATION of PHYSICISTS in MEDICINE, Acceptance Testing and Quality Control of Photostimulable Storage Phosphor Imaging Systems, report 93 (2006) College Park, MD.
[67] KaleidoGraph™ v 3.51, Synergy Software, 2000.
[68] IEC Standard 60601-2-7:1998, Medical electrical equipment Part 2.7: Particular requirements for safety – High voltage generators of diagnostic X ray generators. International Electrotechnical Commission, Geneva (1998).
[69] PETOUSSI-HENS, N., ZANKL, M., DREXLER, G., PANZER, W., REGULLA, D., Calculation of backscatter factors for diagnostic radiology using Monte Carlo methods, Phys Med Biol 43 (1998) 2237-2250.
[70] Journal of the International Commission on Radiation Units and measurements, 5 (2)(2005) ICRU Report 74 Appendix A.
[71] Compilation of anatomical, physiological and metabolic characteristics for a Reference Asian Man – Volume 1: Data summary and conclusions, IAEA TECDOC-1005, IAEA, Vienna (1998).
59

[72] Doses to patients from medical X ray examinations in the UK: 2000 review, Report NRPB-W14, NATIONAL RADIOLOGICAL PROTECTION BOARD (now Health Protection Agency) (2000).
[73] GRAY, J.E., et al., Reference values for diagnostic radiology: Application and impact, Radiology 235 (2005) 354-358.
[74] DIMOND III (Dose and Image Quality in Digital Imaging and Interventional Radiology), European Commission-funded research project, http://www.dimond3.org/WEB_DIMOND3/home.htm.
[75] MAC LEAN, I.D., INTERNATIONAL ATOMIC ENERGY AGENCY, Vienna, personal communication, 2009.
[76] NOWOTNY, R., HOFER, A., Ein Programm für die Berechnung von diagnostischen Röntgenspektren, Fortschr Röntgenstr 142 (1985) 685-689.
[77] BOONE, J.M., CHAVEZ, A.E., Comparison of X ray cross-sections for diagnostic and therapeutic medical physics, Medical Physics 23 (1996) 1997-2005.
[78] HUBBEL, J.H., SELTZER, S.M., Tables of X ray Mass Attenuation Coefficients and Mass Energy-Absorption Coefficients 1 keV to 20 MeV for Elements Z=1 to 92 and 48 Additional Substances of Dosimetric Interest, NISTIR 5632 (1995).
[79] SIEGEL, E.L., et al., Making filmless radiology work, J Digit Imaging 8 (1995) 151-155.
[80] POLUNIN, N., LIM, T.A., TAN, K.P., Reduction in retake rates and radiation dosage through computed radiography, Ann Acad Med Singapore 27 (1998) 807-807.
60

ANNEX I DEFINITIONS
The following definitions apply for the purposes of the present publication only.
Air kerma Air kerma is the kerma value in air.
Under charged particle equilibrium conditions, the air kerma (in gray) is numerically approximately equal to the absorbed dose in air (in gray).
A number of publications in the past have expressed measurements in terms of absorbed dose to air. Recent publications and the IAEA Code of Practice TRS 457 published in 2007 point out the experimental difficulty in determining the dose to air, especially in the vicinity of an interface, and that, in reality, what the dosimetry equipment registers is not the energy absorbed from the radiation by the air, but the energy transferred by the radiation to the charged particles resulting from the ionization. For these reasons the IAEA Code of Practice and ICRU Report 74 recommend the use of air kerma rather than absorbed dose to air. The unit is the joule per kilogram (J kg-1) and is given the special name gray (Gy).
Backscatter factor (B) The ratio of the entrance surface air kerma to the incident air kerma.
Half value layer (HVL) The thickness of an absorber necessary to reduce the intensity of an X ray beam to half its initial level.
Charge-coupled device (CCD) Photoelectric device which converts photons into electrical signals.
Computed radiography (CR) An X ray imaging technique which uses a photostimulable phosphor as the image recording medium.
Contrast The ability to differentiate two objects on an X ray, of similar density. For example, tumour and muscle.
Diagnostic reference level (DRL) Dose levels in medical radiodiagnostic practices or, in the case of radiopharmaceuticals, levels of activity, for typical examinations for groups of standard-sized patients or standard phantoms for broadly defined types of equipment. These levels are indicative of good practice when not exceeded or too low, for standard procedures when good and normal practice regarding diagnostic and technical performance is applied.
Direct radiography (DR) X ray imaging techniques which use various direct photon capture devices as the image recording medium. There are three types of DR systems: CCD, Indirect flat panel detectors, and direct flat panel detectors.
61

Dynamic range The ratio of the maximum to minimum dose that can be accepted by an imaging device without distortion or deterioration of the image. Film/screen systems typically have a dynamic range of 1:30, and DR, 1:10,000 or more.
Committed effective dose (E) The sum over all the organs and tissues of the body of the product of the equivalent dose (HT) to the organ or tissue and a tissue weighting factor, wT, for that organ or tissue.
Entrance skin dose (ESD) Absorbed dose to the skin entrance point including backscatter.
Entrance surface air kerma (ESAK) The air kerma at a point in a plane corresponding to the entrance surface of a specified object, e.g. a patient’s breast or a standard phantom. The radiation incident on the object and the backscattered radiation are included.
Exposure The act or condition of being subject to irradiation.
Also the sum of the electrical charges of all of the ions of one sign produced in air by X rays or gamma radiation when all electrons liberated by photons in a suitably small element of volume of air are completely stopped in air, divided by the mass of the air in the volume element, expressed in Coulomb per kg (C.kg-1).
Filtration The use of appropriate materials (usually Aluminium or Copper) to remove low energy radiation from the X ray beam, resulting in a lower radiation dose to the skin.
Film/screen imaging X ray imaging techniques which use fluorescent screens in combination with photographic film as the image recording medium.
Gray The SI unit of kerma and absorbed dose, equal to 1 J/kg.
Grey scale Image displays where intensity is displayed as levels of brightness.
Guidance level (for medical exposure) A value of dose, dose rate or activity selected by professional bodies in consultation with the regulatory body to indicate a level above which there should be a review by medical practitioners in order to determine whether or not the value is excessive, taking into account the particular circumstances and applying sound clinical judgment.
ICRP International Commission for Radiological Protection.
ICRU International Commission on Radiation Units and measurements.
62

Kerma (K) Originally an acronym for kinetic energy released in matter, now accepted as a word,
K = dEtr/dm
Where dEtr is the sum of the initial kinetic energies of all charged ionizing particles liberated by uncharged ionizing particles in a material of mass dm.
The quantity K, defined as:
= dEdm
where dEtr is the sum of the initial kinetic energies of all charged ionizing particles liberated by uncharged ionizing particles in a material of mass dm.
Unit: gray (Gy). Originally an acronym for kinetic energy released in matter, but now accepted as a word.
Air kerma. The kerma value for air.
Optimization of protection (and safety) The process of determining what level of protection and safety makes exposures, and the probability and magnitude of potential exposures, “as low as reasonably achievable, economic and social factors being taken into account” (ALARA), as required by the International Commission on Radiological Protection System of Radiological Protection.
Optimization The management of absorbed doses received by tissues in the region of the body being examined to a level compatible with obtaining the necessary clinical information for a particular patient.
Pixel (picture element) value The image signal at a defined location within an image. A digital image is made up of an array of individual pixels.
Phantom A device which simulates certain properties of a human body or body part for measurement of imaging performance.
Radiation quality or beam quality A measure of the penetrative power of an X ray beam, usually characterized by a statement of the tube potential and the HVL.
Raw image data Read-out signal of flat panel detector or storage phosphor system. The term “raw data” is often used to emphasize that they are unprocessed, or minimally processed.
Spatial resolution The ability to differentiate two closely spaced objects on an X ray image. Measured in line pairs/mm (lp/mm).
Thermoluminescence dosimetry (TLD) Measurement of absorbed dose by measurement of light emission during thermal stimulation of certain crystal phosphors such as (LiF:Mg,Ti), (Li2B4O7:Cu), (CaF2:nat.) previously exposed to radiation.
63

ANNEX II PROTOCOLS AND SAMPLE FORMS
II-1. ESAK data
Each participating hospital was given a spreadsheet for raw ESAK data collection as well as a protocol sheet. One person was nominated as the data collator, and had the role of normalizing the data, and producing the analytical expressions for ESAK as a function of kVp as described in Section 3.6.
The data collection protocol and the spreadsheet data form are reproduced below.
II-1.1. ESAK data protocol
The following protocol was provided to participants:
The ESAK for any given exposure (kVp, mAs) on any given X ray unit will be derived from a baseline data set of free-in-air kerma measurements for a defined mAs over the range of clinical kVps. The derivation will be by interpolation or analytic expression obtained by curve-fitting the data.
In order to determine changes in ESD as the transition is made from film/screen to digital radiography, wherever possible, the following protocol is to be repeated for each modality, preferably but not necessarily using the same X ray equipment.
• Before data collection, check that the kVp and timer for all participating X ray units are accurate to within IEC limits (+/-10% for kVp and +/-10% + 1 ms for time) using a calibrated measurement non-invasive device (e.g. NEROTM, Radcal). Measurements should be made at 100 cm from the tube focus;
• The kVp quantity reported throughout this study is to be average kVp. If you are unsure of the measured quantity, contact the data collator or manufacturer;
• Measure beam half value layer (HVL) in mm Al at or as close as possible to 80 kVp. • For each X ray unit in the study, record the added filtration in clinical use, measure the air
kerma on the beam axis (no backscatter material in the beam closer than 20 cm from the detector) with an ionization chamber of volume around 3 – 15 cc, or a solid state detector at a fixed FCD of 100 cm. Use either a fixed mAs or fixed mA and variable time (to ensure constant kVp), and a field size of 10 x 10 cm at the FCD.
• At 10 kVp intervals, make three exposures at each kVp to record ESAK, over the clinical range used at that site (normally 50 to 110 kVp)
• Record the following : kVp, mA, mAs , air kerma
Note: If your dosimeter measures in old units of exposure (mR), please use the line provided for this unit. Exposure value in mR will be divided by 87.6 to convert to mGy. If exposure is measured in another submultiple (e.g. microR are used), please convert to mR.
• Repeat for any other focus size used. • Data to be provided in Excel format, in columns, in the order : site ID, room ID, focus,
kVp, HVL, mAs, air kerma x 3 (in mGy), beam filtration • General information required: manufacturer and model of X ray unit in each room
(including whether generator is single phase, 3 phase or medium/high frequency), details of the ion chamber and electrometer used, distance from table (or patient support) to image receptor in cm for each room.
65

II-1.2. ESAK data sheet
IAEA CRP ON DIGITAL RADIOLOGY
Entrance Skin Air Kerma Data Proforma
Version
Date
Author
Purpose To collect basic information on air kerma for participating X ray units
Instructions Please complete all shaded cells.
Please complete one worksheet for each participating X ray system
Return completed file by:
Site
Site ID To be completed by collator
Dosimeter
Manufacturer
Model
Type (circle one)
Ion chamber /solid state detector / Other (specify) ____________
Calibration date
Quantity measured
Absorbed dose or air kerma/exposure Please check with the manual if unsure
Unit mGy/μGy/mR/R/other____________________
Contact person
Key to data sheets
Room no. Local identification of the X ray room, e.g. “C4565”, “Chest Room”, etc.
HVL Half value layer of beam, 80 kVp only, in mm Al.
FCD Focus to chamber (centre of radiation detector) distance, in cm.
Measurement No.
Three repeated measurements for each kVp and mAs
66
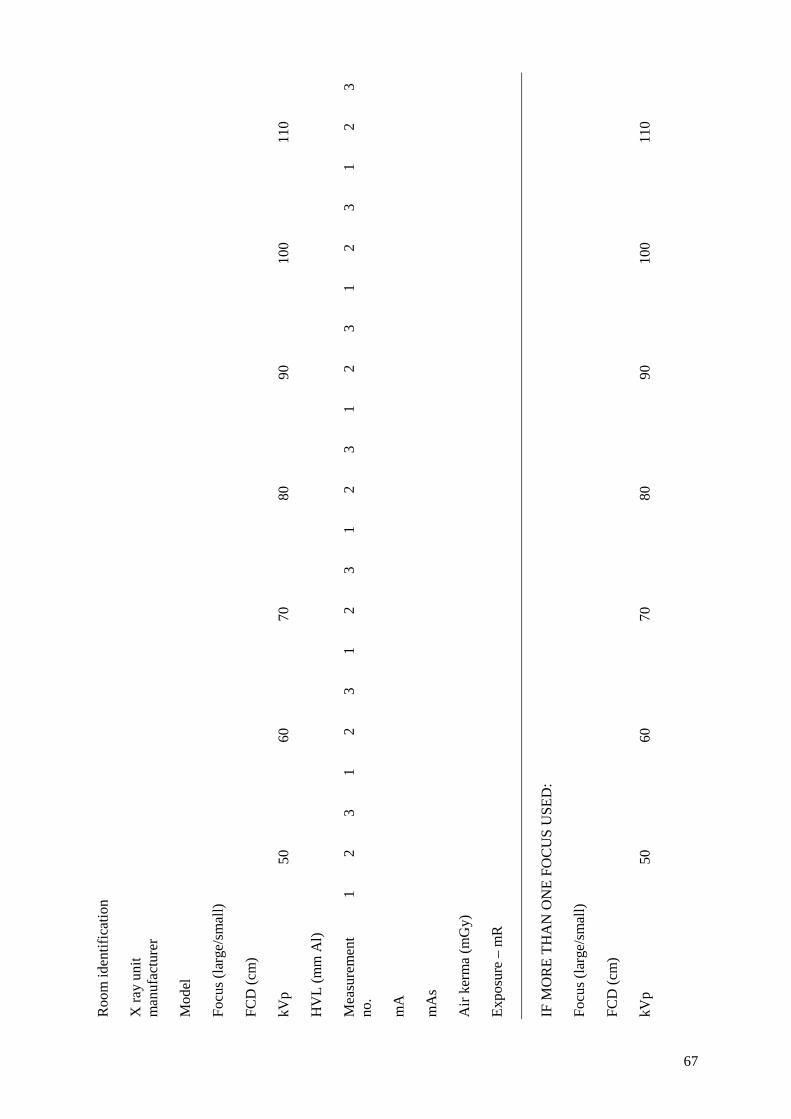
Roo
m id
entif
icat
ion
X ra
y un
it m
anuf
actu
rer
Mod
el
Focu
s (la
rge/
smal
l)
FCD
(cm
)
kVp
50
60
70
80
90
10
0
11
0
HV
L (m
m A
l)
Mea
sure
men
t no
. 1
2 3
1 2
3 1
2 3
1 2
3 1
2 3
1 2
3 1
2 3
mA
mA
s
Air
kerm
a (m
Gy)
Expo
sure
– m
R
IF M
OR
E TH
AN
ON
E FO
CU
S U
SED
:
Focu
s (la
rge/
smal
l)
FCD
(cm
)
kVp
50
60
70
80
90
10
0
11
0
67

HV
L (m
m A
l)
Mea
sure
men
t no
. 1
2 3
1 2
3 1
2 3
1 2
3 1
2 3
1 2
3 1
2 3
mA
mA
s
Air
kerm
a (m
Gy)
68
II-2. Entrance skin dose data collection protocol
II-2.1. Data collection protocol
The following protocol was supplied for the collection of actual patient exposure data:
Exposure parameters are required for at least 20 patients in each room (preferably 50) for each of the study examinations and projections in order to collect ESD data:
• Chest – PA and lateral (left or right) • Lumbar spine – AP and lateral (left or right) • Abdomen – AP • Pelvis – AP
In order to minimize the anatomical variations in ESD, only patients in the following weight and age ranges are to be included: Male European 70 +- 10 kg, male Asian 60 +- 10 kg, age 20-60 years, female European 60 +- 10 kg, female Asian 50 +- 10 kg.
If a film has to be retaken, please do not include the original exposure in your data.
The air kerma data will enable ESD to be determined. For each exposure the following data will be required (to be entered in the supplied Excel 97 spreadsheet template): Site ID, examination, projection, room ID, modality (film/screen, CR or DR), focus, kVp, mA, mAs, tick if a grid was used, focus to image receptor distance (FID).
If a site uses both film/screen and digital radiography, data should be collected for both modalities, with approximately the same no. of patients (20 to 50) for each. If a site currently uses only film/screen but intends to change, the data collection should be repeated after the conversion to digital.
Air gap techniques are to be excluded.
Include only supine abdomen and pelvis examinations.
II-2.2. Quality control
As a QC check, there will be an intercomparison of ESD conducted using TLD. Details will be provided later, but in general will follow the protocol:
• For the given kVp and mAs and focus size, re-measure the air kerma as above but for the specified field size, and report as above;
• the ESAK will be converted to ESD by the data collator; • the TLD will then be placed on the surface of a 20 cm water-equivalent phantom at
least 20 × 20 cm size, in the beam centre, for the given field size (probably 10 × 10 cm) at the phantom surface;
• make an exposure at the specified kVp and mAs; • return the TLD for reading along with the following data : Site ID, room ID,
ESAK, FCD (cm), field size, focus to TLD distance (cm), phantom description.
69

II-2.3. Notes
If any significant changes to the X ray unit occur (such as tube replacement), the ESAK data is to be repeated, and submitted with the effective date of the change.
All measurements should preferably be made with equipment calibrated within the previous 24 months, traceable to an appropriate national standard.
70

ANNEX III IAEA DIGITAL PHANTOM – DESCRIPTION AND INSTRUCTIONS FOR USE
III-1. Introducing the Phantom
A phantom (Prototype Vienna I) was designed and produced by the Vienna group (Peter Homolka). Mainly, it consists of 2 parts:
• the patient equivalent pre-filter • the phantom plate itself.
Both are packed into a custom made suitcase (weight about 12 kg).
III-2. The patient equivalent pre-filter
Consists of 2 slabs of Teflon, each of which is 4 cm thick. These 8 cm of Teflon in combination with the 3 cm thick PMMA Phantom will attenuate X rays quite similarly as a standard patient. Also, exit spectra will be much closer to spectra behind a patient than it would be the case, if an aluminium pre-filter was used. Figure III-1 shows the parts.
Fig. III-1. Pre-filter components.
The pre-filter comes with 2 adaptors for mounting into the slits of the X ray collimator housing. Every adaptor has 2 different dimensions. The adaptors supplied should fit Philips, Siemens and GE equipment. Figure III-2 shows the pre-filter assembled and Fig. III-3 shows it mounted to the X ray tube housing. When assembling the filter using the appropriate adaptor system please note that the two Teflon pieces are different, because one will fit into the cut-out of the adaptor plate. The aluminium side of the adaptor plate should be at the tube side, the lead towards the Teflon slabs.
71
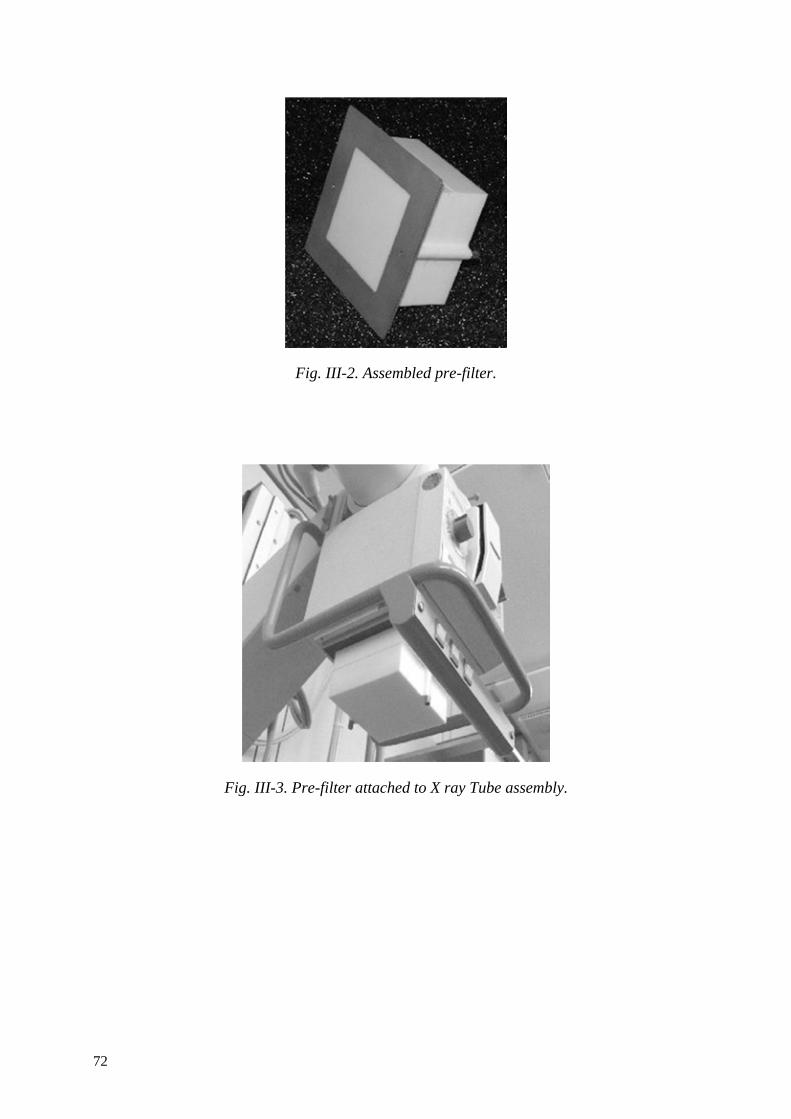
Fig. III-2. Assembled pre-filter.
Fig. III-3. Pre-filter attached to X ray Tube assembly.
72

Fig. III-4. Phantom plate components.
Fig. III-4 shows the components of the phantom plate. The aluminium (Al) wedge should be placed with the thick section facing the line pair test pattern (although it will fit better in the suitcase for transportation, if placed with the thin section next to the line pair test). The Al wedge is necessary to produce an image histogram of approximately the same latitude as a patient image. It also contains boreholes serving as high contrast details at varying background densities.
For this analysis, the red cylinder containing a vertebral body (porcine) embedded into PMMA will not be used. Nevertheless, please leave it in its place on the phantom. You can use the image of the trabecular structure to get an idea of how your system images rather low contrast fine bony tissues.
73
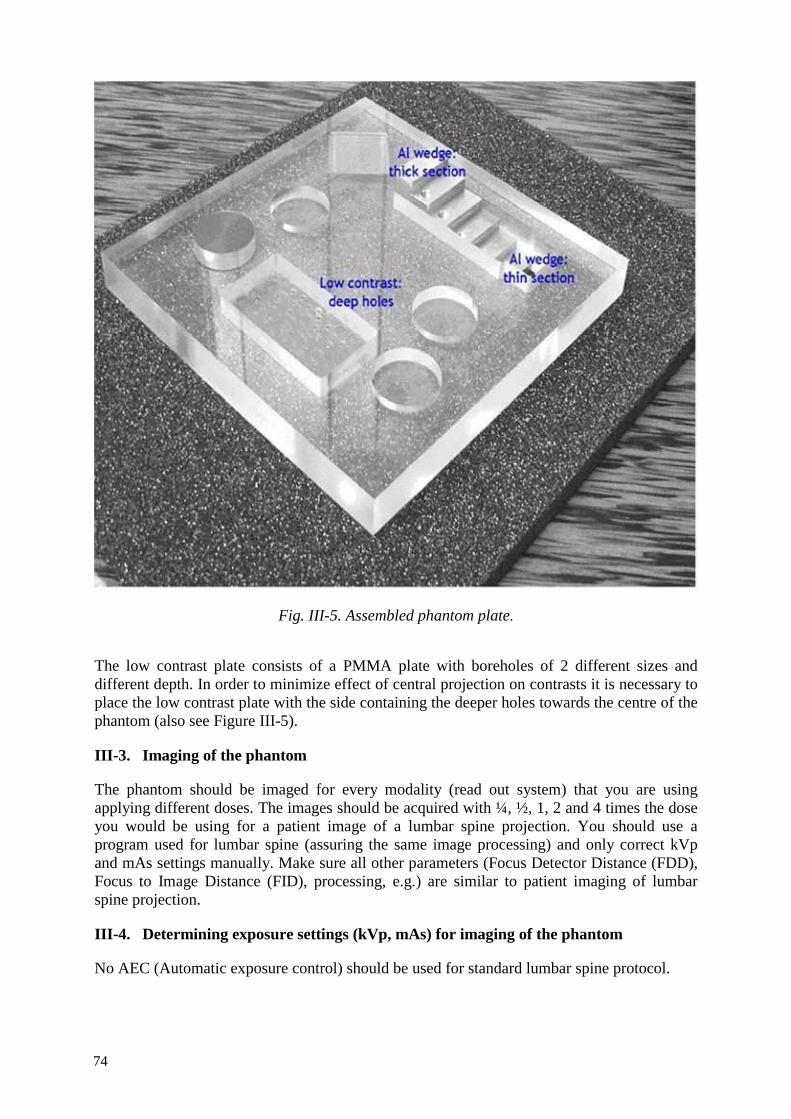
Fig. III-5. Assembled phantom plate.
The low contrast plate consists of a PMMA plate with boreholes of 2 different sizes and different depth. In order to minimize effect of central projection on contrasts it is necessary to place the low contrast plate with the side containing the deeper holes towards the centre of the phantom (also see Figure III-5).
III-3. Imaging of the phantom
The phantom should be imaged for every modality (read out system) that you are using applying different doses. The images should be acquired with ¼, ½, 1, 2 and 4 times the dose you would be using for a patient image of a lumbar spine projection. You should use a program used for lumbar spine (assuring the same image processing) and only correct kVp and mAs settings manually. Make sure all other parameters (Focus Detector Distance (FDD), Focus to Image Distance (FID), processing, e.g.) are similar to patient imaging of lumbar spine projection.
III-4. Determining exposure settings (kVp, mAs) for imaging of the phantom
No AEC (Automatic exposure control) should be used for standard lumbar spine protocol.
74

Since the phantom is to be imaged with multiples (or fractions, respectively) of the actual dose value you are using in patient imaging of lumbar spine, you first need to calculate your average kVp and mAs. To do so, please use the patient exposure data you have supplied in the earlier part of the CRP.
(1) Calculate your average kVp value used for the lumbar spine (AP or PA). Please remember to use only patients with standard weight and height. You should use at least 20 patients.
(2) Determine the closest kVp value on your generator that you can set manually. (3) Calculate the average mAs values corrected for this average kVp setting for all
patients.
Example
Your average kVp is 68.5. The closest value that can be set on the generator is 70 kVp. One patient was imaged using 72 kVp and 10 mAs. The mAs value corrected for 70 kVp is 10.58 mAs using the formula
2
2
( )( )
appliedcorr appplied
mean
kVpmAs mAs
kV=
The corrected mAs value, thus, corresponds to the mAs value you would have used with the mean kVp instead of the applied kVp value.
In our example, this would be:
2
2
7210 10.5870corrmAs mAs mAs= =
(4) Average the corrected mAs values for all patients (5) Determine the closest possible setting for mAs on your generator (6) You will be using ¼, ½, 1, 2 and 4 times of this mAs value.
Example
The average over all patients is 11.2 mAs. The closest setting on the generator is 12 mAs. Your imaging parameters for his system will be:
• 70 kVp, 3 mAs (=1/4 of your average patient exposure) • 70 kVp, 6 mAs (=1/2 of your average patient exposure) • 70 kVp, 12 mAs (=your average patient exposure) • 70 kVp, 24 mAs (=2 times your average patient exposure) • 70 kVp, 48 mAs (=4 times your average patient exposure)
After setting up the phantom, acquire 2 images with identical settings each (i.e. 10 images altogether), print them out and save them to your computer system because you will need both the hard copies and the electronic image files for evaluation.
75

III-5. AEC (Automatic exposure control) used for standard lumbar spine protocol
Determine average kVp setting used for patient LS images. Use the closest setting on the generator for kVp, the LS protocol, and determine mAs baseline setting by making an exposure with AEC as with a patient.
Please use focus-detector distance as used with patient’s protocol and note on protocol. If the generator allows for higher doses than the maximum set here (4 times of normal/AEC dose) please make additional images with even higher doses.
When using CR, please read out the CR plates within approx. 5 minutes after exposure.
The images should look like Figure III-6.
Fig. III-6. Radiograph of phantom plate.
76

III-6. Evaluating the images
Evaluations 1 to 3 refer to the hardcopies. Please use a light box as normally used for reading patient images.
III-7. Spatial resolution
Spatial resolution as determined using the test pattern on every image on the hardcopies.
III-8. High contrast
Count the number of steps in the aluminium wedge clearly distinguishable. The step wedge consists of 7 steps, six actually forming the step wedge plus one (left in the image on the top of this page) where the beam is unattenuated (air only). Every step in the Al wedge shows a high contrast detail (borehole) with a contrast corresponding to halve of the step width. Also count the number of high contrast details you can see (maximum 6). Note numbers in excel sheet.
III-9. Low contrast details
For this analysis you need 3 observers. Please present the images in random order and collimate the light box to the low contrast detail plate of the phantom if possible. In order to present the films differently you should also randomly flip or/and mirror the images on the light box. Then, the details will not appear at the same places in all images and observer bias should be lower.
Have every reader examine the image and count the number of:
• Small details • Big details
he or she can see in the image. If you present the images to all three readers at one time ask them to write these numbers down for each image and not communicate to the others about how many or where they see details.
III-10. Contrast to noise ratio
The contrast to noise ratio has to be measured on the digital images using some kind of digital image processing software. You can, for instance, use ImageJ or Osiris which are both in the public domain and available from the Internet. Alternatively, you can use any software allowing ROI analysis you have.
The contrast to be used is given by the contrast of the 2 boreholes 5 cm in diameter and 1 cm depth against the phantom plate. The CNR (Contrast to Noise Ratio) of these is measured using ROIs of 1 cm in diameter.
Small ROIs of defined diameter are necessary because in some images inhomogeneous scatter background will render measurements done with larger ROIs useless.
In every borehole, 4 measurements of CNR are made and averaged. Therefore, for every CNR data set, 2 regions close together are needed, one in the borehole, the other outside (see Figure 5). The contrast is then defined by the difference of the pixel values of the two
77
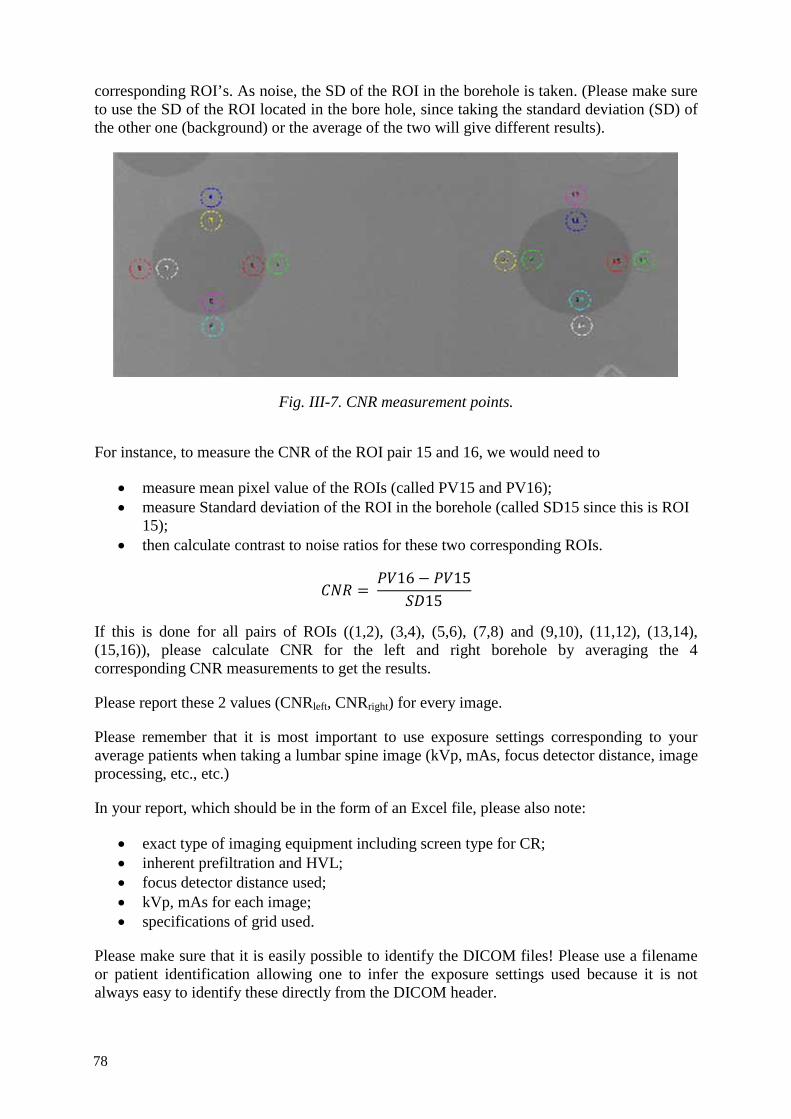
corresponding ROI’s. As noise, the SD of the ROI in the borehole is taken. (Please make sure to use the SD of the ROI located in the bore hole, since taking the standard deviation (SD) of the other one (background) or the average of the two will give different results).
Fig. III-7. CNR measurement points.
For instance, to measure the CNR of the ROI pair 15 and 16, we would need to
• measure mean pixel value of the ROIs (called PV15 and PV16); • measure Standard deviation of the ROI in the borehole (called SD15 since this is ROI
15); • then calculate contrast to noise ratios for these two corresponding ROIs.
16 1515
If this is done for all pairs of ROIs ((1,2), (3,4), (5,6), (7,8) and (9,10), (11,12), (13,14), (15,16)), please calculate CNR for the left and right borehole by averaging the 4 corresponding CNR measurements to get the results.
Please report these 2 values (CNRleft, CNRright) for every image.
Please remember that it is most important to use exposure settings corresponding to your average patients when taking a lumbar spine image (kVp, mAs, focus detector distance, image processing, etc., etc.)
In your report, which should be in the form of an Excel file, please also note:
• exact type of imaging equipment including screen type for CR; • inherent prefiltration and HVL; • focus detector distance used; • kVp, mAs for each image; • specifications of grid used.
Please make sure that it is easily possible to identify the DICOM files! Please use a filename or patient identification allowing one to infer the exposure settings used because it is not always easy to identify these directly from the DICOM header.
78

ANNEX IV IMAGE QUALITY DATA SHEET (SAMPLE)
Hospital Hospital XXX
Room code
Modality (DR/CR)
PLEASE USE SEPARATE EXCEL SHEET FOR EVERY MODALITY
Observer identification
Prof. Dr. Hyde PLEASE USE SEPARATE EXCEL SHEET FOR EVERY OBSERVER (3)
Grading 3 ratings: Examples
0: criterion not fulfilled 1. Femoral heads well demonstrated through the underlying acetabula
1
1/2 (or 0.5):criterion partly fulfilled
2. Visually sharp reproduction of the femoral necks on their full extent without anteversion.
1/2
1: criterion fulfilled
If criterion cannot be evaluated due to a pathology in the patient, grade with “P”
Note: if it is clear before evaluation that a patient’s image will receive one or more “P”s, this is an exclusion criterion since a total score cannot be calculated
Grading of “important” image details**
Image details at 3rd lumbar vertebral body: details with 0.3 - 0.5 mm in width clearly visible**
y
If details as described are visible, grade with y (yes, fulfilled), otherwise estimate size of smallest details visible
Image details at 3rd lumbar vertebral body: details with 0.3 - 0.5 mm in width clearly visible**
0.7 mm
Grading of image noise***
Grading overall image quality - MODIFIED 5/8/04***
Use scale 1 to 5
79

5: Image quality much better than necessary for diagnosis (high dose)
4: Image quality better than necessary
3: Image quality adequate for accurate diagnosis (noise level does not affect diagnosis)
2:image quality low - diagnosis still possible but may not be accurate
1: Image quality poor, diagnosis not possible
80

Pelvis Monitor CRT
Hard copy
Patient identification
Positioning criteria
1. Entire pelvis included along with proximal femurs.
2. If seen lesser trochanters demonstrated on the medial border of femurs.
3. The sacrum and coccyx is aligned with the pubic symphysis.
4. Ilia equidistant to the edge of the radiograph.
5. Greater trochanters equidistant to the edge of the radiograph.
6. Obturator foramina are symmetrical.
7. Both the iliac alae should be symmetrical.
8. The greater trochanters are fully demonstrated.
9. The ischial spines are equally demonstrated.
Total
Image quality
1. Femoral heads well demonstrated through the underlying acetabula
2. Visually sharp reproduction of the femoral necks on their full extent without anteversion
3. Visually sharp reproduction of the sacrum and its intervertebral foramina
4. Visually sharp reproduction of the pubic and ischial rami
5. Visually sharp reproduction of the spongiosa and corticalis
The identification markers should be clearly seen
Important image details ** 0.5 mm sized details clearly visible
Total
Rate overall diagnostic image quality (1-5 scale***)
81


ANNEX V DETAILS OF THE PARTICIPANTS OF THE CRP
This Annex provides the following information for the participating countries: • Participating hospitals • Persons involved in the project
Country: Australia Hospitals: St. Vincents Hospital, Melbourne Sydney Adventist Hospital, Sydney Westmead Hospital, Sydney Participants: Lee Collins Ravinder Grewal Don McLean Contributors: Rita Richter Richard Smart John Heggie
Country: Austria Hospital: General Hospital (AKH), Vienna Participants: Peter Homolka
Franz Kainberger
Country: India Hospital: Kasturba Hospital, Manipal Participants: Bushan Lakhkar
Chandrakant Shetty Gauri Shankar
Country: Malaysia Hospital: University of Malaya Hospital, Kuala Lumpur Participants: K-H Ng Contributors: MS Nizam
BJJ Abdullah SA Sarji
Country: Thailand Hospital: Chulalongkorn University Hospital, Bangkok Participant: Anchali Krisananchida Contributors: Sukalya Lerdlum
Somjai Wangsuphachart, Panruthai Trinavarat Petcharleeya Suwanpradit Chawee Luechapun Baunchai Nittayasupaporn
83


CONTRIBUTORS TO DRAFTING AND REVIEW
Collins, L. Westmead Hospital, Australia
Lewis, C. King’s College Hospital, United Kingdom
Malchair, F. International Atomic Energy Agency
Rehani, M.M. International Atomic Energy Agency
Rothenberg, L.N. Memorial Sloan-Kettering Cancer Center, USA
Vañó Carruana, E. Universidad Complutense de Madrid, Spain
Consultants meetings Madrid, Spain: 10–14 February 2003 Bangkok, Thailand: 2–6 August 2004
85


@������
��������� ���������������� ��������������������������������� �������������������������� ������������ ���������
����������������������������������� �������������������������������� ����� !"����������
������ �#��������� ��� ��$�����%&'�(� �������)�����*�+!,�*�-.-/��
+�������0�1%.�-�2/.3�4444�5�6�70�1%.�-�2/.3�44''��
���0����$��8������ ��������5�(���� �0�� �099���������� ��������
!� " �#:�������;��������$��������)��/3/��<=..23�<��������
+�������0�1-/�/�>-'�&-�3'�5�6�70�1-/�/�>-'�3'�&.��
���0��������������8������������5�(���� �0�� �099��������=��=���������
$���%�<������������ ����&>3.�6������<$��� � ��/33��;�������*#�/343%=&-&%��� ���
+�������0�.='33='%>=-&>4�5�6�70�.='33='%>=-&>3��
���0���� ��������8�����������5�(���� �0�� �099���������������
)������������?�!�������; ����.=>-%2�!��� ���)����" �����"� �����@.:�2:-��
+�������0�1%.-�4&>�/%%>�5�6�70�1%.-�4&>�4%%3��
���0���������� 8����������������5�(���� �0�� �099��������������������
$& ������������ ������!�����0�!���������������?������� ���!������ ����+����� ��� �� ������"��<�7�/.3-��<���?�
$'�$&���(�! $ ������!A�� �)�"���@�����$��-&4��.'3�/.�������2��
+�������0�1&/3�/%%3-�>-%&�5�6�70�1&/3�/'&'/�.%&%��
���0������8��������B�5�(���� �0�� �099������������B�
) � ��%��� �������@������������"�<"C�./'�D@������� ��.E��6��=33.3.�,������
+�������0�1->'�2�./.�&.�5�6�70�1->'�2�./.�&&>3��
���0���� ���8��� �����������5�(���� �0�� �099������� �����������
)���$�6���=�� ��>������:����������"��<�7�/>��6=4>2/.������!���7�.2��
+�������0�1--�.�&/�3.�&2�&2�5�6�70�1--�.�&/�3.�23�23��
���0������� 8������ ����5�(���� �0�� �099����������� ����
;�$����� � ��.&>�����������$?����2&/-%�!������!���7��
+�������0�1�--�.�&4�&3�%4�3/�5�6�7�1--�.�&4�&3�%4�3/��
���0��������$�����8�$��������5�(���� �0�� �099�����$��������
"��#��*��"=F���?��F�� ����=�����F���?��G��,�����,��?�� ���.3��#=>-..-�<�����
+�������0�1�&2�//'�2&�23�/3�5�6�70�1&2�//'�2&�23�/3����1&2�//'�2&�23�///��
���0���� ���?8���=$���?����5�(���� �0�� �099�������=$���?����
&��"��*;��� �����; ����<��������� ����"��<�7�./%��,=.%>%�<������ ��
+�������0�1-%�.�/>4�4444�5�6�70�1-%�.�/>4�4&4/�5����0������8��� ��������
�% ��������������G������.� �6�����#������,������.>��:�����,������*��?��<������� � ���*�����&33�33.���
+�������0�12.�//�//%.42/%9/4�5�6�70�12.�//�//%.42/'��
���0�����8$�������5�(���� �0�� �099��������������������
<�������/94/����������!������#���..3332��
+�������0�12.�..�/-/%'4'%��12.�..�/-/>4/%&�5�6�70�12.�..�/-/'.-.>��
���0�������8$����� �
�� *;������ ��� ����#� ��;������<����H���"�I��F��!������%���=/3.&%�*����
+�������0�1-2�3/�&'�2>�&>�>/����&'�2>�&>�%/�5�6�70�1-2�3/�&'�2>�&>�&'��
���0����8�������������5�(��� �0�����������������

+�(��*���B���!��������; ����.-=%�����������-��������!���=����+�����.3-=33/4��
+�������0�1'.�-�-/4>�'>'/�5�6�70�1'.�-�-/4>�234/��
���0�������8����B���������5�(���� �0�� �099��������B���������
��(�! $�,)�-,���@�� �������������� ���<�������#�� �� �����<�?��/���6�����/4>=.�J��?�:��=���?� ��!��=G�� ����.-4=.-3�
+�������0�13/�>'2�.4&3�5�6�70�13/�>'2�.4&%�5�(���� �0�� �099��������������
���&�� ��%�#��;���������� ���� ���������� ���<�F���*�������)�� ��� ��� �/3����;=4&'/�<A�,�������?����
+�������0�1-.�D3E�>-�>4&333&�5�6�70�1-.�D3E�>-�>4/2/2%��
���0������8��������������5�(���� �0�� �099������������������
*�� ������������� ���� �����@���������>3����"��<�7�.'>-��/433�!A�A�� ��������
+�������0�1-.�42-�%'&�&33�5�6�70�1-.�42-�%.>�%2'��
���0����8���������5�(���� �0�� �099�������������
�� ������A� �?�����$�����"��<�7�'-3��/.%3� A�;�����
+�������0�1-.�/>/�&->�...�5�6�70�1-.�/>/�&.>�'''��
���0������8��� ����5�(���� �0�� �099������� ����
����'�� ��%#��������� ��� ��$�����%&'�(� �������)�����*�+!,�*�-.-/����� �����
+�������0�1%.�-�2/.3�4444�5�6�70�1%.�-�2/.3�44''��
���0����$��8������ ��������5�(���� �0�� �099���������� ��������
� ,.�� �!�������$��A��B���������@�� ����$��/�� �=.>./�;���������
+�������0�1-'%�.�&-/�-.�&&�5�6�70�1-'%�.�/-3�.&�->��
���0����� ������8��������$�=B���5�(���� �0�� �099������������$�=B��9�$�B�
�(� �#K�B���� �� ���� ������9�:����<��$���-����=/'33%�*������
+�������0�1-&�2.�4'.�2&�'3�5�6�70�1-&�2.�>4>�>>�%-��
���0��������8��B����� �������������8��B����� ���������������8��B����� ����������8��B����� �����
(���� �0�� �099������B����� ������
�� ��%�- �"%,#+��� � ������"�����; ����� ���� ���� �����?�������"�<�7�/2�����������)-�.�G���
+��������D������E0�1&&�'43�%33�>>>/�5�D��L����E0�1&&�/34�'4-�'-4/�5�6�70�1&&�/34�'4-�'/3-��
����D������E0������������8 ���������5�D��L����E0��������L����8 ���������5�(���� �0�� �099���� ���������
"�=�����������
#�;+���� ��<����(���������; ����-2���7������)���������� ����� �������@+.>�/�M��
���0����8��������������5�(���� �0�� �099������������������
<�������� �����$������ ��
��� ���� �; ������"��<�7�..2�� �$���?�� G.�&+���
+�������0�1&&�.&-'4&'...�5�6�70�1&&�.&-'4&''&&��
���0�������8��� ���� �����5�(���� �0�� �099������� ���� ����
�� ��%���� ,��#�� ���33&��)����#!/=3'>-��6�� ��$������ �&% �� ��� ������J�������J��.33.4��� ���
D��E�+�������0�1'33�/>-=2%&%����1/./�2%-='-3/�5�6�70�1/./�2%-=-&'2��
���0������ ���8�����?�5�(���� �0�� �099���������?�
�� ��%��������,)��#�� $�<������������ ����&>3.�6������<$���� � ��/33��;�������*#�/343%=&-&%�
+�������0�.='33='%>=-&>4�5�6�70�.='33='%>=-&>3��
���0���� ��������8�����������N�(���� �0�� �099���������������
)������������?�!�������; ����'./����� ����$����"?�������?���J��.-%%2��
+�������0�1'''�>>.�4&43�D �=����E�5�6�70�1'''�>%'�'>&%�D �=����E��
���0���������� 8����������������5�(���� �0�� �099��������������������
,�������/������������0������������������������������� �� �0�
#�1������������������2� ��������������0������3�����3��
F������� ���� ����!�� �����"�<�7�.33��.&33�F��������� ���
+�������0�1&-�.�/%33�//>/2�D���//>-3E�5�6�70�1&-�.�/%33�/2-3/�
���0����������� ���8������?�5�(���� �0�� �099����������?9�����
11-40111

IAEA-TECDOC-1667
Avoidance of Unnecessary Dose to Patients While Transitioning
from Analogue to Digital Radiology
INTERNATIONAL ATOMIC ENERGY AGENCYVIENNA
ISBN 978–92–0–121010–4ISSN 1011–4289
IAEA
-TECD
OC
-1667 n
AvOID
An
CE O
f Un
nEC
EssAry D
OsE TO
PATIEnTs W
hIlE Tr
An
sITIOn
Ing
frO
m A
nA
lOg
UE TO
DIg
ITAl r
AD
IOlO
gy