aviation strategy · briefing awa-us airways: potential merger looms 6-10 ... on this subject among...
TRANSCRIPT

Aviation EconomicsJames House, LG2,
22/24 Corsham StreetLondon N1 6DR
Tel: +44 (0) 20 7490 5215Fax: +44 (0) 20 7490 5218e-mail: [email protected]
Issue No: 91 May 2005
Aviation Strategy
Analysis
Industry sources of liquidity 1-4
Emirates: low cost,long-haul airline 4-6
Briefing
AWA-US Airways:potential merger looms 6-10
bmi: struggling withreluctant owners 11-17
Value and operatinglease rate trends 18-19
Databases 20-23
Airline traffic and financials
Aircraft available
Regional trends
Orders
CONTENTS
PUBLISHER
www.aviationeconomics.com
New sources of liquidityIt is quite remarkable that, after the enormous financial losses of
the past four years, all of the US legacy carriers that existedbefore September 11, 2001 are still in business. Three have filedfor Chapter 11 - UAL, US Airways (twice) and ATA - but there havebeen no actual shutdowns or liquidations. Why? Because uniquepublic and private support systems have been in place to ensurethat even the financially weakest carriers continue operating.
Initially, the airlines made it through the worst of the post-September 11 crisis thanks to government cash grants and the fed-eral loan guarantee programme. Subsequently, the legacy sectorwas kept going by the ingenuity and willingness of the US capitaland banking markets to continue providing them new funds.
The Chapter 11 process, which has long been criticised forenabling carriers that are clearly not long-term survivors to contin-ue operating for many years, has helped US Airways and UALenormously since their bankruptcy filings in the second half of2002. Most recently, on May 10, United's bankruptcy court allowedit to terminate its pension plans and shift $5bn of pension obliga-tions to the Pension Benefit Guaranty Corporation (PBGC), thefederal agency that insures corporate pensions in the US.
Symbiotic financiers
In the past six months or so, US airlines have attracted signifi-cant financial assistance from yet another source: private-sectorsuppliers that are in "symbiotic relationships" with the airlines (aterm used by Peter Morris of Airclaims in a recent speech). Mostnotably, General Electric (GE), which has heavy exposure to USairlines through lessor GECAS, has recently played a key role inpreventing Chapter 11 filings by Delta and Independence Air andenabling US Airways to avoid Chapter 7 liquidation.
The Delta deal in November 2004 was a $500m secured debtfinancing, which included a term loan and a credit facility, and itwas made in conjunction with a financing provided by AmericanExpress. The US Airways deal, also signed in November, was acomprehensive agreement on aircraft leasing and financing andengine services. It provided $140m in interim liquidity, deferral ofdebt and lease payments coming due over six months and leasesfor new RJs, while preserving the vast majority of US Airways'mainline fleet owned by GECAS.
In the first place, GE's motive is obviously to try to keep majorcustomers in business. GECAS has around 94 mainline aircraftand 30 RJs at US Airways, and it would be a nightmare scenario

Aviation Strategy
Analysis
2
Aviation Strategyis published 10 times a yearby Aviation Economics
at the beginning of the month
Editor:Keith McMullan
Contributing EditorHeini Nuutinen
Subscription enquiries:Julian Longin
Tel: +44 (0)20 7490 5215
Copyright:Aviation Economics
All rights reserved
Aviation EconomicsRegistered No: 2967706
(England)
Registered Office: JamesHouse, LG 22/24 Corsham St
London N1 6DRVAT No: 701780947
ISSN 1463-9254
The opinions expressed in this publica-tion do not necessarily reflect the opin-
ions of the editors, publisher or contribu-tors. Every effort is made to ensure thatthe information contained in this publica-tion is accurate, but no legal reponsibilityis accepted for any errors or omissions.
The contents of this publication, either inwhole or in part, may not be copied,
stored or reproduced in any format, print-ed or electronic, without the written con-
sent of the publisher.
May 2005
to have to take them all back. However, UBSanalyst Robert Ashcroft pointed out in arecent report that GE's support was not nec-essarily an endorsement of that airline'slong-term future; rather, it may be a way ofensuring a "soft landing" for GECAS relativeto its exposure to that carrier. That certainlyseems to be the case with US Airways,because GE is reducing its exposure whilehelping the airline.
The other notable recent cases of suppli-er assistance involved two regional airlines.In February, an investment entity owned byAir Wisconsin provided a $125m debtor-in-possession (DIP) loan to US Airways, whichwill convert to equity upon emergence fromChapter 11. In March, Republic Airways andits majority shareholder Wexford Capitalmade a provisional commitment to also pro-vide $125m in new equity funding to USAirways, plus an optional $110m from thesale of EMB-170s. However, the latter is avery soft commitment in that Republic canpull out if it does not like US Airways' busi-ness plan or if US Airways fails to raise atotal of $500m in Chapter 11 exit funding.
All of these deals at US Airways wouldobviously be renegotiated and revised, pos-sibly involving added investment from theregional airlines, in the event that USAirways and America West reach agreementon a merger (see page six in this month’sissue).
The regional carriers' motives are simple:to keep or obtain new business for their RJfleets. Air Wisconsin, worried that it was los-ing its UAL contract (which it did), wantedsomewhere new to place its 50-seat RJs.Republic, an old-established feeder partnerfor US Airways, wanted to safeguard itsfuture role.
There is something odd about the region-al carriers needing to invest in a failing majorlegacy carrier. It reflects on their changedfortunes (except that most of them continueto post healthy profits). Only a couple ofyears ago they were in great demandbecause of their RJ fleets. Now, as JPMorgan analyst Jamie Baker noted recently,they have to pay a "$125m cover charge tojoin the party". Baker also noted thatPinnacle, another regional carrier, recently
had to pay $15m to Northwest to "circum-vent the negotiating process".
The GE factor
However, it is GE's spectacular interven-tion that has caused a lively debate in recentmonths. Ashcroft, who has been most vocalon this subject among the analysts, has crit-icised GE for the major role it has played in"changing airline downturn dynamics" in theUS. Aircraft financing agreements are suchthat airlines can only get rid of aircraftthrough Chapter 11 or Chapter 7. GE's res-cue deals have prevented Chapter 11 andChapter 7 filings, which has kept excesscapacity in the industry. This in turn sup-presses fares, which reduces earnings andultimately depresses airline stock prices.
These concerns also reflect a realisation,over the past couple of months, that the USlegacy carrier sector is headed for a liquiditycrunch next winter. A combination of high oilprices, excess capacity, LCC competition,ticket prices at historic lows and a slowingeconomy (a new problem) means that thefrantic additional cost-cutting now beingimplemented will not be enough to stave offhuge losses. As a result, of the currently sol-vent legacy carriers, Delta and Continentalare likely to end the year with dangerouslylow cash reserves (in the $500-700m range)unless they can raise additional funds.Northwest might be on the borderline with$1-1.3bn liquidity at year-end - its key chal-lenge is to secure labour concessions.
American is an important exceptionamong the currently solvent legacy carriers.The consensus is that, at the current fuelprices, it has sufficient liquidity to ride out2005 through to the spring of 2006 withoutraising cash or approaching its unions forfurther labour concessions (something that itis expected to have to do at some point).Baker estimates that AMR will end the yearwith a comfortable cash balance of $2bn, butthat it may still try to raise $350m in long-term debt this year.
Delta is now a possible Chapter 11 can-didate this autumn, based on its liquidityposition and limited ability to raise funds -

the company formally warned about such apossibility in an SEC filing in early May. Theconsensus is that Delta's fortunes could bedifferent had US Airways liquidated this pastwinter, as had been widely expected. Itwould have provided an immediate substan-tial (short-term) revenue boost for Delta,which has the highest exposure to USAirways among the legacy carriers.Independence Air's disappearance wouldhave further helped the situation.
However, GE is not entirely to blame ifDelta fails to remain solvent. The airline'sfortunes hinge heavily on the US Congresspassing the recently proposed pensionreform laws, which would allow companiesto spread funding over 25 years instead ofthe current four if they freeze their plans.According to Merrill Lynch analyst MikeLinenberg, that should mitigate a $3.15bncash funding requirement for Delta in 2006-2008.
S&P analyst Philip Baggaley has beenwarning for some time that UAL and USAirways shedding their pension plans, whichhas now happened, could have a dominoeffect on the rest of the industry. The combi-nation of that, the scale of the first-quarterlosses and the generally grim outlook ledBaggaley to warn in late April of the possibil-ity of a "broader wave of bankruptcies".
Bailouts by suppliers and other interestedparties are nothing new in the airline indus-try. In particular, aircraft manufacturers havea long history of providing support for theircustomers and have played a very importantrole in allowing order cancellations anddeferrals since September 11.
GE itself has always been very proactivein helping its customers. Among the earlierdeals, it helped Continental out of Chapter11 in the early 1990s by providing exit fund-ing. More recently, it has provided financingto America West, Air Canada and UAL.
There are also new types of suppliersemerging to provide support for airlines -notably credit card issuers and processors.Frequent-flyer credit cards are among themost lucrative of all cards, giving issuersstrong incentives to support airlines.
Other industry observers have noted thatUS Airways' disappearance would not have
helped the industry capacity situation forvery long, because LCCs would have quick-ly filled the void.
Consequently, GE is not likely to changeits behaviour. Ashcroft expects it to continueto assist those airlines to which it has highexposure, "even when those airlines appearconventionally fully-encumbered". This ispotentially good news for Continental andAWA, where GECAS has around 90 and 60aircraft respectively, and perhaps Northwest(12 mainline aircraft and 84 RJs). GE wouldprobably not extend credit on an unsecuredbasis, but it would be motivated to be cre-ative. One potential scenario suggested byAshcroft is Continental monetising its owner-ship in Continental Micronesia and GECASparticipating in the deal as a way of protect-ing its existing exposure.
While access to the capital markets iscurrently impossible or too expensive (andthere is a general lack of unencumberedassets), Continental may be able to do aconvertible debt offering this year. Of course,many of the airlines should be able to refi-nance debt, particularly given that asset val-ues are on the upswing.
Asset sales are likely to play a greaterrole this year. For all its troubles, Delta stillhas marketable assets, particularly its twowholly owned regionals Comair and Atlantic
Aviation Strategy
Analysis
May 20053
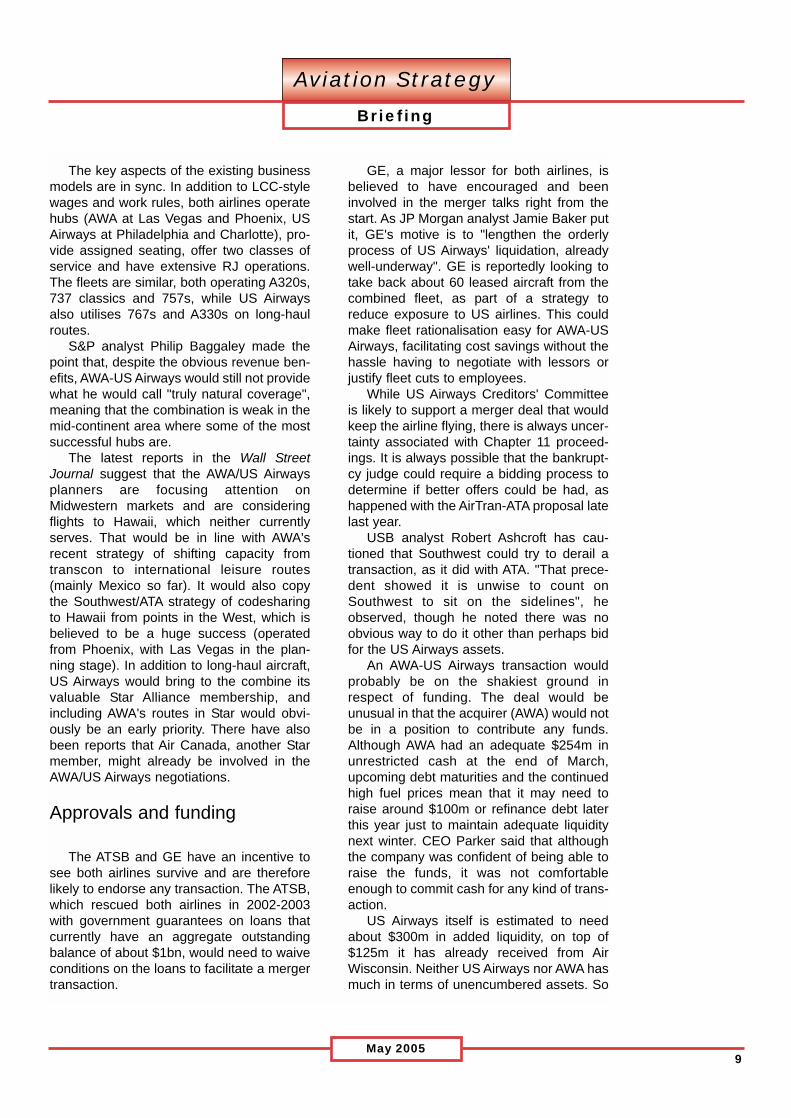
Carrier Mainline Regional TotalAmerican 24 24
America West 60 60Continental 99 99
Delta 32 32JetBlue 6 6
Southwest 5 5Northwest 12 84 96
United 15 15US Airways 94 30 124
Other 101 159 260GECAS Total 448 273 721Boeing Capital 140 140
ILFC 95 95GATX 50 2 52
CIT 43 4 47Other Lessors 288 28 316
Grand Total 1,064 307 1,371
LESSOR EXPOSURE TOUS PASSENGER CARRIERS
Source: Airclaims CASE Feb 14, UBS

Aviation Strategy
Analysis
May 20054
Emirates is positioning itself as the lowcost, long-haul global airline. It accounts
for almost one-third of the firm orders for theA380, and is set to match Lufthansa's long-haul capacity by 2010. As the chart oppositeindicates, Emirates' unit operating cost isabout 40% lower than the lowest costEuropean major, KLM. It derives its costadvantage from:• Its business model is focused purely onlong-haul aircraft, which eventually will beable to connect any two points around theglobe through its 24-hour hub at Dubai; theaverage unit costs of its rivals are pushed upby their short-haul operations. • The zero tax rate in Dubai is a majoradvantage both in terms of corporate taxesand personnel costs.• It has not acquired legacy costs.Emirates is less than 20 years old, so it doesnot have the long-standing working practicesand pension arrangements that burdenmany airlines. Also, unions have little rele-
vance and strikes are extremely unusual inthe UAE.• It is a dollar-based carrier. The UAEdirham is pegged to the US dollar, whoserecent dollar weakness has accentuated thecarrier's cost advantage.
Strategic direction
Emirates has a clearly defined strategy:namely, to create a long-haul transfer hub inDubai, which is capable of connecting anytwo points on the globe. Emirates' strategyis unique in that it plans to serve the con-necting market with just long-haul aircraft,whereas most hubs in Europe and the UShave an expensive short-haul network (gen-erally competing against LCCs) feeding intoa hub. Hub-and-spoke networks generallyconsolidate short-haul traffic into long-hauloperations but Emirates mainly has long-haul traffic flows (just 20% of revenue is
Emirates: the long-haul,low cost carrier
Year to March 1998 1999 2000 2001 2002 2003 2004 2005E 2006E 2007E 2008E 2009E 2010E 2011E 2012EA310/A300 16 12 10 8 2 1 1 0 0 0 0 0 0 0 0
A330-200 2 9 16 25 29 29 29 29 25 19 18 17 15777-200/200ER/300 3 7 9 11 13 20 21 21 21 21 21 21 21 21 21
777-300ER 2 14 25 30 30 30 30 30A340-300 6 8 8 8 8 8 8 8 8A340-500 4 8 10 10 10 10 10 10 10A340-600 4 10 12 12 12A380-800 6 12 20 30 39 45
747F 4 5 6 6 6 6 6 7 7 8Total 19 19 21 28 31 50 66 74 88 105 116 124 136 144 149
Source: Emirates, UBS estimates
EMIRATES’ FLEET PROGRESSION
Southeast (ASA). SkyWest, Delta's partnerand one of the financially strongest USregionals, disclosed in March that Delta hadexpressed an interest in selling one or bothof them. In Ray Neidl's estimates, the twoairlines could raise $600-800m.
Neidl also estimated that Continentalcould raise $600m through the monetisationof its Pacific subsidiary, the sale of its 49%
stake in Copa Airlines and the sale of itsremaining 8.5% in ExpressJet. He noted thatother estimates have valued those assets atup to $1.2bn. Northwest, in turn, could raisearound $75m from the sale of its remainingstakes in Pinnacle and Mesaba and $200mfrom the monetisation of some Japanesereal estate and its vacation wholesaler.

derived in the Middle East).The strategy is being augmented by
increased point-to-point demand to/fromDubai, which is being assisted by thedevelopment of tourism infrastructure.Emirates, in conjunction with the govern-ment, is promoting Dubai as a leisure des-tination. In 2003, there were 5m hotelguests in Dubai compared with less than1m in 1992. The government is targeting 15million by 2012.
The Government of Dubai is attemptingto diversify its economy from traditional oil-related industries and the rapid develop-ment of Emirates is a key part of this strat-egy. It has a $33bn investment programmein infrastructure (including the airport),technology, tourism, and knowledge/health.Indeed, a measure of the scale of the com-mitment to tourism can be seen in the invest-ment in "Dubailand", at the present worth$5bn.
Slated as a "Disney in the Desert", it willbe double the size of Disneyworld inOrlando, Florida. To date, this investmentprogramme has been successful, asbetween 1990 and 2003; Dubai's economygrew at a CAGR of 8%, driven by increasesin trade, industrial output, shipping, and airtransport.
This connecting strategy takes advan-tage of the geographical position of Dubai,which is approximately equidistant from themajor cities of Europe and the Asia Pacific.Furthermore, using the new Airbus A340-500, Emirates can now serve Australia andthe US direct and economically from Dubai,significantly improving the attractiveness ofthese services, particularly for businesstravellers.
For example, Emirates recently intro-duced the A340-500 on the Dubai-Sydneyand the Dubai-Melbourne routes, allowingnon-stop service. Emirates is now aggres-sively marketing Dubai as a convenientalternative for both business and leisurepassengers heading to Australia. This is ofmost concern to British Airways, whichdeploys around 3% of its long-haul seatcapacity on the Australian market (this is thecapacity BA operates to Australia; it doesnot include the capacity BA has access to
through the Joint Services Agreement withQANTAS). Australia has become a key mar-ket for Emirates (excluding Dubai, about12% of seat capacity is deployed in this seg-ment) and ongoing growth is expected.
However, the primary engine for medi-um-term growth is expected to be India.Emirates is the largest foreign airline inIndia, operating to 12 destinations on theIndian subcontinent, which accounts for20% of its capacity (excluding Dubai). Therapid growth of the Indian economy and thisstrong market position should underpin thegrowth of Emirates.
Of course, if the Indian economy falters,Emirates would be forced to switch capacityonto more mature routes, which would benegative for the industry in general.
The main geographical weakness forEmirates has been North America. Onceagain, the Airbus A340-500 has helpedEmirates address this issue. Direct ser-vices from New York to Dubai were intro-duced last year. In addition to the flows ofmainly business passengers from NorthAmerica to the Middle East, this service is aconvenient connection for the significanttraffic flows between North America and theIndian subcontinent. Emirates intends totake a material share of these markets byintroducing direct flights from Dubai toWashington, Toronto, Los Angeles andBoston.
Aviation Strategy
Analysis
May 20055
20
30
40
50
60
70
80
90
100
500 1,000 1,500 2,000 2,500 3,000 3,500 4,000 4,500
Unit cost/atk(USc)
Triplength(km)
TOTAL UNIT OPERATING COST VERSUSTRIP LENGTH, 2003*
IB
AZ
AYAF
EZ
BA KL
OS
LH
Source: Company accounts, UBS estimates. Note: *= EK to year-end March 2004
EK

Emirates growth is to some extentdependable on favourable regulatory devel-opments. Political and/or bureaucratic obsta-cles could inhibit the growth of Emirates. Forexample, Emirates currently only has theright to fly to Paris once a day whereas itflies to Frankfurt twice a day (in addition toflying to a number of other German cities).Such restrictions in France are somewhatsurprising, given the importance of Emiratesto Airbus. That said, rapid global deregula-tion would present concerns for Emirates.The bilateral system has led to some mar-kets being underserved on a point-to-pointbasis. This means that the excess demandspills to hubs such as Dubai. A case in pointis the UK-India market, which British Airwayshas described as "grossly underserved". Arecently renegotiated bilateral agreementhas materially increased the amount ofallowed capacity on this route, which couldlead to market share degradation forEmirates.
The other possible threat to Emirates
comes from potential overcapacity in theMiddle East long-haul market as three localrivals attempt to emulate its success.
Etihad Airways: Set up by theGovernment of Abu Dhabi, it started opera-tions in 2003 and has plans to grow to 50 air-craft by 2009. It currently has on order five777-300ERs, 12 A330-200s, eight A340-500/600s, and four A380-800s aircraft.
Qatar Airways: Owned 50% by theGovernment of Qatar, it currently has an allAirbus fleet of 34 aircraft, with a further 23 onorder (one A320-200, seven A330-200s, 11A330-300s, two A340-600s and two A380-800s). It more than doubled passengers andrevenues between the financial year endedMarch 2002 and the year ended March2004, when it posted total revenue ofUS$605m.
Gulf Air: Operating as the national carri-er of Bahrain, Oman and the UAE. Its fleetconsists of 19 widebody and 11 narrowbodyaircraft. After four years of losses the carrierproduced a marginal profit in 2004.
Aviation Strategy
Analysis
May 20056
America West-US Airways:scepticism over “Project Barbell”US Airways and America West (AWA), the
seventh and eighth largest US carriers,confirmed recently, in response to pressspeculation, that they are in discussionsregarding a potential merger. No detailshave been disclosed, but press reports citing"people familiar with the talks" have sug-gested that the idea is to create a newnational, AWA-managed LCC that wouldrival Southwest in size. Such a deal wouldeffectively rescue US Airways, which needsadditional equity funding for Chapter 11 exitbut is struggling to come up with an accept-able business plan in the current high fuelcost environment.
It is hard to respond to something like thiswith anything other than extreme scepticism.Over the decades, most airlines - and espe-cially US Airways - have been involved inmerger talks, but such talks hardly evercome to anything. On the rare occasion thatthey lead to a definitive agreement, the
result (in the US at least) is invariably labourturmoil, soaring costs and shareholder valuedestruction.
In the case of AWA/US Airways, therewould be extra potential obstacles. Anymerger deal would have to be approved notjust by the airlines' boards, unions and fed-eral regulators but also by US Airways' cred-itors, US Airways' bankruptcy court and theATSB. It would also be an extremely toughundertaking to raise the estimated $350-500m in new equity funding that the combi-nation reportedly requires.
However, these are very unusual times.As the US legacy airline sector approachesanother potential liquidity crisis in late 2005,labour unions have lost virtually all of theirbargaining power while bankruptcy courtsand middlemen like General Electric (GE)have assumed much control. No matter howunlikely a merger between AWA and USAirways may seem, could GE push such a
Article based on arecent UBS InvestmentResearch note: “What
does Emirates mean forEurope?” by Damien
Horth and TabithaAlwyn

deal through, with help from existing andpotential big-name equity investors such asTexas Pacific and Wexford Capital?
The AWA-US Airways proposal raisesmany intriguing questions. First, given thedismal history of large airline mergers in theUS, why would AWA even want to considerit?
Second, AWA-US Airways would beunlike anything ever seen before - a combi-nation of two mid-size airlines that haveweak cash positions and balance sheets buthave transitioned to LCC-type labour costs.Could that make a viable new LCC type inthe US?
Third, would an AWA-US Airways trans-action lead to a material capacity reduction,helping to raise industry unit revenues?Would it mark the start of the long-overdueindustry consolidation process?
Why would AWA consider it?
Most airline mergers have been difficultand expensive, with complicated fleet andlabour issues. Integrating labour has usuallybeen the hardest part, due to differences inwage levels, benefits or seniority profiles,and solving those issues has tended toincrease costs. Past experience has alsoshown that mergers between weak entitiesare a bad idea. While US Airways is inChapter 11 for the second time in two years,AWA narrowly avoided Chapter 11 inJanuary 2002, when it was rescued by theATSB.
US Airways' motives are entirely clear. Itneeds to boost its revenue forecasts andshow better prospects in its business plan inorder to attract additional investment. Also, adeal with AWA would facilitate a graceful exitfor David Bronner, chairman of 36%-equityholder Retirement Systems of Alabama(RSA) and his temporary management teamat US Airways.
By contrast, AWA is actually experiencinga promising financial recovery, thanks toindustry-leading unit revenue trends - partlybecause of a healthier operating environ-ment in the West and partly because oftranscontinental capacity cuts. The airline
incurred a relatively small loss in the firstquarter, accounting for only 1.5% of rev-enues, and is clearly headed for profitability.Analysts say that its stock would be on their"buy" lists without the black cloud of a merg-er hanging over it. Why would AWA want torisk all that?
AWA's CEO Doug Parker, when com-menting on mergers in general terms in thecompany's first-quarter earnings call, sug-gested that several things have changedthat may make airline mergers more suc-cessful than in the past. First, the labour costdifferentials between AWA and some of thehigh-cost legacy carriers have narrowed dra-matically, suggesting that some of the inte-gration hassle may be avoided. Second, withmore legacy carriers in Chapter 11, theprospects for right-sizing fleets in mergersare enhanced. Third, the regulatory environ-ment is now more open towards airlineshelping themselves, as opposed to beinghelped by the government.
It is logical to assume that Washingtonwould now look at airline mergers moreleniently, though other airline CEOs havesaid that they are getting mixed messages.In any case, AWA-US Airways would proba-bly easily pass muster with the regulatorsbecause of the scant route overlap and theLCC status.
However, regarding labour integration,analysts have pointed out that, while AWA
Aviation Strategy
Briefing
May 20057
6
7
8
9
10
11
12
Q1 Q2 Q3 Q4
USc/ASMAWA AND US AIRWAYS:
UNIT REVENUES AND COSTS 2004
US rev.
US cost
AWAcost
AWArev.

and US Airways now have similar wagerates for most groups, they have significant-ly different seniority profiles. US Airways hasa much older work force, as AWA was onlyfounded in 1983. This could pose thornylabour issues at AWA, creating an odd situa-tion where the acquirer's workers could loseout to their counterparts at the target airline.
Of course, AWA and US Airways havematerially different overall cost structures.AWA is an LCC, with CASM of 8.29 cents inthe first quarter with an average stage lengthof 1,022 miles. US Airways had CASM of10.89 cents (average stage length 768miles) in the first quarter. However, USAirways' CASM declined by an impressive6.8% year-over-year despite higher fuelprices, and it is no longer totally out of linewith other legacy carriers' unit costs.
Although AWA's leadership insists thatthe airline could survive in the long term as astand-alone entity, the merger talks areprobably driven by concerns about strategicweaknesses. There would appear to bethree key issues. First, as other legacy carri-ers' costs come down, AWA's cost advan-tage diminishes. Second, AWA has a geo-graphically limited network. Third, the legacycarriers' fare reform, such as Delta's recentSimpliFares, may have the worst impact oncarriers such as AWA and ATA, whichdepend heavily on connecting traffic that hasbeen attracted by undercutting legacy carri-ers' nonstop fares. (AWA has so far reportedminimal impact from SimpliFares, but it isearly days yet.)
In recent months Doug Parker has spo-ken frequently about the industry's need toconsolidate and AWA's desire to play a partin it. In late 2004 AWA considered bidding forATA but backed away mainly because theassociated aircraft leases were too expen-sive (Southwest ended up with a smallerdeal with ATA). Subsequently, Parker pre-dicted that there would be many more merg-er opportunities, suggesting that the numberof LCCs in the US would whittle down fromthe current 7-8 to 2-3 in the next few years.
That said, Parker made it clear in thefirst-quarter call that AWA would be extracareful to preserve its hard-worked-for LCCstatus, saying that the "guiding principle in
any transaction is that it may not put thatwork at risk".
New merger structures?
Several analysts have suggested that theonly way AWA and US Airways could avoidserious integration issues is to structure thetransaction as a "partnership" or "holdingcompany", rather than as a conventionalmerger. Ray Neidl of Calyon Securities sug-gested that such structures could produceup to 80% of the benefits of a merger with-out many of the risks and costs.
There are now examples of the holdingcompany structure among large airlines inEurope, most notably Air France-KLM andLufthansa-Swiss, where the airlines havekept their own identities but cooperate inplanning, marketing and yield management,as well as the usual codesharing. In thesecases the short, or even medium, termscope for cost-cutting rationalisation is stillgreatly limited by national and union consid-erations.
Northwest's CEO Doug Steenland, whenasked about mergers in the company's first-quarter call, called the European models an"interesting development". He pointed outthat the US mainline-regional relationshipsare already based on a similar model, that itworks well and that he would not be sur-prised to see the approach tried among thelarger carriers.
Potential synergies
In many ways, an AWA/US Airways com-bination would make a lot of sense. AWAoperates mainly on the West Coast and USAirways on the East Coast - hence the name"Project Barbell" for the talks. In addition toexpanding the networks of both airlines andhelping their transcontinental services, itwould be an opportunity to diversify. AWA,which relies heavily on leisure traffic, wouldget more business-type (still higher-yield)traffic, while US Airways could benefit fromaccess to the more stable West Coast envi-ronment.
Aviation Strategy
Briefing
May 20058
The key aspects of the existing businessmodels are in sync. In addition to LCC-stylewages and work rules, both airlines operatehubs (AWA at Las Vegas and Phoenix, USAirways at Philadelphia and Charlotte), pro-vide assigned seating, offer two classes ofservice and have extensive RJ operations.The fleets are similar, both operating A320s,737 classics and 757s, while US Airwaysalso utilises 767s and A330s on long-haulroutes.
S&P analyst Philip Baggaley made thepoint that, despite the obvious revenue ben-efits, AWA-US Airways would still not providewhat he would call "truly natural coverage",meaning that the combination is weak in themid-continent area where some of the mostsuccessful hubs are.
The latest reports in the Wall StreetJournal suggest that the AWA/US Airwaysplanners are focusing attention onMidwestern markets and are consideringflights to Hawaii, which neither currentlyserves. That would be in line with AWA'srecent strategy of shifting capacity fromtranscon to international leisure routes(mainly Mexico so far). It would also copythe Southwest/ATA strategy of codesharingto Hawaii from points in the West, which isbelieved to be a huge success (operatedfrom Phoenix, with Las Vegas in the plan-ning stage). In addition to long-haul aircraft,US Airways would bring to the combine itsvaluable Star Alliance membership, andincluding AWA's routes in Star would obvi-ously be an early priority. There have alsobeen reports that Air Canada, another Starmember, might already be involved in theAWA/US Airways negotiations.
Approvals and funding
The ATSB and GE have an incentive tosee both airlines survive and are thereforelikely to endorse any transaction. The ATSB,which rescued both airlines in 2002-2003with government guarantees on loans thatcurrently have an aggregate outstandingbalance of about $1bn, would need to waiveconditions on the loans to facilitate a mergertransaction.
GE, a major lessor for both airlines, isbelieved to have encouraged and beeninvolved in the merger talks right from thestart. As JP Morgan analyst Jamie Baker putit, GE's motive is to "lengthen the orderlyprocess of US Airways' liquidation, alreadywell-underway". GE is reportedly looking totake back about 60 leased aircraft from thecombined fleet, as part of a strategy toreduce exposure to US airlines. This couldmake fleet rationalisation easy for AWA-USAirways, facilitating cost savings without thehassle having to negotiate with lessors orjustify fleet cuts to employees.
While US Airways Creditors' Committeeis likely to support a merger deal that wouldkeep the airline flying, there is always uncer-tainty associated with Chapter 11 proceed-ings. It is always possible that the bankrupt-cy judge could require a bidding process todetermine if better offers could be had, ashappened with the AirTran-ATA proposal latelast year.
USB analyst Robert Ashcroft has cau-tioned that Southwest could try to derail atransaction, as it did with ATA. "That prece-dent showed it is unwise to count onSouthwest to sit on the sidelines", heobserved, though he noted there was noobvious way to do it other than perhaps bidfor the US Airways assets.
An AWA-US Airways transaction wouldprobably be on the shakiest ground inrespect of funding. The deal would beunusual in that the acquirer (AWA) would notbe in a position to contribute any funds.Although AWA had an adequate $254m inunrestricted cash at the end of March,upcoming debt maturities and the continuedhigh fuel prices mean that it may need toraise around $100m or refinance debt laterthis year just to maintain adequate liquiditynext winter. CEO Parker said that althoughthe company was confident of being able toraise the funds, it was not comfortableenough to commit cash for any kind of trans-action.
US Airways itself is estimated to needabout $300m in added liquidity, on top of$125m it has already received from AirWisconsin. Neither US Airways nor AWA hasmuch in terms of unencumbered assets. So
Aviation Strategy
Briefing
May 20059

a significant amount of external fundingwould be required, consisting essentially offull risk bearing equity funding.
In recent weeks the airlines have report-edly approached and met with numerouspotential equity investors - private equityfirms, existing creditors and regional carriers- many of which US Airways had alreadyapproached about providing Chapter 11 exitfunding. The list includes some very bignames, notably Texas Pacific Group (whichhas a 55% voting stake in AWA) andWexford Capital, which earlier made a provi-sional commitment to invest $125m in USAirways when it emerges from Chapter 11.Of course, further funding from RSA isalways possible, even though the pensionfund has written off its existing investment.
As always, but especially in this kind ofmerger scenario, it would all depend on AWAand US Airways coming up with a viablebusiness plan.
Industry implications
Mergers in the past have not tended toremove much capacity, but an AWA-USAirways combination could lead to a modestreduction. Analysts estimate that the 60-air-craft removal by GE would amount to per-haps 1% of industry capacity. On the positiveside, those aircraft would probably go over-seas.
Many people have noted that USAirways' outright liquidation would be muchmore helpful for the industry in terms ofexcess capacity reduction. However, in sucha scenario most of the aircraft, gates androutes would probably be taken up by LCCs.So any overall capacity reduction would onlybe temporary. In the longer term, the benefitwould be that the assets are in more efficienthands.
Even in a merger scenario, it is likely thatsome assets, such as gates and perhapsregional aircraft, could be put up for sale asthe two airlines eliminated duplicate serviceand facilities.
The combination would have respectablemarket mass - Ashcroft noted that a fleet of340 (excluding the 60 GE aircraft) would
make it about the same size as Continental,though the average aircraft size would besmaller.
The combination would be heavilyexposed to Southwest at three key hubs(Philadelphia, Phoenix and Las Vegas), andthere is little doubt which side would win themarket share battles. As Jamie Baker put it:"While the notion of building a supposedlow-cost carrier capable of rivallingSouthwest may have a nice ring to it, anyresulting balance sheet would most certainlypale in comparison to Southwest's".
No one is expecting any AWA-USAirways merger to lead to a round of indus-try consolidation. Philip Baggaley made thepoint that many of the legacy carriers haveexperience of difficult mergers in the pastand they certainly have their hands full deal-ing with losses. There is a lack of three keythings required for a successful merger:management time, money and goodwill onthe part of employees.
However, in the first-quarter conferencecalls most legacy carrier CEOs predictedthat the competitive landscape wouldchange significantly in the next 12-18months. Consolidation is likely to take manydifferent forms - also asset buyouts and liq-uidations. Many in the industry feel thatasset buyouts may dominate, because thatseems to be the method preferred by thestrongest LCCs.
Southwest's CEO Kelly told Reuters in arecent interview that there were no plans toinvest in another airline, even though theATA partnership was showing good results.For the moment, Southwest is interested inselected gate acquisitions at airports likePhiladelphia, as well as 737s that might besold by another airline.
JetBlue is mainly interested in gates andslots that may become available, accordingto its top executives. With such acquisitionspartly in mind, the airline recently completeda $250m convertible debt offering. "We havethe cash to be able to do some things but notmerge with another airline - that is out of thequestion for us", CEO David Neeleman com-mented in the company's first-quarter earn-ings call.
Aviation Strategy
Briefing
May 200510
By Heini [email protected]

bmi broke back into pre-tax profit in 2004after two years of losses, yet two of its
three shareholders are believed to be seek-ing an exit. Does shareholder uncertaintyimply the future for the bmi group is less thansecure?
bmi's origins date back to 1938, but theairline was named British Midland Airways in1964 before turning into bmi in 2002. Todaythe bmi group comprises bmi (the main air-line), bmi Regional and bmibaby (its LCC),and altogether it operates a fleet of 59 air-craft out of the UK.
Run conservatively by management, theairline made steady - if unspectacular - prof-its through the 1990s (see Aviation Strategy,March 1998). However, following September11, the group posted a pre-tax loss of£19.6m in 2002 - its first pre-tax loss in adecade. In 2003 passengers carried rose25%, resulting in a 6.6% rise in revenue to£772m and a trimming of the pre-tax loss to£9.8m, although the Gulf war badly affectedtransfer traffic from bmi's Star alliance part-ners at London Heathrow, costing the grouparound £17m.
In addition to external shocks, the grouphas also been affected by increasing com-petition from the LCCs. In the late 1990s,Austin Reid - CEO at bmi since 1985 - wassceptical about the challenge of the low costcarriers, arguing that there was very littleevidence that the LCCs were making money.Reid resigned in October 2004, a year earli-er than planned due to "personal reasons".Although bmi claimed the change was rou-tine, some analysts saw the early exit ofReid as part of an attempt by long-timemajority owner Sir Michael Bishop to re-establish greater control over the group.
Nigel Turner, bmi's CFO since 2001,replaced Reid and his appointment wasaccompanied by an overhaul of the groupmanagement team. This included theappointment of bmi legal affairs director TimBye as deputy chief executive and bmi
Regional managing director Alex Grant aschief operating officer. Following the man-agement changes, in January this year bmigroup launched a wide-ranging strategicreview, including an analysis of Europeanroutes out of London Heathrow as well as oflong-haul strategy.
The review was initiated just before bmigroup reported a pre-tax profit of £2.1m for2004 (see graph, page 12). Turnover in 2004rose 7.6% to £830m, based on an 11%increase in passengers carried, to 10.5m.Group ASK growth of 7% in 2004 was out-stripped by a rise in RPKs, resulting in loadfactor increasing by three percentage pointsto 70%. However, at an operating level thegroup recorded its fourth consecutive year oflosses, partly due to rising fuel costs. Evenafter hedging more than 80% of its fuelneeds in 2004, rising fuel prices cost thegroup £11.1m, although half of this wasrecovered through passenger fuel sur-charges (which were raised yet again in Aprilthis year). But results would have been farworse if it wasn't for a major cost cuttingpush.
Cost push
Called Blue Sky, bmi group's cost-cuttinginitiative aims to reduce costs by £100mover the three-year period to the end of2006, with £34m in savings targeted in 2004,£26m in 2005 and £40m in 2006. The 2004target was achieved, with savings comingfrom fleet harmonisation (an all-Embraerfleet at bmi Regional and an all-737 fleet atbmibaby), better aircraft utilisation and theintroduction of self-service check-ins.
bmi also closed its call centre at EastMidlands airport in 2004 after the number ofcalls handled fell by 40% in three years,thanks to the rise of internet bookings. bmi'swebsite was redesigned and relaunched inthe summer of 2004, complete with a new
Aviation Strategy
Briefing
May 200511
bmi: who’s goingto be holding the baby?

internet booking engine. This was part of aconsolidation of a number of IT contractsinto one central outsourcing contract withFujitsu Services, in a 10-year deal worth anestimated £60m. Interestingly, this partlyincludes variable payments - e.g. the fee forFujitsu's provision of the website and book-ing engine depends on the amount of book-ings processed through the site. Accordingto Richard Dawson, bmi's IT director, this willachieve "significant savings" and is part of aphilosophy "to correlate prices [i.e. costs]with business activity".
As for labour costs, other than by naturalwastage, bmi has promised that cost cuttingwill not result in job losses among thegroup's 4,800 staff, 2,700 of which areemployed by the main airline and bmiregional (1,600 of those are based atLondon Heathrow) and 2,100 of which workat bmibaby. bmi offered a 1.5% pay rise tostaff in 2004, which was accepted by allemployees other than the pilots. The BritishAir Line Pilots Association (BALPA) mem-bers at the main airline were reluctant toaccept the percentage rise, and an indicativeballot of members last year suggested "over-
whelming" support for industrial action ifneeded. However, after negotiations carriedon into 2005, a deal was eventually agreedbetween the two sides in February, which aunion source says "was higher than man-agement's initial offer".
Overhead costs per ASK fell by 20% inboth 2002 and 2003 - perhaps an indicationof the bloated nature of bmi group in the firstplace - and overall unit costs fell by 15%over the same period, and by another 15%in 2004. But again - as with virtually everyother airline in Europe - bmi has to continu-ously drive down costs as yields continue tofall. At a group level, yield fell in both 2002and 2003, although it did remain level year-on-year in 2004. However, bmibaby's yieldrose 4.1% in 2004 and as bmi Regional'salso improved during the year, this meansthat yield fell yet again at the mainline bmioperation.
Mainline woesBased at London Heathrow, the mainline
bmi is a legacy airline that holds 14% of takeoff and landing slots at the airport. These areused on operations to more than 20 destina-tions across the UK and Europe, althoughjust three destinations were added in 2004 -to Aberdeen, Inverness and Naples.However, this is precisely the short-haulmarket targeted so effectively by Ryanair atLondon Stansted and easyJet out of LondonGatwick.
bmi is currently in a long running argu-ment with the UK CAA over a proposed 40%increase in charges at London Heathrow inorder to pay for the construction of the fifthterminal. bmi accuses the CAA of a "derelic-tion of duty" in allowing the airport operator,BAA, to levy the charges for a terminal thatwill be used by BA, while bmi and its Starpartners will be moved to ageing terminalsone and two. As well as a reduction in thecharges, bmi is lobbying BAA to at leastallow Star carriers to combine all their flightsinto one terminal, thereby allowing "parity"with BA's facilities.
For short-haul, bmi operates a fleet of 27Airbus and Fokker aircraft. In February 2004the first of six A319s leased from ILFC was
Aviation Strategy
Briefing
May 200512
700725750775800825850
2001 2002 2003 2004
£m BMI GROUP’S REVENUES..
-30-25-20-15-10-505
1015
2001 2002 2003 2004
£m ..AND FINANCIAL RESULTS
Op.result
Pre-taxresult

delivered to bmi, all of which will arrive bythe autumn of 2005. The A319s are replac-ing Fokker 100s and a couple of A321s aspart of drive to convert the short-haul fleetinto an all Airbus operation, which will becompleted this summer. bmi is also lookingat the A319LR as a potential aircraft forpoint-to-point medium-haul routes.
But while fleet harmonisation will improveunit costs, the short-haul mainline operationcontinues to face increasing competitionfrom the LCCs, not just in London, but alsoat bmi's other main UK base, East Midlandsairport, where easyJet and Ryanair arebuilding up their route network. And there isalways the challenge of British Airways,which is becoming much more price com-petitive on short-haul Europe routes.Competition contributed to a decline in busi-ness class passengers on bmi's mainlineHeathrow routes in 2004, and fare wars areso fierce that one of the options under con-sideration by the bmi group in the currentstrategic review is turning short-haul main-line operations into a one-class product.British Midland was a pioneer of businessclass on European routes, yet bmi is findingthat over the last few years business trav-ellers have not just switched from businessclass to economy as a temporary measure,but as a permanent trend.
This highlights bmi's key strategic prob-lem that it cannot fully take advantage of thegroup's major asset - the slots at LondonHeathrow. With business class passengersand yield falling on European routes, the air-line would love to switch valuable slots overto long-haul operations. Yet it has long beenfrustrated in its ambition to launch serviceson the lucrative UK-US sector out of LondonHeathrow by the Bermuda II bilateral, whichrestricts the number of airlines on the sectorto four, with BA and Virgin being the desig-nated UK carriers.
After receiving three A330s in 2001 - butfailing to win rights to operate out of LondonHeathrow to the US - bmi instead launchedlong-haul operations out of Manchester toChicago and Washington DC in the summerof that year. These are both hubs for United,which bmi has codeshared with since 1992.The two routes made a loss of around £1m
in 2003, but are believed have been close tobreak even in 2004. Last year bmi built onthese initial services through the launch ofroutes to Toronto in April in co-operation withStar partner Air Canada, and to Las Vegas inOctober. Routes from Manchester to threeCaribbean destinations - Barbados, St Luciaand Antigua - also started in November 2004(and are reaching load factors of 80%). Thelaunch of five routes in 2004 ensured thateven with vastly better aircraft utilisation(there are now more than 40 flights a weekout of Manchester), the long-haul businesswas again unprofitable in 2004.
The Star alliance is crucial to bmi's long-haul business - interline revenue totals morethan £100m a year, though with United andAir Canada in financial trouble, the depen-dence of bmi on interline traffic from thesecarriers at Manchester is worrying. That'swhy the US still remains the major long-haultarget for bmi out of London Heathrow, par-ticularly as the UK accounts for 40% of alltraffic between the US and Europe.
In the meantime, bmi's first-ever long-haul route out of London Heathrow will startin May with a service to Mumbai - althoughinitially not with the number of frequenciesthat bmi wants. After the UK and Indiasigned a liberalised bilateral in September2004, bmi, Virgin and BA applied for 21 addi-tional weekly frequencies between the coun-tries at a UK CAA hearing in December.Previously, BA controlled all 19 of the autho-rised weekly services between the UK andIndia, while Virgin Atlantic operated threetimes a week on London-Heathrow-Delhi viaa codeshare with Air India. In a market that itestimated to be worth £200m a year in rev-enue (with UK visitors accounting for 16% ofall travellers to India), bmi wants to operatea daily service to Mumbai and six times aweek to Bangalore, and told the CAA that itwould undercut BA's current fares by 10%.
bmi was therefore unhappy with theCAA's decision to allocate bmi just fourflights a week to Mumbai out of LondonHeathrow, with 10 weekly flights going toVirgin (which will now operate the route itselffollowing the expiry of its codeshare with AirIndia) and another seven to BA. bmi - alongwith BA and Virgin - appealed against the
Aviation Strategy
Briefing
May 200513

decision, but in March the UK governmentupheld the CAA's allocation, However, theUK and Indian governments started anotherround of bilateral negotiations in April, andthey quickly agreed to increase the numberof frequencies between the countries byanother 44 flights a week over the next 18months. bmi is confident it will operate adaily service within that timeframe, butdespite a suggestion that bmi and Virginshould in the meantime co-operate on a jointroute, bmi insists it will launch the route onits own in mid-May.
The Mumbai service will be followed laterin the summer by a three times a week ser-vice between London Heathrow and Riyadh,which bmi hopes will pick up demand nolonger served by BA since it axed its SaudiArabia routes in March due to securityissues, which it said was hitting profitability.
However, these two routes will severelystretch bmi's long-haul capacity, as it hasjust three A330-200s. bmi did hold optionsfor further A330s, but these were given up.bmi plans to damp lease a 757-200 (i.e. bmiwill provide cabin crew) from Icelandair forthe Manchester-Washington DC, which willfree up an A330 to serve the Mumbai andRiyadh services. This is not ideal, however,as on the Washington DC route the 189-seat757 will provide less capacity than the 244-seat A330, and with the addition of the routeto Riyadh the group will have to add perma-nent long-haul capacity. Another complica-tion comes from the need to get approvalfrom the US FAA for the Icelandair damplease deal on the Manchester-WashingtonDC route - until approval is given, bmi willhave to temporarily suspend its codesharewith United on the service, using only its owndesignator instead.
bmi is also considering long-haul routesto South Africa, possibly in co-operation withfellow Star member SAA. bmi already code-shares with 20 airlines - last year codeshar-ing was started with Singapore Airlines andSri Lanka, while an existing codeshare withGulf Air on UK flights was extended toselected European routes in October 2004,a move that indicates that Gulf Air may jointhe Star alliance in the future. bmi also start-ed codesharing with fellow Star member US
Airways in October 2004.
bmi Regional
Aberdeen-based bmi Regional operatesthree Embraer 135s and 10 Embraer 145son regional routes. As part of bmibaby'slaunch in 2002 (see below), all of bmi'sregional routes out of East Midland airportwere transferred to the LCC. However, dueto lack of demand, some of these serviceshave now been transferred back to bmiRegional, the latest being routes to ParisCDG and Nice, which bmi Regional tookover in March 2005.
In November 2004 bmi Regional restart-ed group operation to London City airportafter a 13-year absence through the launchof a four-times daily route to Leeds Bradford.The service used an ATR 42 leased from AirAtlantique, but although bmi Regional said ithad plans to develop routes and services outof the airport using its Embraer 135s, at theend of April the Leeds Bradford route wasabruptly suspended due to low demand,caused by "the type of aircraft used".Whether further routes will be launched fromthe airport is now open to doubt.
The bmi group describes bmi Regional'sperformance in 2004 as "satisfactory", withpassengers carried increasing last year,although load factor fell "marginally".
bmibaby
In 2001 Austin Reid, then the CEO ofbmi, said that the airline would never launcha LCC as "going from a full service to a bud-get airline is almost impossible". That viewrapidly changed once Go launched opera-tions at bmi's base, East Midlands airport, in2002. In March that same year bmibaby waslaunched at the same airport using a fleet ofthree 737s borrowed from the main airline.At that point bmi announced it was adoptinga "segmentation strategy", based on sepa-rate products for different segments - themainline bmi airline for European short-hauland long-haul; bmi Regional; and the newLCC.
Aviation Strategy
Briefing
May 200514

bmibaby didn't get its own air operator'scertificate until March 2004, which meantthat it did not have operational indepen-dence from its parent until that date, buttoday bmibaby operates to 20 destinationsout of six UK airports - East Midlands,Manchester, Teesside, Cardiff, LondonGatwick and Birmingham - with a fleet of 10737-300s and six 737-500s transferred overfrom its parent.
The LCC will dispose of the 737-500s infavour of an all 737-300 fleet by the end ofthis year, a model that has larger seatcapacity. Three 737-300s were added to thefleet in December 2004, on lease from ILFC,and following the launch of routes fromBirmingham International airport in Januarythis year - which increases bmibaby's routenetwork by more than a third - the airline willlease further 737s in the summer.
Five aircraft will be based at theBirmingham hub (where 150 jobs were cre-ated) by the summer, where currently bmiba-by operates 12 routes - to Alicante,Amsterdam, Belfast International, Bordeaux,Cork, Edinburgh, Geneva, Knock, Malaga,Murcia, Palma and Prague - with anothereight being added by the summer schedule.Altogether, bmibaby expects to carry morethan 1m passengers out of Birmingham in2005.
Although Flybe and MyTravelLite arebased at Birmingham airport, easyJet does-n't have a presence and Ryanair has justone route. However, this wasn't the case atLondon Gatwick, where bmibaby's attemptto establish a hub in April 2004, with plansfor at least 10 routes, was a failure. Theoperation was shut down at the end of 2004in favour of the new base at Birmingham,bmibaby having learnt the hard way thatdirectly taking on easyJet - as well as beingin indirect competition with the mainline bmioperation at London Heathrow - was a mis-take.
bmibaby carried 3.2m passengers in2004, 16% up on 2003, and the LCCexpects to break the 4m barrier in 2005.Load factor rose from 71% in 2003 to 78%last year, after a 9% capacity increase wasmet with a double figure growth in RPKs.Although bmibaby made a loss in 2003, it is
thought to have been close to break even in2004 after yields rose, a trend that is contin-uing into 2005 (yield was up 5.2% in Januarythis year compared with the same month in2004).
To keep up momentum at bmibaby, DavidByron, who has been with the bmi group forfour years, was appointed managing directorin January, replacing Tony Davis, whobecame CEO of Singaporean LCC TigerAirways. Last year bmibaby also agreed apartnership with LCC Germanwings - con-trolled by bmi's Star partner Lufthansa - withco-operation on sales outside their homecountries.
The bmi group claims bmibaby has asimilar cost base to easyJet, and in terms offleet utilisation there is a significant differ-ence in operations between bmibaby andthe mainline operation. Aircraft utilisation isapproximately 25% higher at the LCC thanthe main operation, while pilot hours are upto 33% longer at bmibaby.
Uncertain future?
If bmibaby moves into profit in 2005, ithas been suggested that a flotation or tradesale is a possibility. That appears unlikelythough, as it increasingly appears as if theLCC is becoming the key success story atthe Group, outshadowing the continuingweak performance of short-haul operationswithin Europe at the mainline bmi. TheGroup admits that "bmibaby has had an
Aviation Strategy
Briefing
May 200515
Fleet Order OptionsMainline bmi
A319-100 4 1 A320-200 11 1 A321-200 10 A330-200 3
Fokker 100 2bmi Regional
Emb 135 3 Emb 145 10
bmibaby 737-300 10 737-500 6
Total 59 2 0
BMI GROUP FLEET

important role in absorbing part of the over-head cost of the group, which otherwisewould have had a detrimental effect on ourmainline operation". In the future, long-haulmay generate substantial profits, but this isheavily dependent on bmi being able to bet-ter sweat its key assets - the Heathrow slots- through more routes.
According to Bishop the main airline has"turned the corner" and the group is on trackto both meet the 2005 cost-saving target andmake an operating profit this year. bmi alsopoints out that at the end of 2004 theGroup's debt stood at £122m, comparedwith debt of £181m at end 2003, while cashtotalled £139m at end 2004, compared with£120m a year earlier. But it was interest onthat cash pile that turned the operating lossin 2004 into a pre-tax profit, and if the groupwas floated then surely shareholders woulddemand that either the cash pile was invest-ed in a suitable opportunity or returned toinvestors as a dividend.
And despite the massive cost-cuttingeffort and new senior management, the bmigroup looks weak strategically, with a tinylong-haul network and with short-haul beingsqueezed by the LCCs. There are marketingproblems too, particularly with bmi's image -or rather the lack of one. In 2004 bmi com-mercial director Adrian Parkes admitted at ameeting with UK travel agents that: "Peopleknow what they are getting with Ryanair andVirgin - they don't with us." bmi's marketposition has not been helped by the namechange from British Midland, nor by the seg-mentation strategy, which offers the publicthree different bmi brands.
Shareholder flight?
Sir Michael Bishop owns 50% plus oneshare of bmi group, Lufthansa has a 30%minus one share, and SAS owns 20% - yetthe two external shareholders are unhappywith the performance of the group, and arebelieved to be looking to sell their stakes.
Part of the reason for this is that bmi,Lufthansa and SAS pool revenues and prof-its on their routes between the UK, Germanyand Scandinavia (and a few other destina-
tions) under the so-called "European Co-operation Agreement". Under this pooleddeal, although bmi operates most of theincluded routes it absorbs only 10% of loss-es, whereas SAS and Lufthansa each take45% of losses. According to SAS, the pooledroutes made a collective loss of £23m in2004 (compared with a £42m loss in 2003),though bmi's share of this under the poolingagreement is just £2.3m. SAS now says thatthe pooled agreement is "unsuitable", andthat when it expires at the end of 2007 SASwill not renew it. In any case, according toJorgen Lindegaard, CEO of SAS group, "weprobably wouldn't even get acceptance inBrussels for continuing this sort of co-opera-tion."
bmi admits it wants the pooled agree-ment to perform better, and that the deal isbeing examined as part of the current reviewof mainline operations. This review will beshared with SAS and Lufthansa, bmi says,and it is confident the pooled deal will bemuch more attractive by the end of 2007.This appears to be a significant differencebetween SAS and bmi, and even if bmioffered to change significantly the cost allo-cation in any new deal, the Scandinavian air-line appears determined to end its associa-tion with bmi as soon as possible. SAS saysit has "no strategic interest" in bmi, and saysthat "financial assets should be sold if youdon't see a return on those assets" -although in March SAS said that the airlinehad not yet received any offers for its bmistake.
Lufthansa too is believed to be trying tosell its stake, to either Virgin Atlantic orBritish Airways, in order to avoid having tobuy Bishop's 50% plus one share stake thatit is legally obliged to if Bishop exercises aput option anytime until 2009, as agreedbetween the two parties when Lufthansabought into British Midland in 1999 (fordetails on this see Aviation Strategy, March2005). Lufthansa rushed into the 1999 deal -in which it bought 20% of the airline for£91.4m - out of a fear that Bishop would allyBritish Midland with the SkyTeam alliance(hence securing access to LondonHeathrow) and as a result entered into oblig-ations that are now looking less than wise
Aviation Strategy
Briefing
May 200516

from Lufthansa's point of view. One putoption was exercised in 2002, whenLufthansa bought another 10% stake for£45.7m, and the option for the 50% thatBishop owns would also be at the 1999price. bmi's 1999 valuation was £457m,meaning that the remaining put option wouldcost Lufthansa more than £228m.
That price is well above what most ana-lysts believe to be the true market worth ofbmi, and write downs by Lufthansa implythat the value of bmi has at least halved.However, the launch of routes from LondonHeathrow if/when an open skies deal withthe US is signed would increase bmi's valu-ation substantially. The winner in this situa-tion is Bishop, who can hang on to his stakein the hope that a new US-UK bilateral isimminent - but in the event it isn't, can sellhis shares to Lufthansa by exercising the putoption.
One way of valuing the airline is on a slotbasis, by considering bmi's 85 slot pairs atLondon Heathrow. Historical transactionssuggest a price of up to £10m a pair (as paidby Qantas in 2004), although the price for an"average" pair of slots at Heathrow is aroundthe £5m level. That suggests a price ofaround £425m for the slots, which, is close
to the 1999 valuation of the airline. Unconfirmed sources claim both BA and
Virgin talked to Lufthansa about acquiringthe German carrier's stake, but both airlinestold Lufthansa that because of the Bishop'sput option they did not want to do a deal atpresent. With BA holding 40% of the slots atLondon Heathrow, an acquisition of bmi isalmost unthinkable from a competition pointof view, but a Virgin Atlantic/bmi group merg-er would make sense strategically. There'slittle doubt that Virgin is interested in acquir-ing bmi (formal talks held in May 2003 cameto nothing after a reported reluctance ofBishop to cede overall control), although theairline continues to refuse to comment onthe current situation.
Virgin's trump card is that there areunconfirmed rumours that Bishop wants toexit his holding sooner rather than later(which he would do by simply exercising theexisting put option with Lufthansa). IfBishop's intention is true, it means that notone of the three existing shareholders has along-term commitment to the airline, leavingVirgin a clear run at securing key slots atLondon Heathrow - providing no surprisebidder emerges.
Aviation Strategy
Briefing
May 200517
AVIATION STRATEGY ONLINESubscribers can access Aviation Strategy (including all back numbers)through our website www.aviationeconomics.com. However, you need a
personal password - to obtain it email [email protected]
CUSTOMISED COMPANYAND MARKET BRIEFINGS
If you are interested in a briefing on a particular airline, airport,manufacturer, lessor or industry sector/market, Aviation Economics is
able to produce in-depth reports customised to your requirements.
Contact: Keith McMullan or Tim Coombs +44 (0)20 7490 5215

The following tables reflect the current val-ues (not “fair market”) and lease rates for
narrowbody and widebody jets. The figuresare from The Aircraft Value AnalysisCompany (contact details opposite) andreflect AVAC’s opinion of the worth of the air-craft.
These values are probably above the
opportunistic offer prices or distressed saleprices still prevalent today. These figures arenot solely based on market averages, butalso such factors as remarketing value,number in service, number on order andbacklog, projected life span, etc.
Aviation Strategy
Value trends
May 2005
Jet values and lease rates
18
NEW 5 years 10 years 20 years NEW 5 years 10 years 20 yearsold old old old old old
A318 29.0 717-200 20.3 13.9A319 (IGW) 36.9 29.1 727-200Adv 0.7A320-200 (IGW) 44.2 35.3 26.3 737-200Adv 1.1A321-200 (LGW) 50.5 39.4 737-300 (LGW) 12.0 6.1
737-400 (LGW) 15.6 12.9737-500 12.9 10.3737-600 30.9 22.1737-700 37.1 29.9737-800 47.0 37.1737-900 44.6 32.5757-200 29.7 23.1 9.7757-200ER 32.6 25.1757-300 38.1MD-82 7.1 4.3MD-83 8.0 5.3MD-88 8.3MD-90 11.0
NEW 5 years 10 years 20 years NEW 5 years 10 years 20 yearsold old old old old old
A300B4-200 3.9 747-200B 6.0A300B4-600 6.8 747-400 93.2 65.1A300B4-600R (HGW) 28.3 767-200 7.3A310-300 (IGW) 22.2 6.6 767-300 41.2 30.4A330-200 81.4 767-300ER (LGW) 54.8 40.4A330-300 (IGW) 73.9 52.7 767-400 57.8A340-200 42.7 777-200 72.8 50.8A340-300 (LGW) 78.3 57.8 777-200ER 126.5 102.0A340-300ER 106.8 88.1 777-300 128.3 97.2A340-500 125.4A340-600 131.1
DC-10-30 6DC-10-40 1.3MD-11P 35.3
NARROWBODY VALUES (US$m)
WIDEBODY VALUES (US$m)
Note: As assessed at end April 2005Source: AVAC

Aviation Strategy
Lease trends
May 200519
AIRCRAFT AND ASSET VALUATIONSContact Paul Leighton at AVAC (Aircraft Value Analysis Company)
• Website: www.aircraftvalues.net• Email: [email protected]
• Tel: +44 (0) 20 7477 6563 • Fax: +44 (0) 20 7477 6564
NEW 5 years 10 years 20 years NEW 5 years 10 years 20 years
old old old old old old
A318 241 717-200 203 149
A319 (IGW) 318 270 727-200Adv 48
A320-200 (IGW) 333 304 258 737-200Adv 38
A321-200 (LGW) 405 346 737-300 (LGW) 138 97
737-400 (LGW) 161 143
737-500 143 126
737-600 214 179
737-700 295 246
737-800 334 289
737-900 326
757-200 217 201 120
757-200ER 225 201
757-300 269
MD-82 121 88
MD-83 141 124 98
MD-88 123
MD-90 116
NEW 5 years 10 years 20 years NEW 5 years 10 years 20 years
old old old old old old
A300B4-200 91 747-200B 152
A300B4-600 149 747-400 820 652
A300B4-600R (HGW) 255 767-200 122
A310-300 (IGW) 228 114 767-300 317 282
A330-200 635 767-300ER (LGW) 420 363
A330-300 (IGW) 605 476 767-400 474
A340-200 427 777-200 562 463
A340-300 (LGW) 462 777-200ER 903 793
A340-300ER 835 717 777-300 935 783
A340-500 925
A340-600 977
DC-10-30 122
MD-11P 479 407Note: As assessed at end April 2005Source: AVAC
WIDEBODY LEASE RATES (US$000’s per month)
NARROWBODY LEASE RATES (US$000’s per month)
Aviation Strategy
Databases
May 200520
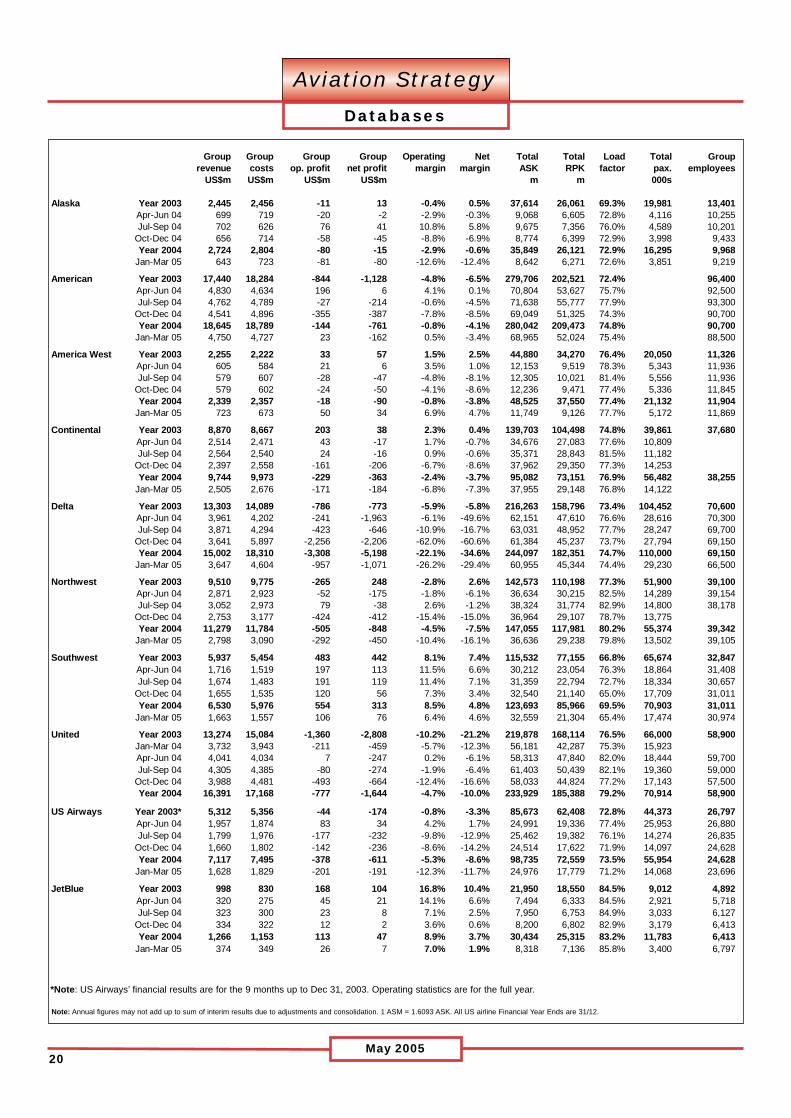
Group Group Group Group Operating Net Total Total Load Total Grouprevenue costs op. profit net profit margin margin ASK RPK factor pax. employees
US$m US$m US$m US$m m m 000s
Alaska Year 2003 2,445 2,456 -11 13 -0.4% 0.5% 37,614 26,061 69.3% 19,981 13,401Apr-Jun 04 699 719 -20 -2 -2.9% -0.3% 9,068 6,605 72.8% 4,116 10,255Jul-Sep 04 702 626 76 41 10.8% 5.8% 9,675 7,356 76.0% 4,589 10,201
Oct-Dec 04 656 714 -58 -45 -8.8% -6.9% 8,774 6,399 72.9% 3,998 9,433Year 2004 2,724 2,804 -80 -15 -2.9% -0.6% 35,849 26,121 72.9% 16,295 9,968
Jan-Mar 05 643 723 -81 -80 -12.6% -12.4% 8,642 6,271 72.6% 3,851 9,219
American Year 2003 17,440 18,284 -844 -1,128 -4.8% -6.5% 279,706 202,521 72.4% 96,400Apr-Jun 04 4,830 4,634 196 6 4.1% 0.1% 70,804 53,627 75.7% 92,500Jul-Sep 04 4,762 4,789 -27 -214 -0.6% -4.5% 71,638 55,777 77.9% 93,300
Oct-Dec 04 4,541 4,896 -355 -387 -7.8% -8.5% 69,049 51,325 74.3% 90,700Year 2004 18,645 18,789 -144 -761 -0.8% -4.1% 280,042 209,473 74.8% 90,700
Jan-Mar 05 4,750 4,727 23 -162 0.5% -3.4% 68,965 52,024 75.4% 88,500
America West Year 2003 2,255 2,222 33 57 1.5% 2.5% 44,880 34,270 76.4% 20,050 11,326Apr-Jun 04 605 584 21 6 3.5% 1.0% 12,153 9,519 78.3% 5,343 11,936Jul-Sep 04 579 607 -28 -47 -4.8% -8.1% 12,305 10,021 81.4% 5,556 11,936
Oct-Dec 04 579 602 -24 -50 -4.1% -8.6% 12,236 9,471 77.4% 5,336 11,845Year 2004 2,339 2,357 -18 -90 -0.8% -3.8% 48,525 37,550 77.4% 21,132 11,904
Jan-Mar 05 723 673 50 34 6.9% 4.7% 11,749 9,126 77.7% 5,172 11,869
Continental Year 2003 8,870 8,667 203 38 2.3% 0.4% 139,703 104,498 74.8% 39,861 37,680Apr-Jun 04 2,514 2,471 43 -17 1.7% -0.7% 34,676 27,083 77.6% 10,809Jul-Sep 04 2,564 2,540 24 -16 0.9% -0.6% 35,371 28,843 81.5% 11,182
Oct-Dec 04 2,397 2,558 -161 -206 -6.7% -8.6% 37,962 29,350 77.3% 14,253Year 2004 9,744 9,973 -229 -363 -2.4% -3.7% 95,082 73,151 76.9% 56,482 38,255
Jan-Mar 05 2,505 2,676 -171 -184 -6.8% -7.3% 37,955 29,148 76.8% 14,122
Delta Year 2003 13,303 14,089 -786 -773 -5.9% -5.8% 216,263 158,796 73.4% 104,452 70,600Apr-Jun 04 3,961 4,202 -241 -1,963 -6.1% -49.6% 62,151 47,610 76.6% 28,616 70,300Jul-Sep 04 3,871 4,294 -423 -646 -10.9% -16.7% 63,031 48,952 77.7% 28,247 69,700
Oct-Dec 04 3,641 5,897 -2,256 -2,206 -62.0% -60.6% 61,384 45,237 73.7% 27,794 69,150Year 2004 15,002 18,310 -3,308 -5,198 -22.1% -34.6% 244,097 182,351 74.7% 110,000 69,150
Jan-Mar 05 3,647 4,604 -957 -1,071 -26.2% -29.4% 60,955 45,344 74.4% 29,230 66,500
Northwest Year 2003 9,510 9,775 -265 248 -2.8% 2.6% 142,573 110,198 77.3% 51,900 39,100Apr-Jun 04 2,871 2,923 -52 -175 -1.8% -6.1% 36,634 30,215 82.5% 14,289 39,154Jul-Sep 04 3,052 2,973 79 -38 2.6% -1.2% 38,324 31,774 82.9% 14,800 38,178
Oct-Dec 04 2,753 3,177 -424 -412 -15.4% -15.0% 36,964 29,107 78.7% 13,775Year 2004 11,279 11,784 -505 -848 -4.5% -7.5% 147,055 117,981 80.2% 55,374 39,342
Jan-Mar 05 2,798 3,090 -292 -450 -10.4% -16.1% 36,636 29,238 79.8% 13,502 39,105
Southwest Year 2003 5,937 5,454 483 442 8.1% 7.4% 115,532 77,155 66.8% 65,674 32,847Apr-Jun 04 1,716 1,519 197 113 11.5% 6.6% 30,212 23,054 76.3% 18,864 31,408Jul-Sep 04 1,674 1,483 191 119 11.4% 7.1% 31,359 22,794 72.7% 18,334 30,657
Oct-Dec 04 1,655 1,535 120 56 7.3% 3.4% 32,540 21,140 65.0% 17,709 31,011Year 2004 6,530 5,976 554 313 8.5% 4.8% 123,693 85,966 69.5% 70,903 31,011
Jan-Mar 05 1,663 1,557 106 76 6.4% 4.6% 32,559 21,304 65.4% 17,474 30,974
United Year 2003 13,274 15,084 -1,360 -2,808 -10.2% -21.2% 219,878 168,114 76.5% 66,000 58,900Jan-Mar 04 3,732 3,943 -211 -459 -5.7% -12.3% 56,181 42,287 75.3% 15,923Apr-Jun 04 4,041 4,034 7 -247 0.2% -6.1% 58,313 47,840 82.0% 18,444 59,700Jul-Sep 04 4,305 4,385 -80 -274 -1.9% -6.4% 61,403 50,439 82.1% 19,360 59,000
Oct-Dec 04 3,988 4,481 -493 -664 -12.4% -16.6% 58,033 44,824 77.2% 17,143 57,500Year 2004 16,391 17,168 -777 -1,644 -4.7% -10.0% 233,929 185,388 79.2% 70,914 58,900
US Airways Year 2003* 5,312 5,356 -44 -174 -0.8% -3.3% 85,673 62,408 72.8% 44,373 26,797Apr-Jun 04 1,957 1,874 83 34 4.2% 1.7% 24,991 19,336 77.4% 25,953 26,880Jul-Sep 04 1,799 1,976 -177 -232 -9.8% -12.9% 25,462 19,382 76.1% 14,274 26,835
Oct-Dec 04 1,660 1,802 -142 -236 -8.6% -14.2% 24,514 17,622 71.9% 14,097 24,628Year 2004 7,117 7,495 -378 -611 -5.3% -8.6% 98,735 72,559 73.5% 55,954 24,628
Jan-Mar 05 1,628 1,829 -201 -191 -12.3% -11.7% 24,976 17,779 71.2% 14,068 23,696
JetBlue Year 2003 998 830 168 104 16.8% 10.4% 21,950 18,550 84.5% 9,012 4,892Apr-Jun 04 320 275 45 21 14.1% 6.6% 7,494 6,333 84.5% 2,921 5,718Jul-Sep 04 323 300 23 8 7.1% 2.5% 7,950 6,753 84.9% 3,033 6,127
Oct-Dec 04 334 322 12 2 3.6% 0.6% 8,200 6,802 82.9% 3,179 6,413Year 2004 1,266 1,153 113 47 8.9% 3.7% 30,434 25,315 83.2% 11,783 6,413
Jan-Mar 05 374 349 26 7 7.0% 1.9% 8,318 7,136 85.8% 3,400 6,797
*Note: US Airways’ financial results are for the 9 months up to Dec 31, 2003. Operating statistics are for the full year.
Note: Annual figures may not add up to sum of interim results due to adjustments and consolidation. 1 ASM = 1.6093 ASK. All US airline Financial Year Ends are 31/12.

Aviation Strategy
Databases
May 200521
Group Group Group Group Operating Net Total Total Load Total Grouprevenue costs op. profit net profit margin margin ASK RPK factor pax. employees
US$m US$m US$m US$m m m 000sAir FranceYE 31/03 Year 2002/03 13,702 13,495 207 130 1.5% 0.9% 131,247 99,960 76.2% 71,525
Jul-Sep 03 3,715 3,598 117 56 3.1% 1.5% 35,255 27,544 78.1%Oct-Dec 03 3,933 3,855 78 35 2.0% 0.9% 33,380 25,329 75.9% 71,900Jan-Mar 04 3,668 3,680 -12 16 -0.3% 0.4% 33,917 25,026 73.8%
Year 2003/04 15,024 14,855 169 113 1.1% 0.8% 134,444 101,644 75.6%KLMYE 31/03 Year 2002/03 7,004 7,147 -144 -449 -2.1% -6.4% 87,647 69,016 78.7% 23,437 34,666
Jul-Sep 03 1,878 1,725 152 104 8.1% 5.5% 18,905 15,874 84.0% 32,853Oct-Dec 03 1,838 1,801 36 10 2.0% 0.5% 17,969 14,378 80.0% 31,804Jan-Mar 04 1,677 1,645 32 -24 1.9% -1.4% 17,963 14,455 80.5%
Year 2003/04 7,157 7,011 146 29 2.0% 0.4% 72,099 57,784 80.1% 31,077Air France/KLM Group* Apr-Jun 04 5,394 5,205 189 115 3.5% 2.1% 48,944 38,025 77.7%
Jul-Sep 04 6,328 5,964 364 248 5.8% 3.9% 57,668 46,767 81.1%Oct-Dec 04 6,628 5,745 883 83 13.3% 1.3% 54,144 42,042 77.6% 15,934
BAYE 31/03 Year 2002/03 12,490 12,011 543 117 4.3% 0.9% 139,172 100,112 71.9% 38,019 51,630
Jul-Sep 03 3,306 2,980 333 163 10.1% 4.9% 35,981 27,540 76.5% 9,739 47,702Oct-Dec 03 3,363 3,118 244 148 7.3% 4.4% 35,098 25,518 72.7% 8,453 46,952Jan-Mar 04 3,386 3,327 164 22 4.8% 0.6% 35,232 24,932 70.8% 8,142 46,551
Year 2003/04 13,806 13,067 739 237 5.4% 1.7% 141,273 103,092 73.0% 36,103 49,072Apr-Jun 04 3,479 3,208 271 127 7.8% 3.7% 36,150 27,083 74.9% 9,288 46,280Jul-Sep 04 3,645 3,213 432 221 11.9% 6.1% 36,639 28,749 78.5% 9,822 46,179
Oct-Dec 04 3,801 3,589 212 94 5.6% 2.5% 35,723 25,999 72.8% 8,428 45,888IberiaYE 31/12 Year 2002 5,123 4,852 272 174 5.3% 3.4% 55,633 40,647 73.0% 24,956 25,963
Apr-Jun 03 1,348 1,265 83 60 6.2% 4.5% 13,516 9,982 73.8% 6,472Jul-Sep 03 1,434 1,301 133 93 9.3% 6.5% 14,819 11,846 79.9% 7,073Year 2003 5,800 4,459 202 180 3.5% 3.1% 56,145 42,100 75.0% 25,613
Jan-Mar 04 1,325 1,356 -32 -1 -2.4% -0.1% 14,563 10,721 73.6% 6,136Apr-Jun 04 1,461 1,371 90 95 6.2% 6.5% 14,743 11,106 75.3% 6,913Jul-Sep 04 1,593 1,452 141 110 8.9% 6.9% 16,053 12,699 79.1% 7,314 25,839
Oct-Dec 04 1,660 1,605 55 74 3.3% 4.5% 15,700 11,398 72.6% 6,329 24,783LufthansaYE 31/12 Apr-Jun 03 4,423 4,214 209 -39 4.7% -0.9% 30,597 22,315 71.7% 10,758
Jul-Sep 03 4,923 4,783 140 -20 2.8% -0.4% 32,895 24,882 12,020Year 2003 20,037 20,222 -185 -1,236 -0.9% -6.2% 124,000 90,700 73.1% 45,440 94,798
Jan-Mar 04 4,742 4,883 -141 76 -3.0% 1.6% 31,787 23,030 72.5% 11,414 93,479Apr-Jun 04 5,269 5,045 224 -28 4.3% -0.5% 36,440 26,959 74.0% 13,336Jul-Sep 04 5,511 5,164 347 154 6.3% 2.8% 38,115 28,883 75.8% 14,053 92,718Year 2004 25,655 24,285 1370 551 5.3% 2.1% 140,648 104,064 74.0% 50,300 90,763
SASYE 31/12 Apr-Jun 03 1,906 1,705 201 8 10.5% 0.4% 12,278 7,855 64.0% 5,128
Jul-Sep 03 1,941 1,715 131 91 6.7% 4.7% 12,543 8,681 69.2% 8,301 34,856Year 2003 7,978 8,100 -122 -195 -1.5% -2.4% 47,881 30,402 63.5% 31,320 34,544
Jan-Mar 04 1,652 1,823 -171 -184 -10.4% -11.1% 11,852 7,031 59.3% 7,238Apr-Jun 04 2,007 1,979 27 13 1.3% 0.6% 13,456 8,960 66.6% 8,879Jul-Sep 04 2,099 1,860 239 9 11.4% 0.4% 13,557 9,198 67.8% 8,591
Oct-Dec 04 2,271 2,293 -22 -96 -1.0% -4.2% 12,667 7,649 60.4% 7,645 32,600Year 2004 8,830 8,967 -137 -283 -1.6% -3.2% 43,077 28,576 64.0% 32,354 32,481
RyanairYE 31/03 Year 2002/03 910 625 285 259 31.3% 28.5% 84.0% 15,740 1,900
Apr-Jun 03 280 220 57 46 20.4% 16.4% 78.0% 5,100 2,135Jul-Sep 03 407 237 170 148 41.8% 36.4% 5,571 2,200
Oct-Dec 03 320 253 67 51 20.9% 15.9% 6,100 2,356Year 2003/04 1,308 978 330 252 25.2% 19.3% 81.0% 23,133 2,300
Apr-Jun 04 366 288 78 64 21.3% 17.5% 83.0% 6,600 2,444Jul-Sep 04 516 305 211 181 40.9% 35.1% 90.0% 7,400 2,531
Oct-Dec 04 402 335 68 47 16.9% 11.7% 84.0% 6,900 2,671easyJetYE 30/09 Year 2001/02 864 656 111 77 12.8% 8.9% 10,769 9,218 84.8% 11,350 3,100
Oct-Mar 03 602 676 -74 -76 -12.3% -12.6% 9,594 7,938 82.2% 9,347Year 2002/03 1,553 1,472 81 54 5.2% 3.5% 21,024 17,735 84.1% 20,300 3,372
Oct-Mar 04 803 861 -58 -36 -7.2% -4.5% 10,991 9,175 83.3% 10,800Year 2003/04 1,963 1,871 92 74 4.7% 3.8% 25,448 21,566 84.5% 24,300
Note: Annual figures may not add up to sum of interim results due to adjustments and consolidation. * = Preliminary consolidated figures for Air France Group from May-June, KLM Group from May-June

Aviation Strategy
Databases
22May 2005
Group Group Group Group Operating Net Total Total Load Total Grouprevenue costs op. profit net profit margin margin ASK RPK factor pax. employees
US$m US$m US$m US$m m m 000sANAYE 31/03 Year 2001/02 9,714 9,529 185 -76 1.9% -0.8% 87,908 57,904 64.7% 49,306
Apr-Sep 02 5,322 5,194 127 -69 2.4% -1.3% 44,429 29,627 66.7% 25,341Year 2002/03 10,116 10,137 -22 -235 -0.2% -2.3% 88,539 59,107 66.7% 50,916 14,506
Apr-Sep 03 5,493 5,362 131 186 2.4% 3.4% 32,494 19,838 61.1% 22,866Year 2003/04 11,529 11,204 325 234 2.8% 2.0% 87,772 55,807 63.6% 44,800 20,530
Cathay PacificYE 31/12 Year 2002 4,243 3,634 609 513 14.4% 12.1% 63,050 77.8% 14,600
Jan-Jun 03 1,575 1,672 -97 -159 -6.2% -10.1% 26,831 64.4% 4,019 14,800Year 2003 3,810 3,523 287 168 7.5% 4.4% 59,280 42,774 72.2% 12,322 14,673
Jan-Jun 04 2,331 2,046 285 233 12.2% 10.0% 35,250 76.1% 6,404Year 2004 5,024 4,350 674 581 13.4% 11.6% 74,062 57,283 77.3% 13,664 15,054
JALYE 31/03 Year 2001/02 9,607 9,741 -135 -286 -1.4% -3.0% 37,183
Year 2002/03 17,387 17,298 88 97 0.5% 0.6% 145,944 99,190 68.0% 56,022Year 2003/04 18,398 19,042 -644 -844 -3.5% -4.6% 145,900 93,847 64.3% 58,241
Korean AirYE 31/12 Year 2001 4,309 4,468 -159 -448 -3.7% -10.4% 55,802 38,452 68.9% 21,638
Year 2002 5,206 4,960 246 93 4.7% 1.8% 58,310 41,818 71.7%Year 2003 5,172 4,911 261 -202 5.0% -3.9% 59,074 40,507 68.6% 21,811
MalaysianYE 31/03 Year 2001/02 2,228 2,518 -204 -220 -9.2% -9.9% 52,595 34,709 66.0% 15,734 21,438
Year 2002/03 2,350 2,343 7 89 0.3% 3.8% 54,266 37,653 69.4% 21,916Year 2003/04 2,308 2,258 50 121 2.2% 5.2% 55,692 37,659 67.6% 15,375 20,789
QantasYE 30/06 Year 2001/02 6,133 5,785 348 232 5.7% 3.8% 95,944 75,134 78.3% 27,128 33,044
Jul-Dec 02 3,429 3,126 303 200 8.8% 5.8% 50,948 40,743 80.0% 15,161 34,770Year 2002/03 7,588 7,217 335 231 4.4% 3.0% 99,509 77,225 77.6% 28,884 34,872
Jul-Dec 03 4,348 3,898 450 269 10.3% 6.2% 50,685 40,419 79.7% 15,107 33,552Year 2003/04 7,838 7,079 759 448 9.7% 5.7% 104,200 81,276 78.0% 30,076 33,862
Jul-Dec 04 5,017 4,493 524 358 10.4% 7.1% 57,402 43,907 76.5% 16,548 35,310SingaporeYE 31/03 Year 2001/02 5,399 4,837 562 395 10.4% 7.3% 94,559 69,995 74.0% 14,765 29,422
Year 2002/03 5,936 5,531 405 601 6.8% 10.1% 99,566 74,183 74.5% 15,326 30,243Year 2003/04 5,732 5,332 400 525 7.0% 9.2% 88,253 64,685 73.3% 13,278 29,734
Apr-Jun 04 1,588 1,409 179 159 11.3% 10.0% 25,249 18,167 71.9% 3,800Jul-Sep 04 1,780 1,587 193 215 10.8% 12.1% 26,357 19,959 75.7% 4,050
Oct-Dec 04 1,956 1,697 259 291 13.2% 14.9% 26,768 20,274 75.7% 4,201
Note: Annual figures may not add up to sum of interim results due to adjustments and consolidation. 1 ASM = 1.6093 ASK
Old Old Total New New Total narrowbodies widebodies old narrowbodies widebodies new Total
Dec-1999 243 134 377 101 53 154 531Dec-2000 302 172 474 160 42 202 676Dec-2001 368 188 556 291 101 392 948Dec-2002 366 144 510 273 102 375 885Dec-2003 275 117 392 274 131 405 797Dec-2004 185 56 241 194 48 242 483Feb-2005 156 55 211 192 45 237 448
Old Old Total New New Total narrowbodies widebodies old narrowbodies widebodies new Total
1999 582 230 812 989 170 1,159 1,9712000 475 205 680 895 223 1,118 1,7982001 286 142 428 1,055 198 1,253 1,6812002 439 213 652 1,205 246 1,451 2,1032003 408 94 502 1,119 212 1,331 1,8332004 321 177 498 1,815 325 2,140 2,638
Feb-2005 30 6 36 126 16 142 178
Source: BACK Notes: As at endyear; Old narrowbodies = 707,DC8, DC9, 727,737-100/200,F28, BAC 1-11, Caravelle; Oldwidebodies = L1011, DC10, 747-100/200, A300B4; New narrow-bodies = 737-300+, 757. A320types, BAe 146, F100, RJ; Newwidebodies = 747-300+, 767,777. A600, A310, A330, A340.
AIRCRAFT AVAILABLE FOR SALE OR LEASE - MONTH END
AIRCRAFT SOLD OR LEASED

Aviation Strategy
Databases
23May 2005
Domestic North Atlantic Pacific Latin America Total Int'lASK RPK LF ASK RPK LF ASK RPK LF ASK RPK LF ASK RPK LF
bn bn % bn bn % bn bn % bn bn % bn bn %1997 953.3 663.7 69.6 138.1 108.9 78.9 122.0 91.2 74.7 71.3 46.4 65.1 331.2 246.5 74.41998 960.8 678.8 70.7 150.5 117.8 78.3 112.7 82.5 73.2 83.5 52.4 62.8 346.7 252.7 72.91999 1,007.3 707.5 70.2 164.2 128.2 78.1 113.2 84.7 74.8 81.3 54.3 66.8 358.7 267.2 74.52000 1,033.5 740.1 71.6 178.9 141.4 79.0 127.7 97.7 76.5 83.0 57.6 69.4 380.9 289.9 76.12001 1,025.4 712.2 69.5 173.7 128.8 74.2 120.1 88.0 73.3 83.4 56.9 68.2 377.2 273.7 72.62002 990.0 701.6 70.9 159.0 125.7 67.2 103.0 83.0 80.5 84.1 56.8 67.5 346.1 265.5 76.72003 963.1 706.6 73.4 148.3 117.6 79.3 94.8 74.0 80.5 84.2 59.3 70.5 327.2 251.0 76.72004 1,014.5 763.6 75.3 164.2 134.4 81.8 105.1 87.6 83.4 96.4 68.0 70.5 365.6 289.8 79.3
Mar- 05 87.2 70.2 80.6 13.4 11.4 84.9 9.6 8.1 84.5 9.7 7.4 76.4 32.7 26.9 82.3Ann. Change 0.6% 7.0% 4.8 10.4% 12.0% 1.2 15.3% 12.3% -2.2 15.4% 23.0% 4.7 13.3% 14.9% 1.2
Jan-Mar 05 245.8 184.0 74.9 38.1 29.3 77.0 27.8 22.7 81.4 27.9 20.6 74.0 93.8 72.6 77.4Ann. Change -0.6% 5.6% 4.4 8.4% 11.1% 1.8 13.9% 9.9% -2.9 14.1% 18.3% 2.6 11.7% 12.7% 0.7
Note: US Majors = Aloha, Alaska, American, Am. West, American Transair, Continental, Cont. Micronesia, Delta, HawaiianJetBlue, MidWest Express, Northwest,Southwest, United and US Airways Source: ATA
US MAJORS’ SCHEDULED TRAFFIC
Intra-Europe North Atlantic Europe-Far East Total long-haul Total Int'lASK RPK LF ASK RPK LF ASK RPK LF ASK RPK LF ASK RPK LF
bn bn % bn bn % bn bn % bn bn % bn bn %1997 174.8 110.9 63.4 176.5 138.2 78.3 130.4 96.9 74.3 419.0 320.5 76.5 621.9 450.2 72.41998 188.3 120.3 63.9 194.2 149.7 77.1 135.4 100.6 74.3 453.6 344.2 75.9 673.2 484.8 721999 200.0 124.9 62.5 218.9 166.5 76.1 134.5 103.1 76.7 492.3 371.0 75.4 727.2 519.5 71.42000 208.2 132.8 63.8 229.9 179.4 78.1 137.8 108.0 78.3 508.9 396.5 77.9 755.0 555.2 73.52001 212.9 133.4 62.7 217.6 161.3 74.1 131.7 100.9 76.6 492.2 372.6 75.7 743.3 530.5 71.42002 197.2 129.3 65.6 181.0 144.4 79.8 129.1 104.4 80.9 447.8 355.1 79.3 679.2 507.7 74.72003 210.7 136.7 64.9 215.0 171.3 79.7 131.7 101.2 76.8 497.2 390.8 78.6 742.6 551.3 74.22004 220.6 144.2 65.4 224.0 182.9 81.6 153.6 119.9 78.0 535.2 428.7 80.1 795.7 600.7 75.5
Mar-05 25.0 16.3 65.3 17.6 14.8 83.7 14.1 11.0 77.6 46.1 37.4 81.1 67.7 51.8 76.4 Ann. chng 1.9% 5.5% 2.2 1.8% 1.5% -0.3 15.3% 13.9% -0.9 7.1% 7.1% 0.0 5.9% 7.5% 1.1Jan-Mar 05 71.0 43.2 60.9 49.8 38.8 77.9 39.9 31.0 77.7 131.6 104.6 79.5 193.2 142.8 73.9
Ann. Change 2.3% 4.7% 1.4 0.0% 1.3% 1.0 12.6% 11.3% -0.9 5.1% 6.4% 1.0 4.6% 6.5% 1.3Source: AEA
EUROPEAN SCHEDULED TRAFFIC
Date Buyer Order Delivery Other information/engines
Boeing 11April Icelandair 5 x 737-800 2006 converted options19 April Air Europa 3 x 737-800 200725 April Copa Airlines 5 x 737NG 2007/09 plus 10 options25 April Air Canada 18 x 777 2006 onwards plus 18 options
14 x 787 2010 onwards plus 46 options/purchase rights05 May Northwest Airlines 18 x 787-8 2008 onwards plus 50 options/purchase rights09 May Japan Airlines (JAL) 30 x 787 plus 20 options
30 x 737-800 plus 10 options10 May GECAS 6 x 737-700 2006/0710 May SkyEurope 4 x 737-700 plus 16 purchase rights
Airbus 21 April Shenzen Airlines 3 x A320, 3 x A31928 April British Mediterranean 7 x A321 2006 onwards IAE V2500
Embraer 11 May LOT Polish Airlines 4 x Emb175 2Q 2006 converted options
JET ORDERS
Note: Only firm orders from identifiable airlines/lessors are included. Source: Manufacturers

The Principals and Associates of Aviation Economics apply a problem-solving, creative and pragmatic approach to commercial aviation projects.
Our expertise is in strategic and financial consulting in Europe, the Americas, Asia, Africa and the Middle East, covering:
• Start-up business plans • Turnaround strategies • State aid applications
• Antitrust investigations • Merger/takeover proposals • Competitor analyses
• Credit analysis • Corporate strategy reviews • Market forecasts
• Privatisation projects • IPO prospectuses • Cash flow forecasts
• Asset valuations • E&M processes • Distribution policy
For further information please contact:Tim Coombs or Keith McMullan
Aviation EconomicsJames House, LG, 22/24 Corsham Street, London N1 6DR
Tel: + 44 (0)20 7490 5215 Fax: +44 (0)20 7490 5218e-mail:[email protected]
PLEASE RETURN THIS FORM TO:Aviation EconomicsJames House, LG
22/24 Corsham StreetLondon N1 6DR
Fax: +44 (0)20 7490 5218
Delivery addressName
Position
Company
Address
Country Postcode
Tel Fax
I enclose a Sterling, Euro or US Dollarcheque, made payable to:Aviation Economics
Please invoice me
Please charge my AMEX/Mastercard/Visacredit cardCard numberName on card Expiry date
I am sending a direct bank transfer of£390 net of all charges to AviationEconomics’ account: HSBC BankSort code: 40 04 37 Account no: 91256904
Aviation Economics
Please enter my Aviation Strategysubscription for:1 year (10 issues-Jan/Feb, Jul/Augcombined) @ £390 / €625 / US$650,
starting with the issue
DATA PROTECTION ACTThe information you provide will be held on our database and may beused to keep you informed of our products and services or for selectedthird party mailings
Invoice address (if different from delivery address)
NamePositionCompanyAddress
Country Postcode
SUBSCRIPTION FORM