aviation trends1).pdfaviation trends q1 2017 page 1 of 14 aviation trends quarter 1 2017 contents 1....
TRANSCRIPT
Aviation Trends Q1 2017 Page 1 of 14
Aviation Trends
Quarter 1 2017
Contents Introduction ......................................................................................................................................................................................................... 2
1. Historical overview of traffic .......................................................................................................................................................................... 3
a. Terminal passengers .............................................................................................................................................................................. 4
b. Commercial flights .................................................................................................................................................................................. 5
c. Cargo tonnage ........................................................................................................................................................................................ 6
2. Terminal passengers at UK airports ............................................................................................................................................................. 7
3. Passenger flights to and from UK airports .................................................................................................................................................... 8
4. Terminal passengers at UK airports by origin/destination ............................................................................................................................. 9
5. Air cargo tonnes carried to and from UK airports ........................................................................................................................................ 10
6. All commercial flights to and from UK airports ............................................................................................................................................ 11
7. Punctuality of scheduled passenger flights to and from UK airports ........................................................................................................... 12
a. On-time performance ............................................................................................................................................................................ 12
b. Average delay....................................................................................................................................................................................... 13
Explanatory notes ............................................................................................................................................................................................. 14
Aviation Trends Q1 2017 Page 2 of 14
Introduction Welcome to Aviation Trends. Every quarter we update key figures which summarise the levels of activity at the UK’s airports. The Aviation Trends series is available at www.caa.co.uk/aviationtrends, part of Aviation Intelligence, the online home of the CAA’s monthly airport and airline statistical publications. Please note that historic numbers may be subject to minor change as the result of prior period adjustments.1 Due to rounding of figures, there may be an apparent slight discrepancy between the sum of the constituent items and the total as shown. For a list of all statistics available on the CAA website, see www.caa.co.uk/data-and-analysis.
1 Also, in editions of Aviation Trends prior to quarter 4 2008, all figures included activity at Channel Islands and Isle of Man airports. These islands are not formally part of
the UK, and as we wish to present only the trends at UK airports, their figures are now excluded from the UK reporting airports, although travel between the UK and these airports is treated as domestic.
Aviation Trends Q1 2017 Page 3 of 14
1. Historical overview of traffic see note 5 on p.14
a. Terminal passengers
b. Cargo tonnage
c. Commercial flights
0
50
100
150
200
250
300
19
95
19
96
19
97
19
98
19
99
20
00
20
01
20
02
20
03
20
04
20
05
20
06
20
07
20
08
20
09
20
10
20
11
20
12
20
13
20
14
20
15
20
16
20
17
Term
inal
Pas
sen
gers
(m
il)
Q1 Q2 Q3 Q4
0
500
1,000
1,500
2,000
2,500
3,000
19
95
19
96
19
97
19
98
19
99
20
00
20
01
20
02
20
03
20
04
20
05
20
06
20
07
20
08
20
09
20
10
20
11
20
12
20
13
20
14
20
15
20
16
20
17
Car
go t
on
nag
e (
00
0's
)
Q1 Q2 Q3 Q4
0
500
1,000
1,500
2,000
2,500
3,000
19
95
19
96
19
97
19
98
19
99
20
00
20
01
20
02
20
03
20
04
20
05
20
06
20
07
20
08
20
09
20
10
20
11
20
12
20
13
20
14
20
15
20
16
20
17
Co
mm
erci
al f
ligh
ts (
00
0's
)
Q1 Q2 Q3 Q4
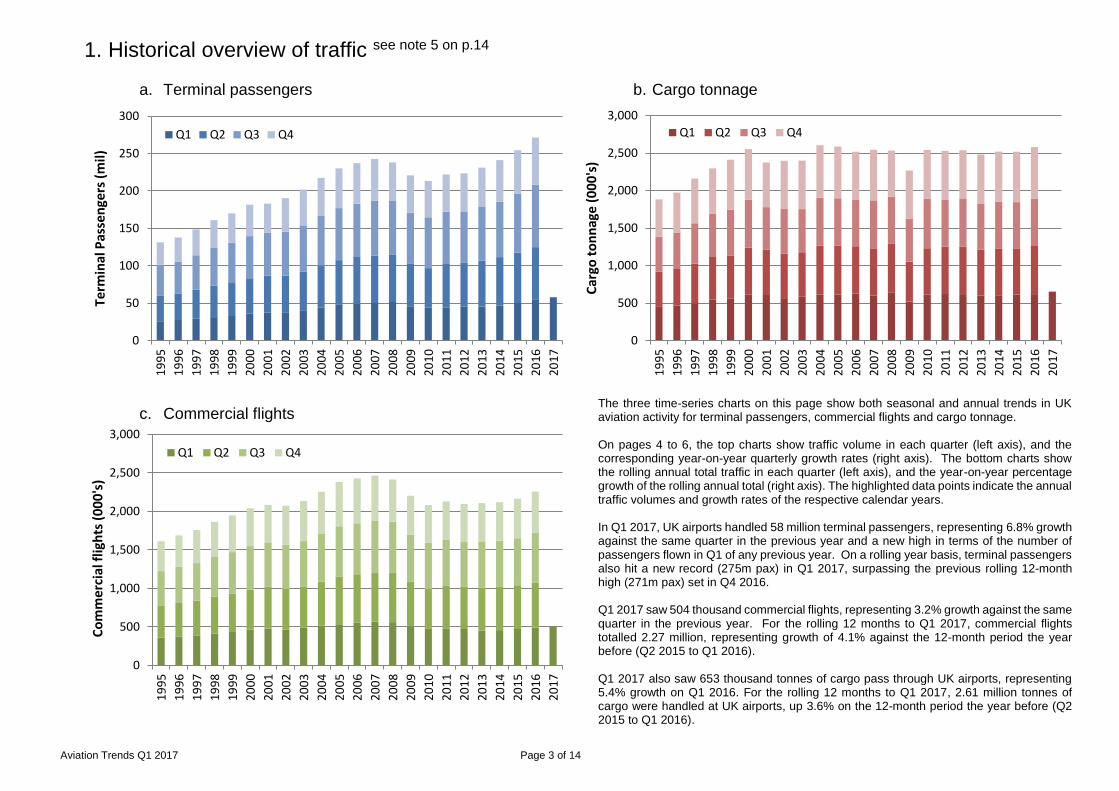
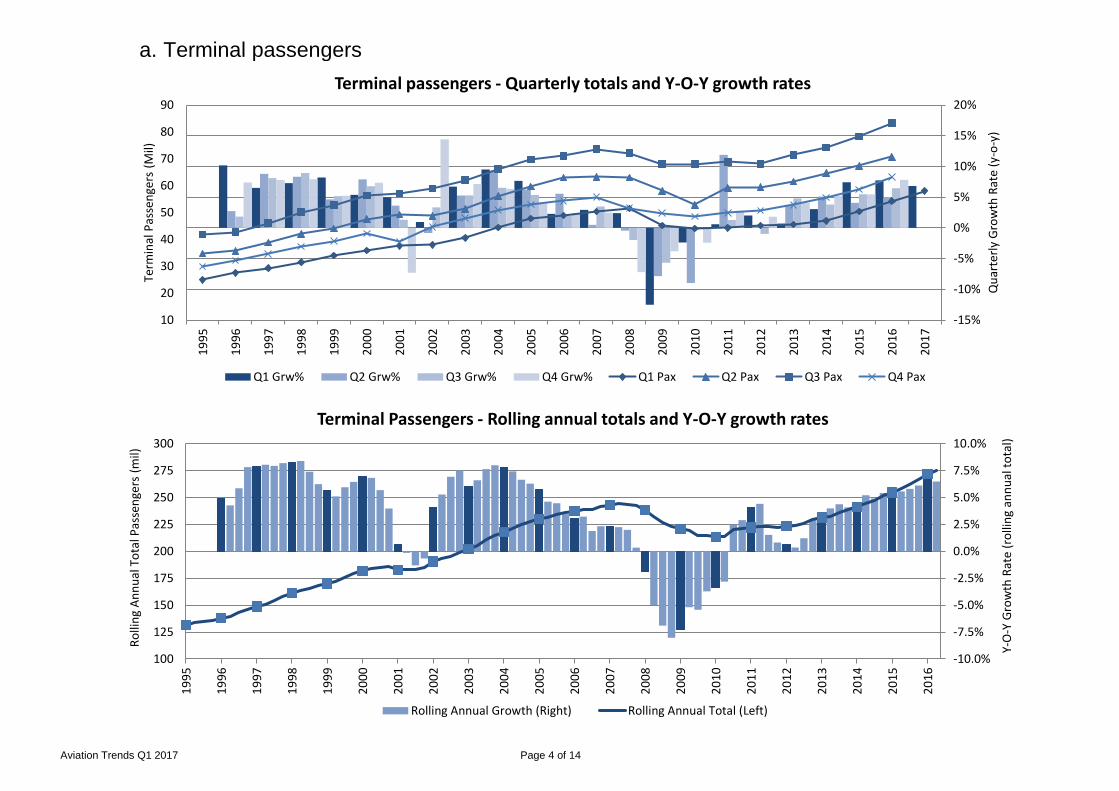
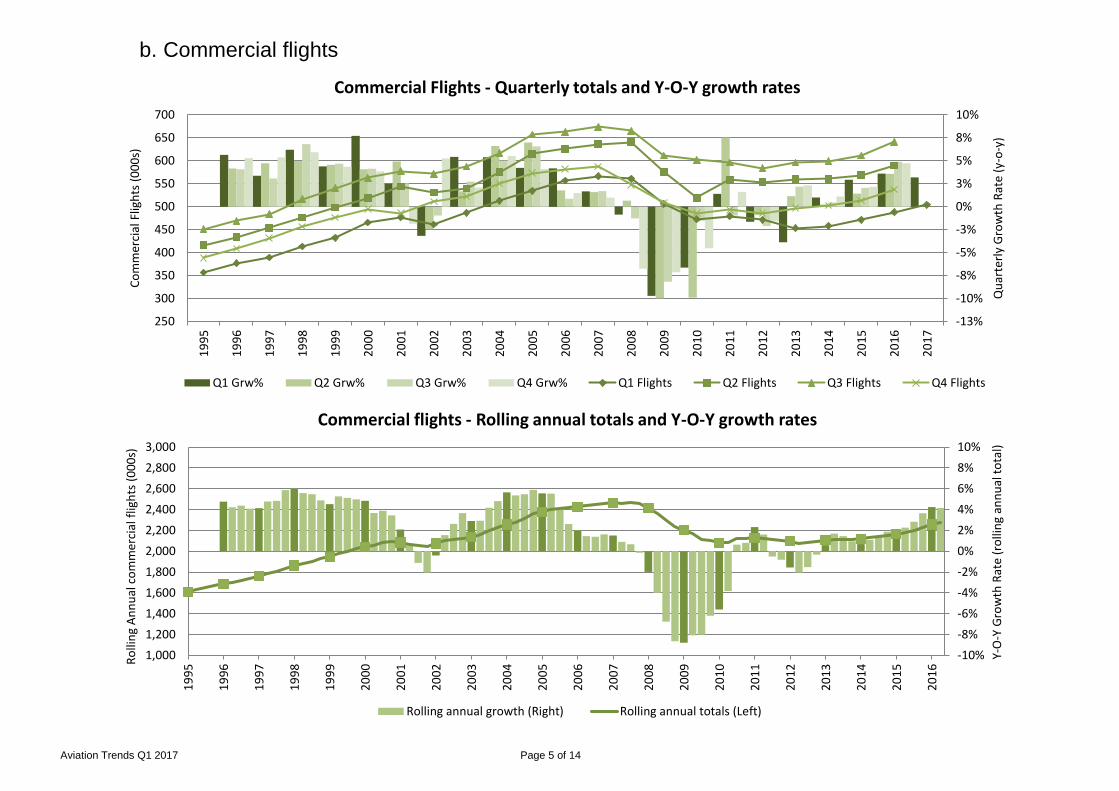
The three time-series charts on this page show both seasonal and annual trends in UK aviation activity for terminal passengers, commercial flights and cargo tonnage. On pages 4 to 6, the top charts show traffic volume in each quarter (left axis), and the corresponding year-on-year quarterly growth rates (right axis). The bottom charts show the rolling annual total traffic in each quarter (left axis), and the year-on-year percentage growth of the rolling annual total (right axis). The highlighted data points indicate the annual traffic volumes and growth rates of the respective calendar years. In Q1 2017, UK airports handled 58 million terminal passengers, representing 6.8% growth against the same quarter in the previous year and a new high in terms of the number of passengers flown in Q1 of any previous year. On a rolling year basis, terminal passengers also hit a new record (275m pax) in Q1 2017, surpassing the previous rolling 12-month high (271m pax) set in Q4 2016. Q1 2017 saw 504 thousand commercial flights, representing 3.2% growth against the same quarter in the previous year. For the rolling 12 months to Q1 2017, commercial flights totalled 2.27 million, representing growth of 4.1% against the 12-month period the year before (Q2 2015 to Q1 2016). Q1 2017 also saw 653 thousand tonnes of cargo pass through UK airports, representing 5.4% growth on Q1 2016. For the rolling 12 months to Q1 2017, 2.61 million tonnes of cargo were handled at UK airports, up 3.6% on the 12-month period the year before (Q2 2015 to Q1 2016).
Aviation Trends Q1 2017 Page 4 of 14
a. Terminal passengers
-15%
-10%
-5%
0%
5%
10%
15%
20%
10
20
30
40
50
60
70
80
90
19
95
19
96
19
97
19
98
19
99
20
00
20
01
20
02
20
03
20
04
20
05
20
06
20
07
20
08
20
09
20
10
20
11
20
12
20
13
20
14
20
15
20
16
20
17
Qu
arte
rly
Gro
wth
Rat
e (y
-o-y
)
Term
inal
Pas
sen
gers
(M
il)
Terminal passengers - Quarterly totals and Y-O-Y growth rates
Q1 Grw% Q2 Grw% Q3 Grw% Q4 Grw% Q1 Pax Q2 Pax Q3 Pax Q4 Pax
-10.0%
-7.5%
-5.0%
-2.5%
0.0%
2.5%
5.0%
7.5%
10.0%
100
125
150
175
200
225
250
275
300
19
95
19
96
19
97
19
98
19
99
20
00
20
01
20
02
20
03
20
04
20
05
20
06
20
07
20
08
20
09
20
10
20
11
20
12
20
13
20
14
20
15
20
16
Y-O
-Y G
row
th R
ate
(ro
llin
g an
nu
al t
ota
l)
Ro
llin
g A
nn
ual
To
tal P
asse
nge
rs (
mil)
Terminal Passengers - Rolling annual totals and Y-O-Y growth rates
Rolling Annual Growth (Right) Rolling Annual Total (Left)
Aviation Trends Q1 2017 Page 5 of 14
b. Commercial flights
-13%
-10%
-8%
-5%
-3%
0%
3%
5%
8%
10%
250
300
350
400
450
500
550
600
650
700
19
95
19
96
19
97
19
98
19
99
20
00
20
01
20
02
20
03
20
04
20
05
20
06
20
07
20
08
20
09
20
10
20
11
20
12
20
13
20
14
20
15
20
16
20
17
Qu
arte
rly
Gro
wth
Rat
e (y
-o-y
)
Co
mm
erci
al F
ligh
ts (
00
0s)
Commercial Flights - Quarterly totals and Y-O-Y growth rates
Q1 Grw% Q2 Grw% Q3 Grw% Q4 Grw% Q1 Flights Q2 Flights Q3 Flights Q4 Flights
-10%
-8%
-6%
-4%
-2%
0%
2%
4%
6%
8%
10%
1,000
1,200
1,400
1,600
1,800
2,000
2,200
2,400
2,600
2,800
3,000
19
95
19
96
19
97
19
98
19
99
20
00
20
01
20
02
20
03
20
04
20
05
20
06
20
07
20
08
20
09
20
10
20
11
20
12
20
13
20
14
20
15
20
16
Y-O
-Y G
row
th R
ate
(ro
llin
g an
nu
al t
ota
l)
Ro
llin
g A
nn
ual
co
mm
erci
al f
ligh
ts (
00
0s)
Commercial flights - Rolling annual totals and Y-O-Y growth rates
Rolling annual growth (Right) Rolling annual totals (Left)

Aviation Trends Q1 2017 Page 6 of 14
c. Cargo tonnage
-20%
-15%
-10%
-5%
0%
5%
10%
15%
20%
350
400
450
500
550
600
650
700
750
19
95
19
96
19
97
19
98
19
99
20
00
20
01
20
02
20
03
20
04
20
05
20
06
20
07
20
08
20
09
20
10
20
11
20
12
20
13
20
14
20
15
20
16
20
17
Qu
arte
rly
Gro
wth
Rat
e (y
-o-y
)
Car
go T
on
nag
e (0
00
s)
Cargo Tonnage - Quarterly totals and Y-O-Y growth rates
Q1 Grw% Q2 Grw % Q3 Grw % Q4 Grw % Q1 Tonnage Q2 Tonnage Q3 Tonnage Q4 Tonnage
-15%
-10%
-5%
0%
5%
10%
15%
1,250
1,500
1,750
2,000
2,250
2,500
2,750
19
95
19
96
19
97
19
98
19
99
20
00
20
01
20
02
20
03
20
04
20
05
20
06
20
07
20
08
20
09
20
10
20
11
20
12
20
13
20
14
20
15
20
16
Y-O
-Y G
row
th R
ate
(ro
llin
g an
nu
al t
ota
l)
Ro
llin
g A
nn
ual
Car
go T
on
nag
e (0
00
s)
Cargo tonnage - Rolling annual totals and Y-O-Y growth rates
Rolling annual growth (Right) Rolling annual totals (Left)

Aviation Trends Q1 2017 Page 7 of 14
2. Terminal passengers at UK airports see note 5 on p.14
Pax (millions)
CURRENT QUARTER ROLLING YEAR
Q1 2017 Q1 2016
Q2 16 – Q1 17 Q2 15 – Q1 16
Pax (Mil)
% of total
Pax (Mil)
% of total
% chg Pax (Mill)
% of total
Pax (Mil)
% of total
% chg
London Airports
36.1 62% 34.3 63% 5.3% 165.0 60% 157.4 61% 4.8%
- Scheduled 35.4 61% 33.6 62% 5.3% 160.8 59% 152.2 59% 5.6%
- Charter 0.7 1% 0.7 1% 2.4% 4.2 2% 5.2 2% -18.7%
Regional Airports
21.7 38% 19.8 37% 9.7% 109.5 40% 100.3 39% 9.2%
-Scheduled 20.4 35% 18.5 34% 10.6% 100.7 37% 88.6 34% 13.6%
- Charter 1.3 2% 1.3 2% -2.6% 8.8 3% 11.7 5% -24.3%
All Airports 57.8 100% 54.1 100% 6.9% 274.5 100% 257.7 100% 6.5%
-Scheduled 55.8 97% 52.1 96% 7.2% 261.5 95% 240.8 93% 8.6%
- Charter 2.0 3% 2.0 4% -0.9% 13.0 5% 16.8 7% -22.6%
-40%
-30%
-20%
-10%
0%
10%
20%
20
12
Q1
20
12
Q2
20
12
Q3
20
12
Q4
20
13
Q1
20
13
Q2
20
13
Q3
20
13
Q4
20
14
Q1
20
14
Q2
20
14
Q3
20
14
Q4
20
15
Q1
20
15
Q2
20
15
Q3
20
15
Q4
20
16
Q1
20
16
Q2
20
16
Q3
20
16
Q4
20
17
Q1
YOY
Gro
wth
in T
erm
inal
Pas
sen
gers
London Sch London Chrt
Regional Sch Regional Chrt
0
10
20
30
40
50
60
70
80
90
20
12
Q1
20
12
Q2
20
12
Q3
20
12
Q4
20
13
Q1
20
13
Q2
20
13
Q3
20
13
Q4
20
14
Q1
20
14
Q2
20
14
Q3
20
14
Q4
20
15
Q1
20
15
Q2
20
15
Q3
20
15
Q4
20
16
Q1
20
16
Q2
20
16
Q3
20
16
Q4
20
17
Q1
Term
inal
pas
sen
gers
(m
illio
ns)
London Sch London Chrt Regional Sch Regional Chrt
UK terminal passengers are those travellers who board or disembark an aircraft on a commercial flight at a reporting UK airport. The figures in this section therefore exclude transit passengers – those who remain on-board aircraft which land at a UK airport and then continue on to another destination. In Q1 2017, London airports handled 5.3% more passengers, and regional airports 9.7% more than in the same quarter last year. Scheduled passengers grew by 7.2% overall. Charter traffic on the other hand declined by 0.9%, driven mainly larger capacity reductions at regional airports. For the rolling 12 months to Q1 2017, terminal passengers were 4.8% higher at London airports and 9.2% higher at regional airports, respectively compared to the previous rolling 12-month period. Overall for the period, UK airports handled 275m passengers in total, up by 6.5% on the previous 12 months.
Aviation Trends Q1 2017 Page 8 of 14
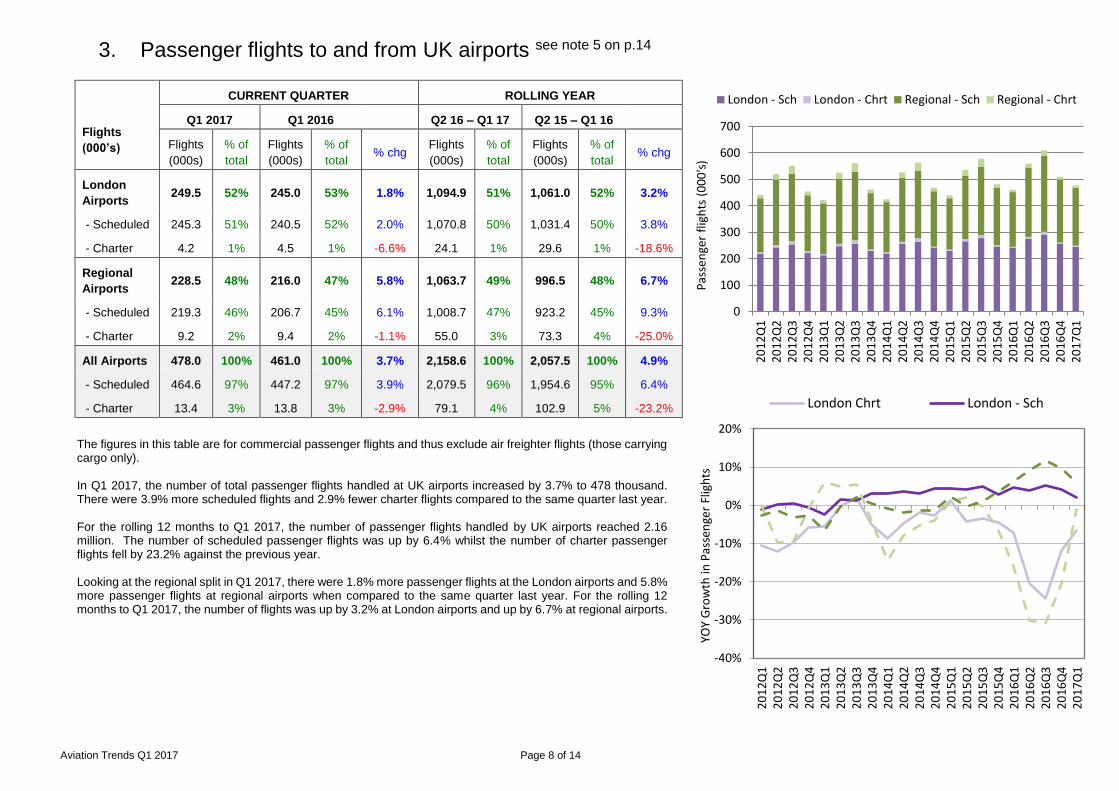
3. Passenger flights to and from UK airports see note 5 on p.14
Flights
(000’s)
CURRENT QUARTER ROLLING YEAR
Q1 2017 Q1 2016
Q2 16 – Q1 17 Q2 15 – Q1 16
Flights
(000s)
% of
total
Flights
(000s)
% of
total % chg
Flights
(000s)
% of
total
Flights
(000s)
% of
total % chg
London
Airports 249.5 52% 245.0 53% 1.8% 1,094.9 51% 1,061.0 52% 3.2%
- Scheduled 245.3 51% 240.5 52% 2.0% 1,070.8 50% 1,031.4 50% 3.8%
- Charter 4.2 1% 4.5 1% -6.6% 24.1 1% 29.6 1% -18.6%
Regional
Airports 228.5 48% 216.0 47% 5.8% 1,063.7 49% 996.5 48% 6.7%
- Scheduled 219.3 46% 206.7 45% 6.1% 1,008.7 47% 923.2 45% 9.3%
- Charter 9.2 2% 9.4 2% -1.1% 55.0 3% 73.3 4% -25.0%
All Airports 478.0 100% 461.0 100% 3.7% 2,158.6 100% 2,057.5 100% 4.9%
- Scheduled 464.6 97% 447.2 97% 3.9% 2,079.5 96% 1,954.6 95% 6.4%
- Charter 13.4 3% 13.8 3% -2.9% 79.1 4% 102.9 5% -23.2%
0
100
200
300
400
500
600
700
20
12
Q1
20
12
Q2
20
12
Q3
20
12
Q4
20
13
Q1
20
13
Q2
20
13
Q3
20
13
Q4
20
14
Q1
20
14
Q2
20
14
Q3
20
14
Q4
20
15
Q1
20
15
Q2
20
15
Q3
20
15
Q4
20
16
Q1
20
16
Q2
20
16
Q3
20
16
Q4
20
17
Q1
Pas
sen
ger
flig
hts
(0
00
's)
London - Sch London - Chrt Regional - Sch Regional - Chrt
-40%
-30%
-20%
-10%
0%
10%
20%
20
12
Q1
20
12
Q2
20
12
Q3
20
12
Q4
20
13
Q1
20
13
Q2
20
13
Q3
20
13
Q4
20
14
Q1
20
14
Q2
20
14
Q3
20
14
Q4
20
15
Q1
20
15
Q2
20
15
Q3
20
15
Q4
20
16
Q1
20
16
Q2
20
16
Q3
20
16
Q4
20
17
Q1
YOY
Gro
wth
in P
asse
nge
r Fl
igh
ts
London Chrt London - Sch
The figures in this table are for commercial passenger flights and thus exclude air freighter flights (those carrying cargo only). In Q1 2017, the number of total passenger flights handled at UK airports increased by 3.7% to 478 thousand. There were 3.9% more scheduled flights and 2.9% fewer charter flights compared to the same quarter last year. For the rolling 12 months to Q1 2017, the number of passenger flights handled by UK airports reached 2.16 million. The number of scheduled passenger flights was up by 6.4% whilst the number of charter passenger flights fell by 23.2% against the previous year. Looking at the regional split in Q1 2017, there were 1.8% more passenger flights at the London airports and 5.8% more passenger flights at regional airports when compared to the same quarter last year. For the rolling 12 months to Q1 2017, the number of flights was up by 3.2% at London airports and up by 6.7% at regional airports.
Aviation Trends Q1 2017 Page 9 of 14
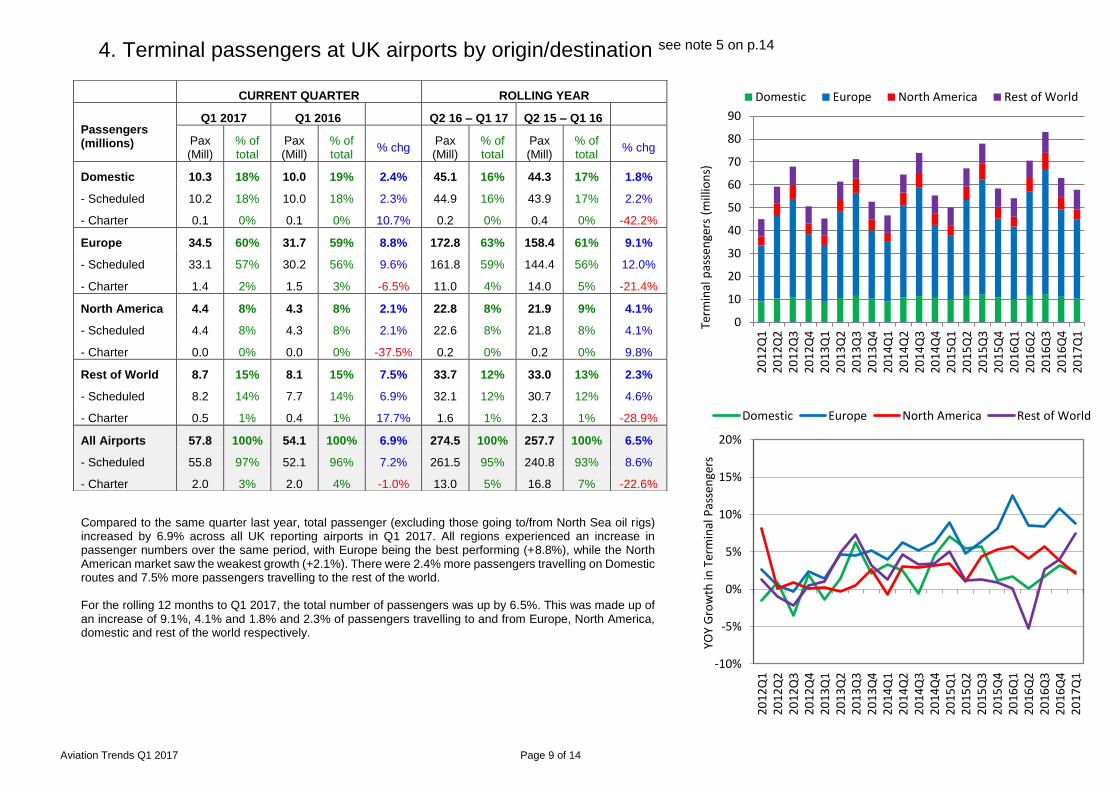
4. Terminal passengers at UK airports by origin/destination see note 5 on p.14
CURRENT QUARTER ROLLING YEAR
Passengers (millions)
Q1 2017 Q1 2016
Q2 16 – Q1 17 Q2 15 – Q1 16
Pax (Mill)
% of total
Pax (Mill)
% of total
% chg Pax (Mill)
% of total
Pax (Mill)
% of total
% chg
Domestic 10.3 18% 10.0 19% 2.4% 45.1 16% 44.3 17% 1.8%
- Scheduled 10.2 18% 10.0 18% 2.3% 44.9 16% 43.9 17% 2.2%
- Charter 0.1 0% 0.1 0% 10.7% 0.2 0% 0.4 0% -42.2%
Europe 34.5 60% 31.7 59% 8.8% 172.8 63% 158.4 61% 9.1%
- Scheduled 33.1 57% 30.2 56% 9.6% 161.8 59% 144.4 56% 12.0%
- Charter 1.4 2% 1.5 3% -6.5% 11.0 4% 14.0 5% -21.4%
North America 4.4 8% 4.3 8% 2.1% 22.8 8% 21.9 9% 4.1%
- Scheduled 4.4 8% 4.3 8% 2.1% 22.6 8% 21.8 8% 4.1%
- Charter 0.0 0% 0.0 0% -37.5% 0.2 0% 0.2 0% 9.8%
Rest of World 8.7 15% 8.1 15% 7.5% 33.7 12% 33.0 13% 2.3%
- Scheduled 8.2 14% 7.7 14% 6.9% 32.1 12% 30.7 12% 4.6%
- Charter 0.5 1% 0.4 1% 17.7% 1.6 1% 2.3 1% -28.9%
All Airports 57.8 100% 54.1 100% 6.9% 274.5 100% 257.7 100% 6.5%
- Scheduled 55.8 97% 52.1 96% 7.2% 261.5 95% 240.8 93% 8.6%
- Charter 2.0 3% 2.0 4% -1.0% 13.0 5% 16.8 7% -22.6%
0
10
20
30
40
50
60
70
80
90
20
12
Q1
20
12
Q2
20
12
Q3
20
12
Q4
20
13
Q1
20
13
Q2
20
13
Q3
20
13
Q4
20
14
Q1
20
14
Q2
20
14
Q3
20
14
Q4
20
15
Q1
20
15
Q2
20
15
Q3
20
15
Q4
20
16
Q1
20
16
Q2
20
16
Q3
20
16
Q4
20
17
Q1
Term
inal
pas
sen
gers
(m
illio
ns)
Domestic Europe North America Rest of World
-10%
-5%
0%
5%
10%
15%
20%
20
12
Q1
20
12
Q2
20
12
Q3
20
12
Q4
20
13
Q1
20
13
Q2
20
13
Q3
20
13
Q4
20
14
Q1
20
14
Q2
20
14
Q3
20
14
Q4
20
15
Q1
20
15
Q2
20
15
Q3
20
15
Q4
20
16
Q1
20
16
Q2
20
16
Q3
20
16
Q4
20
17
Q1
YOY
Gro
wth
in T
erm
inal
Pas
sen
gers
Domestic Europe North America Rest of World
Compared to the same quarter last year, total passenger (excluding those going to/from North Sea oil rigs) increased by 6.9% across all UK reporting airports in Q1 2017. All regions experienced an increase in passenger numbers over the same period, with Europe being the best performing (+8.8%), while the North American market saw the weakest growth (+2.1%). There were 2.4% more passengers travelling on Domestic routes and 7.5% more passengers travelling to the rest of the world. For the rolling 12 months to Q1 2017, the total number of passengers was up by 6.5%. This was made up of an increase of 9.1%, 4.1% and 1.8% and 2.3% of passengers travelling to and from Europe, North America, domestic and rest of the world respectively.

Aviation Trends Q1 2017 Page 10 of 14
5. Air cargo tonnes carried to and from UK airports see note 5 on p.14
Tonnes (000's)
CURRENT QUARTER ROLLING YEAR
Q1 2017 Q1 2016
Q2 16 – Q1 17 Q2 15 – Q1 16
Tonnes (000's)
% of total
Tonnes (000's)
% of total
% chg Tonnes (000's)
% of total
Tonnes (000's)
% of total
% chg
Cargo only flights
194.9 30% 193.3 31% 0.9% 808.9 33% 832.7 33% -2.9%
- London 89.1 14% 84.4 14% 5.5% 329.7 13% 337.0 13% -2.2%
- Regional 105.8 16% 108.8 18% -2.8% 479.3 19% 495.7 20% -3.3%
Bellyhold cargo
458.1 70% 426.0 69% 7.5% 1,671.2 67% 1,704.6 67% -2.0%
- London 423.6 65% 395.9 64% 7.0% 1,552.0 63% 1,590.8 63% -2.4%
- Regional 34.4 5% 30.2 5% 14.1% 119.2 5% 113.8 4% 4.8%
Total cargo
653.0 100% 619.3 100% 5.4% 2,480.1 100% 2,537.3 100% -2.3%
- London 512.8 79% 480.3 78% 6.8% 1,881.7 76% 1,927.8 76% -2.4%
- Regional 140.2 21% 139.0 22% 0.9% 598.5 24% 609.4 24% -1.8%
0
100
200
300
400
500
600
700
800
20
12
Q1
20
12
Q2
20
12
Q3
20
12
Q4
20
13
Q1
20
13
Q2
20
13
Q3
20
13
Q4
20
14
Q1
20
14
Q2
20
14
Q3
20
14
Q4
20
15
Q1
20
15
Q2
20
15
Q3
20
15
Q4
20
16
Q1
20
16
Q2
20
16
Q3
20
16
Q4
20
17
Q1
Car
go T
on
nag
e (0
00
's)
London Bellyhold London Airfreight
Regional Bellyhold Regional Airfreight
-15%
-10%
-5%
0%
5%
10%
15%
20%
25%
30%
35%
20
12
Q1
20
12
Q2
20
12
Q3
20
12
Q4
20
13
Q1
20
13
Q2
20
13
Q3
20
13
Q4
20
14
Q1
20
14
Q2
20
14
Q3
20
14
Q4
20
15
Q1
20
15
Q2
20
15
Q3
20
15
Q4
20
16
Q1
20
16
Q2
20
16
Q3
20
16
Q4
20
17
Q1
YOY
Gro
wth
in C
argo
to
nn
age
London Bellyhold London AirfrieghtRegional Bellyhold Regional Airfrieght
Air cargo – freight and mail – is transported into and out of the UK on air freighters and in the bellyhold of passenger aircraft. In Q1 2017, total cargo tonnage at UK airports grew by 5.4% compared with the same quarter last year. At London airports cargo tonnage grew by 6.8% while cargo tonnage at regional airports increased by 0.9%. Air freighter tonnage increased by 0.9% whilst bellyhold cargo tonnage grew by 7.5% over the same period. The weaker performance of the regional airports was driven by the 2.8% reduction in cargo tonnes transported by freighter in Q4 2016, although an increase of 14.1% in bellyhold cargo compensated for the reduction of air freighter cargo. For the rolling 12 months to Q1 2017, total cargo tonnage handled at UK airports fell by 2.3% compared with the previous 12 month period (Q2 2015 to Q1 2016), with similar declines at both London airports and regional airports.

Aviation Trends Q1 2017 Page 11 of 14
6. All commercial flights to and from UK airports see note 5 on p.14
Flights (000s)
CURRENT QUARTER ROLLING YEAR
Q1 2017 Q1 2016 Q2 16 – Q1 17 Q2 15 – Q1 16
Flights (000's)
% of total
Flights (000's)
% of total
% chg Flights (000's)
% of total
Flights (000's)
% of total
% chg
Airfreighter 13.2 3% 13.3 3% -0.1% 52.7 2% 55.7 3% -5.3%
- London 3.9 1% 3.7 1% 4.4% 15.6 1% 14.3 1% 9.6%
- Regional 9.4 2% 9.6 2% -1.9% 37.1 2% 41.4 2% -10.4%
Passenger flights
478.0 97% 461.0 97% 3.7% 2,159.0 98% 2,057.6 97% 4.9%
- London 249.5 51% 245.0 52% 1.8% 1,094.9 50% 1,061.0 50% 3.2%
- Regional 228.5 47% 216.0 46% 5.8% 1,064.2 48% 996.6 47% 6.8%
Total flights 491.3 100% 474.3 100% 3.6% 2,211.8 100% 2,113.2 100% 4.7%
- London 253.4 52% 248.7 52% 1.9% 1,110.5 50% 1,075.3 51% 3.3%
- Regional 237.9 48% 225.6 48% 5.5% 1,101.2 50% 1,038.0 49% 6.1%
0
100
200
300
400
500
600
700
20
12
Q1
20
12
Q2
20
12
Q3
20
12
Q4
20
13
Q1
20
13
Q2
20
13
Q3
20
13
Q4
20
14
Q1
20
14
Q2
20
14
Q3
20
14
Q4
20
15
Q1
20
15
Q2
20
15
Q3
20
15
Q4
20
16
Q1
20
16
Q2
20
16
Q3
20
16
Q4
20
17
Q1
Co
mm
erci
al F
ligh
ts (
00
0's
)
London Passenger London Airfreighter
Regional Passenger Regional Airfreighter
-20%
-15%
-10%
-5%
0%
5%
10%
15%
20%
20
12
Q1
20
12
Q2
20
12
Q3
20
12
Q4
20
13
Q1
20
13
Q2
20
13
Q3
20
13
Q4
20
14
Q1
20
14
Q2
20
14
Q3
20
14
Q4
20
15
Q1
20
15
Q2
20
15
Q3
20
15
Q4
20
16
Q1
20
16
Q2
20
16
Q3
20
16
Q4
20
17
Q1
YOY
Gro
wth
in c
om
mer
cial
flig
hts
London Passenger London AirfreighterRegional Passenger Regional Airfreighter
The number of commercial flights at reporting UK airports is a measure of commercial aviation activity in the UK. It includes both passenger and cargo flights, but excludes military flights, general aviation, and aircraft that pass through UK airspace without landing. The total number of commercial flights in the UK was up 3.6% in Q1 2017 compared to the same quarter last year – the combined effect of a 3.7% increase in the number of passenger flights and a 0.1% decrease in the number of freighter flights. Overall for the same quarter, London airports and regional airports grew at 1.9% and 5.5% respectively. For the rolling 12 months to Q1 2017, the total number of commercial flights reached 2.21m, up by 4.7% compared with the previous rolling 12 months (Q2 2015 to Q1 2016). Commercial flights at London airports rose by 3.3% while at regional airports the increase was 6.1%.

Aviation Trends Q1 2017 Page 12 of 14
7. Punctuality of scheduled passenger flights to and from UK airports see note 6 on p.14
a. On-time performance
Matched scheduled passenger flights
(000s), % of flights on-time
Q1 2017 Q1 2016 Change (%
points) Flights (000s)
% on-time
Flights (000s)
% on-time
London Airports 243.1 77% 238.4 78% -1
- Gatwick 57.1 72% 53.6 71% +1
- Heathrow 110.6 81% 111.6 81% 0
- London City 19.4 79% 19.6 77% +2
- Luton 22.2 72% 19.3 74% -2
- Stansted 33.7 75% 34.3 80% -5
Regional Airports 191.5 79% 178.5 81% -2
- Aberdeen 11.1 81% 11.3 82% -1
- Belfast City 8.4 86% 9.1 88% -2
- Belfast International 9.0 80% 7.4 84% -4
- Birmingham 21.7 78% 19.6 82% -4
- Bournemouth 0.5 76% 0.6 73% +3
- Bristol 12.2 76% 10.8 81% -5
- Cardiff 3.1 80% 2.7 80% 0
- Doncaster Sheffield 1.5 80% 1.0 71% +9
- Durham Tees Valley 0.9 81% 0.9 80% +1
- East Midlands 5.6 83% 5.4 84% -1
- Edinburgh 23.7 79% 22.6 81% -2
- Exeter 2.3 78% 2.0 83% -5
- Glasgow 18.1 80% 17.5 81% -1
- Jersey 4.6 78% 5.0 78% 0
- Leeds Bradford 6.3 85% 5.6 81% +4
- Liverpool 7.5 80% 8.5 80% 0
- Manchester 38.0 77% 33.8 79% -2
- Newcastle 8.3 85% 7.1 83% +2
- Southampton 8.8 81% 7.6 85% -4
All Airports 434.6 78% 418.5 79% -1
Punctuality of arriving and departing passenger flights is measured by comparing actual and planned times of operation. The data covers 24 airports. On-time performance is defined as the proportion of flights arriving or departing early or up to and including 15 minutes late. It is calculated from the scheduled on-stand time, the reported runway time and the expected time an aircraft takes to travel between a stand and the runway.
-1+1
0+2
-2-5
-2-1
-2-4-4
+3-5
0+9
+1-1
-2-5
-10
+40
-2+2
-4-1
-6 -5 -4 -3 -2 -1 0 1 2 3 4 5 6 7 8 9 10
London Airports - Gatwick - Heathrow - London City - Luton - StanstedRegional Airports - Aberdeen - Belfast City - Belfast International - Birmingham - Bournemouth - Bristol - Cardiff - Doncaster Sheffield - Durham Tees Valley - East Midlands - Edinburgh - Exeter - Glasgow - Jersey - Leeds Bradford - Liverpool - Manchester - Newcastle - SouthamptonAll Airports
Q1 2017: y-o-y change in on-time performance(% points)
Aviation Trends Q1 2017 Page 13 of 14
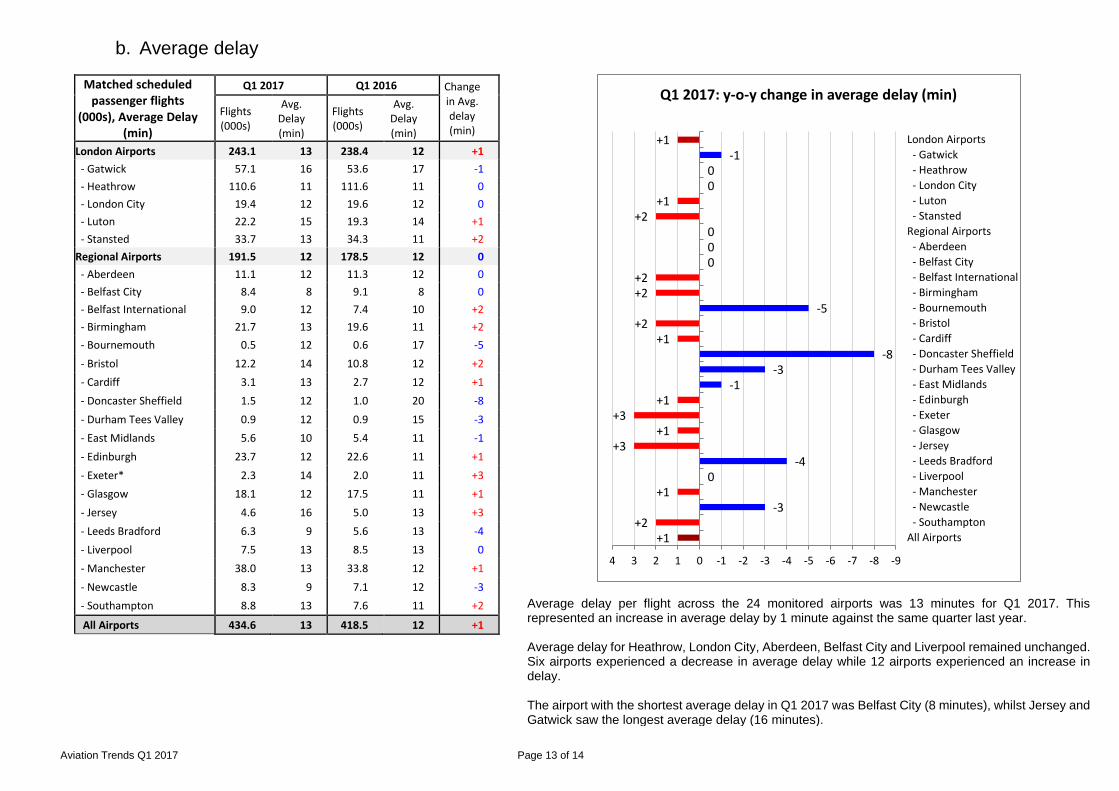
b. Average delay
Matched scheduled passenger flights
(000s), Average Delay (min)
Q1 2017 Q1 2016 Change in Avg. delay (min)
Flights (000s)
Avg. Delay (min)
Flights (000s)
Avg. Delay (min)
London Airports 243.1 13 238.4 12 +1
- Gatwick 57.1 16 53.6 17 -1
- Heathrow 110.6 11 111.6 11 0
- London City 19.4 12 19.6 12 0
- Luton 22.2 15 19.3 14 +1
- Stansted 33.7 13 34.3 11 +2
Regional Airports 191.5 12 178.5 12 0
- Aberdeen 11.1 12 11.3 12 0
- Belfast City 8.4 8 9.1 8 0
- Belfast International 9.0 12 7.4 10 +2
- Birmingham 21.7 13 19.6 11 +2
- Bournemouth 0.5 12 0.6 17 -5
- Bristol 12.2 14 10.8 12 +2
- Cardiff 3.1 13 2.7 12 +1
- Doncaster Sheffield 1.5 12 1.0 20 -8
- Durham Tees Valley 0.9 12 0.9 15 -3
- East Midlands 5.6 10 5.4 11 -1
- Edinburgh 23.7 12 22.6 11 +1
- Exeter* 2.3 14 2.0 11 +3
- Glasgow 18.1 12 17.5 11 +1
- Jersey 4.6 16 5.0 13 +3
- Leeds Bradford 6.3 9 5.6 13 -4
- Liverpool 7.5 13 8.5 13 0
- Manchester 38.0 13 33.8 12 +1
- Newcastle 8.3 9 7.1 12 -3
- Southampton 8.8 13 7.6 11 +2
All Airports 434.6 13 418.5 12 +1
Average delay per flight across the 24 monitored airports was 13 minutes for Q1 2017. This represented an increase in average delay by 1 minute against the same quarter last year. Average delay for Heathrow, London City, Aberdeen, Belfast City and Liverpool remained unchanged. Six airports experienced a decrease in average delay while 12 airports experienced an increase in delay. The airport with the shortest average delay in Q1 2017 was Belfast City (8 minutes), whilst Jersey and Gatwick saw the longest average delay (16 minutes).
+1-1
00
+1+2
000
+2+2
-5+2
+1-8
-3-1
+1+3
+1+3
-40
+1-3
+2+1
-9-8-7-6-5-4-3-2-101234
London Airports
- Gatwick
- Heathrow
- London City
- Luton
- Stansted
Regional Airports
- Aberdeen
- Belfast City
- Belfast International
- Birmingham
- Bournemouth
- Bristol
- Cardiff
- Doncaster Sheffield
- Durham Tees Valley
- East Midlands
- Edinburgh
- Exeter
- Glasgow
- Jersey
- Leeds Bradford
- Liverpool
- Manchester
- Newcastle
- Southampton
All Airports
Q1 2017: y-o-y change in average delay (min)
Aviation Trends Q1 2017 Page 14 of 14
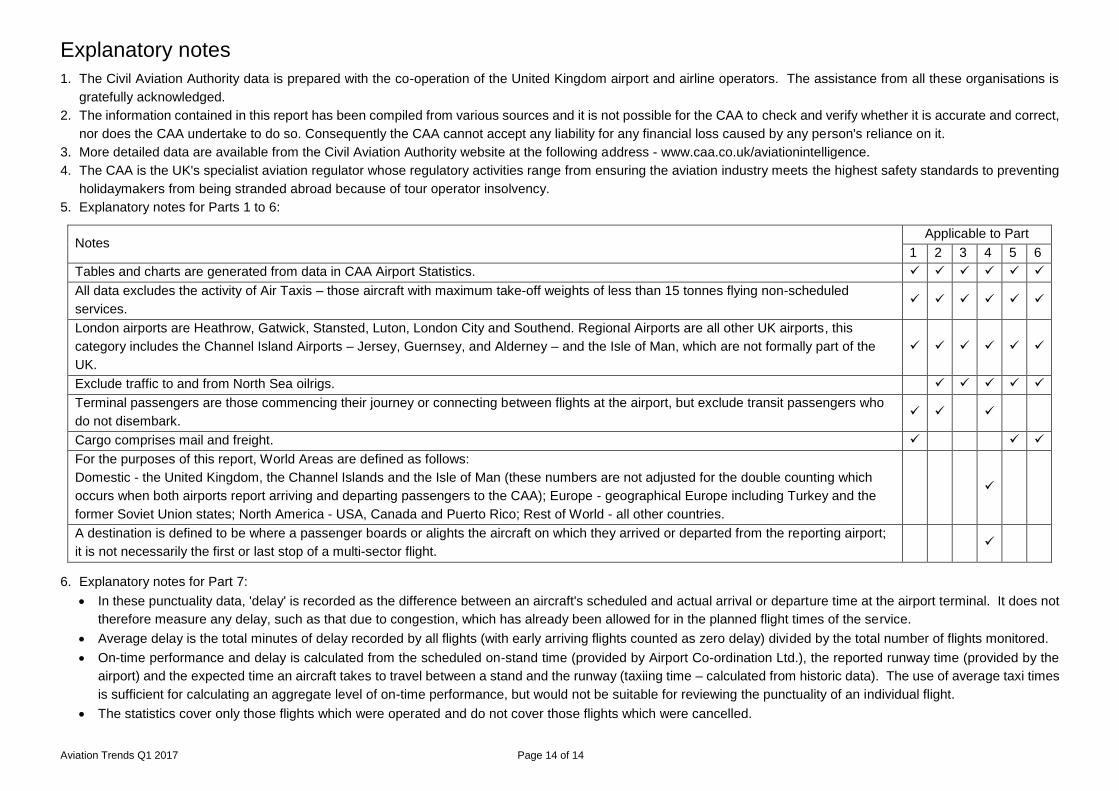
Explanatory notes
1. The Civil Aviation Authority data is prepared with the co-operation of the United Kingdom airport and airline operators. The assistance from all these organisations is
gratefully acknowledged.
2. The information contained in this report has been compiled from various sources and it is not possible for the CAA to check and verify whether it is accurate and correct,
nor does the CAA undertake to do so. Consequently the CAA cannot accept any liability for any financial loss caused by any person's reliance on it.
3. More detailed data are available from the Civil Aviation Authority website at the following address - www.caa.co.uk/aviationintelligence.
4. The CAA is the UK's specialist aviation regulator whose regulatory activities range from ensuring the aviation industry meets the highest safety standards to preventing
holidaymakers from being stranded abroad because of tour operator insolvency.
5. Explanatory notes for Parts 1 to 6:
Notes Applicable to Part
1 2 3 4 5 6
Tables and charts are generated from data in CAA Airport Statistics. ✓ ✓ ✓ ✓ ✓ ✓
All data excludes the activity of Air Taxis – those aircraft with maximum take-off weights of less than 15 tonnes flying non-scheduled
services. ✓ ✓ ✓ ✓ ✓ ✓
London airports are Heathrow, Gatwick, Stansted, Luton, London City and Southend. Regional Airports are all other UK airports, this
category includes the Channel Island Airports – Jersey, Guernsey, and Alderney – and the Isle of Man, which are not formally part of the
UK.
✓ ✓ ✓ ✓ ✓ ✓
Exclude traffic to and from North Sea oilrigs. ✓ ✓ ✓ ✓ ✓
Terminal passengers are those commencing their journey or connecting between flights at the airport, but exclude transit passengers who
do not disembark. ✓ ✓ ✓
Cargo comprises mail and freight. ✓ ✓ ✓
For the purposes of this report, World Areas are defined as follows:
Domestic - the United Kingdom, the Channel Islands and the Isle of Man (these numbers are not adjusted for the double counting which
occurs when both airports report arriving and departing passengers to the CAA); Europe - geographical Europe including Turkey and the
former Soviet Union states; North America - USA, Canada and Puerto Rico; Rest of World - all other countries.
✓
A destination is defined to be where a passenger boards or alights the aircraft on which they arrived or departed from the reporting airport;
it is not necessarily the first or last stop of a multi-sector flight. ✓
6. Explanatory notes for Part 7:
• In these punctuality data, 'delay' is recorded as the difference between an aircraft's scheduled and actual arrival or departure time at the airport terminal. It does not
therefore measure any delay, such as that due to congestion, which has already been allowed for in the planned flight times of the service.
• Average delay is the total minutes of delay recorded by all flights (with early arriving flights counted as zero delay) divided by the total number of flights monitored.
• On-time performance and delay is calculated from the scheduled on-stand time (provided by Airport Co-ordination Ltd.), the reported runway time (provided by the
airport) and the expected time an aircraft takes to travel between a stand and the runway (taxiing time – calculated from historic data). The use of average taxi times
is sufficient for calculating an aggregate level of on-time performance, but would not be suitable for reviewing the punctuality of an individual flight.
• The statistics cover only those flights which were operated and do not cover those flights which were cancelled.